UNITED STATES
SECURITIES AND EXCHANGE COMMISSION
Washington, D.C. 20549
FORM N-CSR
CERTIFIED SHAREHOLDER REPORT OF REGISTERED
MANAGEMENT INVESTMENT COMPANIES
Investment Company Act file number | 811-05624 |
|
Morgan Stanley Institutional Fund, Inc. |
(Exact name of registrant as specified in charter) |
|
522 Fifth Avenue, New York, New York | | 10036 |
(Address of principal executive offices) | | (Zip code) |
|
John H. Gernon 522 Fifth Avenue, New York, New York 10036 |
(Name and address of agent for service) |
|
Registrant’s telephone number, including area code: | 212-296-0289 | |
|
Date of fiscal year end: | December 31, | |
|
Date of reporting period: | December 31, 2018 | |
| | | | | | | | |
Item 1 - Report to Shareholders

Morgan Stanley Institutional Fund, Inc.
Active International Allocation Portfolio
Annual Report
December 31, 2018
Beginning on January 1, 2021, as permitted by regulations adopted by the Securities and Exchange Commission ("SEC"), paper copies of the Fund's Annual and Semi-Annual Reports to Shareholders ("Shareholder Reports") will no longer be sent by mail, unless you specifically request paper copies of the Shareholder Reports from the Fund or from your financial intermediary, such as a broker-dealer or a bank. Instead, the Shareholder Reports will be made available on the Fund's website, https://www.morganstanley.com/im/shareholderreports and you will be notified by mail each time a Shareholder Report is posted and provided with a website link to access the Shareholder Report. If you already elected to receive Shareholder Reports electronically, you will not be affected by this change and you need not take any action. You may elect to receive Shareholder Reports and other communications from the Fund electronically anytime by contacting your financial intermediary or, if you are a direct investor, please follow the instructions on the envelope.
Beginning on January 1, 2019, you may elect to receive all future Shareholder Reports in paper free of charge. If you invest through a financial intermediary, you can contact your financial intermediary to request that you continue to receive paper copies of your Shareholder Reports. If you invest directly with the Fund, please follow the instructions on the envelope to let the Fund know you wish to continue receiving paper copies of your Shareholder Reports. Your election to receive Shareholder Reports in paper will apply to all funds held in your account if you invest through your financial intermediary or all funds held with the fund complex if you invest directly with a fund.

Morgan Stanley Institutional Fund, Inc.
Annual Report — December 31, 2018
Shareholders' Letter | | | 2 | | |
Expense Example | | | 3 | | |
Investment Overview | | | 4 | | |
Portfolio of Investments | | | 7 | | |
Statement of Assets and Liabilities | | | 12 | | |
Statement of Operations | | | 14 | | |
Statements of Changes in Net Assets | | | 15 | | |
Financial Highlights | | | 17 | | |
Notes to Financial Statements | | | 21 | | |
Report of Independent Registered Public Accounting Firm | | | 32 | | |
Federal Tax Notice | | | 33 | | |
Privacy Notice | | | 34 | | |
Director and Officer Information | | | 37 | | |
This report is authorized for distribution only when preceded or accompanied by a prospectus or summary prospectus of the applicable Fund of Morgan Stanley Institutional Fund, Inc. To receive a prospectus and/or statement of additional information (SAI), which contains more complete information such as investment objectives, charges, expenses, policies for voting proxies, risk considerations and describes in detail each of the Fund's investment policies to the prospective investor, please call toll free 1 (800) 548-7786. Please read the prospectuses carefully before you invest or send money.
Additionally, you can access information about the Fund, including performance, characteristics and investment team commentary, through Morgan Stanley Investment Management's website: www.morganstanley.com/im/shareholderreports.
Market forecasts provided in this report may not necessarily come to pass. There is no guarantee that any sectors mentioned will continue to perform as discussed herein or that securities in such sectors will be held by the Fund in the future. There is no assurance that a fund will achieve its investment objective. Funds are subject to market risk, which is the possibility that market values of securities owned by the Fund will decline and, therefore, the value of the Fund's shares may be less than what you paid for them. Accordingly, you can lose money investing in this Fund. Please see the prospectus for more complete information on investment risks.
1
Morgan Stanley Institutional Fund, Inc.
Annual Report — December 31, 2018
Shareholders' Letter (unaudited)
Dear Shareholders,
We are pleased to provide this Annual report, in which you will learn how your investment in Active International Allocation Portfolio (the "Fund") performed during the latest twelve-month period.
Morgan Stanley Investment Management is a client-centric, investor-led organization. Our global presence, intellectual capital, and breadth of products and services enable us to partner with investors to meet the evolving challenges of today's financial markets. We aim to deliver superior investment service and to empower our clients to make the informed decisions that help them reach their investment goals.
As always, we thank you for selecting Morgan Stanley Investment Management, and look forward to working with you in the months and years ahead.
Sincerely,

John H. Gernon
President and Principal Executive Officer
January 2019
2
Morgan Stanley Institutional Fund, Inc.
Annual Report — December 31, 2018
Expense Example (unaudited)
Active International Allocation Portfolio
As a shareholder of the Fund, you incur two types of costs: (1) transactional costs, including redemption fees; and (2) ongoing costs, which may include advisory fees, administration fees, distribution and shareholder services fees and other Fund expenses. This example is intended to help you understand your ongoing costs (in dollars) of investing in the Fund and to compare these costs with the ongoing costs of investing in other mutual funds.
This example is based on an investment of $1,000 invested at the beginning of the six-month period ended December 31, 2018 and held for the entire six-month period.
Actual Expenses
The table below provides information about actual account values and actual expenses. You may use the information in this table, together with the amount you invested, to estimate the expenses that you paid over the period. Simply divide your account value by $1,000 (for example, an $8,600 account value divided by $1,000 = 8.6), then multiply the result by the number in the table under the heading entitled "Actual Expenses Paid During Period" to estimate the expenses you paid on your account during this period.
Hypothetical Example for Comparison Purposes
The table below provides information about hypothetical account values and hypothetical expenses based on the Fund's actual expense ratio and an assumed rate of return of 5% per year before expenses, which is not the Fund's actual return. The hypothetical account values and expenses may not be used to estimate the actual ending account balance or expenses you paid for the period. You may use this information to compare the ongoing costs of investing in the Fund and other funds. To do so, compare this 5% hypothetical example with the 5% hypothetical examples that appear in the shareholder reports of the other funds.
Please note that the expenses shown in the table are meant to highlight your ongoing costs only and do not reflect any transactional costs, such as sales charges (loads) and redemption fees. Therefore, the information for each class in the table is useful in comparing ongoing costs only, and will not help you determine the relative total costs of owning different funds. In addition, if these transactional costs were included, your costs would have been higher.
| | | Beginning
Account
Value
7/1/18 | | Actual Ending
Account
Value
12/31/18 | | Hypothetical
Ending Account
Value | | Actual
Expenses
Paid
During
Period* | | Hypothetical
Expenses Paid
During Period* | | Net
Expense
Ratio
During
Period** | |
Active International Allocation Portfolio Class I | | $ | 1,000.00 | | | $ | 891.70 | | | $ | 1,020.72 | | | $ | 4.24 | | | $ | 4.53 | | | | 0.89 | % | |
Active International Allocation Portfolio Class A | | | 1,000.00 | | | | 890.70 | | | | 1,019.36 | | | | 5.53 | | | | 5.90 | | | | 1.16 | | |
Active International Allocation Portfolio Class L | | | 1,000.00 | | | | 888.30 | | | | 1,016.79 | | | | 7.95 | | | | 8.49 | | | | 1.67 | | |
Active International Allocation Portfolio Class C | | | 1,000.00 | | | | 887.10 | | | | 1,015.17 | | | | 9.47 | | | | 10.11 | | | | 1.99 | | |
* Expenses are calculated using each Fund Class' annualized net expense ratio (as disclosed), multiplied by the average account value over the period and multiplied by 184/365 (to reflect the most recent one-half year period).
** Annualized.
3
Morgan Stanley Institutional Fund, Inc.
Annual Report — December 31, 2018
Investment Overview (unaudited)
Active International Allocation Portfolio
The Fund seeks long-term capital appreciation.
Performance
For the fiscal year ended December 31, 2018, the Fund's Class I shares had a total return based on net asset value and reinvestment of distributions per share of –15.14%, net of fees. The Fund's Class I shares underperformed the Fund's benchmark, the MSCI All Country World ex USA Index (the "Index"), which returned –14.20%.
Factors Affecting Performance
• Global equity markets see-sawed higher for the first nine months of 2018 and in the fourth quarter experienced two significant declines, one in early October and the second in early-mid December, which wiped out the gains for the year.
• For 2018, MSCI regional returns were all negative (based in U.S. dollars). The U.S. was a relative outperformer at –5%, followed by Japan at –13%, and Europe and emerging markets both at –15%. Sector performance for the Index for 2018 was as follows: utilities were flat, health care –6%, energy –8%, consumer staples –11%, real estate –12%, industrials –15%, technology and materials both –16%, financials and communication services both –17%, and consumer discretionary–20%.
• Looking back on 2018 performance, we believe a number of decisions worked well: overweights to technology and health care, underweight European financials/overweight emerging markets financials, and overweight positions in Indonesia.
• We began to add to defensives early in 2018 and in hindsight our timing was too early, but these positions were significant contributors to the second half and overall 2018 performance.
• Decisions that hindered performance were overweight positions in Germany, Spain and the Philippines, the allocation to the U.S. and the below-benchmark allocations to energy and to Brazil. We believe the cash position we raised in the fourth quarter of 2018 did protect the portfolio a bit in the downturn.
• The Fund utilizes stock index futures as an additional vehicle to implement the portfolio manager's macro investment decisions. For 2018, macro investment decisions made with the use of
stock index futures resulted in a realized loss for the Fund. The Fund used currency forward contracts to hedge some local currency exposure, which resulted in a loss for the Fund in the reporting period.
Management Strategies
• 2018 marked a departure from the calm market environment that prevailed in 2017. Whether it was the significant worsening of global trade tensions, continued political upheaval in the eurozone and the U.K., a hawkish Federal Reserve (Fed) and the emergence of funding strains in several emerging markets, or simply just the realization that the global economic and market cycle is aging quickly, the fact is that most asset markets saw declines over the last year. From our vantage point, until there is more clarity on a range of issues from Brexit to ongoing global trade negotiations and a change in Fed policy from tightening to easing, markets are likely to churn and, in our view, more defensive positioning continues to be the best option. We do not anticipate a recession in any of the large global economies, but more of a continued slowdown from the peak growth seen earlier in 2018. While the volatility in asset prices has certainly not been pleasant, the positive is that global equities have de-rated significantly and are now substantially cheaper, while being supported by generally stable earnings expectations and valuations that for some market segments are at or near 30-year lows.
• The news in early January indicates that policy makers are alert and beginning to respond to flagging investor, business and consumer confidence. Recent reassuring comments from the Fed, positive news flow on U.S.-China trade negotiations and easing measures by China may indicate that a bottom may have been put in for now. Looking out further into 2019, as investor positioning and sentiment are much more negative than at the start of 2018, the surprise could be on the upside for growth and supportive policy moves. It is helpful to have a wall of worry and skepticism rather than euphoria to help form a base. At that same time, we continue to be mindful of the record stock of debt globally and the lack of tools held by most policy makers that would limit an economic acceleration and are therefore looking for those pockets of opportunity where fundamentals are likely to inflect positively despite an overall environment of more muted growth.
4
Morgan Stanley Institutional Fund, Inc.
Annual Report — December 31, 2018
Investment Overview (unaudited) (cont'd)
Active International Allocation Portfolio
• In 2017, equity markets were inordinately tame, and we expect that the market differentiation that began in 2018 is likely to persist into this year and beyond. This differentiation should mean that countries, sectors and companies that offer better fundamentals and growth prospects will be recognized and may be able to outperform less attractive market segments. We believe our multi-pronged strategy is well positioned to benefit from this differentiation and return opportunities among countries, sectors and stocks. We are avoiding areas where our work indicates that balance sheets are stretched, those that have large vulnerabilities to disruption and/or structural impediments to growth. As we start the new year, our focus is on identifying and investing in those areas that offer improving fundamentals, supportive structural stories and/or strong and defensible businesses that are now more attractively valued.
* Minimum Investment for Class I shares
In accordance with SEC regulations, the Fund's performance shown assumes that all recurring fees (including management fees) were deducted and all dividends and distributions were reinvested. The performance of Class A , L and C shares will vary from the performance of Class I shares based upon their different inception dates and will be negatively impacted by additional fees assessed to those classes.
5
Morgan Stanley Institutional Fund, Inc.
Annual Report — December 31, 2018
Investment Overview (unaudited) (cont'd)
Active International Allocation Portfolio
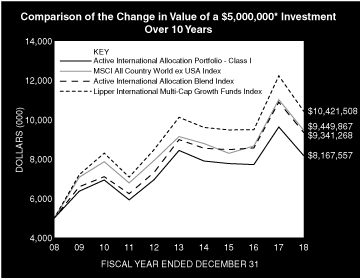
Performance Compared to the MSCI All Country World ex USA Index(1), the Active International Allocation Blend Index(2) and the Lipper International Multi-Cap Growth Funds Index(3)
| | | Period Ended December 31, 2018
Total Returns(4) | |
| | | | | Average Annual | |
| | | One
Year | | Five
Years | | Ten
Years | | Since
Inception(9) | |
Fund — Class I Shares
w/o sales charges(5) | | | –15.14 | % | | | –0.64 | % | | | 5.03 | % | | | 5.19 | % | |
Fund — Class A Shares
w/o sales charges(6) | | | –15.38 | | | | –0.98 | | | | 4.72 | | | | 4.35 | | |
Fund — Class A Shares with
maximum 5.25% sales charges(6) | | | –19.83 | | | | –2.04 | | | | 4.16 | | | | 4.10 | | |
Fund — Class L Shares
w/o sales charges(7) | | | –15.87 | | | | –1.50 | | | | — | | | | 4.40 | | |
Fund — Class C Shares
w/o sales charges(8) | | | –16.04 | | | | — | | | | — | | | | –2.69 | | |
Fund — Class C Shares with
maximum 1.00% deferred
sales charges(8) | | | –16.87 | | | | — | | | | — | | | | –2.69 | | |
MSCI All Country World ex USA Index | | | –14.20 | | | | 0.68 | | | | 6.57 | | | | 5.30 | | |
Active International Allocation
Blend Index | | | –14.20 | | | | 0.78 | | | | 6.45 | | | | 5.11 | | |
Lipper International Multi-Cap
Growth Funds Index | | | –14.74 | | | | 0.60 | | | | 7.62 | | | | N/A | | |
Performance data quoted represents past performance, which is no guarantee of future results, and current performance may be lower or higher than the figures shown. Performance assumes that all dividends and distributions, if any, were reinvested. For the most recent month-end performance figures, please visit www.morganstanley.com/im/shareholderreports. Investment return and principal value will fluctuate so that Fund shares, when redeemed, may be worth more or less than their original cost. Total returns do not reflect the deduction of taxes that a shareholder would pay on Fund distributions or the redemption of Fund shares. Performance of share classes will vary due to difference in sales charges and expenses.
(1) The MSCI All Country World ex USA Index is a free float-adjusted market capitalization weighted index designed to measure the equity market performance of developed and emerging markets, excluding the United States. The term ""free float"" represents the portion of shares outstanding that are deemed to be available for purchase in the public equity markets by investors. The performance of the Index is listed in U.S. dollars and assumes reinvestment of net dividends. Returns, including periods prior to January 1, 2001, are calculated using the return data of the MSCI All Country World ex USA Index (gross dividends) through December 31, 2000 and the return data of the MSCI All Country World ex USA Index (net dividends) after December 31, 2000. Net total return indices reinvest dividends after the deduction of withholding taxes, using (for international indices) a tax rate applicable to non-resident institutional investors who do not benefit from double taxation treaties. The Index is unmanaged and its returns do not include any sales charges or fees. Such costs would lower performance. It is not possible to invest directly in an index.
(2) The Active International Allocation Blend Index is performance linked benchmark of the old and new benchmark of the Fund, the old benchmark represented by MSCI EAFE Index (a benchmark measures the international equity market performance of developed markets excluding the United States and Canada) from the Fund's inception to 12/31/16 and the new benchmark represented by MSCI All Country World Ex USA Index for periods thereafer. The Index is unmanaged and its returns do not include any sales charges or fees. Such costs would lower performance. It is not possible to invest directly in an index.
(3) The Lipper International Multi-Cap Growth Funds Index is an equally weighted performance index of the largest qualifying funds (based on net assets) in the Lipper International Multi-Cap Growth Funds classification. The Index, which is adjusted for capital gains distributions and income dividends, is unmanaged and should not be considered an investment. There are currently 30 funds represented in this Index. As of the date of this report, the Fund was in the Lipper International Multi-Cap Growth Funds classification.
(4) Total returns for the Fund reflect fees waived and expenses reimbursed, if applicable, by Morgan Stanley Investment Management Inc. (the "Adviser"). Without such waivers and reimbursements, total returns would have been lower.
(5) Commenced operations on January 17, 1992.
(6) Commenced offering on January 2, 1996.
(7) Commenced offering on June 14, 2012.
(8) Commenced offering on April 30, 2015.
(9) For comparative purposes, average annual since inception returns listed for the Indexes refer to the inception date of Class I of the Fund, not the inception of the Index.
6
Morgan Stanley Institutional Fund, Inc.
Annual Report — December 31, 2018
Portfolio of Investments
Active International Allocation Portfolio
| | | Shares | | Value
(000) | |
Common Stocks (92.5%) | |
Argentina (1.0%) | |
Banco Macro SA ADR | | | 21,600 | | | $ | 955 | | |
BBVA Banco Frances SA ADR | | | 29,600 | | | | 335 | | |
Despegar.com Corp. (a)(b) | | | 9,300 | | | | 116 | | |
Grupo Financiero Galicia SA ADR | | | 11,500 | | | | 317 | | |
| | | | 1,723 | | |
Austria (0.1%) | |
Andritz AG | | | 2,809 | | | | 129 | | |
Belgium (1.7%) | |
Anheuser-Busch InBev SA N.V. | | | 35,512 | | | | 2,350 | | |
UCB SA | | | 4,981 | | | | 406 | | |
Umicore SA | | | 4,583 | | | | 183 | | |
| | | | 2,939 | | |
Brazil (0.8%) | |
Banco Bradesco SA (Preference) | | | 38,940 | | | | 388 | | |
Banco Santander Brasil SA (Units) (c) | | | 22,600 | | | | 250 | | |
Itau Unibanco Holding SA (Preference) | | | 42,388 | | | | 390 | | |
Lojas Renner SA | | | 17,800 | | | | 196 | | |
Raia Drogasil SA | | | 7,400 | | | | 109 | | |
| | | | 1,333 | | |
Canada (1.0%) | |
Agnico Eagle Mines Ltd. | | | 21,600 | | | | 872 | | |
Goldcorp, Inc. | | | 89,400 | | | | 875 | | |
| | | | 1,747 | | |
Chile (1.3%) | |
Banco de Chile | | | 1,040,882 | | | | 149 | | |
Banco de Credito e Inversiones SA | | | 2,359 | | | | 153 | | |
Banco Santander Chile | | | 7,351,145 | | | | 547 | | |
Enel Americas SA | | | 4,865,043 | | | | 856 | | |
Itau CorpBanca | | | 15,688,824 | | | | 147 | | |
SACI Falabella | | | 68,955 | | | | 504 | | |
| | | | 2,356 | | |
China (3.7%) | |
Alibaba Group Holding Ltd. ADR (a) | | | 12,000 | | | | 1,645 | | |
Baidu, Inc. ADR (a) | | | 5,000 | | | | 793 | | |
China Mengniu Dairy Co., Ltd. (a)(d) | | | 24,000 | | | | 74 | | |
CSPC Pharmaceutical Group Ltd. (d) | | | 46,000 | | | | 66 | | |
JD.com, Inc. ADR (a) | | | 6,600 | | | | 138 | | |
Tencent Holdings Ltd. (d) | | | 92,900 | | | | 3,682 | | |
| | | | 6,398 | | |
Denmark (1.8%) | |
DSV A/S | | | 1,895 | | | | 125 | | |
Novo Nordisk A/S Series B | | | 57,408 | | | | 2,639 | | |
Novozymes A/S Series B | | | 6,145 | | | | 275 | | |
Vestas Wind Systems A/S | | | 1,348 | | | | 102 | | |
| | | | 3,141 | | |
Egypt (0.7%) | |
Commercial International Bank Egypt SAE | | | 306,818 | | | | 1,285 | | |
| | | Shares | | Value
(000) | |
Finland (0.6%) | |
Neste Oyj | | | 2,554 | | | $ | 197 | | |
Nokia Oyj | | | 110,241 | | | | 637 | | |
Orion Oyj, Class B | | | 2,195 | | | | 76 | | |
Wartsila Oyj Abp | | | 6,723 | | | | 107 | | |
| | | | 1,017 | | |
France (8.2%) | |
Accor SA | | | 1,832 | | | | 78 | | |
Air Liquide SA | | | 4,946 | | | | 612 | | |
Airbus SE | | | 5,515 | | | | 527 | | |
Atos SE | | | 1,887 | | | | 153 | | |
Bureau Veritas SA | | | 14,281 | | | | 290 | | |
Capgemini SE | | | 4,960 | | | | 490 | | |
Cie de Saint-Gobain | | | 9,069 | | | | 302 | | |
Cie Generale des Etablissements Michelin SCA | | | 1,659 | | | | 164 | | |
Danone SA | | | 27,839 | | | | 1,962 | | |
Dassault Systemes SE | | | 5,767 | | | | 681 | | |
Edenred | | | 13,744 | | | | 504 | | |
Engie SA | | | 40,095 | | | | 573 | | |
EssilorLuxottica SA | | | 4,581 | | | | 578 | | |
Gecina SA REIT | | | 439 | | | | 57 | | |
Hermes International | | | 463 | | | | 256 | | |
Kering SA | | | 1,106 | | | | 517 | | |
L'Oreal SA | | | 2,311 | | | | 530 | | |
Legrand SA | | | 6,555 | | | | 369 | | |
LVMH Moet Hennessy Louis Vuitton SE | | | 1,997 | | | | 587 | | |
Pernod Ricard SA | | | 4,095 | | | | 672 | | |
Remy Cointreau SA | | | 572 | | | | 65 | | |
Safran SA | | | 3,213 | | | | 386 | | |
Sanofi | | | 20,368 | | | | 1,760 | | |
Societe BIC SA | | | 2,385 | | | | 243 | | |
Sodexo SA | | | 1,718 | | | | 176 | | |
STMicroelectronics N.V. | | | 7,689 | | | | 110 | | |
Television Francaise 1 | | | 8,274 | | | | 67 | | |
Thales SA | | | 1,015 | | | | 118 | | |
TOTAL SA | | | 28,333 | | | | 1,497 | | |
Vivendi SA | | | 4,595 | | | | 112 | | |
| | | | 14,436 | | |
Germany (11.4%) | |
Adidas AG | | | 5,217 | | | | 1,090 | | |
Allianz SE (Registered) | | | 8,904 | | | | 1,787 | | |
BASF SE | | | 9,194 | | | | 636 | | |
Bayer AG (Registered) | | | 51,509 | | | | 3,572 | | |
Bayerische Motoren Werke AG | | | 4,266 | | | | 346 | | |
Bayerische Motoren Werke AG (Preference) | | | 579 | | | | 41 | | |
Beiersdorf AG | | | 3,335 | | | | 348 | | |
Brenntag AG | | | 3,042 | | | | 131 | | |
Commerzbank AG (a) | | | 75,123 | | | | 498 | | |
Continental AG | | | 2,122 | | | | 293 | | |
Daimler AG (Registered) | | | 12,470 | | | | 656 | | |
Deutsche Boerse AG | | | 4,013 | | | | 483 | | |
Deutsche Wohnen SE | | | 13,273 | | | | 608 | | |
The accompanying notes are an integral part of the financial statements.
7
Morgan Stanley Institutional Fund, Inc.
Annual Report — December 31, 2018
Portfolio of Investments (cont'd)
Active International Allocation Portfolio
| | | Shares | | Value
(000) | |
Germany (cont'd) | |
E.ON SE | | | 33,170 | | | $ | 328 | | |
Fresenius Medical Care AG & Co., KGaA | | | 6,022 | | | | 391 | | |
GEA Group AG | | | 9,660 | | | | 249 | | |
Hannover Rueck SE (Registered) | | | 1,596 | | | | 215 | | |
Henkel AG & Co., KGaA | | | 1,161 | | | | 114 | | |
Henkel AG & Co., KGaA (Preference) | | | 6,784 | | | | 741 | | |
Infineon Technologies AG | | | 33,471 | | | | 666 | | |
Merck KGaA | | | 4,793 | | | | 495 | | |
Muenchener Rueckversicherungs-Gesellschaft
AG in Muenchen (Registered) | | | 3,877 | | | | 846 | | |
Porsche Automobil Holding SE (Preference) | | | 3,698 | | | | 219 | | |
QIAGEN N.V. (a) | | | 12,900 | | | | 444 | | |
QIAGEN N.V. (a) | | | 24,063 | | | | 821 | | |
RWE AG | | | 5,480 | | | | 119 | | |
SAP SE | | | 23,453 | | | | 2,336 | | |
Uniper SE | | | 7,027 | | | | 182 | | |
United Internet AG (Registered) | | | 12,921 | | | | 565 | | |
Vonovia SE | | | 12,764 | | | | 579 | | |
Zalando SE (a) | | | 6,559 | | | | 169 | | |
| | | | 19,968 | | |
Hong Kong (0.8%) | |
AIA Group Ltd. | | | 122,800 | | | | 1,010 | | |
Hong Kong Exchanges & Clearing Ltd. | | | 13,350 | | | | 383 | | |
| | | | 1,393 | | |
Hungary (0.2%) | |
OTP Bank Nyrt | | | 7,656 | | | | 309 | | |
India (5.4%) | |
Ashok Leyland Ltd. | | | 691,924 | | | | 1,013 | | |
Eicher Motors Ltd. | | | 1,565 | | | | 517 | | |
Housing Development Finance Corp., Ltd. | | | 39,997 | | | | 1,128 | | |
ICICI Bank Ltd. | | | 189,283 | | | | 978 | | |
IndusInd Bank Ltd. | | | 51,883 | | | | 1,190 | | |
Marico Ltd. | | | 292,091 | | | | 1,560 | | |
Maruti Suzuki India Ltd. | | | 10,517 | | | | 1,122 | | |
Shree Cement Ltd. | | | 3,949 | | | | 975 | | |
Zee Entertainment Enterprises Ltd. | | | 138,122 | | | | 940 | | |
| | | | 9,423 | | |
Indonesia (3.2%) | |
Astra International Tbk PT | | | 1,008,100 | | | | 580 | | |
Bank Central Asia Tbk PT | | | 1,981,900 | | | | 3,583 | | |
Charoen Pokphand Indonesia Tbk PT | | | 406,700 | | | | 204 | | |
Gudang Garam Tbk PT | | | 26,500 | | | | 154 | | |
Hanjaya Mandala Sampoerna Tbk PT | | | 491,700 | | | | 127 | | |
Kalbe Farma Tbk PT | | | 1,161,400 | | | | 123 | | |
Telekomunikasi Indonesia Persero Tbk PT | | | 2,542,800 | | | | 664 | | |
Unilever Indonesia Tbk PT | | | 80,300 | | | | 254 | | |
| | | | 5,689 | | |
Ireland (0.7%) | |
Kerry Group PLC, Class A | | | 4,867 | | | | 481 | | |
Ryanair Holdings PLC ADR (a) | | | 9,477 | | | | 676 | | |
| | | | 1,157 | | |
| | | Shares | | Value
(000) | |
Japan (10.3%) | |
Asahi Group Holdings Ltd. | | | 7,200 | | | $ | 281 | | |
Astellas Pharma, Inc. | | | 21,700 | | | | 276 | | |
Central Japan Railway Co. | | | 2,192 | | | | 466 | | |
Dai-ichi Life Holdings, Inc. | | | 24,400 | | | | 378 | | |
Daiichi Sankyo Co., Ltd. | | | 7,500 | | | | 241 | | |
Daikin Industries Ltd. | | | 4,200 | | | | 442 | | |
Daito Trust Construction Co., Ltd. | | | 956 | | | | 131 | | |
East Japan Railway Co. | | | 5,300 | | | | 471 | | |
Eisai Co., Ltd. | | | 5,900 | | | | 459 | | |
FANUC Corp. | | | 5,150 | | | | 774 | | |
FUJIFILM Holdings Corp. | | | 9,800 | | | | 378 | | |
Honda Motor Co., Ltd. | | | 15,113 | | | | 395 | | |
Hoya Corp. | | | 7,800 | | | | 477 | | |
ITOCHU Corp. | | | 21,951 | | | | 370 | | |
Kao Corp. | | | 8,400 | | | | 619 | | |
Keyence Corp. | | | 2,800 | | | | 1,411 | | |
Kose Corp. | | | 1,100 | | | | 174 | | |
Makita Corp. | | | 5,600 | | | | 198 | | |
Mitsubishi Corp. | | | 24,300 | | | | 663 | | |
Mitsubishi UFJ Financial Group, Inc. | | | 46,206 | | | | 228 | | |
Murata Manufacturing Co., Ltd. | | | 2,900 | | | | 400 | | |
Nabtesco Corp. | | | 1,900 | | | | 41 | | |
Nexon Co., Ltd. (a) | | | 49,800 | | | | 636 | | |
Nidec Corp. | | | 4,800 | | | | 550 | | |
Nintendo Co., Ltd. | | | 1,808 | | | | 478 | | |
Nissan Motor Co., Ltd. | | | 27,805 | | | | 224 | | |
Obic Co., Ltd. | | | 1,300 | | | | 100 | | |
Omron Corp. | | | 4,404 | | | | 159 | | |
Ono Pharmaceutical Co., Ltd. | | | 7,700 | | | | 156 | | |
Oriental Land Co., Ltd. | | | 3,200 | | | | 325 | | |
Panasonic Corp. | | | 19,100 | | | | 171 | | |
Recruit Holdings Co., Ltd. | | | 20,100 | | | | 481 | | |
Santen Pharmaceutical Co., Ltd. | | | 9,100 | | | | 130 | | |
Shimano, Inc. | | | 4,350 | | | | 618 | | |
Shiseido Co., Ltd. | | | 10,300 | | | | 640 | | |
SMC Corp. | | | 2,105 | | | | 629 | | |
SoftBank Group Corp. | | | 8,700 | | | | 574 | | |
Sony Corp. | | | 12,893 | | | | 621 | | |
Tokio Marine Holdings, Inc. | | | 11,620 | | | | 552 | | |
Toyota Motor Corp. | | | 18,155 | | | | 1,055 | | |
Unicharm Corp. | | | 13,300 | | | | 430 | | |
Yamaha Corp. | | | 2,400 | | | | 102 | | |
Yaskawa Electric Corp. | | | 2,800 | | | | 68 | | |
| | | | 17,972 | | |
Malaysia (1.4%) | |
CIMB Group Holdings Bhd | | | 122,200 | | | | 169 | | |
DiGi.Com Bhd | | | 107,100 | | | | 117 | | |
Genting Bhd | | | 77,500 | | | | 114 | | |
Genting Malaysia Bhd | | | 102,300 | | | | 75 | | |
IHH Healthcare Bhd | | | 70,900 | | | | 92 | | |
Malayan Banking Bhd | | | 122,900 | | | | 282 | | |
The accompanying notes are an integral part of the financial statements.
8
Morgan Stanley Institutional Fund, Inc.
Annual Report — December 31, 2018
Portfolio of Investments (cont'd)
Active International Allocation Portfolio
| | | Shares | | Value
(000) | |
Malaysia (cont'd) | |
Malaysia Airports Holdings Bhd | | | 57,400 | | | $ | 116 | | |
Petronas Chemicals Group Bhd | | | 82,700 | | | | 186 | | |
Public Bank Bhd | | | 205,500 | | | | 1,229 | | |
| | | | 2,380 | | |
Malta (0.0%) | |
BGP Holdings PLC (a)(e)(f) | | | 72,261 | | | | — | @ | |
Netherlands (3.4%) | |
Heineken N.V. | | | 5,442 | | | | 480 | | |
Koninklijke Philips N.V. | | | 65,002 | | | | 2,291 | | |
Unilever N.V. CVA | | | 38,935 | | | | 2,115 | | |
Wolters Kluwer N.V. | | | 19,131 | | | | 1,130 | | |
| | | | 6,016 | | |
Peru (1.2%) | |
Cia de Minas Buenaventura SA ADR | | | 15,000 | | | | 244 | | |
Credicorp Ltd. | | | 7,200 | | | | 1,596 | | |
Southern Copper Corp. | | | 6,700 | | | | 206 | | |
| | | | 2,046 | | |
Poland (2.6%) | |
Dino Polska SA (a) | | | 48,295 | | | | 1,235 | | |
Jeronimo Martins SGPS SA | | | 76,511 | | | | 906 | | |
Powszechna Kasa Oszczednosci Bank Polski SA | | | 109,948 | | | | 1,159 | | |
Powszechny Zaklad Ubezpieczen SA | | | 109,506 | | | | 1,287 | | |
| | | | 4,587 | | |
Portugal (0.1%) | |
Galp Energia SGPS SA | | | 12,270 | | | | 194 | | |
South Africa (0.0%) | |
Old Mutual Ltd. | | | 21,154 | | | | 31 | | |
Spain (2.4%) | |
Aena SME SA | | | 4,497 | | | | 697 | | |
Amadeus IT Group SA | | | 19,720 | | | | 1,373 | | |
Endesa SA | | | 29,309 | | | | 675 | | |
Grifols SA | | | 22,454 | | | | 587 | | |
Industria de Diseno Textil SA | | | 26,756 | | | | 682 | | |
Repsol SA | | | 12,277 | | | | 197 | | |
| | | | 4,211 | | |
Sweden (1.5%) | |
Essity AB, Class B | | | 13,601 | | | | 334 | | |
Hennes & Mauritz AB, Class B | | | 16,318 | | | | 232 | | |
Hexagon AB, Class B | | | 9,186 | | | | 424 | | |
Telefonaktiebolaget LM Ericsson, Class B | | | 181,320 | | | | 1,598 | | |
| | | | 2,588 | | |
Switzerland (6.1%) | |
Baloise Holding AG (Registered) | | | 833 | | | | 115 | | |
Geberit AG (Registered) | | | 1,694 | | | | 660 | | |
Givaudan SA (Registered) | | | 246 | | | | 571 | | |
Nestle SA (Registered) | | | 57,551 | | | | 4,679 | | |
Partners Group Holding AG | | | 198 | | | | 120 | | |
Roche Holding AG (Genusschein) | | | 14,431 | | | | 3,569 | | |
| | | Shares | | Value
(000) | |
Swiss Life Holding AG (Registered) (a) | | | 995 | | | $ | 384 | | |
Zurich Insurance Group AG | | | 2,096 | | | | 626 | | |
| | | | 10,724 | | |
Taiwan (1.6%) | |
Airtac International Group | | | 32,000 | | | | 309 | | |
Taiwan Semiconductor Manufacturing Co., Ltd. | | | 341,000 | | | | 2,475 | | |
| | | | 2,784 | | |
United Kingdom (11.8%) | |
| ASOS PLC (a) | | | 2,403 | | | | 69 | | |
AstraZeneca PLC | | | 27,591 | | | | 2,063 | | |
AstraZeneca PLC ADR | | | 9,910 | | | | 376 | | |
BAE Systems PLC | | | 130,645 | | | | 763 | | |
British American Tobacco PLC | | | 46,513 | | | | 1,483 | | |
Burberry Group PLC | | | 8,172 | | | | 180 | | |
Diageo PLC | | | 27,352 | | | | 972 | | |
Ferguson PLC | | | 3,224 | | | | 206 | | |
GlaxoSmithKline PLC | | | 74,410 | | | | 1,412 | | |
Glencore PLC (a) | | | 94,670 | | | | 349 | | |
Indivior PLC (a) | | | 16,953 | | | | 24 | | |
Intertek Group PLC | | | 3,793 | | | | 231 | | |
Johnson Matthey PLC | | | 2,526 | | | | 90 | | |
Melrose Industries PLC | | | 34,621 | | | | 72 | | |
Micro Focus International PLC | | | 11,865 | | | | 207 | | |
Prudential PLC | | | 14,422 | | | | 258 | | |
Reckitt Benckiser Group PLC | | | 16,042 | | | | 1,225 | | |
RELX PLC (a) | | | 67,046 | | | | 1,380 | | |
RELX PLC | | | 20,956 | | | | 430 | | |
Rolls-Royce Holdings PLC (a) | | | 510,738 | | | | 1 | | |
Royal Dutch Shell PLC, Class A | | | 42,335 | | | | 1,243 | | |
Royal Dutch Shell PLC, Class B | | | 31,111 | | | | 926 | | |
Sage Group PLC (The) | | | 72,435 | | | | 555 | | |
Shire PLC | | | 53,396 | | | | 3,103 | | |
Smith & Nephew PLC | | | 35,901 | | | | 668 | | |
TechnipFMC PLC | | | 3,806 | | | | 77 | | |
Unilever PLC | | | 44,586 | | | | 2,334 | | |
| | | | 20,697 | | |
United States (7.5%) | |
Allergan PLC | | | 2,900 | | | | 388 | | |
Alphabet, Inc., Class A (a) | | | 900 | | | | 940 | | |
American Tower Corp. REIT | | | 2,400 | | | | 380 | | |
Biogen, Inc. (a) | | | 2,100 | | | | 632 | | |
Booking Holdings, Inc. (a) | | | 530 | | | | 913 | | |
Bristol-Myers Squibb Co. | | | 12,100 | | | | 629 | | |
Charles River Laboratories International, Inc. (a) | | | 2,300 | | | | 260 | | |
Cognex Corp. | | | 7,900 | | | | 306 | | |
Editas Medicine, Inc. (a) | | | 4,400 | | | | 100 | | |
Halliburton Co. | | | 12,600 | | | | 335 | | |
ICON PLC (a) | | | 4,120 | | | | 532 | | |
Incyte Corp. (a) | | | 3,100 | | | | 197 | | |
Intellia Therapeutics, Inc. (a) | | | 6,300 | | | | 86 | | |
Intuitive Surgical, Inc. (a) | | | 600 | | | | 287 | | |
Mastercard, Inc., Class A | | | 3,200 | | | | 604 | | |
The accompanying notes are an integral part of the financial statements.
9
Morgan Stanley Institutional Fund, Inc.
Annual Report — December 31, 2018
Portfolio of Investments (cont'd)
Active International Allocation Portfolio
| | | Shares | | Value
(000) | |
United States (cont'd) | |
Medtronic PLC | | | 7,400 | | | $ | 673 | | |
MercadoLibre, Inc. | | | 700 | | | | 205 | | |
Microsoft Corp. | | | 8,300 | | | | 843 | | |
Newmont Mining Corp. | | | 25,000 | | | | 866 | | |
Palo Alto Networks, Inc. (a) | | | 2,900 | | | | 546 | | |
PepsiCo, Inc. | | | 3,200 | | | | 354 | | |
Schlumberger Ltd. | | | 53,800 | | | | 1,941 | | |
Visa, Inc., Class A | | | 8,900 | | | | 1,174 | | |
| | | | 13,191 | | |
Total Common Stocks (Cost $148,800) | | | 161,864 | | |
Short-Term Investments (5.3%) | |
Securities held as Collateral on Loaned Securities (0.0%) | |
Investment Company (0.0%) | |
Morgan Stanley Institutional Liquidity
Funds — Treasury Securities Portfolio —
Institutional Class (See Note G) | | | 19,001 | | | | 19 | | |
| | | Face
Amount
(000) | | | |
Repurchase Agreements (0.0%) | |
Barclays Capital, Inc., (2.90%,
dated 12/31/18, due 1/2/19;
proceeds $1; fully collateralized by
a U.S. Government obligation;
2.50% due 5/15/24; valued at $1) | | $ | 1 | | | | 1 | | |
HSBC Securities USA, Inc., (2.95%,
dated 12/31/18, due 1/2/19; proceeds
$3; fully collateralized by
U.S. Government obligations;
0.00% - 2.75% due 1/31/19 - 2/15/42;
valued at $3) | | | 3 | | | | 3 | | |
| | | | 4 | | |
Total Securities held as Collateral on Loaned
Securities (Cost $23) | | | 23 | | |
| | | Shares | | Value
(000) | |
Investment Company (5.3%) | |
Morgan Stanley Institutional Liquidity
Funds — Treasury Securities Portfolio —
Institutional Class (See Note G)
(Cost $9,252) | | | 9,252,146 | | | $ | 9,252 | | |
Total Short-Term Investments (Cost $9,275) | | | 9,275 | | |
Total Investments (97.8%) (Cost $158,075)
Including $44 of Securities Loaned (g)(h)(i) | | | 171,139 | | |
Other Assets in Excess of Liabilities (2.2%) | | | 3,929 | | |
Net Assets (100.0%) | | $ | 175,068 | | |
Country assignments and aggregations are based generally on third party vendor classifications and information, and may be different from the assignments and aggregations under the policies set forth in the Fund's prospectus and/or statement of additional information relating to geographic classifications.
@ Value is less than $500.
(a) Non-income producing security.
(b) All or a portion of this security was on loan at December 31, 2018.
(c) Consists of one or more classes of securities traded together as a unit; stocks with attached warrants.
(d) Security trades on the Hong Kong exchange.
(e) Security has been deemed illiquid at December 31, 2018.
(f) At December 31, 2018, the Fund held a fair valued security valued at less than $500, representing less than 0.05% of net assets. This security has been fair valued as determined in good faith under procedures established by and under the general supervision of the Company's Directors.
(g) Securities are available for collateral in connection with open foreign currency forward exchange contracts and futures contracts.
(h) The approximate fair value and percentage of net assets, $137,898,000 and 78.8%, respectively, represent the securities that have been fair valued under the fair valuation policy for international investments as described in Note A-1 within the Notes to the Financial Statements.
(i) At December 31, 2018, the aggregate cost for federal income tax purposes is approximately $159,260,000. The aggregate gross unrealized appreciation is approximately $23,749,000 and the aggregate gross unrealized depreciation is approximately $11,687,000, resulting in net unrealized appreciation of approximately $12,062,000.
ADR American Depositary Receipt.
CVA Certificaten Van Aandelen.
REIT Real Estate Investment Trust.
The accompanying notes are an integral part of the financial statements.
10
Morgan Stanley Institutional Fund, Inc.
Annual Report — December 31, 2018
Portfolio of Investments (cont'd)
Active International Allocation Portfolio
Foreign Currency Forward Exchange Contracts:
The Fund had the following foreign currency forward exchange contracts open at December 31, 2018:
Counterparty | | Contracts to
Deliver
(000) | | In Exchange
For
(000) | | Delivery
Date | | Unrealized
Appreciation
(Depreciation)
(000) | |
Citibank NA | | EUR | 1,593 | | | $ | 1,824 | | | 3/14/19 | | $ | (12 | ) | |
Goldman Sachs International | | $ | 2,745 | | | MYR | 11,469 | | | 3/14/19 | | | 28 | | |
JPMorgan Chase Bank NA | | $ | 2,432 | | | MXN | 49,593 | | | 3/14/19 | | | 64 | | |
State Street Bank and Trust Co. | | HKD | 35,433 | | | $ | 4,538 | | | 3/14/19 | | | 3 | | |
State Street Bank and Trust Co. | | $ | 2,402 | | | GBP | 1,894 | | | 3/14/19 | | | 20 | | |
State Street Bank and Trust Co. | | $ | 1,902 | | | JPY | 212,626 | | | 3/14/19 | | | 48 | | |
| | | | | | | | | $ | 151 | | |
Futures Contracts:
The Fund had the following futures contracts open at December 31, 2018:
| | | Number
of
Contracts | | Expiration
Date | | Notional
Amount
(000) | | Value
(000) | | Unrealized
Appreciation
(Depreciation)
(000) | |
Long: | |
FTSE 100 Index (United Kingdom) | | | 30 | | | Mar-19 | | | — | @ | | $ | 2,546 | | | $ | 4 | | |
FTSE KLCI Index (Malaysia) | | | 139 | | | Jan-19 | | | 7 | | | | 2,845 | | | | 56 | | |
MEX BOLSA Index (Mexico) | | | 118 | | | Mar-19 | | | 1 | | | | 2,508 | | | | 38 | | |
MSCI Emerging Market E Mini (United States) | | | 47 | | | Mar-19 | | | 2 | | | | 2,272 | | | | (57 | ) | |
SGX NIFTY 50 (Singapore) | | | 80 | | | Jan-19 | | | — | @ | | | 1,748 | | | | (9 | ) | |
| | | | | | | | | | | $ | 32 | | |
@ Amount is less than $500.
EUR — Euro
GBP — British Pound
HKD — Hong Kong Dollar
JPY — Japanese Yen
MXN — Mexican Peso
MYR — Malaysian Ringgit
USD — United States Dollar
Portfolio Composition*
Classification | | Percentage of
Total Investments | |
Other** | | | 74.2 | % | |
Pharmaceuticals | | | 11.0 | | |
Banks | | | 9.4 | | |
Short-Term Investments | | | 5.4 | | |
Total Investments | | | 100.0 | %*** | |
* Percentages indicated are based upon total investments (excluding Securities held as Collateral on Loaned Securities) as of December 31, 2018.
** Industries and/or investment types representing less than 5% of total investments.
*** Does not include open long futures contracts with a value of approximately $11,919,000 and net unrealized appreciation of approximately $32,000. Does not include open foreign currency forward exchange contracts with net unrealized appreciation of approximately $151,000.
The accompanying notes are an integral part of the financial statements.
11
Morgan Stanley Institutional Fund, Inc.
Annual Report — December 31, 2018
Active International Allocation Portfolio
Statement of Assets and Liabilities | | December 31, 2018
(000) | |
Assets: | |
Investments in Securities of Unaffiliated Issuers, at Value(1) (Cost $148,294) | | $ | 161,640 | | |
Investments in Securities of Affiliated Issuers, at Value (Cost $9,781) | | | 9,499 | | |
Total Investments in Securities, at Value (Cost $158,075) | | | 171,139 | | |
Foreign Currency, at Value (Cost $48) | | | 41 | | |
Receivable for Investments Sold | | | 6,744 | | |
Receivable for Variation Margin on Futures Contracts | | | 613 | | |
Receivable for Fund Shares Sold | | | 504 | | |
Tax Reclaim Receivable | | | 398 | | |
Unrealized Appreciation on Foreign Currency Forward Exchange Contracts | | | 163 | | |
Dividends Receivable | | | 147 | | |
Receivable from Affiliate | | | 17 | | |
Receivable from Securities Lending Income | | | 1 | | |
Other Assets | | | 41 | | |
Total Assets | | | 179,808 | | |
Liabilities: | |
Payable for Investments Purchased | | | 3,543 | | |
Payable for Fund Shares Redeemed | | | 669 | | |
Payable for Advisory Fees | | | 232 | | |
Payable for Professional Fees | | | 95 | | |
Payable for Directors' Fees and Expenses | | | 30 | | |
Collateral on Securities Loaned, at Value | | | 23 | | |
Deferred Capital Gain Country Tax | | | 21 | | |
Payable for Custodian Fees | | | 20 | | |
Payable for Sub Transfer Agency Fees — Class I | | | 10 | | |
Payable for Sub Transfer Agency Fees — Class A | | | 8 | | |
Payable for Sub Transfer Agency Fees — Class L | | | 1 | | |
Payable for Sub Transfer Agency Fees — Class C | | | — | @ | |
Payable for Shareholder Services Fees — Class A | | | 11 | | |
Payable for Distribution and Shareholder Services Fees — Class L | | | 3 | | |
Payable for Distribution and Shareholder Services Fees — Class C | | | — | @ | |
Unrealized Depreciation on Foreign Currency Forward Exchange Contract | | | 12 | | |
Payable for Administration Fees | | | 12 | | |
Payable for Transfer Agency Fees — Class I | | | 3 | | |
Payable for Transfer Agency Fees — Class A | | | 4 | | |
Payable for Transfer Agency Fees — Class L | | | 1 | | |
Payable for Transfer Agency Fees — Class C | | | 1 | | |
Bank Overdraft | | | 1 | | |
Other Liabilities | | | 40 | | |
Total Liabilities | | | 4,740 | | |
Net Assets | | $ | 175,068 | | |
Net Assets Consist of: | |
Paid-in-Capital | | $ | 174,574 | | |
Total Distributable Earnings | | | 494 | | |
Net Assets | | $ | 175,068 | | |
The accompanying notes are an integral part of the financial statements.
12
Morgan Stanley Institutional Fund, Inc.
Annual Report — December 31, 2018
Active International Allocation Portfolio
Statement of Assets and Liabilities (cont'd) | | December 31, 2018
(000) | |
CLASS I: | |
Net Assets | | $ | 119,925 | | |
| Shares Outstanding $0.001 par value shares of beneficial interest (unlimited shares authorized) (not in 000's) | | | 9,938,100 | | |
Net Asset Value, Offering and Redemption Price Per Share | | $ | 12.07 | | |
CLASS A: | |
Net Assets | | $ | 50,726 | | |
| Shares Outstanding $0.001 par value shares of beneficial interest (unlimited shares authorized) (not in 000's) | | | 4,105,360 | | |
Net Asset Value, Redemption Price Per Share | | $ | 12.36 | | |
Maximum Sales Load | | | 5.25 | % | |
Maximum Sales Charge | | $ | 0.68 | | |
Maximum Offering Price Per Share | | $ | 13.04 | | |
CLASS L: | |
Net Assets | | $ | 4,375 | | |
| Shares Outstanding $0.001 par value shares of beneficial interest (unlimited shares authorized) (not in 000's) | | | 355,048 | | |
Net Asset Value, Offering and Redemption Price Per Share | | $ | 12.32 | | |
CLASS C: | |
Net Assets | | $ | 42 | | |
| Shares Outstanding $0.001 par value shares of beneficial interest (unlimited shares authorized) (not in 000's) | | | 3,387 | | |
Net Asset Value, Offering and Redemption Price Per Share | | $ | 12.34 | | |
(1) Including:
Securities on Loan, at Value: | | $ | 44 | | |
@ Amount is less than $500.
The accompanying notes are an integral part of the financial statements.
13
Morgan Stanley Institutional Fund, Inc.
Annual Report — December 31, 2018
Active International Allocation Portfolio
Statement of Operations | | Year Ended
December 31, 2018
(000) | |
Investment Income: | |
Dividends from Securities of Unaffiliated Issuers (Net of $298 of Foreign Taxes Withheld) | | $ | 4,996 | | |
Dividends from Securities of Affiliated Issuers (Note G) | | | 265 | | |
Income from Securities Loaned — Net | | | 56 | | |
Total Investment Income | | | 5,317 | | |
Expenses: | |
Advisory Fees (Note B) | | | 1,351 | | |
Shareholder Services Fees — Class A (Note D) | | | 150 | | |
Distribution and Shareholder Services Fees — Class L (Note D) | | | 42 | | |
Distribution and Shareholder Services Fees — Class C (Note D) | | | — | @ | |
Administration Fees (Note C) | | | 166 | | |
Professional Fees | | | 149 | | |
Shareholder Reporting Fees | | | 137 | | |
Registration Fees | | | 55 | | |
Custodian Fees (Note F) | | | 49 | | |
Sub Transfer Agency Fees — Class I | | | 24 | | |
Sub Transfer Agency Fees — Class A | | | 22 | | |
Sub Transfer Agency Fees — Class C | | | — | @ | |
Pricing Fees | | | 28 | | |
Transfer Agency Fees — Class I (Note E) | | | 8 | | |
Transfer Agency Fees — Class A (Note E) | | | 12 | | |
Transfer Agency Fees — Class L (Note E) | | | 4 | | |
Transfer Agency Fees — Class C (Note E) | | | 2 | | |
Directors' Fees and Expenses | | | 9 | | |
Other Expenses | | | 34 | | |
Total Expenses | | | 2,242 | | |
Waiver of Advisory Fees (Note B) | | | (108 | ) | |
Reimbursement of Class Specific Expenses — Class I (Note B) | | | (32 | ) | |
Reimbursement of Class Specific Expenses — Class C (Note B) | | | (2 | ) | |
Rebate from Morgan Stanley Affiliate (Note G) | | | (33 | ) | |
Net Expenses | | | 2,067 | | |
Net Investment Income | | | 3,250 | | |
Realized Gain (Loss): | |
Investments Sold (Net of $2 of Capital Gain Country Tax) | | | 7,040 | | |
Investments in Affiliates | | | (233 | ) | |
Foreign Currency Forward Exchange Contracts | | | (362 | ) | |
Foreign Currency Translation | | | (391 | ) | |
Futures Contracts | | | (1,927 | ) | |
Net Realized Gain | | | 4,127 | | |
Change in Unrealized Appreciation (Depreciation): | |
Investments (Net of Decrease in Deferred Capital Gain Country Tax of $23) | | | (38,914 | ) | |
Investments in Affiliates | | | 61 | | |
Foreign Currency Forward Exchange Contracts | | | (49 | ) | |
Foreign Currency Translation | | | (63 | ) | |
Futures Contracts | | | (622 | ) | |
Net Change in Unrealized Appreciation (Depreciation) | | | (39,587 | ) | |
Net Realized Gain and Change in Unrealized Appreciation (Depreciation) | | | (35,460 | ) | |
Net Decrease in Net Assets Resulting from Operations | | $ | (32,210 | ) | |
@ Amount is less than $500.
The accompanying notes are an integral part of the financial statements.
14
Morgan Stanley Institutional Fund, Inc.
Annual Report — December 31, 2018
Active International Allocation Portfolio
Statements of Changes in Net Assets | | Year Ended
December 31, 2018
(000) | | Year Ended
December 31, 2017
(000) | |
Increase (Decrease) in Net Assets: | |
Operations: | |
Net Investment Income | | $ | 3,250 | | | $ | 3,025 | | |
Net Realized Gain | | | 4,127 | | | | 19,186 | | |
Net Change in Unrealized Appreciation (Depreciation) | | | (39,587 | ) | | | 29,205 | | |
Net Increase (Decrease) in Net Assets Resulting from Operations | | | (32,210 | ) | | | 51,416 | | |
Dividends and Distributions to Shareholders: | |
Class I | | | (2,041 | ) | | | (3,170 | )* | |
Class A | | | (655 | ) | | | (1,073 | )* | |
Class L | | | (29 | ) | | | (75 | )* | |
Class C | | | (— | @) | | | (— | @)* | |
Total Dividends and Distributions to Shareholders | | | (2,725 | ) | | | (4,318 | ) | |
Capital Share Transactions:(1) | |
Class I: | |
Subscribed | | | 10,181 | | | | 6,465 | | |
Distributions Reinvested | | | 2,032 | | | | 3,157 | | |
Redeemed | | | (23,890 | ) | | | (57,220 | ) | |
Class A: | |
Subscribed | | | 9,153 | | | | 6,669 | | |
Distributions Reinvested | | | 646 | | | | 1,059 | | |
Redeemed | | | (14,703 | ) | | | (11,227 | ) | |
Class L: | |
Exchanged | | | 50 | | | | — | | |
Distributions Reinvested | | | 28 | | | | 74 | | |
Redeemed | | | (1,267 | ) | | | (928 | ) | |
Class C: | |
Subscribed | | | 27 | | | | 13 | | |
Distributions Reinvested | | | — | @ | | | — | @ | |
Redeemed | | | — | @ | | | — | | |
Net Decrease in Net Assets Resulting from Capital Share Transactions | | | (17,743 | ) | | | (51,938 | ) | |
Redemption Fees | | | — | @ | | | 1 | | |
Total Decrease in Net Assets | | | (52,678 | ) | | | (4,839 | ) | |
Net Assets: | |
Beginning of Period | | | 227,746 | | | | 232,585 | | |
End of Period | | $ | 175,068 | | | $ | 227,746 | † | |
The accompanying notes are an integral part of the financial statements.
15
Morgan Stanley Institutional Fund, Inc.
Annual Report — December 31, 2018
Active International Allocation Portfolio
Statements of Changes in Net Assets (cont'd) | | Year Ended
December 31, 2018
(000) | | Year Ended
December 31, 2017
(000) | |
(1) Capital Share Transactions: | |
Class I: | |
Shares Subscribed | | | 736 | | | | 501 | | |
Shares Issued on Distributions Reinvested | | | 164 | | | | 221 | | |
Shares Redeemed | | | (1,720 | ) | | | (4,302 | ) | |
Net Decrease in Class I Shares Outstanding | | | (820 | ) | | | (3,580 | ) | |
Class A: | |
Shares Subscribed | | | 668 | | | | 489 | | |
Shares Issued on Distributions Reinvested | | | 51 | | | | 73 | | |
Shares Redeemed | | | (1,056 | ) | | | (826 | ) | |
Net Decrease in Class A Shares Outstanding | | | (337 | ) | | | (264 | ) | |
Class L: | |
Shares Exchanged | | | 4 | | | | — | | |
Shares Issued on Distributions Reinvested | | | 2 | | | | 5 | | |
Shares Redeemed | | | (90 | ) | | | (69 | ) | |
Net Decrease in Class L Shares Outstanding | | | (84 | ) | | | (64 | ) | |
Class C: | |
Shares Subscribed | | | 2 | | | | 1 | | |
Shares Issued on Distributions Reinvested | | | — | @@ | | | — | @@ | |
Shares Redeemed | | | (— | @@) | | | — | | |
Net Increase in Class C Shares Outstanding | | | 2 | | | | 1 | | |
The following information was previously reported in the December 31, 2017 financial statements. The distribution information for the year ended December 31, 2017 presented on the Statements of Changes in Net Assets is presented for comparative purposes to the December 31, 2018 financial statements, which conform to the SEC Final Rule on Disclosure Update and Simplification which was effective November 5, 2018.
* Dividends and Distributions to Shareholders for the year ended December 31, 2017 were as follows:
Class I: | |
Net Investment Income | | $ | (3,170 | ) | |
Class A: | |
Net Investment Income | | $ | (1,073 | ) | |
Class L: | |
Net Investment Income | | $ | (75 | ) | |
Class C: | |
Net Investment Income | | $ | (— | @) | |
† Distributions in Excess of Net Investment Income for the year ended December 31, 2017 was $(477).
@ Amount is less than $500.
@@ Amount is less than 500 shares.
The accompanying notes are an integral part of the financial statements.
16
Morgan Stanley Institutional Fund, Inc.
Annual Report — December 31, 2018
Financial Highlights
Active International Allocation Portfolio
| | | Class I | |
| | | Year Ended December 31, | |
Selected Per Share Data and Ratios | | 2018 | | 2017 | | 2016(1) | | 2015 | | 2014 | |
Net Asset Value, Beginning of Period | | $ | 14.46 | | | $ | 11.83 | | | $ | 12.20 | | | $ | 12.52 | | | $ | 13.75 | | |
Income (Loss) from Investment Operations: | |
Net Investment Income(2) | | | 0.23 | | | | 0.19 | | | | 0.26 | | | | 0.22 | | | | 0.34 | | |
Net Realized and Unrealized Gain (Loss) | | | (2.41 | ) | | | 2.74 | | | | (0.34 | ) | | | (0.42 | ) | | | (1.22 | ) | |
Total from Investment Operations | | | (2.18 | ) | | | 2.93 | | | | (0.08 | ) | | | (0.20 | ) | | | (0.88 | ) | |
Distributions from and/or in Excess of: | |
Net Investment Income | | | (0.21 | ) | | | (0.30 | ) | | | (0.29 | ) | | | (0.12 | ) | | | (0.35 | ) | |
Redemption Fees | | | 0.00 | (3) | | | 0.00 | (3) | | | 0.00 | (3) | | | 0.00 | (3) | | | 0.00 | (3) | |
Net Asset Value, End of Period | | $ | 12.07 | | | $ | 14.46 | | | $ | 11.83 | | | $ | 12.20 | | | $ | 12.52 | | |
Total Return(4) | | | (15.14 | )% | | | 24.76 | % | | | (0.67 | )% | | | (1.63 | )% | | | (6.37 | )% | |
Ratios and Supplemental Data: | |
Net Assets, End of Period (Thousands) | | $ | 119,925 | | | $ | 155,550 | | | $ | 169,589 | | | $ | 197,733 | | | $ | 219,467 | | |
Ratio of Expenses to Average Net Assets(6) | | | 0.88 | %(5) | | | 0.88 | %(5) | | | 0.76 | %(5) | | | 0.89 | %(5) | | | 0.88 | %(5) | |
Ratio of Net Investment Income to Average Net Assets(6) | | | 1.67 | %(5) | | | 1.44 | %(5) | | | 2.18 | %(5) | | | 1.66 | %(5) | | | 2.53 | %(5) | |
Ratio of Rebate from Morgan Stanley Affiliates to Average Net Assets | | | 0.02 | % | | | 0.02 | % | | | 0.01 | % | | | 0.01 | % | | | 0.02 | % | |
Portfolio Turnover Rate | | | 43 | % | | | 22 | % | | | 40 | % | | | 30 | % | | | 32 | % | |
(6) Supplemental Information on the Ratios to Average Net Assets: | |
Ratios Before Expense Limitation: | |
Expenses to Average Net Assets | | | 0.97 | % | | | 1.14 | % | | | 0.94 | % | | | 0.92 | % | | | 0.99 | % | |
Net Investment Income to Average Net Assets | | | 1.58 | % | | | 1.18 | % | | | 2.00 | % | | | 1.63 | % | | | 2.42 | % | |
(1) Reflects prior period Custodian out-of-pocket expenses that were reimbursed in September 2016. The amount of the reimbursement was immaterial on a per share basis and did not impact the total return of Class I shares. The Ratio of Expenses to Average Net Assets would have been 0.13% higher and the Ratio of Net Investment Income to Average Net Assets would have been 0.13% lower had the Custodian not reimbursed the Fund.
(2) Per share amount is based on average shares outstanding.
(3) Amount is less than $0.005 per share.
(4) Calculated based on the net asset value as of the last business day of the period.
(5) The Ratios of Expenses and Net Investment Income reflect the rebate of certain Fund expenses in connection with the investments in Morgan Stanley affiliates during the period. The effect of the rebate on the ratios is disclosed in the above table as "Ratio of Rebate from Morgan Stanley Affiliates to Average Net Assets."
The accompanying notes are an integral part of the financial statements.
17
Morgan Stanley Institutional Fund, Inc.
Annual Report — December 31, 2018
Financial Highlights
Active International Allocation Portfolio
| | | Class A | |
| | | Year Ended December 31, | |
Selected Per Share Data and Ratios | | 2018 | | 2017 | | 2016(1) | | 2015 | | 2014 | |
Net Asset Value, Beginning of Period | | $ | 14.79 | | | $ | 12.10 | | | $ | 12.47 | | | $ | 12.79 | | | $ | 14.03 | | |
Income (Loss) from Investment Operations: | |
Net Investment Income(2) | | | 0.19 | | | | 0.14 | | | | 0.21 | | | | 0.17 | | | | 0.30 | | |
Net Realized and Unrealized Gain (Loss) | | | (2.46 | ) | | | 2.80 | | | | (0.34 | ) | | | (0.42 | ) | | | (1.24 | ) | |
Total from Investment Operations | | | (2.27 | ) | | | 2.94 | | | | (0.13 | ) | | | (0.25 | ) | | | (0.94 | ) | |
Distributions from and/or in Excess of: | |
Net Investment Income | | | (0.16 | ) | | | (0.25 | ) | | | (0.24 | ) | | | (0.07 | ) | | | (0.30 | ) | |
Redemption Fees | | | 0.00 | (3) | | | 0.00 | (3) | | | 0.00 | (3) | | | 0.00 | (3) | | | 0.00 | (3) | |
Net Asset Value, End of Period | | $ | 12.36 | | | $ | 14.79 | | | $ | 12.10 | | | $ | 12.47 | | | $ | 12.79 | | |
Total Return(4) | | | (15.38 | )% | | | 24.29 | % | | | (1.05 | )% | | | (1.95 | )% | | | (6.70 | )% | |
Ratios and Supplemental Data: | |
Net Assets, End of Period (Thousands) | | $ | 50,726 | | | $ | 65,710 | | | $ | 56,934 | | | $ | 64,482 | | | $ | 71,938 | | |
Ratio of Expenses to Average Net Assets(6) | | | 1.19 | %(5) | | | 1.23 | %(5) | | | 1.14 | %(5) | | | 1.24 | %(5) | | | 1.23 | %(5) | |
Ratio of Net Investment Income to Average Net Assets(6) | | | 1.37 | %(5) | | | 1.02 | %(5) | | | 1.79 | %(5) | | | 1.31 | %(5) | | | 2.18 | %(5) | |
Ratio of Rebate from Morgan Stanley Affiliates to Average Net Assets | | | 0.02 | % | | | 0.02 | % | | | 0.01 | % | | | 0.01 | % | | | 0.02 | % | |
Portfolio Turnover Rate | | | 43 | % | | | 22 | % | | | 40 | % | | | 30 | % | | | 32 | % | |
(6) Supplemental Information on the Ratios to Average Net Assets: | |
Ratios Before Expense Limitation: | |
Expenses to Average Net Assets | | | 1.26 | % | | | 1.48 | % | | | 1.32 | % | | | 1.28 | % | | | 1.31 | % | |
Net Investment Income to Average Net Assets | | | 1.30 | % | | | 0.77 | % | | | 1.61 | % | | | 1.27 | % | | | 2.10 | % | |
(1) Reflects prior period Custodian out-of-pocket expenses that were reimbursed in September 2016. The amount of the reimbursement was immaterial on a per share basis and did not impact the total return of Class A shares. The Ratio of Expenses to Average Net Assets would have been 0.10% higher and the Ratio of Net Investment Income to Average Net Assets would have been 0.10% lower had the Custodian not reimbursed the Fund.
(2) Per share amount is based on average shares outstanding.
(3) Amount is less than $0.005 per share.
(4) Calculated based on the net asset value which does not reflect sales charges, if applicable, as of the last business day of the period.
(5) The Ratios of Expenses and Net Investment Income reflect the rebate of certain Fund expenses in connection with the investments in Morgan Stanley affiliates during the period. The effect of the rebate on the ratios is disclosed in the above table as "Ratio of Rebate from Morgan Stanley Affiliates to Average Net Assets."
The accompanying notes are an integral part of the financial statements.
18
Morgan Stanley Institutional Fund, Inc.
Annual Report — December 31, 2018
Financial Highlights
Active International Allocation Portfolio
| | | Class L | |
| | | Year Ended December 31, | |
Selected Per Share Data and Ratios | | 2018 | | 2017 | | 2016(1) | | 2015 | | 2014 | |
Net Asset Value, Beginning of Period | | $ | 14.73 | | | $ | 12.04 | | | $ | 12.41 | | | $ | 12.74 | | | $ | 13.97 | | |
Income (Loss) from Investment Operations: | |
Net Investment Income(2) | | | 0.13 | | | | 0.07 | | | | 0.14 | | | | 0.11 | | | | 0.23 | | |
Net Realized and Unrealized Gain (Loss) | | | (2.46 | ) | | | 2.79 | | | | (0.35 | ) | | | (0.42 | ) | | | (1.23 | ) | |
Total from Investment Operations | | | (2.33 | ) | | | 2.86 | | | | (0.21 | ) | | | (0.31 | ) | | | (1.00 | ) | |
Distributions from and/or in Excess of: | |
Net Investment Income | | | (0.08 | ) | | | (0.17 | ) | | | (0.16 | ) | | | (0.02 | ) | | | (0.23 | ) | |
Redemption Fees | | | 0.00 | (3) | | | 0.00 | (3) | | | 0.00 | (3) | | | 0.00 | (3) | | | 0.00 | (3) | |
Net Asset Value, End of Period | | $ | 12.32 | | | $ | 14.73 | | | $ | 12.04 | | | $ | 12.41 | | | $ | 12.74 | | |
Total Return(4) | | | (15.87 | )% | | | 23.80 | % | | | (1.68 | )% | | | (2.44 | )% | | | (7.17 | )% | |
Ratios and Supplemental Data: | |
Net Assets, End of Period (Thousands) | | $ | 4,375 | | | $ | 6,463 | | | $ | 6,053 | | | $ | 7,495 | | | $ | 8,606 | | |
Ratio of Expenses to Average Net Assets(6) | | | 1.69 | %(5) | | | 1.73 | %(5) | | | 1.74 | %(5) | | | 1.74 | %(5) | | | 1.73 | %(5) | |
Ratio of Net Investment Income to Average Net Assets(6) | | | 0.92 | %(5) | | | 0.54 | %(5) | | | 1.20 | %(5) | | | 0.82 | %(5) | | | 1.68 | %(5) | |
Ratio of Rebate from Morgan Stanley Affiliates to Average Net Assets | | | 0.02 | % | | | 0.02 | % | | | 0.01 | % | | | 0.01 | % | | | 0.02 | % | |
Portfolio Turnover Rate | | | 43 | % | | | 22 | % | | | 40 | % | | | 30 | % | | | 32 | % | |
(6) Supplemental Information on the Ratios to Average Net Assets: | |
Ratios Before Expense Limitation: | |
Expenses to Average Net Assets | | | 1.76 | % | | | 2.07 | % | | | 1.93 | % | | | 1.87 | % | | | 1.87 | % | |
Net Investment Income to Average Net Assets | | | 0.85 | % | | | 0.20 | % | | | 1.01 | % | | | 0.69 | % | | | 1.54 | % | |
(1) Reflects prior period Custodian out-of-pocket expenses that were reimbursed in September 2016. The amount of the reimbursement was immaterial on a per share basis and did not impact the total return of Class L shares. The Ratio of Expenses to Average Net Assets and the Ratio of Net Investment Income to Average Net Assets would be unchanged as the reimbursement of Custodian fees was offset against expense waivers/reimbursements with no impact to net expenses or net investment income.
(2) Per share amount is based on average shares outstanding.
(3) Amount is less than $0.005 per share.
(4) Calculated based on the net asset value as of the last business day of the period.
(5) The Ratios of Expenses and Net Investment Income reflect the rebate of certain Fund expenses in connection with the investments in Morgan Stanley affiliates during the period. The effect of the rebate on the ratios is disclosed in the above table as "Ratio of Rebate from Morgan Stanley Affiliates to Average Net Assets."
The accompanying notes are an integral part of the financial statements.
19
Morgan Stanley Institutional Fund, Inc.
Annual Report — December 31, 2018
Financial Highlights
Active International Allocation Portfolio
| | | Class C | |
| | | Year Ended December 31, | | Period from
April 30, 2015(2) to | |
Selected Per Share Data and Ratios | | 2018 | | 2017 | | 2016(1) | | December 31, 2015 | |
Net Asset Value, Beginning of Period | | $ | 14.77 | | | $ | 12.15 | | | $ | 12.38 | | | $ | 13.94 | | |
Income (Loss) from Investment Operations: | |
Net Investment Income (Loss)(3) | | | 0.09 | | | | (0.00 | )(4) | | | 0.14 | | | | (0.00 | )(4) | |
Net Realized and Unrealized Gain (Loss) | | | (2.45 | ) | | | 2.83 | | | | (0.37 | ) | | | (1.53 | ) | |
Total from Investment Operations | | | (2.36 | ) | | | 2.83 | | | | (0.23 | ) | | | (1.53 | ) | |
Distributions from and/or in Excess of: | |
Net Investment Income | | | (0.07 | ) | | | (0.21 | ) | | | — | | | | (0.03 | ) | |
Redemption Fees | | | 0.00 | (4) | | | 0.00 | (4) | | | 0.00 | (4) | | | 0.00 | (4) | |
Net Asset Value, End of Period | | $ | 12.34 | | | $ | 14.77 | | | $ | 12.15 | | | $ | 12.38 | | |
Total Return(5) | | | (16.04 | )% | | | 23.42 | % | | | (1.94 | )% | | | (10.96 | )%(7) | |
Ratios and Supplemental Data: | |
Net Assets, End of Period (Thousands) | | $ | 42 | | | $ | 23 | | | $ | 9 | | | $ | 32 | | |
Ratio of Expenses to Average Net Assets(9) | | | 1.98 | %(6) | | | 1.97 | %(6) | | | 1.99 | %(6) | | | 1.99 | %(6)(8) | |
Ratio of Net Investment Income (Loss) to Average Net Assets(9) | | | 0.67 | %(6) | | | (0.03 | )%(6) | | | 1.19 | %(6) | | | (0.04 | )%(6)(8) | |
Ratio of Rebate from Morgan Stanley Affiliates to Average Net Assets | | | 0.02 | % | | | 0.03 | % | | | 0.01 | % | | | 0.01 | %(8) | |
Portfolio Turnover Rate | | | 43 | % | | | 22 | % | | | 40 | % | | | 30 | % | |
(9) Supplemental Information on the Ratios to Average Net Assets: | |
Ratios Before Expense Limitation: | |
Expenses to Average Net Assets | | | 7.18 | % | | | 20.06 | % | | | 8.58 | % | | | 4.26 | %(8) | |
Net Investment Loss to Average Net Assets | | | (4.53 | )% | | | (18.12 | )% | | | (5.40 | )% | | | (2.31 | )%(8) | |
(1) Reflects prior period Custodian out-of-pocket expenses that were reimbursed in September 2016. The amount of the reimbursement was immaterial on a per share basis and did not impact the total return of Class C shares. The Ratio of Expenses to Average Net Assets and the Ratio of Net Investment Income to Average Net Assets would be unchanged as the reimbursement of Custodian fees was offset against expense waivers/reimbursements with no impact to net expenses or net investment income.
(2) Commencement of Offering.
(3) Per share amount is based on average shares outstanding.
(4) Amount is less than $0.005 per share.
(5) Calculated based on the net asset value which does not reflect sales charges, if applicable, as of the last business day of the period.
(6) The Ratios of Expenses and Net Investment Income (Loss) reflect the rebate of certain Fund expenses in connection with the investments in Morgan Stanley affiliates during the period. The effect of the rebate on the ratios is disclosed in the above table as "Ratio of Rebate from Morgan Stanley Affiliates to Average Net Assets."
(7) Not annualized.
(8) Annualized.
The accompanying notes are an integral part of the financial statements.
20
Morgan Stanley Institutional Fund, Inc.
Annual Report — December 31, 2018
Notes to Financial Statements
Morgan Stanley Institutional Fund, Inc. (the "Company") is registered under the Investment Company Act of 1940, as amended (the "Act"), as an open-end management investment company. The Company is comprised of thirty separate, active, diversified and non-diversified funds (individually referred to as a "Fund", collectively as the "Funds"). The Company applies investment company accounting and reporting guidance.
The accompanying financial statements relate to the Active International Allocation Portfolio. The Fund seeks long-term capital appreciation by investing primarily, in accordance with country and sector weightings determined by Morgan Stanley Investment Management Inc. (the "Adviser") and/or Morgan Stanley Investment Management Company ("MSIM Company") (the "Sub-Adviser"), each a wholly-owned subsidiary of Morgan Stanley, in equity securities of non-U.S. issuers which, in the aggregate, replicate broad market indices. Effective June 30, 2018, MSIM Company is no longer a Sub-Adviser to the Fund.
The Fund offers four classes of shares — Class I, Class A, Class L and Class C. On April 30, 2015, the Fund suspended offering of Class L shares. Existing Class L shareholders may invest through reinvestment of dividends and distributions.
A. Significant Accounting Policies: The following significant accounting policies are in conformity with U.S. generally accepted accounting principles ("GAAP"). Such policies are consistently followed by the Company in the preparation of its financial statements. GAAP may require management to make estimates and assumptions that affect the reported amounts and disclosures in the financial statements. Actual results may differ from those estimates.
In August 2018, the Financial Accounting Standards Board ("FASB") issued Accounting Standards Update ("ASU") 2018-13, Fair Value Measurement (Topic 820) — Disclosures Framework — Changes to Disclosure Requirements of Fair Value Measurement ("ASU 2018-13") which introduces new fair value disclosure requirements as well as eliminates and modifies certain existing fair value disclosure requirements. ASU 2018-13 would be effective for fiscal years beginning after December 15, 2019 and for interim periods within those fiscal years; however, management has elected to early adopt ASU 2018-13 effective with the current reporting period as permitted by the standard. The impact of the Fund's adoption was limited to changes in the Fund's financial statement disclosures regarding fair value, primarily those disclosures related to transfers between levels of the fair value
hierarchy and disclosure of the range and weighted average used to develop significant unobservable inputs for Level 3 fair value measurements, when applicable.
1. Security Valuation: (1) An equity portfolio security listed or traded on an exchange is valued at its latest reported sales price (or at the exchange official closing price if such exchange reports an official closing price), and if there were no sales on a given day and if there is no official exchange closing price for that day, the security is valued at the mean between the last reported bid and asked prices if such bid and asked prices are available on the relevant exchanges. Listed equity securities not traded on the valuation date with no reported bid and asked prices available on the exchange are valued at the mean between the current bid and asked prices obtained from one or more reputable brokers or dealers. In cases where a security is traded on more than one exchange, the security is valued on the exchange designated as the primary market; (2) all other equity portfolio securities for which over-the-counter ("OTC") market quotations are readily available are valued at the latest reported sales price (or at the market official closing price if such market reports an official closing price), and if there was no trading in the security on a given day and if there is no official closing price from relevant markets for that day, the security is valued at the mean between the last reported bid and asked prices if such bid and asked prices are available on the relevant markets. An unlisted equity security that does not trade on the valuation date and for which bid and asked prices from the relevant markets are unavailable is valued at the mean between the current bid and asked prices obtained from one or more reputable brokers or dealers; (3) certain portfolio securities may be valued by an outside pricing service/vendor approved by the Company's Board of Directors (the "Directors"). The pricing service/vendor may employ a pricing model that takes into account, among other things, bids, yield spreads and/or other market data and specific security characteristics. Alternatively, if a valuation is not available from an outside pricing service/vendor, and the security trades on an exchange, the security may be valued at its latest reported sale price (or at the exchange official closing price if such exchange reports an official closing price), prior to the time when assets are valued. If there are no sales on a given day and if there is no official exchange closing price for that day, the security is valued at the mean between the last reported bid and
21
Morgan Stanley Institutional Fund, Inc.
Annual Report — December 31, 2018
Notes to Financial Statements (cont'd)
asked prices if such bid and asked prices are available in the relevant exchanges; (4) futures are valued at the settlement price on the exchange on which they trade or, if a settlement price is unavailable, at the last sale price on the exchange; (5) when market quotations are not readily available, including circumstances under which the Adviser or Sub-Adviser determines that the closing price, last sale price or the mean between the last reported bid and asked prices are not reflective of a security's market value, portfolio securities are valued at their fair value as determined in good faith under procedures established by and under the general supervision of the Directors. Occasionally, developments affecting the closing prices of securities and other assets may occur between the times at which valuations of such securities are determined (that is, close of the foreign market on which the securities trade) and the close of business of the New York Stock Exchange ("NYSE"). If developments occur during such periods that are expected to materially affect the value of such securities, such valuations may be adjusted to reflect the estimated fair value of such securities as of the close of the NYSE, as determined in good faith by the Directors or by the Adviser using a pricing service and/or procedures approved by the Directors; (6) quotations of foreign portfolio securities, other assets and liabilities and forward contracts stated in foreign currency are translated into U.S. dollar equivalents at the prevailing market rates prior to the close of the NYSE; and (7) investments in mutual funds, including the Morgan Stanley Institutional Liquidity Funds, are valued at the net asset value ("NAV") as of the close of each business day.
The Directors have responsibility for determining in good faith the fair value of the investments, and the Directors may appoint others, such as the Company's Adviser or a valuation committee, to assist the Directors in determining fair value and to make the actual calculations pursuant to the fair valuation methodologies previously approved by the Directors. Under procedures approved by the Directors, the Company's Adviser has formed a Valuation Committee whose members are approved by the Directors. The Valuation Committee provides administration and oversight of the Company's valuation policies and procedures, which are reviewed at least annually by the Directors. These procedures allow the Company to utilize independent pricing services,
quotations from securities and financial instrument dealers and other market sources to determine fair value.
2. Fair Value Measurement: FASB Accounting Standards CodificationTM ("ASC") 820, "Fair Value Measurement" ("ASC 820"), defines fair value as the value that the Fund would receive to sell an investment or pay to transfer a liability in a timely transaction with an independent buyer in the principal market, or in the absence of a principal market, the most advantageous market for the investment or liability. ASC 820 establishes a three-tier hierarchy to distinguish between (1) inputs that reflect the assumptions market participants would use in valuing an asset or liability developed based on market data obtained from sources independent of the reporting entity (observable inputs) and (2) inputs that reflect the reporting entity's own assumptions about the assumptions market participants would use in valuing an asset or liability developed based on the best information available in the circumstances (unobservable inputs) and to establish classification of fair value measurements for disclosure purposes. Various inputs are used in determining the value of the Fund's investments. The inputs are summarized in the three broad levels listed below:
• Level 1 – unadjusted quoted prices in active markets for identical investments
• Level 2 – other significant observable inputs (including quoted prices for similar investments, interest rates, prepayment speeds, credit risk, etc.)
• Level 3 – significant unobservable inputs including the Fund's own assumptions in determining the fair value of investments. Factors considered in making this determination may include, but are not limited to, information obtained by contacting the issuer, analysts, or the appropriate stock exchange (for exchange-traded securities), analysis of the issuer's financial statements or other available documents and, if necessary, available information concerning other securities in similar circumstances
The inputs or methodology used for valuing securities are not necessarily an indication of the risk associated with investing in those securities and the determination of the significance of a particular input to the fair value
22
Morgan Stanley Institutional Fund, Inc.
Annual Report — December 31, 2018
Notes to Financial Statements (cont'd)
measurement in its entirety requires judgment and considers factors specific to each security.
The following is a summary of the inputs used to value the Fund's investments as of December 31, 2018:
Investment Type | | Level 1
Unadjusted
quoted
prices
(000) | | Level 2
Other
significant
observable
inputs
(000) | | Level 3
Significant
unobservable
inputs
(000) | | Total
(000) | |
Assets: | |
Common Stocks | |
Aerospace & Defense | | $ | 1 | | | $ | 1,794 | | | $ | — | | | $ | 1,795 | | |
Airlines | | | 676 | | | | — | | | | — | | | | 676 | | |
Auto Components | | | — | | | | 457 | | | | — | | | | 457 | | |
Automobiles | | | — | | | | 5,155 | | | | — | | | | 5,155 | | |
Banks | | | 3,203 | | | | 12,934 | | | | — | | | | 16,137 | | |
Beverages | | | 354 | | | | 4,820 | | | | — | | | | 5,174 | | |
Biotechnology | | | 1,015 | | | | 3,690 | | | | — | | | | 4,705 | | |
Building Products | | | — | | | | 1,404 | | | | — | | | | 1,404 | | |
Capital Markets | | | — | | | | 986 | | | | — | | | | 986 | | |
Chemicals | | | — | | | | 2,553 | | | | — | | | | 2,553 | | |
Commercial Services &
Supplies | | | — | | | | 747 | | | | — | | | | 747 | | |
Communications
Equipment | | | 546 | | | | 2,235 | | | | — | | | | 2,781 | | |
Construction Materials | | | — | | | | 975 | | | | — | | | | 975 | | |
Diversified
Telecommunication
Services | | | — | | | | 664 | | | | — | | | | 664 | | |
Electric Utilities | | | — | | | | 1,531 | | | | — | | | | 1,531 | | |
Electrical Equipment | | | — | | | | 1,093 | | | | — | | | | 1,093 | | |
Electronic Equipment,
Instruments &
Components | | | 306 | | | | 2,462 | | | | — | | | | 2,768 | | |
Energy Equipment &
Services | | | 2,276 | | | | 77 | | | | — | | | | 2,353 | | |
Equity Real Estate
Investment Trusts
(REITs) | | | 380 | | | | 57 | | | | — | | | | 437 | | |
Food & Staples Retailing | | | — | | | | 2,250 | | | | — | | | | 2,250 | | |
Food Products | | | — | | | | 7,400 | | | | — | | | | 7,400 | | |
Health Care Equipment &
Supplies | | | 960 | | | | 4,014 | | | | — | | | | 4,974 | | |
Health Care Providers &
Services | | | — | | | | 483 | | | | — | | | | 483 | | |
Hotels, Restaurants &
Leisure | | | — | | | | 768 | | | | — | | | | 768 | | |
Household Durables | | | — | | | | 792 | | | | — | | | | 792 | | |
Household Products | | | — | | | | 3,098 | | | | — | | | | 3,098 | | |
Independent Power &
Renewable Electricity
Producers | | | — | | | | 182 | | | | — | | | | 182 | | |
Information Technology
Services | | | 1,778 | | | | 2,116 | | | | — | | | | 3,894 | | |
Insurance | | | — | | | | 7,489 | | | | — | | | | 7,489 | | |
Interactive Media &
Services | | | 1,733 | | | | 4,247 | | | | — | | | | 5,980 | | |
Internet & Direct
Marketing Retail | | | 3,017 | | | | 238 | | | | — | | | | 3,255 | | |
Leisure Products | | | — | | | | 720 | | | | — | | | | 720 | | |
Life Sciences Tools &
Services | | | 1,236 | | | | 821 | | | | — | | | | 2,057 | | |
Machinery | | | — | | | | 3,449 | | | | — | | | | 3,449 | | |
Investment Type | | Level 1
Unadjusted
quoted
prices
(000) | | Level 2
Other
significant
observable
inputs
(000) | | Level 3
Significant
unobservable
inputs
(000) | | Total
(000) | |
Common Stocks (cont'd) | |
Media | | $ | — | | | $ | 1,119 | | | $ | — | | | $ | 1,119 | | |
Metals & Mining | | | 3,063 | | | | 349 | | | | — | | | | 3,412 | | |
Multi-Line Retail | | | — | | | | 700 | | | | — | | | | 700 | | |
Multi-Utilities | | | — | | | | 1,020 | | | | — | | | | 1,020 | | |
Oil, Gas & Consumable
Fuels | | | — | | | | 4,254 | | | | — | | | | 4,254 | | |
Personal Products | | | — | | | | 8,320 | | | | — | | | | 8,320 | | |
Pharmaceuticals | | | 1,393 | | | | 17,467 | | | | — | | | | 18,860 | | |
Professional Services | | | — | | | | 3,942 | | | | — | | | | 3,942 | | |
Real Estate Management &
Development | | | — | | | | 1,318 | | | | — | @ | | | 1,318 | | |
Road & Rail | | | — | | | | 1,062 | | | | — | | | | 1,062 | | |
Semiconductors &
Semiconductor
Equipment | | | — | | | | 3,251 | | | | — | | | | 3,251 | | |
Software | | | 843 | | | | 4,893 | | | | — | | | | 5,736 | | |
Specialty Retail | | | — | | | | 914 | | | | — | | | | 914 | | |
Tech Hardware, Storage &
Peripherals | | | — | | | | 378 | | | | — | | | | 378 | | |
Textiles, Apparel & Luxury
Goods | | | — | | | | 2,630 | | | | — | | | | 2,630 | | |
Thrifts & Mortgage Finance | | | — | | | | 1,128 | | | | — | | | | 1,128 | | |
Tobacco | | | — | | | | 1,764 | | | | — | | | | 1,764 | | |
Trading Companies &
Distributors | | | — | | | | 1,370 | | | | — | | | | 1,370 | | |
Transportation
Infrastructure | | | — | | | | 813 | | | | — | | | | 813 | | |
Wireless
Telecommunication
Services | | | — | | | | 691 | | | | — | | | | 691 | | |
Total Common Stocks | | | 22,780 | | | | 139,084 | | | | — | @ | | | 161,864 | | |
Short-Term Investments | |
Investment Company | | | 9,271 | | | | — | | | | — | | | | 9,271 | | |
Repurchase Agreements | | | — | | | | 4 | | | | — | | | | 4 | | |
Total Short-Term
Investments | | | 9,271 | | | | 4 | | | | — | | | | 9,275 | | |
Foreign Currency Forward
Exchange Contracts | | | — | | | | 163 | | | | — | | | | 163 | | |
Futures Contracts | | | 98 | | | | — | | | | — | | | | 98 | | |
Total Assets | | | 32,149 | | | | 139,251 | | | | — | @ | | | 171,400 | | |
Liabilities: | |
Foreign Currency Forward
Exchange Contract | | | — | | | | (12 | ) | | | — | | | | (12 | ) | |
Futures Contracts | | | (66 | ) | | | — | | | | — | | | | (66 | ) | |
Total Liabilities | | | (66 | ) | | | (12 | ) | | | — | | | | (78 | ) | |
Total | | $ | 32,083 | | | $ | 139,239 | | | $ | — | @ | | $ | 171,322 | | |
@ Value is less than $500.
Transfers between investment levels may occur as the markets fluctuate and/or the availability of data used in an investment's valuation changes.
23
Morgan Stanley Institutional Fund, Inc.
Annual Report — December 31, 2018
Notes to Financial Statements (cont'd)
Following is a reconciliation of investments in which significant unobservable inputs (Level 3) were used in determining fair value:
| | | Common
Stock
(000) | |
Beginning Balance | | $ | — | @ | |
Purchases | | | — | | |
Sales | | | — | | |
Amortization of discount | | | — | �� | |
Transfers in | | | — | | |
Transfers out | | | — | | |
Corporate actions | | | — | | |
Change in unrealized appreciation (depreciation) | | | (— | @) | |
Realized gains (losses) | | | — | | |
Ending Balance | | $ | — | @ | |
Net change in unrealized appreciation (depreciation) from
investments still held as of December 31, 2018 | | $ | (— | @) | |
@ Value is less than $500.
3. Repurchase Agreements: The Fund may enter into repurchase agreements under which the Fund lends cash and takes possession of securities with an agreement that the counterparty will repurchase such securities. In connection with transactions in repurchase agreements, a bank as custodian for the Fund takes possession of the underlying securities which are held as collateral, with a market value at least equal to the amount of the repurchase transaction, including principal and accrued interest. To the extent that any repurchase transaction exceeds one business day, the value of the collateral is marked-to-market on a daily basis to determine that the value of the collateral does not decrease below the repurchase price plus accrued interest as earned. If such a decrease occurs, additional collateral will be requested and, when received, will be added to the account to maintain full collateralization. In the event of default on the obligation to repurchase, the Fund has the right to liquidate the collateral and apply the proceeds in satisfaction of the obligation. In the event of default or bankruptcy by the counterparty to the agreement, realization of the collateral proceeds may be subject to cost and delays. The Fund, along with other affiliated investment companies, may utilize a joint trading account for the purpose of entering into repurchase agreements.
4. Foreign Currency Translation and Foreign Investments: The books and records of the Fund are maintained in U.S. dollars. Foreign currency amounts are translated into U.S. dollars as follows:
– investments, other assets and liabilities at the prevailing rate of exchange on the valuation date;
– investment transactions and investment income at the prevailing rates of exchange on the dates of such transactions.
Although the net assets of the Fund are presented at the foreign exchange rates and market values at the close of the period, the Fund does not isolate that portion of the results of operations arising as a result of changes in the foreign exchange rates from the fluctuations arising from changes in the market prices of securities held at period end. Similarly, the Fund does not isolate the effect of changes in foreign exchange rates from the fluctuations arising from changes in the market prices of securities sold during the period. Accordingly, realized and unrealized foreign currency gains (losses) on investments in securities are included in the reported net realized and unrealized gains (losses) on investment transactions and balances. However, pursuant to U.S. federal income tax regulations, gains and losses from certain foreign currency transactions and the foreign currency portion of gains and losses realized on sales and maturities of foreign denominated debt securities are treated as ordinary income for U.S. federal income tax purposes.
Net realized gains (losses) on foreign currency transactions represent net foreign exchange gains (losses) from foreign currency forward exchange contracts, disposition of foreign currencies, currency gains (losses) realized between the trade and settlement dates on securities transactions, and the difference between the amount of investment income and foreign withholding taxes recorded on the Fund's books and the U.S. dollar equivalent amounts actually received or paid. Net unrealized currency gains (losses) from valuing foreign currency denominated assets and liabilities at period end exchange rates are reflected as a component of unrealized appreciation (depreciation) in the Statement of Assets and Liabilities. The change in unrealized currency gains (losses) on foreign currency translations for the period is reflected in the Statement of Operations.
24
Morgan Stanley Institutional Fund, Inc.
Annual Report — December 31, 2018
Notes to Financial Statements (cont'd)
Foreign security and currency transactions may involve certain considerations and risks not typically associated with those of U.S. dollar denominated transactions as a result of, among other factors, fluctuations of exchange rates in relation to the U.S. dollar, the possibility of lower levels of governmental supervision and regulation of foreign securities markets and the possibility of political or economic instability.
Governmental approval for foreign investments may be required in advance of making an investment under certain circumstances in some countries, and the extent of foreign investments in domestic companies may be subject to limitation in other countries. Foreign ownership limitations also may be imposed by the charters of individual companies to prevent, among other concerns, violations of foreign investment limitations. As a result, an additional class of shares (identified as "Foreign" in the Portfolio of Investments) may be created and offered for investment. The "local" and "foreign shares" market values may differ. In the absence of trading of the foreign shares in such markets, the Fund values the foreign shares at the closing exchange price of the local shares.
5. Derivatives: The Fund may, but is not required to, use derivative instruments for a variety of purposes, including hedging, risk management, portfolio management or to earn income. Derivatives are financial instruments whose value is based, in part, on the value of an underlying asset, interest rate, index or financial instrument. Prevailing interest rates and volatility levels, among other things, also affect the value of derivative instruments. A derivative instrument often has risks similar to its underlying asset and may have additional risks, including imperfect correlation between the value of the derivative and the underlying asset, risks of default by the counterparty to certain transactions, magnification of losses incurred due to changes in the market value of the securities, instruments, indices or interest rates to which the derivative instrument relates, risks that the transactions may not be liquid and risks arising from margin requirements. The use of derivatives involves risks that are different from, and possibly greater than, the risks associated with other portfolio investments. Derivatives may involve the use of highly specialized instruments that require investment techniques and risk analyses different from those associated with other portfolio investments. All of the Fund's holdings, including derivative instruments, are marked-to-market each day with
the change in value reflected in unrealized appreciation (depreciation). Upon disposition, a realized gain or loss is recognized.
Certain derivative transactions may give rise to a form of leverage. Leverage magnifies the potential for gain and the risk of loss. Leverage associated with derivative transactions may cause the Fund to liquidate portfolio positions when it may not be advantageous to do so to satisfy its obligations or to meet earmarking or segregation requirements, pursuant to applicable Securities and Exchange Commission ("SEC") rules and regulations, or may cause the Fund to be more volatile than if the Fund had not been leveraged. Although the Adviser seeks to use derivatives to further the Fund's investment objectives, there is no assurance that the use of derivatives will achieve this result.
Following is a description of the derivative instruments and techniques that the Fund used during the period and their associated risks:
Futures: A futures contract is a standardized, exchange-traded agreement to buy or sell a specific quantity of an underlying asset, reference rate or index at a specific price at a specific future time. The value of a futures contract tends to increase and decrease in tandem with the value of the underlying instrument. Depending on the terms of the particular contract, futures contracts are settled through either physical delivery of the underlying instrument on the settlement date or by payment of a cash settlement amount on the settlement date. During the period the futures contract is open, payments are received from or made to the broker based upon changes in the value of the contract (the variation margin). A decision as to whether, when and how to use futures contracts involves the exercise of skill and judgment and even a well-conceived futures transaction may be unsuccessful because of market behavior or unexpected events. In addition to the derivatives risks discussed above, the prices of futures contracts can be highly volatile, using futures contracts can lower total return and the potential loss from futures contracts can exceed the Fund's initial investment in such contracts. No assurance can be given that a liquid market will exist for any particular futures contract at any particular time. There is also the risk of loss by the Fund of margin deposits in the event of bankruptcy of a broker with which the Fund has open positions in the futures contract.
25
Morgan Stanley Institutional Fund, Inc.
Annual Report — December 31, 2018
Notes to Financial Statements (cont'd)
Foreign Currency Forward Exchange Contracts: In connection with its investments in foreign securities, the Fund also entered into contracts with banks, brokers or dealers to purchase or sell securities or foreign currencies at a future date. A foreign currency forward exchange contract ("currency contract") is a negotiated agreement between the contracting parties to exchange a specified amount of currency at a specified future time at a specified rate. The rate can be higher or lower than the spot rate between the currencies that are the subject of the contract. Currency contracts may be used to protect against uncertainty in the level of future foreign currency exchange rates or to gain or modify exposure to a particular currency. To the extent hedged by the use of currency contracts, the precise matching of the currency contract amounts and the value of the securities involved will not generally be possible because the future value of such securities in foreign currencies will change as a consequence of market movements in the value of those securities between the date on which the contract is entered into and the date it matures. Furthermore, such transactions may reduce or preclude the opportunity for gain if the value of the currency should move in the direction opposite to the position taken. There is additional risk to the extent that currency contracts create exposure to currencies in which the Fund's securities are not denominated. Unanticipated changes in currency prices may result in poorer overall performance for the Fund than if it had not entered into such contracts. The use of currency contracts involves the risk of loss from the insolvency or bankruptcy of the counterparty to the contract or the failure of the counterparty to make payments or otherwise comply with the terms of the contract. A currency contract is marked-to-market daily and the change in market value is recorded by the Fund as unrealized gain or loss. The Fund records realized gains (losses) when the currency contract is closed equal to the difference between the value of the currency contract at the time it was opened and the value at the time it was closed.
FASB ASC 815, "Derivatives and Hedging" ("ASC 815"), is intended to improve financial reporting about derivative instruments by requiring enhanced disclosures to enable investors to better understand how and why the Fund uses derivative instruments, how these derivative instruments are accounted for and their effects on the Fund's financial position and results of operations.
The following tables set forth the fair value of the Fund's derivative contracts by primary risk exposure as of December 31, 2018:
| | | Asset Derivatives
Statement of Assets and
Liabilities Location | | Primary Risk
Exposure | | Value
(000) | |
Foreign Currency Forward
Exchange Contracts
| | Unrealized Appreciation on
Foreign Currency Forward
Exchange Contracts | |
Currency Risk | | $ | 163 | | |
Futures Contracts | | Variation Margin on
Futures Contracts | |
Equity Risk | | | 98 | (a) | |
Total | | | | | | $ | 261 | | |
| | | Liability Derivatives
Statement of Assets and
Liabilities Location | | Primary Risk
Exposure | | Value
(000) | |
Foreign Currency Forward
Exchange Contract
| | Unrealized Depreciation on
Foreign Currency Forward
Exchange Contract | |
Currency Risk | | $ | (12 | ) | |
Futures Contracts | | Variation Margin on
Futures Contracts | |
Equity Risk | | | (66 | )(a) | |
Total | | | | | | $ | (78 | ) | |
(a) This amount represents the cumulative appreciation (depreciation) as reported in the Portfolio of Investments. The Statement of Assets and Liabilities only reflects the current day's net variation margin.
The following tables set forth by primary risk exposure the Fund's realized gains (losses) and change in unrealized appreciation (depreciation) by type of derivative contract for the year ended December 31, 2018 in accordance with ASC 815:
Realized Gain (Loss) | |
Primary Risk Exposure | | Derivative Type | | Value
(000) | |
Currency Risk
| | Foreign Currency Forward
Exchange Contracts | | $ | (362 | ) | |
Equity Risk | | Futures Contracts | | | (1,927 | ) | |
| | | Total | | $ | (2,289 | ) | |
Change in Unrealized Appreciation (Depreciation) | |
Primary Risk Exposure | | Derivative Type | | Value
(000) | |
Currency Risk
| | Foreign Currency Forward
Exchange Contracts | | $ | (49 | ) | |
Equity Risk | | Futures Contracts | | | (622 | ) | |
| | | Total | | $ | (671 | ) | |
At December 31, 2018, the Fund's derivative assets and liabilities are as follows:
Gross Amounts of Assets and Liabilities
Presented in the Statement of Assets and Liabilities | |
Derivatives(b) | | Assets(c)
(000) | | Liabilities(c)
(000) | |
Foreign Currency Forward
Exchange Contracts | | $ | 163 | | | $ | (12 | ) | |
(b) Excludes exchange-traded derivatives.
(c) Absent an event of default or early termination, OTC derivative assets and liabilities are presented gross and not offset in the Statement of Assets and Liabilities.
26
Morgan Stanley Institutional Fund, Inc.
Annual Report — December 31, 2018
Notes to Financial Statements (cont'd)
The Fund typically enters into International Swaps and Derivatives Association, Inc. Master Agreements ("ISDA Master Agreements") or similar master agreements (collectively, "Master Agreements") with its contract counterparties for certain OTC derivatives in order to, among other things, reduce its credit risk to counterparties. ISDA Master Agreements include provisions for general obligations, representations, collateral and events of default or termination. Under an ISDA Master Agreement, the Fund typically may offset with the counterparty certain OTC derivative financial instruments' payables and/or receivables with collateral held and/or posted and create one single net payment (close-out netting) in the event of default, termination and/or potential deterioration in the credit quality of the counterparty. Various Master Agreements govern the terms of certain transactions with counterparties, including transactions such as swap, forward, repurchase and reverse repurchase agreements. These Master Agreements typically attempt to reduce the counterparty risk associated with such transactions by specifying credit protection mechanisms and providing standardization that improves legal certainty. Cross-termination provisions under Master Agreements typically provide that a default in connection with one transaction between the Fund and a counterparty gives the non-defaulting party the right to terminate any other transactions in place with the defaulting party to create one single net payment due to/due from the defaulting party and may be a feature in certain Master Agreements. In the event the Fund exercises its right to terminate a Master Agreement after a counterparty experiences a termination event as defined in the Master Agreement, the return of collateral with market value in excess of the Fund's net liability may be delayed or denied.
The following tables present derivative financial instruments that are subject to enforceable netting arrangements as of December 31, 2018:
Gross Amounts Not Offset in the Statement of Assets and Liabilities | |
Counterparty | | Gross Asset
Derivatives
Presented in
the Statement of
Assets and
Liabilities
(000) | | Financial
Instrument
(000) | | Collateral
Received
(000) | | Net Amount
(not less
than $0)
(000) | |
JPMorgan Chase
Bank NA | | $ | 64 | | | $ | — | | | $ | — | | | $ | 64 | | |
Goldman Sachs
International | | | 28 | | | | — | | | | — | | | | 28 | | |
State Street Bank and
Trust Co. | | | 71 | | | | — | | | | — | | | | 71 | | |
Total | | $ | 163 | | | $ | — | | | $ | — | | | $ | 163 | | |
Gross Amounts Not Offset in the Statement of Assets and Liabilities | |
Counterparty | | Gross Liability
Derivatives
Presented in
the Statement of
Assets and
Liabilities
(000) | | Financial
Instrument
(000) | | Collateral
Pledged
(000) | | Net Amount
(not less
than $0)
(000) | |
Citibank NA | | $ | 12 | | | $ | — | | | $ | — | | | $ | 12 | | |
For the year ended December 31, 2018, the approximate average monthly amount outstanding for each derivative type is as follows:
Foreign Currency Forward Exchange Contracts: | |
Average monthly principal amount | | $ | 25,499,000 | | |
Futures Contracts: | |
Average monthly notional value | | $ | 24,053,000 | | |
6. Securities Lending: The Fund lends securities to qualified financial institutions, such as broker-dealers, to earn additional income. Any increase or decrease in the fair value of the securities loaned that might occur and any interest earned or dividends declared on those securities during the term of the loan would remain in the Fund. The Fund would receive cash or securities as collateral in an amount equal to or exceeding 100% of the current fair value of the loaned securities. The collateral is marked-to-market daily by State Street Bank and Trust Company ("State Street"), the securities lending agent, to ensure that a minimum of 100% collateral coverage is maintained.
27
Morgan Stanley Institutional Fund, Inc.
Annual Report — December 31, 2018
Notes to Financial Statements (cont'd)
Based on pre-established guidelines, the securities lending agent invests any cash collateral that is received in an affiliated money market portfolio and repurchase agreements. Securities lending income is generated from the earnings on the invested collateral and borrowing fees, less any rebates owed to the borrowers and compensation to the lending agent, and is recorded as "Income from Securities Loaned — Net" in the Fund's Statement of Operations. Risks in securities lending transactions are that a borrower may not provide additional collateral when required or return the securities when due, and that the value of the short-term investments will be less than the amount of cash collateral plus any rebate that is required to be returned to the borrower.
The Fund has the right under the securities lending agreement to recover the securities from the borrower on demand.
The following table presents financial instruments that are subject to enforceable netting arrangements as of December 31, 2018:
Gross Amounts Not Offset in the Statement of Assets and Liabilities | |
Gross Asset
Amounts
Presented in
the Statement of
Assets and
Liabilities
(000) | | Financial
Instrument
(000) | | Collateral
Received
(000) | | Net Amount
(not less
than $0)
(000) | |
| $ | 44 | (d) | | $ | — | | | $ | (44 | )(e)(f) | | $ | 0 | | |
(d) Represents market value of loaned securities at year end.
(e) The Fund received cash collateral of approximately $23,000, of which approximately $23,000 was subsequently invested in Repurchase Agreements and Morgan Stanley Institutional Liquidity Funds as reported in the Portfolio of Investments. As of December 31, 2018, there was uninvested cash of less than $500, which is not reflected in the Portfolio of Investments. In addition, the Fund received non-cash collateral of approximately $23,000 in the form of U.S. Government obligations, which the Fund cannot sell or repledge, and accordingly are not reflected in the Portfolio of Investments.
(f) The actual collateral received is greater than the amount shown here due to overcollateralization.
FASB ASC 860, "Transfers & Servicing: Repurchase-to-Maturity Transactions, Repurchase Financings, and Disclosures", is intended to provide increased transparency about the types of collateral pledged in securities lending transactions and other similar transactions that are accounted for as secured borrowing.
The following table displays a breakdown of transactions accounted for as secured borrowings, the gross obligations by class of collateral pledged and the remaining
contractual maturity of those transactions as of December 31, 2018:
Remaining Contractual Maturity of the Agreements | |
| | | Overnight and
Continuous
(000) | | <30 days
(000) | | Between
30 &
90 days
(000) | | >90 days
(000) | | Total
(000) | |
Securities Lending
Transactions | |
Common Stocks | | $ | 23 | | | $ | — | | | $ | — | | | $ | — | | | $ | 23 | | |
Total Borrowings | | $ | 23 | | | $ | — | | | $ | — | | | $ | — | | | $ | 23 | | |
Gross amount of
recognized liabilities
for securities lending
transactions | | | | | | | | | | $ | 23 | | |
7. Redemption Fees: The Fund will assess a 2% redemption fee on Class I shares, Class A shares, Class L shares and Class C shares, which is paid directly to the Fund, for shares redeemed or exchanged within thirty days of purchase, subject to certain exceptions. The redemption fee is designed to protect the Fund and its remaining shareholders from the effects of short-term trading. These fees, if any, are included in the Statements of Changes in Net Assets.
8. Indemnifications: The Company enters into contracts that contain a variety of indemnifications. The Company's maximum exposure under these arrangements is unknown. However, the Company has not had prior claims or losses pursuant to these contracts and expects the risk of loss to be remote.
9. Dividends and Distributions to Shareholders: Dividends and distributions to shareholders are recorded on the ex-dividend date. Dividends from net investment income, if any, are declared and paid annually. Net realized capital gains, if any, are distributed at least annually.
10. Security Transactions, Income and Expenses: Security transactions are accounted for on the trade date (date the order to buy or sell is executed). Realized gains and losses on the sale of investment securities are determined on the specific identified cost method. Dividend income and other distributions are recorded on the ex-dividend date (except for certain foreign dividends which may be recorded as soon as the Fund is informed of such dividends) net of applicable withholding taxes. Interest income is recognized on the accrual basis except where collection is in doubt. Discounts are accreted and premiums are amortized over the life of the respective securities. Most expenses of the Company can be directly attributed to a particular Fund. Expenses which cannot be directly
28
Morgan Stanley Institutional Fund, Inc.
Annual Report — December 31, 2018
Notes to Financial Statements (cont'd)
attributed are apportioned among the Funds based upon relative net assets or other appropriate methods. Income, expenses (other than class specific expenses — distribution and shareholder services, transfer agency and sub transfer agency fees) and realized and unrealized gains or losses are allocated to each class of shares based upon their relative net assets.
The Fund owns shares of real estate investment trusts ("REITs") which report information on the source of their distributions annually in the following calendar year. A portion of distributions received from REITs during the year is estimated to be a return of capital and is recorded as a reduction of their cost.
B. Advisory/Sub-Advisory Fees: The Adviser, a wholly-owned subsidiary of Morgan Stanley, provides the Fund with advisory services under the terms of an Investment Advisory Agreement, paid quarterly, at the annual rate based on the daily net assets as follows:
First $1
billion | | Over $1
billion | |
| | 0.65 | % | | | 0.60 | % | |
For the year ended December 31, 2018, the advisory fee rate (net of waiver/rebate) was equivalent to an annual effective rate of 0.58% of the Fund's average daily net assets.
The Adviser has agreed to reduce its advisory fee and/or reimburse the Fund so that total annual portfolio operating expenses, excluding certain investment related expenses, taxes, interest and other extraordinary expenses (including litigation), will not exceed 0.90% for Class I shares, 1.25% for Class A shares, 1.75% for Class L shares and 2.00% for Class C shares. The fee waivers and/or expense reimbursements will continue for at least one year from the date of the Fund's prospectus or until such time as the Directors act to discontinue all or a portion of such waivers and/or reimbursements when they deem such action is appropriate. For the year ended December 31, 2018, approximately $108,000 of advisory fees were waived and approximately $34,000 of other expenses were reimbursed by the Adviser pursuant to this arrangement.
The Adviser has entered into a Sub-Advisory Agreement with the Sub-Adviser, a wholly-owned subsidiary of Morgan Stanley. The Sub-Adviser provides the Fund with advisory services subject to the overall supervision of the Adviser and the Fund's Officers and Directors. The Adviser pays the Sub-Adviser on a monthly basis a portion of the net advisory fees the Adviser receives from the Fund.
Effective June 30, 2018, MSIM Company is no longer a Sub-Adviser to the Fund.
C. Administration Fees: The Adviser also serves as Administrator to the Company and provides administrative services pursuant to an Administration Agreement for an annual fee, accrued daily and paid monthly, of 0.08% of the Fund's average daily net assets.
Under a Sub-Administration Agreement between the Administrator and State Street, State Street provides certain administrative services to the Company. For such services, the Administrator pays State Street a portion of the fee the Administrator receives from the Fund.
D. Distribution and Shareholder Services Fees: Morgan Stanley Distribution, Inc. ("MSDI" or the "Distributor"), a wholly-owned subsidiary of the Adviser and an indirect subsidiary of Morgan Stanley, serves as the Company's Distributor of Fund shares pursuant to a Distribution Agreement. The Company has adopted a Shareholder Services Plan with respect to Class A shares pursuant to Rule 12b-1 under the Act. Under the Shareholder Services Plan, the Fund pays the Distributor a shareholder services fee, accrued daily and paid monthly, at an annual rate of 0.25% of the Fund's average daily net assets attributable to Class A shares.
The Company has adopted a Distribution and Shareholder Services Plan with respect to Class L shares pursuant to Rule 12b-1 under the Act. Under the Distribution and Shareholder Services Plan, the Fund pays the Distributor a distribution fee, accrued daily and paid monthly, at an annual rate of 0.50% and a shareholder services fee, accrued daily and paid monthly, at an annual rate of 0.25% of the Fund's average daily net assets attributable to Class L shares.
The Company has adopted a Distribution and Shareholder Services Plan with respect to Class C shares pursuant to Rule 12b-1 under the Act. Under the Distribution and Shareholder Services Plan, the Fund pays the Distributor a distribution fee, accrued daily and paid monthly, at an annual rate of 0.75% and a shareholder services fee, accrued daily and paid monthly, at an annual rate of 0.25% of the Fund's average daily net assets attributable to Class C shares.
The distribution and shareholder services fees are used to support the expenses associated with servicing and maintaining accounts. The Distributor may compensate other parties for providing shareholder support services to investors who purchase Class A, Class L and Class C shares.
E. Dividend Disbursing and Transfer Agent: The Company's dividend disbursing and transfer agent is DST Asset
29
Morgan Stanley Institutional Fund, Inc.
Annual Report — December 31, 2018
Notes to Financial Statements (cont'd)
Manager Solutions, Inc. ("DST"). Pursuant to a Transfer Agency Agreement, the Company pays DST a fee based on the number of classes, accounts and transactions relating to the Funds of the Company.
F. Custodian Fees: State Street (the "Custodian") also serves as Custodian for the Company in accordance with a Custodian Agreement. The Custodian holds cash, securities and other assets of the Company as required by the Act. Custody fees are payable monthly based on assets held in custody, investment purchases and sales activity and account maintenance fees, plus reimbursement for certain out-of-pocket expenses.
G. Security Transactions and Transactions with Affiliates: For the year ended December 31, 2018, purchases and sales of investment securities for the Fund, other than long-term U.S. Government securities and short-term investments were approximately $81,224,000 and $84,052,000, respectively. There were no purchases and sales of long-term U.S. Government securities for the year ended December 31, 2018.
The Fund invests in the Institutional Class of the Morgan Stanley Institutional Liquidity Funds — Treasury Securities Portfolio (the "Liquidity Funds"), an open-end management investment company managed by the Adviser, both directly and as a portion of the securities held as collateral on loaned securities. Advisory fees paid by the Fund are reduced by an amount equal to its pro-rata share of the advisory and administration fees paid by the Fund due to its investment in the Liquidity Funds. For the year ended December 31, 2018, advisory fees paid were reduced by approximately $33,000 relating to the Fund's investment in the Liquidity Funds.
The Fund had transactions with Mitsubishi UFJ Financial Group, Inc. and its affiliated broker-dealers, which may be deemed affiliates of the Adviser/Administrator and Distributor under Section 17 the Act.
A summary of the Fund's transactions in shares of affiliated investments during the year ended December 31, 2018 is as follows:
Affiliated
Investment
Company | | Value
December 31,
2017
(000) | | Purchases
at Cost
(000) | | Proceeds
from Sales
(000) | | Dividend
Income
(000) | |
Liquidity Funds | | $ | 27,978 | | | $ | 56,979 | | | $ | 75,687 | | | $ | 252 | | |
Mitsubishi UFJ
Financial
Group, Inc. | | | 679 | | | | — | | | | 278 | | | | 13 | | |
| Total | | $ | 28,657 | | | $ | 56,979 | | | $ | 75,965 | | | $ | 265 | | |
Affiliated
Investment
Company (cont'd) | | Realized
Gain (Loss)
(000) | | Change in
Unrealized
Appreciation
(Depreciation)
(000) | | Value
December 31,
2018
(000) | |
Liquidity Funds | | $ | — | | | $ | — | | | $ | 9,271 | | |
Mitsubishi UFJ
Financial
Group, Inc. | | | (233 | ) | | | 61 | | | | 228 | | |
| Total | | $ | (233 | ) | | $ | 61 | | | $ | 9,499 | | |
The Fund is permitted to purchase and sell securities ("cross-trade") from and to other Morgan Stanley funds as well as other funds and client accounts for which the Adviser or an affiliate of the Adviser serves as investment adviser, pursuant to procedures approved by the Directors in compliance with Rule 17a-7 under the Act (the "Rule"). Each cross-trade is executed at the current market price in compliance with provisions of the Rule. For the year ended December 31, 2018, the Fund did not engage in any cross-trade transactions.
The Fund has an unfunded Deferred Compensation Plan (the "Compensation Plan"), which allows each independent Director to defer payment of all, or a portion, of the fees he or she receives for serving on the Board of Directors. Each eligible Director generally may elect to have the deferred amounts credited with a return equal to the total return on one or more of the Morgan Stanley funds that are offered as investment options under the Compensation Plan. Appreciation/depreciation and distributions received from these investments are recorded with an offsetting increase/decrease in the deferred compensation obligation and do not affect the NAV of the Fund.
H. Federal Income Taxes: It is the Fund's intention to continue to qualify as a regulated investment company and distribute all of its taxable and tax-exempt income. Accordingly, no provision for Federal income taxes is required in the financial statements.
The Fund may be subject to taxes imposed by countries in which it invests. Such taxes are generally based on income and/or capital gains earned or repatriated. Taxes are accrued based on net investment income, net realized gains and net unrealized appreciation as such income and/or gains are earned. Taxes may also be based on transactions in foreign currency and are accrued based on the value of investments denominated in such currency.
FASB ASC 740-10, "Income Taxes — Overall", sets forth a minimum threshold for financial statement recognition of the benefit of a tax position taken or expected to be taken in a tax return. Management has concluded there are no significant
30
Morgan Stanley Institutional Fund, Inc.
Annual Report — December 31, 2018
Notes to Financial Statements (cont'd)
uncertain tax positions that would require recognition in the financial statements. If applicable, the Fund recognizes interest accrued related to unrecognized tax benefits in "Interest Expense" and penalties in "Other Expenses" in the Statement of Operations. The Fund files tax returns with the U.S. Internal Revenue Service, New York and various states. Generally, each of the tax years in the four-year period ended December 31, 2018 remains subject to examination by taxing authorities.
The tax character of distributions paid may differ from the character of distributions for GAAP purposes due to short-term capital gains being treated as ordinary income for tax purposes. The tax character of distributions paid during fiscal years 2018 and 2017 was as follows:
2018
Distributions
Paid From: | | 2017
Distributions
Paid From: | |
Ordinary
Income
(000) | | Long-Term
Capital Gain
(000) | | Ordinary
Income
(000) | | Long-Term
Capital Gain
(000) | |
| $ | 2,725 | | | $ | — | | | $ | 4,318 | | | $ | — | | |
The amount and character of income and gains to be distributed are determined in accordance with income tax regulations which may differ from GAAP. These book/tax differences are either considered temporary or permanent in nature.
Temporary differences are primarily due to differing book and tax treatments in the timing of the recognition of gains (losses) on certain investment transactions and the timing of the deductibility of certain expenses.
The Fund had no permanent differences causing reclassifications among the components of net assets for the year ended December 31, 2018.
At December 31, 2018, the components of distributable earnings for the Fund on a tax basis were as follows:
Undistributed
Ordinary
Income
(000) | | Undistributed
Long-Term
Capital Gain
(000) | |
| $ | 19 | | | $ | — | | |
At December 31, 2018, the Fund had available for federal income tax purposes unused short-term and long-term capital losses of approximately $3,828,000 and $7,712,000, respectively that do not have an expiration date.
To the extent that capital loss carryforwards are used to offset any future capital gains realized, no capital gains tax liability will be incurred by the Fund for gains realized and not distributed. To the extent that capital gains are offset, such gains will not be distributed to the shareholders.
During the year ended December 31, 2018, the Fund utilized capital loss carryforwards for U. S. federal income tax purposes of approximately $2,197,000.
I. Credit Facility: The Company and other Morgan Stanley funds participated in a $150,000,000 committed, unsecured revolving line of credit facility (the "Facility") with State Street. This Facility is to be used for temporary emergency purposes or funding of shareholder redemption requests. The interest rate on borrowings is based on the federal funds rate or 1 month LIBOR rate plus a spread. The Facility also has a commitment fee of 0.25% per annum based on the unused portion of the Facility. During the year ended December 31, 2018, the Fund did not have any borrowings under the Facility.
J. Other: At December 31, 2018, the Fund had record owners of 10% or greater. Investment activities of these shareholders could have a material impact on the Fund. The aggregate percentage of such owners was 83.1%.
31
Morgan Stanley Institutional Fund, Inc.
Annual Report — December 31, 2018
Report of Independent Registered Public Accounting Firm
To the Shareholders and Board of Directors of
Morgan Stanley Institutional Fund, Inc. —
Active International Allocation Portfolio
Opinion on the Financial Statements
We have audited the accompanying statement of assets and liabilities of Active International Allocation Portfolio (the "Fund") (one of the funds constituting the Morgan Stanley Institutional Fund, Inc. (the "Company")), including the portfolio of investments, as of December 31, 2018, and the related statement of operations for the year then ended, the statements of changes in net assets for each of the two years in the period then ended, the financial highlights for each of the five years in the period then ended and the related notes (collectively referred to as the "financial statements"). In our opinion, the financial statements present fairly, in all material respects, the financial position of Active International Allocation Portfolio (one of the funds constituting Morgan Stanley Institutional Fund, Inc.) at December 31, 2018, the results of its operations for the year then ended, the changes in its net assets for each of the two years in the period then ended and its financial highlights for each of the five years in the period then ended, in conformity with U.S. generally accepted accounting principles.
Basis for Opinion
These financial statements are the responsibility of the Company's management. Our responsibility is to express an opinion on the Fund's financial statements based on our audits. We are a public accounting firm registered with the Public Company Accounting Oversight Board (United States) ("PCAOB") and are required to be independent with respect to the Company in accordance with the U.S. federal securities law and the applicable rules and regulations of the Securities and Exchange Commission and the PCAOB.
We conducted our audits in accordance with the standards of the PCAOB. Those standards require that we plan and perform the audit to obtain reasonable assurance about whether the financial statements are free of material misstatement, whether due to error or fraud. The Company is not required to have, nor were we engaged to perform, an audit of the Company's internal control over financial reporting. As part of our audits, we are required to obtain an understanding of internal control over financial reporting, but not for the purpose of expressing an opinion on the effectiveness of the Company's internal control over financial reporting. Accordingly, we express no such opinion.
Our audits included performing procedures to assess the risks of material misstatement of the financial statements, whether due to error or fraud, and performing procedures that respond to those risks. Such procedures included examining, on a test basis, evidence regarding the amounts and disclosures in the financial statements. Our procedures included confirmation of securities owned as of December 31, 2018 by correspondence with the custodian and others or by other appropriate auditing procedures where replies from others were not received. Our audits also included evaluating the accounting principles used and significant estimates made by management, as well as evaluating the overall presentation of the financial statements. We believe that our audits provide a reasonable basis for our opinion.

We have served as the auditor of one or more Morgan Stanley investment companies since 2000.
Boston, Massachusetts
February 26, 2019
32
Morgan Stanley Institutional Fund, Inc.
Annual Report — December 31, 2018
Federal Tax Notice (unaudited)
For federal income tax purposes, the following information is furnished with respect to the distributions paid by the Fund during its taxable year ended December 31, 2018. For corporate shareholders, 0.9% of the dividends qualified for the dividends received deduction.
For federal income tax purposes, the following information is furnished with respect to the Fund's earnings for its taxable year ended December 31, 2018. When distributed, certain earnings may be subject to a maximum tax rate of 15% as provided for the Jobs and Growth Tax Relief Reconciliation Act of 2003. The Fund designated up to a maximum of approximately $2,859,000 as taxable at this lower rate.
The Fund intends to pass through foreign tax credits of approximately $134,000 and has derived net income from sources within foreign countries amounting to approximately $5,275,000.
In January, the Fund provides tax information to shareholders for the preceding calendar year.
33
Morgan Stanley Institutional Fund, Inc.
Annual Report — December 31, 2018
Privacy Notice (unaudited)
MORGAN STANLEY INVESTMENT MANAGEMENT INC.
AN IMPORTANT NOTICE CONCERNING OUR U.S. PRIVACY POLICY
We are required by federal law to provide you with a copy of our privacy policy annually. This policy applies to current and former individual investors in funds managed or sponsored by Morgan Stanley Investment Management Inc. ("MSIM") as well as current and former individual clients of MSIM. This policy is not applicable to partnerships, corporations, trusts or other non-individual clients or investors. Please note that we may amend this policy at any time, and will inform you of any changes as required by law.
WE RESPECT YOUR PRIVACY
We appreciate that you have provided us with your personal financial information. We strive to maintain the privacy of such information while we help you achieve your financial objectives. This Notice describes what non-public personal information we collect about you, why we collect it, when we may share it with others and how certain others may use it. It discusses the steps you may take to limit our sharing of certain information about you to affiliated companies in the Morgan Stanley family of companies ("other Morgan Stanley companies"). It also discloses how you may limit use of certain shared information for marketing purposes by other Morgan Stanley branded companies. Throughout this policy, we refer to the non-public information that personally identifies you or your accounts as "personal information.''
1. WHAT PERSONAL INFORMATION DO WE COLLECT ABOUT YOU?
We obtain personal information from applications and other forms you submit to us, from your dealings with us, from consumer reporting agencies, from our Web sites and from third parties and other sources.
For example:
• We may collect information such as your name, address, e-mail address, telephone/fax numbers, assets, income and investment objectives through subscription documents, applications and other forms you submit to us.
• We may obtain information about account balances, your use of account(s) and the types of products and services you prefer to receive from us through your dealings and transactions with us and other sources.
• We may obtain information about your creditworthiness and credit history from consumer reporting agencies.
• We may collect background information from and through third-party vendors to verify representations you have made and to comply with various regulatory requirements.
• If you interact with us through our public and private Web sites, we may collect information that you provide directly through online communications (such as an e-mail address). We may also collect information about your Internet service provider, your domain name, your computer's operating system and Web browser, your use of our Web sites and your product and service preferences, through the use of "cookies." Please consult the Terms of Use of these sites for more details.
2. WHEN DO WE DISCLOSE PERSONAL INFORMATION WE COLLECT ABOUT YOU?
We may disclose personal information we collect about you to other Morgan Stanley companies and to non-affiliated third parties.
a. Information We Disclose to Other Morgan Stanley Companies.
We may disclose personal information to other Morgan Stanley companies for a variety of reasons, including to manage your account(s) effectively, to service and process your transactions, to let you know about products and services offered by us and other Morgan Stanley companies, to manage our business, and as otherwise required or permitted by law. Offers for products and services from other Morgan Stanley companies are developed under conditions designed to safeguard your personal information.
34
Morgan Stanley Institutional Fund, Inc.
Annual Report — December 31, 2018
Privacy Notice (unaudited) (cont'd)
b. Information We Disclose to Non-affiliated Third Parties.
We do not disclose personal information that we collect about you to non-affiliated third parties except to those who provide marketing services on our behalf, to financial institutions with whom we have joint marketing agreements, and as otherwise required or permitted by law. For example, we may disclose personal information to non-affiliated third parties for servicing and processing transactions, to offer our own products and services, to protect against fraud, for institutional risk control, to respond to judicial process or to perform services on our behalf. When we share personal information with a non-affiliated third party, they are required to limit their use of personal information to the particular purpose for which it was shared and they are not allowed to share personal information with others except to fulfill that limited purpose or as may be permitted or required by law.
3. HOW DO WE PROTECT THE SECURITY AND CONFIDENTIALITY OF PERSONAL INFORMATION WE COLLECT ABOUT YOU?
We maintain physical, electronic and procedural security measures to help safeguard the personal information we collect about you. We have internal policies governing the proper handling of client information. Third parties that provide support or marketing services on our behalf may also receive personal information, and we require them to adhere to confidentiality standards with respect to such information.
4. HOW CAN YOU LIMIT THE SHARING OF CERTAIN TYPES OF PERSONAL INFORMATION WITH OTHER MORGAN STANLEY COMPANIES?
We offer you choices as to whether we share with other Morgan Stanley companies the personal information that was collected to determine your eligibility for products and services you request ("eligibility information"). Eligibility information does not include your identification information or personal information pertaining to our transactions or experiences with you. Please note that, even if you direct us not to share eligibility information with other Morgan Stanley companies ("opt-out"), we may still share personal information, including eligibility information, with those companies in circumstances excluded from the opt-out under applicable law, such as to process transactions or to service your account.
5. HOW CAN YOU LIMIT THE USE OF CERTAIN TYPES OF PERSONAL INFORMATION BY OTHER MORGAN STANLEY COMPANIES FOR MARKETING?
By following the opt-out instructions in Section 6 below, you may limit other Morgan Stanley branded companies from marketing their products or services to you based on personal information we disclose to them. This information may include, for example, your income and account history with us. Please note that, even if you choose to limit Other Morgan Stanley Companies from using personal information about you that we may share with them for marketing their products and services to you, Other Morgan Stanley Companies may use your personal information that they obtain from us to market to you in circumstances permitted by law, such as if the Other Morgan Stanley Company has its own relationship with you.
6. HOW CAN YOU SEND US AN OPT-OUT INSTRUCTION?
If you wish to limit our sharing of eligibility information about you with other Morgan Stanley companies or other Morgan Stanley companies' use of personal information for marketing purposes, as described in this notice, you may do so by:
• Calling us at (800) 548-7786
Monday–Friday between 8a.m. and 6p.m.(EST)
• Writing to us at the following address:
DST Asset Manager Solutions, Inc.
c/o Privacy Coordinator
P.O. Box 219804
Kansas City, Missouri 64121
35
Morgan Stanley Institutional Fund, Inc.
Annual Report — December 31, 2018
Privacy Notice (unaudited) (cont'd)
Your written request should include your name, address, telephone number and account number(s) to which the opt-out applies and whether you are opting out with respect to sharing of eligibility information (Section 4 above), or if information used for Marketing (Section 5 above) or both. Written opt-out requests should not be sent with any other correspondence. In order to process your request, we require that the request be provided by you directly and not through a third party.
Your opt-out preference will remain in effect with respect to this policy (as it may be amended) until you notify us otherwise. If you have a joint account, your direction for us not to share this information with other Morgan Stanley companies and for those other Morgan Stanley companies not to use your personal information for marketing will be applied to all account holders on that account. Please understand that if you limit our sharing or our affiliated companies' use of personal information, you and any joint account holder(s) may not receive information about Morgan Stanley products and services, including products or services that could help you manage your financial resources and achieve your investment objectives.
7. WHAT IF AN AFFILIATED COMPANY BECOMES A NON-AFFILIATED THIRD PARTY?
If, at any time in the future, an affiliated company becomes a non-affiliated third party, further disclosures of personal information made to the former affiliated company will be limited to those described in Section 2(b) above relating to non-affiliated third parties. If you elected under Section 6 to limit disclosures we make to affiliated companies, or use of personal information by affiliated companies, your election will not apply to use by any former affiliated company of your personal information in their possession once it becomes a non-affiliated third party.
SPECIAL NOTICE TO RESIDENTS OF VERMONT
The following section supplements our policy with respect to our individual clients who have a Vermont address and supersedes anything to the contrary in the above policy with respect to those clients only.
The state of Vermont requires financial institutions to obtain your consent prior to sharing personal information that they collect about you with affiliated companies and non-affiliated third parties other than in certain limited circumstances. Except as permitted by law, we will not share personal information we collect about you with non-affiliated third parties or other Morgan Stanley companies unless you provide us with your written consent to share such information ("opt-in").
If you wish to receive offers for investment products and services offered by or through other Morgan Stanley companies, please notify us in writing at the following address:
DST Asset Manager Solutions, Inc.
c/o Privacy Coordinator
P.O. Box 219804
Kansas City, Missouri 64121
Your authorization should include your name, address, telephone number and account number(s) to which the opt-in applies and should not be sent with any other correspondence. In order to process your authorization, we require that the authorization be provided by you directly and not through a third party.
SPECIAL NOTICE TO RESIDENTS OF CALIFORNIA
The following section supplements our policy with respect to our individual clients who have a California address and supersedes anything to the contrary in the above policy with respect to those clients only.
In response to a California law, if your account has a California home address, your personal information will not be disclosed to non-affiliated third parties except as permitted by applicable California law, and we will limit sharing such information with our affiliates to comply with California privacy laws that apply to us.
36
Morgan Stanley Institutional Fund, Inc.
Annual Report — December 31, 2018
Director and Officer Information (unaudited)
Independent Directors:
Name, Age and Address of
Independent Director | | Position(s)
Held with
Registrant | | Length of Time
Served* | | Principal Occupation(s) During Past 5 Years
and Other Relevant Professional Experience | | Number of
Portfolios in
Fund Complex
Overseen by
Independent
Director** | | Other Directorships
Held by Independent
Director*** | |
Frank L. Bowman (74)
c/o Perkins Coie LLP
Counsel to the Independent
Directors
30 Rockefeller Plaza
New York, NY 10112 | | Director | | Since
August
2006 | | President, Strategic Decisions, LLC (consulting) (since February 2009); Director or Trustee of various Morgan Stanley Funds (since August 2006); Chairperson of the Compliance and Insurance Committee (since October 2015); formerly, Chairperson of the Insurance Sub-Committee of the Compliance and Insurance Committee (2007-2015); served as President and Chief Executive Officer of the Nuclear Energy Institute (policy organization) (February 2005-November 2008); retired as Admiral, U.S. Navy after serving over 38 years on active duty including 8 years as Director of the Naval Nuclear Propulsion Program in the Department of the Navy and the U.S. Department of Energy (1996-2004); served as Chief of Naval Personnel (July 1994-September 1996) and on the Joint Staff as Director of Political Military Affairs (June 1992-July 1994); knighted as Honorary Knight Commander of the Most Excellent Order of the British Empire; awarded the Officier de l'Orde National du Mérite by the French Government; elected to the National Academy of Engineering (2009). | | | 82 | | | Director of BP p.l.c.; Director of Naval and Nuclear Technologies LLP; Director Emeritus of the Armed Services YMCA; Member of the National Security Advisory Council of the Center for U.S. Global Engagement and a member of the CNA Military Advisory Board; Trustee of Fairhaven United Methodist Church; Member of the Board of Advisors of the Dolphin Scholarship Foundation; and Director of other various non-profit organizations. | |
Kathleen A. Dennis (65)
c/o Perkins Coie LLP
Counsel to the Independent Directors
30 Rockefeller Plaza
New York, NY 10112 | | Director | | Since
August
2006 | | President, Cedarwood Associates (mutual fund and investment management consulting) (since July 2006); Chairperson of the Liquidity and Alternatives Sub-Committee of the Investment Committee (since October 2006) and Director or Trustee of various Morgan Stanley Funds (since August 2006); formerly, Senior Managing Director of Victory Capital Management (1993-2006). | | | 82 | | | Director of various non-profit organizations. | |
Nancy C. Everett (63)
c/o Perkins Coie LLP
Counsel to the Independent Directors
30 Rockefeller Plaza
New York, NY 10112 | | Director | | Since
January
2015 | | Chief Executive Officer, Virginia Commonwealth University Investment Company (since November 2015); Owner, OBIR, LLC (institutional investment management consulting) (since June 2014); formerly, Managing Director, BlackRock Inc. (February 2011-December 2013); and Chief Executive Officer, General Motors Asset Management (a/k/a Promark Global Advisors, Inc.) (June 2005-May 2010). | | | 83 | | | Formerly, Member of Virginia Commonwealth University School of Business Foundation (2005-2016); Member of Virginia Commonwealth University Board of Visitors (2013-2015); Member of Committee on Directors for Emerging Markets Growth Fund, Inc. (2007-2010); Chairperson of Performance Equity Management, LLC (2006-2010); and Chairperson, GMAM Absolute Return Strategies Fund, LLC (2006-2010). | |
37
Morgan Stanley Institutional Fund, Inc.
Annual Report — December 31, 2018
Director and Officer Information (unaudited) (cont'd)
Independent Directors: (cont'd)
Name, Age and Address of
Independent Director | | Position(s)
Held with
Registrant | | Length of Time
Served* | | Principal Occupation(s) During Past 5 Years
and Other Relevant Professional Experience | | Number of
Portfolios in
Fund Complex
Overseen by
Independent
Director** | | Other Directorships
Held by Independent
Director*** | |
Jakki L. Haussler (61)
c/o Perkins Coie LLP
Counsel to the Independent Directors
30 Rockefeller Plaza
New York, NY 10112 | | Director | | Since
January
2015 | | Chairman and Chief Executive Officer, Opus Capital Group (since January 1996); formerly, Director, Capvest Venture Fund, LP (May 2000-December 2011); Partner, Adena Ventures, LP (July 1999-December 2010); Director, The Victory Funds (February 2005-July 2008). | | | 83 | | | Director of Service Corporation International and Member, Audit Committee and Investment Committee; Director of Cincinnati Bell Inc. and Member, Audit Committee and Governance and Nominating Committee; Chairman of Northern Kentucky University Member Investment Committee; Member of Chase College of Law Transactional Law Practice Center Board of Advisors; Director of Best Transport; Director of Chase College of Law Board of Visitors; formerly, Member, University of Cincinnati Foundation Investment Committee; Member, Miami University Board of Visitors (2008-2011); Trustee of Victory Funds (2005-2008) and Chairman, Investment Committee (2007-2008) and Member, Service Provider Committee (2005-2008). | |
Dr. Manuel H. Johnson (69)
c/o Johnson Smick
International, Inc.
220 I Street, NE — Suite 200
Washington, D.C. 20002 | | Director | | Since
July
1991 | | Senior Partner, Johnson Smick International, Inc. (consulting firm); Chairperson of the Investment Committee (since October 2006) and Director or Trustee of various Morgan Stanley Funds (since July 1991); Co-Chairman and a founder of the Group of Seven Council (G7C) (international economic commission); formerly, Chairperson of the Audit Committee (July 1991-September 2006), Vice Chairman of the Board of Governors of the Federal Reserve System and Assistant Secretary of the U.S. Treasury. | | | 82 | | | Director of NVR, Inc. (home construction). | |
Joseph J. Kearns (76)
c/o Perkins Coie LLP
Counsel to the Independent Directors
30 Rockefeller Plaza
New York, NY 10112 | | Director | | Since
August
1994 | | Senior Adviser, Kearns & Associates LLC (investment consulting); Chairperson of the Audit Committee (since October 2006) and Director or Trustee of various Morgan Stanley Funds (since August 1994); formerly, Deputy Chairperson of the Audit Committee (July 2003-September 2006) and Chairperson of the Audit Committee of various Morgan Stanley Funds (since August 1994); CFO of the J. Paul Getty Trust. | | | 83 | | | Prior to August 10, 2016, Director of Electro Rent Corporation (equipment leasing); Prior to December 31, 2013, Director of The Ford Family Foundation. | |
38
Morgan Stanley Institutional Fund, Inc.
Annual Report — December 31, 2018
Director and Officer Information (unaudited) (cont'd)
Independent Directors: (cont'd)
Name, Age and Address of
Independent Director | | Position(s)
Held with
Registrant | | Length of Time
Served* | | Principal Occupation(s) During Past 5 Years
and Other Relevant Professional Experience | | Number of
Portfolios in
Fund Complex
Overseen by
Independent
Director** | | Other Directorships
Held by Independent
Director*** | |
Michael F. Klein (60)
c/o Perkins Coie LLP
Counsel to the Independent Directors
30 Rockefeller Plaza
New York, NY 10112 | | Director | | Since
August
2006 | | Managing Director, Aetos Alternatives Management, LP (since March 2000); Co-President, Aetos Alternatives Management, LP (since January 2004) and Co-Chief Executive Officer of Aetos Alternatives Management, LP (since August 2013); Chairperson of the Fixed Income Sub-Committee of the Investment Committee (since October 2006) and Director or Trustee of various Morgan Stanley Funds (since August 2006); formerly, Managing Director, Morgan Stanley & Co. Inc. and Morgan Stanley Dean Witter Investment Management and President, various Morgan Stanley Funds (June 1998-March 2000); Principal, Morgan Stanley & Co. Inc. and Morgan Stanley Dean Witter Investment Management (August 1997-December 1999). | | | 82 | | | Director of certain investment funds managed or sponsored by Aetos Alternatives Management, LP; Director of Sanitized AG and Sanitized Marketing AG (specialty chemicals). | |
Patricia Maleski (58)
c/o Perkins Coie LLP
Counsel to the Independent Directors
30 Rockefeller Plaza
New York, NY 10112 | | Director | | Since
January
2017 | | Managing Director, JPMorgan Asset Management (2004-2016); Oversight and Control Head of Fiduciary and Conflicts of Interest Program (2015-2016); Chief Control Officer-Global Asset Management (2013-2015); President, JPMorgan Funds (2010-2013); Chief Administrative Officer (2004-2013); various other positions including Treasurer and Board Liaison (since 2001). | | | 83 | | | None. | |
Michael E. Nugent (82)
522 Fifth Avenue
New York, NY 10036 | | Chair of the Board and Director | | Chair of the Boards since July 2006 and Director since July 1991 | | Chair of the Boards of various Morgan Stanley Funds (since July 2006); Chairperson of the Closed-End Fund Committee (since June 2012) Governance Committee (since January 2019) and Director or Trustee of various Morgan Stanley Funds (since July 1991); formerly, Chairperson of the Insurance Committee (until July 2006); General Partner, Triumph Capital, L.P. (private investment partnership) (1988-2013). | | | 82 | | | None. | |
W. Allen Reed (71)
c/o Perkins Coie LLP
Counsel to the Independent Directors
30 Rockefeller Plaza
New York, NY 10112 | | Director | | Since
August
2006 | | Chairperson of the Equity Sub-Committee of the Investment Committee (since October 2006) and Director or Trustee of various Morgan Stanley Funds (since August 2006); formerly, President and CEO of General Motors Asset Management; Chairman and Chief Executive Officer of the GM Trust Bank and Corporate Vice President of General Motors Corporation (August 1994-December 2005). | | | 82 | | | Director of Legg Mason, Inc.; formerly, Director of the Auburn University Foundation (2010-2015). | |
Fergus Reid (86)****
c/o Joe Pietryka, Inc.
85 Charles Colman Blvd.
Pawling, NY 12564 | | Director | | Since
June
1992 | | Chairman, Joe Pietryka, Inc.; Chairperson of the Governance Committee and Director or Trustee of various Morgan Stanley Funds (since June 1992). | | | 83 | | | Formerly, Trustee and Director of certain investment companies in the JP Morgan Fund Complex managed by JP Morgan Investment Management Inc. (1987-2012). | |
* This is the earliest date the Director began serving the Morgan Stanley Funds. Each Director serves an indefinite term, until his or her successor is elected.
** The Fund Complex includes (as of December 31, 2018) all open-end and closed-end funds (including all of their portfolios) advised by Morgan Stanley Investment Management Inc. (the "Adviser") and any funds that have an adviser that is an affiliated person of the Adviser (including, but not limited to, Morgan Stanley AIP GP LP).
*** This includes any directorships at public companies and registered investment companies held by the Director at any time during the past five years.
**** Effective date of retirement is December 31, 2018.
39
Morgan Stanley Institutional Fund, Inc.
Annual Report — December 31, 2018
Director and Officer Information (unaudited) (cont'd)
Executive Officers:
Name, Age and Address of Executive Officer | | Position(s) Held
with
Registrant | | Length of Time
Served* | | Principal Occupation(s) During Past 5 Years | |
John H. Gernon (55)
522 Fifth Avenue
New York, NY 10036 | | President and Principal Executive Officer | | Since
September
2013 | | President and Principal Executive Officer of the Equity and Fixed Income Funds and the Morgan Stanley AIP Funds (since September 2013) and the Liquidity Funds and various money market funds (since May 2014) in the Fund Complex; Managing Director of the Adviser; Head of Product (since 2006). | |
Timothy J. Knierim (59)
522 Fifth Avenue
New York, NY 10036 | | Chief Compliance Officer | | Since
December
2016 | | Managing Director of the Adviser and various entities affiliated with the Adviser; Chief Compliance Officer of various Morgan Stanley Funds and the Adviser (since December 2016) and Chief Compliance Officer of Morgan Stanley AIP GP LP (since 2014). Formerly, Managing Director and Deputy Chief Compliance Officer of the Adviser (2014-2016); and formerly, Chief Compliance Officer of Prudential Investment Management, Inc. (2007-2014). | |
Francis J. Smith (53)
522 Fifth Avenue
New York, NY 10036 | | Treasurer and Principal Financial Officer | | Treasurer since July 2003 and Principal Financial Officer since September 2002 | | Managing Director of the Adviser and various entities affiliated with the Adviser; Treasurer (since July 2003) and Principal Financial Officer of various Morgan Stanley Funds (since September 2002). | |
Mary E. Mullin (51)
522 Fifth Avenue
New York, NY 10036 | | Secretary | | Since
June
1999 | | Managing Director of the Adviser; Secretary of various Morgan Stanley Funds (since June 1999). | |
Michael J. Key (39)
522 Fifth Avenue
New York, NY 10036 | | Vice President | | Since
June
2017 | | Vice President of the Equity and Fixed Income Funds, Liquidity Funds, various money market funds and the Morgan Stanley AIP Funds in the Fund Complex (since June 2017); Executive Director of the Adviser; Head of Product Development for Equity and Fixed Income Funds (since August 2013). | |
* This is the earliest date the officer began serving the Morgan Stanley Funds. Each officer serves a one-year term, until his or her successor is elected and qualifies.
40
Morgan Stanley Institutional Fund, Inc.
Annual Report — December 31, 2018
Adviser and Administrator
Morgan Stanley Investment Management Inc.
522 Fifth Avenue
New York, New York 10036
Distributor
Morgan Stanley Distribution, Inc.
522 Fifth Avenue
New York, New York 10036
Dividend Disbursing and Transfer Agent
DST Asset Manager Solutions, Inc.
2000 Crown Colony Drive
Quincy, Massachusetts 02169
Custodian
State Street Bank and Trust Company
One Lincoln Street
Boston, Massachusetts 02111
Legal Counsel
Dechert LLP
1095 Avenue of the Americas
New York, New York 10036
Counsel to the Independent Directors
Perkins Coie LLP
30 Rockefeller Plaza
New York, New York 10112
Independent Registered Public Accounting Firm
Ernst & Young LLP
200 Clarendon Street
Boston, Massachusetts 02116
Reporting to Shareholders
Each Morgan Stanley fund provides a complete schedule of portfolio holdings in its semi-annual and the annual reports within 60 days of the end of the fund's second and fourth fiscal quarters. The semi-annual and annual reports are filed electronically with the Securities and Exchange Commission ("SEC") on Form N-CSRS and Form N-CSR, respectively. Morgan Stanley also delivers the semi-annual and annual reports to fund shareholders and makes these reports available on its public website, www.morganstanley.com/im/shareholderreports. Each Morgan Stanley fund also files a complete schedule of portfolio holdings with the SEC for the fund's first and third fiscal quarters on Form N-Q. Morgan Stanley does not deliver the reports for the first and third fiscal quarters to shareholders, nor are the reports posted to the Morgan Stanley public website. You may, however, obtain the Form N-Q filings (as well as the Form N-CSR and N-CSRS filings) by accessing the SEC's website, www.sec.gov. You can also request copies of these materials, upon payment of a duplicating fee, by electronic request at the SEC's email address (publicinfo@sec.gov).
Proxy Voting Policies and Procedures and Proxy Voting Record
You may obtain a copy of the Company's Proxy Voting Policy and Procedures and information regarding how the Company voted proxies relating to portfolio securities during the most recent twelve-month period ended June 30, without charge, upon request, by calling toll free 1 (800) 548-7786 or by visiting our website at www.morganstanley.com/im/shareholderreports. This information is also available on the SEC's website at www.sec.gov.
This report is authorized for distribution only when preceded or accompanied by a prospectus or summary prospectus of the applicable Fund of Morgan Stanley Institutional Fund, Inc., which describes in detail the Fund's investment policies, risks, fees and expenses. Please read the prospectus carefully before you invest or send money. For additional information, including information regarding the investments comprising the Fund, please visit our website at www.morganstanley.com/im/shareholderreports or call toll free 1 (800) 548-7786.
41
Printed in U.S.A.
This Report has been prepared for shareholders and may be distributed to others only if preceded or accompanied by a current prospectus.
Morgan Stanley Investment Management Inc.
522 Fifth Avenue
New York, New York 10036
© 2019 Morgan Stanley. Morgan Stanley Distribution, Inc.

IFIAIAANN
2400391 EXP. 02.29.20

Morgan Stanley Institutional Fund, Inc.
Advantage Portfolio
Annual Report
December 31, 2018
Beginning on January 1, 2021, as permitted by regulations adopted by the Securities and Exchange Commission ("SEC"), paper copies of the Fund's Annual and Semi-Annual Reports to Shareholders ("Shareholder Reports") will no longer be sent by mail, unless you specifically request paper copies of the Shareholder Reports from the Fund or from your financial intermediary, such as a broker-dealer or a bank. Instead, the Shareholder Reports will be made available on the Fund's website, https://www.morganstanley.com/im/shareholderreports and you will be notified by mail each time a Shareholder Report is posted and provided with a website link to access the Shareholder Report. If you already elected to receive Shareholder Reports electronically, you will not be affected by this change and you need not take any action. You may elect to receive Shareholder Reports and other communications from the Fund electronically anytime by contacting your financial intermediary or, if you are a direct investor, please follow the instructions on the envelope.
Beginning on January 1, 2019, you may elect to receive all future Shareholder Reports in paper free of charge. If you invest through a financial intermediary, you can contact your financial intermediary to request that you continue to receive paper copies of your Shareholder Reports. If you invest directly with the Fund, please follow the instructions on the envelope to let the Fund know you wish to continue receiving paper copies of your Shareholder Reports. Your election to receive Shareholder Reports in paper will apply to all funds held in your account if you invest through your financial intermediary or all funds held with the fund complex if you invest directly with a fund.

Morgan Stanley Institutional Fund, Inc.
Annual Report — December 31, 2018
Shareholders' Letter | | | 2 | | |
Expense Example | | | 3 | | |
Investment Overview | | | 4 | | |
Portfolio of Investments | | | 6 | | |
Statement of Assets and Liabilities | | | 8 | | |
Statement of Operations | | | 10 | | |
Statements of Changes in Net Assets | | | 11 | | |
Financial Highlights | | | 13 | | |
Notes to Financial Statements | | | 18 | | |
Report of Independent Registered Public Accounting Firm | | | 27 | | |
Federal Tax Notice | | | 28 | | |
Privacy Notice | | | 29 | | |
Director and Officer Information | | | 32 | | |
This report is authorized for distribution only when preceded or accompanied by a prospectus or summary prospectus of the applicable Fund of Morgan Stanley Institutional Fund, Inc. To receive a prospectus and/or statement of additional information (SAI), which contains more complete information such as investment objectives, charges, expenses, policies for voting proxies, risk considerations and describes in detail each of the Fund's investment policies to the prospective investor, please call toll free 1 (800) 548-7786. Please read the prospectuses carefully before you invest or send money.
Additionally, you can access information about the Fund, including performance, characteristics and investment team commentary, through Morgan Stanley Investment Management's website: www.morganstanley.com/im/shareholderreports.
Market forecasts provided in this report may not necessarily come to pass. There is no guarantee that any sectors mentioned will continue to perform as discussed herein or that securities in such sectors will be held by the Fund in the future. There is no assurance that a fund will achieve its investment objective. Funds are subject to market risk, which is the possibility that market values of securities owned by the Fund will decline and, therefore, the value of the Fund's shares may be less than what you paid for them. Accordingly, you can lose money investing in this Fund. Please see the prospectus for more complete information on investment risks.
1
Morgan Stanley Institutional Fund, Inc.
Annual Report — December 31, 2018
Shareholders' Letter (unaudited)
Dear Shareholders,
We are pleased to provide this Annual report, in which you will learn how your investment in Advantage Portfolio (the "Fund") performed during the latest twelve-month period.
Morgan Stanley Investment Management is a client-centric, investor-led organization. Our global presence, intellectual capital, and breadth of products and services enable us to partner with investors to meet the evolving challenges of today's financial markets. We aim to deliver superior investment service and to empower our clients to make the informed decisions that help them reach their investment goals.
As always, we thank you for selecting Morgan Stanley Investment Management, and look forward to working with you in the months and years ahead.
Sincerely,

John H. Gernon
President and Principal Executive Officer
January 2019
2
Morgan Stanley Institutional Fund, Inc.
Annual Report — December 31, 2018
Expense Example (unaudited)
Advantage Portfolio
As a shareholder of the Fund, you incur two types of costs: (1) transactional costs; and (2) ongoing costs, which may include advisory fees, administration fees, distribution and shareholder services fees and other Fund expenses. This example is intended to help you understand your ongoing costs (in dollars) of investing in the Fund and to compare these costs with the ongoing costs of investing in other mutual funds.
This example is based on an investment of $1,000 invested at the beginning of the six-month period ended December 31, 2018 and held for the entire six-month period.
Actual Expenses
The table below provides information about actual account values and actual expenses. You may use the information in this table, together with the amount you invested, to estimate the expenses that you paid over the period. Simply divide your account value by $1,000 (for example, an $8,600 account value divided by $1,000 = 8.6), then multiply the result by the number in the table under the heading entitled "Actual Expenses Paid During Period" to estimate the expenses you paid on your account during this period.
Hypothetical Example for Comparison Purposes
The table below provides information about hypothetical account values and hypothetical expenses based on the Fund's actual expense ratio and an assumed rate of return of 5% per year before expenses, which is not the Fund's actual return. The hypothetical account values and expenses may not be used to estimate the actual ending account balance or expenses you paid for the period. You may use this information to compare the ongoing costs of investing in the Fund and other funds. To do so, compare this 5% hypothetical example with the 5% hypothetical examples that appear in the shareholder reports of the other funds.
Please note that the expenses shown in the table are meant to highlight your ongoing costs only and do not reflect any transactional costs, such as sales charges (loads). Therefore, the information for each class in the table is useful in comparing ongoing costs only, and will not help you determine the relative total costs of owning different funds. In addition, if these transactional costs were included, your costs would have been higher.
| | | Beginning
Account
Value
7/1/18 | | Actual Ending
Account
Value
12/31/18 | | Hypothetical
Ending Account
Value | | Actual
Expenses
Paid
During
Period* | | Hypothetical
Expenses Paid
During Period* | | Net
Expense
Ratio
During
Period** | |
Advantage Portfolio Class I | | $ | 1,000.00 | | | $ | 921.40 | | | $ | 1,020.97 | | | $ | 4.07 | | | $ | 4.28 | | | | 0.84 | % | |
Advantage Portfolio Class A | | | 1,000.00 | | | | 919.90 | | | | 1,019.31 | | | | 5.66 | | | | 5.96 | | | | 1.17 | | |
Advantage Portfolio Class L | | | 1,000.00 | | | | 920.80 | | | | 1,020.16 | | | | 4.84 | | | | 5.09 | | | | 1.00 | | |
Advantage Portfolio Class C | | | 1,000.00 | | | | 916.40 | | | | 1,015.68 | | | | 9.13 | | | | 9.60 | | | | 1.89 | | |
Advantage Portfolio Class IS | | | 1,000.00 | | | | 921.60 | | | | 1,021.17 | | | | 3.87 | | | | 4.08 | | | | 0.80 | | |
* Expenses are calculated using each Fund Class' annualized net expense ratio (as disclosed), multiplied by the average account value over the period and multiplied by 184/365 (to reflect the most recent one-half year period).
** Annualized.
3
Morgan Stanley Institutional Fund, Inc.
Annual Report — December 31, 2018
Investment Overview (unaudited)
Advantage Portfolio
The Fund seeks long-term capital appreciation.
Performance
For the fiscal year ended December 31, 2018, the Fund's Class I shares had a total return based on net asset value and reinvestment of distributions per share of 3.74%, net of fees. The Fund's Class I shares outperformed the Fund's benchmark, the Russell 1000® Growth Index (the "Index"), which returned –1.51%.
Factors Affecting Performance
• U.S. stocks ended the year with a loss, as anxiety over rising downside risks overwhelmed positive fundamental data. While most other major world economies were slowing, the U.S. economy accelerated in 2018. A tight labor market and rising wages supported consumer spending and confidence. Corporate earnings and revenues were robust, aided by tailwinds from tax cuts and deregulation. However, looming risks from geopolitical uncertainties, especially U.S.-China trade relations, and tightening financial conditions began to take a toll on investor sentiment and corporate earnings outlooks. Market volatility increased markedly from 2017's historically low levels, with especially sharp price swings in February, October and December 2018.
• Within the Index, utilities, consumer discretionary and information technology were the best-performing sectors, while energy, materials and communication services were the weakest performers.
• The long-term investment horizon and conviction-weighted investment approach embraced by the team since 1998 can result in periods of performance deviation from the benchmark and peers. In this reporting period, the Fund's outperformance was largely driven by stock selection. Sector allocation marginally detracted from relative performance.
• The consumer discretionary, information technology and industrials sectors contributed the most to relative performance. Both stock selection and an overweight allocation in consumer discretionary were advantageous, led by strong results from an online retail and cloud computing leader, which was also the top contributing holding across the whole portfolio. Our stock selection in information technology added value, led by a
provider of cloud-based human resources and financial management software, but relative gains were partially offset by an underweight to the sector, which detracted. In the industrials sector, our stock selection was beneficial, which more than made up for the relative loss from an overweight to the sector.
• The materials and financials sectors were the largest sector detractors in the reporting period. The overweight allocation to materials was detrimental as the sector was among the worst performers in the market, while stock selection in financials underperformed. The largest detractor across the portfolio was a video game publisher, which is in the communication services sector.
Management Strategies
• There were no changes to our bottom-up investment process during the period. We continued to look for franchises with strong name recognition and sustainable competitive advantages. We typically favor companies with rising returns on invested capital, above average business visibility, strong free cash flow generation and an attractive risk/reward profile. Our emphasis is on secular growth, and as a result short-term market events are not as meaningful in the stock selection process.
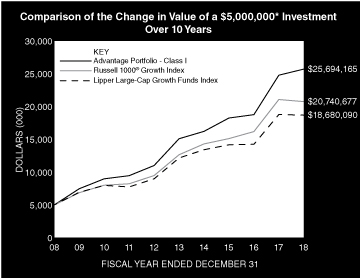
* Minimum Investment for Class I shares
In accordance with SEC regulations, the Fund's performance shown assumes that all recurring fees (including management fees) were deducted and all dividends and distributions were reinvested. The performance of Class A, L, C and IS shares will vary from the performance of Class I shares based upon their different inception dates and will be negatively impacted by additional fees assessed to those classes (if applicable).
4
Morgan Stanley Institutional Fund, Inc.
Annual Report — December 31, 2018
Investment Overview (unaudited) (cont'd)
Advantage Portfolio
Performance Compared to the Russell 1000® Growth Index(1) and the Lipper Large-Cap Growth Funds Index(2)
| | | Period Ended December 31, 2018
Total Returns(3) | |
| | | | | Average Annual | |
| | | One
Year | | Five
Years | | Ten
Years | | Since
Inception(7) | |
Fund — Class I Shares
w/o sales charges(4) | | | 3.74 | % | | | 11.24 | % | | | 17.78 | % | | | 11.70 | % | |
Fund — Class A Shares
w/o sales charges(4) | | | 3.37 | | | | 10.86 | | | | — | | | | 15.18 | | |
Fund — Class A Shares with
maximum 5.25% sales charges(4) | | | –2.06 | | | | 9.67 | | | | — | | | | 14.46 | | |
Fund — Class L Shares
w/o sales charges(4) | | | 3.61 | | | | 11.12 | | | | 17.66 | | | | 11.56 | | |
Fund — Class C Shares
w/o sales charges(6) | | | 2.64 | | | | — | | | | — | | | | 9.99 | | |
Fund — Class C Shares
with maximum 1.00% deferred
sales charges(6) | | | 1.67 | | | | — | | | | — | | | | 9.99 | | |
Fund — Class IS Shares
w/o sales charges(5) | | | 3.74 | | | | 11.29 | | | | — | | | | 13.60 | | |
Russell 1000® Growth Index | | | –1.51 | | | | 10.40 | | | | 15.29 | | | | 10.33 | | |
Lipper Large-Cap Growth
Funds Index | | | –0.47 | | | | 8.98 | | | | 14.09 | | | | 8.87 | | |
Performance data quoted represents past performance, which is no guarantee of future results, and current performance may be lower or higher than the figures shown. Performance assumes that all dividends and distributions, if any, were reinvested. For the most recent month-end performance figures, please visit www.morganstanley.com/im/shareholderreports. Investment return and principal value will fluctuate so that Fund shares, when redeemed, may be worth more or less than their original cost. Total returns do not reflect the deduction of taxes that a shareholder would pay on Fund distributions or the redemption of Fund shares. Performance of share classes will vary due to difference in sales charges and expenses.
(1) The Russell 1000® Growth Index measures the performance of the large-cap growth segment of the U.S. equity universe. It includes those Russell 1000® Index companies with higher price-to-book ratios and higher forecasted growth values. The Russell 1000® Index is an index of approximately 1,000 of the largest U.S. companies based on a combination of market capitalization and current index membership. The Index is unmanaged and its returns do not include any sales charges or fees. Such costs would lower performance. It is not possible to invest directly in an index.
(2) The Lipper Large-Cap Growth Funds Index is an equally weighted performance index of the largest qualifying funds (based on net assets) in the Lipper Large-Cap Growth Funds classification. The Index, which is adjusted for capital gains distributions and income dividends, is unmanaged and should not be considered an investment. There are currently 30 funds represented in this Index. As of the date of this report, the Fund was in the Lipper Large-Cap Growth Funds classification.
(3) Total returns for the Fund reflect fees waived and expenses reimbursed, if applicable, by Morgan Stanley Investment Management Inc. (the "Adviser"). Without such waivers and reimbursements, total returns would have been lower.
(4) On May 21, 2010 Class C and Class I shares of Van Kampen Core Growth Fund (the "Predecessor Fund") were reorganized into Class L and Class I shares of Morgan Stanley Advantage Portfolio (the "Fund"), respectively. Class L and Class I shares' returns of the Fund will differ from the Predecessor Fund as they have different expenses. Performance shown for the Fund's Class I and Class L shares reflects the performance of the shares of the Predecessor Fund for periods prior to May 21, 2010. The Class C and I shares of the Predecessor Fund commenced operations on June 30, 2008. Class P shares, which were renamed Class A shares effective September 9, 2013, commenced operations on May 21, 2010.
(5) Commenced offering on September 13, 2013.
(6) Commenced offering on April 30, 2015.
(7) For comparative purposes, average annual since inception returns listed for the Indexes refer to the inception date of Class I of the Fund, not the inception of the Index.
5
Morgan Stanley Institutional Fund, Inc.
Annual Report — December 31, 2018
Portfolio of Investments
Advantage Portfolio
| | | Shares | | Value
(000) | |
Common Stocks (95.1%) | |
Aerospace & Defense (1.2%) | |
United Technologies Corp. | | | 30,907 | | | $ | 3,291 | | |
Capital Markets (2.9%) | |
MSCI, Inc. | | | 26,047 | | | | 3,840 | | |
S&P Global, Inc. | | | 22,373 | | | | 3,802 | | |
| | | | 7,642 | | |
Chemicals (2.9%) | |
Ecolab, Inc. | | | 25,514 | | | | 3,760 | | |
Linde PLC | | | 25,032 | | | | 3,906 | | |
| | | | 7,666 | | |
Commercial Services & Supplies (4.3%) | |
Copart, Inc. (a) | | | 80,918 | | | | 3,866 | | |
Rollins, Inc. | | | 97,851 | | | | 3,533 | | |
Waste Management, Inc. | | | 43,040 | | | | 3,830 | | |
| | | | 11,229 | | |
Construction Materials (1.4%) | |
Martin Marietta Materials, Inc. | | | 21,069 | | | | 3,621 | | |
Entertainment (4.0%) | |
Activision Blizzard, Inc. | | | 82,031 | | | | 3,820 | | |
Walt Disney Co. (The) | | | 60,958 | | | | 6,684 | | |
| | | | 10,504 | | |
Health Care Equipment & Supplies (6.4%) | |
Danaher Corp. | | | 38,482 | | | | 3,968 | | |
Intuitive Surgical, Inc. (a) | | | 26,614 | | | | 12,746 | | |
| | | | 16,714 | | |
Health Care Providers & Services (3.3%) | |
UnitedHealth Group, Inc. | | | 35,175 | | | | 8,763 | | |
Hotels, Restaurants & Leisure (4.7%) | |
Starbucks Corp. | | | 192,412 | | | | 12,391 | | |
Interactive Media & Services (14.5%) | |
Alphabet, Inc., Class C (a) | | | 8,910 | | | | 9,227 | | |
Facebook, Inc., Class A (a) | | | 69,253 | | | | 9,079 | | |
IAC/InterActiveCorp (a) | | | 38,834 | | | | 7,108 | | |
Twitter, Inc. (a) | | | 438,493 | | | | 12,602 | | |
| | | | 38,016 | | |
Internet & Direct Marketing Retail (11.2%) | |
Amazon.com, Inc. (a) | | | 14,608 | | | | 21,941 | | |
Booking Holdings, Inc. (a) | | | 2,190 | | | | 3,772 | | |
MercadoLibre, Inc. | | | 13,166 | | | | 3,856 | | |
| | | | 29,569 | | |
Machinery (1.4%) | |
Fortive Corp. | | | 53,705 | | | | 3,634 | | |
Pharmaceuticals (5.0%) | |
Elanco Animal Health, Inc. (a) | | | 208,658 | | | | 6,579 | | |
Zoetis, Inc. | | | 78,542 | | | | 6,718 | | |
| | | | 13,297 | | |
Road & Rail (6.4%) | |
Canadian National Railway Co. (Canada) | | | 107,924 | | | | 7,998 | | |
Union Pacific Corp. | | | 63,556 | | | | 8,786 | | |
| | | | 16,784 | | |
| | | Shares | | Value
(000) | |
Software (22.1%) | |
Adobe, Inc. (a) | | | 41,986 | | | $ | 9,499 | | |
Constellation Software, Inc. (Canada) | | | 5,923 | | | | 3,791 | | |
Intuit, Inc. | | | 19,841 | | | | 3,906 | | |
salesforce.com, Inc. (a) | | | 75,168 | | | | 10,296 | | |
ServiceNow, Inc. (a) | | | 80,387 | | | | 14,313 | | |
Workday, Inc., Class A (a) | | | 101,349 | | | | 16,183 | | |
| | | | 57,988 | | |
Textiles, Apparel & Luxury Goods (3.4%) | |
LVMH Moet Hennessy Louis Vuitton SE (France) | | | 30,075 | | | | 8,837 | | |
Total Common Stocks (Cost $232,175) | | | 249,946 | | |
Short-Term Investment (7.0%) | |
Investment Company (7.0%) | |
Morgan Stanley Institutional Liquidity
Funds — Treasury Securities Portfolio —
Institutional Class (See Note G)
(Cost $18,432) | | | 18,432,247 | | | | 18,432 | | |
Total Investments Excluding Purchased
Options (102.1%) (Cost $250,607) | | | | | 268,378 | | |
Total Purchased Options Outstanding (0.1%)
(Cost $610) | | | 136 | | |
Total Investments (102.2%) (Cost $251,217) (b)(c) | | | 268,514 | | |
Liabilities in Excess of Other Assets (–2.2%) | | | (5,715 | ) | |
Net Assets (100.0%) | | $ | 262,799 | | |
(a) Non-income producing security.
(b) The approximate fair value and percentage of net assets, $8,837,000 and 3.4%, respectively, represent the securities that have been fair valued under the fair valuation policy for international investments as described in Note A-1 within the Notes to the Financial Statements.
(c) At December 31, 2018, the aggregate cost for federal income tax purposes is approximately $253,539,000. The aggregate gross unrealized appreciation is approximately $21,458,000 and the aggregate gross unrealized depreciation is approximately $6,483,000, resulting in net unrealized appreciation of approximately $14,975,000.
The accompanying notes are an integral part of the financial statements.
6
Morgan Stanley Institutional Fund, Inc.
Annual Report — December 31, 2018
Portfolio of Investments (cont'd)
Advantage Portfolio
Call Options Purchased:
The Fund had the following call options purchased open at December 31, 2018:
Counterparty | | Description | | Strike
Price | | Expiration
Date | | Number of
Contracts | | Notional
Amount
(000) | | Value
(000) | | Premiums
Paid
(000) | | Unrealized
Depreciation
(000) | |
Royal Bank of Scotland | | USD/CNH | | CNH | 7.16 | | | Jan-19 | | | 26,392,104 | | | | 26,392 | | | $ | 3 | | | $ | 114 | | | $ | (111 | ) | |
Royal Bank of Scotland | | USD/CNH | | CNH | 7.78 | | | Jul-19 | | | 48,816,064 | | | | 48,816 | | | | 53 | | | | 238 | | | | (185 | ) | |
Royal Bank of Scotland | | USD/CNH | | CNH | 8.00 | | | Oct-19 | | | 43,802,720 | | | | 43,803 | | | | 80 | | | | 258 | | | | (178 | ) | |
| | | | | | | | | | | | | $ | 136 | | | $ | 610 | | | $ | (474 | ) | |
CNH — Chinese Yuan Renminbi Offshore
USD — United States Dollar
Portfolio Composition
Classification | | Percentage of
Total Investments | |
Other* | | | 28.9 | % | |
Software | | | 21.6 | | |
Interactive Media & Services | | | 14.2 | | |
Internet & Direct Marketing Retail | | | 11.0 | | |
Short-Term Investments | | | 6.9 | | |
Road & Rail | | | 6.2 | | |
Health Care Equipment & Supplies | | | 6.2 | | |
Pharmaceuticals | | | 5.0 | | |
Total Investments | | | 100.0 | % | |
* Industries and/or investment types representing less than 5% of total investments.
The accompanying notes are an integral part of the financial statements.
7
Morgan Stanley Institutional Fund, Inc.
Annual Report — December 31, 2018
Statement of Assets and Liabilities | | December 31, 2018
(000) | |
Assets: | |
Investments in Securities of Unaffiliated Issuers, at Value (Cost $232,785) | | $ | 250,082 | | |
Investment in Security of Affiliated Issuer, at Value (Cost $18,432) | | | 18,432 | | |
Total Investments in Securities, at Value (Cost $251,217) | | | 268,514 | | |
Foreign Currency, at Value (Cost $1) | | | 1 | | |
Receivable for Fund Shares Sold | | | 3,129 | | |
Dividends Receivable | | | 72 | | |
Tax Reclaim Receivable | | | 25 | | |
Receivable from Affiliate | | | 22 | | |
Other Assets | | | 74 | | |
Total Assets | | | 271,837 | | |
Liabilities: | |
Payable for Investments Purchased | | | 7,381 | | |
Payable for Fund Shares Redeemed | | | 921 | | |
Due to Broker | | | 270 | | |
Payable for Advisory Fees | | | 228 | | |
Payable for Professional Fees | | | 79 | | |
Payable for Shareholder Services Fees — Class A | | | 9 | | |
Payable for Distribution and Shareholder Services Fees — Class L | | | — | @ | |
Payable for Distribution and Shareholder Services Fees — Class C | | | 27 | | |
Payable for Sub Transfer Agency Fees — Class I | | | 26 | | |
Payable for Sub Transfer Agency Fees — Class L | | | — | @ | |
Payable for Sub Transfer Agency Fees — Class C | | | 1 | | |
Payable for Reorganization Expense | | | 25 | | |
Payable for Administration Fees | | | 18 | | |
Payable for Transfer Agency Fees — Class I | | | 6 | | |
Payable for Transfer Agency Fees — Class A | | | 3 | | |
Payable for Transfer Agency Fees — Class L | | | 2 | | |
Payable for Transfer Agency Fees — Class C | | | 3 | | |
Payable for Transfer Agency Fees — Class IS | | | 1 | | |
Payable for Custodian Fees | | | 5 | | |
Bank Overdraft | | | 1 | | |
Other Liabilities | | | 32 | | |
Total Liabilities | | | 9,038 | | |
Net Assets | | $ | 262,799 | | |
Net Assets Consist of: | |
Paid-in-Capital | | $ | 248,333 | | |
Total Distributable Earnings | | | 14,466 | | |
Net Assets | | $ | 262,799 | | |
The accompanying notes are an integral part of the financial statements.
8
Morgan Stanley Institutional Fund, Inc.
Annual Report — December 31, 2018
Statement of Assets and Liabilities (cont'd) | | December 31, 2018
(000) | |
CLASS I: | |
Net Assets | | $ | 156,782 | | |
| Shares Outstanding $0.001 par value shares of beneficial interest (unlimited shares authorized) (not in 000's) | | | 7,473,187 | | |
Net Asset Value, Offering and Redemption Price Per Share | | $ | 20.98 | | |
CLASS A: | |
Net Assets | | $ | 42,959 | | |
| Shares Outstanding $0.001 par value shares of beneficial interest (unlimited shares authorized) (not in 000's) | | | 2,091,233 | | |
Net Asset Value, Redemption Price Per Share | | $ | 20.54 | | |
Maximum Sales Load | | | 5.25 | % | |
Maximum Sales Charge | | $ | 1.14 | | |
Maximum Offering Price Per Share | | $ | 21.68 | | |
CLASS L: | |
Net Assets | | $ | 3,751 | | |
| Shares Outstanding $0.001 par value shares of beneficial interest (unlimited shares authorized) (not in 000's) | | | 179,293 | | |
Net Asset Value, Offering and Redemption Price Per Share | | $ | 20.92 | | |
CLASS C: | |
Net Assets | | $ | 32,706 | | |
| Shares Outstanding $0.001 par value shares of beneficial interest (unlimited shares authorized) (not in 000's) | | | 1,627,083 | | |
Net Asset Value, Offering and Redemption Price Per Share | | $ | 20.10 | | |
CLASS IS: | |
Net Assets | | $ | 26,601 | | |
| Shares Outstanding $0.001 par value shares of beneficial interest (unlimited shares authorized) (not in 000's) | | | 1,265,431 | | |
Net Asset Value, Offering and Redemption Price Per Share | | $ | 21.02 | | |
@ Amount is less than $500.
The accompanying notes are an integral part of the financial statements.
9
Morgan Stanley Institutional Fund, Inc.
Annual Report — December 31, 2018
Statement of Operations | | Year Ended
December 31, 2018
(000) | |
Investment Income: | |
Dividends from Securities of Unaffiliated Issuers (Net of $39 of Foreign Taxes Withheld) | | $ | 1,065 | | |
Dividends from Security of Affiliated Issuer (Note G) | | | 123 | | |
Total Investment Income | | | 1,188 | | |
Expenses: | |
Advisory Fees (Note B) | | | 963 | | |
Shareholder Services Fees — Class A (Note D) | | | 69 | | |
Distribution and Shareholder Services Fees — Class L (Note D) | | | 32 | | |
Distribution and Shareholder Services Fees — Class C (Note D) | | | 187 | | |
Professional Fees | | | 131 | | |
Administration Fees (Note C) | | | 119 | | |
Sub Transfer Agency Fees — Class I | | | 66 | | |
Sub Transfer Agency Fees — Class A | | | 28 | | |
Sub Transfer Agency Fees — Class L | | | 2 | | |
Sub Transfer Agency Fees — Class C | | | 10 | | |
Registration Fees | | | 73 | | |
Shareholder Reporting Fees | | | 28 | | |
Transfer Agency Fees — Class I (Note E) | | | 4 | | |
Transfer Agency Fees — Class A (Note E) | | | 4 | | |
Transfer Agency Fees — Class L (Note E) | | | 4 | | |
Transfer Agency Fees — Class C (Note E) | | | 4 | | |
Transfer Agency Fees — Class IS (Note E) | | | 2 | | |
Custodian Fees (Note F) | | | 17 | | |
Directors' Fees and Expenses | | | 7 | | |
Pricing Fees | | | 2 | | |
Other Expenses | | | 27 | | |
Total Expenses | | | 1,779 | | |
Waiver of Advisory Fees (Note B) | | | (167 | ) | |
Reimbursement of Class Specific Expenses — Class I (Note B) | | | (40 | ) | |
Reimbursement of Class Specific Expenses — Class L (Note B) | | | (— | @) | |
Reimbursement of Class Specific Expenses — Class IS (Note B) | | | (2 | ) | |
Distribution Fees — Class L Shares Waived (Note D) | | | (30 | ) | |
Rebate from Morgan Stanley Affiliate (Note G) | | | (13 | ) | |
Net Expenses | | | 1,527 | | |
Net Investment Loss | | | (339 | ) | |
Realized Gain (Loss): | |
Investments Sold | | | 4,793 | | |
Foreign Currency Translation | | | (3 | ) | |
Net Realized Gain | | | 4,790 | | |
Change in Unrealized Appreciation (Depreciation): | |
Investments | | | (8,648 | ) | |
Foreign Currency Translation | | | (1 | ) | |
Net Change in Unrealized Appreciation (Depreciation) | | | (8,649 | ) | |
Net Realized Gain and Change in Unrealized Appreciation (Depreciation) | | | (3,859 | ) | |
Net Decrease in Net Assets Resulting from Operations | | $ | (4,198 | ) | |
@ Amount is less than $500.
The accompanying notes are an integral part of the financial statements.
10
Morgan Stanley Institutional Fund, Inc.
Annual Report — December 31, 2018
Statements of Changes in Net Assets | | Year Ended
December 31, 2018
(000) | | Year Ended
December 31, 2017
(000) | |
Increase (Decrease) in Net Assets: | |
Operations: | |
Net Investment Loss | | $ | (339 | ) | | $ | (142 | ) | |
Net Realized Gain | | | 4,790 | | | | 9,823 | | |
Net Change in Unrealized Appreciation (Depreciation) | | | (8,649 | ) | | | 17,275 | | |
Net Increase (Decrease) in Net Assets Resulting from Operations | | | (4,198 | ) | | | 26,956 | | |
Dividends and Distributions to Shareholders: | |
Class I | | | (4,501 | ) | | | (3,748 | )* | |
Class A | | | (1,722 | ) | | | (1,700 | )* | |
Class L | | | (233 | ) | | | (294 | )* | |
Class C | | | (1,230 | ) | | | (836 | )* | |
Class IS | | | (1,253 | ) | | | (1,216 | )* | |
Total Dividends and Distributions to Shareholders | | | (8,939 | ) | | | (7,794 | ) | |
Capital Share Transactions:(1) | |
Class I: | |
Subscribed | | | 71,760 | | | | 11,335 | | |
Issued due to a Tax-free Reorganization | | | 74,516 | | | | — | | |
Distributions Reinvested | | | 4,501 | | | | 3,748 | | |
Redeemed | | | (40,550 | ) | | | (13,359 | ) | |
Class A: | |
Subscribed | | | 22,223 | | | | 4,674 | | |
Issued due to a Tax-free Reorganization | | | 12,842 | | | | — | | |
Distributions Reinvested | | | 1,722 | | | | 1,700 | | |
Redeemed | | | (15,270 | ) | | | (6,744 | ) | |
Class L: | |
Exchanged | | | — | | | | 20 | | |
Issued due to a Tax-free Reorganization | | | 107 | | | | — | | |
Distributions Reinvested | | | 233 | | | | 282 | | |
Redeemed | | | (618 | ) | | | (722 | ) | |
Class C: | |
Subscribed | | | 17,251 | | | | 4,367 | | |
Issued due to a Tax-free Reorganization | | | 9,885 | | | | — | | |
Distributions Reinvested | | | 1,228 | | | | 834 | | |
Redeemed | | | (5,204 | ) | | | (1,219 | ) | |
Class IS: | |
Subscribed | | | 10,421 | | | | — | | |
Distributions Reinvested | | | 1,252 | | | | 1,215 | | |
Redeemed | | | (1,534 | ) | | | — | | |
Net Increase in Net Assets Resulting from Capital Share Transactions | | | 164,765 | | | | 6,131 | | |
Total Increase in Net Assets | | | 151,628 | | | | 25,293 | | |
Net Assets: | |
Beginning of Period | | | 111,171 | | | | 85,878 | | |
End of Period | | $ | 262,799 | | | $ | 111,171 | † | |
The accompanying notes are an integral part of the financial statements.
11
Morgan Stanley Institutional Fund, Inc.
Annual Report — December 31, 2018
Statements of Changes in Net Assets (cont'd) | | Year Ended
December 31, 2018
(000) | | Year Ended
December 31, 2017
(000) | |
(1) Capital Share Transactions: | |
Class I: | |
Shares Subscribed | | | 3,152 | | | | 573 | | |
Shares Issued due to a Tax-free Reorganization | | | 3,393 | | | | — | | |
Shares Issued on Distributions Reinvested | | | 203 | | | | 177 | | |
Shares Redeemed | | | (1,792 | ) | | | (677 | ) | |
Net Increase in Class I Shares Outstanding | | | 4,956 | | | | 73 | | |
Class A: | |
Shares Subscribed | | | 991 | | | | 237 | | |
Shares Issued due to a Tax-free Reorganization | | | 597 | | | | — | | |
Shares Issued on Distributions Reinvested | | | 79 | | | | 82 | | |
Shares Redeemed | | | (700 | ) | | | (345 | ) | |
Net Increase (Decrease) in Class A Shares Outstanding | | | 967 | | | | (26 | ) | |
Class L: | |
Shares Exchanged | | | — | | | | 1 | | |
Shares Issued due to a Tax-free Reorganization | | | 5 | | | | — | | |
Shares Issued on Distributions Reinvested | | | 10 | | | | 13 | | |
Shares Redeemed | | | (26 | ) | | | (35 | ) | |
Net Decrease in Class L Shares Outstanding | | | (11 | ) | | | (21 | ) | |
Class C: | |
Shares Subscribed | | | 771 | | | | 219 | | |
Shares Issued due to a Tax-free Reorganization | | | 469 | | | | — | | |
Shares Issued on Distributions Reinvested | | | 58 | | | | 41 | | |
Shares Redeemed | | | (239 | ) | | | (63 | ) | |
Net Increase in Class C Shares Outstanding | | | 1,059 | | | | 197 | | |
Class IS: | |
Shares Subscribed | | | 461 | | | | — | | |
Shares Issued on Distributions Reinvested | | | 56 | | | | 57 | | |
Shares Redeemed | | | (68 | ) | | | — | | |
Net Increase in Class IS Shares Outstanding | | | 449 | | | | 57 | | |
The following information was previously reported in the December 31, 2017 financial statements. The distribution information for the year ended December 31, 2017 presented on the Statements of Changes in Net Assets is presented for comparative purposes to the December 31, 2018 financial statements, which conform to the SEC Final Rule on Disclosure Update and Simplification which was effective November 5, 2018.
* Dividends and Distributions to Shareholders for the year ended December 31, 2017 were as follows:
Class I: | |
Net Realized Gain | | $ | (3,748 | ) | |
Class A: | |
Net Realized Gain | | $ | (1,700 | ) | |
Class L: | |
Net Realized Gain | | $ | (294 | ) | |
Class C: | |
Net Realized Gain | | $ | (836 | ) | |
Class IS: | |
Net Realized Gain | | $ | (1,216 | ) | |
† Accumulated Net Investment Loss for the year ended December 31, 2017 was (—@).
@ Amount is less than $500.
The accompanying notes are an integral part of the financial statements.
12
Morgan Stanley Institutional Fund, Inc.
Annual Report — December 31, 2018
Financial Highlights
Advantage Portfolio
| | | Class I | |
| | | Year Ended December 31, | |
Selected Per Share Data and Ratios | | 2018 | | 2017 | | 2016(1) | | 2015 | | 2014 | |
Net Asset Value, Beginning of Period | | $ | 21.45 | | | $ | 17.47 | | | $ | 17.40 | | | $ | 16.83 | | | $ | 16.41 | | |
Income (Loss) from Investment Operations: | |
Net Investment Income (Loss)(2) | | | (0.01 | ) | | | 0.00 | (3) | | | 0.07 | | | | 0.01 | | | | 0.04 | | |
Net Realized and Unrealized Gain | | | 0.87 | | | | 5.57 | | | | 0.42 | | | | 2.11 | | | | 1.15 | | |
Total from Investment Operations | | | 0.86 | | | | 5.57 | | | | 0.49 | | | | 2.12 | | | | 1.19 | | |
Distributions from and/or in Excess of: | |
Net Investment Income | | | — | | | | — | | | | (0.04 | ) | | | (0.02 | ) | | | (0.01 | ) | |
Net Realized Gain | | | (1.33 | ) | | | (1.59 | ) | | | (0.38 | ) | | | (1.53 | ) | | | (0.76 | ) | |
Total Distributions | | | (1.33 | ) | | | (1.59 | ) | | | (0.42 | ) | | | (1.55 | ) | | | (0.77 | ) | |
Net Asset Value, End of Period | | $ | 20.98 | | | $ | 21.45 | | | $ | 17.47 | | | $ | 17.40 | | | $ | 16.83 | | |
Total Return(4) | | | 3.74 | % | | | 32.06 | % | | | 2.82 | % | | | 12.56 | % | | | 7.43 | % | |
Ratios and Supplemental Data: | |
Net Assets, End of Period (Thousands) | | $ | 156,782 | | | $ | 54,002 | | | $ | 42,695 | | | $ | 24,718 | | | $ | 17,971 | | |
Ratio of Expenses to Average Net Assets(8) | | | 0.84 | %(5) | | | 0.84 | %(5) | | | 0.84 | %(5) | | | 0.86 | %(5)(6) | | | 1.04 | %(5) | |
Ratio of Net Investment Income (Loss) to Average Net Assets(8) | | | (0.02 | )%(5) | | | 0.02 | %(5) | | | 0.38 | %(5) | | | 0.06 | %(5) | | | 0.23 | %(5) | |
Ratio of Rebate from Morgan Stanley Affiliates to Average Net Assets | | | 0.01 | % | | | 0.01 | % | | | 0.01 | % | | | 0.00 | %(7) | | | 0.01 | % | |
Portfolio Turnover Rate | | | 79 | % | | | 65 | % | | | 79 | % | | | 51 | % | | | 31 | % | |
(8) Supplemental Information on the Ratios to Average Net Assets: | |
Ratios Before Expense Limitation: | |
Expenses to Average Net Assets | | | 1.01 | % | | | 1.09 | % | | | 1.15 | % | | | 1.49 | % | | | 1.78 | % | |
Net Investment Income (Loss) to Average Net Assets | | | (0.19 | )% | | | (0.23 | )% | | | 0.07 | % | | | (0.57 | )% | | | (0.51 | )% | |
(1) Reflects prior period Custodian out-of-pocket expenses that were reimbursed in September 2016. The amount of the reimbursement was immaterial on a per share basis and did not impact the total return of Class I shares. The Ratio of Expenses to Average Net Assets and the Ratio of Net Investment Income to Average Net Assets would be unchanged as the reimbursement of Custodian fees was offset against expense waivers/reimbursements with no impact to net expenses or net investment income.
(2) Per share amount is based on average shares outstanding.
(3) Amount is less than $0.005 per share.
(4) Calculated based on the net asset value as of the last business day of the period.
(5) The Ratios of Expenses and Net Investment Income (Loss) reflect the rebate of certain Fund expenses in connection with the investments in Morgan Stanley affiliates during the period. The effect of the rebate on the ratios is disclosed in the above table as "Ratio of Rebate from Morgan Stanley Affiliates to Average Net Assets."
(6) Effective January 23, 2015, the Adviser has agreed to limit the ratio of expenses to average net assets to the maximum ratio of 0.85% for Class I shares. Prior to January 23, 2015, the maximum ratio was 1.05% for Class I shares.
(7) Amount is less than 0.005%.
The accompanying notes are an integral part of the financial statements.
13
Morgan Stanley Institutional Fund, Inc.
Annual Report — December 31, 2018
Financial Highlights
Advantage Portfolio
| | | Class A | |
| | | Year Ended December 31, | |
Selected Per Share Data and Ratios | | 2018 | | 2017 | | 2016(1) | | 2015 | | 2014 | |
Net Asset Value, Beginning of Period | | $ | 21.10 | | | $ | 17.26 | | | $ | 17.22 | | | $ | 16.70 | | | $ | 16.34 | | |
Income (Loss) from Investment Operations: | |
Net Investment Income (Loss)(2) | | | (0.08 | ) | | | (0.06 | ) | | | 0.01 | | | | (0.06 | ) | | | (0.03 | ) | |
Net Realized and Unrealized Gain | | | 0.85 | | | | 5.49 | | | | 0.41 | | | | 2.11 | | | | 1.15 | | |
Total from Investment Operations | | | 0.77 | | | | 5.43 | | | | 0.42 | | | | 2.05 | | | | 1.12 | | |
Distributions from and/or in Excess of: | |
Net Realized Gain | | | (1.33 | ) | | | (1.59 | ) | | | (0.38 | ) | | | (1.53 | ) | | | (0.76 | ) | |
Net Asset Value, End of Period | | $ | 20.54 | | | $ | 21.10 | | | $ | 17.26 | | | $ | 17.22 | | | $ | 16.70 | | |
Total Return(3) | | | 3.37 | % | | | 31.64 | % | | | 2.47 | % | | | 12.20 | % | | | 7.05 | % | |
Ratios and Supplemental Data: | |
Net Assets, End of Period (Thousands) | | $ | 42,959 | | | $ | 23,715 | | | $ | 19,850 | | | $ | 11,939 | | | $ | 3,738 | | |
Ratio of Expenses to Average Net Assets(6) | | | 1.17 | %(4) | | | 1.19 | %(4) | | | 1.19 | %(4) | | | 1.18 | %(4)(5) | | | 1.39 | %(4) | |
Ratio of Net Investment Income (Loss) to Average Net Assets(6) | | | (0.37 | )%(4) | | | (0.32 | )%(4) | | | 0.04 | %(4) | | | (0.31 | )%(4) | | | (0.15 | )%(4) | |
Ratio of Rebate from Morgan Stanley Affiliates to Average Net Assets | | | 0.01 | % | | | 0.01 | % | | | 0.01 | % | | | 0.01 | % | | | 0.01 | % | |
Portfolio Turnover Rate | | | 79 | % | | | 65 | % | | | 79 | % | | | 51 | % | | | 31 | % | |
(6) Supplemental Information on the Ratios to Average Net Assets: | |
Ratios Before Expense Limitation: | |
Expenses to Average Net Assets | | | 1.29 | % | | | 1.39 | % | | | 1.43 | % | | | 1.87 | % | | | 2.14 | % | |
Net Investment Loss to Average Net Assets | | | (0.49 | )% | | | (0.52 | )% | | | (0.20 | )% | | | (1.00 | )% | | | (0.90 | )% | |
(1) Reflects prior period Custodian out-of-pocket expenses that were reimbursed in September 2016. The amount of the reimbursement was immaterial on a per share basis and did not impact the total return of Class A shares. The Ratio of Expenses to Average Net Assets and the Ratio of Net Investment Income to Average Net Assets would be unchanged as the reimbursement of Custodian fees was offset against expense waivers/reimbursements with no impact to net expenses or net investment income.
(2) Per share amount is based on average shares outstanding.
(3) Calculated based on the net asset value which does not reflect sales charges, if applicable, as of the last business day of the period.
(4) The Ratios of Expenses and Net Investment Income (Loss) reflect the rebate of certain Fund expenses in connection with the investments in Morgan Stanley affiliates during the period. The effect of the rebate on the ratios is disclosed in the above table as "Ratio of Rebate from Morgan Stanley Affiliates to Average Net Assets."
(5) Effective January 23, 2015, the Adviser has agreed to limit the ratio of expenses to average net assets to the maximum ratio of 1.20% for Class A shares. Prior to January 23, 2015, the maximum ratio was 1.40% for Class A shares.
The accompanying notes are an integral part of the financial statements.
14
Morgan Stanley Institutional Fund, Inc.
Annual Report — December 31, 2018
Financial Highlights
Advantage Portfolio
| | | Class L | |
| | | Year Ended December 31, | |
Selected Per Share Data and Ratios | | 2018 | | 2017 | | 2016(1) | | 2015 | | 2014 | |
Net Asset Value, Beginning of Period | | $ | 21.42 | | | $ | 17.46 | | | $ | 17.40 | | | $ | 16.82 | | | $ | 16.42 | | |
Income (Loss) from Investment Operations: | |
Net Investment Income (Loss)(2) | | | (0.05 | ) | | | (0.02 | ) | | | 0.04 | | | | (0.01 | ) | | | 0.02 | | |
Net Realized and Unrealized Gain | | | 0.88 | | | | 5.57 | | | | 0.43 | | | | 2.12 | | | | 1.14 | | |
Total from Investment Operations | | | 0.83 | | | | 5.55 | | | | 0.47 | | | | 2.11 | | | | 1.16 | | |
Distributions from and/or in Excess of: | |
Net Investment Income | | | — | | | | — | | | | (0.03 | ) | | | — | | | | (0.00 | )(3) | |
Net Realized Gain | | | (1.33 | ) | | | (1.59 | ) | | | (0.38 | ) | | | (1.53 | ) | | | (0.76 | ) | |
Total Distributions | | | (1.33 | ) | | | (1.59 | ) | | | (0.41 | ) | | | (1.53 | ) | | | (0.76 | ) | |
Net Asset Value, End of Period | | $ | 20.92 | | | $ | 21.42 | | | $ | 17.46 | | | $ | 17.40 | | | $ | 16.82 | | |
Total Return(4) | | | 3.61 | % | | | 31.96 | % | | | 2.72 | % | | | 12.47 | % | | | 7.28 | % | |
Ratios and Supplemental Data: | |
Net Assets, End of Period (Thousands) | | $ | 3,751 | | | $ | 4,077 | | | $ | 3,684 | | | $ | 5,369 | | | $ | 6,549 | | |
Ratio of Expenses to Average Net Assets(7) | | | 0.98 | %(5) | | | 0.96 | %(5) | | | 0.91 | %(5) | | | 0.97 | %(5)(6) | | | 1.18 | %(5) | |
Ratio of Net Investment Income (Loss) to Average Net Assets(7) | | | (0.21 | )%(5) | | | (0.10 | )%(5) | | | 0.26 | %(5) | | | (0.03 | )%(5) | | | 0.12 | %(5) | |
Ratio of Rebate from Morgan Stanley Affiliates to Average Net Assets | | | 0.01 | % | | | 0.01 | % | | | 0.01 | % | | | 0.01 | % | | | 0.01 | % | |
Portfolio Turnover Rate | | | 79 | % | | | 65 | % | | | 79 | % | | | 51 | % | | | 31 | % | |
(7) Supplemental Information on the Ratios to Average Net Assets: | |
Ratios Before Expense Limitation: | |
Expenses to Average Net Assets | | | 1.82 | % | | | 1.87 | % | | | 1.85 | % | | | 2.33 | % | | | 2.64 | % | |
Net Investment Loss to Average Net Assets | | | (1.05 | )% | | | (1.01 | )% | | | (0.68 | )% | | | (1.39 | )% | | | (1.34 | )% | |
(1) Reflects prior period Custodian out-of-pocket expenses that were reimbursed in September 2016. The amount of the reimbursement was immaterial on a per share basis and did not impact the total return of Class L shares. The Ratio of Expenses to Average Net Assets and the Ratio of Net Investment Income to Average Net Assets would be unchanged as the reimbursement of Custodian fees was offset against expense waivers/reimbursements with no impact to net expenses or net investment income.
(2) Per share amount is based on average shares outstanding.
(3) Amount is less than $0.005 per share.
(4) Calculated based on the net asset value as of the last business day of the period.
(5) The Ratios of Expenses and Net Investment Income (Loss) reflect the rebate of certain Fund expenses in connection with the investments in Morgan Stanley affiliates during the period. The effect of the rebate on the ratios is disclosed in the above table as "Ratio of Rebate from Morgan Stanley Affiliates to Average Net Assets."
(6) Effective January 23, 2015, the Adviser has agreed to limit the ratio of expenses to average net assets to the maximum ratio of 0.99% for Class L shares. Prior to January 23, 2015, the maximum ratio was 1.19% for Class L shares.
The accompanying notes are an integral part of the financial statements.
15
Morgan Stanley Institutional Fund, Inc.
Annual Report — December 31, 2018
Financial Highlights
Advantage Portfolio
| | | Class C | |
| | | Year Ended December 31, | | Period from
April 30, 2015(2) to | |
Selected Per Share Data and Ratios | | 2018 | | 2017 | | 2016(1) | | December 31, 2015 | |
Net Asset Value, Beginning of Period | | $ | 20.82 | | | $ | 17.16 | | | $ | 17.25 | | | $ | 18.08 | | |
Income (Loss) from Investment Operations: | |
Net Investment Loss(3) | | | (0.24 | ) | | | (0.20 | ) | | | (0.12 | ) | | | (0.14 | ) | |
Net Realized and Unrealized Gain | | | 0.85 | | | | 5.45 | | | | 0.41 | | | | 0.86 | | |
Total from Investment Operations | | | 0.61 | | | | 5.25 | | | | 0.29 | | | | 0.72 | | |
Distributions from and/or in Excess of: | |
Net Investment Income | | | — | | | | — | | | | — | | | | (0.02 | ) | |
Net Realized Gain | | | (1.33 | ) | | | (1.59 | ) | | | (0.38 | ) | | | (1.53 | ) | |
Total Distributions | | | (1.33 | ) | | | (1.59 | ) | | | (0.38 | ) | | | (1.55 | ) | |
Net Asset Value, End of Period | | $ | 20.10 | | | $ | 20.82 | | | $ | 17.16 | | | $ | 17.25 | | |
Total Return(4) | | | 2.64 | % | | | 30.77 | % | | | 1.71 | % | | | 3.91 | %(6) | |
Ratios and Supplemental Data: | |
Net Assets, End of Period (Thousands) | | $ | 32,706 | | | $ | 11,835 | | | $ | 6,376 | | | $ | 1,776 | | |
Ratio of Expenses to Average Net Assets(8) | | | 1.88 | %(5) | | | 1.90 | %(5) | | | 1.94 | %(5) | | | 1.94 | %(5)(7) | |
Ratio of Net Investment Loss to Average Net Assets(8) | | | (1.08 | )%(5) | | | (1.01 | )%(5) | | | (0.72 | )%(5) | | | (1.15 | )%(5)(7) | |
Ratio of Rebate from Morgan Stanley Affiliates to Average Net Assets | | | 0.01 | % | | | 0.01 | % | | | 0.01 | % | | | 0.01 | %(7) | |
Portfolio Turnover Rate | | | 79 | % | | | 65 | % | | | 79 | % | | | 51 | % | |
(8) Supplemental Information on the Ratios to Average Net Assets: | |
Ratios Before Expense Limitation: | |
Expenses to Average Net Assets | | | 2.00 | % | | | 2.10 | % | | | 2.20 | % | | | 2.83 | %(7) | |
Net Investment Loss to Average Net Assets | | | (1.20 | )% | | | (1.21 | )% | | | (0.98 | )% | | | (2.04 | )%(7) | |
(1) Reflects prior period Custodian out-of-pocket expenses that were reimbursed in September 2016. The amount of the reimbursement was immaterial on a per share basis and did not impact the total return of Class C shares. The Ratio of Expenses to Average Net Assets and the Ratio of Net Investment Loss to Average Net Assets would be unchanged as the reimbursement of Custodian fees was offset against expense waivers/reimbursements with no impact to net expenses or net investment loss.
(2) Commencement of Offering.
(3) Per share amount is based on average shares outstanding.
(4) Calculated based on the net asset value which does not reflect sales charges, if applicable, as of the last business day of the period.
(5) The Ratios of Expenses and Net Investment Loss reflect the rebate of certain Fund expenses in connection with the investments in Morgan Stanley affiliates during the period. The effect of the rebate on the ratios is disclosed in the above table as "Ratio of Rebate from Morgan Stanley Affiliates to Average Net Assets."
(6) Not annualized.
(7) Annualized.
The accompanying notes are an integral part of the financial statements.
16
Morgan Stanley Institutional Fund, Inc.
Annual Report — December 31, 2018
Financial Highlights
Advantage Portfolio
| | | Class IS | |
| | | Year Ended December 31, | |
Selected Per Share Data and Ratios | | 2018 | | 2017 | | 2016(1) | | 2015 | | 2014 | |
Net Asset Value, Beginning of Period | | $ | 21.49 | | | $ | 17.48 | | | $ | 17.42 | | | $ | 16.84 | | | $ | 16.41 | | |
Income (Loss) from Investment Operations: | |
Net Investment Income (Loss)(2) | | | (0.01 | ) | | | 0.01 | | | | 0.08 | | | | 0.02 | | | | 0.04 | | |
Net Realized and Unrealized Gain | | | 0.87 | | | | 5.59 | | | | 0.41 | | | | 2.11 | | | | 1.16 | | |
Total from Investment Operations | | | 0.86 | | | | 5.60 | | | | 0.49 | | | | 2.13 | | | | 1.20 | | |
Distributions from and/or in Excess of: | |
Net Investment Income | | | — | | | | — | | | | (0.05 | ) | | | (0.02 | ) | | | (0.01 | ) | |
Net Realized Gain | | | (1.33 | ) | | | (1.59 | ) | | | (0.38 | ) | | | (1.53 | ) | | | (0.76 | ) | |
Total Distributions | | | (1.33 | ) | | | (1.59 | ) | | | (0.43 | ) | | | (1.55 | ) | | | (0.77 | ) | |
Net Asset Value, End of Period | | $ | 21.02 | | | $ | 21.49 | | | $ | 17.48 | | | $ | 17.42 | | | $ | 16.84 | | |
Total Return(3) | | | 3.74 | % | | | 32.22 | % | | | 2.79 | % | | | 12.65 | % | | | 7.50 | % | |
Ratios and Supplemental Data: | |
Net Assets, End of Period (Thousands) | | $ | 26,601 | | | $ | 17,542 | | | $ | 13,273 | | | $ | 12 | | | $ | 12 | | |
Ratio of Expenses to Average Net Assets(7) | | | 0.80 | %(4) | | | 0.80 | %(4) | | | 0.80 | %(4) | | | 0.82 | %(4)(5) | | | 1.00 | %(4) | |
Ratio of Net Investment Income (Loss) to Average Net Assets(7) | | | (0.04 | )%(4) | | | 0.07 | %(4) | | | 0.46 | %(4) | | | 0.10 | %(4) | | | 0.26 | %(4) | |
Ratio of Rebate from Morgan Stanley Affiliates to Average Net Assets | | | 0.01 | % | | | 0.01 | % | | | 0.01 | % | | | 0.00 | %(6) | | | 0.01 | % | |
Portfolio Turnover Rate | | | 79 | % | | | 65 | % | | | 79 | % | | | 51 | % | | | 31 | % | |
(7) Supplemental Information on the Ratios to Average Net Assets: | |
Ratios Before Expense Limitation: | |
Expenses to Average Net Assets | | | 0.93 | % | | | 1.01 | % | | | 1.05 | % | | | 14.53 | % | | | 18.84 | % | |
Net Investment Income (Loss) to Average Net Assets | | | (0.17 | )% | | | (0.14 | )% | | | 0.21 | % | | | (13.61 | )% | | | (17.58 | )% | |
(1) Reflects prior period Custodian out-of-pocket expenses that were reimbursed in September 2016. The amount of the reimbursement was immaterial on a per share basis and did not impact the total return of Class IS shares. The Ratio of Expenses to Average Net Assets and the Ratio of Net Investment Income to Average Net Assets would be unchanged as the reimbursement of Custodian fees was offset against expense waivers/reimbursements with no impact to net expenses or net investment income.
(2) Per share amount is based on average shares outstanding.
(3) Calculated based on the net asset value as of the last business day of the period.
(4) The Ratios of Expenses and Net Investment Income (Loss) reflect the rebate of certain Fund expenses in connection with the investments in Morgan Stanley affiliates during the period. The effect of the rebate on the ratios is disclosed in the above table as "Ratio of Rebate from Morgan Stanley Affiliates to Average Net Assets."
(5) Effective January 23, 2015, the Adviser has agreed to limit the ratio of expenses to average net assets to the maximum ratio of 0.81% for Class IS shares. Prior to January 23, 2015, the maximum ratio was 1.01% for Class IS shares.
(6) Amount is less than 0.005%.
The accompanying notes are an integral part of the financial statements.
17
Morgan Stanley Institutional Fund, Inc.
Annual Report — December 31, 2018
Notes to Financial Statements
Morgan Stanley Institutional Fund, Inc. (the "Company") is registered under the Investment Company Act of 1940, as amended (the "Act"), as an open-end management investment company. The Company is comprised of thirty separate, active, diversified and non-diversified funds (individually referred to as a "Fund", collectively as the "Funds"). The Company applies investment company accounting and reporting guidance.
The accompanying financial statements relate to the Advantage Portfolio. The Fund seeks long-term capital appreciation.
The Fund offers five classes of shares — Class I, Class A, Class L, Class C and Class IS. On April 30, 2015, the Fund suspended offering of Class L shares. Existing Class L shareholders may invest through reinvestment of dividends and distributions.
On November 16, 2018, the Fund acquired the net assets of the Company's Insight Portfolio ("Insight"), an open-end investment company. Based on the respective valuations as of the close of business on November 16, 2018, pursuant to a Plan of Reorganization approved by the shareholders of Insight on October 17, 2018 ("Reorganization"). The purpose of the transaction was to combine two portfolios managed by Morgan Stanley Investment Management Inc., (the "Adviser") with comparable investment objectives and strategies. The acquisition was accomplished by a tax-free exchange of 3,393,240 Class I shares of the Fund at a net asset value ("NAV") of $21.96 for 4,949,201 Class I shares of Insight; 597,044 Class A shares of the Fund at a NAV of $21.51 for 860,147 Class A shares of Insight; 4,867 Class L shares of the Fund at a NAV of $21.90 for 7,388 Class L shares of Insight; 469,147 Class C shares of the Fund at a NAV of $21.07 for 691,884 Class C shares of Insight. The net assets of Insight before the Reorganization were approximately $97,349,000, including unrealized appreciation (depreciation) of approximately $(29,000) at November 16, 2018. The investment portfolio of Insight, with a fair value of approximately $97,367,000 and identified cost of approximately $97,396,000, on November 16, 2018, was the principal asset acquired by the Fund. For financial reporting purposes, assets received and shares issued by the Fund were recorded at fair value; however, the cost basis of the investments received from Insight was carried forward to align ongoing reporting of the Fund's realized and unrealized gains and losses with amounts distributable to shareholders for tax purposes. Immediately prior to the Reorganization, the net assets of the Fund were approximately $160,556,000. Immediately after the Reorganization, the net assets of the Fund were approximately $257,906,000.
Upon closing of the Reorganization, shareholders of Insight received shares of the Fund as follows:
| Insight Portfolio | | Advantage Portfolio | |
| Class I | | Class I | |
| Class A | | Class A | |
| Class L | | Class L | |
| Class C | | Class C | |
Assuming the acquisition had been completed on January 1, 2018, the beginning of the annual reporting period of the Fund, the Fund's pro-forma results of operations for the year ended December 31, 2018, are approximately as follows:
Net investment income(1) | | $ | 1,964,000 | | |
Net realized gain and unrealized gain(2) | | $ | 861,000 | | |
Net increase in net assets resulting
from operations | | $ | 2,825,000 | | |
(1) Approximately $(339,000) as reported, plus approximately $1,183,000 Insight prior to the Reorganization, plus approximately $1,120,000 of estimated pro-forma eliminated expenses.
(2) Approximately $(3,859,000) as reported, plus approximately $4,720,000 Insight prior to the Reorganization.
Because the combined investment portfolios have been managed as a single integrated portfolio since the acquisition was completed, it is not practicable to separate the amounts of revenue and earnings of Insight that have been included in the Fund's Statement of Operations since November 16, 2018.
A. Significant Accounting Policies: The following significant accounting policies are in conformity with U.S. generally accepted accounting principles ("GAAP"). Such policies are consistently followed by the Company in the preparation of its financial statements. GAAP may require management to make estimates and assumptions that affect the reported amounts and disclosures in the financial statements. Actual results may differ from those estimates.
In August 2018, the Financial Accounting Standards Board ("FASB") issued Accounting Standards Update ("ASU") 2018-13, Fair Value Measurement (Topic 820) — Disclosures Framework — Changes to Disclosure Requirements of Fair Value Measurement ("ASU 2018-13") which introduces new fair value disclosure requirements as well as eliminates and modifies certain existing fair value disclosure requirements. ASU 2018-13 would be effective for fiscal years beginning after December 15, 2019 and for interim periods within those fiscal years; however, management has elected to early adopt ASU 2018-13 effective with the current reporting period as permitted by the standard. The impact of the Fund's adoption was limited to changes in the Fund's financial statement disclosures regarding fair value, primarily those disclosures related to transfers between levels of the fair value hierarchy and
18
Morgan Stanley Institutional Fund, Inc.
Annual Report — December 31, 2018
Notes to Financial Statements (cont'd)
disclosure of the range and weighted average used to develop significant unobservable inputs for Level 3 fair value measurements, when applicable.
1. Security Valuation: (1) An equity portfolio security listed or traded on an exchange is valued at its latest reported sales price (or at the exchange official closing price if such exchange reports an official closing price), and if there were no sales on a given day and if there is no official exchange closing price for that day, the security is valued at the mean between the last reported bid and asked prices if such bid and asked prices are available on the relevant exchanges. Listed equity securities not traded on the valuation date with no reported bid and asked prices available on the exchange are valued at the mean between the current bid and asked prices obtained from one or more reputable brokers or dealers. In cases where a security is traded on more than one exchange, the security is valued on the exchange designated as the primary market; (2) all other equity portfolio securities for which over-the-counter ("OTC") market quotations are readily available are valued at the latest reported sales price (or at the market official closing price if such market reports an official closing price), and if there was no trading in the security on a given day and if there is no official closing price from relevant markets for that day, the security is valued at the mean between the last reported bid and asked prices if such bid and asked prices are available on the relevant markets. An unlisted equity security that does not trade on the valuation date and for which bid and asked prices from the relevant markets are unavailable is valued at the mean between the current bid and asked prices obtained from one or more reputable brokers or dealers; (3) listed options are valued at the last reported sales price on the exchange on which they are listed (or at the exchange official closing price if such exchange reports an official closing price). If an official closing price or last reported sales price is unavailable, the listed option should be fair valued at the mean between its latest bid and ask prices. Unlisted options are valued at the mean between their latest bid and ask prices from a broker/dealer or valued by a pricing service/vendor; (4) certain portfolio securities may be valued by an outside pricing service/vendor approved by the Company's Board of Directors (the "Directors"). The pricing service/vendor may employ a pricing model that takes into account, among other things, bids, yield spreads and/or other market data and specific security characteristics. Alternatively, if a valuation is not available from an
outside pricing service/vendor, and the security trades on an exchange, the security may be valued at its latest reported sale price (or at the exchange official closing price if such exchange reports an official closing price), prior to the time when assets are valued. If there are no sales on a given day and if there is no official exchange closing price for that day, the security is valued at the mean between the last reported bid and asked prices if such bid and asked prices are available in the relevant exchanges; (5) when market quotations are not readily available, including circumstances under which the Adviser determines that the closing price, last sale price or the mean between the last reported bid and asked prices are not reflective of a security's market value, portfolio securities are valued at their fair value as determined in good faith under procedures established by and under the general supervision of the Directors. Occasionally, developments affecting the closing prices of securities and other assets may occur between the times at which valuations of such securities are determined (that is, close of the foreign market on which the securities trade) and the close of business of the New York Stock Exchange ("NYSE"). If developments occur during such periods that are expected to materially affect the value of such securities, such valuations may be adjusted to reflect the estimated fair value of such securities as of the close of the NYSE, as determined in good faith by the Directors or by the Adviser using a pricing service and/or procedures approved by the Directors; (6) quotations of foreign portfolio securities, other assets and liabilities and forward contracts stated in foreign currency are translated into U.S. dollar equivalents at the prevailing market rates prior to the close of the NYSE; and (7) investments in mutual funds, including the Morgan Stanley Institutional Liquidity Funds, are valued at the NAV as of the close of each business day.
The Directors have responsibility for determining in good faith the fair value of the investments, and the Directors may appoint others, such as the Company's Adviser or a valuation committee, to assist the Directors in determining fair value and to make the actual calculations pursuant to the fair valuation methodologies previously approved by the Directors. Under procedures approved by the Directors, the Company's Adviser has formed a Valuation Committee whose members are approved by the Directors. The Valuation Committee provides administration and oversight of the Company's valuation policies and procedures, which are reviewed at
19
Morgan Stanley Institutional Fund, Inc.
Annual Report — December 31, 2018
Notes to Financial Statements (cont'd)
least annually by the Directors. These procedures allow the Company to utilize independent pricing services, quotations from securities and financial instrument dealers and other market sources to determine fair value.
2. Fair Value Measurement: FASB Accounting Standards CodificationTM ("ASC") 820, "Fair Value Measurement" ("ASC 820"), defines fair value as the value that the Fund would receive to sell an investment or pay to transfer a liability in a timely transaction with an independent buyer in the principal market, or in the absence of a principal market, the most advantageous market for the investment or liability. ASC 820 establishes a three-tier hierarchy to distinguish between (1) inputs that reflect the assumptions market participants would use in valuing an asset or liability developed based on market data obtained from sources independent of the reporting entity (observable inputs) and (2) inputs that reflect the reporting entity's own assumptions about the assumptions market participants would use in valuing an asset or liability developed based on the best information available in the circumstances (unobservable inputs) and to establish classification of fair value measurements for disclosure purposes. Various inputs are used in determining the value of the Fund's investments. The inputs are summarized in the three broad levels listed below:
• Level 1 – unadjusted quoted prices in active markets for identical investments
• Level 2 – other significant observable inputs (including quoted prices for similar investments, interest rates, prepayment speeds, credit risk, etc.)
• Level 3 – significant unobservable inputs including the Fund's own assumptions in determining the fair value of investments. Factors considered in making this determination may include, but are not limited to, information obtained by contacting the issuer, analysts, or the appropriate stock exchange (for exchange-traded securities), analysis of the issuer's financial statements or other available documents and, if necessary, available information concerning other securities in similar circumstances
The inputs or methodology used for valuing securities are not necessarily an indication of the risk associated
with investing in those securities and the determination of the significance of a particular input to the fair value measurement in its entirety requires judgment and considers factors specific to each security.
The following is a summary of the inputs used to value the Fund's investments as of December 31, 2018:
Investment Type | | Level 1
Unadjusted
quoted
prices
(000) | | Level 2
Other
significant
observable
inputs
(000) | | Level 3
Significant
unobservable
inputs
(000) | | Total
(000) | |
Assets: | |
Common Stocks | |
Aerospace & Defense | | $ | 3,291 | | | $ | — | | | $ | — | | | $ | 3,291 | | |
Capital Markets | | | 7,642 | | | | — | | | | — | | | | 7,642 | | |
Chemicals | | | 7,666 | | | | — | | | | — | | | | 7,666 | | |
Commercial
Services & Supplies | | | 11,229 | | | | — | | | | — | | | | 11,229 | | |
Construction Materials | | | 3,621 | | | | — | | | | — | | | | 3,621 | | |
Entertainment | | | 10,504 | | | | — | | | | — | | | | 10,504 | | |
Health Care
Equipment & Supplies | | | 16,714 | | | | — | | | | — | | | | 16,714 | | |
Health Care
Providers & Services | | | 8,763 | | | | — | | | | — | | | | 8,763 | | |
Hotels, Restaurants &
Leisure | | | 12,391 | | | | — | | | | — | | | | 12,391 | | |
Interactive Media &
Services | | | 38,016 | | | | — | | | | — | | | | 38,016 | | |
Internet & Direct
Marketing Retail | | | 29,569 | | | | — | | | | — | | | | 29,569 | | |
Machinery | | | 3,634 | | | | — | | | | — | | | | 3,634 | | |
Pharmaceuticals | | | 13,297 | | | | — | | | | — | | | | 13,297 | | |
Road & Rail | | | 16,784 | | | | — | | | | — | | | | 16,784 | | |
Software | | | 57,988 | | | | — | | | | — | | | | 57,988 | | |
Textiles, Apparel &
Luxury Goods | | | — | | | | 8,837 | | | | — | | | | 8,837 | | |
Total Common Stocks | | | 241,109 | | | | 8,837 | | | | — | | | | 249,946 | | |
Call Options Purchased | | | — | | | | 136 | | | | — | | | | 136 | | |
Short-Term Investment | |
Investment Company | | | 18,432 | | | | — | | | | — | | | | 18,432 | | |
Total Assets | | $ | 259,541 | | | $ | 8,973 | | | $ | — | | | $ | 268,514 | | |
Transfers between investment levels may occur as the markets fluctuate and/or the availability of data used in an investment's valuation changes.
3. Foreign Currency Translation and Foreign Investments: The books and records of the Fund are maintained in U.S. dollars. Foreign currency amounts are translated into U.S. dollars as follows:
– investments, other assets and liabilities at the prevailing rate of exchange on the valuation date;
– investment transactions and investment income at the prevailing rates of exchange on the dates of such transactions.
20
Morgan Stanley Institutional Fund, Inc.
Annual Report — December 31, 2018
Notes to Financial Statements (cont'd)
Although the net assets of the Fund are presented at the foreign exchange rates and market values at the close of the period, the Fund does not isolate that portion of the results of operations arising as a result of changes in the foreign exchange rates from the fluctuations arising from changes in the market prices of securities held at period end. Similarly, the Fund does not isolate the effect of changes in foreign exchange rates from the fluctuations arising from changes in the market prices of securities sold during the period. Accordingly, realized and unrealized foreign currency gains (losses) on investments in securities are included in the reported net realized and unrealized gains (losses) on investment transactions and balances. However, pursuant to U.S. federal income tax regulations, gains and losses from certain foreign currency transactions and the foreign currency portion of gains and losses realized on sales and maturities of foreign denominated debt securities are treated as ordinary income for U.S. federal income tax purposes.
Net realized gains (losses) on foreign currency transactions represent net foreign exchange gains (losses) from foreign currency forward exchange contracts, disposition of foreign currencies, currency gains (losses) realized between the trade and settlement dates on securities transactions, and the difference between the amount of investment income and foreign withholding taxes recorded on the Fund's books and the U.S. dollar equivalent amounts actually received or paid. Net unrealized currency gains (losses) from valuing foreign currency denominated assets and liabilities at period end exchange rates are reflected as a component of unrealized appreciation (depreciation) in the Statement of Assets and Liabilities. The change in unrealized currency gains (losses) on foreign currency translations for the period is reflected in the Statement of Operations.
Foreign security and currency transactions may involve certain considerations and risks not typically associated with those of U.S. dollar denominated transactions as a result of, among other factors, fluctuations of exchange rates in relation to the U.S. dollar, the possibility of lower levels of governmental supervision and regulation of foreign securities markets and the possibility of political or economic instability.
Governmental approval for foreign investments may be required in advance of making an investment under
certain circumstances in some countries, and the extent of foreign investments in domestic companies may be subject to limitation in other countries. Foreign ownership limitations also may be imposed by the charters of individual companies to prevent, among other concerns, violations of foreign investment limitations. As a result, an additional class of shares (identified as "Foreign" in the Portfolio of Investments) may be created and offered for investment. The "local" and "foreign shares" market values may differ. In the absence of trading of the foreign shares in such markets, the Fund values the foreign shares at the closing exchange price of the local shares.
4. Derivatives: The Fund may, but is not required to, use derivative instruments for a variety of purposes, including hedging, risk management, portfolio management or to earn income. Derivatives are financial instruments whose value is based, in part, on the value of an underlying asset, interest rate, index or financial instrument. Prevailing interest rates and volatility levels, among other things, also affect the value of derivative instruments. A derivative instrument often has risks similar to its underlying asset and may have additional risks, including imperfect correlation between the value of the derivative and the underlying asset, risks of default by the counterparty to certain transactions, magnification of losses incurred due to changes in the market value of the securities, instruments, indices or interest rates to which the derivative instrument relates, risks that the transactions may not be liquid and risks arising from margin requirements. The use of derivatives involves risks that are different from, and possibly greater than, the risks associated with other portfolio investments. Derivatives may involve the use of highly specialized instruments that require investment techniques and risk analyses different from those associated with other portfolio investments. All of the Fund's holdings, including derivative instruments, are marked-to-market each day with the change in value reflected in unrealized appreciation (depreciation). Upon disposition, a realized gain or loss is recognized.
Certain derivative transactions may give rise to a form of leverage. Leverage magnifies the potential for gain and the risk of loss. Leverage associated with derivative transactions may cause the Fund to liquidate portfolio positions when it may not be advantageous to do so to satisfy its obligations or to meet earmarking or segregation requirements, pursuant to applicable Securities and Exchange Commission ("SEC") rules and regulations, or
21
Morgan Stanley Institutional Fund, Inc.
Annual Report — December 31, 2018
Notes to Financial Statements (cont'd)
may cause the Fund to be more volatile than if the Fund had not been leveraged. Although the Adviser seeks to use derivatives to further the Fund's investment objectives, there is no assurance that the use of derivatives will achieve this result.
Following is a description of the derivative instruments and techniques that the Fund used during the period and their associated risks:
Options: With respect to options, the Fund is subject to equity risk, interest rate risk and foreign currency exchange risk in the normal course of pursuing its investment objectives. If the Fund buys an option, it buys a legal contract giving it the right to buy or sell a specific amount of the underlying instrument or foreign currency, or futures contract on the underlying instrument or foreign currency, at an agreed-upon price during a period of time or on a specified date typically in exchange for a premium paid by the Fund. The Fund may purchase and/or sell put and call options. Purchasing call options tends to increase the Fund's exposure to the underlying (or similar) instrument. Purchasing put options tends to decrease the Fund's exposure to the underlying (or similar) instrument. When entering into purchased option contracts, the Fund bears the risk of interest or exchange rates or securities prices moving unexpectedly, in which case, the Fund may not achieve the anticipated benefits of the purchased option contracts; however the risk of loss is limited to the premium paid. Purchased options are reported as part of "Total Investments in Securities" in the Statement of Assets and Liabilities. Premiums paid for purchasing options which expired are treated as realized losses. If the Fund sells an option, it sells to another party the right to buy from or sell to the Fund a specific amount of the underlying instrument or foreign currency, or futures contract on the underlying instrument or foreign currency, at an agreed-upon price during a period of time or on a specified date typically in exchange for a premium received by the Fund. When options are purchased OTC, the Fund bears the risk that the counterparty that wrote the option will be unable or unwilling to perform its obligations under the option contract. Options may also be illiquid and the Fund may have difficulty closing out its position. A decision as to whether, when and how to
use options involves the exercise of skill and judgment and even a well-conceived option transaction may be unsuccessful because of market behavior or unexpected events. The prices of options can be highly volatile and the use of options can lower total returns.
FASB ASC 815, "Derivatives and Hedging" ("ASC 815"), is intended to improve financial reporting about derivative instruments by requiring enhanced disclosures to enable investors to better understand how and why the Fund uses derivative instruments, how these derivative instruments are accounted for and their effects on the Fund's financial position and results of operations.
The following table sets forth the fair value of the Fund's derivative contracts by primary risk exposure as of December 31, 2018:
| | | Asset Derivatives
Statement of Assets and
Liabilities Location | | Primary Risk
Exposure | | Value
(000) | |
Purchased Options
| | Investments, at Value
(Purchased Options) | | Currency Risk | | $ | 136 | (a) | |
(a) Amounts are included in Investments in Securities in the Statement of Assets and Liabilities.
The following tables set forth by primary risk exposure the Fund's realized gains (losses) and change in unrealized appreciation (depreciation) by type of derivative contract for the year ended December 31, 2018 in accordance with ASC 815:
Realized Gain (Loss) | |
Primary Risk Exposure | | Derivative Type | | Value
(000) | |
Currency Risk
| | Investments
(Purchased Options) | | $ | (208 | )(b) | |
(b) Amounts are included in Investments Sold in the Statement of Operations.
Change in Unrealized Appreciation (Depreciation) | |
Primary Risk Exposure | | Derivative Type | | Value
(000) | |
Currency Risk | | Investments
(Purchased Options) | | $ | (298 | )(c) | |
(c) Amounts are included in Investments in the Statement of Operations.
22
Morgan Stanley Institutional Fund, Inc.
Annual Report — December 31, 2018
Notes to Financial Statements (cont'd)
At December 31, 2018, the Fund's derivative assets and liabilities are as follows:
Gross Amounts of Assets and Liabilities
Presented in the Statement of Assets and Liabilities | |
Derivatives | | Assets(d)
(000) | | Liabilities(d)
(000) | |
Purchased Options | | $ | 136 | (a) | | $ | — | | |
(a) Amounts are included in Investments in Securities in the Statement of Assets and Liabilities.
(d) Absent an event of default or early termination, OTC derivative assets and liabilities are presented gross and not offset in the Statement of Assets and Liabilities.
The Fund typically enters into International Swaps and Derivatives Association, Inc. Master Agreements ("ISDA Master Agreements") or similar master agreements (collectively, "Master Agreements") with its contract counterparties for certain OTC derivatives in order to, among other things, reduce its credit risk to counterparties. ISDA Master Agreements include provisions for general obligations, representations, collateral and events of default or termination. Under an ISDA Master Agreement, the Fund typically may offset with the counterparty certain OTC derivative financial instruments' payables and/or receivables with collateral held and/or posted and create one single net payment (close-out netting) in the event of default, termination and/or potential deterioration in the credit quality of the counterparty. Various Master Agreements govern the terms of certain transactions with counterparties, including transactions such as swap, forward, repurchase and reverse repurchase agreements. These Master Agreements typically attempt to reduce the counterparty risk associated with such transactions by specifying credit protection mechanisms and providing standardization that improves legal certainty. Cross-termination provisions under Master Agreements typically provide that a default in connection with one transaction between the Fund and a counterparty gives the non-defaulting party the right to terminate any other transactions in place with the defaulting party to create one single net payment due to/due from the defaulting party and may be a feature in certain Master Agreements. In the event the Fund exercises its right to terminate a Master Agreement after a counterparty experiences a termination event as defined in the Master Agreement, the return of collateral with market value in excess of the Fund's net liability may be delayed or denied.
The following table presents derivative financial instruments that are subject to enforceable netting arrangements as of December 31, 2018:
Gross Amounts Not Offset in the Statement of Assets and Liabilities | |
Counterparty | | Gross Asset
Derivatives
Presented in
the Statement of
Assets and
Liabilities
(000) | | Financial
Instrument
(000) | | Collateral
Received(e)
(000) | | Net Amount
(not less
than $0)
(000) | |
Royal Bank of Scotland | | $ | 136 | (a) | | $ | — | | | $ | (136 | ) | | $ | 0 | | |
(a) Amounts are included in Investments in Securities in the Statement of Assets and Liabilities.
(e) In some instances, the actual collateral received may be more than the amount shown here due to overcollateralization.
For the year ended December 31, 2018, the approximate average monthly amount outstanding for each derivative type is as follows:
Purchased Options: | |
Average monthly notional amount | | | 86,101,000 | | |
5. Indemnifications: The Company enters into contracts that contain a variety of indemnifications. The Company's maximum exposure under these arrangements is unknown. However, the Company has not had prior claims or losses pursuant to these contracts and expects the risk of loss to be remote.
6. Dividends and Distributions to Shareholders: Dividends and distributions to shareholders are recorded on the ex-dividend date. Dividends from net investment income, if any, are declared and paid annually. Net realized capital gains, if any, are distributed at least annually.
7. Security Transactions, Income and Expenses: Security transactions are accounted for on the trade date (date the order to buy or sell is executed). Realized gains and losses on the sale of investment securities are determined on the specific identified cost method. Dividend income and other distributions are recorded on the ex-dividend date (except for certain foreign dividends which may be recorded as soon as the Fund is informed of such dividends) net of applicable withholding taxes. Interest income is recognized on the accrual basis except where collection is in doubt. Discounts are accreted and premiums are amortized over the life of the respective securities. Most expenses of the Company can be directly attributed to a particular Fund. Expenses which cannot be directly attributed are apportioned among the Funds based upon
23
Morgan Stanley Institutional Fund, Inc.
Annual Report — December 31, 2018
Notes to Financial Statements (cont'd)
relative net assets or other appropriate methods. Income, expenses (other than class specific expenses — distribution and shareholder services, transfer agency and sub transfer agency fees) and realized and unrealized gains or losses are allocated to each class of shares based upon their relative net assets.
B. Advisory Fees: The Adviser, a wholly-owned subsidiary of Morgan Stanley, provides the Fund with advisory services under the terms of an Investment Advisory Agreement, paid quarterly, at the annual rate based on the daily net assets as follows:
First $750
million | | Next $750
million | | Over $1.5
billion | |
| | 0.65 | % | | | 0.60 | % | | | 0.55 | % | |
For the year ended December 31, 2018, the advisory fee rate (net of waiver/rebate) was equivalent to an annual effective rate of 0.53% of the Fund's average daily net assets.
The Adviser has agreed to reduce its advisory fee and/or reimburse the Fund so that total annual portfolio operating expenses, excluding certain investment related expenses, taxes, interest and other extraordinary expenses (including litigation), will not exceed 0.85% for Class I shares, 1.20% for Class A shares, 0.99% for Class L shares, 1.95% for Class C shares and 0.81% for Class IS shares. The fee waivers and/or expense reimbursements will continue for at least one year from the date of the Fund's prospectus or until such time as the Directors act to discontinue all or a portion of such waivers and/or reimbursements when they deem such action is appropriate. For the year ended December 31, 2018, approximately $167,000 of advisory fees were waived and approximately $42,000 of other expenses were reimbursed by the Adviser pursuant to this arrangement.
C. Administration Fees: The Adviser also serves as Administrator to the Company and provides administrative services pursuant to an Administration Agreement for an annual fee, accrued daily and paid monthly, of 0.08% of the Fund's average daily net assets.
Under a Sub-Administration Agreement between the Administrator and State Street Bank and Trust Company ("State Street"), State Street provides certain administrative services to the Company. For such services, the Administrator pays State Street a portion of the fee the Administrator receives from the Fund.
D. Distribution and Shareholder Services Fees: Morgan Stanley Distribution, Inc. ("MSDI" or the "Distributor"), a wholly-owned subsidiary of the Adviser and an indirect subsidiary of Morgan Stanley, serves as the Company's Distributor of Fund shares pursuant to a Distribution Agreement. The Company has adopted a Shareholder Services Plan with respect to Class A shares pursuant to Rule 12b-1 under the Act. Under the Shareholder Services Plan, the Fund pays the Distributor a shareholder services fee, accrued daily and paid monthly, at an annual rate of 0.25% of the Fund's average daily net assets attributable to Class A shares.
The Company has adopted a Distribution and Shareholder Services Plan with respect to Class L shares pursuant to Rule 12b-1 under the Act. Under the Distribution and Shareholder Services Plan, the Fund pays the Distributor a distribution fee, accrued daily and paid monthly, at an annual rate of 0.50% and a shareholder services fee, accrued daily and paid monthly, at an annual rate of 0.25% of the Fund's average daily net assets attributable to Class L shares. The Distributor has agreed to waive for at least one year from the date of the Fund's prospectus, the 12b-1 fees on Class L shares of the Fund to the extent it exceeds 0.04% of the average daily net assets of such shares on an annualized basis. For the year ended December 31, 2018, this waiver amounted to approximately $30,000.
The Company has adopted a Distribution and Shareholder Services Plan with respect to Class C shares pursuant to Rule 12b-1 under the Act. Under the Distribution and Shareholder Services Plan, the Fund pays the Distributor a distribution fee, accrued daily and paid monthly, at an annual rate of 0.75% and a shareholder services fee, accrued daily and paid monthly, at an annual rate of 0.25% of the Fund's average daily net assets attributable to Class C shares.
The distribution and shareholder services fees are used to support the expenses associated with servicing and maintaining accounts. The Distributor may compensate other parties for providing shareholder support services to investors who purchase Class A, Class L and Class C shares.
E. Dividend Disbursing and Transfer Agent: The Company's dividend disbursing and transfer agent is DST Asset Manager Solutions, Inc. ("DST"). Pursuant to a Transfer Agency Agreement, the Company pays DST a fee based on the number of classes, accounts and transactions relating to the Funds of the Company.
24
Morgan Stanley Institutional Fund, Inc.
Annual Report — December 31, 2018
Notes to Financial Statements (cont'd)
F. Custodian Fees: State Street (the "Custodian") also serves as Custodian for the Company in accordance with a Custodian Agreement. The Custodian holds cash, securities and other assets of the Company as required by the Act. Custody fees are payable monthly based on assets held in custody, investment purchases and sales activity and account maintenance fees, plus reimbursement for certain out-of-pocket expenses.
G. Security Transactions and Transactions with Affiliates: For the year ended December 31, 2018, purchases and sales of investment securities for the Fund, other than long-term U.S. Government securities and short-term investments were approximately $347,095,000 and $189,364,000, respectively. There were no purchases and sales of long-term U.S. Government securities for the year ended December 31, 2018.
The Fund invests in the Institutional Class of the Morgan Stanley Institutional Liquidity Funds (the "Liquidity Funds"), an open-end management investment company managed by the Adviser. Advisory fees paid by the Fund are reduced by an amount equal to its pro-rata share of the advisory and administration fees paid by the Fund due to its investment in the Liquidity Funds. For the year ended December 31, 2018, advisory fees paid were reduced by approximately $13,000 relating to the Fund's investment in the Liquidity Funds.
A summary of the Fund's transactions in shares of affiliated investments during the year ended December 31, 2018 is as follows:
Affiliated
Investment
Company | | Value
December 31,
2017
(000) | | Purchases
at Cost
(000) | | Proceeds
from Sales
(000) | | Dividend
Income
(000) | |
Liquidity Funds | | $ | 3,431 | | | $ | 97,378 | | | $ | 82,377 | | | $ | 123 | | |
Affiliated
Investment
Company (cont'd) | | Realized
Gain (Loss)
(000) | | Change in
Unrealized
Appreciation
(Depreciation)
(000) | | Value
December 31,
2018
(000) | |
Liquidity Funds | | $ | — | | | $ | — | | | $ | 18,432 | | |
The Fund is permitted to purchase and sell securities ("cross-trade") from and to other Morgan Stanley funds as well as other funds and client accounts for which the Adviser or an affiliate of the Adviser serves as investment adviser, pursuant to procedures approved by the Directors in compliance with Rule 17a-7 under the Act (the "Rule"). Each cross-trade is
executed at the current market price in compliance with provisions of the Rule. For the year ended December 31, 2018, the Fund did not engage in any cross-trade transactions.
The Fund has an unfunded Deferred Compensation Plan (the "Compensation Plan"), which allows each independent Director to defer payment of all, or a portion, of the fees he or she receives for serving on the Board of Directors. Each eligible Director generally may elect to have the deferred amounts credited with a return equal to the total return on one or more of the Morgan Stanley funds that are offered as investment options under the Compensation Plan. Appreciation/depreciation and distributions received from these investments are recorded with an offsetting increase/decrease in the deferred compensation obligation and do not affect the NAV of the Fund.
H. Federal Income Taxes: It is the Fund's intention to continue to qualify as a regulated investment company and distribute all of its taxable and tax-exempt income. Accordingly, no provision for federal income taxes is required in the financial statements.
The Fund may be subject to taxes imposed by countries in which it invests. Such taxes are generally based on income and/or capital gains earned or repatriated. Taxes are accrued based on net investment income, net realized gains and net unrealized appreciation as such income and/or gains are earned. Taxes may also be based on transactions in foreign currency and are accrued based on the value of investments denominated in such currency.
FASB ASC 740-10, "Income Taxes — Overall", sets forth a minimum threshold for financial statement recognition of the benefit of a tax position taken or expected to be taken in a tax return. Management has concluded there are no significant uncertain tax positions that would require recognition in the financial statements. If applicable, the Fund recognizes interest accrued related to unrecognized tax benefits in "Interest Expense" and penalties in "Other Expenses" in the Statement of Operations. The Fund files tax returns with the U.S. Internal Revenue Service, New York and various states. Generally, each of the tax years in the four-year period ended December 31, 2018 remains subject to examination by taxing authorities.
The tax character of distributions paid may differ from the character of distributions shown for GAAP purposes due to
25
Morgan Stanley Institutional Fund, Inc.
Annual Report — December 31, 2018
Notes to Financial Statements (cont'd)
short-term capital gains being treated as ordinary income for tax purposes. The tax character of distributions paid during fiscal years 2018 and 2017 was as follows:
2018
Distributions
Paid From: | | 2017
Distributions
Paid From: | |
Ordinary
Income
(000) | | Long-Term
Capital Gain
(000) | | Ordinary
Income
(000) | | Long-Term
Capital Gain
(000) | |
| $ | 542 | | | $ | 8,397 | | | $ | 761 | | | $ | 7,033 | | |
The amount and character of income and gains to be distributed are determined in accordance with income tax regulations which may differ from GAAP. These book/tax differences are either considered temporary or permanent in nature.
Temporary differences are attributable to differing book and tax treatments for the timing of the recognition of gains (losses) on certain investment transactions and the timing of the deductibility of certain expenses.
Permanent differences, primarily due to equalization debits, resulted in the following reclassifications among the components of net assets at December 31, 2018:
Total
Distributable
Earnings
(000) | | Paid-in
Capital
(000) | |
| $ | (597 | ) | | $ | 597 | | |
At December 31, 2018, the Fund had no distributable earnings on a tax basis.
Qualified late year losses are capital losses and specified ordinary losses, including currency losses, incurred after October 31 but within the taxable year that, if elected, are deemed to arise on the first day of the Fund's next taxable year. For the year ended December 31, 2018, the Fund intends to defer to January 1, 2019 for U.S. federal income tax purposes the following losses:
Qualified
Late Year
Ordinary
Losses
(000) | | Post-October
Capital
Losses
(000) | |
| $ | — | | | $ | 532 | | |
I. Credit Facility: The Company and other Morgan Stanley funds participated in a $150,000,000 committed, unsecured revolving line of credit facility (the "Facility") with State Street. This Facility is to be used for temporary emergency purposes or funding of shareholder redemption requests. The interest rate on borrowings is based on the federal funds rate or 1 month LIBOR rate plus a spread. The Facility also has a commitment fee of 0.25% per annum based on the unused portion of the Facility. During the year ended December 31, 2018, the Fund did not have any borrowings under the Facility.
J. Other: At December 31, 2018, the Fund had record owners of 10% or greater. Investment activities of these shareholders could have a material impact on the Fund. The aggregate percentage of such owners was 24.4%.
26
Morgan Stanley Institutional Fund, Inc.
Annual Report — December 31, 2018
Report of Independent Registered Public Accounting Firm
To the Shareholders and Board of Directors of
Morgan Stanley Institutional Fund, Inc. —
Advantage Portfolio
Opinion on the Financial Statements
We have audited the accompanying statement of assets and liabilities of Advantage Portfolio (the "Fund") (one of the funds constituting the Morgan Stanley Institutional Fund, Inc. (the "Company")), including the portfolio of investments, as of December 31, 2018, and the related statement of operations for the year then ended, the statements of changes in net assets for each of the two years in the period then ended, the financial highlights for each of the five years in the period then ended and the related notes (collectively referred to as the "financial statements"). In our opinion, the financial statements present fairly, in all material respects, the financial position of Advantage Portfolio (one of the funds constituting Morgan Stanley Institutional Fund, Inc.) at December 31, 2018, the results of its operations for the year then ended, the changes in its net assets for each of the two years in the period then ended and its financial highlights for each of the five years in the period then ended, in conformity with U.S. generally accepted accounting principles.
Basis for Opinion
These financial statements are the responsibility of the Company's management. Our responsibility is to express an opinion on the Fund's financial statements based on our audits. We are a public accounting firm registered with the Public Company Accounting Oversight Board (United States) ("PCAOB") and are required to be independent with respect to the Company in accordance with the U.S. federal securities law and the applicable rules and regulations of the Securities and Exchange Commission and the PCAOB.
We conducted our audits in accordance with the standards of the PCAOB. Those standards require that we plan and perform the audit to obtain reasonable assurance about whether the financial statements are free of material misstatement, whether due to error or fraud. The Company is not required to have, nor were we engaged to perform, an audit of the Company's internal control over financial reporting. As part of our audits, we are required to obtain an understanding of internal control over financial reporting, but not for the purpose of expressing an opinion on the effectiveness of the Company's internal control over financial reporting. Accordingly, we express no such opinion.
Our audits included performing procedures to assess the risks of material misstatement of the financial statements, whether due to error or fraud, and performing procedures that respond to those risks. Such procedures included examining, on a test basis, evidence regarding the amounts and disclosures in the financial statements. Our procedures included confirmation of securities owned as of December 31, 2018 by correspondence with the custodian and others or by other appropriate auditing procedures where replies from others were not received. Our audits also included evaluating the accounting principles used and significant estimates made by management, as well as evaluating the overall presentation of the financial statements. We believe that our audits provide a reasonable basis for our opinion.

We have served as the auditor of one or more Morgan Stanley investment companies since 2000.
Boston, Massachusetts
February 26, 2019
27
Morgan Stanley Institutional Fund, Inc.
Annual Report — December 31, 2018
Federal Tax Notice (unaudited)
For federal income tax purposes, the following information is furnished with respect to the distributions paid by the Fund during its taxable year ended December 31, 2018. For corporate shareholders 68.71% of the dividends qualified for the dividends received deduction.
The Fund designated and paid approximately $8,397,000 as a long-term capital gain distribution.
For federal income tax purposes, the following information is furnished with respect to the Fund's earnings for its taxable year ended December 31, 2018. When distributed, certain earnings may be subject to a maximum tax rate of 15% as provided for by the Jobs and Growth Tax Relief Reconciliation Act of 2003. The Fund designated up to a maximum of approximately $213,000 as taxable at this lower rate.
In January, the Fund provides tax information to shareholders for the preceding calendar year.
28
Morgan Stanley Institutional Fund, Inc.
Annual Report — December 31, 2018
Privacy Notice (unaudited)
MORGAN STANLEY INVESTMENT MANAGEMENT INC.
AN IMPORTANT NOTICE CONCERNING OUR U.S. PRIVACY POLICY
We are required by federal law to provide you with a copy of our privacy policy annually. This policy applies to current and former individual investors in funds managed or sponsored by Morgan Stanley Investment Management Inc. ("MSIM") as well as current and former individual clients of MSIM. This policy is not applicable to partnerships, corporations, trusts or other non-individual clients or investors. Please note that we may amend this policy at any time, and will inform you of any changes as required by law.
WE RESPECT YOUR PRIVACY
We appreciate that you have provided us with your personal financial information. We strive to maintain the privacy of such information while we help you achieve your financial objectives. This Notice describes what non-public personal information we collect about you, why we collect it, when we may share it with others and how certain others may use it. It discusses the steps you may take to limit our sharing of certain information about you to affiliated companies in the Morgan Stanley family of companies ("other Morgan Stanley companies"). It also discloses how you may limit use of certain shared information for marketing purposes by other Morgan Stanley branded companies. Throughout this policy, we refer to the non-public information that personally identifies you or your accounts as "personal information."
1. WHAT PERSONAL INFORMATION DO WE COLLECT ABOUT YOU?
We obtain personal information from applications and other forms you submit to us, from your dealings with us, from consumer reporting agencies, from our Web sites and from third parties and other sources.
For example:
• We may collect information such as your name, address, e-mail address, telephone/fax numbers, assets, income and investment objectives through subscription documents, applications and other forms you submit to us.
• We may obtain information about account balances, your use of account(s) and the types of products and services you prefer to receive from us through your dealings and transactions with us and other sources.
• We may obtain information about your creditworthiness and credit history from consumer reporting agencies.
• We may collect background information from and through third-party vendors to verify representations you have made and to comply with various regulatory requirements.
• If you interact with us through our public and private Web sites, we may collect information that you provide directly through online communications (such as an e-mail address). We may also collect information about your Internet service provider, your domain name, your computer's operating system and Web browser, your use of our Web sites and your product and service preferences, through the use of "cookies." Please consult the Terms of Use of these sites for more details.
2. WHEN DO WE DISCLOSE PERSONAL INFORMATION WE COLLECT ABOUT YOU?
We may disclose personal information we collect about you to other Morgan Stanley companies and to non-affiliated third parties.
a. Information We Disclose to Other Morgan Stanley Companies.
We may disclose personal information to other Morgan Stanley companies for a variety of reasons, including to manage your account(s) effectively, to service and process your transactions, to let you know about products and services offered by us and other Morgan Stanley companies, to manage our business, and as otherwise required or permitted by law. Offers for products and services from other Morgan Stanley companies are developed under conditions designed to safeguard your personal information.
29
Morgan Stanley Institutional Fund, Inc.
Annual Report — December 31, 2018
Privacy Notice (unaudited) (cont'd)
b. Information We Disclose to Non-affiliated Third Parties.
We do not disclose personal information that we collect about you to non-affiliated third parties except to those who provide marketing services on our behalf, to financial institutions with whom we have joint marketing agreements, and as otherwise required or permitted by law. For example, we may disclose personal information to non-affiliated third parties for servicing and processing transactions, to offer our own products and services, to protect against fraud, for institutional risk control, to respond to judicial process or to perform services on our behalf. When we share personal information with a non-affiliated third party, they are required to limit their use of personal information to the particular purpose for which it was shared and they are not allowed to share personal information with others except to fulfill that limited purpose or as may be permitted or required by law.
3. HOW DO WE PROTECT THE SECURITY AND CONFIDENTIALITY OF PERSONAL INFORMATION WE COLLECT ABOUT YOU?
We maintain physical, electronic and procedural security measures to help safeguard the personal information we collect about you. We have internal policies governing the proper handling of client information. Third parties that provide support or marketing services on our behalf may also receive personal information, and we require them to adhere to confidentiality standards with respect to such information.
4. HOW CAN YOU LIMIT THE SHARING OF CERTAIN TYPES OF PERSONAL INFORMATION WITH OTHER MORGAN STANLEY COMPANIES?
We offer you choices as to whether we share with other Morgan Stanley companies the personal information that was collected to determine your eligibility for products and services you request ("eligibility information"). Eligibility information does not include your identification information or personal information pertaining to our transactions or experiences with you. Please note that, even if you direct us not to share eligibility information with other Morgan Stanley companies ("opt-out"), we may still share personal information, including eligibility information, with those companies in circumstances excluded from the opt-out under applicable law, such as to process transactions or to service your account.
5. HOW CAN YOU LIMIT THE USE OF CERTAIN TYPES OF PERSONAL INFORMATION BY OTHER MORGAN STANLEY COMPANIES FOR MARKETING?
By following the opt-out instructions in Section 6 below, you may limit other Morgan Stanley branded companies from marketing their products or services to you based on personal information we disclose to them. This information may include, for example, your income and account history with us. Please note that, even if you choose to limit Other Morgan Stanley Companies from using personal information about you that we may share with them for marketing their products and services to you, Other Morgan Stanley Companies may use your personal information that they obtain from us to market to you in circumstances permitted by law, such as if the Other Morgan Stanley Company has its own relationship with you.
6. HOW CAN YOU SEND US AN OPT-OUT INSTRUCTION?
If you wish to limit our sharing of eligibility information about you with other Morgan Stanley companies or other Morgan Stanley companies' use of personal information for marketing purposes, as described in this notice, you may do so by:
• Calling us at (800) 548-7786
Monday–Friday between 8a.m. and 6p.m.(EST)
• Writing to us at the following address:
DST Asset Manager Solutions, Inc.
c/o Privacy Coordinator
P.O. Box 219804
Kansas City, Missouri 64121
30
Morgan Stanley Institutional Fund, Inc.
Annual Report — December 31, 2018
Privacy Notice (unaudited) (cont'd)
Your written request should include your name, address, telephone number and account number(s) to which the opt-out applies and whether you are opting out with respect to sharing of eligibility information (Section 4 above), or if information used for Marketing (Section 5 above) or both. Written opt-out requests should not be sent with any other correspondence. In order to process your request, we require that the request be provided by you directly and not through a third party.
Your opt-out preference will remain in effect with respect to this policy (as it may be amended) until you notify us otherwise. If you have a joint account, your direction for us not to share this information with other Morgan Stanley companies and for those other Morgan Stanley companies not to use your personal information for marketing will be applied to all account holders on that account. Please understand that if you limit our sharing or our affiliated companies' use of personal information, you and any joint account holder(s) may not receive information about Morgan Stanley products and services, including products or services that could help you manage your financial resources and achieve your investment objectives.
7. WHAT IF AN AFFILIATED COMPANY BECOMES A NON-AFFILIATED THIRD PARTY?
If, at any time in the future, an affiliated company becomes a non-affiliated third party, further disclosures of personal information made to the former affiliated company will be limited to those described in Section 2(b) above relating to non-affiliated third parties. If you elected under Section 6 to limit disclosures we make to affiliated companies, or use of personal information by affiliated companies, your election will not apply to use by any former affiliated company of your personal information in their possession once it becomes a non-affiliated third party.
SPECIAL NOTICE TO RESIDENTS OF VERMONT
The following section supplements our policy with respect to our individual clients who have a Vermont address and supersedes anything to the contrary in the above policy with respect to those clients only.
The state of Vermont requires financial institutions to obtain your consent prior to sharing personal information that they collect about you with affiliated companies and non-affiliated third parties other than in certain limited circumstances. Except as permitted by law, we will not share personal information we collect about you with non-affiliated third parties or other Morgan Stanley companies unless you provide us with your written consent to share such information ("opt-in").
If you wish to receive offers for investment products and services offered by or through other Morgan Stanley companies, please notify us in writing at the following address:
DST Asset Manager Solutions, Inc.
c/o Privacy Coordinator
P.O. Box 219804
Kansas City, Missouri 64121
Your authorization should include your name, address, telephone number and account number(s) to which the opt-in applies and should not be sent with any other correspondence. In order to process your authorization, we require that the authorization be provided by you directly and not through a third party.
SPECIAL NOTICE TO RESIDENTS OF CALIFORNIA
The following section supplements our policy with respect to our individual clients who have a California address and supersedes anything to the contrary in the above policy with respect to those clients only.
In response to a California law, if your account has a California home address, your personal information will not be disclosed to non-affiliated third parties except as permitted by applicable California law, and we will limit sharing such information with our affiliates to comply with California privacy laws that apply to us.
31
Morgan Stanley Institutional Fund, Inc.
Annual Report — December 31, 2018
Director and Officer Information (unaudited)
Independent Directors:
Name, Age and Address of
Independent Director | | Position(s)
Held with
Registrant | | Length of Time
Served* | | Principal Occupation(s) During Past 5 Years
and Other Relevant Professional Experience | | Number of
Portfolios in
Fund Complex
Overseen by
Independent
Director** | | Other Directorships
Held by Independent
Director*** | |
Frank L. Bowman (74)
c/o Perkins Coie LLP
Counsel to the Independent
Directors
30 Rockefeller Plaza
New York, NY 10112 | | Director | | Since
August
2006 | | President, Strategic Decisions, LLC (consulting) (since February 2009); Director or Trustee of various Morgan Stanley Funds (since August 2006); Chairperson of the Compliance and Insurance Committee (since October 2015); formerly, Chairperson of the Insurance Sub-Committee of the Compliance and Insurance Committee (2007-2015); served as President and Chief Executive Officer of the Nuclear Energy Institute (policy organization) (February 2005-November 2008); retired as Admiral, U.S. Navy after serving over 38 years on active duty including 8 years as Director of the Naval Nuclear Propulsion Program in the Department of the Navy and the U.S. Department of Energy (1996-2004); served as Chief of Naval Personnel (July 1994-September 1996) and on the Joint Staff as Director of Political Military Affairs (June 1992-July 1994); knighted as Honorary Knight Commander of the Most Excellent Order of the British Empire; awarded the Officier de l'Orde National du Mérite by the French Government; elected to the National Academy of Engineering (2009). | | | 82 | | | Director of BP p.l.c.; Director of Naval and Nuclear Technologies LLP; Director Emeritus of the Armed Services YMCA; Member of the National Security Advisory Council of the Center for U.S. Global Engagement and a member of the CNA Military Advisory Board; Trustee of Fairhaven United Methodist Church; Member of the Board of Advisors of the Dolphin Scholarship Foundation; and Director of other various non-profit organizations. | |
Kathleen A. Dennis (65)
c/o Perkins Coie LLP
Counsel to the Independent Directors
30 Rockefeller Plaza
New York, NY 10112 | | Director | | Since
August
2006 | | President, Cedarwood Associates (mutual fund and investment management consulting) (since July 2006); Chairperson of the Liquidity and Alternatives Sub-Committee of the Investment Committee (since October 2006) and Director or Trustee of various Morgan Stanley Funds (since August 2006); formerly, Senior Managing Director of Victory Capital Management (1993-2006). | | | 82 | | | Director of various non-profit organizations. | |
Nancy C. Everett (63)
c/o Perkins Coie LLP
Counsel to the Independent Directors
30 Rockefeller Plaza
New York, NY 10112 | | Director | | Since
January
2015 | | Chief Executive Officer, Virginia Commonwealth University Investment Company (since November 2015); Owner, OBIR, LLC (institutional investment management consulting) (since June 2014); formerly, Managing Director, BlackRock Inc. (February 2011-December 2013); and Chief Executive Officer, General Motors Asset Management (a/k/a Promark Global Advisors, Inc.) (June 2005-May 2010). | | | 83 | | | Formerly, Member of Virginia Commonwealth University School of Business Foundation (2005-2016); Member of Virginia Commonwealth University Board of Visitors (2013-2015); Member of Committee on Directors for Emerging Markets Growth Fund, Inc. (2007-2010); Chairperson of Performance Equity Management, LLC (2006-2010); and Chairperson, GMAM Absolute Return Strategies Fund, LLC (2006-2010). | |
32
Morgan Stanley Institutional Fund, Inc.
Annual Report — December 31, 2018
Director and Officer Information (unaudited) (cont'd)
Independent Directors: (cont'd)
Name, Age and Address of
Independent Director | | Position(s)
Held with
Registrant | | Length of Time
Served* | | Principal Occupation(s) During Past 5 Years
and Other Relevant Professional Experience | | Number of
Portfolios in
Fund Complex
Overseen by
Independent
Director** | | Other Directorships
Held by Independent
Director*** | |
Jakki L. Haussler (61)
c/o Perkins Coie LLP
Counsel to the Independent Directors
30 Rockefeller Plaza
New York, NY 10112 | | Director | | Since
January
2015 | | Chairman and Chief Executive Officer, Opus Capital Group (since January 1996); formerly, Director, Capvest Venture Fund, LP (May 2000-December 2011); Partner, Adena Ventures, LP (July 1999-December 2010); Director, The Victory Funds (February 2005-July 2008). | | | 83 | | | Director of Service Corporation International and Member, Audit Committee and Investment Committee; Director of Cincinnati Bell Inc. and Member, Audit Committee and Governance and Nominating Committee; Chairman of Northern Kentucky University Member Investment Committee; Member of Chase College of Law Transactional Law Practice Center Board of Advisors; Director of Best Transport; Director of Chase College of Law Board of Visitors; formerly, Member, University of Cincinnati Foundation Investment Committee; Member, Miami University Board of Visitors (2008-2011); Trustee of Victory Funds (2005-2008) and Chairman, Investment Committee (2007-2008) and Member, Service Provider Committee (2005-2008). | |
Dr. Manuel H. Johnson (69)
c/o Johnson Smick
International, Inc.
220 I Street, NE — Suite 200
Washington, D.C. 20002 | | Director | | Since
July
1991 | | Senior Partner, Johnson Smick International, Inc. (consulting firm); Chairperson of the Investment Committee (since October 2006) and Director or Trustee of various Morgan Stanley Funds (since July 1991); Co-Chairman and a founder of the Group of Seven Council (G7C) (international economic commission); formerly, Chairperson of the Audit Committee (July 1991-September 2006), Vice Chairman of the Board of Governors of the Federal Reserve System and Assistant Secretary of the U.S. Treasury. | | | 82 | | | Director of NVR, Inc. (home construction). | |
Joseph J. Kearns (76)
c/o Perkins Coie LLP
Counsel to the Independent Directors
30 Rockefeller Plaza
New York, NY 10112 | | Director | | Since
August
1994 | | Senior Adviser, Kearns & Associates LLC (investment consulting); Chairperson of the Audit Committee (since October 2006) and Director or Trustee of various Morgan Stanley Funds (since August 1994); formerly, Deputy Chairperson of the Audit Committee (July 2003-September 2006) and Chairperson of the Audit Committee of various Morgan Stanley Funds (since August 1994); CFO of the J. Paul Getty Trust. | | | 83 | | | Prior to August 10, 2016, Director of Electro Rent Corporation (equipment leasing); Prior to December 31, 2013, Director of The Ford Family Foundation. | |
33
Morgan Stanley Institutional Fund, Inc.
Annual Report — December 31, 2018
Director and Officer Information (unaudited) (cont'd)
Independent Directors: (cont'd)
Name, Age and Address of
Independent Director | | Position(s)
Held with
Registrant | | Length of Time
Served* | | Principal Occupation(s) During Past 5 Years
and Other Relevant Professional Experience | | Number of
Portfolios in
Fund Complex
Overseen by
Independent
Director** | | Other Directorships
Held by Independent
Director*** | |
Michael F. Klein (60)
c/o Perkins Coie LLP
Counsel to the Independent Directors
30 Rockefeller Plaza
New York, NY 10112 | | Director | | Since
August
2006 | | Managing Director, Aetos Alternatives Management, LP (since March 2000); Co-President, Aetos Alternatives Management, LP (since January 2004) and Co-Chief Executive Officer of Aetos Alternatives Management, LP (since August 2013); Chairperson of the Fixed Income Sub-Committee of the Investment Committee (since October 2006) and Director or Trustee of various Morgan Stanley Funds (since August 2006); formerly, Managing Director, Morgan Stanley & Co. Inc. and Morgan Stanley Dean Witter Investment Management and President, various Morgan Stanley Funds (June 1998-March 2000); Principal, Morgan Stanley & Co. Inc. and Morgan Stanley Dean Witter Investment Management (August 1997-December 1999). | | | 82 | | | Director of certain investment funds managed or sponsored by Aetos Alternatives Management, LP; Director of Sanitized AG and Sanitized Marketing AG (specialty chemicals). | |
Patricia Maleski (58)
c/o Perkins Coie LLP
Counsel to the Independent Directors
30 Rockefeller Plaza
New York, NY 10112 | | Director | | Since
January
2017 | | Managing Director, JPMorgan Asset Management (2004-2016); Oversight and Control Head of Fiduciary and Conflicts of Interest Program (2015-2016); Chief Control Officer-Global Asset Management (2013-2015); President, JPMorgan Funds (2010-2013); Chief Administrative Officer (2004-2013); various other positions including Treasurer and Board Liaison (since 2001). | | | 83 | | | None. | |
Michael E. Nugent (82)
522 Fifth Avenue
New York, NY 10036 | | Chair of the Board and Director | | Chair of the Boards since July 2006 and Director since July 1991 | | Chair of the Boards of various Morgan Stanley Funds (since July 2006); Chairperson of the Closed-End Fund Committee (since June 2012) Governance Committee (since
January 2019) and Director or Trustee of various Morgan Stanley Funds (since July 1991); formerly, Chairperson of the Insurance Committee (until July 2006); General Partner, Triumph Capital, L.P. (private investment partnership) (1988-2013). | | | 82 | | | None. | |
W. Allen Reed (71)
c/o Perkins Coie LLP
Counsel to the Independent Directors
30 Rockefeller Plaza
New York, NY 10112 | | Director | | Since
August
2006 | | Chairperson of the Equity Sub-Committee of the Investment Committee (since October 2006) and Director or Trustee of various Morgan Stanley Funds (since August 2006); formerly, President and CEO of General Motors Asset Management; Chairman and Chief Executive Officer of the GM Trust Bank and Corporate Vice President of General Motors Corporation (August 1994-December 2005). | | | 82 | | | Director of Legg Mason, Inc.; formerly, Director of the Auburn University Foundation (2010-2015). | |
Fergus Reid (86)****
c/o Joe Pietryka, Inc.
85 Charles Colman Blvd.
Pawling, NY 12564 | | Director | | Since
June
1992 | | Chairman, Joe Pietryka, Inc.; Chairperson of the Governance Committee and Director or Trustee of various Morgan Stanley Funds (since June 1992). | | | 83 | | | Formerly, Trustee and Director of certain investment companies in the JP Morgan Fund Complex managed by JP Morgan Investment Management Inc. (1987-2012). | |
* This is the earliest date the Director began serving the Morgan Stanley Funds. Each Director serves an indefinite term, until his or her successor is elected.
** The Fund Complex includes (as of December 31, 2018) all open-end and closed-end funds (including all of their portfolios) advised by Morgan Stanley Investment Management Inc. (the "Adviser") and any funds that have an adviser that is an affiliated person of the Adviser (including, but not limited to, Morgan Stanley AIP GP LP).
*** This includes any directorships at public companies and registered investment companies held by the Director at any time during the past five years.
**** Effective date of retirement is December 31, 2018.
34
Morgan Stanley Institutional Fund, Inc.
Annual Report — December 31, 2018
Director and Officer Information (unaudited) (cont'd)
Executive Officers:
Name, Age and Address of Executive Officer | | Position(s) Held
with
Registrant | | Length of Time
Served* | | Principal Occupation(s) During Past 5 Years | |
John H. Gernon (55)
522 Fifth Avenue
New York, NY 10036 | | President and Principal Executive Officer | | Since
September
2013 | | President and Principal Executive Officer of the Equity and Fixed Income Funds and the Morgan Stanley AIP Funds (since September 2013) and the Liquidity Funds and various money market funds (since May 2014) in the Fund Complex; Managing Director of the Adviser; Head of Product (since 2006). | |
Timothy J. Knierim (59)
522 Fifth Avenue
New York, NY 10036 | | Chief Compliance Officer | | Since
December
2016 | | Managing Director of the Adviser and various entities affiliated with the Adviser; Chief Compliance Officer of various Morgan Stanley Funds and the Adviser (since December 2016) and Chief Compliance Officer of Morgan Stanley AIP GP LP (since 2014). Formerly, Managing Director and Deputy Chief Compliance Officer of the Adviser (2014-2016); and formerly, Chief Compliance Officer of Prudential Investment Management, Inc. (2007-2014). | |
Francis J. Smith (53)
522 Fifth Avenue
New York, NY 10036 | | Treasurer and Principal Financial Officer | | Treasurer since July 2003 and Principal Financial Officer since September 2002 | | Managing Director of the Adviser and various entities affiliated with the Adviser; Treasurer (since July 2003) and Principal Financial Officer of various Morgan Stanley Funds (since September 2002). | |
Mary E. Mullin (51)
522 Fifth Avenue
New York, NY 10036 | | Secretary | | Since
June
1999 | | Managing Director of the Adviser; Secretary of various Morgan Stanley Funds (since June 1999). | |
Michael J. Key (39)
522 Fifth Avenue
New York, NY 10036 | | Vice President | | Since
June
2017 | | Vice President of the Equity and Fixed Income Funds, Liquidity Funds, various money market funds and the Morgan Stanley AIP Funds in the Fund Complex (since June 2017); Executive Director of the Adviser; Head of Product Development for Equity and Fixed Income Funds (since August 2013). | |
* This is the earliest date the officer began serving the Morgan Stanley Funds. Each officer serves a one-year term, until his or her successor is elected and qualifies.
35
Morgan Stanley Institutional Fund, Inc.
Annual Report — December 31, 2018
Adviser and Administrator
Morgan Stanley Investment Management Inc.
522 Fifth Avenue
New York, New York 10036
Distributor
Morgan Stanley Distribution, Inc.
522 Fifth Avenue
New York, New York 10036
Dividend Disbursing and Transfer Agent
DST Asset Manager Solutions, Inc.
2000 Crown Colony Drive
Quincy, Massachusetts 02169
Custodian
State Street Bank and Trust Company
One Lincoln Street
Boston, Massachusetts 02111
Legal Counsel
Dechert LLP
1095 Avenue of the Americas
New York, New York 10036
Counsel to the Independent Directors
Perkins Coie LLP
30 Rockefeller Plaza
New York, New York 10112
Independent Registered Public Accounting Firm
Ernst & Young LLP
200 Clarendon Street
Boston, Massachusetts 02116
Reporting to Shareholders
Each Morgan Stanley fund provides a complete schedule of portfolio holdings in its semi-annual and the annual reports within 60 days of the end of the fund's second and fourth fiscal quarters. The semi-annual and annual reports are filed electronically with the Securities and Exchange Commission ("SEC") on Form N-CSRS and Form N-CSR, respectively. Morgan Stanley also delivers the semi-annual and annual reports to fund shareholders and makes these reports available on its public website, www.morganstanley.com/im/shareholderreports. Each Morgan Stanley fund also files a complete schedule of portfolio holdings with the SEC for the fund's first and third fiscal quarters on Form N-Q. Morgan Stanley does not deliver the reports for the first and third fiscal quarters to shareholders, nor are the reports posted to the Morgan Stanley public website. You may, however, obtain the Form N-Q filings (as well as the Form N-CSR and N-CSRS filings) by accessing the SEC's website, www.sec.gov. You can also request copies of these materials, upon payment of a duplicating fee, by electronic request at the SEC's email address (publicinfo@sec.gov).
Proxy Voting Policies and Procedures and Proxy Voting Record
You may obtain a copy of the Company's Proxy Voting Policy and Procedures and information regarding how the Company voted proxies relating to portfolio securities during the most recent twelve-month period ended June 30, without charge, upon request, by calling toll free 1 (800) 548-7786 or by visiting our website at www.morganstanley.com/im/shareholderreports. This information is also available on the SEC's website at www.sec.gov.
This report is authorized for distribution only when preceded or accompanied by a prospectus or summary prospectus of the applicable Fund of Morgan Stanley Institutional Fund, Inc., which describes in detail the Fund's investment policies, risks, fees and expenses. Please read the prospectus carefully before you invest or send money. For additional information, including information regarding the investments comprising the Fund, please visit our website at www.morganstanley.com/im/shareholderreports or call toll free 1 (800) 548-7786.
36
Printed in U.S.A.
This Report has been prepared for shareholders and may be distributed to others only if preceded or accompanied by a current prospectus.
Morgan Stanley Investment Management Inc.
522 Fifth Avenue
New York, New York 10036
© 2019 Morgan Stanley. Morgan Stanley Distribution, Inc.

IFIADVANN
2401203 EXP. 02.29.20

Morgan Stanley Institutional Fund, Inc.
Asia Opportunity Portfolio
Annual Report
December 31, 2018
Beginning on January 1, 2021, as permitted by regulations adopted by the Securities and Exchange Commission ("SEC"), paper copies of the Fund's Annual and Semi-Annual Reports to Shareholders ("Shareholder Reports") will no longer be sent by mail, unless you specifically request paper copies of the Shareholder Reports from the Fund or from your financial intermediary, such as a broker-dealer or a bank. Instead, the Shareholder Reports will be made available on the Fund's website, https://www.morganstanley.com/im/shareholderreports and you will be notified by mail each time a Shareholder Report is posted and provided with a website link to access the Shareholder Report. If you already elected to receive Shareholder Reports electronically, you will not be affected by this change and you need not take any action. You may elect to receive Shareholder Reports and other communications from the Fund electronically anytime by contacting your financial intermediary or, if you are a direct investor, please follow the instructions on the envelope.
Beginning on January 1, 2019, you may elect to receive all future Shareholder Reports in paper free of charge. If you invest through a financial intermediary, you can contact your financial intermediary to request that you continue to receive paper copies of your Shareholder Reports. If you invest directly with the Fund, please follow the instructions on the envelope to let the Fund know you wish to continue receiving paper copies of your Shareholder Reports. Your election to receive Shareholder Reports in paper will apply to all funds held in your account if you invest through your financial intermediary or all funds held with the fund complex if you invest directly with a fund.

Morgan Stanley Institutional Fund, Inc.
Annual Report — December 31, 2018
Shareholders' Letter | | | 2 | | |
Expense Example | | | 3 | | |
Investment Overview | | | 4 | | |
Portfolio of Investments | | | 6 | | |
Statement of Assets and Liabilities | | | 8 | | |
Statement of Operations | | | 10 | | |
Statements of Changes in Net Assets | | | 11 | | |
Financial Highlights | | | 13 | | |
Notes to Financial Statements | | | 17 | | |
Report of Independent Registered Public Accounting Firm | | | 26 | | |
Federal Tax Notice | | | 27 | | |
Privacy Notice | | | 28 | | |
Director and Officer Information | | | 31 | | |
This report is authorized for distribution only when preceded or accompanied by a prospectus or summary prospectus of the applicable Fund of Morgan Stanley Institutional Fund, Inc. To receive a prospectus and/or statement of additional information (SAI), which contains more complete information such as investment objectives, charges, expenses, policies for voting proxies, risk considerations and describes in detail each of the Fund's investment policies to the prospective investor, please call toll free 1 (800) 548-7786. Please read the prospectuses carefully before you invest or send money.
Additionally, you can access information about the Fund, including performance, characteristics and investment team commentary, through Morgan Stanley Investment Management's website: www.morganstanley.com/im/shareholderreports.
Market forecasts provided in this report may not necessarily come to pass. There is no guarantee that any sectors mentioned will continue to perform as discussed herein or that securities in such sectors will be held by the Fund in the future. There is no assurance that a fund will achieve its investment objective. Funds are subject to market risk, which is the possibility that market values of securities owned by the Fund will decline and, therefore, the value of the Fund's shares may be less than what you paid for them. Accordingly, you can lose money investing in this Fund. Please see the prospectus for more complete information on investment risks.
1
Morgan Stanley Institutional Fund, Inc.
Annual Report — December 31, 2018
Shareholders' Letter (unaudited)
Dear Shareholders,
We are pleased to provide this Annual report, in which you will learn how your investment in Asia Opportunity Portfolio (the "Fund") performed during the latest twelve-month period.
Morgan Stanley Investment Management is a client-centric, investor-led organization. Our global presence, intellectual capital, and breadth of products and services enable us to partner with investors to meet the evolving challenges of today's financial markets. We aim to deliver superior investment service and to empower our clients to make the informed decisions that help them reach their investment goals.
As always, we thank you for selecting Morgan Stanley Investment Management, and look forward to working with you in the months and years ahead.
Sincerely,

John H. Gernon
President and Principal Executive Officer
January 2019
2
Morgan Stanley Institutional Fund, Inc.
Annual Report — December 31, 2018
Expense Example (unaudited)
Asia Opportunity Portfolio
As a shareholder of the Fund, you incur two types of costs: (1) transactional costs, including redemption fees; and (2) ongoing costs, which may include advisory fees, administration fees, distribution and shareholder services fees and other Fund expenses. This example is intended to help you understand your ongoing costs (in dollars) of investing in the Fund and to compare these costs with the ongoing costs of investing in other mutual funds.
This example is based on an investment of $1,000 invested at the beginning of the six-month period ended December 31, 2018 and held for the entire six-month period.
Actual Expenses
The table below provides information about actual account values and actual expenses. You may use the information in this table, together with the amount you invested, to estimate the expenses that you paid over the period. Simply divide your account value by $1,000 (for example, an $8,600 account value divided by $1,000 = 8.6), then multiply the result by the number in the table under the heading entitled "Actual Expenses Paid During Period" to estimate the expenses you paid on your account during this period.
Hypothetical Example for Comparison Purposes
The table below provides information about hypothetical account values and hypothetical expenses based on the Fund's actual expense ratio and an assumed rate of return of 5% per year before expenses, which is not the Fund's actual return. The hypothetical account values and expenses may not be used to estimate the actual ending account balance or expenses you paid for the period. You may use this information to compare the ongoing costs of investing in the Fund and other funds. To do so, compare this 5% hypothetical example with the 5% hypothetical examples that appear in the shareholder reports of the other funds.
Please note that the expenses shown in the table are meant to highlight your ongoing costs only and do not reflect any transactional costs, such as sales charges (loads) and redemption fees. Therefore, the information for each class in the table is useful in comparing ongoing costs only, and will not help you determine the relative total costs of owning different funds. In addition, if these transactional costs were included, your costs would have been higher.
| | | Beginning
Account
Value
7/1/18 | | Actual Ending
Account
Value
12/31/18 | | Hypothetical
Ending Account
Value | | Actual
Expenses
Paid
During
Period* | | Hypothetical
Expenses Paid
During Period* | | Net
Expense
Ratio
During
Period** | |
Asia Opportunity Portfolio Class I | | $ | 1,000.00 | | | $ | 801.90 | | | $ | 1,019.66 | | | $ | 5.00 | | | $ | 5.60 | | | | 1.10 | % | |
Asia Opportunity Portfolio Class A | | | 1,000.00 | | | | 800.70 | | | | 1,017.69 | | | | 6.76 | | | | 7.58 | | | | 1.49 | | |
Asia Opportunity Portfolio Class C | | | 1,000.00 | | | | 797.50 | | | | 1,014.17 | | | | 9.92 | | | | 11.12 | | | | 2.19 | | |
Asia Opportunity Portfolio Class IS | | | 1,000.00 | | | | 802.00 | | | | 1,019.96 | | | | 4.72 | | | | 5.30 | | | | 1.04 | | |
* Expenses are calculated using each Fund Class' annualized net expense ratio (as disclosed), multiplied by the average account value over the period and multiplied by 184/365 (to reflect the most recent one-half year period).
** Annualized.
3
Morgan Stanley Institutional Fund, Inc.
Annual Report — December 31, 2018
Investment Overview (unaudited)
Asia Opportunity Portfolio
The Fund seeks long-term capital appreciation.
Performance
For the fiscal year ended December 31, 2018, the Fund's Class I shares had a total return based on net asset value and reinvestment of distributions per share of –13.65%, net of fees. The Fund's Class I shares outperformed the Fund's benchmark, the MSCI All Country Asia ex Japan Net Index (the "Index"), which returned –14.37%.
Factors Affecting Performance
• Concerns about weaker global growth, exacerbated by unpredictable geopolitics and reduced liquidity from developed market central banks, drove widespread losses in global equity markets in the 12-month period. For the Asia ex Japan region, the slowdown in China's economy and deteriorating trade relations between the U.S. and China slackened export demand and dampened the outlook for technology company profits. A strong U.S. dollar, depreciating emerging market currencies and higher oil prices added to inflation pressures and tightening financial conditions. Overall for the year, Asia ex Japan was among the weakest performing global equity regions.
• Asian equity markets declined 14.37% for the 12-month period ended December 31, 2018, as measured by the Index. Against this backdrop, our team remained focused on assessing company prospects over a longer-term period of three to five years, and owning a portfolio of high quality companies with diverse business drivers not tied to a particular market environment.
• The team manages concentrated portfolios that are highly differentiated from the benchmark, with securities weighted on our assessment of the quality of the company and our conviction. Our longer-term focus results in lower turnover than many of our peers. The value added or detracted in any period of time will typically result from stock selection, given our philosophy and process.
• For the 12-month period, the Fund outperformed the Index due to favorable stock selection and sector allocation.
• Contributing positively to relative performance was our stock selection in consumer discretionary and financials, along with an overweight in consumer staples.
• Relative detractors from performance included an overweight in consumer discretionary and stock selection in consumer staples and communication services.
Management Strategies
• There were no changes to our bottom-up investment process during the period. The team seeks high quality companies, which we define primarily as those with sustainable competitive advantages. We remain focused on assessing company prospects over a longer-term period of three to five years, and owning a portfolio of high-quality companies with diverse business drivers not tied to a particular market environment.
• At the close of the period ended December 31, 2018, consumer discretionary represented the largest sector weight in the Fund, followed by consumer staples and financials. The team's bottom-up investment process resulted in sector overweight positions in consumer discretionary, consumer staples and health care and underweight positions in information technology, financials, industrials, real estate, materials, energy, communication services and utilities. This Fund had no industrials, real estate, materials, energy and utilities holdings at the end of the reporting period.
4
Morgan Stanley Institutional Fund, Inc.
Annual Report — December 31, 2018
Investment Overview (unaudited) (cont'd)
Asia Opportunity Portfolio
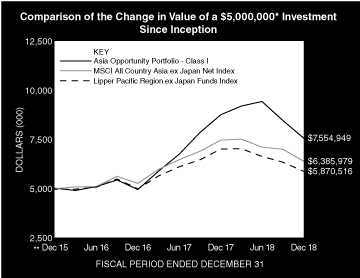
* Minimum Investment for Class I shares
** Commenced Operations on December 29, 2015.
In accordance with SEC regulations, the Fund's performance shown assumes that all recurring fees (including management fees) were deducted and all dividends and distributions were reinvested. The performance of Class A, C and IS shares will vary from the performance of Class I shares and will be negatively impacted by additional fees assessed to those classes (if applicable).
Performance Compared to the MSCI All Country Asia ex Japan Net Index(1) and the Lipper Pacific Region ex Japan Funds Index(2)
| | | Period Ended December 31, 2018
Total Returns(3) | |
| | | | Average Annual | |
| | | One
Year | | Five
Years | | Ten
Years | | Since
Inception(5) | |
Fund — Class I Shares
w/o sales charges(4) | | | –13.65 | % | | | — | | | | — | | | | 14.72 | % | |
Fund — Class A Shares
w/o sales charges(4) | | | –13.89 | | | | — | | | | — | | | | 14.35 | | |
Fund — Class A Shares with
maximum 5.25% sales charges(4) | | | –18.40 | | | | — | | | | — | | | | 12.33 | | |
Fund — Class C Shares
w/o sales charges(4) | | | –14.58 | | | | — | | | | — | | | | 13.46 | | |
Fund — Class C Shares with
maximum 1.00% deferred
sales charges(4) | | | –15.43 | | | | — | | | | — | | | | 13.46 | | |
Fund — Class IS Shares
w/o sales charges(4) | | | –13.59 | | | | — | | | | — | | | | 14.76 | | |
MSCI All Country Asia ex Japan
Net Index | | | –14.37 | | | | — | | | | — | | | | 8.48 | | |
Lipper Pacific Region ex Japan
Funds Index | | | –16.20 | | | | — | | | | — | | | | 5.48 | | |
Performance data quoted represents past performance, which is no guarantee of future results, and current performance may be lower or higher than the figures shown. Performance assumes that all dividends and distributions, if any, were reinvested. For the most recent month-end performance figures, please visit www.morganstanley.com/im/shareholderreports. Investment return and principal value will fluctuate so that Fund shares, when redeemed, may be worth more or less than their original cost. Total returns do not reflect the deduction of taxes that a shareholder would pay on Fund distributions or the redemption of Fund shares. Performance of share classes will vary due to difference in sales charges and expenses.
(1) The MSCI All Country Asia ex Japan Net Index is a free float-adjusted market capitalization weighted index that is designed to measure the equity market performance of Asia, excluding Japan. The performance of the Index is listed in U.S. dollars and assumes reinvestment of net dividends. Net total return indices reinvest dividends after the deduction of withholding taxes, using (for international indices) a tax rate applicable to non-resident institutional investors who do not benefit from double taxation treaties. The Index is unmanaged and its returns do not include any sales charges or fees. Such costs would lower performance. It is not possible to invest directly in an index.
(2) The Lipper Pacific Region ex Japan Funds Index is an equally weighted performance index of the largest qualifying funds (based on net assets) in the Lipper Pacific Region ex Japan Funds classification. The Index, which is adjusted for capital gains distributions and income dividends, is unmanaged and should not be considered an investment. There are currently 10 funds represented in this Index. As of the date of this report, the Fund was in the Lipper Pacific Region ex Japan Funds classification.
(3) Total returns for the Fund reflect fees waived and expenses reimbursed, if applicable, by Morgan Stanley Investment Management Inc. (the "Adviser"). Without such waivers and reimbursements, total returns would have been lower.
(4) Commenced operations on December 29, 2015.
(5) For comparative purposes, average annual since inception returns listed for the Indexes refer to the inception date of the Fund, not the inception of the Index.
5
Morgan Stanley Institutional Fund, Inc.
Annual Report — December 31, 2018
Portfolio of Investments
Asia Opportunity Portfolio
| | | Shares | | Value
(000) | |
Common Stocks (98.2%) | |
China (58.7%) | |
Alibaba Group Holding Ltd. ADR (a) | | | 8,896 | | | $ | 1,219 | | |
China Resources Beer Holdings Co., Ltd. (c) | | | 486,300 | | | | 1,685 | | |
Ctrip.com International Ltd. ADR (a) | | | 44,345 | | | | 1,200 | | |
Foshan Haitian Flavouring & Food Co., Ltd.,
Class A | | | 203,764 | | | | 2,040 | | |
Hangzhou Tigermed Consulting Co. Ltd.,
Class A | | | 135,797 | | | | 851 | | |
Huazhu Group Ltd. ADR (b) | | | 51,948 | | | | 1,487 | | |
Inner Mongolia Yili Industrial Group Co., Ltd.,
Class A | | | 312,799 | | | | 1,048 | | |
Jiangsu Hengrui Medicine Co., Ltd., Class A | | | 134,835 | | | | 1,042 | | |
Jiangsu Yanghe Brewery Joint-Stock Co., Ltd.,
Class A | | | 132,072 | | | | 1,820 | | |
Kweichow Moutai Co., Ltd., Class A | | | 21,096 | | | | 1,811 | | |
Shenzhou International Group Holdings Ltd. (c) | | | 153,000 | | | | 1,721 | | |
Suofeiya Home Collection Co., Ltd., Class A | | | 277,697 | | | | 677 | | |
TAL Education Group ADR (a) | | | 91,707 | | | | 2,447 | | |
Tencent Holdings Ltd. (c) | | | 37,800 | | | | 1,498 | | |
| | | | 20,546 | | |
Hong Kong (9.5%) | |
AIA Group Ltd. | | | 220,500 | | | | 1,814 | | |
Haidilao International Holding Ltd. (a)(d) | | | 373,000 | | | | 813 | | |
Meituan Dianping, Class B (a)(b) | | | 123,400 | | | | 694 | | |
| | | | 3,321 | | |
India (11.1%) | |
HDFC Bank Ltd. ADR | | | 37,579 | | | | 3,893 | | |
Korea, Republic of (4.8%) | |
NAVER Corp. | | | 15,478 | | | | 1,686 | | |
Philippines (1.9%) | |
Jollibee Foods Corp. | | | 119,620 | | | | 664 | | |
Taiwan (12.2%) | |
Nien Made Enterprise Co., Ltd. | | | 220,000 | | | | 1,674 | | |
Silergy Corp. | | | 60,000 | | | | 874 | | |
Taiwan Semiconductor Manufacturing Co., Ltd. | | | 239,000 | | | | 1,735 | | |
| | | | 4,283 | | |
Total Common Stocks (Cost $34,303) | | | 34,393 | | |
| | | Shares | | Value
(000) | |
Short-Term Investment (2.5%) | |
Investment Company (2.5%) | |
Morgan Stanley Institutional Liquidity
Funds — Treasury Securities Portfolio —
Institutional Class (See Note G)
(Cost $883) | | | 883,009 | | | $ | 883 | | |
Total Investments Excluding Purchased
Options (100.7%) (Cost $35,186) | | | 35,276 | | |
Total Purchased Options Outstanding (0.1%)
(Cost $114) | | | 23 | | |
Total Investments (100.8%) (Cost $35,300)
Including $778 of Securities Loaned (e)(f) | | | 35,299 | | |
Liabilities in Excess of Other Assets (–0.8%) | | | (293 | ) | |
Net Assets (100.0%) | | $ | 35,006 | | |
Country assignments and aggregations are based generally on third party vendor classifications and information, and may be different from the assignments and aggregations under the policies set forth in the Fund's prospectus and/or statement of additional information relating to geographic classifications.
(a) Non-income producing security.
(b) All or a portion of this security was on loan at December 31, 2018.
(c) Security trades on the Hong Kong exchange.
(d) 144A security — Certain conditions for public sale may exist. Unless otherwise noted, these securities are deemed to be liquid.
(e) The approximate fair value and percentage of net assets, $24,147,000 and 69.0%, respectively, represent the securities that have been fair valued under the fair valuation policy for international investments as described in Note A-1 within the Notes to the Financial Statements.
(f) At December 31, 2018, the aggregate cost for federal income tax purposes is approximately $35,547,000. The aggregate gross unrealized appreciation is approximately $2,553,000 and the aggregate gross unrealized depreciation is approximately $2,801,000, resulting in net unrealized depreciation of approximately $248,000.
ADR American Depositary Receipt
The accompanying notes are an integral part of the financial statements.
6
Morgan Stanley Institutional Fund, Inc.
Annual Report — December 31, 2018
Portfolio of Investments (cont'd)
Asia Opportunity Portfolio
Call Options Purchased:
The Fund had the following call options purchased open at December 31, 2018:
Counterparty | | Description | | Strike
Price | | Expiration
Date | | Number of
Contracts | | Notional
Amount
(000) | | Value
(000) | | Premiums
Paid
(000) | | Unrealized
Depreciation
(000) | |
Royal Bank of Scotland | | USD/CNH | | CNH | 7.16 | | | Jan-19 | | | 6,749,451 | | | | 6,749 | | | $ | 1 | | | $ | 29 | | | $ | (28 | ) | |
Royal Bank of Scotland | | USD/CNH | | CNH | 7.78 | | | Jul-19 | | | 9,522,180 | | | | 9,522 | | | | 10 | | | | 47 | | | | (37 | ) | |
Royal Bank of Scotland | | USD/CNH | | CNH | 8.00 | | | Oct-19 | | | 6,421,881 | | | | 6,422 | | | | 12 | | | | 38 | | | | (26 | ) | |
| | | | | | | | | | | | | $ | 23 | | | $ | 114 | | | $ | (91 | ) | |
CNH — Chinese Yuan Renminbi Offshore
USD — United States Dollar
Portfolio Composition
Classification | | Percentage of
Total Investments | |
Beverages | | | 15.1 | % | |
Other* | | | 12.7 | | |
Interactive Media & Services | | | 12.5 | | |
Banks | | | 11.0 | | |
Food Products | | | 8.8 | | |
Hotels, Restaurants & Leisure | | | 8.4 | | |
Semiconductors & Semiconductor Equipment | | | 7.4 | | |
Diversified Consumer Services | | | 6.9 | | |
Household Durables | | | 6.7 | | |
Internet & Direct Marketing Retail | | | 5.4 | | |
Insurance | | | 5.1 | | |
Total Investments | | | 100.0 | % | |
* Industries and/or investment types representing less than 5% of total investments.
The accompanying notes are an integral part of the financial statements.
7
Morgan Stanley Institutional Fund, Inc.
Annual Report — December 31, 2018
Asia Opportunity Portfolio
Statement of Assets and Liabilities | | December 31, 2018
(000) | |
Assets: | |
Investments in Securities of Unaffiliated Issuers, at Value(1) (Cost $34,417) | | $ | 34,416 | | |
Investment in Security of Affiliated Issuer, at Value (Cost $883) | | | 883 | | |
Total Investments in Securities, at Value (Cost $35,300) | | | 35,299 | | |
Foreign Currency, at Value (Cost —@) | | | — | @ | |
Receivable for Investments Sold | | | 374 | | |
Receivable for Fund Shares Sold | | | 121 | | |
Dividends Receivable | | | 18 | | |
Receivable from Affiliate | | | 4 | | |
Receivable from Securities Lending Income | | | 1 | | |
Other Assets | | | 48 | | |
Total Assets | | | 35,865 | | |
Liabilities: | |
Payable for Investments Purchased | | | 424 | | |
Payable for Fund Shares Redeemed | | | 315 | | |
Payable for Professional Fees | | | 76 | | |
Payable for Advisory Fees | | | 9 | | |
Payable for Custodian Fees | | | 8 | | |
Payable for Transfer Agency Fees — Class I | | | 1 | | |
Payable for Transfer Agency Fees — Class A | | | 4 | | |
Payable for Transfer Agency Fees — Class C | | | 1 | | |
Payable for Transfer Agency Fees — Class IS | | | — | @ | |
Payable for Sub Transfer Agency Fees — Class I | | | 3 | | |
Payable for Sub Transfer Agency Fees — Class A | | | 1 | | |
Payable for Sub Transfer Agency Fees — Class C | | | — | @ | |
Payable for Shareholder Services Fees — Class A | | | 2 | | |
Payable for Distribution and Shareholder Services Fees — Class C | | | 2 | | |
Payable for Administration Fees | | | 3 | | |
Other Liabilities | | | 10 | | |
Total Liabilities | | | 859 | | |
Net Assets | | $ | 35,006 | | |
Net Assets Consist of: | |
Paid-in-Capital | | $ | 37,459 | | |
Total Accumulated Loss | | | (2,453 | ) | |
Net Assets | | $ | 35,006 | | |
The accompanying notes are an integral part of the financial statements.
8
Morgan Stanley Institutional Fund, Inc.
Annual Report — December 31, 2018
Asia Opportunity Portfolio
Statement of Assets and Liabilities (cont'd) | | December 31, 2018
(000) | |
CLASS I: | |
Net Assets | | $ | 25,479 | | |
| Shares Outstanding $0.001 par value shares of beneficial interest (unlimited shares authorized) (not in 000's) | | | 1,753,195 | | |
Net Asset Value, Offering and Redemption Price Per Share | | $ | 14.53 | | |
CLASS A: | |
Net Assets | | $ | 6,930 | | |
| Shares Outstanding $0.001 par value shares of beneficial interest (unlimited shares authorized) (not in 000's) | | | 480,662 | | |
Net Asset Value, Redemption Price Per Share | | $ | 14.42 | | |
Maximum Sales Load | | | 5.25 | % | |
Maximum Sales Charge | | $ | 0.80 | | |
Maximum Offering Price Per Share | | $ | 15.22 | | |
CLASS C: | |
Net Assets | | $ | 2,582 | | |
| Shares Outstanding $0.001 par value shares of beneficial interest (unlimited shares authorized) (not in 000's) | | | 181,679 | | |
Net Asset Value, Offering and Redemption Price Per Share | | $ | 14.21 | | |
CLASS IS: | |
Net Assets | | $ | 15 | | |
| Shares Outstanding $0.001 par value shares of beneficial interest (unlimited shares authorized) (not in 000's) | | | 1,000 | | |
Net Asset Value, Offering and Redemption Price Per Share | | $ | 14.54 | | |
(1) Including:
Securities on Loan, at Value: | | $ | 778 | | |
@ Amount is less than $500.
The accompanying notes are an integral part of the financial statements.
9
Morgan Stanley Institutional Fund, Inc.
Annual Report — December 31, 2018
Asia Opportunity Portfolio
Statement of Operations | | Year Ended
December 31, 2018
(000) | |
Investment Income: | |
Dividends from Securities of Unaffiliated Issuers (Net of $50 of Foreign Taxes Withheld) | | $ | 404 | | |
Dividends from Security of Affiliated Issuer (Note G) | | | 48 | | |
Income from Securities Loaned — Net | | | 9 | | |
Total Investment Income | | | 461 | | |
Expenses: | |
Advisory Fees (Note B) | | | 320 | | |
Professional Fees | | | 138 | | |
Registration Fees | | | 57 | | |
Custodian Fees (Note F) | | | 52 | | |
Shareholder Services Fees — Class A (Note D) | | | 21 | | |
Distribution and Shareholder Services Fees — Class C (Note D) | | | 22 | | |
Administration Fees (Note C) | | | 32 | | |
Sub Transfer Agency Fees — Class I | | | 19 | | |
Sub Transfer Agency Fees — Class A | | | 5 | | |
Sub Transfer Agency Fees — Class C | | | 2 | | |
Transfer Agency Fees — Class I (Note E) | | | 3 | | |
Transfer Agency Fees — Class A (Note E) | | | 11 | | |
Transfer Agency Fees — Class C (Note E) | | | 2 | | |
Transfer Agency Fees — Class IS (Note E) | | | 2 | | |
Shareholder Reporting Fees | | | 14 | | |
Directors' Fees and Expenses | | | 4 | | |
Other Expenses | | | 24 | | |
Total Expenses | | | 728 | | |
Waiver of Advisory Fees (Note B) | | | (221 | ) | |
Reimbursement of Class Specific Expenses — Class I (Note B) | | | (7 | ) | |
Reimbursement of Class Specific Expenses — Class A (Note B) | | | (4 | ) | |
Reimbursement of Class Specific Expenses — Class C (Note B) | | | (1 | ) | |
Reimbursement of Class Specific Expenses — Class IS (Note B) | | | (2 | ) | |
Rebate from Morgan Stanley Affiliate (Note G) | | | (6 | ) | |
Net Expenses | | | 487 | | |
Net Investment Loss | | | (26 | ) | |
Realized Loss: | |
Investments Sold | | | (2,342 | ) | |
Foreign Currency Translation | | | (18 | ) | |
Net Realized Loss | | | (2,360 | ) | |
Change in Unrealized Appreciation (Depreciation): | |
Investments | | | (5,627 | ) | |
Foreign Currency Translation | | | 1 | | |
Net Change in Unrealized Appreciation (Depreciation) | | | (5,626 | ) | |
Net Realized Loss and Change in Unrealized Appreciation (Depreciation) | | | (7,986 | ) | |
Net Decrease in Net Assets Resulting from Operations | | $ | (8,012 | ) | |
The accompanying notes are an integral part of the financial statements.
10
Morgan Stanley Institutional Fund, Inc.
Annual Report — December 31, 2018
Asia Opportunity Portfolio
Statements of Changes in Net Assets | | Year Ended
December 31, 2018
(000) | | Year Ended
December 31, 2017
(000) | |
Increase (Decrease) in Net Assets: | |
Operations: | |
Net Investment Loss | | $ | (26 | ) | | $ | (40 | ) | |
Net Realized Gain (Loss) | | | (2,360 | ) | | | 560 | | |
Net Change in Unrealized Appreciation (Depreciation) | | | (5,626 | ) | | | 5,612 | | |
Net Increase (Decrease) in Net Assets Resulting from Operations | | | (8,012 | ) | | | 6,132 | | |
Dividends and Distributions to Shareholders: | |
Class I | | | (184 | ) | | | (177 | )* | |
Class A | | | (55 | ) | | | (32 | )* | |
Class C | | | (17 | ) | | | (5 | )* | |
Class IS | | | (— | @) | | | (— | @)* | |
Total Dividends and Distributions to Shareholders | | | (256 | ) | | | (214 | ) | |
Capital Share Transactions:(1) | |
Class I: | |
Subscribed | | | 25,301 | | | | 5,518 | | |
Distributions Reinvested | | | 135 | | | | 82 | | |
Redeemed | | | (10,225 | ) | | | (172 | ) | |
Class A: | |
Subscribed | | | 14,058 | | | | 1,637 | | |
Distributions Reinvested | | | 55 | | | | 32 | | |
Redeemed | | | (8,094 | ) | | | (80 | ) | |
Class C: | |
Subscribed | | | 3,603 | | | | 333 | | |
Distributions Reinvested | | | 17 | | | | 5 | | |
Redeemed | | | (813 | ) | | | — | | |
Net Increase in Net Assets Resulting from Capital Share Transactions | | | 24,037 | | | | 7,355 | | |
Redemption Fees | | | 3 | | | | 1 | | |
Total Increase in Net Assets | | | 15,772 | | | | 13,274 | | |
Net Assets: | |
Beginning of Period | | | 19,234 | | | | 5,960 | | |
End of Period | | $ | 35,006 | | | $ | 19,234 | † | |
The accompanying notes are an integral part of the financial statements.
11
Morgan Stanley Institutional Fund, Inc.
Annual Report — December 31, 2018
Asia Opportunity Portfolio
Statements of Changes in Net Assets (cont'd) | | Year Ended
December 31, 2018
(000) | | Year Ended
December 31, 2017
(000) | |
(1) Capital Share Transactions: | |
Class I: | |
Shares Subscribed | | | 1,448 | | | | 388 | | |
Shares Issued on Distributions Reinvested | | | 8 | | | | 5 | | |
Shares Redeemed | | | (643 | ) | | | (11 | ) | |
Net Increase in Class I Shares Outstanding | | | 813 | | | | 382 | | |
Class A: | |
Shares Subscribed | | | 817 | | | | 118 | | |
Shares Issued on Distributions Reinvested | | | 3 | | | | 2 | | |
Shares Redeemed | | | (510 | ) | | | (5 | ) | |
Net Increase in Class A Shares Outstanding | | | 310 | | | | 115 | | |
Class C: | |
Shares Subscribed | | | 208 | | | | 25 | | |
Shares Issued on Distributions Reinvested | | | 1 | | | | — | @@ | |
Shares Redeemed | | | (53 | ) | | | — | | |
Net Increase in Class C Shares Outstanding | | | 156 | | | | 25 | | |
The following information was previously reported in the December 31, 2017 financial statements. The distribution information for the year ended December 31, 2017 presented on the Statements of Changes in Net Assets is presented for comparative purposes to the December 31, 2018 financial statements, which conform to the SEC Final Rule on Disclosure Update and Simplification which was effective November 5, 2018.
* Dividends and Distributions to Shareholders for the year ended December 31, 2017 were as follows:
Class I: | |
Net Realized Gain | | $ | (177 | ) | |
Class A: | |
Net Realized Gain | | $ | (32 | ) | |
Class C: | |
Net Realized Gain | | $ | (5 | ) | |
Class IS: | |
Net Realized Gain | | $ | (— | @) | |
† Accumulated Net Investment Loss for the year ended December 31, 2017 was $(56).
@ Amount is less than $500.
@@ Amount is less than 500 shares.
The accompanying notes are an integral part of the financial statements.
12
Morgan Stanley Institutional Fund, Inc.
Annual Report — December 31, 2018
Financial Highlights
Asia Opportunity Portfolio
| | | Class I | |
| | | Year Ended December 31, | | Period from
December 29, 2015(1) to | |
Selected Per Share Data and Ratios | | 2018 | | 2017 | | 2016 | | December 31, 2015 | |
Net Asset Value, Beginning of Period | | $ | 16.92 | | | $ | 9.68 | | | $ | 10.03 | | | $ | 10.00 | | |
Income (Loss) from Investment Operations: | |
Net Investment Income (Loss)(2) | | | 0.01 | | | | (0.04 | ) | | | (0.03 | ) | | | (0.00 | )(3) | |
Net Realized and Unrealized Gain (Loss) | | | (2.30 | ) | | | 7.47 | | | | (0.10 | ) | | | 0.03 | | |
Total from Investment Operations | | | (2.29 | ) | | | 7.43 | | | | (0.13 | ) | | | 0.03 | | |
Distributions from and/or in Excess of: | |
Net Investment Income | | | — | | | | — | | | | (0.08 | ) | | | — | | |
Net Realized Gain | | | (0.10 | ) | | | (0.19 | ) | | | — | | | | — | | |
Paid-in-Capital | | | — | | | | — | | | | (0.14 | ) | | | — | | |
Total Distributions | | | (0.10 | ) | | | (0.19 | ) | | | (0.22 | ) | | | — | | |
Redemption Fees | | | 0.00 | (3) | | | 0.00 | (3) | | | — | | | | — | | |
Net Asset Value, End of Period | | $ | 14.53 | | | $ | 16.92 | | | $ | 9.68 | | | $ | 10.03 | | |
Total Return(4) | | | (13.65 | )% | | | 76.82 | % | | | (1.34 | )% | | | 0.30 | %(6) | |
Ratios and Supplemental Data: | |
Net Assets, End of Period (Thousands) | | $ | 25,479 | | | $ | 15,913 | | | $ | 5,405 | | | $ | 5,587 | | |
Ratio of Expenses to Average Net Assets(8) | | | 1.09 | %(5) | | | 1.06 | %(5) | | | 1.08 | %(5) | | | 1.03 | %(5)(7) | |
Ratio of Net Investment Income (Loss) to Average Net Assets(8) | | | 0.04 | %(5) | | | (0.27 | )%(5) | | | (0.31 | )%(5) | | | (0.71 | )%(5)(7) | |
Ratio of Rebate from Morgan Stanley Affiliates to Average Net Assets | | | 0.01 | % | | | 0.01 | % | | | 0.01 | % | | | 0.04 | %(7) | |
Portfolio Turnover Rate | | | 63 | % | | | 50 | % | | | 44 | % | | | 0 | %(6) | |
(8) Supplemental Information on the Ratios to Average Net Assets: | |
Ratios Before Expense Limitation: | |
Expenses to Average Net Assets | | | 1.67 | % | | | 3.10 | % | | | 5.28 | % | | | 125.50 | %(7) | |
Net Investment Loss to Average Net Assets | | | (0.54 | )% | | | (2.31 | )% | | | (4.51 | )% | | | (125.18 | )%(7) | |
(1) Commencement of Operations.
(2) Per share amount is based on average shares outstanding.
(3) Amount is less than $0.005 per share.
(4) Calculated based on the net asset value as of the last business day of the period.
(5) The Ratios of Expenses and Net Investment Income (Loss) reflect the rebate of certain Fund expenses in connection with the investments in Morgan Stanley affiliates during the period. The effect of the rebate on the ratios is disclosed in the above table as "Ratio of Rebate from Morgan Stanley Affiliates to Average Net Assets."
(6) Not annualized.
(7) Annualized.
The accompanying notes are an integral part of the financial statements.
13
Morgan Stanley Institutional Fund, Inc.
Annual Report — December 31, 2018
Financial Highlights
Asia Opportunity Portfolio
| | | Class A | |
| | | Year Ended December 31, | | Period from
December 29, 2015(1) to | |
Selected Per Share Data and Ratios | | 2018 | | 2017 | | 2016 | | December 31, 2015 | |
Net Asset Value, Beginning of Period | | $ | 16.84 | | | $ | 9.67 | | | $ | 10.03 | | | $ | 10.00 | | |
Income (Loss) from Investment Operations: | |
Net Investment Loss(2) | | | (0.04 | ) | | | (0.10 | ) | | | (0.08 | ) | | | (0.00 | )(3) | |
Net Realized and Unrealized Gain (Loss) | | | (2.28 | ) | | | 7.46 | | | | (0.09 | ) | | | 0.03 | | |
Total from Investment Operations | | | (2.32 | ) | | | 7.36 | | | | (0.17 | ) | | | 0.03 | | |
Distributions from and/or in Excess of: | |
Net Investment Income | | | — | | | | — | | | | (0.05 | ) | | | — | | |
Net Realized Gain | | | (0.10 | ) | | | (0.19 | ) | | | — | | | | — | | |
Paid-in-Capital | | | — | | | | — | | | | (0.14 | ) | | | — | | |
Total Distributions | | | (0.10 | ) | | | (0.19 | ) | | | (0.19 | ) | | | — | | |
Redemption Fees | | | 0.00 | (3) | | | 0.00 | (3) | | | — | | | | — | | |
Net Asset Value, End of Period | | $ | 14.42 | | | $ | 16.84 | | | $ | 9.67 | | | $ | 10.03 | | |
Total Return(4) | | | (13.89 | )% | | | 76.17 | % | | | (1.67 | )% | | | 0.30 | %(6) | |
Ratios and Supplemental Data: | |
Net Assets, End of Period (Thousands) | | $ | 6,930 | | | $ | 2,873 | | | $ | 535 | | | $ | 10 | | |
Ratio of Expenses to Average Net Assets(8) | | | 1.44 | %(5) | | | 1.44 | %(5) | | | 1.44 | %(5) | | | 1.40 | %(5)(7) | |
Ratio of Net Investment Loss to Average Net Assets(8) | | | (0.22 | )%(5) | | | (0.69 | )%(5) | | | (0.78 | )%(5) | | | (1.09 | )%(5)(7) | |
Ratio of Rebate from Morgan Stanley Affiliates to Average Net Assets | | | 0.01 | % | | | 0.01 | % | | | 0.01 | % | | | 0.05 | %(7) | |
Portfolio Turnover Rate | | | 63 | % | | | 50 | % | | | 44 | % | | | 0 | %(6) | |
(8) Supplemental Information on the Ratios to Average Net Assets: | |
Ratios Before Expense Limitation: | |
Expenses to Average Net Assets | | | 2.05 | % | | | 3.50 | % | | | 6.36 | % | | | 139.50 | %(7) | |
Net Investment Loss to Average Net Assets | | | (0.83 | )% | | | (2.75 | )% | | | (5.70 | )% | | | (139.19 | )%(7) | |
(1) Commencement of Operations.
(2) Per share amount is based on average shares outstanding.
(3) Amount is less than $0.005 per share.
(4) Calculated based on the net asset value which does not reflect sales charges, if applicable, as of the last business day of the period.
(5) The Ratios of Expenses and Net Investment Loss reflect the rebate of certain Fund expenses in connection with the investments in Morgan Stanley affiliates during the period. The effect of the rebate on the ratios is disclosed in the above table as "Ratio of Rebate from Morgan Stanley Affiliates to Average Net Assets."
(6) Not annualized.
(7) Annualized.
The accompanying notes are an integral part of the financial statements.
14
Morgan Stanley Institutional Fund, Inc.
Annual Report — December 31, 2018
Financial Highlights
Asia Opportunity Portfolio
| | | Class C | |
| | | Year Ended December 31, | | Period from
December 29, 2015(1) to | |
Selected Per Share Data and Ratios | | 2018 | | 2017 | | 2016 | | December 31, 2015 | |
Net Asset Value, Beginning of Period | | $ | 16.73 | | | $ | 9.68 | | | $ | 10.03 | | | $ | 10.00 | | |
Income (Loss) from Investment Operations: | |
Net Investment Loss(2) | | | (0.15 | ) | | | (0.22 | ) | | | (0.14 | ) | | | (0.00 | )(3) | |
Net Realized and Unrealized Gain (Loss) | | | (2.27 | ) | | | 7.46 | | | | (0.10 | ) | | | 0.03 | | |
Total from Investment Operations | | | (2.42 | ) | | | 7.24 | | | | (0.24 | ) | | | 0.03 | | |
Distributions from and/or in Excess of: | |
Net Realized Gain | | | (0.10 | ) | | | (0.19 | ) | | | — | | | | — | | |
Paid-in-Capital | | | — | | | | — | | | | (0.11 | ) | | | — | | |
Total Distributions | | | (0.10 | ) | | | (0.19 | ) | | | (0.11 | ) | | | — | | |
Redemption Fees | | | 0.00 | (3) | | | 0.00 | (3) | | | — | | | | — | | |
Net Asset Value, End of Period | | $ | 14.21 | | | $ | 16.73 | | | $ | 9.68 | | | $ | 10.03 | | |
Total Return(4) | | | (14.58 | )% | | | 74.85 | % | | | (2.44 | )% | | | 0.30 | %(6) | |
Ratios and Supplemental Data: | |
Net Assets, End of Period (Thousands) | | $ | 2,582 | | | $ | 431 | | | $ | 10 | | | $ | 10 | | |
Ratio of Expenses to Average Net Assets(8) | | | 2.19 | %(5) | | | 2.19 | %(5) | | | 2.19 | %(5) | | | 2.17 | %(5)(7) | |
Ratio of Net Investment Loss to Average Net Assets(8) | | | (0.92 | )%(5) | | | (1.51 | )%(5) | | | (1.42 | )%(5) | | | (1.84 | )%(5)(7) | |
Ratio of Rebate from Morgan Stanley Affiliates to Average Net Assets | | | 0.01 | % | | | 0.01 | % | | | 0.01 | % | | | 0.03 | %(7) | |
Portfolio Turnover Rate | | | 63 | % | | | 50 | % | | | 44 | % | | | 0 | %(6) | |
(8) Supplemental Information on the Ratios to Average Net Assets: | |
Ratios Before Expense Limitation: | |
Expenses to Average Net Assets | | | 2.80 | % | | | 5.26 | % | | | 27.34 | % | | | 140.25 | %(7) | |
Net Investment Loss to Average Net Assets | | | (1.53 | )% | | | (4.58 | )% | | | (26.57 | )% | | | (139.92 | )%(7) | |
(1) Commencement of Operations.
(2) Per share amount is based on average shares outstanding.
(3) Amount is less than $0.005 per share.
(4) Calculated based on the net asset value which does not reflect sales charges, if applicable, as of the last business day of the period.
(5) The Ratios of Expenses and Net Investment Loss reflect the rebate of certain Fund expenses in connection with the investments in Morgan Stanley affiliates during the period. The effect of the rebate on the ratios is disclosed in the above table as "Ratio of Rebate from Morgan Stanley Affiliates to Average Net Assets."
(6) Not annualized.
(7) Annualized.
The accompanying notes are an integral part of the financial statements.
15
Morgan Stanley Institutional Fund, Inc.
Annual Report — December 31, 2018
Financial Highlights
Asia Opportunity Portfolio
| | | Class IS | |
| | | Year Ended December 31, | | Period from
December 29, 2015(1) to | |
Selected Per Share Data and Ratios | | 2018 | | 2017 | | 2016 | | December 31, 2015 | |
Net Asset Value, Beginning of Period | | $ | 16.92 | | | $ | 9.68 | | | $ | 10.03 | | | $ | 10.00 | | |
Income (Loss) from Investment Operations: | |
Net Investment Income (Loss)(2) | | | 0.01 | | | | (0.02 | ) | | | (0.03 | ) | | | (0.00 | )(3) | |
Net Realized and Unrealized Gain (Loss) | | | (2.29 | ) | | | 7.45 | | | | (0.10 | ) | | | 0.03 | | |
Total from Investment Operations | | | (2.28 | ) | | | 7.43 | | | | (0.13 | ) | | | 0.03 | | |
Distributions from and/or in Excess of: | |
Net Investment Income | | | — | | | | — | | | | (0.08 | ) | | | — | | |
Net Realized Gain | | | (0.10 | ) | | | (0.19 | ) | | | — | | | | — | | |
Paid-in-Capital | | | — | | | | — | | | | (0.14 | ) | | | — | | |
Total Distributions | | | (0.10 | ) | | | (0.19 | ) | | | (0.22 | ) | | | — | | |
Redemption Fees | | | 0.00 | (3) | | | 0.00 | (3) | | | — | | | | — | | |
Net Asset Value, End of Period | | $ | 14.54 | | | $ | 16.92 | | | $ | 9.68 | | | $ | 10.03 | | |
Total Return(4) | | | (13.59 | )% | | | 76.82 | % | | | (1.29 | )% | | | 0.30 | %(6) | |
Ratios and Supplemental Data: | |
Net Assets, End of Period (Thousands) | | $ | 15 | | | $ | 17 | | | $ | 10 | | | $ | 10 | | |
Ratio of Expenses to Average Net Assets(8) | | | 1.04 | %(5) | | | 1.04 | %(5) | | | 1.04 | %(5) | | | 1.02 | %(5)(7) | |
Ratio of Net Investment Income (Loss) to Average Net Assets(8) | | | 0.05 | %(5) | | | (0.18 | )%(5) | | | (0.26 | )%(5) | | | (0.69 | )%(5)(7) | |
Ratio of Rebate from Morgan Stanley Affiliates to Average Net Assets | | | 0.01 | % | | | 0.01 | % | | | 0.01 | % | | | 0.03 | %(7) | |
Portfolio Turnover Rate | | | 63 | % | | | 50 | % | | | 44 | % | | | 0 | %(6) | |
(8) Supplemental Information on the Ratios to Average Net Assets: | |
Ratios Before Expense Limitation: | |
Expenses to Average Net Assets | | | 13.31 | % | | | 17.65 | % | | | 25.20 | % | | | 139.25 | %(7) | |
Net Investment Loss to Average Net Assets | | | (12.22 | )% | | | (16.79 | )% | | | (24.42 | )% | | | (138.92 | )%(7) | |
(1) Commencement of Operations.
(2) Per share amount is based on average shares outstanding.
(3) Amount is less than $0.005 per share.
(4) Calculated based on the net asset value as of the last business day of the period.
(5) The Ratios of Expenses and Net Investment Income (Loss) reflect the rebate of certain Fund expenses in connection with the investments in Morgan Stanley affiliates during the period. The effect of the rebate on the ratios is disclosed in the above table as "Ratio of Rebate from Morgan Stanley Affiliates to Average Net Assets."
(6) Not annualized.
(7) Annualized.
The accompanying notes are an integral part of the financial statements.
16
Morgan Stanley Institutional Fund, Inc.
Annual Report — December 31, 2018
Notes to Financial Statements
Morgan Stanley Institutional Fund, Inc. (the "Company") is registered under the Investment Company Act of 1940, as amended (the "Act"), as an open-end management investment company. The Company is comprised of thirty separate, active, diversified and non-diversified funds (individually referred to as a "Fund", collectively as the "Funds"). The Company applies investment company accounting and reporting guidance.
The accompanying financial statements relate to the Asia Opportunity Portfolio. The Fund seeks long-term capital appreciation.
The Fund offers four classes of shares — Class I, Class A, Class C and Class IS.
A. Significant Accounting Policies: The following significant accounting policies are in conformity with U.S. generally accepted accounting principles ("GAAP"). Such policies are consistently followed by the Company in the preparation of its financial statements. GAAP may require management to make estimates and assumptions that affect the reported amounts and disclosures in the financial statements. Actual results may differ from those estimates.
In August 2018, the Financial Accounting Standards Board ("FASB") issued Accounting Standards Update ("ASU") 2018-13, Fair Value Measurement (Topic 820) — Disclosures Framework — Changes to Disclosure Requirements of Fair Value Measurement ("ASU 2018-13") which introduces new fair value disclosure requirements as well as eliminates and modifies certain existing fair value disclosure requirements. ASU 2018-13 would be effective for fiscal years beginning after December 15, 2019 and for interim periods within those fiscal years; however, management has elected to early adopt ASU 2018-13 effective with the current reporting period as permitted by the standard. The impact of the Fund's adoption was limited to changes in the Fund's financial statement disclosures regarding fair value, primarily those disclosures related to transfers between levels of the fair value hierarchy and disclosure of the range and weighted average used to develop significant unobservable inputs for Level 3 fair value measurements, when applicable.
1. Security Valuation: (1) An equity portfolio security listed or traded on an exchange is valued at its latest reported sales price (or at the exchange official closing price if such exchange reports an official closing price), and if there were no sales on a given day and if there is no official exchange closing price for that day, the security is valued at the mean between the last reported bid and asked prices
if such bid and asked prices are available on the relevant exchanges. Listed equity securities not traded on the valuation date with no reported bid and asked prices available on the exchange are valued at the mean between the current bid and asked prices obtained from one or more reputable brokers or dealers. In cases where a security is traded on more than one exchange, the security is valued on the exchange designated as the primary market; (2) all other equity portfolio securities for which over-the-counter ("OTC") market quotations are readily available are valued at the latest reported sales price (or at the market official closing price if such market reports an official closing price), and if there was no trading in the security on a given day and if there is no official closing price from relevant markets for that day, the security is valued at the mean between the last reported bid and asked prices if such bid and asked prices are available on the relevant markets. An unlisted equity security that does not trade on the valuation date and for which bid and asked prices from the relevant markets are unavailable is valued at the mean between the current bid and asked prices obtained from one or more reputable brokers or dealers; (3) certain portfolio securities may be valued by an outside pricing service/vendor approved by the Company's Board of Directors (the "Directors"). The pricing service/vendor may employ a pricing model that takes into account, among other things, bids, yield spreads and/or other market data and specific security characteristics. Alternatively, if a valuation is not available from an outside pricing service/vendor, and the security trades on an exchange, the security may be valued at its latest reported sale price (or at the exchange official closing price if such exchange reports an official closing price), prior to the time when assets are valued. If there are no sales on a given day and if there is no official exchange closing price for that day, the security is valued at the mean between the last reported bid and asked prices if such bid and asked prices are available in the relevant exchanges; (4) listed options are valued at the last reported sales price on the exchange on which they are listed (or at the exchange official closing price if such exchange reports an official closing price). If an official closing price or last reported sales price is unavailable, the listed option should be fair valued at the mean between its latest bid and ask prices. Unlisted options are valued at the mean between their latest bid and ask prices from a broker/dealer or valued by a pricing service/vendor; (5) when market quotations are not readily available, including circumstances
17
Morgan Stanley Institutional Fund, Inc.
Annual Report — December 31, 2018
Notes to Financial Statements (cont'd)
under which Morgan Stanley Investment Management Inc. (the "Adviser") determines that the closing price, last sale price or the mean between the last reported bid and asked prices are not reflective of a security's market value, portfolio securities are valued at their fair value as determined in good faith under procedures established by and under the general supervision of the Directors. Occasionally, developments affecting the closing prices of securities and other assets may occur between the times at which valuations of such securities are determined (that is, close of the foreign market on which the securities trade) and the close of business of the New York Stock Exchange ("NYSE"). If developments occur during such periods that are expected to materially affect the value of such securities, such valuations may be adjusted to reflect the estimated fair value of such securities as of the close of the NYSE, as determined in good faith by the Directors or by the Adviser using a pricing service and/or procedures approved by the Directors; (6) quotations of foreign portfolio securities, other assets and liabilities and forward contracts stated in foreign currency are translated into U.S. dollar equivalents at the prevailing market rates prior to the close of the NYSE; and (7) investments in mutual funds, including the Morgan Stanley Institutional Liquidity Funds, are valued at the net asset value ("NAV") as of the close of each business day.
The Directors have responsibility for determining in good faith the fair value of the investments, and the Directors may appoint others, such as the Company's Adviser or a valuation committee, to assist the Directors in determining fair value and to make the actual calculations pursuant to the fair valuation methodologies previously approved by the Directors. Under procedures approved by the Directors, the Company's Adviser has formed a Valuation Committee whose members are approved by the Directors. The Valuation Committee provides administration and oversight of the Company's valuation policies and procedures, which are reviewed at least annually by the Directors. These procedures allow the Company to utilize independent pricing services, quotations from securities and financial instrument dealers and other market sources to determine fair value.
2. Fair Value Measurement: FASB Accounting Standards CodificationTM ("ASC") 820, "Fair Value Measurement" ("ASC 820"), defines fair value as the value that the
Fund would receive to sell an investment or pay to transfer a liability in a timely transaction with an independent buyer in the principal market, or in the absence of a principal market, the most advantageous market for the investment or liability. ASC 820 establishes a three-tier hierarchy to distinguish between (1) inputs that reflect the assumptions market participants would use in valuing an asset or liability developed based on market data obtained from sources independent of the reporting entity (observable inputs) and (2) inputs that reflect the reporting entity's own assumptions about the assumptions market participants would use in valuing an asset or liability developed based on the best information available in the circumstances (unobservable inputs) and to establish classification of fair value measurements for disclosure purposes. Various inputs are used in determining the value of the Fund's investments. The inputs are summarized in the three broad levels listed below:
• Level 1 – unadjusted quoted prices in active markets for identical investments
• Level 2 – other significant observable inputs (including quoted prices for similar investments, interest rates, prepayment speeds, credit risk, etc.)
• Level 3 – significant unobservable inputs including the Fund's own assumptions in determining the fair value of investments. Factors considered in making this determination may include, but are not limited to, information obtained by contacting the issuer, analysts, or the appropriate stock exchange (for exchange-traded securities), analysis of the issuer's financial statements or other available documents and, if necessary, available information concerning other securities in similar circumstances
The inputs or methodology used for valuing securities are not necessarily an indication of the risk associated with investing in those securities and the determination of the significance of a particular input to the fair value measurement in its entirety requires judgment and considers factors specific to each security.
18
Morgan Stanley Institutional Fund, Inc.
Annual Report — December 31, 2018
Notes to Financial Statements (cont'd)
The following is a summary of the inputs used to value the Fund's investments as of December 31, 2018:
Investment Type | | Level 1
Unadjusted
quoted
prices
(000) | | Level 2
Other
significant
observable
inputs
(000) | | Level 3
Significant
unobservable
inputs
(000) | | Total
(000) | |
Assets: | |
Common Stocks | |
Banks | | $ | 3,893 | | | $ | — | | | $ | — | | | $ | 3,893 | | |
Beverages | | | — | | | | 5,316 | | | | — | | | | 5,316 | | |
Diversified Consumer
Services | | | 2,447 | | | | — | | | | — | | | | 2,447 | | |
Food Products | | | — | | | | 3,087 | | | | — | | | | 3,087 | | |
Hotels, Restaurants &
Leisure | | | 1,487 | | | | 1,478 | | | | — | | | | 2,965 | | |
Household Durables | | | — | | | | 2,351 | | | | — | | | | 2,351 | | |
Insurance | | | — | | | | 1,814 | | | | — | | | | 1,814 | | |
Interactive Media &
Services | | | 1,219 | | | | 3,184 | | | | — | | | | 4,403 | | |
Internet & Direct
Marketing Retail | | | 1,200 | | | | 694 | | | | — | | | | 1,894 | | |
Life Sciences Tools &
Services | | | — | | | | 851 | | | | — | | | | 851 | | |
Pharmaceuticals | | | — | | | | 1,042 | | | | — | | | | 1,042 | | |
Semiconductors &
Semiconductor
Equipment | | | — | | | | 2,609 | | | | — | | | | 2,609 | | |
Textiles, Apparel &
Luxury Goods | | | — | | | | 1,721 | | | | — | | | | 1,721 | | |
Total Common Stocks | | | 10,246 | | | | 24,147 | | | | — | | | | 34,393 | | |
Call Options Purchased | | | | | 23 | | | | | | 23 | | |
Short-Term Investment | |
Investment Company | | | 883 | | | | — | | | | — | | | | 883 | | |
Total Assets | | $ | 11,129 | | | $ | 24,170 | | | $ | — | | | $ | 35,299 | | |
Transfers between investment levels may occur as the markets fluctuate and/or the availability of data used in an investment's valuation changes.
3. Repurchase Agreements: The Fund may enter into repurchase agreements under which the Fund lends cash and takes possession of securities with an agreement that the counterparty will repurchase such securities. In connection with transactions in repurchase agreements, a bank as custodian for the Fund takes possession of the underlying securities which are held as collateral, with a market value at least equal to the amount of the repurchase transaction, including principal and accrued interest. To the extent that any repurchase transaction exceeds one business day, the value of the collateral is marked-to-market on a daily basis to determine that the value of the collateral does not decrease below the repurchase price plus accrued interest as earned. If such a decrease occurs, additional collateral will be requested and, when received, will be added to the account to maintain full collateralization. In the event of
default on the obligation to repurchase, the Fund has the right to liquidate the collateral and apply the proceeds in satisfaction of the obligation. In the event of default or bankruptcy by the counterparty to the agreement, realization of the collateral proceeds may be subject to cost and delays. The Fund, along with other affiliated investment companies, may utilize a joint trading account for the purpose of entering into repurchase agreements.
4. Foreign Currency Translation and Foreign Investments: The books and records of the Fund are maintained in U.S. dollars. Foreign currency amounts are translated into U.S. dollars as follows:
– investments, other assets and liabilities at the prevailing rate of exchange on the valuation date;
– investment transactions and investment income at the prevailing rates of exchange on the dates of such transactions.
Although the net assets of the Fund are presented at the foreign exchange rates and market values at the close of the period, the Fund does not isolate that portion of the results of operations arising as a result of changes in the foreign exchange rates from the fluctuations arising from changes in the market prices of securities held at period end. Similarly, the Fund does not isolate the effect of changes in foreign exchange rates from the fluctuations arising from changes in the market prices of securities sold during the period. Accordingly, realized and unrealized foreign currency gains (losses) on investments in securities are included in the reported net realized and unrealized gains (losses) on investment transactions and balances. However, pursuant to U.S. federal income tax regulations, gains and losses from certain foreign currency transactions and the foreign currency portion of gains and losses realized on sales and maturities of foreign denominated debt securities are treated as ordinary income for U.S. federal income tax purposes.
Net realized gains (losses) on foreign currency transactions represent net foreign exchange gains (losses) from foreign currency forward exchange contracts, disposition of foreign currencies, currency gains (losses) realized between the trade and settlement dates on securities transactions, and the difference between the amount of investment income and foreign withholding taxes recorded on the Fund's books and the U.S. dollar
19
Morgan Stanley Institutional Fund, Inc.
Annual Report — December 31, 2018
Notes to Financial Statements (cont'd)
equivalent amounts actually received or paid. Net unrealized currency gains (losses) from valuing foreign currency denominated assets and liabilities at period end exchange rates are reflected as a component of unrealized appreciation (depreciation) in the Statement of Assets and Liabilities. The change in unrealized currency gains (losses) on foreign currency translations for the period is reflected in the Statement of Operations.
Foreign security and currency transactions may involve certain considerations and risks not typically associated with those of U.S. dollar denominated transactions as a result of, among other factors, fluctuations of exchange rates in relation to the U.S. dollar, the possibility of lower levels of governmental supervision and regulation of foreign securities markets and the possibility of political or economic instability.
Governmental approval for foreign investments may be required in advance of making an investment under certain circumstances in some countries, and the extent of foreign investments in domestic companies may be subject to limitation in other countries. Foreign ownership limitations also may be imposed by the charters of individual companies to prevent, among other concerns, violations of foreign investment limitations. As a result, an additional class of shares (identified as "Foreign" in the Portfolio of Investments) may be created and offered for investment. The "local" and "foreign shares" market values may differ. In the absence of trading of the foreign shares in such markets, the Fund values the foreign shares at the closing exchange price of the local shares.
5. Derivatives: The Fund may, but is not required to, use derivative instruments for a variety of purposes, including hedging, risk management, portfolio management or to earn income. Derivatives are financial instruments whose value is based, in part, on the value of an underlying asset, interest rate, index or financial instrument. Prevailing interest rates and volatility levels, among other things, also affect the value of derivative instruments. A derivative instrument often has risks similar to its underlying asset and may have additional risks, including imperfect correlation between the value of the derivative and the underlying asset, risks of default by the counterparty to certain transactions, magnification of losses incurred due to changes in the market value of the securities, instruments, indices or interest rates to which the derivative instrument relates,
risks that the transactions may not be liquid and risks arising from margin requirements. The use of derivatives involves risks that are different from, and possibly greater than, the risks associated with other portfolio investments. Derivatives may involve the use of highly specialized instruments that require investment techniques and risk analyses different from those associated with other portfolio investments. All of the Fund's holdings, including derivative instruments, are marked-to-market each day with the change in value reflected in unrealized appreciation (depreciation). Upon disposition, a realized gain or loss is recognized.
Certain derivative transactions may give rise to a form of leverage. Leverage magnifies the potential for gain and the risk of loss. Leverage associated with derivative transactions may cause the Fund to liquidate portfolio positions when it may not be advantageous to do so to satisfy its obligations or to meet earmarking or segregation requirements, pursuant to applicable Securities and Exchange Commission ("SEC") rules and regulations, or may cause the Fund to be more volatile than if the Fund had not been leveraged. Although the Adviser seeks to use derivatives to further the Fund's investment objectives, there is no assurance that the use of derivatives will achieve this result.
Following is a description of the derivative instruments and techniques that the Fund used during the period and their associated risks:
Options: With respect to options, the Fund is subject to equity risk, interest rate risk and foreign currency exchange risk in the normal course of pursuing its investment objectives. If the Fund buys an option, it buys a legal contract giving it the right to buy or sell a specific amount of the underlying instrument or foreign currency, or futures contract on the underlying instrument or foreign currency, at an agreed-upon price during a period of time or on a specified date typically in exchange for a premium paid by the Fund. The Fund may purchase and/or sell put and call options. Purchasing call options tends to increase the Fund's exposure to the underlying (or similar) instrument. Purchasing put options tends to decrease the Fund's exposure to the underlying (or similar) instrument. When entering into purchased option contracts, the Fund bears the risk of interest or exchange rates or securities prices moving
20
Morgan Stanley Institutional Fund, Inc.
Annual Report — December 31, 2018
Notes to Financial Statements (cont'd)
unexpectedly, in which case, the Fund may not achieve the anticipated benefits of the purchased option contracts; however the risk of loss is limited to the premium paid. Purchased options are reported as part of "Total Investments in Securities" in the Statement of Assets and Liabilities. Premiums paid for purchasing options which expired are treated as realized losses. If the Fund sells an option, it sells to another party the right to buy from or sell to the Fund a specific amount of the underlying instrument or foreign currency, or futures contract on the underlying instrument or foreign currency, at an agreed-upon price during a period of time or on a specified date typically in exchange for a premium received by the Fund. When options are purchased OTC, the Fund bears the risk that the counterparty that wrote the option will be unable or unwilling to perform its obligations under the option contract. Options may also be illiquid and the Fund may have difficulty closing out its position. A decision as to whether, when and how to use options involves the exercise of skill and judgment and even a well-conceived option transaction may be unsuccessful because of market behavior or unexpected events. The prices of options can be highly volatile and the use of options can lower total returns.
FASB ASC 815, "Derivatives and Hedging" ("ASC 815"), is intended to improve financial reporting about derivative instruments by requiring enhanced disclosures to enable investors to better understand how and why the Fund uses derivative instruments, how these derivative instruments are accounted for and their effects on the Fund's financial position and results of operations.
The following table sets forth the fair value of the Fund's derivative contracts by primary risk exposure as of December 31, 2018:
| | | Asset Derivatives
Statement of Assets and
Liabilities Location | | Primary Risk
Exposure | | Value
(000) | |
Purchased Options
| | Investments, at Value
(Purchased Options) | |
Currency Risk | | $ | 23 | (a) | |
(a) Amounts are included in Investments in Securities in the Statement of Assets and Liabilities.
The following tables set forth by primary risk exposure the Fund's realized gains (losses) and change in unrealized appreciation (depreciation) by type of derivative contract for
the year ended December 31, 2018 in accordance with ASC 815:
Realized Gain (Loss) | |
Primary Risk Exposure | | Derivative Type | | Value
(000) | |
Currency Risk
| | Investments
(Purchased Options) | | $ | (17 | )(b) | |
(b) Amounts are included in Investments Sold in the Statement of Operations.
Change in Unrealized Appreciation (Depreciation) | |
Primary Risk Exposure | | Derivative Type | | Value
(000) | |
Currency Risk
| | Investments
(Purchased Options) | | $ | (78 | )(c) | |
(c) Amounts are included in Investments in the Statement of Operations.
At December 31, 2018, the Fund's derivative assets and liabilities are as follows:
| | | Gross Amounts of Assets and Liabilities
Presented in the Statement of Assets and Liabilities | |
Derivatives | | Assets(d)
(000) | | Liabilities(d)
(000) | |
Purchased Options | | $ | 23 | (a) | | $ | — | | |
(a) Amounts are included in Investments in Securities in the Statement of Assets and Liabilities.
(d) Absent an event of default or early termination, OTC derivative assets and liabilities are presented gross and not offset in the Statement of Assets and Liabilities.
The Fund typically enters into International Swaps and Derivatives Association, Inc. Master Agreements ("ISDA Master Agreements") or similar master agreements (collectively, "Master Agreements") with its contract counterparties for certain OTC derivatives in order to, among other things, reduce its credit risk to counterparties. ISDA Master Agreements include provisions for general obligations, representations, collateral and events of default or termination. Under an ISDA Master Agreement, the Fund typically may offset with the counterparty certain OTC derivative financial instruments' payables and/or receivables with collateral held and/or posted and create one single net payment (close-out netting) in the event of default, termination and/or potential deterioration in the credit quality of the counterparty. Various Master Agreements govern the terms of certain transactions with counterparties, including transactions such as swap, forward, repurchase and reverse repurchase agreements. These Master Agreements typically attempt to reduce the counterparty risk associated with such transactions by specifying credit protection mechanisms and providing standardization that improves legal certainty. Cross-termination provisions under Master Agreements typically provide that a default in
21
Morgan Stanley Institutional Fund, Inc.
Annual Report — December 31, 2018
Notes to Financial Statements (cont'd)
connection with one transaction between the Fund and a counterparty gives the non-defaulting party the right to terminate any other transactions in place with the defaulting party to create one single net payment due to/due from the defaulting party and may be a feature in certain Master Agreements. In the event the Fund exercises its right to terminate a Master Agreement after a counterparty experiences a termination event as defined in the Master Agreement, the return of collateral with market value in excess of the Fund's net liability may be delayed or denied.
The following table presents derivative financial instruments that are subject to enforceable netting arrangements as of December 31, 2018:
Gross Amounts Not Offset in the Statement of Assets and Liabilities | |
Counterparty | | Gross Asset
Derivatives
Presented in
the Statement of
Assets and
Liabilities
(000) | | Financial
Instrument
(000) | | Collateral
Received
(000) | | Net Amount
(not less
than $0)
(000) | |
Royal Bank of Scotland | | $ | 23 | (a) | | $ | — | | | $ | — | | | $ | 23 | | |
(a) Amounts are included in Investments in Securities in the Statement of Assets and Liabilities.
For the year ended December 31, 2018, the approximate average monthly amount outstanding for each derivative type is as follows:
Purchased Options: | |
Average monthly notional amount | | | 16,603,000 | | |
6. Securities Lending: The Fund lends securities to qualified financial institutions, such as broker-dealers, to earn additional income. Any increase or decrease in the fair value of the securities loaned that might occur and any interest earned or dividends declared on those securities during the term of the loan would remain in the Fund. The Fund would receive cash or securities as collateral in an amount equal to or exceeding 100% of the current fair value of the loaned securities. The collateral is marked-to-market daily by State Street Bank and Trust Company ("State Street"), the securities lending agent, to ensure that a minimum of 100% collateral coverage is maintained.
Based on pre-established guidelines, the securities lending agent invests any cash collateral that is received in an affiliated money market portfolio and repurchase agreements. Securities lending income is generated from the earnings on the invested collateral and borrowing fees, less any rebates owed to the borrowers and compensation
to the lending agent, and is recorded as "Income from Securities Loaned — Net" in the Fund's Statement of Operations. Risks in securities lending transactions are that a borrower may not provide additional collateral when required or return the securities when due, and that the value of the short-term investments will be less than the amount of cash collateral plus any rebate that is required to be returned to the borrower.
The Fund has the right under the securities lending agreement to recover the securities from the borrower on demand.
The following table presents financial instruments that are subject to enforceable netting arrangements as of December 31, 2018:
Gross Amounts Not Offset in the Statement of Assets and Liabilities | |
Gross Asset
Amounts
Presented in
the Statement
of Assets and
Liabilities
(000) | | Financial
Instrument
(000) | | Collateral
Received
(000) | | Net Amount
(not less
than $0)
(000) | |
| $ | 778 | (e) | | $ | — | | | $ | 778 | (f)(g) | | $ | 0 | | |
(e) Represents market value of loaned securities at year end.
(f) The Fund received non-cash collateral of approximately $837,000 in the form of U.S. Government obligations, which the Fund cannot sell or repledge, and accordingly are not reflected in the Portfolio of Investments.
(g) The actual collateral received is greater than the amount shown here due to overcollateralization.
7. Redemption Fees: The Fund will assess a 2% redemption fee on Class I shares, Class A shares, Class C shares and Class IS shares, which is paid directly to the Fund, for shares redeemed or exchanged within thirty days of purchase, subject to certain exceptions. The redemption fee is designed to protect the Fund and its remaining shareholders from the effects of short-term trading. These fees, if any, are included in the Statements of Changes in Net Assets.
8. Indemnifications: The Company enters into contracts that contain a variety of indemnifications. The Company's maximum exposure under these arrangements is unknown. However, the Company has not had prior claims or losses pursuant to these contracts and expects the risk of loss to be remote.
9. Dividends and Distributions to Shareholders: Dividends and distributions to shareholders are recorded on the ex-dividend date. Dividends from net investment income, if any, are declared and paid annually. Net realized capital gains, if any, are distributed at least annually.
22
Morgan Stanley Institutional Fund, Inc.
Annual Report — December 31, 2018
Notes to Financial Statements (cont'd)
10. Security Transactions, Income and Expenses: Security transactions are accounted for on the trade date (date the order to buy or sell is executed). Realized gains and losses on the sale of investment securities are determined on the specific identified cost method. Dividend income and other distributions are recorded on the ex-dividend date (except for certain foreign dividends which may be recorded as soon as the Fund is informed of such dividends) net of applicable withholding taxes. Interest income is recognized on the accrual basis except where collection is in doubt. Discounts are accreted and premiums are amortized over the life of the respective securities. Most expenses of the Company can be directly attributed to a particular Fund. Expenses which cannot be directly attributed are apportioned among the Funds based upon relative net assets or other appropriate methods. Income, expenses (other than class specific expenses — distribution and shareholder services, transfer agency and sub transfer agency fees) and realized and unrealized gains or losses are allocated to each class of shares based upon their relative net assets.
B. Advisory Fees: The Adviser, a wholly-owned subsidiary of Morgan Stanley, provides the Fund with advisory services under the terms of an Investment Advisory Agreement, paid quarterly, at the annual rate based on the daily net assets as follows:
First $750
million | | Next $750
million | | Over $1.5
billion | |
| | 0.80 | % | | | 0.75 | % | | | 0.70 | % | |
For the year ended December 31, 2018, the advisory fee rate (net of waiver/rebate) was equivalent to an annual effective rate of 0.23% of the Fund's average daily net assets.
The Adviser has agreed to reduce its advisory fee and/or reimburse the Fund so that total annual portfolio operating expenses, excluding certain investment related expenses, taxes, interest and other extraordinary expenses (including litigation), will not exceed 1.10% for Class I shares, 1.45% for Class A shares, 2.20% for Class C shares and 1.05% for Class IS shares. The fee waivers and/or expense reimbursements will continue for at least one year from the date of the Fund's prospectus or until such time as the Directors act to discontinue all or a portion of such waivers and/or reimbursements when they deem such action is appropriate. For the year ended December 31, 2018, approximately $221,000 of advisory fees were waived and approximately $14,000 of other expenses were reimbursed by the Adviser pursuant to this arrangement.
C. Administration Fees: The Adviser also serves as Administrator to the Company and provides administrative services pursuant to an Administration Agreement for an annual fee, accrued daily and paid monthly, of 0.08% of the Fund's average daily net assets.
Under a Sub-Administration Agreement between the Administrator and State Street, State Street provides certain administrative services to the Company. For such services, the Administrator pays State Street a portion of the fee the Administrator receives from the Fund.
D. Distribution and Shareholder Services Fees: Morgan Stanley Distribution, Inc. ("MSDI" or the "Distributor"), a wholly-owned subsidiary of the Adviser and an indirect subsidiary of Morgan Stanley, serves as the Company's Distributor of Fund shares pursuant to a Distribution Agreement. The Company has adopted a Shareholder Services Plan with respect to Class A shares pursuant to Rule 12b-1 under the Act. Under the Shareholder Services Plan, the Fund pays the Distributor a shareholder services fee, accrued daily and paid monthly, at an annual rate of 0.25% of the Fund's average daily net assets attributable to Class A shares.
The Company has adopted a Distribution and Shareholder Services Plan with respect to Class C shares pursuant to Rule 12b-1 under the Act. Under the Distribution and Shareholder Services Plan, the Fund pays the Distributor a distribution fee, accrued daily and paid monthly, at an annual rate of 0.75% and a shareholder services fee, accrued daily and paid monthly, at an annual rate of 0.25% of the Fund's average daily net assets attributable to Class C shares.
The distribution and shareholder services fees are used to support the expenses associated with servicing and maintaining accounts. The Distributor may compensate other parties for providing shareholder support services to investors who purchase Class A and Class C shares.
E. Dividend Disbursing and Transfer Agent: The Company's dividend disbursing and transfer agent is DST Asset Manager Solutions, Inc. ("DST"). Pursuant to a Transfer Agency Agreement, the Company pays DST a fee based on the number of classes, accounts and transactions relating to the Funds of the Company.
F. Custodian Fees: State Street (the "Custodian") also serves as Custodian for the Company in accordance with a Custodian Agreement. The Custodian holds cash, securities and other assets of the Company as required by the Act. Custody fees are
23
Morgan Stanley Institutional Fund, Inc.
Annual Report — December 31, 2018
Notes to Financial Statements (cont'd)
payable monthly based on assets held in custody, investment purchases and sales activity and account maintenance fees, plus reimbursement for certain out-of-pocket expenses.
G. Security Transactions and Transactions with Affiliates: For the year ended December 31, 2018, purchases and sales of investment securities for the Fund, other than long-term U.S. Government securities and short-term investments were approximately $47,651,000 and $22,686,000, respectively. There were no purchases and sales of long-term U.S. Government securities for the year ended December 31, 2018.
The Fund invests in the Institutional Class of the Morgan Stanley Institutional Liquidity Funds — Treasury Securities Portfolio (the "Liquidity Funds"), an open-end management investment company managed by the Adviser, both directly and as a portion of the securities held as collateral on loaned securities. Advisory fees paid by the Fund are reduced by an amount equal to its pro-rata share of the advisory and administration fees paid by the Fund due to its investment in the Liquidity Funds. For the year ended December 31, 2018, advisory fees paid were reduced by approximately $6,000 relating to the Fund's investment in the Liquidity Funds.
A summary of the Fund's transactions in shares of affiliated investments during the year ended December 31, 2018 is as follows:
Affiliated
Investment
Company | | Value
December 31,
2017
(000) | | Purchases
at Cost
(000) | | Proceeds
from Sales
(000) | | Dividend
Income
(000) | |
Liquidity Funds | | $ | 1,947 | | | $ | 35,102 | | | $ | 36,166 | | | $ | 48 | | |
Affiliated
Investment
Company (cont'd) | | Realized
Gain
(Loss)
(000) | | Change in
Unrealized
Appreciation
(Depreciation)
(000) | | Value
December 31,
2018
(000) | |
Liquidity Funds | | $ | — | | | $ | — | | | $ | 883 | | |
The Fund is permitted to purchase and sell securities ("cross-trade") from and to other Morgan Stanley funds as well as other funds and client accounts for which the Adviser or an affiliate of the Adviser serves as investment adviser, pursuant to procedures approved by the Directors in compliance with Rule 17a-7 under the Act (the "Rule"). Each cross-trade is executed at the current market price in compliance with provisions of the Rule. For the year ended December 31, 2018, the Fund did not engage in any cross-trade transactions.
The Fund has an unfunded Deferred Compensation Plan (the "Compensation Plan"), which allows each independent Director to defer payment of all, or a portion, of the fees he or she receives for serving on the Board of Directors. Each eligible
Director generally may elect to have the deferred amounts credited with a return equal to the total return on one or more of the Morgan Stanley funds that are offered as investment options under the Compensation Plan. Appreciation/depreciation and distributions received from these investments are recorded with an offsetting increase/decrease in the deferred compensation obligation and do not affect the NAV of the Fund.
H. Federal Income Taxes: It is the Fund's intention to continue to qualify as a regulated investment company and distribute all of its taxable and tax-exempt income. Accordingly, no provision for federal income taxes is required in the financial statements.
The Fund may be subject to taxes imposed by countries in which it invests. Such taxes are generally based on income and/or capital gains earned or repatriated. Taxes are accrued based on net investment income, net realized gains and net unrealized appreciation as such income and/or gains are earned. Taxes may also be based on transactions in foreign currency and are accrued based on the value of investments denominated in such currency.
FASB ASC 740-10, "Income Taxes — Overall", sets forth a minimum threshold for financial statement recognition of the benefit of a tax position taken or expected to be taken in a tax return. Management has concluded there are no significant uncertain tax positions that would require recognition in the financial statements. If applicable, the Fund recognizes interest accrued related to unrecognized tax benefits in "Interest Expense" and penalties in "Other Expenses" in the Statement of Operations. The Fund files tax returns with the U.S. Internal Revenue Service, New York and various states. Generally, each of the tax years in the four-year period ended December 31, 2018 remains subject to examination by taxing authorities.
The tax character of distributions paid may differ from the character of distributions shown for GAAP purposes due to short-term capital gains being treated as ordinary income for tax purposes. The tax character of distributions paid during fiscal years 2018 and 2017 was as follows:
2018
Distributions
Paid From: | | 2017
Distributions
Paid From: | |
Ordinary
Income
(000) | | Long-Term
Capital Gain
(000) | | Ordinary
Income
(000) | | Long-Term
Capital Gain
(000) | |
| $ | 256 | | | $ | — | | | $ | 195 | | | $ | 19 | | |
The amount and character of income and gains to be distributed are determined in accordance with income tax regulations
24
Morgan Stanley Institutional Fund, Inc.
Annual Report — December 31, 2018
Notes to Financial Statements (cont'd)
which may differ from GAAP. These book/tax differences are either considered temporary or permanent in nature.
Temporary differences are attributable to differing book and tax treatments for the timing of the recognition of gains (losses) on certain investment transactions and the timing of the deductibility of certain expenses.
The Fund had no permanent differences causing reclassifications among the components of net assets for the year ended December 31, 2018.
At December 31, 2018, the components of distributable earnings for the Fund on a tax basis were as follows:
Undistributed
Ordinary
Income
(000) | | Undistributed
Long-Term
Capital Gain
(000) | |
| $ | 37 | | | $ | — | | |
At December 31, 2018, the Fund had available for federal income tax purposes unused short-term capital losses of approximately $2,191,000 that do not have an expiration date.
To the extent that capital loss carryforwards are used to offset any future capital gains realized, no capital gains tax liability will be incurred by the Fund for gains realized and not distributed. To the extent that capital gains are offset, such gains will not be distributed to the shareholders.
I. Credit Facility: The Company and other Morgan Stanley funds participated in a $150,000,000 committed, unsecured revolving line of credit facility (the "Facility") with State Street. This Facility is to be used for temporary emergency purposes or funding of shareholder redemption requests. The interest rate on borrowings is based on the federal funds rate or 1 month LIBOR rate plus a spread. The Facility also has a commitment fee of 0.25% per annum based on the unused portion of the Facility. During the year ended December 31, 2018, the Fund did not have any borrowings under the Facility.
J. Other: At December 31, 2018, the Fund had record owners of 10% or greater. Investment activities of these shareholders could have a material impact on the Fund. The aggregate percentage of such owners was 38.3%.
25
Morgan Stanley Institutional Fund, Inc.
Annual Report — December 31, 2018
Report of Independent Registered Public Accounting Firm
To the Shareholders and Board of Directors of
Morgan Stanley Institutional Fund, Inc. —
Asia Opportunity Portfolio
Opinion on the Financial Statements
We have audited the accompanying statement of assets and liabilities of Asia Opportunity Portfolio (the "Fund") (one of the funds constituting the Morgan Stanley Institutional Fund, Inc. (the "Company")), including the portfolio of investments, as of December 31, 2018, and the related statement of operations for the year then ended, the statements of changes in net assets for each of the two years in the period then ended, the financial highlights for each of the three years in the period then ended and the period from December 29, 2015 (commencement of operations) through December 31, 2015 and the related notes (collectively referred to as the "financial statements"). In our opinion, the financial statements present fairly, in all material respects, the financial position of Asia Opportunity Portfolio (one of the funds constituting Morgan Stanley Institutional Fund, Inc.) at December 31, 2018, the results of its operations for the year then ended, the changes in its net assets for each of the two years in the period then ended and its financial highlights for each of the three years in the period then ended and the period from December 29, 2015 (commencement of operations) through December 31, 2015, in conformity with U.S. generally accepted accounting principles.
Basis for Opinion
These financial statements are the responsibility of the Company's management. Our responsibility is to express an opinion on the Fund's financial statements based on our audits. We are a public accounting firm registered with the Public Company Accounting Oversight Board (United States) ("PCAOB") and are required to be independent with respect to the Company in accordance with the U.S. federal securities law and the applicable rules and regulations of the Securities and Exchange Commission and the PCAOB.
We conducted our audits in accordance with the standards of the PCAOB. Those standards require that we plan and perform the audit to obtain reasonable assurance about whether the financial statements are free of material misstatement, whether due to error or fraud. The Company is not required to have, nor were we engaged to perform, an audit of the Company's internal control over financial reporting. As part of our audits, we are required to obtain an understanding of internal control over financial reporting, but not for the purpose of expressing an opinion on the effectiveness of the Company's internal control over financial reporting. Accordingly, we express no such opinion.
Our audits included performing procedures to assess the risks of material misstatement of the financial statements, whether due to error or fraud, and performing procedures that respond to those risks. Such procedures included examining, on a test basis, evidence regarding the amounts and disclosures in the financial statements. Our procedures included confirmation of securities owned as of December 31, 2018 by correspondence with the custodian and others or by other appropriate auditing procedures where replies from others were not received. Our audits also included evaluating the accounting principles used and significant estimates made by management, as well as evaluating the overall presentation of the financial statements. We believe that our audits provide a reasonable basis for our opinion.

We have served as the auditor of one or more Morgan Stanley investment companies since 2000.
Boston, Massachusetts
February 26, 2019
26
Morgan Stanley Institutional Fund, Inc.
Annual Report — December 31, 2018
Federal Tax Notice (unaudited)
For federal income tax purposes, the following information is furnished with respect to the Fund's earnings for its taxable year ended December 31, 2018. When distributed, certain earnings may be subject to a maximum tax rate of 15% as provided for by the Jobs and Growth Tax Relief Reconciliation Act of 2003. The Fund designated up to a maximum of approximately $53,000 as taxable at this lower rate.
The Fund intends to pass through foreign tax credits of approximately $50,000 and has derived net income from sources within foreign countries amounting to approximately $454,000.
In January, the Fund provides tax information to shareholders for the preceding calendar year.
27
Morgan Stanley Institutional Fund, Inc.
Annual Report — December 31, 2018
Privacy Notice (unaudited)
MORGAN STANLEY INVESTMENT MANAGEMENT INC.
AN IMPORTANT NOTICE CONCERNING OUR U.S. PRIVACY POLICY
We are required by federal law to provide you with a copy of our privacy policy annually. This policy applies to current and former individual investors in funds managed or sponsored by Morgan Stanley Investment Management Inc. ("MSIM") as well as current and former individual clients of MSIM. This policy is not applicable to partnerships, corporations, trusts or other non-individual clients or investors. Please note that we may amend this policy at any time, and will inform you of any changes as required by law.
WE RESPECT YOUR PRIVACY
We appreciate that you have provided us with your personal financial information. We strive to maintain the privacy of such information while we help you achieve your financial objectives. This Notice describes what non-public personal information we collect about you, why we collect it, when we may share it with others and how certain others may use it. It discusses the steps you may take to limit our sharing of certain information about you to affiliated companies in the Morgan Stanley family of companies ("other Morgan Stanley companies"). It also discloses how you may limit use of certain shared information for marketing purposes by other Morgan Stanley branded companies. Throughout this policy, we refer to the non-public information that personally identifies you or your accounts as "personal information.''
1. WHAT PERSONAL INFORMATION DO WE COLLECT ABOUT YOU?
We obtain personal information from applications and other forms you submit to us, from your dealings with us, from consumer reporting agencies, from our Web sites and from third parties and other sources.
For example:
• We may collect information such as your name, address, e-mail address, telephone/fax numbers, assets, income and investment objectives through subscription documents, applications and other forms you submit to us.
• We may obtain information about account balances, your use of account(s) and the types of products and services you prefer to receive from us through your dealings and transactions with us and other sources.
• We may obtain information about your creditworthiness and credit history from consumer reporting agencies.
• We may collect background information from and through third-party vendors to verify representations you have made and to comply with various regulatory requirements.
• If you interact with us through our public and private Web sites, we may collect information that you provide directly through online communications (such as an e-mail address). We may also collect information about your Internet service provider, your domain name, your computer's operating system and Web browser, your use of our Web sites and your product and service preferences, through the use of "cookies." Please consult the Terms of Use of these sites for more details.
2. WHEN DO WE DISCLOSE PERSONAL INFORMATION WE COLLECT ABOUT YOU?
We may disclose personal information we collect about you to other Morgan Stanley companies and to non-affiliated third parties.
a. Information We Disclose to Other Morgan Stanley Companies.
We may disclose personal information to other Morgan Stanley companies for a variety of reasons, including to manage your account(s) effectively, to service and process your transactions, to let you know about products and services offered by us and other Morgan Stanley companies, to manage our business, and as otherwise required or permitted by law. Offers for products and services from other Morgan Stanley companies are developed under conditions designed to safeguard your personal information.
b. Information We Disclose to Non-affiliated Third Parties.
We do not disclose personal information that we collect about you to non-affiliated third parties except to those who provide marketing services on our behalf, to financial institutions with whom we have joint marketing agreements, and as otherwise
28
Morgan Stanley Institutional Fund, Inc.
Annual Report — December 31, 2018
Privacy Notice (unaudited) (cont'd)
required or permitted by law. For example, we may disclose personal information to non-affiliated third parties for servicing and processing transactions, to offer our own products and services, to protect against fraud, for institutional risk control, to respond to judicial process or to perform services on our behalf. When we share personal information with a non-affiliated third party, they are required to limit their use of personal information to the particular purpose for which it was shared and they are not allowed to share personal information with others except to fulfill that limited purpose or as may be permitted or required by law.
3. HOW DO WE PROTECT THE SECURITY AND CONFIDENTIALITY OF PERSONAL INFORMATION WE COLLECT ABOUT YOU?
We maintain physical, electronic and procedural security measures to help safeguard the personal information we collect about you. We have internal policies governing the proper handling of client information. Third parties that provide support or marketing services on our behalf may also receive personal information, and we require them to adhere to confidentiality standards with respect to such information.
4. HOW CAN YOU LIMIT THE SHARING OF CERTAIN TYPES OF PERSONAL INFORMATION WITH OTHER MORGAN STANLEY COMPANIES?
We offer you choices as to whether we share with other Morgan Stanley companies the personal information that was collected to determine your eligibility for products and services you request ("eligibility information"). Eligibility information does not include your identification information or personal information pertaining to our transactions or experiences with you. Please note that, even if you direct us not to share eligibility information with other Morgan Stanley companies ("opt-out"), we may still share personal information, including eligibility information, with those companies in circumstances excluded from the opt-out under applicable law, such as to process transactions or to service your account.
5. HOW CAN YOU LIMIT THE USE OF CERTAIN TYPES OF PERSONAL INFORMATION BY OTHER MORGAN STANLEY COMPANIES FOR MARKETING?
By following the opt-out instructions in Section 6 below, you may limit other Morgan Stanley branded companies from marketing their products or services to you based on personal information we disclose to them. This information may include, for example, your income and account history with us. Please note that, even if you choose to limit Other Morgan Stanley Companies from using personal information about you that we may share with them for marketing their products and services to you, Other Morgan Stanley Companies may use your personal information that they obtain from us to market to you in circumstances permitted by law, such as if the Other Morgan Stanley Company has its own relationship with you.
6. HOW CAN YOU SEND US AN OPT-OUT INSTRUCTION?
If you wish to limit our sharing of eligibility information about you with other Morgan Stanley companies or other Morgan Stanley companies' use of personal information for marketing purposes, as described in this notice, you may do so by:
• Calling us at (800) 548-7786
Monday–Friday between 8a.m. and 6p.m.(EST)
• Writing to us at the following address:
DST Asset Manager Solutions, Inc.
c/o Privacy Coordinator
P.O. Box 219804
Kansas City, Missouri 64121
Your written request should include your name, address, telephone number and account number(s) to which the opt-out applies and whether you are opting out with respect to sharing of eligibility information (Section 4 above), or if information used for Marketing (Section 5 above) or both. Written opt-out requests should not be sent with any other correspondence. In order to process your request, we require that the request be provided by you directly and not through a third party.
29
Morgan Stanley Institutional Fund, Inc.
Annual Report — December 31, 2018
Privacy Notice (unaudited) (cont'd)
Your opt-out preference will remain in effect with respect to this policy (as it may be amended) until you notify us otherwise. If you have a joint account, your direction for us not to share this information with other Morgan Stanley companies and for those other Morgan Stanley companies not to use your personal information for marketing will be applied to all account holders on that account. Please understand that if you limit our sharing or our affiliated companies' use of personal information, you and any joint account holder(s) may not receive information about Morgan Stanley products and services, including products or services that could help you manage your financial resources and achieve your investment objectives.
7. WHAT IF AN AFFILIATED COMPANY BECOMES A NON-AFFILIATED THIRD PARTY?
If, at any time in the future, an affiliated company becomes a non-affiliated third party, further disclosures of personal information made to the former affiliated company will be limited to those described in Section 2(b) above relating to non-affiliated third parties. If you elected under Section 6 to limit disclosures we make to affiliated companies, or use of personal information by affiliated companies, your election will not apply to use by any former affiliated company of your personal information in their possession once it becomes a non-affiliated third party.
SPECIAL NOTICE TO RESIDENTS OF VERMONT
The following section supplements our Policy with respect to our individual clients who have a Vermont address and supersedes anything to the contrary in the above Policy with respect to those clients only.
The state of Vermont requires financial institutions to obtain your consent prior to sharing personal information that they collect about you with affiliated companies and non-affiliated third parties other than in certain limited circumstances. Except as permitted by law, we will not share personal information we collect about you with non-affiliated third parties or other Morgan Stanley companies unless you provide us with your written consent to share such information ("opt-in").
If you wish to receive offers for investment products and services offered by or through other Morgan Stanley companies, please notify us in writing at the following address:
DST Asset Manager Solutions, Inc.
c/o Privacy Coordinator
P.O. Box 219804
Kansas City, Missouri 64121
Your authorization should include your name, address, telephone number and account number(s) to which the opt-in applies and should not be sent with any other correspondence. In order to process your authorization, we require that the authorization be provided by you directly and not through a third party.
SPECIAL NOTICE TO RESIDENTS OF CALIFORNIA
The following section supplements our Policy with respect to our individual clients who have a California address and supersedes anything to the contrary in the above Policy with respect to those clients only.
In response to a California law, if your account has a California home address, your personal information will not be disclosed to non-affiliated third parties except as permitted by applicable California law, and we will limit sharing such information with our affiliates to comply with California privacy laws that apply to us.
30
Morgan Stanley Institutional Fund, Inc.
Annual Report — December 31, 2018
Director and Officer Information (unaudited)
Independent Directors:
Name, Age and Address of
Independent Director | | Position(s)
Held with
Registrant | | Length of Time
Served* | | Principal Occupation(s) During Past 5 Years
and Other Relevant Professional Experience | | Number of
Portfolios in
Fund Complex
Overseen by
Independent
Director** | | Other Directorships
Held by Independent
Director*** | |
Frank L. Bowman (74)
c/o Perkins Coie LLP
Counsel to the Independent
Directors
30 Rockefeller Plaza
New York, NY 10112 | | Director | | Since
August
2006 | | President, Strategic Decisions, LLC (consulting) (since February 2009); Director or Trustee of various Morgan Stanley Funds (since August 2006); Chairperson of the Compliance and Insurance Committee (since October 2015); formerly, Chairperson of the Insurance Sub-Committee of the Compliance and Insurance Committee (2007-2015); served as President and Chief Executive Officer of the Nuclear Energy Institute (policy organization) (February 2005-November 2008); retired as Admiral, U.S. Navy after serving over 38 years on active duty including 8 years as Director of the Naval Nuclear Propulsion Program in the Department of the Navy and the U.S. Department of Energy (1996-2004); served as Chief of Naval Personnel (July 1994-September 1996) and on the Joint Staff as Director of Political Military Affairs (June 1992-July 1994); knighted as Honorary Knight Commander of the Most Excellent Order of the British Empire; awarded the Officier de l'Orde National du Mérite by the French Government; elected to the National Academy of Engineering (2009). | | | 82 | | | Director of BP p.l.c.; Director of Naval and Nuclear Technologies LLP; Director Emeritus of the Armed Services YMCA; Member of the National Security Advisory Council of the Center for U.S. Global Engagement and a member of the CNA Military Advisory Board; Trustee of Fairhaven United Methodist Church; Member of the Board of Advisors of the Dolphin Scholarship Foundation; and Director of other various non-profit organizations. | |
Kathleen A. Dennis (65)
c/o Perkins Coie LLP
Counsel to the Independent Directors
30 Rockefeller Plaza
New York, NY 10112 | | Director | | Since
August
2006 | | President, Cedarwood Associates (mutual fund and investment management consulting) (since July 2006); Chairperson of the Liquidity and Alternatives Sub-Committee of the Investment Committee (since October 2006) and Director or Trustee of various Morgan Stanley Funds (since August 2006); formerly, Senior Managing Director of Victory Capital Management (1993-2006). | | | 82 | | | Director of various non-profit organizations. | |
Nancy C. Everett (63)
c/o Perkins Coie LLP
Counsel to the Independent Directors
30 Rockefeller Plaza
New York, NY 10112 | | Director | | Since
January
2015 | | Chief Executive Officer, Virginia Commonwealth University Investment Company (since November 2015); Owner, OBIR, LLC (institutional investment management consulting) (since June 2014); formerly, Managing Director, BlackRock Inc. (February 2011-December 2013); and Chief Executive Officer, General Motors Asset Management (a/k/a Promark Global Advisors, Inc.) (June 2005-May 2010). | | | 83 | | | Formerly, Member of Virginia Commonwealth University School of Business Foundation (2005-2016); Member of Virginia Commonwealth University Board of Visitors (2013-2015); Member of Committee on Directors for Emerging Markets Growth Fund, Inc. (2007-2010); Chairperson of Performance Equity Management, LLC (2006-2010); and Chairperson, GMAM Absolute Return Strategies Fund, LLC (2006-2010). | |
31
Morgan Stanley Institutional Fund, Inc.
Annual Report — December 31, 2018
Director and Officer Information (unaudited) (cont'd)
Independent Directors: (cont'd)
Name, Age and Address of
Independent Director | | Position(s)
Held with
Registrant | | Length of Time
Served* | | Principal Occupation(s) During Past 5 Years
and Other Relevant Professional Experience | | Number of
Portfolios in
Fund Complex
Overseen by
Independent
Director** | | Other Directorships
Held by Independent
Director*** | |
Jakki L. Haussler (61)
c/o Perkins Coie LLP
Counsel to the Independent Directors
30 Rockefeller Plaza
New York, NY 10112 | | Director | | Since
January
2015 | | Chairman and Chief Executive Officer, Opus Capital Group (since January 1996); formerly, Director, Capvest Venture Fund, LP (May 2000-December 2011); Partner, Adena Ventures, LP (July 1999-December 2010); Director, The Victory Funds (February 2005-July 2008). | | | 83 | | | Director of Service Corporation International and Member, Audit Committee and Investment Committee; Director of Cincinnati Bell Inc. and Member, Audit Committee and Governance and Nominating Committee; Chairman of Northern Kentucky University Member Investment Committee; Member of Chase College of Law Transactional Law Practice Center Board of Advisors; Director of Best Transport; Director of Chase College of Law Board of Visitors; formerly, Member, University of Cincinnati Foundation Investment Committee; Member, Miami University Board of Visitors (2008-2011); Trustee of Victory Funds (2005-2008) and Chairman, Investment Committee (2007-2008) and Member, Service Provider Committee (2005-2008). | |
Dr. Manuel H. Johnson (69)
c/o Johnson Smick
International, Inc.
220 I Street, NE — Suite 200
Washington, D.C. 20002 | | Director | | Since
July
1991 | | Senior Partner, Johnson Smick International, Inc. (consulting firm); Chairperson of the Investment Committee (since October 2006) and Director or Trustee of various Morgan Stanley Funds (since July 1991); Co-Chairman and a founder of the Group of Seven Council (G7C) (international economic commission); formerly, Chairperson of the Audit Committee (July 1991-September 2006), Vice Chairman of the Board of Governors of the Federal Reserve System and Assistant Secretary of the U.S. Treasury. | | | 82 | | | Director of NVR, Inc. (home construction). | |
Joseph J. Kearns (76)
c/o Perkins Coie LLP
Counsel to the Independent Directors
30 Rockefeller Plaza
New York, NY 10112 | | Director | | Since
August
1994 | | Senior Adviser, Kearns & Associates LLC (investment consulting); Chairperson of the Audit Committee (since October 2006) and Director or Trustee of various Morgan Stanley Funds (since August 1994); formerly, Deputy Chairperson of the Audit Committee (July 2003-September 2006) and Chairperson of the Audit Committee of various Morgan Stanley Funds (since August 1994); CFO of the J. Paul Getty Trust. | | | 83 | | | Prior to August 10, 2016, Director of Electro Rent Corporation (equipment leasing); Prior to December 31, 2013, Director of The Ford Family Foundation. | |
32
Morgan Stanley Institutional Fund, Inc.
Annual Report — December 31, 2018
Director and Officer Information (unaudited) (cont'd)
Independent Directors: (cont'd)
Name, Age and Address of
Independent Director | | Position(s)
Held with
Registrant | | Length of Time
Served* | | Principal Occupation(s) During Past 5 Years
and Other Relevant Professional Experience | | Number of
Portfolios in
Fund Complex
Overseen by
Independent
Director** | | Other Directorships
Held by Independent
Director*** | |
Michael F. Klein (60)
c/o Perkins Coie LLP
Counsel to the Independent Directors
30 Rockefeller Plaza
New York, NY 10112 | | Director | | Since
August
2006 | | Managing Director, Aetos Alternatives Management, LP (since March 2000); Co-President, Aetos Alternatives Management, LP (since January 2004) and Co-Chief Executive Officer of Aetos Alternatives Management, LP (since August 2013); Chairperson of the Fixed Income Sub-Committee of the Investment Committee (since October 2006) and Director or Trustee of various Morgan Stanley Funds (since August 2006); formerly, Managing Director, Morgan Stanley & Co. Inc. and Morgan Stanley Dean Witter Investment Management and President, various Morgan Stanley Funds (June 1998-March 2000); Principal, Morgan Stanley & Co. Inc. and Morgan Stanley Dean Witter Investment Management (August 1997-December 1999). | | | 82 | | | Director of certain investment funds managed or sponsored by Aetos Alternatives Management, LP; Director of Sanitized AG and Sanitized Marketing AG (specialty chemicals). | |
Patricia Maleski (58)
c/o Perkins Coie LLP
Counsel to the Independent Directors
30 Rockefeller Plaza
New York, NY 10112 | | Director | | Since
January
2017 | | Managing Director, JPMorgan Asset Management (2004-2016); Oversight and Control Head of Fiduciary and Conflicts of Interest Program (2015-2016); Chief Control Officer-Global Asset Management (2013-2015); President, JPMorgan Funds (2010-2013); Chief Administrative Officer (2004-2013); various other positions including Treasurer and Board Liaison (since 2001). | | | 83 | | | None. | |
Michael E. Nugent (82)
522 Fifth Avenue
New York, NY 10036 | | Chair of the Board and Director | | Chair of the Boards since July 2006 and Director since July 1991 | | Chair of the Boards of various Morgan Stanley Funds (since July 2006); Chairperson of the Closed-End Fund Committee (since June 2012) Governance Committee (since January 2019) and Director or Trustee of various Morgan Stanley Funds (since July 1991); formerly, Chairperson of the Insurance Committee (until July 2006); General Partner, Triumph Capital, L.P. (private investment partnership) (1988-2013). | | | 82 | | | None. | |
W. Allen Reed (71)
c/o Perkins Coie LLP
Counsel to the Independent Directors
30 Rockefeller Plaza
New York, NY 10112 | | Director | | Since
August
2006 | | Chairperson of the Equity Sub-Committee of the Investment Committee (since October 2006) and Director or Trustee of various Morgan Stanley Funds (since August 2006); formerly, President and CEO of General Motors Asset Management; Chairman and Chief Executive Officer of the GM Trust Bank and Corporate Vice President of General Motors Corporation (August 1994-December 2005). | | | 82 | | | Director of Legg Mason, Inc.; formerly, Director of the Auburn University Foundation (2010-2015). | |
Fergus Reid (86)****
c/o Joe Pietryka, Inc.
85 Charles Colman Blvd.
Pawling, NY 12564 | | Director | | Since
June
1992 | | Chairman, Joe Pietryka, Inc.; Chairperson of the Governance Committee and Director or Trustee of various Morgan Stanley Funds (since June 1992). | | | 83 | | | Formerly, Trustee and Director of certain investment companies in the JP Morgan Fund Complex managed by JP Morgan Investment Management Inc. (1987-2012). | |
* This is the earliest date the Director began serving the Morgan Stanley Funds. Each Director serves an indefinite term, until his or her successor is elected.
** The Fund Complex includes (as of December 31, 2018) all open-end and closed-end funds (including all of their portfolios) advised by Morgan Stanley Investment Management Inc. (the "Adviser") and any funds that have an adviser that is an affiliated person of the Adviser (including, but not limited to, Morgan Stanley AIP GP LP).
*** This includes any directorships at public companies and registered investment companies held by the Director at any time during the past five years.
**** Effective date of retirement is December 31, 2018.
33
Morgan Stanley Institutional Fund, Inc.
Annual Report — December 31, 2018
Director and Officer Information (unaudited) (cont'd)
Executive Officers:
Name, Age and Address of Executive Officer | | Position(s) Held
with
Registrant | | Length of Time
Served* | | Principal Occupation(s) During Past 5 Years | |
John H. Gernon (55)
522 Fifth Avenue
New York, NY 10036 | | President and Principal Executive Officer | | Since
September
2013 | | President and Principal Executive Officer of the Equity and Fixed Income Funds and the Morgan Stanley AIP Funds (since September 2013) and the Liquidity Funds and various money market funds (since May 2014) in the Fund Complex; Managing Director of the Adviser; Head of Product (since 2006). | |
Timothy J. Knierim (59)
522 Fifth Avenue
New York, NY 10036 | | Chief Compliance Officer | | Since
December
2016 | | Managing Director of the Adviser and various entities affiliated with the Adviser; Chief Compliance Officer of various Morgan Stanley Funds and the Adviser (since December 2016) and Chief Compliance Officer of Morgan Stanley AIP GP LP (since 2014). Formerly, Managing Director and Deputy Chief Compliance Officer of the Adviser (2014-2016); and formerly, Chief Compliance Officer of Prudential Investment Management, Inc. (2007-2014). | |
Francis J. Smith (53)
522 Fifth Avenue
New York, NY 10036 | | Treasurer and Principal Financial Officer | | Treasurer since July 2003 and Principal Financial Officer since September 2002 | | Managing Director of the Adviser and various entities affiliated with the Adviser; Treasurer (since July 2003) and Principal Financial Officer of various Morgan Stanley Funds (since September 2002). | |
Mary E. Mullin (51)
522 Fifth Avenue
New York, NY 10036 | | Secretary | | Since
June
1999 | | Managing Director of the Adviser; Secretary of various Morgan Stanley Funds (since June 1999). | |
Michael J. Key (39)
522 Fifth Avenue
New York, NY 10036 | | Vice President | | Since
June
2017 | | Vice President of the Equity and Fixed Income Funds, Liquidity Funds, various money market funds and the Morgan Stanley AIP Funds in the Fund Complex (since June 2017); Executive Director of the Adviser; Head of Product Development for Equity and Fixed Income Funds (since August 2013). | |
* This is the earliest date the officer began serving the Morgan Stanley Funds. Each officer serves a one-year term, until his or her successor is elected and qualifies.
34
Morgan Stanley Institutional Fund, Inc.
Annual Report — December 31, 2018
Adviser and Administrator
Morgan Stanley Investment Management Inc.
522 Fifth Avenue
New York, New York 10036
Distributor
Morgan Stanley Distribution, Inc.
522 Fifth Avenue
New York, New York 10036
Dividend Disbursing and Transfer Agent
DST Asset Manager Solutions, Inc.
2000 Crown Colony Drive
Quincy, Massachusetts 02169
Custodian
State Street Bank and Trust Company
One Lincoln Street
Boston, Massachusetts 02111
Legal Counsel
Dechert LLP
1095 Avenue of the Americas
New York, New York 10036
Counsel to the Independent Directors
Perkins Coie LLP
30 Rockefeller Plaza
New York, New York 10112
Independent Registered Public Accounting Firm
Ernst & Young LLP
200 Clarendon Street
Boston, Massachusetts 02116
Reporting to Shareholders
Each Morgan Stanley fund provides a complete schedule of portfolio holdings in its semi-annual and the annual reports within 60 days of the end of the fund's second and fourth fiscal quarters. The semi-annual and annual reports are filed electronically with the Securities and Exchange Commission ("SEC") on Form N-CSRS and Form N-CSR, respectively. Morgan Stanley also delivers the semi-annual and annual reports to fund shareholders and makes these reports available on its public website, www.morganstanley.com/im/shareholderreports. Each Morgan Stanley fund also files a complete schedule of portfolio holdings with the SEC for the fund's first and third fiscal quarters on Form N-Q. Morgan Stanley does not deliver the reports for the first and third fiscal quarters to shareholders, nor are the reports posted to the Morgan Stanley public website. You may, however, obtain the Form N-Q filings (as well as the Form N-CSR and N-CSRS filings) by accessing the SEC's website, www.sec.gov. You can also request copies of these materials, upon payment of a duplicating fee, by electronic request at the SEC's email address (publicinfo@sec.gov).
Proxy Voting Policies and Procedures and Proxy Voting Record
You may obtain a copy of the Company's Proxy Voting Policy and Procedures and information regarding how the Company voted proxies relating to portfolio securities during the most recent twelve-month period ended June 30, without charge, upon request, by calling toll free 1 (800) 548-7786 or by visiting our website at www.morganstanley.com/im/shareholderreports. This information is also available on the SEC's website at www.sec.gov.
This report is authorized for distribution only when preceded or accompanied by a prospectus or summary prospectus of the applicable Fund of Morgan Stanley Institutional Fund, Inc., which describes in detail the Fund's investment policies, risks, fees and expenses. Please read the prospectus carefully before you invest or send money. For additional information, including information regarding the investments comprising the Fund, please visit our website at www.morganstanley.com/im/shareholderreports or call toll free 1 (800) 548-7786.
35
Printed in U.S.A.
This Report has been prepared for shareholders and may be distributed to others only if preceded or accompanied by a current prospectus.
Morgan Stanley Investment Management Inc.
522 Fifth Avenue
New York, New York 10036
© 2019 Morgan Stanley. Morgan Stanley Distribution, Inc.

IFIASOPPANN
2401109 EXP. 02.29.20

Morgan Stanley Institutional Fund, Inc.
Emerging Markets Breakout Nations Portfolio
Annual Report
December 31, 2018
Beginning on January 1, 2021, as permitted by regulations adopted by the Securities and Exchange Commission ("SEC"), paper copies of the Fund's Annual and Semi-Annual Reports to Shareholders ("Shareholder Reports") will no longer be sent by mail, unless you specifically request paper copies of the Shareholder Reports from the Fund or from your financial intermediary, such as a broker-dealer or a bank. Instead, the Shareholder Reports will be made available on the Fund's website, https://www.morganstanley.com/im/shareholderreports and you will be notified by mail each time a Shareholder Report is posted and provided with a website link to access the Shareholder Report. If you already elected to receive Shareholder Reports electronically, you will not be affected by this change and you need not take any action. You may elect to receive Shareholder Reports and other communications from the Fund electronically anytime by contacting your financial intermediary or, if you are a direct investor, please follow the instructions on the envelope.
Beginning on January 1, 2019, you may elect to receive all future Shareholder Reports in paper free of charge. If you invest through a financial intermediary, you can contact your financial intermediary to request that you continue to receive paper copies of your Shareholder Reports. If you invest directly with the Fund, please follow the instructions on the envelope to let the Fund know you wish to continue receiving paper copies of your Shareholder Reports. Your election to receive Shareholder Reports in paper will apply to all funds held in your account if you invest through your financial intermediary or all funds held with the fund complex if you invest directly with a fund.

Morgan Stanley Institutional Fund, Inc.
Annual Report — December 31, 2018
Shareholders' Letter | | | 2 | | |
Expense Example | | | 3 | | |
Investment Overview | | | 4 | | |
Portfolio of Investments | | | 7 | | |
Statement of Assets and Liabilities | | | 9 | | |
Statement of Operations | | | 10 | | |
Statements of Changes in Net Assets | | | 11 | | |
Financial Highlights | | | 12 | | |
Notes to Financial Statements | | | 16 | | |
Report of Independent Registered Public Accounting Firm | | | 25 | | |
Federal Tax Notice | | | 26 | | |
Privacy Notice | | | 27 | | |
Director and Officer Information | | | 30 | | |
This report is authorized for distribution only when preceded or accompanied by a prospectus or summary prospectus of the applicable Fund of Morgan Stanley Institutional Fund, Inc. To receive a prospectus and/or statement of additional information (SAI), which contains more complete information such as investment objectives, charges, expenses, policies for voting proxies, risk considerations and describes in detail each of the Fund's investment policies to the prospective investor, please call toll free 1 (800) 548-7786. Please read the prospectuses carefully before you invest or send money.
Additionally, you can access information about the Fund, including performance, characteristics and investment team commentary, through Morgan Stanley Investment Management's website: www.morganstanley.com/im/shareholderreports.
Market forecasts provided in this report may not necessarily come to pass. There is no guarantee that any sectors mentioned will continue to perform as discussed herein or that securities in such sectors will be held by the Fund in the future. There is no assurance that a fund will achieve its investment objective. Funds are subject to market risk, which is the possibility that market values of securities owned by the Fund will decline and, therefore, the value of the Fund's shares may be less than what you paid for them. Accordingly, you can lose money investing in this Fund. Please see the prospectus for more complete information on investment risks.
1
Morgan Stanley Institutional Fund, Inc.
Annual Report — December 31, 2018
Shareholders' Letter (unaudited)
Dear Shareholders,
We are pleased to provide this Annual report, in which you will learn how your investment in Emerging Markets Breakout Nations Portfolio (the "Fund") performed during the latest twelve-month period.
Morgan Stanley Investment Management is a client-centric, investor-led organization. Our global presence, intellectual capital, and breadth of products and services enable us to partner with investors to meet the evolving challenges of today's financial markets. We aim to deliver superior investment service and to empower our clients to make the informed decisions that help them reach their investment goals.
As always, we thank you for selecting Morgan Stanley Investment Management, and look forward to working with you in the months and years ahead.
Sincerely,

John H. Gernon
President and Principal Executive Officer
January 2019
2
Morgan Stanley Institutional Fund, Inc.
Annual Report — December 31, 2018
Expense Example (unaudited)
Emerging Markets Breakout Nations Portfolio
As a shareholder of the Fund, you incur two types of costs: (1) transactional costs, including redemption fees; and (2) ongoing costs, which may include advisory fees, administration fees, distribution and shareholder services fees and other Fund expenses. This example is intended to help you understand your ongoing costs (in dollars) of investing in the Fund and to compare these costs with the ongoing costs of investing in other mutual funds.
This example is based on an investment of $1,000 invested at the beginning of the six-month period ended December 31, 2018 and held for the entire six-month period.
Actual Expenses
The table below provides information about actual account values and actual expenses. You may use the information in this table, together with the amount you invested, to estimate the expenses that you paid over the period. Simply divide your account value by $1,000 (for example, an $8,600 account value divided by $1,000 = 8.6), then multiply the result by the number in the table under the heading entitled "Actual Expenses Paid During Period" to estimate the expenses you paid on your account during this period.
Hypothetical Example for Comparison Purposes
The table below provides information about hypothetical account values and hypothetical expenses based on the Fund's actual expense ratio and an assumed rate of return of 5% per year before expenses, which is not the Fund's actual return. The hypothetical account values and expenses may not be used to estimate the actual ending account balance or expenses you paid for the period. You may use this information to compare the ongoing costs of investing in the Fund and other funds. To do so, compare this 5% hypothetical example with the 5% hypothetical examples that appear in the shareholder reports of the other funds.
Please note that the expenses shown in the table are meant to highlight your ongoing costs only and do not reflect any transactional costs, such as sales charges (loads) and redemption fees. Therefore, the information for each class in the table is useful in comparing ongoing costs only, and will not help you determine the relative total costs of owning different funds. In addition, if these transactional costs were included, your costs would have been higher.
| | | Beginning
Account
Value
7/1/18 | | Actual Ending
Account
Value
12/31/18 | | Hypothetical
Ending Account
Value | | Actual
Expenses
Paid
During
Period* | | Hypothetical
Expenses Paid
During Period* | | Net
Expense
Ratio
During
Period** | |
Emerging Markets Breakout Nations Portfolio Class I | | $ | 1,000.00 | | | $ | 939.50 | | | $ | 1,019.56 | | | $ | 5.48 | | | $ | 5.70 | | | | 1.12 | % | |
Emerging Markets Breakout Nations Portfolio Class A | | | 1,000.00 | | | | 937.40 | | | | 1,017.54 | | | | 7.42 | | | | 7.73 | | | | 1.52 | | |
Emerging Markets Breakout Nations Portfolio Class C | | | 1,000.00 | | | | 933.70 | | | | 1,013.71 | | | | 11.11 | | | | 11.57 | | | | 2.28 | | |
Emerging Markets Breakout Nations Portfolio Class IS | | | 1,000.00 | | | | 939.50 | | | | 1,019.76 | | | | 5.28 | | | | 5.50 | | | | 1.08 | | |
* Expenses are calculated using each Fund Class' annualized net expense ratio (as disclosed), multiplied by the average account value over the period and multiplied by 184/365 (to reflect the most recent one-half year period).
** Annualized.
3
Morgan Stanley Institutional Fund, Inc.
Annual Report — December 31, 2018
Investment Overview (unaudited)
Emerging Markets Breakout Nations Portfolio
The Fund seeks long-term capital appreciation.
Performance
For the fiscal year ended December 31, 2018, the Fund's Class I shares had a total return based on net asset value and reinvestment of distributions per share of –17.10%, net of fees. The Fund's Class I shares underperformed the Fund's benchmark, the MSCI Emerging Markets Net Index (the "Index"), which returned –14.57%.
The Board of Directors approved to change the Fund's primary benchmark from MSCI Emerging Markets Net Index to MSCI Emerging Markets ex China Net Index effective 1/1/19 because of investment strategy change.
Factors Affecting Performance
• The Index returned –14.57% during the year, underperforming the MSCI World Net Index, which returned –8.71%. Qatar (+30%) and Peru (+2%) were the only countries with positive performance in the Index during the year. Turkey (–41%), Greece (–37%), Pakistan (–35%) and South Africa (–25%) underperformed the Index.
• Our stock selection in India was the biggest contributor to performance during the year. We have long held underweight allocations to China and Korea over concern about each country's slowing economic growth and China's massive debt build-up in its "old" and state-controlled portions of the economy and market. These underweight allocations contributed to performance. However, our stock selection in China detracted from performance.
• Our stock selection in and overweight allocations to Brazil and Peru contributed to performance, as did our stock selection in and underweight allocation to South Africa. Our stock selection in Egypt also contributed.
• Our allocation to Argentina was the most significant detractor from returns as it suffered currency weakness in April and again in August. Our stock selection in Poland and Malaysia and allocation to Bangladesh detracted. Our zero allocations to Taiwan and Russia also hampered returns.
• The Fund sometimes uses derivative instruments to manage certain market or currency exposures. This detracted from performance in the period.
Management Strategies
• Before its downturn during the fourth quarter of 2018, technology had dominated returns in emerging markets for nearly three years, showing high correlation with its U.S. counterparts. As a sector, tech had contributed around 40% of emerging market (EM) returns over the prior three years — a share matched only by energy in 2007.(i) Tech-heavy China had accounted for nearly half of all returns during this same three-year period. The infatuation with big tech stocks had driven the relative performance of small- and medium-cap stocks (on an equal-weighted index) to nearly two standard deviations below its historical trend in the emerging markets.(ii) This is highly unusual.
• Our argument for some time has been that when market imbalances grow this extreme, they don't persist. Now that we have begun to see major falls in tech and the tech-heavy MSCI China Index, the question is how the rebalancing is likely to play out. After the busts of tech and telecom in 2000 and energy in 2008, the beaten-down sectors recovered, small and medium caps came back to life and forgotten countries were rediscovered.
• Investors are also rediscovering overlooked markets in Eastern Europe and Latin America. Those markets had been battered in part by the strong U.S. dollar, which historically sucks money out of EM. Since the early 1980s, the dollar has rarely traded more than 15% above or below its long-term range, and it is now at the high end of that range.(iii) Dollar bear markets have tended to last around seven years. Our view is that the dollar's rise in 2018 was a temporary rally within the downtrend that began in 2016 and could prove long-lasting.
(i) Source: Morgan Stanley Investment Management, MSCI, as of December 31, 2018
(ii) Source: FAME, FactSet, as of June 14, 2018. The analysis is based on the relative performance trend of an equal-weighted MSCI EM Index versus a cap-weighted MSCI EM Index measured over the past 20 years.
(iii) Source: Morgan Stanley Investment Management, Bloomberg, FactSet, Haver Analytics
4
Morgan Stanley Institutional Fund, Inc.
Annual Report — December 31, 2018
Investment Overview (unaudited) (cont'd)
Emerging Markets Breakout Nations Portfolio
• Some of the hardest hit EM currencies have stabilized, and there is no reason to expect the broad collapse to resume. As a group, emerging markets — even excluding China — have a current account surplus. This contrasts with the aggregate current account deficit in 2013 when the "taper tantrum" rattled countries with large deficits, such as Brazil and India. Both those countries and others have seen their deficits narrow since 2013. We believe concerns about emerging market debt are really reflecting worries about China's debt. While the rest of EM has seen its non-financial debt climb by 20 percentage points as a share of gross domestic product (GDP) since the global financial crisis of 2008, China's debt has grown by more than 100 percentage points.(iv)
• Total global debt, which fell a bit after 2008, has since continued its upward march to 320% of global GDP, up from 200% in 2000.(iv) The big borrowers include the U.S. government, U.S. firms — and corporations in China. These debt clouds put an invisible ceiling on how high and fast central banks can normalize interest rates. The markets had expected the Federal Reserve to follow through on plans to raise rates in 2019, but as it became clear that any further hikes would slow the already weakening global economy and trigger turmoil in the markets, those expectations have receded of late.
• We remain constructive on Poland in particular on its further convergence potential with developed Europe and growing wage and consumption trends. Indonesia, Malaysia and Mexico have adjusted successfully to lower commodity prices, leading to better current and fiscal account positions. We are positioned in domestically driven economies and sectors.
(iv) Source: Morgan Stanley Investment Management, Bloomberg, FactSet, Haver Analytics
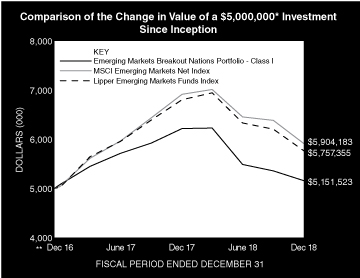
* Minimum Investment for Class I shares
** Commenced Operations on December 15, 2016.
In accordance with SEC regulations, the Fund's performance shown assumes that all recurring fees (including management fees) were deducted and all dividends and distributions were reinvested. The performance of Class A, C and IS shares will vary from the performance of Class I shares and will be negatively impacted by additional fees assessed to those classes (if applicable).
5
Morgan Stanley Institutional Fund, Inc.
Annual Report — December 31, 2018
Investment Overview (unaudited) (cont'd)
Emerging Markets Breakout Nations Portfolio
Performance Compared to the MSCI Emerging Markets Net Index(1) and the Lipper Emerging Markets Funds Index(2)
| | | Period Ended December 31, 2018
Total Returns(3) | |
| | | One
Year | | Five
Years | | Ten
Years | | Since
Inception(5) | |
Fund — Class I Shares
w/o sales charges(4) | | | –17.10 | % | | | — | | | | — | | | | 1.47 | % | |
Fund — Class A Shares
w/o sales charges(4) | | | –17.45 | | | | — | | | | — | | | | 1.04 | | |
Fund — Class A Shares
with maximum 5.25%
sales charges(4) | | | –21.79 | | | | — | | | | — | | | | –1.58 | | |
Fund — Class C Shares
w/o sales charges(4) | | | –18.09 | | | | — | | | | — | | | | 0.28 | | |
Fund — Class C Shares
with maximum 1.00%
deferred sales charges(4) | | | –18.90 | | | | — | | | | — | | | | 0.28 | | |
Fund — Class IS Shares
w/o sales charges(4) | | | –17.10 | | | | — | | | | — | | | | 1.48 | | |
MSCI Emerging Markets
Net Index | | | –14.57 | | | | — | | | | — | | | | 8.47 | | |
Lipper Emerging Markets Funds
Index | | | –15.34 | | | | — | | | | — | | | | 7.15 | | |
Performance data quoted represents past performance, which is no guarantee of future results, and current performance may be lower or higher than the figures shown. Performance assumes that all dividends and distributions, if any, were reinvested. For the most recent month-end performance figures, please visit www.morganstanley.com/im/shareholderreports. Investment return and principal value will fluctuate so that Fund shares, when redeemed, may be worth more or less than their original cost. Total returns do not reflect the deduction of taxes that a shareholder would pay on Fund distributions or the redemption of Fund shares. Performance of share classes will vary due to difference in sales charges and expenses.
(1) The MSCI Emerging Markets Net Index is a free float-adjusted market capitalization weighted index that is designed to measure equity market performance of emerging markets. The term "free float" represents the portion of shares outstanding that are deemed to be available for purchase in the public equity markets by investors. The MSCI Emerging Markets Net Index currently consists of 24 emerging market country indices. The performance of the Index is listed in U.S. dollars and assumes reinvestment of net dividends. The performance of the Index is listed in U.S. dollars and assumes reinvestment of net dividends. Net total return indices reinvest dividends after the deduction of withholding taxes, using (for international indices) a tax rate applicable to non-resident institutional investors who do not benefit from double taxation treaties. The Index is unmanaged and its returns do not include any sales charges or fees. Such costs would lower performance. It is not possible to invest directly in an index. The Board of Directors approved to change the Fund's primary benchmark from MSCI Emerging Markets Net Index to MSCI Emerging Markets ex China Net Index effective 1/1/19 because of investment strategy change.
(2) The Lipper Emerging Markets Funds Index is an equally weighted performance index of the largest qualifying funds (based on net assets) in the Lipper Emerging Markets Funds classification. The Index, which is adjusted for capital gains distributions and income dividends, is unmanaged and should not be considered an investment. There are currently 30 funds represented in this Index. As of the
date of this report, the Fund is in the Lipper Emerging Markets Funds classification.
(3) Total returns for the Fund reflect fees waived and expenses reimbursed, if applicable, by Morgan Stanley Investment Management Inc. (the "Adviser"). Without such waivers and reimbursements, total returns would have been lower.
(4) Commenced operations on December 15, 2016.
(5) For comparative purposes, average annual since inception returns listed for the Indexes refer to the inception date of the Fund, not the inception of the Index.
6
Morgan Stanley Institutional Fund, Inc.
Annual Report — December 31, 2018
Portfolio of Investments
Emerging Markets Breakout Nations Portfolio
| | | Shares | | Value
(000) | |
Common Stocks (75.0%) | |
Argentina (2.9%) | |
Banco Macro SA ADR | | | 491 | | | $ | 22 | | |
Globant SA (a) | | | 372 | | | | 21 | | |
Grupo Financiero Galicia SA ADR | | | 971 | | | | 27 | | |
Grupo Supervielle SA ADR | | | 874 | | | | 7 | | |
Pampa Energia SA ADR (a) | | | 592 | | | | 19 | | |
Telecom Argentina SA ADR | | | 1,240 | | | | 19 | | |
YPF SA ADR | | | 1,887 | | | | 25 | | |
| | | | 140 | | |
Brazil (10.4%) | |
Ambev SA | | | 19,890 | | | | 79 | | |
B3 SA — Brasil Bolsa Balcao | | | 8,746 | | | | 60 | | |
Banco Bradesco SA (Preference) | | | 9,565 | | | | 95 | | |
Itau Unibanco Holding SA (Preference) | | | 10,840 | | | | 100 | | |
Lojas Renner SA | | | 4,792 | | | | 53 | | |
Petroleo Brasileiro SA | | | 8,322 | | | | 54 | | |
Petroleo Brasileiro SA (Preference) | | | 10,900 | | | | 63 | | |
| | | | 504 | | |
Chile (3.1%) | |
Banco Santander Chile | | | 1,164,068 | | | | 87 | | |
SACI Falabella | | | 8,541 | | | | 62 | | |
| | | | 149 | | |
China (12.1%) | |
Alibaba Group Holding Ltd. ADR (a) | | | 796 | | | | 109 | | |
Baidu, Inc. ADR (a) | | | 134 | | | | 21 | | |
Brilliance China Automotive Holdings Ltd. (b) | | | 6,000 | | | | 4 | | |
China Mengniu Dairy Co., Ltd. (a)(b) | | | 9,000 | | | | 28 | | |
CSPC Pharmaceutical Group Ltd. (b) | | | 14,000 | | | | 20 | | |
JD.com, Inc. ADR (a) | | | 737 | | | | 15 | | |
Kweichow Moutai Co., Ltd., Class A | | | 200 | | | | 17 | | |
New Oriental Education & Technology Group,
Inc. ADR (a) | | | 354 | | | | 19 | | |
Shenzhou International Group Holdings Ltd. (b) | | | 4,000 | | | | 45 | | |
Sino Biopharmaceutical Ltd. (b) | | | 27,000 | | | | 18 | | |
Sinopharm Group Co., Ltd. H Shares (b) | | | 1,600 | | | | 7 | | |
Sogou, Inc. ADR (a) | | | 1,071 | | | | 6 | | |
TAL Education Group ADR (a) | | | 887 | | | | 24 | | |
Tencent Holdings Ltd. (b) | | | 6,400 | | | | 254 | | |
| | | | 587 | | |
Egypt (6.1%) | |
Commercial International Bank Egypt SAE (a) | | | 4,181 | | | | 17 | | |
Commercial International Bank Egypt SAE GDR | | | 26,816 | | | | 114 | | |
Egyptian Financial Group-Hermes Holding Co. (a) | | | 29,948 | | | | 25 | | |
Egyptian Financial Group-Hermes Holding Co.
GDR (a) | | | 31,288 | | | | 53 | | |
Integrated Diagnostics Holdings PLC | | | 13,288 | | | | 55 | | |
Juhayna Food Industries | | | 53,650 | | | | 34 | | |
| | | | 298 | | |
| | | Shares | | Value
(000) | |
India (2.4%) | |
HDFC Bank Ltd. ADR | | | 279 | | | $ | 29 | | |
ICICI Bank Ltd. ADR | | | 8,639 | | | | 89 | | |
| | | | 118 | | |
Indonesia (7.8%) | |
Astra International Tbk PT | | | 142,600 | | | | 82 | | |
Bank Central Asia Tbk PT | | | 31,200 | | | | 56 | | |
Bank Mandiri Persero Tbk PT | | | 129,200 | | | | 66 | | |
Bank Rakyat Indonesia Persero Tbk PT | | | 127,000 | | | | 32 | | |
Telekomunikasi Indonesia Persero Tbk PT | | | 282,800 | | | | 74 | | |
Unilever Indonesia Tbk PT | | | 21,000 | | | | 67 | | |
| | | | 377 | | |
Malaysia (4.7%) | |
Malayan Banking Bhd | | | 34,740 | | | | 80 | | |
Malaysia Airports Holdings Bhd | | | 29,900 | | | | 61 | | |
Public Bank Bhd | | | 6,900 | | | | 41 | | |
Sime Darby Plantation Bhd | | | 39,360 | | | | 45 | | |
| | | | 227 | | |
Mexico (5.9%) | |
Alsea SAB de CV | | | 13,593 | | | | 36 | | |
Fomento Economico Mexicano SAB de CV ADR | | | 790 | | | | 68 | | |
Grupo Financiero Banorte SAB de CV Series O | | | 19,125 | | | | 93 | | |
Infraestructura Energetica Nova SAB de CV | | | 6,145 | | | | 23 | | |
Wal-Mart de Mexico SAB de CV | | | 26,469 | | | | 67 | | |
| | | | 287 | | |
Peru (4.9%) | |
Cia de Minas Buenaventura S.A.A. ADR | | | 3,373 | | | | 55 | | |
Credicorp Ltd. | | | 840 | | | | 186 | | |
| | | | 241 | | |
Philippines (3.0%) | |
Ayala Corp. | | | 1,300 | | | | 22 | | |
Ayala Land, Inc. | | | 27,900 | | | | 22 | | |
SM Investments Corp. | | | 5,930 | | | | 103 | | |
| | | | 147 | | |
Poland (7.1%) | |
CCC SA | | | 1,194 | | | | 62 | | |
Jeronimo Martins SGPS SA | | | 2,673 | | | | 32 | | |
LPP SA | | | 31 | | | | 65 | | |
Powszechna Kasa Oszczednosci Bank Polski SA | | | 10,173 | | | | 107 | | |
Santander Bank Polska SA | | | 841 | | | | 81 | | |
| | | | 347 | | |
South Africa (3.4%) | |
AVI Ltd. | | | 2,692 | | | | 19 | | |
Bidvest Group Ltd. (The) | | | 1,650 | | | | 24 | | |
Capitec Bank Holdings Ltd. | | | 405 | | | | 31 | | |
Clicks Group Ltd. | | | 1,518 | | | | 20 | | |
Nedbank Group Ltd. | | | 1,408 | | | | 27 | | |
Reunert Ltd. | | | 2,745 | | | | 14 | | |
Sanlam Ltd. | | | 5,773 | | | | 32 | | |
| | | | 167 | | |
The accompanying notes are an integral part of the financial statements.
7
Morgan Stanley Institutional Fund, Inc.
Annual Report — December 31, 2018
Portfolio of Investments (cont'd)
Emerging Markets Breakout Nations Portfolio
| | | Shares | | Value
(000) | |
Vietnam (1.2%) | |
Sai Gon Cargo Service Corp. | | | 1,400 | | | $ | 9 | | |
Saigon Beer Alcohol Beverage Corp. | | | 1,510 | | | | 17 | | |
Vietjet Aviation JSC | | | 2,388 | | | | 12 | | |
Vincom Retail JSC (a) | | | 15,753 | | | | 19 | | |
| | | | 57 | | |
Total Common Stocks (Cost $3,718) | | | 3,646 | | |
Investment Company (5.6%) | |
India (5.6%) | |
| iShares MSCI India ETF (Cost $265) | | | 8,204 | | | | 274 | | |
Short-Term Investment (16.9%) | |
Investment Company (16.9%) | |
Morgan Stanley Institutional Liquidity
Funds — Government Portfolio —
Institutional Class (See Note G)
(Cost $819) | | | 818,564 | | | | 819 | | |
Total Investments (97.5%) (Cost $4,802) (c)(d)(e) | | | 4,739 | | |
| Other Assets in Excess of Liabilities (2.5%) | | | 122 | | |
Net Assets (100.0%) | | $ | 4,861 | | |
Country assignments and aggregations are based generally on third party vendor classifications and information, and may be different from the assignments and aggregations under the policies set forth in the Fund's prospectus and/or statement of additional information relating to geographic classifications.
(a) Non-income producing security.
(b) Security trades on the Hong Kong exchange.
(c) The approximate fair value and percentage of net assets, $2,666,000 and 54.8%, respectively, represent the securities that have been fair valued under the fair valuation policy for international investments as described in Note A-1 within the Notes to the Financial Statements.
(d) Securities are available for collateral in connection with an open foreign currency forward exchange contract and future contracts.
(e) At December 31, 2018, the aggregate cost for federal income tax purposes is approximately $4,794,000. The aggregate gross unrealized appreciation is approximately $331,000 and the aggregate gross unrealized depreciation is approximately $398,000, resulting in net unrealized depreciation of approximately $67,000.
ADR American Depositary Receipt.
ETF Exchange Traded Fund.
GDR Global Depositary Receipt.
Foreign Currency Forward Exchange Contract:
The Fund had the following foreign currency forward exchange contract open at December 31, 2018:
Counterparty | | Contracts to
Deliver
(000) | | In Exchange
For
(000) | | Delivery
Date | | Unrealized
Depreciation
(000) | |
UBS AG | | ZAR | 2,097 | | | $ | 139 | | | 1/17/19 | | $ | (7 | ) | |
Futures Contracts:
The Fund had the following futures contracts open at December 31, 2018:
| | | Number
of
Contracts | | Expiration
Date | | Notional
Amount
(000) | | Value
(000) | | Unrealized
Appreciation
(Depreciation)
(000) | |
Long: | |
MSCI Emerging Market E Mini (United States) | | | 5 | | | Mar-19 | | | — | @ | | $ | 242 | | | $ | (6 | ) | |
SGX NIFTY 50 (Singapore) | | | 23 | | | Jan-19 | | | — | @ | | | 502 | | | | 1 | | |
| | | | | | | | | | | $ | (5 | ) | |
@ — Value is less than $500
USD — United States Dollar
ZAR — South African Rand
Portfolio Composition
Classification | | Percentage of
Total Investments | |
Other* | | | 39.4 | % | |
Banks | | | 29.3 | | |
Short-Term Investments | | | 17.3 | | |
Interactive Media & Services | | | 8.2 | | |
Investment Companies | | | 5.8 | | |
Total Investments | | | 100.0 | %** | |
* Industries and/or investment types representing less than 5% of total investments.
** Does not include an open long futures contracts with a value of approximately $744,000 with unrealized depreciation of approximately $5,000. Does not include an open foreign currency forward exchange contract with total unrealized depreciation of approximately $7,000.
The accompanying notes are an integral part of the financial statements.
8
Morgan Stanley Institutional Fund, Inc.
Annual Report — December 31, 2018
Emerging Markets Breakout Nations Portfolio
Statement of Assets and Liabilities | | December 31, 2018
(000) | |
Assets: | |
Investments in Securities of Unaffiliated Issuers, at Value (Cost $3,983) | | $ | 3,920 | | |
Investment in Security of Affiliated Issuer, at Value (Cost $819) | | | 819 | | |
Total Investments in Securities, at Value (Cost $4,802) | | | 4,739 | | |
Foreign Currency, at Value (Cost $10) | | | 10 | | |
Due from Adviser | | | 72 | | |
Receivable for Variation Margin on Futures Contracts | | | 60 | | |
Receivable for Investments Sold | | | 55 | | |
Dividends Receivable | | | 6 | | |
Receivable from Affiliate | | | 2 | | |
Tax Reclaim Receivable | | | 1 | | |
Other Assets | | | 44 | | |
Total Assets | | | 4,989 | | |
Liabilities: | |
Payable for Professional Fees | | | 83 | | |
Payable for Custodian Fees | | | 15 | | |
Unrealized Depreciation on Foreign Currency Forward Exchange Contract | | | 7 | | |
Bank Overdraft | | | 4 | | |
Deferred Capital Gain Country Tax | | | 6 | | |
Payable for Transfer Agency Fees — Class I | | | 1 | | |
Payable for Transfer Agency Fees — Class A | | | 1 | | |
Payable for Transfer Agency Fees — Class C | | | 1 | | |
Payable for Transfer Agency Fees — Class IS | | | — | @ | |
Payable for Shareholder Services Fees — Class A | | | — | @ | |
Payable for Distribution and Shareholder Services Fees — Class C | | | — | @ | |
Payable for Investments Purchased | | | — | @ | |
Payable for Administration Fees | | | — | @ | |
Other Liabilities | | | 10 | | |
Total Liabilities | | | 128 | | |
Net Assets | | $ | 4,861 | | |
Net Assets Consist of: | |
Paid-in-Capital | | $ | 4,993 | | |
Total Accumulated Loss | | | (132 | ) | |
Net Assets | | $ | 4,861 | | |
CLASS I: | |
Net Assets | | $ | 4,831 | | |
| Shares Outstanding $0.001 par value shares of beneficial interest (unlimited shares authorized) (not in 000's) | | | 497,000 | | |
Net Asset Value, Offering and Redemption Price Per Share | | $ | 9.72 | | |
CLASS A: | |
Net Assets | | $ | 10 | | |
| Shares Outstanding $0.001 par value shares of beneficial interest (unlimited shares authorized) (not in 000's) | | | 1,000 | | |
Net Asset Value, Redemption Price Per Share | | $ | 9.67 | | |
Maximum Sales Load | | | 5.25 | % | |
Maximum Sales Charge | | $ | 0.54 | | |
Maximum Offering Price Per Share | | $ | 10.21 | | |
CLASS C: | |
Net Assets | | $ | 10 | | |
| Shares Outstanding $0.001 par value shares of beneficial interest (unlimited shares authorized) (not in 000's) | | | 1,000 | | |
Net Asset Value, Offering and Redemption Price Per Share | | $ | 9.53 | | |
CLASS IS: | |
Net Assets | | $ | 10 | | |
| Shares Outstanding $0.001 par value shares of beneficial interest (unlimited shares authorized) (not in 000's) | | | 1,000 | | |
Net Asset Value, Offering and Redemption Price Per Share | | $ | 9.73 | | |
@ Amount is less than $500.
The accompanying notes are an integral part of the financial statements.
9
Morgan Stanley Institutional Fund, Inc.
Annual Report — December 31, 2018
Emerging Markets Breakout Nations Portfolio
Statement of Operations | | Year Ended
December 31, 2018
(000) | |
Investment Income: | |
Dividends from Securities of Unaffiliated Issuers (Net of $7 of Foreign Taxes Withheld) | | $ | 78 | | |
Dividends from Security of Affiliated Issuer (Note G) | | | 12 | | |
Total Investment Income | | | 90 | | |
Expenses: | |
Professional Fees | | | 167 | | |
Registration Fees | | | 53 | | |
Advisory Fees (Note B) | | | 49 | | |
Custodian Fees (Note F) | | | 22 | | |
Shareholder Reporting Fees | | | 12 | | |
Transfer Agency Fees — Class I (Note E) | | | 2 | | |
Transfer Agency Fees — Class A (Note E) | | | 2 | | |
Transfer Agency Fees — Class C (Note E) | | | 2 | | |
Transfer Agency Fees — Class IS (Note E) | | | 2 | | |
Pricing Fees | | | 6 | | |
Administration Fees (Note C) | | | 4 | | |
Directors' Fees and Expenses | | | 3 | | |
Shareholder Services Fees — Class A (Note D) | | | — | @ | |
Distribution and Shareholder Services Fees — Class C (Note D) | | | — | @ | |
Other Expenses | | | 25 | | |
Total Expenses | | | 349 | | |
Expenses Reimbursed by Adviser (Note B) | | | (232 | ) | |
Waiver of Advisory Fees (Note B) | | | (49 | ) | |
Reimbursement of Class Specific Expenses — Class A (Note B) | | | (2 | ) | |
Reimbursement of Class Specific Expenses — Class C (Note B) | | | (2 | ) | |
Reimbursement of Class Specific Expenses — Class IS (Note B) | | | (2 | ) | |
Rebate from Morgan Stanley Affiliate (Note G) | | | (1 | ) | |
Net Expenses | | | 61 | | |
Net Investment Income | | | 29 | | |
Realized Loss: | |
Investments Sold (Net of $4 of Capital Gain Country Tax) | | | (44 | ) | |
Foreign Currency Forward Exchange Contracts | | | (15 | ) | |
Foreign Currency Translation | | | (2 | ) | |
Futures Contracts | | | (17 | ) | |
Net Realized Loss | | | (78 | ) | |
Change in Unrealized Appreciation (Depreciation): | |
Investments (Net Decrease in Deferred Capital Gain Country Tax of $3) | | | (944 | ) | |
Foreign Currency Forward Exchange Contracts | | | (17 | ) | |
Foreign Currency Translation | | | — | @ | |
Futures Contracts | | | (5 | ) | |
Net Change in Unrealized Appreciation (Depreciation) | | | (966 | ) | |
Net Realized Loss and Change in Unrealized Appreciation (Depreciation) | | | (1,044 | ) | |
Net Decrease in Net Assets Resulting from Operations | | $ | (1,015 | ) | |
@ Amount is less than $500.
The accompanying notes are an integral part of the financial statements.
10
Morgan Stanley Institutional Fund, Inc.
Annual Report — December 31, 2018
Emerging Markets Breakout Nations Portfolio
Statements of Changes in Net Assets | | Year Ended
December 31, 2018
(000) | | Year Ended
December 31, 2017
(000) | |
Increase (Decrease) in Net Assets: | |
Operations: | |
Net Investment Income | | $ | 29 | | | $ | 37 | | |
Net Realized Gain (Loss) | | | (78 | ) | | | 287 | | |
Net Change in Unrealized Appreciation (Depreciation) | | | (966 | ) | | | 807 | | |
Net Increase (Decrease) in Net Assets Resulting from Operations | | | (1,015 | ) | | | 1,131 | | |
Dividends and Distributions to Shareholders: | |
Class I | | | (77 | ) | | | (251 | )* | |
Class A | | | (— | @) | | | (— | @)* | |
Class C | | | (— | @) | | | (— | @)* | |
Class IS | | | (— | @) | | | (— | @)* | |
Total Dividends and Distributions to Shareholders | | | (77 | ) | | | (251 | ) | |
Total Increase (Decrease) in Net Assets | | | (1,092 | ) | | | 880 | | |
Net Assets: | |
Beginning of Period | | | 5,953 | | | | 5,073 | | |
End of Period | | $ | 4,861 | | | $ | 5,953 | † | |
The following information was previously reported in the December 31, 2017 financial statements. The distribution information for the year ended December 31, 2017 presented on the Statements of Changes in Net Assets is presented for comparative purposes to the December 31, 2018 financial statements, which conform to the SEC Final Rule on Disclosure Update and Simplification which was effective November 5, 2018.
* Dividends and Distributions to Shareholders for the year ended December 31, 2017 were as follows:
Class I: | |
Net Investment Income | | $ | (24 | ) | |
Net Realized Gain | | $ | (227 | ) | |
Class A: | |
Net Investment Income | | $ | (— | @) | |
Net Realized Gain | | $ | (— | @) | |
Class C: | |
Net Investment Income | | $ | (— | @) | |
Net Realized Gain | | $ | (— | @) | |
Class IS: | |
Net Investment Income | | $ | (— | @) | |
Net Realized Gain | | $ | (— | @) | |
† Accumulated Undistributed Net Investment Income for the year ended December 31, 2017 was $1.
@ Amount is less than $500.
The accompanying notes are an integral part of the financial statements.
11
Morgan Stanley Institutional Fund, Inc.
Annual Report — December 31, 2018
Financial Highlights
Emerging Markets Breakout Nations Portfolio
| | | Class I | |
| | | Year Ended December 31, | | Period from
December 15, 2016(1) to | |
Selected Per Share Data and Ratios | | 2018 | | 2017 | | December 31, 2016 | |
Net Asset Value, Beginning of Period | | $ | 11.91 | | | $ | 10.15 | | | $ | 10.00 | | |
Income (Loss) from Investment Operations: | |
Net Investment Income(2) | | | 0.06 | | | | 0.08 | | | | 0.00 | (3) | |
Net Realized and Unrealized Gain (Loss) | | | (2.09 | ) | | | 2.19 | | | | 0.15 | | |
Total from Investment Operations | | | (2.03 | ) | | | 2.27 | | | | 0.15 | | |
Distributions from and/or in Excess of: | |
Net Investment Income | | | (0.03 | ) | | | (0.05 | ) | | | — | | |
Net Realized Gain | | | (0.13 | ) | | | (0.46 | ) | | | — | | |
Total Distributions | | | (0.16 | ) | | | (0.51 | ) | | | — | | |
Net Asset Value, End of Period | | $ | 9.72 | | | $ | 11.91 | | | $ | 10.15 | | |
Total Return(4) | | | (17.10 | )% | | | 22.44 | % | | | 1.50 | %(6) | |
Ratios and Supplemental Data: | |
Net Assets, End of Period (Thousands) | | $ | 4,831 | | | $ | 5,917 | | | $ | 5,043 | | |
Ratio of Expenses to Average Net Assets(8) | | | 1.12 | %(5) | | | 1.11 | %(5) | | | 1.09 | %(5)(7) | |
Ratio of Net Investment Income to Average Net Assets(8) | | | 0.54 | %(5) | | | 0.66 | %(5) | | | 0.67 | %(5)(7) | |
Ratio of Rebate from Morgan Stanley Affiliates to Average Net Assets | | | 0.02 | % | | | 0.02 | % | | | 0.04 | %(7) | |
Portfolio Turnover Rate | | | 36 | % | | | 79 | % | | | 16 | %(6) | |
(8) Supplemental Information on the Ratios to Average Net Assets: | |
Ratios Before Expense Limitation: | |
Expenses to Average Net Assets | | | 6.28 | % | | | 9.42 | % | | | 22.93 | %(7) | |
Net Investment Loss to Average Net Assets | | | (4.62 | )% | | | (7.65 | )% | | | (21.17 | )%(7) | |
(1) Commencement of Operations.
(2) Per share amount is based on average shares outstanding.
(3) Amount is less than $0.005 per share.
(4) Calculated based on the net asset value as of the last business day of the period.
(5) The Ratios of Expenses and Net Investment Income reflect the rebate of certain Fund expenses in connection with the investments in Morgan Stanley affiliates during the period. The effect of the rebate on the ratios is disclosed in the above table as "Ratio of Rebate from Morgan Stanley Affiliates to Average Net Assets."
(6) Not annualized.
(7) Annualized.
The accompanying notes are an integral part of the financial statements.
12
Morgan Stanley Institutional Fund, Inc.
Annual Report — December 31, 2018
Financial Highlights
Emerging Markets Breakout Nations Portfolio
| | | Class A | |
| | | Year Ended December 31, | | Period from
December 15, 2016(1) to | |
Selected Per Share Data and Ratios | | 2018 | | 2017 | | December 31, 2016 | |
Net Asset Value, Beginning of Period | | $ | 11.90 | | | $ | 10.14 | | | $ | 10.00 | | |
Income (Loss) from Investment Operations: | |
Net Investment Income(2) | | | 0.01 | | | | 0.03 | | | | 0.00 | (3) | |
Net Realized and Unrealized Gain (Loss) | | | (2.08 | ) | | | 2.20 | | | | 0.14 | | |
Total from Investment Operations | | | (2.07 | ) | | | 2.23 | | | | 0.14 | | |
Distributions from and/or in Excess of: | |
Net Investment Income | | | (0.03 | ) | | | (0.01 | ) | | | — | | |
Net Realized Gain | | | (0.13 | ) | | | (0.46 | ) | | | — | | |
Total Distributions | | | (0.16 | ) | | | (0.47 | ) | | | — | | |
Net Asset Value, End of Period | | $ | 9.67 | | | $ | 11.90 | | | $ | 10.14 | | |
Total Return(4) | | | (17.45 | )% | | | 22.01 | % | | | 1.40 | %(6) | |
Ratios and Supplemental Data: | |
Net Assets, End of Period (Thousands) | | $ | 10 | | | $ | 12 | | | $ | 10 | | |
Ratio of Expenses to Average Net Assets(8) | | | 1.53 | %(5) | | | 1.53 | %(5) | | | 1.51 | %(5)(7) | |
Ratio of Net Investment Income to Average Net Assets(8) | | | 0.12 | %(5) | | | 0.25 | %(5) | | | 0.24 | %(5)(7) | |
Ratio of Rebate from Morgan Stanley Affiliates to Average Net Assets | | | 0.02 | % | | | 0.02 | % | | | 0.04 | %(7) | |
Portfolio Turnover Rate | | | 36 | % | | | 79 | % | | | 16 | %(6) | |
(8) Supplemental Information on the Ratios to Average Net Assets: | |
Ratios Before Expense Limitation: | |
Expenses to Average Net Assets | | | 23.28 | % | | | 27.13 | % | | | 37.02 | %(7) | |
Net Investment Loss to Average Net Assets | | | (21.63 | )% | | | (25.35 | )% | | | (35.27 | )%(7) | |
(1) Commencement of Operations.
(2) Per share amount is based on average shares outstanding.
(3) Amount is less than $0.005 per share.
(4) Calculated based on the net asset value which does not reflect sales charges, if applicable, as of the last business day of the period.
(5) The Ratios of Expenses and Net Investment Income reflect the rebate of certain Fund expenses in connection with the investments in Morgan Stanley affiliates during the period. The effect of the rebate on the ratios is disclosed in the above table as "Ratio of Rebate from Morgan Stanley Affiliates to Average Net Assets."
(6) Not annualized.
(7) Annualized.
The accompanying notes are an integral part of the financial statements.
13
Morgan Stanley Institutional Fund, Inc.
Annual Report — December 31, 2018
Financial Highlights
Emerging Markets Breakout Nations Portfolio
| | | Class C | |
| | | Year Ended December 31, | | Period from
December 15, 2016(1) to | |
Selected Per Share Data and Ratios | | 2018 | | 2017 | | December 31, 2016 | |
Net Asset Value, Beginning of Period | | $ | 11.80 | | | $ | 10.14 | | | $ | 10.00 | | |
Income (Loss) from Investment Operations: | |
Net Investment Loss(2) | | | (0.07 | ) | | | (0.06 | ) | | | (0.00 | )(3) | |
Net Realized and Unrealized Gain (Loss) | | | (2.04 | ) | | | 2.18 | | | | 0.14 | | |
Total from Investment Operations | | | (2.11 | ) | | | 2.12 | | | | 0.14 | | |
Distributions from and/or in Excess of: | |
Net Investment Income | | | (0.03 | ) | | | (0.00 | )(3) | | | — | | |
Net Realized Gain | | | (0.13 | ) | | | (0.46 | ) | | | — | | |
Total Distributions | | | (0.16 | ) | | | (0.46 | ) | | | — | | |
Net Asset Value, End of Period | | $ | 9.53 | | | $ | 11.80 | | | $ | 10.14 | | |
Total Return(4) | | | (18.09 | )% | | | 21.09 | % | | | 1.40 | %(6) | |
Ratios and Supplemental Data: | |
Net Assets, End of Period (Thousands) | | $ | 10 | | | $ | 12 | | | $ | 10 | | |
Ratio of Expenses to Average Net Assets(8) | | | 2.28 | %(5) | | | 2.28 | %(5) | | | 2.26 | %(5)(7) | |
Ratio of Net Investment Loss to Average Net Assets(8) | | | (0.62 | )%(5) | | | (0.50 | )%(5) | | | (0.50 | )%(5)(7) | |
Ratio of Rebate from Morgan Stanley Affiliates to Average Net Assets | | | 0.02 | % | | | 0.02 | % | | | 0.04 | %(7) | |
Portfolio Turnover Rate | | | 36 | % | | | 79 | % | | | 16 | %(6) | |
(8) Supplemental Information on the Ratios to Average Net Assets: | |
Ratios Before Expense Limitation: | |
Expenses to Average Net Assets | | | 24.22 | % | | | 26.78 | % | | | 37.76 | %(7) | |
Net Investment Loss to Average Net Assets | | | (22.56 | )% | | | (25.00 | )% | | | (36.00 | )%(7) | |
(1) Commencement of Operations.
(2) Per share amount is based on average shares outstanding.
(3) Amount is less than $0.005 per share.
(4) Calculated based on the net asset value which does not reflect sales charges, if applicable, as of the last business day of the period.
(5) The Ratios of Expenses and Net Investment Loss reflect the rebate of certain Fund expenses in connection with the investments in Morgan Stanley affiliates during the period. The effect of the rebate on the ratios is disclosed in the above table as "Ratio of Rebate from Morgan Stanley Affiliates to Average Net Assets."
(6) Not annualized.
(7) Annualized.
The accompanying notes are an integral part of the financial statements.
14
Morgan Stanley Institutional Fund, Inc.
Annual Report — December 31, 2018
Financial Highlights
Emerging Markets Breakout Nations Portfolio
| | | Class IS | |
| | | Year Ended December 31, | | Period from
December 15, 2016(1) to | |
Selected Per Share Data and Ratios | | 2018 | | 2017 | | December 31, 2016 | |
Net Asset Value, Beginning of Period | | $ | 11.91 | | | $ | 10.15 | | | $ | 10.00 | | |
Income (Loss) from Investment Operations: | |
Net Investment Income(2) | | | 0.06 | | | | 0.08 | | | | 0.00 | (3) | |
Net Realized and Unrealized Gain (Loss) | | | (2.08 | ) | | | 2.19 | | | | 0.15 | | |
Total from Investment Operations | | | (2.02 | ) | | | 2.27 | | | | 0.15 | | |
Distributions from and/or in Excess of: | |
Net Investment Income | | | (0.03 | ) | | | (0.05 | ) | | | — | | |
Net Realized Gain | | | (0.13 | ) | | | (0.46 | ) | | | — | | |
Total Distributions | | | (0.16 | ) | | | (0.51 | ) | | | — | | |
Net Asset Value, End of Period | | $ | 9.73 | | | $ | 11.91 | | | $ | 10.15 | | |
Total Return(4) | | | (17.10 | )% | | | 22.47 | % | | | 1.50 | %(6) | |
Ratios and Supplemental Data: | |
Net Assets, End of Period (Thousands) | | $ | 10 | | | $ | 12 | | | $ | 10 | | |
Ratio of Expenses to Average Net Assets(8) | | | 1.08 | %(5) | | | 1.08 | %(5) | | | 1.06 | %(5)(7) | |
Ratio of Net Investment Income to Average Net Assets(8) | | | 0.58 | %(5) | | | 0.69 | %(5) | | | 0.70 | %(5)(7) | |
Ratio of Rebate from Morgan Stanley Affiliates to Average Net Assets | | | 0.02 | % | | | 0.02 | % | | | 0.04 | %(7) | |
Portfolio Turnover Rate | | | 36 | % | | | 79 | % | | | 16 | %(6) | |
(8) Supplemental Information on the Ratios to Average Net Assets: | |
Ratios Before Expense Limitation: | |
Expenses to Average Net Assets | | | 20.74 | % | | | 25.68 | % | | | 36.76 | %(7) | |
Net Investment Loss to Average Net Assets | | | (19.08 | )% | | | (23.91 | )% | | | (35.00 | )%(7) | |
(1) Commencement of Operations.
(2) Per share amount is based on average shares outstanding.
(3) Amount is less than $0.005 per share.
(4) Calculated based on the net asset value as of the last business day of the period.
(5) The Ratios of Expenses and Net Investment Income reflect the rebate of certain Fund expenses in connection with the investments in Morgan Stanley affiliates during the period. The effect of the rebate on the ratios is disclosed in the above table as "Ratio of Rebate from Morgan Stanley Affiliates to Average Net Assets."
(6) Not annualized.
(7) Annualized.
The accompanying notes are an integral part of the financial statements.
15
Morgan Stanley Institutional Fund, Inc.
Annual Report — December 31, 2018
Notes to Financial Statements
Morgan Stanley Institutional Fund, Inc. (the "Company") is registered under the Investment Company Act of 1940, as amended (the "Act"), as an open-end management investment company. The Company is comprised of thirty separate, active, diversified and non-diversified funds (individually referred to as a "Fund", collectively as the "Funds"). The Company applies investment company accounting and reporting guidance.
The accompanying financial statements relate to the Emerging Markets Breakout Nations Portfolio. The Fund seeks long-term capital appreciation.
The Fund offers four classes of shares — Class I, Class A, Class C and Class IS.
A. Significant Accounting Policies: The following significant accounting policies are in conformity with U.S. generally accepted accounting principles ("GAAP"). Such policies are consistently followed by the Company in the preparation of its financial statements. GAAP may require management to make estimates and assumptions that affect the reported amounts and disclosures in the financial statements. Actual results may differ from those estimates.
In August 2018, the Financial Accounting Standards Board ("FASB") issued Accounting Standards Update ("ASU") 2018-13, Fair Value Measurement (Topic 820) — Disclosures Framework — Changes to Disclosure Requirements of Fair Value Measurement ("ASU 2018-13") which introduces new fair value disclosure requirements as well as eliminates and modifies certain existing fair value disclosure requirements. ASU 2018-13 would be effective for fiscal years beginning after December 15, 2019 and for interim periods within those fiscal years; however, management has elected to early adopt ASU 2018-13 effective with the current reporting period as permitted by the standard. The impact of the Fund's adoption was limited to changes in the Fund's financial statement disclosures regarding fair value, primarily those disclosures related to transfers between levels of the fair value hierarchy and disclosure of the range and weighted average used to develop significant unobservable inputs for Level 3 fair value measurements, when applicable.
1. Security Valuation: (1) An equity portfolio security listed or traded on an exchange is valued at its latest reported sales price (or at the exchange official closing price if such exchange reports an official closing price), and if there were no sales on a given day and if there is no
official exchange closing price for that day, the security is valued at the mean between the last reported bid and asked prices if such bid and asked prices are available on the relevant exchanges. Listed equity securities not traded on the valuation date with no reported bid and asked prices available on the exchange are valued at the mean between the current bid and asked prices obtained from one or more reputable brokers or dealers. In cases where a security is traded on more than one exchange, the security is valued on the exchange designated as the primary market; (2) all other equity portfolio securities for which over-the-counter ("OTC") market quotations are readily available are valued at the latest reported sales price (or at the market official closing price if such market reports an official closing price), and if there was no trading in the security on a given day and if there is no official closing price from relevant markets for that day, the security is valued at the mean between the last reported bid and asked prices if such bid and asked prices are available on the relevant markets. An unlisted equity security that does not trade on the valuation date and for which bid and asked prices from the relevant markets are unavailable is valued at the mean between the current bid and asked prices obtained from one or more reputable brokers or dealers; (3) certain portfolio securities may be valued by an outside pricing service/vendor approved by the Company's Board of Directors (the "Directors"). The pricing service/vendor may employ a pricing model that takes into account, among other things, bids, yield spreads and/or other market data and specific security characteristics. Alternatively, if a valuation is not available from an outside pricing service/vendor, and the security trades on an exchange, the security may be valued at its latest reported sale price (or at the exchange official closing price if such exchange reports an official closing price), prior to the time when assets are valued. If there are no sales on a given day and if there is no official exchange closing price for that day, the security is valued at the mean between the last reported bid and asked prices if such bid and asked prices are available in the relevant exchanges; (4) futures are valued at the settlement price on the exchange on which they trade or, if a settlement price is unavailable, at the last sale price on the exchange; (5) when market quotations are not readily available, including circumstances under which Morgan Stanley Investment Management Inc. (the "Adviser") determines that the closing price, last
16
Morgan Stanley Institutional Fund, Inc.
Annual Report — December 31, 2018
Notes to Financial Statements (cont'd)
sale price or the mean between the last reported bid and asked prices are not reflective of a security's market value, portfolio securities are valued at their fair value as determined in good faith under procedures established by and under the general supervision of the Directors. Occasionally, developments affecting the closing prices of securities and other assets may occur between the times at which valuations of such securities are determined (that is, close of the foreign market on which the securities trade) and the close of business of the New York Stock Exchange ("NYSE"). If developments occur during such periods that are expected to materially affect the value of such securities, such valuations may be adjusted to reflect the estimated fair value of such securities as of the close of the NYSE, as determined in good faith by the Directors or by the Adviser using a pricing service and/or procedures approved by the Directors; (6) quotations of foreign portfolio securities, other assets and liabilities and forward contracts stated in foreign currency are translated into U.S. dollar equivalents at the prevailing market rates prior to the close of the NYSE; and (7) investments in mutual funds, including the Morgan Stanley Institutional Liquidity Funds, are valued at the net asset value ("NAV") as of the close of each business day.
The Directors have responsibility for determining in good faith the fair value of the investments, and the Directors may appoint others, such as the Company's Adviser or a valuation committee, to assist the Directors in determining fair value and to make the actual calculations pursuant to the fair valuation methodologies previously approved by the Directors. Under procedures approved by the Directors, the Company's Adviser has formed a Valuation Committee whose members are approved by the Directors. The Valuation Committee provides administration and oversight of the Company's valuation policies and procedures, which are reviewed at least annually by the Directors. These procedures allow the Company to utilize independent pricing services, quotations from securities and financial instrument dealers and other market sources to determine fair value.
2. Fair Value Measurement: FASB Accounting Standards CodificationTM ("ASC") 820, "Fair Value Measurement" ("ASC 820"), defines fair value as the value that the
Fund would receive to sell an investment or pay to transfer a liability in a timely transaction with an independent buyer in the principal market, or in the absence of a principal market, the most advantageous market for the investment or liability. ASC 820 establishes a three-tier hierarchy to distinguish between (1) inputs that reflect the assumptions market participants would use in valuing an asset or liability developed based on market data obtained from sources independent of the reporting entity (observable inputs) and (2) inputs that reflect the reporting entity's own assumptions about the assumptions market participants would use in valuing an asset or liability developed based on the best information available in the circumstances (unobservable inputs) and to establish classification of fair value measurements for disclosure purposes. Various inputs are used in determining the value of the Fund's investments. The inputs are summarized in the three broad levels listed below:
• Level 1 – unadjusted quoted prices in active markets for identical investments
• Level 2 – other significant observable inputs (including quoted prices for similar investments, interest rates, prepayment speeds, credit risk, etc.)
• Level 3 – significant unobservable inputs including the Fund's own assumptions in determining the fair value of investments. Factors considered in making this determination may include, but are not limited to, information obtained by contacting the issuer, analysts, or the appropriate stock exchange (for exchange-traded securities), analysis of the issuer's financial statements or other available documents and, if necessary, available information concerning other securities in similar circumstances
The inputs or methodology used for valuing securities are not necessarily an indication of the risk associated with investing in those securities and the determination of the significance of a particular input to the fair value measurement in its entirety requires judgment and considers factors specific to each security.
17
Morgan Stanley Institutional Fund, Inc.
Annual Report — December 31, 2018
Notes to Financial Statements (cont'd)
The following is a summary of the inputs used to value the Fund's investments as of December 31, 2018:
Investment Type | | Level 1
Unadjusted
quoted
prices
(000) | | Level 2
Other
significant
observable
inputs
(000) | | Level 3
Significant
unobservable
inputs
(000) | | Total
(000) | |
Assets: | |
Common Stocks | |
Air Freight & Logistics | | $ | — | | | $ | 9 | | | $ | — | | | $ | 9 | | |
Airlines | | | — | | | | 12 | | | | — | | | | 12 | | |
Automobiles | | | — | | | | 86 | | | | — | | | | 86 | | |
Banks | | | 453 | | | | 934 | | | | — | | | | 1,387 | | |
Beverages | | | 68 | | | | 113 | | | | — | | | | 181 | | |
Capital Markets | | | — | | | | 138 | | | | — | | | | 138 | | |
Diversified Consumer
Services | | | 43 | | | | — | | | | — | | | | 43 | | |
Diversified Financial
Services | | | — | | | | 22 | | | | — | | | | 22 | | |
Diversified
Telecommunication
Services | | | 19 | | | | 74 | | | | — | | | | 93 | | |
Electric Utilities | | | 19 | | | | — | | | | — | | | | 19 | | |
Food & Staples Retailing | | | 67 | | | | 52 | | | | — | | | | 119 | | |
Food Products | | | — | | | | 126 | | | | — | | | | 126 | | |
Gas Utilities | | | 23 | | | | — | | | | — | | | | 23 | | |
Health Care Providers &
Services | | | — | | | | 62 | | | | — | | | | 62 | | |
Hotels, Restaurants &
Leisure | | | 36 | | | | — | | | | — | | | | 36 | | |
Household Products | | | — | | | | 67 | | | | — | | | | 67 | | |
Industrial Conglomerates | | | — | | | | 141 | | | | — | | | | 141 | | |
Insurance | | | — | | | | 32 | | | | — | | | | 32 | | |
Interactive Media &
Services | | | 136 | | | | 254 | | | | — | | | | 390 | | |
Internet & Direct
Marketing Retail | | | 15 | | | | — | | | | — | | | | 15 | | |
Metals & Mining | | | 55 | | | | — | | | | — | | | | 55 | | |
Multi-Line Retail | | | — | | | | 115 | | | | — | | | | 115 | | |
Oil, Gas & Consumable
Fuels | | | 25 | | | | 117 | | | | — | | | | 142 | | |
Pharmaceuticals | | | — | | | | 38 | | | | — | | | | 38 | | |
Real Estate
Management &
Development | | | — | | | | 41 | | | | — | | | | 41 | | |
Software | | | 21 | | | | — | | | | — | | | | 21 | | |
Textiles, Apparel & Luxury
Goods | | | — | | | | 172 | | | | — | | | | 172 | | |
Transportation
Infrastructure | | | — | | | | 61 | | | | — | | | | 61 | | |
Total Common Stocks | | | 980 | | | | 2,666 | | | | — | | | | 3,646 | | |
Investment Company | | | 274 | | | | — | | | | — | | | | 274 | | |
Short-Term Investment | |
Investment Company | | | 819 | | | | — | | | | — | | | | 819 | | |
Futures Contract | | | 1 | | | | — | | | | — | | | | 1 | | |
Total Assets | | | 2,074 | | | | 2,666 | | | | — | | | | 4,740 | | |
Liabilities: | |
Foreign Currency Forward
Exchange Contract | | | — | | | | (7 | ) | | | — | | | | (7 | ) | |
Futures Contract | | | (6 | ) | | | — | | | | — | | | | (6 | ) | |
Total Liabilities | | | (6 | ) | | | (7 | ) | | | — | | | | (13 | ) | |
Total | | $ | 2,068 | | | $ | 2,659 | | | $ | — | | | $ | 4,727 | | |
Transfers between investment levels may occur as the markets fluctuate and/or the availability of data used in an investment's valuation changes.
3. Foreign Currency Translation and Foreign Investments: The books and records of the Fund are maintained in U.S. dollars. Foreign currency amounts are translated into U.S. dollars as follows:
– investments, other assets and liabilities at the prevailing rate of exchange on the valuation date;
– investment transactions and investment income at the prevailing rates of exchange on the dates of such transactions.
Although the net assets of the Fund are presented at the foreign exchange rates and market values at the close of the period, the Fund does not isolate that portion of the results of operations arising as a result of changes in the foreign exchange rates from the fluctuations arising from changes in the market prices of securities held at period end. Similarly, the Fund does not isolate the effect of changes in foreign exchange rates from the fluctuations arising from changes in the market prices of securities sold during the period. Accordingly, realized and unrealized foreign currency gains (losses) on investments in securities are included in the reported net realized and unrealized gains (losses) on investment transactions and balances. However, pursuant to U.S. federal income tax regulations, gains and losses from certain foreign currency transactions and the foreign currency portion of gains and losses realized on sales and maturities of foreign denominated debt securities are treated as ordinary income for U.S. federal income tax purposes.
Net realized gains (losses) on foreign currency transactions represent net foreign exchange gains (losses) from foreign currency forward exchange contracts, disposition of foreign currencies, currency gains (losses) realized between the trade and settlement dates on securities transactions, and the difference between the amount of investment income and foreign withholding taxes recorded on the Fund's books and the U.S. dollar equivalent amounts actually received or paid. Net unrealized currency gains (losses) from valuing foreign currency denominated assets and liabilities at period end exchange rates are reflected as a component of
18
Morgan Stanley Institutional Fund, Inc.
Annual Report — December 31, 2018
Notes to Financial Statements (cont'd)
unrealized appreciation (depreciation) in the Statement of Assets and Liabilities. The change in unrealized currency gains (losses) on foreign currency translations for the period is reflected in the Statement of Operations.
A significant portion of the Fund's net assets consist of securities of issuers located in emerging markets, which are denominated in foreign currencies. Such securities may be concentrated in a limited number of countries and regions and may vary throughout the year. Changes in currency exchange rates will affect the value of securities and investment income from foreign currency denominated securities. Emerging market securities are often subject to greater price volatility, limited capitalization and liquidity, and higher rates of inflation than securities of companies based in the U.S. In addition, emerging market issuers may be subject to substantial governmental involvement in the economy and greater social, economic and political uncertainty.
Governmental approval for foreign investments may be required in advance of making an investment under certain circumstances in some countries, and the extent of foreign investments in domestic companies may be subject to limitation in other countries. Foreign ownership limitations also may be imposed by the charters of individual companies to prevent, among other concerns, violations of foreign investment limitations. As a result, an additional class of shares (identified as "Foreign" in the Portfolio of Investments) may be created and offered for investment. The "local" and "foreign shares" market values may differ. In the absence of trading of the foreign shares in such markets, the Fund values the foreign shares at the closing exchange price of the local shares.
4. Derivatives: The Fund may, but is not required to, use derivative instruments for a variety of purposes, including hedging, risk management, portfolio management or to earn income. Derivatives are financial instruments whose value is based, in part, on the value of an underlying asset, interest rate, index or financial instrument. Prevailing interest rates and volatility levels, among other things, also affect the value of derivative instruments. A derivative instrument often has risks similar to its underlying asset and may have additional risks, including imperfect correlation between the value of the derivative and the underlying asset, risks of default by the counterparty to certain transactions, magnification of losses incurred due to changes in the market value of the securities, instruments,
indices or interest rates to which the derivative instrument relates, risks that the transactions may not be liquid and risks arising from margin requirements. The use of derivatives involves risks that are different from, and possibly greater than, the risks associated with other portfolio investments. Derivatives may involve the use of highly specialized instruments that require investment techniques and risk analyses different from those associated with other portfolio investments. All of the Fund's holdings, including derivative instruments, are marked-to-market each day with the change in value reflected in unrealized appreciation (depreciation). Upon disposition, a realized gain or loss is recognized.
Certain derivative transactions may give rise to a form of leverage. Leverage magnifies the potential for gain and the risk of loss. Leverage associated with derivative transactions may cause the Fund to liquidate portfolio positions when it may not be advantageous to do so to satisfy its obligations or to meet earmarking or segregation requirements, pursuant to applicable Securities and Exchange Commission ("SEC") rules and regulations, or may cause the Fund to be more volatile than if the Fund had not been leveraged. Although the Adviser seeks to use derivatives to further the Fund's investment objectives, there is no assurance that the use of derivatives will achieve this result.
Following is a description of the derivative instruments and techniques that the Fund used during the period and their associated risks:
Foreign Currency Forward Exchange Contracts: In connection with its investments in foreign securities, the Fund also entered into contracts with banks, brokers or dealers to purchase or sell securities or foreign currencies at a future date. A foreign currency forward exchange contract ("currency contract") is a negotiated agreement between the contracting parties to exchange a specified amount of currency at a specified future time at a specified rate. The rate can be higher or lower than the spot rate between the currencies that are the subject of the contract. Currency contracts may be used to protect against uncertainty in the level of future foreign currency exchange rates or to gain or modify exposure to a particular currency. To the extent hedged by the use of currency contracts, the precise matching of the currency contract amounts and the value of the securities involved will not generally be possible because the future value of
19
Morgan Stanley Institutional Fund, Inc.
Annual Report — December 31, 2018
Notes to Financial Statements (cont'd)
such securities in foreign currencies will change as a consequence of market movements in the value of those securities between the date on which the contract is entered into and the date it matures. Furthermore, such transactions may reduce or preclude the opportunity for gain if the value of the currency should move in the direction opposite to the position taken. There is additional risk to the extent that currency contracts create exposure to currencies in which the Fund's securities are not denominated. Unanticipated changes in currency prices may result in poorer overall performance for the Fund than if it had not entered into such contracts. The use of currency contracts involves the risk of loss from the insolvency or bankruptcy of the counterparty to the contract or the failure of the counterparty to make payments or otherwise comply with the terms of the contract. A currency contract is marked-to-market daily and the change in market value is recorded by the Fund as unrealized gain or loss. The Fund records realized gains (losses) when the currency contract is closed equal to the difference between the value of the currency contract at the time it was opened and the value at the time it was closed.
Futures: A futures contract is a standardized, exchange-traded agreement to buy or sell a specific quantity of an underlying asset, reference rate or index at a specific price at a specific future time. The value of a futures contract tends to increase and decrease in tandem with the value of the underlying instrument. Depending on the terms of the particular contract, futures contracts are settled through either physical delivery of the underlying instrument on the settlement date or by payment of a cash settlement amount on the settlement date. During the period the futures contract is open, payments are received from or made to the broker based upon changes in the value of the contract (the variation margin). A decision as to whether, when and how to use futures contracts involves the exercise of skill and judgment and even a well-conceived futures transaction may be unsuccessful because of market behavior or unexpected events. In addition to the derivatives risks discussed above, the prices of futures contracts can be highly volatile, using futures contracts can lower total return and the potential loss from futures contracts can exceed the Fund's initial investment in such contracts. No assurance can be given that a liquid market will exist for any particular futures
contract at any particular time. There is also the risk of loss by the Fund of margin deposits in the event of bankruptcy of a broker with which the Fund has open positions in the futures contract.
FASB ASC 815, "Derivatives and Hedging" ("ASC 815"), is intended to improve financial reporting about derivative instruments by requiring enhanced disclosures to enable investors to better understand how and why the Fund uses derivative instruments, how these derivative instruments are accounted for and their effects on the Fund's financial position and results of operations.
The following tables set forth the fair value of the Fund's derivative contracts by primary risk exposure as of December 31, 2018:
| | | Asset Derivatives
Statement of Assets and
Liabilities Location | | Primary Risk
Exposure | | Value
(000) | |
Futures Contract
| | Variation Margin on
Futures Contract | |
Equity Risk | | $ | 1 | (a) | |
| | | Liability Derivatives
Statement of Assets and
Liabilities Location | | Primary Risk
Exposure | | Value
(000) | |
Foreign Currency
Forward Exchange
Contract | | Unrealized Depreciation on
Foreign Currency Forward
Exchange Contract | |
Currency Risk | | $ | (7 | ) | |
Futures Contract
| | Variation Margin on
Futures Contract | |
Equity Risk | | | (6 | )(a) | |
Total | | | | | | $ | (13 | ) | |
(a) This amount represents the cumulative appreciation (depreciation) as reported in the Portfolio of Investments. The Statement of Assets and Liabilities only reflects the current day's net variation margin.
The following tables set forth by primary risk exposure the Fund's realized gains (losses) and change in unrealized appreciation (depreciation) by type of derivative contract for the year ended December 31, 2018 in accordance with ASC 815:
Realized Gain (Loss) | |
Primary Risk Exposure | | Derivative Type | | Value
(000) | |
Currency Risk | | Foreign Currency Forward
Exchange Contracts | | $ | (15 | ) | |
Equity Risk | | Futures Contracts | | | (17 | ) | |
Total | | | | $ | (32 | ) | |
Change in Unrealized Appreciation (Depreciation) | |
Primary Risk Exposure | | Derivative Type | | Value
(000) | |
Currency Risk | | Foreign Currency Forward
Exchange Contracts | | $ | (17 | ) | |
Equity Risk | | Futures Contracts | | | (5 | ) | |
Total | | | | $ | (22 | ) | |
20
Morgan Stanley Institutional Fund, Inc.
Annual Report — December 31, 2018
Notes to Financial Statements (cont'd)
At December 31, 2018, the Fund's derivative assets and liabilities are as follows:
Gross Amounts of Assets and Liabilities
Presented in the Statement of Assets and Liabilities | |
Derivatives(b) | | Assets(c)
(000) | | Liabilities(c)
(000) | |
Foreign Currency Forward Exchange Contract | | $ | — | | | $ | 7 | | |
(b) Excludes exchange-traded derivatives.
(c) Absent an event of default or early termination, OTC derivative assets and liabilities are presented gross and not offset in the Statement of Assets and Liabilities.
The Fund typically enters into International Swaps and Derivatives Association, Inc. Master Agreements ("ISDA Master Agreements") or similar master agreements (collectively, "Master Agreements") with its contract counterparties for certain OTC derivatives in order to, among other things, reduce its credit risk to counterparties. ISDA Master Agreements include provisions for general obligations, representations, collateral and events of default or termination. Under an ISDA Master Agreement, the Fund typically may offset with the counterparty certain OTC derivative financial instruments' payables and/or receivables with collateral held and/or posted and create one single net payment (close-out netting) in the event of default, termination and/or potential deterioration in the credit quality of the counterparty. Various Master Agreements govern the terms of certain transactions with counterparties, including transactions such as swap, forward, repurchase and reverse repurchase agreements. These Master Agreements typically attempt to reduce the counterparty risk associated with such transactions by specifying credit protection mechanisms and providing standardization that improves legal certainty. Cross-termination provisions under Master Agreements typically provide that a default in connection with one transaction between the Fund and a counterparty gives the non-defaulting party the right to terminate any other transactions in place with the defaulting party to create one single net payment due to/due from the defaulting party and may be a feature in certain Master Agreements. In the event the Fund exercises its right to terminate a Master Agreement after a counterparty experiences a termination event as defined in the Master Agreement, the return of collateral with market value in excess of the Fund's net liability may be delayed or denied.
The following table presents derivative financial instruments that are subject to enforceable netting arrangements as of December 31, 2018:
Gross Amounts Not Offset in the Statement of Assets and Liabilities | |
Counterparty | | Gross Liabilities
Derivatives
Presented in the
Statement of
Assets and
Liabilities
(000) | | Financial
Instrument
(000) | | Collateral
Received
(000) | | Net Amount
(not less
than $0)
(000) | |
UBS AG | | $ | 7 | | | $ | — | | | $ | — | | | $ | 7 | | |
For the year ended December 31, 2018, the approximate average monthly amount outstanding for each derivative type is as follows:
Foreign Currency Forward Exchange Contract: | |
Average monthly principal amount | | $ | 452,000 | | |
Futures Contract: | |
Average monthly notional value | | $ | 1,094,000 | | |
5. Redemption Fees: The Fund will assess a 2% redemption fee on Class I shares, Class A shares, Class C shares and Class IS shares, which is paid directly to the Fund, for shares redeemed or exchanged within thirty days of purchase, subject to certain exceptions. The redemption fee is designed to protect the Fund and its remaining shareholders from the effects of short-term trading. These fees, if any, are included in the Statements of Changes in Net Assets.
6. Indemnifications: The Company enters into contracts that contain a variety of indemnifications. The Company's maximum exposure under these arrangements is unknown. However, the Company has not had prior claims or losses pursuant to these contracts and expects the risk of loss to be remote.
7. Dividends and Distributions to Shareholders: Dividend income and distributions to shareholders are recorded on the ex-dividend date. Dividends from net investment income, if any, are declared and paid annually. Net realized capital gains, if any, are distributed at least annually.
8. Security Transactions, Income and Expenses: Security transactions are accounted for on the trade date (date the order to buy or sell is executed). Realized gains and losses on the sale of investment securities are
21
Morgan Stanley Institutional Fund, Inc.
Annual Report — December 31, 2018
Notes to Financial Statements (cont'd)
determined on the specific identified cost method. Dividend income and other distributions are recorded on the ex-dividend date (except for certain foreign dividends which may be recorded as soon as the Fund is informed of such dividends) net of applicable withholding taxes. Interest income is recognized on the accrual basis except where collection is in doubt. Discounts are accreted and premiums are amortized over the life of the respective securities. Most expenses of the Company can be directly attributed to a particular Fund. Expenses which cannot be directly attributed are apportioned among the Funds based upon relative net assets or other appropriate methods. Income, expenses (other than class specific expenses — distribution and shareholder services, transfer agency and sub transfer agency fees) and realized and unrealized gains or losses are allocated to each class of shares based upon their relative net assets.
B. Advisory Fees: The Adviser, a wholly-owned subsidiary of Morgan Stanley, provides the Fund with advisory services under the terms of an Investment Advisory Agreement, paid quarterly, at the annual rate based on the daily net assets as follows:
First $1
billion | | Over $1
billion | |
| | 0.90 | % | | | 0.85 | % | |
For the year ended December 31, 2018, the advisory fee rate (net of waiver/rebate) was equivalent to an annual effective rate of 0.00% of the Fund's average daily net assets.
The Adviser has agreed to reduce its advisory fee and/or reimburse the Fund so that total annual portfolio operating expenses, excluding certain investment related expenses, taxes, interest and other extraordinary expenses (including litigation), will not exceed 1.20% for Class I shares, 1.55% for Class A shares, 2.30% for Class C shares and 1.10% for Class IS shares. The fee waivers and/or expense reimbursements will continue for at least one year from the date of the Fund's prospectus or until such time as the Directors act to discontinue all or a portion of such waivers and/or reimbursements when they deem such action is appropriate. For the period ended December 31, 2018, approximately $49,000 of advisory fees were waived and approximately $238,000 of other expenses were reimbursed by the Adviser pursuant to this arrangement.
C. Administration Fees: The Adviser also serves as Administrator to the Company and provides administrative services pursuant to an Administration Agreement for an annual fee, accrued daily and paid monthly, of 0.08% of the Fund's average daily net assets.
Under a Sub-Administration Agreement between the Administrator and State Street Bank and Trust Company ("State Street"), State Street provides certain administrative services to the Company. For such services, the Administrator pays State Street a portion of the fee the Administrator receives from the Fund.
D. Distribution and Shareholder Services Fees: Morgan Stanley Distribution, Inc. ("MSDI" or the "Distributor"), a wholly-owned subsidiary of the Adviser and an indirect subsidiary of Morgan Stanley, serves as the Company's Distributor of Fund shares pursuant to a Distribution Agreement. The Company has adopted a Shareholder Services Plan with respect to Class A shares pursuant to Rule 12b-1 under the Act. Under the Shareholder Services Plan, the Fund pays the Distributor a shareholder services fee, accrued daily and paid monthly, at an annual rate of 0.25% of the Fund's average daily net assets attributable to Class A shares.
The Company has adopted a Distribution and Shareholder Services Plan with respect to Class C shares pursuant to Rule 12b-1 under the Act. Under the Distribution and Shareholder Services Plan, the Fund pays the Distributor a distribution fee, accrued daily and paid monthly, at an annual rate of 0.75% and a shareholder services fee, accrued daily and paid monthly, at an annual rate of 0.25% of the Fund's average daily net assets attributable to Class C shares.
The distribution and shareholder services fees are used to support the expenses associated with servicing and maintaining accounts. The Distributor may compensate other parties for providing shareholder support services to investors who purchase Class A and Class C shares.
E. Dividend Disbursing and Transfer Agent: The Company's dividend disbursing and transfer agent is DST Asset Manager Solutions, Inc. ("DST"). Pursuant to a Transfer Agency Agreement, the Company pays DST a fee based on the number of classes, accounts and transactions relating to the Funds of the Company.
F. Custodian Fees: State Street (the "Custodian") also serves as Custodian for the Company in accordance with a Custodian
22
Morgan Stanley Institutional Fund, Inc.
Annual Report — December 31, 2018
Notes to Financial Statements (cont'd)
Agreement. The Custodian holds cash, securities and other assets of the Company as required by the Act. Custody fees are payable monthly based on assets held in custody, investment purchases and sales activity and account maintenance fees, plus reimbursement for certain out-of-pocket expenses.
G. Security Transactions and Transactions with Affiliates: For the year ended December 31, 2018, purchases and sales of investment securities for the Fund, other than long-term U.S. Government securities and short-term investments were approximately $1,704,000 and $2,050,000, respectively. There were no purchases and sales of long-term U.S. Government securities for the period ended December 31, 2018.
The Fund invests in the Institutional Class of the Morgan Stanley Institutional Liquidity Funds — Government Portfolio (the "Liquidity Funds"), an open-end management investment company managed by the Adviser. Advisory fees paid by the Fund are reduced by an amount equal to its pro-rata share of the advisory and administration fees paid by the Fund due to its investment in the Liquidity Funds. For the period ended December 31, 2018, advisory fees paid were reduced by approximately $1,000 relating to the Fund's investment in the Liquidity Funds.
A summary of the Fund's transactions in shares of affiliated investments during the year ended December 31, 2018 is as follows:
Affiliated
Investment
Company | | Value
December 31,
2017
(000) | | Purchases
at Cost
(000) | | Proceeds
from Sales
(000) | | Dividend
Income
(000) | |
Liquidity Funds | | $ | 592 | | | $ | 1,660 | | | $ | 1,433 | | | $ | 12 | | |
Affiliated
Investment
Company (cont'd) | | Realized
Gain (Loss)
(000) | | Change in
Unrealized
Appreciation
(Depreciation)
(000) | | Value
December 31,
2018
(000) | |
Liquidity Funds | | $ | — | | | $ | — | | | $ | 819 | | |
The Fund is permitted to purchase and sell securities ("cross-trade") from and to other Morgan Stanley Funds as well as other funds and client accounts for which the Adviser or an affiliate of the Adviser serves as investment adviser, pursuant to procedures approved by the Directors in compliance with Rule 17a-7 under the Act (the "Rule"). Each cross-trade is executed at the current market price in compliance with provisions of the Rule. For the period ended December 31, 2018, the Fund did not engage in any cross-trade transactions.
The Fund has an unfunded Deferred Compensation Plan (the "Compensation Plan"), which allows each independent Director to defer payment of all, or a portion, of the fees he or she receives for serving on the Board of Directors. Each eligible Director generally may elect to have the deferred amounts credited with a return equal to the total return on one or more of the Morgan Stanley funds that are offered as investment options under the Compensation Plan. Appreciation/depreciation and distributions received from these investments are recorded with an offsetting increase/decrease in the deferred compensation obligation and do not affect the NAV of the Fund.
H. Federal Income Taxes: It is the Fund's intention to continue to qualify as a regulated investment company and distribute all of its taxable and tax-exempt income. Accordingly, no provision for Federal income taxes is required in the financial statements.
The Fund may be subject to taxes imposed by countries in which it invests. Such taxes are generally based on income and/or capital gains earned or repatriated. Taxes are accrued based on net investment income, net realized gains and net unrealized appreciation as such income and/or gains are earned. Taxes may also be based on transactions in foreign currency and are accrued based on the value of investments denominated in such currency.
FASB ASC 740-10, "Income Taxes — Overall", sets forth a minimum threshold for financial statement recognition of the benefit of a tax position taken or expected to be taken in a tax return. Management has concluded there are no significant uncertain tax positions that would require recognition in the financial statements. If applicable, the Fund recognizes interest accrued related to unrecognized tax benefits in "Interest Expense" and penalties in "Other Expenses" in the Statement of Operations. The Fund files tax returns with the U.S. Internal Revenue Service, New York and various states. Generally, each of the tax years in the three-year period ended December 31, 2018 remains subject to examination by taxing authorities.
The tax character of distributions paid may differ from the character of distributions for GAAP purposes due to short-term capital gains being treated as ordinary income for tax
23
Morgan Stanley Institutional Fund, Inc.
Annual Report — December 31, 2018
Notes to Financial Statements (cont'd)
purposes. The tax character of distributions paid during fiscal years 2018 and 2017 was as follows:
2018
Distributions
Paid From: | | 2017
Distributions
Paid From: | |
Ordinary
Income
(000) | | Long-Term
Capital Gain
(000) | | Ordinary
Income
(000) | | Long-Term
Capital Gain
(000) | |
| $ | 35 | | | $ | 35 | | | $ | 243 | | | $ | 8 | | |
The amount and character of income and gains to be distributed are determined in accordance with income tax regulations which may differ from GAAP. These book/tax differences are either considered temporary or permanent in nature.
Temporary differences are primarily due to differing book and tax treatments in the timing of the recognition of gains (losses) on certain investment transactions and the timing of the deductibility of certain expenses.
Permanent differences, primarily due to a dividend redesignation and a net operating loss, resulted in the following reclassifications among the components of net assets at December 31, 2018:
Total
Accumulated
Loss
(000) | | Paid-in-
Capital
(000) | |
| $ | 7 | | | ($ | 7 | ) | |
At December 31, 2018, the Fund had no distributable earnings on a tax basis.
At December 31, 2018, the Fund had available unused short-term capital losses of approximately $64,000 that do not have an expiration date.
To the extent that capital loss carryforwards are used to offset any future capital gains realized, no capital gains tax liability will be incurred by the Fund for gains realized and not distributed. To the extent that capital gains are offset, such gains will not be distributed to the shareholders.
I. Credit Facility: The Company and other Morgan Stanley funds participated in a $150,000,000 committed, unsecured revolving line of credit facility (the "Facility") with State Street. This Facility is to be used for temporary emergency purposes or funding of shareholder redemption requests. The interest rate on borrowings is based on the federal funds rate or 1 month LIBOR rate plus a spread. The Facility also has a commitment fee of 0.25% per annum based on the unused portion of the Facility. During the year ended December 31,
2018, the Fund did not have any borrowings under the Facility.
J. Other: At December 31, 2018, the Fund did not have record owners of 10% or greater.
24
Morgan Stanley Institutional Fund, Inc.
Annual Report — December 31, 2018
Report of Independent Registered Public Accounting Firm
To the Shareholders and Board of Directors of
Morgan Stanley Institutional Fund, Inc. —
Emerging Markets Breakout Nations Portfolio
Opinion on the Financial Statements
We have audited the accompanying statement of assets and liabilities of Emerging Markets Breakout Nations Portfolio (the "Fund") (one of the funds constituting the Morgan Stanley Institutional Fund, Inc. (the "Company")), including the portfolio of investments, as of December 31, 2018, and the related statement of operations for the year then ended, the statements of changes in net assets for each of the two years in the period then ended, the financial highlights for each of the two years then ended and the period from December 15, 2016 (commencement of operations) through December 31, 2016 and the related notes (collectively referred to as the "financial statements"). In our opinion, the financial statements present fairly, in all material respects, the financial position of Emerging Markets Breakout Nations Portfolio (one of the funds constituting Morgan Stanley Institutional Fund, Inc.) at December 31, 2018, the results of its operations for the year then ended, the changes in its net assets for each of the two years in the period then ended and its financial highlights for each of the two years in the period then ended and the period from December 15, 2016 (commencement of operations) through December 31, 2016, in conformity with U.S. generally accepted accounting principles.
Basis for Opinion
These financial statements are the responsibility of the Company's management. Our responsibility is to express an opinion on the Fund's financial statements based on our audits. We are a public accounting firm registered with the Public Company Accounting Oversight Board (United States) ("PCAOB") and are required to be independent with respect to the Company in accordance with the U.S. federal securities law and the applicable rules and regulations of the Securities and Exchange Commission and the PCAOB.
We conducted our audits in accordance with the standards of the PCAOB. Those standards require that we plan and perform the audit to obtain reasonable assurance about whether the financial statements are free of material misstatement, whether due to error or fraud. The Company is not required to have, nor were we engaged to perform, an audit of the Company's internal control over financial reporting. As part of our audits, we are required to obtain an understanding of internal control over financial reporting, but not for the purpose of expressing an opinion on the effectiveness of the Company's internal control over financial reporting. Accordingly, we express no such opinion.
Our audits included performing procedures to assess the risks of material misstatement of the financial statements, whether due to error or fraud, and performing procedures that respond to those risks. Such procedures included examining, on a test basis, evidence regarding the amounts and disclosures in the financial statements. Our procedures included confirmation of securities owned as of December 31, 2018 by correspondence with the custodian and others or by other appropriate auditing procedures where replies from others were not received. Our audits also included evaluating the accounting principles used and significant estimates made by management, as well as evaluating the overall presentation of the financial statements. We believe that our audits provide a reasonable basis for our opinion.

We have served as the auditor of one or more Morgan Stanley investment companies since 2000.
Boston, Massachusetts
February 26, 2019
25
Morgan Stanley Institutional Fund, Inc.
Annual Report — December 31, 2018
Federal Tax Notice (unaudited)
For federal income tax purposes, the following information is furnished with respect to the distributions paid by the Fund during its taxable year ended December 31, 2018. For corporate shareholders 0.1% of the dividends qualified for the dividends received deduction.
The Fund designated and paid approximately $35,000 as a long-term capital gain distribution.
For federal income tax purposes, the following information is furnished with respect to the Fund's earnings for its taxable year ended December 31, 2018. When distributed, certain earnings may be subject to a maximum tax rate of 15% as provided for by the Jobs and Growth Tax Relief Reconciliation Act of 2003. The Fund designated up to a maximum of approximately $9,000 as taxable at this lower rate.
The Fund intends to pass through foreign tax credits of approximately $7,000 and has derived net income from sources within foreign countries amounting to approximately $83,000.
In January, the Fund provides tax information to shareholders for the preceding calendar year.
26
Morgan Stanley Institutional Fund, Inc.
Annual Report — December 31, 2018
Privacy Notice (unaudited)
MORGAN STANLEY INVESTMENT MANAGEMENT INC.
AN IMPORTANT NOTICE CONCERNING OUR U.S. PRIVACY POLICY
We are required by federal law to provide you with a copy of our privacy policy annually. This policy applies to current and former individual investors in funds managed or sponsored by Morgan Stanley Investment Management Inc. ("MSIM") as well as current and former individual clients of MSIM. This policy is not applicable to partnerships, corporations, trusts or other non-individual clients or investors. Please note that we may amend this policy at any time, and will inform you of any changes as required by law.
WE RESPECT YOUR PRIVACY
We appreciate that you have provided us with your personal financial information. We strive to maintain the privacy of such information while we help you achieve your financial objectives. This Notice describes what non-public personal information we collect about you, why we collect it, when we may share it with others and how certain others may use it. It discusses the steps you may take to limit our sharing of certain information about you to affiliated companies in the Morgan Stanley family of companies ("other Morgan Stanley companies"). It also discloses how you may limit use of certain shared information for marketing purposes by other Morgan Stanley branded companies. Throughout this policy, we refer to the non-public information that personally identifies you or your accounts as "personal information.''
1. WHAT PERSONAL INFORMATION DO WE COLLECT ABOUT YOU?
We obtain personal information from applications and other forms you submit to us, from your dealings with us, from consumer reporting agencies, from our Web sites and from third parties and other sources.
For example:
• We may collect information such as your name, address, e-mail address, telephone/fax numbers, assets, income and investment objectives through subscription documents, applications and other forms you submit to us.
• We may obtain information about account balances, your use of account(s) and the types of products and services you prefer to receive from us through your dealings and transactions with us and other sources.
• We may obtain information about your creditworthiness and credit history from consumer reporting agencies.
• We may collect background information from and through third-party vendors to verify representations you have made and to comply with various regulatory requirements.
• If you interact with us through our public and private Web sites, we may collect information that you provide directly through online communications (such as an e-mail address). We may also collect information about your Internet service provider, your domain name, your computer's operating system and Web browser, your use of our Web sites and your product and service preferences, through the use of "cookies." Please consult the Terms of Use of these sites for more details.
2. WHEN DO WE DISCLOSE PERSONAL INFORMATION WE COLLECT ABOUT YOU?
We may disclose personal information we collect about you to other Morgan Stanley companies and to non-affiliated third parties.
a. Information We Disclose to Other Morgan Stanley Companies.
We may disclose personal information to other Morgan Stanley companies for a variety of reasons, including to manage your account(s) effectively, to service and process your transactions, to let you know about products and services offered by us and other Morgan Stanley companies, to manage our business, and as otherwise required or permitted by law. Offers for products and services from other Morgan Stanley companies are developed under conditions designed to safeguard your personal information.
27
Morgan Stanley Institutional Fund, Inc.
Annual Report — December 31, 2018
Privacy Notice (unaudited) (cont'd)
b. Information We Disclose to Non-affiliated Third Parties.
We do not disclose personal information that we collect about you to non-affiliated third parties except to those who provide marketing services on our behalf, to financial institutions with whom we have joint marketing agreements, and as otherwise required or permitted by law. For example, we may disclose personal information to non-affiliated third parties for servicing and processing transactions, to offer our own products and services, to protect against fraud, for institutional risk control, to respond to judicial process or to perform services on our behalf. When we share personal information with a non-affiliated third party, they are required to limit their use of personal information to the particular purpose for which it was shared and they are not allowed to share personal information with others except to fulfill that limited purpose or as may be permitted or required by law.
3. HOW DO WE PROTECT THE SECURITY AND CONFIDENTIALITY OF PERSONAL INFORMATION WE COLLECT ABOUT YOU?
We maintain physical, electronic and procedural security measures to help safeguard the personal information we collect about you. We have internal policies governing the proper handling of client information. Third parties that provide support or marketing services on our behalf may also receive personal information, and we require them to adhere to confidentiality standards with respect to such information.
4. HOW CAN YOU LIMIT THE SHARING OF CERTAIN TYPES OF PERSONAL INFORMATION WITH OTHER MORGAN STANLEY COMPANIES?
We offer you choices as to whether we share with other Morgan Stanley companies the personal information that was collected to determine your eligibility for products and services you request ("eligibility information"). Eligibility information does not include your identification information or personal information pertaining to our transactions or experiences with you. Please note that, even if you direct us not to share eligibility information with other Morgan Stanley companies ("opt-out"), we may still share personal information, including eligibility information, with those companies in circumstances excluded from the opt-out under applicable law, such as to process transactions or to service your account.
5. HOW CAN YOU LIMIT THE USE OF CERTAIN TYPES OF PERSONAL INFORMATION BY OTHER MORGAN STANLEY COMPANIES FOR MARKETING?
By following the opt-out instructions in Section 6 below, you may limit other Morgan Stanley branded companies from marketing their products or services to you based on personal information we disclose to them. This information may include, for example, your income and account history with us. Please note that, even if you choose to limit Other Morgan Stanley Companies from using personal information about you that we may share with them for marketing their products and services to you, Other Morgan Stanley Companies may use your personal information that they obtain from us to market to you in circumstances permitted by law, such as if the Other Morgan Stanley Company has its own relationship with you.
6. HOW CAN YOU SEND US AN OPT-OUT INSTRUCTION?
If you wish to limit our sharing of eligibility information about you with other Morgan Stanley companies or other Morgan Stanley companies' use of personal information for marketing purposes, as described in this notice, you may do so by:
• Calling us at (800) 548-7786
Monday–Friday between 8a.m. and 6p.m.(EST)
• Writing to us at the following address:
DST Asset Manager Solutions, Inc.
c/o Privacy Coordinator
P.O. Box 219804
Kansas City, Missouri 64121
28
Morgan Stanley Institutional Fund, Inc.
Annual Report — December 31, 2018
Privacy Notice (unaudited) (cont'd)
Your written request should include your name, address, telephone number and account number(s) to which the opt-out applies and whether you are opting out with respect to sharing of eligibility information (Section 4 above), or if information used for Marketing (Section 5 above) or both. Written opt-out requests should not be sent with any other correspondence. In order to process your request, we require that the request be provided by you directly and not through a third party.
Your opt-out preference will remain in effect with respect to this policy (as it may be amended) until you notify us otherwise. If you have a joint account, your direction for us not to share this information with other Morgan Stanley companies and for those other Morgan Stanley companies not to use your personal information for marketing will be applied to all account holders on that account. Please understand that if you limit our sharing or our affiliated companies' use of personal information, you and any joint account holder(s) may not receive information about Morgan Stanley products and services, including products or services that could help you manage your financial resources and achieve your investment objectives.
7. WHAT IF AN AFFILIATED COMPANY BECOMES A NON-AFFILIATED THIRD PARTY?
If, at any time in the future, an affiliated company becomes a non-affiliated third party, further disclosures of personal information made to the former affiliated company will be limited to those described in Section 2(b) above relating to non-affiliated third parties. If you elected under Section 6 to limit disclosures we make to affiliated companies, or use of personal information by affiliated companies, your election will not apply to use by any former affiliated company of your personal information in their possession once it becomes a non-affiliated third party.
SPECIAL NOTICE TO RESIDENTS OF VERMONT
The following section supplements our policy with respect to our individual clients who have a Vermont address and supersedes anything to the contrary in the above policy with respect to those clients only.
The state of Vermont requires financial institutions to obtain your consent prior to sharing personal information that they collect about you with affiliated companies and non-affiliated third parties other than in certain limited circumstances. Except as permitted by law, we will not share personal information we collect about you with non-affiliated third parties or other Morgan Stanley companies unless you provide us with your written consent to share such information ("opt-in").
If you wish to receive offers for investment products and services offered by or through other Morgan Stanley companies, please notify us in writing at the following address:
DST Asset Manager Solutions, Inc.
c/o Privacy Coordinator
P.O. Box 219804
Kansas City, Missouri 64121
Your authorization should include your name, address, telephone number and account number(s) to which the opt-in applies and should not be sent with any other correspondence. In order to process your authorization, we require that the authorization be provided by you directly and not through a third party.
SPECIAL NOTICE TO RESIDENTS OF CALIFORNIA
The following section supplements our policy with respect to our individual clients who have a California address and supersedes anything to the contrary in the above policy with respect to those clients only.
In response to a California law, if your account has a California home address, your personal information will not be disclosed to non-affiliated third parties except as permitted by applicable California law, and we will limit sharing such information with our affiliates to comply with California privacy laws that apply to us.
29
Morgan Stanley Institutional Fund, Inc.
Annual Report — December 31, 2018
Director and Officer Information (unaudited)
Independent Directors:
Name, Age and Address of
Independent Director | | Position(s)
Held with
Registrant | | Length of Time
Served* | | Principal Occupation(s) During Past 5 Years
and Other Relevant Professional Experience | | Number of
Portfolios in
Fund Complex
Overseen by
Independent
Director** | | Other Directorships
Held by Independent
Director*** | |
Frank L. Bowman (74)
c/o Perkins Coie LLP
Counsel to the Independent
Directors
30 Rockefeller Plaza
New York, NY 10112 | | Director | | Since
August
2006 | | President, Strategic Decisions, LLC (consulting) (since February 2009); Director or Trustee of various Morgan Stanley Funds (since August 2006); Chairperson of the Compliance and Insurance Committee (since October 2015); formerly, Chairperson of the Insurance Sub-Committee of the Compliance and Insurance Committee (2007-2015); served as President and Chief Executive Officer of the Nuclear Energy Institute (policy organization) (February 2005-November 2008); retired as Admiral, U.S. Navy after serving over 38 years on active duty including 8 years as Director of the Naval Nuclear Propulsion Program in the Department of the Navy and the U.S. Department of Energy (1996-2004); served as Chief of Naval Personnel (July 1994-September 1996) and on the Joint Staff as Director of Political Military Affairs (June 1992-July 1994); knighted as Honorary Knight Commander of the Most Excellent Order of the British Empire; awarded the Officier de l'Orde National du Mérite by the French Government; elected to the National Academy of Engineering (2009). | | | 82 | | | Director of BP p.l.c.; Director of Naval and Nuclear Technologies LLP; Director Emeritus of the Armed Services YMCA; Member of the National Security Advisory Council of the Center for U.S. Global Engagement and a member of the CNA Military Advisory Board; Trustee of Fairhaven United Methodist Church; Member of the Board of Advisors of the Dolphin Scholarship Foundation; and Director of other various non-profit organizations. | |
Kathleen A. Dennis (65)
c/o Perkins Coie LLP
Counsel to the Independent Directors
30 Rockefeller Plaza
New York, NY 10112 | | Director | | Since
August
2006 | | President, Cedarwood Associates (mutual fund and investment management consulting) (since July 2006); Chairperson of the Liquidity and Alternatives Sub-Committee of the Investment Committee (since October 2006) and Director or Trustee of various Morgan Stanley Funds (since August 2006); formerly, Senior Managing Director of Victory Capital Management (1993-2006). | | | 82 | | | Director of various non-profit organizations. | |
Nancy C. Everett (63)
c/o Perkins Coie LLP
Counsel to the Independent Directors
30 Rockefeller Plaza
New York, NY 10112 | | Director | | Since
January
2015 | | Chief Executive Officer, Virginia Commonwealth University Investment Company (since November 2015); Owner, OBIR, LLC (institutional investment management consulting) (since June 2014); formerly, Managing Director, BlackRock Inc. (February 2011-December 2013); and Chief Executive Officer, General Motors Asset Management (a/k/a Promark Global Advisors, Inc.) (June 2005-May 2010). | | | 83 | | | Formerly, Member of Virginia Commonwealth University School of Business Foundation (2005-2016); Member of Virginia Commonwealth University Board of Visitors (2013-2015); Member of Committee on Directors for Emerging Markets Growth Fund, Inc. (2007-2010); Chairperson of Performance Equity Management, LLC (2006-2010); and Chairperson, GMAM Absolute Return Strategies Fund, LLC (2006-2010). | |
30
Morgan Stanley Institutional Fund, Inc.
Annual Report — December 31, 2018
Director and Officer Information (unaudited) (cont'd)
Independent Directors: (cont'd)
Name, Age and Address of
Independent Director | | Position(s)
Held with
Registrant | | Length of Time
Served* | | Principal Occupation(s) During Past 5 Years
and Other Relevant Professional Experience | | Number of
Portfolios in
Fund Complex
Overseen by
Independent
Director** | | Other Directorships
Held by Independent
Director*** | |
Jakki L. Haussler (61)
c/o Perkins Coie LLP
Counsel to the Independent Directors
30 Rockefeller Plaza
New York, NY 10112 | | Director | | Since
January
2015 | | Chairman and Chief Executive Officer, Opus Capital Group (since January 1996); formerly, Director, Capvest Venture Fund, LP (May 2000-December 2011); Partner, Adena Ventures, LP (July 1999-December 2010); Director, The Victory Funds (February 2005-July 2008). | | | 83 | | | Director of Service Corporation International and Member, Audit Committee and Investment Committee; Director of Cincinnati Bell Inc. and Member, Audit Committee and Governance and Nominating Committee; Chairman of Northern Kentucky University Member Investment Committee; Member of Chase College of Law Transactional Law Practice Center Board of Advisors; Director of Best Transport; Director of Chase College of Law Board of Visitors; formerly, Member, University of Cincinnati Foundation Investment Committee; Member, Miami University Board of Visitors (2008-2011); Trustee of Victory Funds (2005-2008) and Chairman, Investment Committee (2007-2008) and Member, Service Provider Committee (2005-2008). | |
Dr. Manuel H. Johnson (69)
c/o Johnson Smick
International, Inc.
220 I Street, NE — Suite 200
Washington, D.C. 20002 | | Director | | Since
July
1991 | | Senior Partner, Johnson Smick International, Inc. (consulting firm); Chairperson of the Investment Committee (since October 2006) and Director or Trustee of various Morgan Stanley Funds (since July 1991); Co-Chairman and a founder of the Group of Seven Council (G7C) (international economic commission); formerly, Chairperson of the Audit Committee (July 1991-September 2006), Vice Chairman of the Board of Governors of the Federal Reserve System and Assistant Secretary of the U.S. Treasury. | | | 82 | | | Director of NVR, Inc. (home construction). | |
Joseph J. Kearns (76)
c/o Perkins Coie LLP
Counsel to the Independent Directors
30 Rockefeller Plaza
New York, NY 10112 | | Director | | Since
August
1994 | | Senior Adviser, Kearns & Associates LLC (investment consulting); Chairperson of the Audit Committee (since October 2006) and Director or Trustee of various Morgan Stanley Funds (since August 1994); formerly, Deputy Chairperson of the Audit Committee (July 2003-September 2006) and Chairperson of the Audit Committee of various Morgan Stanley Funds (since August 1994); CFO of the J. Paul Getty Trust. | | | 83 | | | Prior to August 10, 2016, Director of Electro Rent Corporation (equipment leasing); Prior to December 31, 2013, Director of The Ford Family Foundation. | |
31
Morgan Stanley Institutional Fund, Inc.
Annual Report — December 31, 2018
Director and Officer Information (unaudited) (cont'd)
Independent Directors: (cont'd)
Name, Age and Address of
Independent Director | | Position(s)
Held with
Registrant | | Length of Time
Served* | | Principal Occupation(s) During Past 5 Years
and Other Relevant Professional Experience | | Number of
Portfolios in
Fund Complex
Overseen by
Independent
Director** | | Other Directorships
Held by Independent
Director*** | |
Michael F. Klein (60)
c/o Perkins Coie LLP
Counsel to the Independent Directors
30 Rockefeller Plaza
New York, NY 10112 | | Director | | Since
August
2006 | | Managing Director, Aetos Alternatives Management, LP (since March 2000); Co-President, Aetos Alternatives Management, LP (since January 2004) and Co-Chief Executive Officer of Aetos Alternatives Management, LP (since August 2013); Chairperson of the Fixed Income Sub-Committee of the Investment Committee (since October 2006) and Director or Trustee of various Morgan Stanley Funds (since August 2006); formerly, Managing Director, Morgan Stanley & Co. Inc. and Morgan Stanley Dean Witter Investment Management and President, various Morgan Stanley Funds (June 1998-March 2000); Principal, Morgan Stanley & Co. Inc. and Morgan Stanley Dean Witter Investment Management (August 1997-December 1999). | | | 82 | | | Director of certain investment funds managed or sponsored by Aetos Alternatives Management, LP; Director of Sanitized AG and Sanitized Marketing AG (specialty chemicals). | |
Patricia Maleski (58)
c/o Perkins Coie LLP
Counsel to the Independent Directors
30 Rockefeller Plaza
New York, NY 10112 | | Director | | Since
January
2017 | | Managing Director, JPMorgan Asset Management (2004-2016); Oversight and Control Head of Fiduciary and Conflicts of Interest Program (2015-2016); Chief Control Officer-Global Asset Management (2013-2015); President, JPMorgan Funds (2010-2013); Chief Administrative Officer (2004-2013); various other positions including Treasurer and Board Liaison (since 2001). | | | 83 | | | None. | |
Michael E. Nugent (82)
522 Fifth Avenue
New York, NY 10036 | | Chair of the Board and Director | | Chair of the Boards since July 2006 and Director since July 1991 | | Chair of the Boards of various Morgan Stanley Funds (since July 2006); Chairperson of the Closed-End Fund Committee (since June 2012) Governance Committee (since January 2019) and Director or Trustee of various Morgan Stanley Funds (since July 1991); formerly, Chairperson of the Insurance Committee (until July 2006); General Partner, Triumph Capital, L.P. (private investment partnership) (1988-2013). | | | 82 | | | None. | |
W. Allen Reed (71)
c/o Perkins Coie LLP
Counsel to the Independent Directors
30 Rockefeller Plaza
New York, NY 10112 | | Director | | Since
August
2006 | | Chairperson of the Equity Sub-Committee of the Investment Committee (since October 2006) and Director or Trustee of various Morgan Stanley Funds (since August 2006); formerly, President and CEO of General Motors Asset Management; Chairman and Chief Executive Officer of the GM Trust Bank and Corporate Vice President of General Motors Corporation (August 1994-December 2005). | | | 82 | | | Director of Legg Mason, Inc.; formerly, Director of the Auburn University Foundation (2010-2015). | |
Fergus Reid (86)****
c/o Joe Pietryka, Inc.
85 Charles Colman Blvd.
Pawling, NY 12564 | | Director | | Since
June
1992 | | Chairman, Joe Pietryka, Inc.; Chairperson of the Governance Committee and Director or Trustee of various Morgan Stanley Funds (since June 1992). | | | 83 | | | Formerly, Trustee and Director of certain investment companies in the JP Morgan Fund Complex managed by JP Morgan Investment Management Inc. (1987-2012). | |
* This is the earliest date the Director began serving the Morgan Stanley Funds. Each Director serves an indefinite term, until his or her successor is elected.
** The Fund Complex includes (as of December 31, 2018) all open-end and closed-end funds (including all of their portfolios) advised by Morgan Stanley Investment Management Inc. (the "Adviser") and any funds that have an adviser that is an affiliated person of the Adviser (including, but not limited to, Morgan Stanley AIP GP LP).
*** This includes any directorships at public companies and registered investment companies held by the Director at any time during the past five years.
**** Effective date of retirement is December 31, 2018.
32
Morgan Stanley Institutional Fund, Inc.
Annual Report — December 31, 2018
Director and Officer Information (unaudited) (cont'd)
Executive Officers:
Name, Age and Address of Executive Officer | | Position(s) Held
with
Registrant | | Length of Time
Served* | | Principal Occupation(s) During Past 5 Years | |
John H. Gernon (55)
522 Fifth Avenue
New York, NY 10036 | | President and Principal Executive Officer | | Since
September
2013 | | President and Principal Executive Officer of the Equity and Fixed Income Funds and the Morgan Stanley AIP Funds (since September 2013) and the Liquidity Funds and various money market funds (since May 2014) in the Fund Complex; Managing Director of the Adviser; Head of Product (since 2006). | |
Timothy J. Knierim (59)
522 Fifth Avenue
New York, NY 10036 | | Chief Compliance Officer | | Since
December
2016 | | Managing Director of the Adviser and various entities affiliated with the Adviser; Chief Compliance Officer of various Morgan Stanley Funds and the Adviser (since December 2016) and Chief Compliance Officer of Morgan Stanley AIP GP LP (since 2014). Formerly, Managing Director and Deputy Chief Compliance Officer of the Adviser (2014-2016); and formerly, Chief Compliance Officer of Prudential Investment Management, Inc. (2007-2014). | |
Francis J. Smith (53)
522 Fifth Avenue
New York, NY 10036 | | Treasurer and Principal Financial Officer | | Treasurer since July 2003 and Principal Financial Officer since September 2002 | | Managing Director of the Adviser and various entities affiliated with the Adviser; Treasurer (since July 2003) and Principal Financial Officer of various Morgan Stanley Funds (since September 2002). | |
Mary E. Mullin (51)
522 Fifth Avenue
New York, NY 10036 | | Secretary | | Since
June
1999 | | Managing Director of the Adviser; Secretary of various Morgan Stanley Funds (since June 1999). | |
Michael J. Key (39)
522 Fifth Avenue
New York, NY 10036 | | Vice President | | Since
June
2017 | | Vice President of the Equity and Fixed Income Funds, Liquidity Funds, various money market funds and the Morgan Stanley AIP Funds in the Fund Complex (since June 2017); Executive Director of the Adviser; Head of Product Development for Equity and Fixed Income Funds (since August 2013). | |
* This is the earliest date the officer began serving the Morgan Stanley Funds. Each officer serves a one-year term, until his or her successor is elected and qualifies.
33
Morgan Stanley Institutional Fund, Inc.
Annual Report — December 31, 2018
Adviser and Administrator
Morgan Stanley Investment Management Inc.
522 Fifth Avenue
New York, New York 10036
Distributor
Morgan Stanley Distribution, Inc.
522 Fifth Avenue
New York, New York 10036
Dividend Disbursing and Transfer Agent
DST Asset Manager Solutions, Inc.
2000 Crown Colony Drive
Quincy, Massachusetts 02169
Custodian
State Street Bank and Trust Company
One Lincoln Street
Boston, Massachusetts 02111
Legal Counsel
Dechert LLP
1095 Avenue of the Americas
New York, New York 10036
Counsel to the Independent Directors
Perkins Coie LLP
30 Rockefeller Plaza
New York, New York 10112
Independent Registered Public Accounting Firm
Ernst & Young LLP
200 Clarendon Street
Boston, Massachusetts 02116
Reporting to Shareholders
Each Morgan Stanley fund provides a complete schedule of portfolio holdings in its semi-annual and the annual reports within 60 days of the end of the fund's second and fourth fiscal quarters. The semi-annual and annual reports are filed electronically with the Securities and Exchange Commission ("SEC") on Form N-CSRS and Form N-CSR, respectively. Morgan Stanley also delivers the semi-annual and annual reports to fund shareholders and makes these reports available on its public website, www.morganstanley.com/im/shareholderreports. Each Morgan Stanley fund also files a complete schedule of portfolio holdings with the SEC for the fund's first and third fiscal quarters on Form N-Q. Morgan Stanley does not deliver the reports for the first and third fiscal quarters to shareholders, nor are the reports posted to the Morgan Stanley public website. You may, however, obtain the Form N-Q filings (as well as the Form N-CSR and N-CSRS filings) by accessing the SEC's website, www.sec.gov. You can also request copies of these materials, upon payment of a duplicating fee, by electronic request at the SEC's email address (publicinfo@sec.gov).
Proxy Voting Policies and Procedures and Proxy Voting Record
You may obtain a copy of the Company's Proxy Voting Policy and Procedures and information regarding how the Company voted proxies relating to portfolio securities during the most recent twelve-month period ended June 30, without charge, upon request, by calling toll free 1 (800) 548-7786 or by visiting our website at www.morganstanley.com/im/shareholderreports. This information is also available on the SEC's website at www.sec.gov.
This report is authorized for distribution only when preceded or accompanied by a prospectus or summary prospectus of the applicable Fund of Morgan Stanley Institutional Fund, Inc., which describes in detail the Fund's investment policies, risks, fees and expenses. Please read the prospectus carefully before you invest or send money. For additional information, including information regarding the investments comprising the Fund, please visit our website at www.morganstanley.com/im/shareholderreports or call toll free 1 (800) 548-7786.
34
Printed in U.S.A.
This Report has been prepared for shareholders and may be distributed to others only if preceded or accompanied by a current prospectus.
Morgan Stanley Investment Management Inc.
522 Fifth Avenue
New York, New York 10036
© 2019 Morgan Stanley. Morgan Stanley Distribution, Inc.

IFIEMBONANN
2398596 EXP. 02.29.20

Morgan Stanley Institutional Fund, Inc.
Emerging Markets Fixed Income Opportunities Portfolio
Annual Report
December 31, 2018
Beginning on January 1, 2021, as permitted by regulations adopted by the Securities and Exchange Commission ("SEC"), paper copies of the Fund's Annual and Semi-Annual Reports to Shareholders ("Shareholder Reports") will no longer be sent by mail, unless you specifically request paper copies of the Shareholder Reports from the Fund or from your financial intermediary, such as a broker-dealer or a bank. Instead, the Shareholder Reports will be made available on the Fund's website, https://www.morganstanley.com/im/shareholderreports and you will be notified by mail each time a Shareholder Report is posted and provided with a website link to access the Shareholder Report. If you already elected to receive Shareholder Reports electronically, you will not be affected by this change and you need not take any action. You may elect to receive Shareholder Reports and other communications from the Fund electronically anytime by contacting your financial intermediary or, if you are a direct investor, please follow the instructions on the envelope.
Beginning on January 1, 2019, you may elect to receive all future Shareholder Reports in paper free of charge. If you invest through a financial intermediary, you can contact your financial intermediary to request that you continue to receive paper copies of your Shareholder Reports. If you invest directly with the Fund, please follow the instructions on the envelope to let the Fund know you wish to continue receiving paper copies of your Shareholder Reports. Your election to receive Shareholder Reports in paper will apply to all funds held in your account if you invest through your financial intermediary or all funds held with the fund complex if you invest directly with a fund.

Morgan Stanley Institutional Fund, Inc.
Annual Report — December 31, 2018
Shareholders' Letter | | | 2 | | |
Expense Example | | | 3 | | |
Investment Overview | | | 4 | | |
Portfolio of Investments | | | 7 | | |
Statement of Assets and Liabilities | | | 13 | | |
Statement of Operations | | | 15 | | |
Statements of Changes in Net Assets | | | 16 | | |
Financial Highlights | | | 18 | | |
Notes to Financial Statements | | | 23 | | |
Report of Independent Registered Public Accounting Firm | | | 32 | | |
Privacy Notice | | | 33 | | |
Director and Officer Information | | | 36 | | |
This report is authorized for distribution only when preceded or accompanied by a prospectus or summary prospectus of the applicable Fund of Morgan Stanley Institutional Fund, Inc. To receive a prospectus and/or statement of additional information (SAI), which contains more complete information such as investment objectives, charges, expenses, policies for voting proxies, risk considerations and describes in detail each of the Fund's investment policies to the prospective investor, please call toll free 1 (800) 548-7786. Please read the prospectuses carefully before you invest or send money.
Additionally, you can access information about the Fund including performance, characteristics and investment team commentary, through Morgan Stanley Investment Management's website: www.morganstanley.com/im/shareholderreports.
Market forecasts provided in this report may not necessarily come to pass. There is no guarantee that any sectors mentioned will continue to perform as discussed herein or that securities in such sectors will be held by the Fund in the future. There is no assurance that a fund will achieve its investment objective. Funds are subject to market risk, which is the possibility that market values of securities owned by the Fund will decline and, therefore, the value of the Fund's shares may be less than what you paid for them. Accordingly, you can lose money investing in this Fund. Please see the prospectus for more complete information on investment risks.
1
Morgan Stanley Institutional Fund, Inc.
Annual Report — December 31, 2018
Shareholders' Letter (unaudited)
Dear Shareholders,
We are pleased to provide this Annual report, in which you will learn how your investment in Emerging Markets Fixed Income Opportunities Portfolio (the "Fund") performed during the latest twelve-month period.
Morgan Stanley Investment Management is a client-centric, investor-led organization. Our global presence, intellectual capital, and breadth of products and services enable us to partner with investors to meet the evolving challenges of today's financial markets. We aim to deliver superior investment service and to empower our clients to make the informed decisions that help them reach their investment goals.
As always, we thank you for selecting Morgan Stanley Investment Management, and look forward to working with you in the months and years ahead.
Sincerely,

John H. Gernon
President and Principal Executive Officer
January 2019
2
Morgan Stanley Institutional Fund, Inc.
Annual Report — December 31, 2018
Expense Example (unaudited)
Emerging Markets Fixed Income Opportunities Portfolio
As a shareholder of the Fund, you incur two types of costs: (1) transactional costs, including redemption fees; and (2) ongoing costs, which may include advisory fees, administration fees, distribution and shareholder services fees and other Fund expenses. This example is intended to help you understand your ongoing costs (in dollars) of investing in the Fund and to compare these costs with the ongoing costs of investing in other mutual funds.
This example is based on an investment of $1,000 invested at the beginning of the six-month period ended December 31, 2018 and held for the entire six-month period.
Actual Expenses
The table below provides information about actual account values and actual expenses. You may use the information in this table, together with the amount you invested, to estimate the expenses that you paid over the period. Simply divide your account value by $1,000 (for example, an $8,600 account value divided by $1,000 = 8.6), then multiply the result by the number in the table under the heading entitled "Actual Expenses Paid During Period" to estimate the expenses you paid on your account during this period.
Hypothetical Example for Comparison Purposes
The table below provides information about hypothetical account values and hypothetical expenses based on the Fund's actual expense ratio and an assumed rate of return of 5% per year before expenses, which is not the Fund's actual return. The hypothetical account values and expenses may not be used to estimate the actual ending account balance or expenses you paid for the period. You may use this information to compare the ongoing costs of investing in the Fund and other funds. To do so, compare this 5% hypothetical example with the 5% hypothetical examples that appear in the shareholder reports of the other funds.
Please note that the expenses shown in the table are meant to highlight your ongoing costs only and do not reflect any transactional costs, such as sales charges (loads) and redemption fees. Therefore, the information for each class in the table is useful in comparing ongoing costs only, and will not help you determine the relative total costs of owning different funds. In addition, if these transactional costs were included, your costs would have been higher.
| | | Beginning
Account
Value
7/1/18 | | Actual Ending
Account
Value
12/31/18 | | Hypothetical
Ending Account
Value | | Actual
Expenses
Paid
During
Period* | | Hypothetical
Expenses Paid
During Period* | | Net
Expense
Ratio
During
Period** | |
Emerging Markets Fixed Income Opportunities Portfolio Class I | | $ | 1,000.00 | | | $ | 1,002.00 | | | $ | 1,020.97 | | | $ | 4.24 | | | $ | 4.28 | | | | 0.84 | % | |
Emerging Markets Fixed Income Opportunities Portfolio Class A | | | 1,000.00 | | | | 999.10 | | | | 1,019.21 | | | | 6.00 | | | | 6.06 | | | | 1.19 | | |
Emerging Markets Fixed Income Opportunities Portfolio Class L | | | 1,000.00 | | | | 998.50 | | | | 1,017.95 | | | | 7.25 | | | | 7.32 | | | | 1.44 | | |
Emerging Markets Fixed Income Opportunities Portfolio Class C | | | 1,000.00 | | | | 995.80 | | | | 1,015.43 | | | | 9.76 | | | | 9.86 | | | | 1.94 | | |
Emerging Markets Fixed Income Opportunities Portfolio Class IS | | | 1,000.00 | | | | 1,001.00 | | | | 1,021.12 | | | | 4.09 | | | | 4.13 | | | | 0.81 | | |
* Expenses are calculated using each Fund Class' annualized net expense ratio (as disclosed), multiplied by the average account value over the period and multiplied by 184/365 (to reflect the most recent one-half year period).
** Annualized.
3
Morgan Stanley Institutional Fund, Inc.
Annual Report — December 31, 2018
Investment Overview (unaudited)
Emerging Markets Fixed Income Opportunities Portfolio
The Fund seeks high total return.
Performance
For the fiscal year ended December 31, 2018, the Fund's Class I shares had a total return based on net asset value and reinvestment of distributions per share of –6.93%, net of fees. The Fund's Class I shares underperformed the Fund's blended benchmark, the Emerging Markets Fixed Income Blend Index (the "Index"), which for the year ended December 31, 2018 returned –4.08% and was composed of one-third J.P. Morgan Emerging Markets Bond Global Index (returned –4.61%), one-third J.P. Morgan GBI-EM Global Diversified Index (returned –6.21%) and one-third J.P. Morgan CEMBI Broad Diversified Index (returned –1.65%).
Factors Affecting Performance
• Emerging market (EM) fixed income debt returned –4.08% in 2018, as measured by the Emerging Markets Fixed Income Blend Index. Dollar-denominated sovereign debt underperformed dollar-denominated corporate debt during the year, while EM currencies weakened –9.39% versus the U.S. dollar, and domestic bonds returned 3.18% in local terms (as measured by the J.P. Morgan GBI-EM Diversified Bond Index).(i)
• Emerging market fixed income assets experienced a challenging year of performance following two consecutive years of high-single to double-digit returns. After a strong economic start, the year ended with waning optimism for global growth, which was punctuated by a sell-off in equity markets. Market sentiment soured on a combination of global trade disputes and political tensions between the U.S. and a number of countries including the China, the European Union, North Korea, Russia, Iran, Mexico and Turkey. The resulting market action was exacerbated by a stronger U.S. dollar and tighter global liquidity (the raising of policy rates and reduction of Federal Reserve balance sheet assets). This forced the market to focus on countries with external vulnerabilities, specifically those with twin deficits (current account and fiscal), including Turkey, Argentina and South Africa. In addition to the change in market sentiment, many of the
underperforming countries were also facing their own idiosyncratic issues, leaving them vulnerable to shifts in risk appetite.
• For the year, domestic debt positioning in Egypt, Brazil, Thailand and Malaysia was beneficial to performance. Dollar-denominated sovereign exposure in Bahrain, Mongolia and Pakistan also contributed to returns, as did dollar-denominated corporate debt in Tanzania and the Philippines.
• In a negative market, exposure across dollar-denominated corporates and sovereigns detracted from performance, as did exposure to EM domestic debt. Holdings in Argentina, Mexico, Russia, Indonesia, Venezuela and South Africa were the largest detractors from performance. Currency and interest rate derivatives had a negligible impact on performance in the period.
Management Strategies
• After a challenging year for EM fixed income, we hold a constructive outlook for 2019, driven by attractive valuations, a potentially benign global backdrop of moderate growth/subdued inflation and a Federal Reserve that is likely approaching the end of its tightening cycle. We believe these factors and growing twin deficits in the U.S. limit the scope for material U.S. dollar appreciation, which would be beneficial to EM borrowers. Our historical analysis indicates that EM fixed income tends to outperform when EM economies are closing negative output gaps and converging toward potential growth, as they are currently doing. Further support for local currency strategies should come from already adequately tight monetary policy in key EM economies and steep yield curves providing investors with excess term premium. Furthermore, overall EM foreign currency cheapness should enhance local currency returns from income and interest rates, particularly if our expectation of a declining dollar and hawkish EM central banks were to materialize. Among credit, the hard currency J.P. Morgan Emerging Markets Bond Global Index screens as cheap versus both its historical average and traditionally comparable asset classes such as U.S. high yield, while our sovereign spread model suggests that there could be attractive
4
Morgan Stanley Institutional Fund, Inc.
Annual Report — December 31, 2018
Investment Overview (unaudited) (cont'd)
Emerging Markets Fixed Income Opportunities Portfolio
spread compression potential from a fundamental perspective. Similar attractive opportunities can be found in EM corporates, where absolute and relative spreads have sharply underperformed other credit markets such as U.S. and European high yield in 2018, despite generally improving fundamentals that are reflected in a similarly (low) default profile.
• Despite our overall constructive tone for EM debt in 2019, we acknowledge several risks that could undermine our thesis. The main risk concerns a worsening of U.S. — China trade relations. Though the recent truce reached at the G-20 meeting on December 1, 2018 is a step in the right direction, a final settlement of the ongoing disputes seems elusive in our view, as U.S. grievances involve issues that are critical to China's development model and on which Chinese authorities may be reluctant to compromise. We note, though, that a tariffs/counter-tariffs regime may also generate shifts in trade flows and relocation of supply chains to other countries, which could benefit several economies in EM. Moreover, the absence of synchronized global growth or loose global monetary policy implies that opportunities in EM will demand a discriminating approach to country/asset selection, especially with trade tensions and geopolitical risks on the rise. EM-specific drivers that are worth monitoring include policy signals from incoming administrations in systemically important EM countries such as Mexico and Brazil. Regarding the former, Mexican President Andres Manuel Lopez Obrador's recent decisions to scrap the Mexico City airport and to consult the population on certain initiatives via legally questionable referenda bode poorly for policy predictability going forward. On the other hand, statements from the incoming Brazilian President Bolsonaro are more constructive, as he unveils a market-friendly economic agenda prioritizing fiscal consolidation, and particularly a swift pension reform. Finally, elections will be held in several EM economies in 2019 that, if resolved positively, could provide further impetus to reformist agendas. In particular, we highlight important electoral contests in Indonesia, Ukraine, India, South Africa and Argentina.
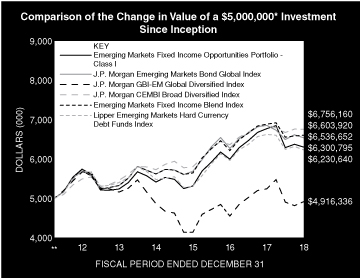
* Minimum Investment for Class I shares
** Commenced Operations on May 24, 2012.
In accordance with SEC regulations, the Fund's performance shown assumes that all recurring fees (including management fees) were deducted and all dividends and distributions were reinvested. The performance of Class A, L, C and IS shares will vary from the performance of Class I shares based upon their different inception dates and will be negatively impacted by additional fees assessed to those classes (if applicable).
5
Morgan Stanley Institutional Fund, Inc.
Annual Report — December 31, 2018
Investment Overview (unaudited) (cont'd)
Emerging Markets Fixed Income Opportunities Portfolio
Performance Compared to the J.P. Morgan Emerging Markets Bond Global Index(1), the J.P. Morgan GBI-EM Global Diversified Index(2), the J.P. Morgan CEMBI Broad Diversified Index(3), the Emerging Markets Fixed Income Blend Index(4) and the Lipper Emerging Markets Hard Currency Debt Fund Index(5)
| | | Period Ended December 31, 2018
Total Returns(6) | |
| | | | | Average Annual | |
| | | One
Year | | Five
Years | | Ten
Years | | Since
Inception(10) | |
Fund — Class I Shares
w/o sales charges(7) | | | –6.93 | % | | | 3.77 | % | | | — | | | | 3.56 | % | |
Fund — Class A Shares
w/o sales charges(7) | | | –7.29 | | | | 3.41 | | | | — | | | | 3.22 | | |
Fund — Class A Shares with
maximum 4.25% sales charges(7) | | | –11.24 | | | | 2.51 | | | | — | | | | 2.55 | | |
Fund — Class L Shares
w/o sales charges(7) | | | –7.52 | | | | 3.15 | | | | — | | | | 2.92 | | |
Fund — Class C Shares
w/o sales charges(9) | | | –7.98 | | | | — | | | | — | | | | 1.81 | | |
Fund — Class C Shares with
maximum 1.00% deferred
sales charges(9) | | | –8.86 | | | | — | | | | — | | | | 1.81 | | |
Fund — Class IS Shares
w/o sales charges(8) | | | –6.91 | | | | 3.78 | | | | — | | | | 3.94 | | |
J.P. Morgan Emerging Markets
Bond Global Index | | | –4.61 | | | | 4.18 | | | | — | | | | 4.14 | | |
J.P. Morgan GBI-EM Global
Diversified Index | | | –6.21 | | | | –0.96 | | | | — | | | | –0.26 | | |
J.P. Morgan CEMBI Broad
Diversified Index | | | –1.65 | | | | 4.36 | | | | — | | | | 4.66 | | |
Emerging Markets Fixed Income
Blend Index | | | –4.08 | | | | 4.40 | | | | — | | | | 4.30 | | |
Lipper Emerging Market
Hard Currency Debt Funds Index | | | –5.93 | | | | 2.90 | | | | — | | | | 3.39 | | |
Performance data quoted represents past performance, which is no guarantee of future results, and current performance may be lower or higher than the figures shown. Performance assumes that all dividends and distributions, if any, were reinvested. For the most recent month-end performance figures, please visit www.morganstanley.com/im/shareholderreports. Investment return and principal value will fluctuate so that Fund shares, when redeemed, may be worth more or less than their original cost. Total returns do not reflect the deduction of taxes that a shareholder would pay on Fund distributions or the redemption of Fund shares. Performance of share classes will vary due to difference in sales charges and expenses.
(1) The J.P. Morgan Emerging Markets Bond Global Index (EMBI Global Index) tracks total returns for U.S. dollar-denominated debt instruments issued by emerging markets sovereign and quasi-sovereign entities: Brady Bonds, loans, Eurobonds and local market instruments for emerging market countries. The Index is unmanaged and its returns do not include any sales charges or fees. Such costs would lower performance. It is not possible to invest directly in an index.
(2) The J.P. Morgan Government Bond Index-Emerging Markets Global Diversified Index (GBI-EM Global Diversified Index) tracks local currency government bonds issued by emerging markets. The Index is unmanaged and its returns do not include any sales charges or fees. Such costs would lower performance. It is not possible to invest directly in an index.
(3) The J.P. Morgan Corportate Emerging Markets Bond Index Broad Diversified (CEMBI Broad Diversified Index) which tracks performance of corportate issued debt instruments issued by emerging markets. The Index is unmanaged and its returns do not include any sales charges or fees. Such costs would lower performance. It is not possible to invest directly in an index.
(4) The Emerging Markets Fixed Income Blend Index is a performance linked benchmark of the old and new benchmark of the Fund, the old represented by J.P. Morgan EMBI Global Index for period from the Fund's inception to September 25, 2015 and the new Blended Index which consists of 1/3 J.P. Morgan EMBI Global Index, 1/3 J.P. morgan GBI-EM Global Diversified Index, 1/3 J.P. Morgan CEMBI Broad Diversified Index for periods thereafter. The Index is unmanaged and its returns do not include any sales charges or fees. Such costs would lower performance. It is not possible to invest directly in an index.
(5) The Lipper Emerging Market Hard Currency Debt Funds Index is an equally weighted performance index of the largest qualifying funds (based on net assets) in the Lipper Emerging Market Hard Currency Debt Funds classification. The Index, which is adjusted for capital gains distributions and income dividends, is unmanaged and should not be considered an investment. There are currently 30 funds represented in this Index. As of the date of this report, the Fund is in the Lipper Emerging Market Hard Currency Debt Funds classification.
(6) Total returns for the Fund reflect fees waived and expenses reimbursed, if applicable, by Morgan Stanley Investment Management Inc. (the "Adviser"). Without such waivers and reimbursements, total returns would have been lower.
(7) Commenced operations on May 24, 2012.
(8) Commenced offering on September 13, 2013.
(9) Commenced offering on April 30, 2015.
(10) For comparative purposes, average annual since inception returns listed for the Indexes refer to the inception date of Class I of the Fund, not the inception of the Index.
6
Morgan Stanley Institutional Fund, Inc.
Annual Report — December 31, 2018
Portfolio of Investments
Emerging Markets Fixed Income Opportunities Portfolio
| | | Face
Amount
(000) | | Value
(000) | |
Fixed Income Securities (91.8%) | |
Angola (1.1%) | |
Sovereign (1.1%) | |
Angolan Government International Bond,
9.38%, 5/8/48 (a) | | $ | 420 | | | $ | 394 | | |
Argentina (4.4%) | |
Corporate Bonds (3.0%) | |
Banco Macro SA, | |
17.50%, 5/8/22 (a) | | ARS | 1,080 | | | | 19 | | |
Province of Santa Fe, | |
6.90%, 11/1/27 (a) | | $ | 400 | | | | 297 | | |
Provincia de Buenos Aires, | |
BADLAR + 3.83%, 52.52%, 5/31/22 (b) | | ARS | 2,440 | | | | 60 | | |
Provincia de Cordoba, | |
7.45%, 9/1/24 (a) | | $ | 170 | | | | 139 | | |
Provincia de Entre Rios Argentina, | |
8.75%, 2/8/25 (a) | | | 230 | | | | 165 | | |
Provincia de Mendoza Argentina, | |
BADLAR + 4.38%, 52.84%, 6/9/21 (b) | | ARS | 3,570 | | | | 85 | | |
Provincia de Rio Negro, | |
7.75%, 12/7/25 (a) | | $ | 150 | | | | 106 | | |
Provincia del Chaco Argentina, | |
9.38%, 8/18/24 (a) | | | 240 | | | | 172 | | |
| | | | 1,043 | | |
Sovereign (1.4%) | |
Argentine Bonos del Tesoro, | |
18.20%, 10/3/21 | | ARS | 634 | | | | 13 | | |
Argentine Republic Government
International Bond, | |
6.88%, 4/22/21 – 1/11/48 | | $ | 510 | | | | 419 | | |
7.13%, 12/31/99 | | | 100 | | | | 72 | | |
| | | | 504 | | |
| | | | 1,547 | | |
Belarus (0.5%) | |
Sovereign (0.5%) | |
Republic of Belarus International Bond, | |
6.20%, 2/28/30 (a) | | | 200 | | | | 184 | | |
Brazil (7.0%) | |
Corporate Bonds (2.3%) | |
Cosan Luxembourg SA, | |
7.00%, 1/20/27 (a) | | | 240 | | | | 242 | | |
Embraer Netherlands Finance BV, | |
5.40%, 2/1/27 | | | 30 | | | | 31 | | |
Hidrovias International Finance SARL, | |
5.95%, 1/24/25 (a) | | | 400 | | | | 366 | | |
Minerva Luxembourg SA, | |
5.88%, 1/19/28 (a) | | | 200 | | | | 175 | | |
| | | | 814 | | |
Sovereign (4.7%) | |
Brazil Notas do Tesouro Nacional, Series F, | |
10.00%, 1/1/21 – 1/1/27 | | BRL | 6,482 | | | | 1,666 | | |
| | | | 2,480 | | |
| | | Face
Amount
(000) | | Value
(000) | |
Chile (1.1%) | |
Corporate Bonds (1.1%) | |
Cencosud SA, | |
4.88%, 1/20/23 | | $ | 200 | | | $ | 195 | | |
Geopark Ltd., | |
6.50%, 9/21/24 (a) | | | 200 | | | | 186 | | |
| | | | 381 | | |
China (0.6%) | |
Corporate Bond (0.6%) | |
Fufeng Group Ltd., | |
5.88%, 8/28/21 | | | 200 | | | | 201 | | |
Colombia (5.2%) | |
Corporate Bonds (3.0%) | |
Canacol Energy Ltd., | |
7.25%, 5/3/25 (a) | | | 400 | | | | 370 | | |
Millicom International Cellular SA, | |
6.00%, 3/15/25 | | | 685 | | | | 679 | | |
| | | | 1,049 | | |
Sovereign (2.2%) | |
Colombian TES, | |
7.00%, 5/4/22 | | COP | 302,700 | | | | 97 | | |
7.50%, 8/26/26 | | | 1,138,000 | | | | 371 | | |
7.75%, 9/18/30 | | | 30,000 | | | | 10 | | |
10.00%, 7/24/24 | | | 847,300 | | | | 308 | | |
| | | | 786 | | |
| | | | 1,835 | | |
Costa Rica (1.0%) | |
Sovereign (1.0%) | |
Costa Rica Government International Bond, | |
7.16%, 3/12/45 | | $ | 400 | | | | 346 | | |
Dominican Republic (2.2%) | |
Corporate Bond (1.1%) | |
AES Andres BV/Dominican Power Partners/
Empresa Generadora de Electricidad It,
(Units) | |
7.95%, 5/11/26 (a)(c) | | | 400 | | | | 406 | | |
Sovereign (1.1%) | |
Dominican Republic International Bond, | |
6.00%, 7/19/28 (a) | | | 300 | | | | 300 | | |
6.88%, 1/29/26 (a) | | | 100 | | | | 105 | | |
| | | | 405 | | |
| | | | 811 | | |
Ecuador (1.5%) | |
Sovereign (1.5%) | |
Ecuador Government International Bond, | |
8.88%, 10/23/27 | | | 610 | | | | 527 | | |
The accompanying notes are an integral part of the financial statements.
7
Morgan Stanley Institutional Fund, Inc.
Annual Report — December 31, 2018
Portfolio of Investments (cont'd)
Emerging Markets Fixed Income Opportunities Portfolio
| | | Face
Amount
(000) | | Value
(000) | |
Egypt (1.3%) | |
Sovereign (1.3%) | |
Egypt Government International Bond, | |
4.75%, 4/16/26 | | EUR | 100 | | | $ | 104 | | |
7.90%, 2/21/48 (a) | | $ | 400 | | | | 346 | | |
| | | | 450 | | |
El Salvador (0.2%) | |
Sovereign (0.2%) | |
El Salvador Government International Bond, | |
8.63%, 2/28/29 (a) | | | 80 | | | | 84 | | |
Georgia (0.5%) | |
Corporate Bond (0.5%) | |
Bank of Georgia JSC, | |
11.00%, 6/1/20 (a) | | GEL | 500 | | | | 187 | | |
Ghana (1.3%) | |
Sovereign (1.3%) | |
Ghana Government International Bond, | |
8.63%, 6/16/49 (a) | | $ | 260 | | | | 227 | | |
10.75%, 10/14/30 | | | 200 | | | | 227 | | |
| | | | 454 | | |
Guatemala (1.6%) | |
Sovereign (1.6%) | |
Guatemala Government Bond, | |
4.50%, 5/3/26 (a) | | | 400 | | | | 377 | | |
4.88%, 2/13/28 | | | 200 | | | | 190 | | |
| | | | 567 | | |
Hungary (1.5%) | |
Sovereign (1.5%) | |
Hungary Government Bond, | |
3.00%, 10/27/27 | | HUF | 105,000 | | | | 376 | | |
5.50%, 6/24/25 | | | 39,170 | | | | 164 | | |
| | | | 540 | | |
India (1.1%) | |
Corporate Bond (1.1%) | |
Neerg Energy Ltd., | |
6.00%, 2/13/22 | | $ | 400 | | | | 378 | | |
Indonesia (7.6%) | |
Corporate Bonds (1.0%) | |
Jababeka International BV, | |
6.50%, 10/5/23 (a) | | | 260 | | | | 216 | | |
Soechi Capital Pte Ltd., | |
8.38%, 1/31/23 (a) | | | 200 | | | | 143 | | |
| | | | 359 | | |
Sovereign (6.6%) | |
Indonesia Government International Bond, | |
5.35%, 2/11/49 | | | 200 | | | | 207 | | |
Indonesia Treasury Bond, | |
7.50%, 8/15/32 | | IDR | 9,150,000 | | | | 597 | | |
8.75%, 5/15/31 | | | 1,310,000 | | | | 95 | | |
9.00%, 3/15/29 | | | 10,990,000 | | | | 808 | | |
| | | Face
Amount
(000) | | Value
(000) | |
Pertamina Persero PT, | |
6.50%, 11/7/48 (a) | | $ | 200 | | | $ | 211 | | |
Perusahaan Listrik Negara PT, | |
6.15%, 5/21/48 (a) | | | 400 | | | | 403 | | |
| | | | 2,321 | | |
| | | | 2,680 | | |
Iraq (0.5%) | |
Sovereign (0.5%) | |
Iraq International Bond, | |
6.75%, 3/9/23 (a) | | | 200 | | | | 191 | | |
Israel (1.4%) | |
Corporate Bond (1.4%) | |
Teva Pharmaceutical Finance
Netherlands III BV, | |
6.75%, 3/1/28 | | | 500 | | | | 485 | | |
Jamaica (1.5%) | |
Corporate Bonds (0.9%) | |
Digicel Group Ltd., | |
8.25%, 9/30/20 | | | 200 | | | | 136 | | |
Digicel Ltd., | |
6.00%, 4/15/21 | | | 200 | | | | 180 | | |
| | | | 316 | | |
Sovereign (0.6%) | |
Jamaica Government International Bond, | |
8.00%, 3/15/39 | | | 200 | | | | 230 | | |
| | | | 546 | | |
Jordan (0.5%) | |
Sovereign (0.5%) | |
Jordan Government International Bond, | |
7.38%, 10/10/47 (a) | | | 200 | | | | 178 | | |
Kazakhstan (2.1%) | |
Corporate Bond (0.4%) | |
Nostrum Oil & Gas Finance BV, | |
7.00%, 2/16/25 (a) | | | 230 | | | | 143 | | |
Sovereign (1.7%) | |
KazMunayGas National Co., JSC, | |
6.38%, 10/24/48 (a) | | | 580 | | | | 585 | | |
| | | | 728 | | |
Kenya (0.5%) | |
Sovereign (0.5%) | |
Kenya Government International Bond, | |
8.25%, 2/28/48 (a) | | | 200 | | | | 171 | | |
Malaysia (1.9%) | |
Sovereign (1.9%) | |
Malaysia Government Bond, | |
3.66%, 10/15/20 | | MYR | 137 | | | | 33 | | |
3.96%, 9/15/25 | | | 1,127 | | | | 272 | | |
4.16%, 7/15/21 | | | 875 | | | | 215 | | |
The accompanying notes are an integral part of the financial statements.
8
Morgan Stanley Institutional Fund, Inc.
Annual Report — December 31, 2018
Portfolio of Investments (cont'd)
Emerging Markets Fixed Income Opportunities Portfolio
| | | Face
Amount
(000) | | Value
(000) | |
Malaysia (cont'd) | |
4.18%, 7/15/24 | | MYR | 124 | | | $ | 30 | | |
4.23%, 6/30/31 | | | 246 | | | | 58 | | |
4.50%, 4/15/30 | | | 249 | | | | 61 | | |
| | | | 669 | | |
Mexico (11.4%) | |
Corporate Bonds (2.0%) | |
Alfa SAB de CV, | |
5.25%, 3/25/24 | | $ | 200 | | | | 200 | | |
Alpha Holding SA de CV, | |
10.00%, 12/19/22 (a) | | | 200 | | | | 147 | | |
Financiera Independencia SAB de
CV SOFOM ENR, | |
8.00%, 7/19/24 (a) | | | 250 | | | | 184 | | |
Unifin Financiera SAB de CV SOFOM ENR, | |
8.88%, 1/29/25 (a)(d) | | | 200 | | | | 166 | | |
| | | | 697 | | |
Sovereign (9.4%) | |
Mexican Bonos, | |
10.00%, 12/5/24 | | MXN | 11,510 | | | | 623 | | |
Series M | |
6.50%, 6/10/21 | | | 18,450 | | | | 897 | | |
7.75%, 5/29/31 | | | 3,017 | | | | 142 | | |
8.00%, 6/11/20 - 12/7/23 | | | 7,672 | | | | 386 | | |
10.00%, 12/5/24 | | | 1,388 | | | | 75 | | |
Mexico Government International Bond, | |
3.75%, 1/11/28 | | $ | 200 | | | | 188 | | |
Petroleos Mexicanos, | |
6.35%, 2/12/48 | | | 300 | | | | 241 | | |
6.50%, 3/13/27 – 1/23/29 | | | 730 | | | | 685 | | |
6.75%, 9/21/47 | | | 100 | | | | 83 | | |
| | | | 3,320 | | |
| | | | 4,017 | | |
Mongolia (0.6%) | |
Sovereign (0.6%) | |
Development Bank of Mongolia LLC, | |
7.25%, 10/23/23 (a) | | | 200 | | | | 197 | | |
Nigeria (6.0%) | |
Corporate Bonds (3.4%) | |
Access Bank PLC, | |
10.50%, 10/19/21 | | | 200 | | | | 213 | | |
Fidelity Bank PLC, | |
10.50%, 10/16/22 (a) | | | 200 | | | | 201 | | |
United Bank for Africa PLC, | |
7.75%, 6/8/22 (a) | | | 340 | | | | 338 | | |
Zenith Bank PLC, | |
6.25%, 4/22/19 | | | 440 | | | | 440 | | |
| | | | 1,192 | | |
| | | Face
Amount
(000) | | Value
(000) | |
Sovereign (2.6%) | |
Nigeria Government International Bond, | |
6.38%, 7/12/23 | | $ | 400 | | | $ | 385 | | |
6.50%, 11/28/27 (a) | | | 200 | | | | 177 | | |
7.14%, 2/23/30 (a) | | | 200 | | | | 178 | | |
9.25%, 1/21/49 (a) | | | 200 | | | | 195 | | |
| | | | 935 | | |
| | | | 2,127 | | |
Panama (1.7%) | |
Corporate Bond (1.1%) | |
Multibank, Inc., | |
4.38%, 11/9/22 (a) | | | 400 | | | | 389 | | |
Sovereign (0.6%) | |
Aeropuerto Internacional de Tocumen SA, | |
5.63%, 5/18/36 (a) | | | 200 | | | | 204 | | |
| | | | 593 | | |
Paraguay (1.1%) | |
Sovereign (1.1%) | |
Paraguay Government International Bond, | |
4.70%, 3/27/27 (a) | | | 400 | | | | 397 | | |
Peru (0.5%) | |
Sovereign (0.5%) | |
Peruvian Government International Bond,
(Units) | |
6.35%, 8/12/28 (c) | | PEN | 523 | | | | 163 | | |
Poland (4.1%) | |
Sovereign (4.1%) | |
Republic of Poland Government Bond, | |
2.50%, 7/25/27 | | PLN | 280 | | | | 74 | | |
3.25%, 7/25/25 | | | 2,664 | | | | 745 | | |
4.00%, 10/25/23 | | | 1,815 | | | | 526 | | |
5.75%, 10/25/21 – 9/23/22 | | | 400 | | | | 119 | | |
| | | | 1,464 | | |
Romania (0.7%) | |
Sovereign (0.7%) | |
Romania Government Bond, | |
4.75%, 2/24/25 | | RON | 980 | | | | 247 | | |
Russia (2.2%) | |
Sovereign (2.2%) | |
Russian Federal Bond - OFZ, | |
7.00%, 1/25/23 - 8/16/23 | | RUB | 17,480 | | | | 240 | | |
7.60%, 7/20/22 | | | 9,800 | | | | 139 | | |
7.75%, 9/16/26 | | | 29,671 | | | | 410 | | |
| | | | 789 | | |
Senegal (0.5%) | |
Sovereign (0.5%) | |
Senegal Government International Bond, | |
6.25%, 5/23/33 (a) | | $ | 200 | | | | 173 | | |
The accompanying notes are an integral part of the financial statements.
9
Morgan Stanley Institutional Fund, Inc.
Annual Report — December 31, 2018
Portfolio of Investments (cont'd)
Emerging Markets Fixed Income Opportunities Portfolio
| | | Face
Amount
(000) | | Value
(000) | |
South Africa (5.0%) | |
Corporate Bond (0.6%) | |
SASOL Financing USA LLC, | |
6.50%, 9/27/28 | | $ | 200 | | | $ | 200 | | |
Sovereign (4.4%) | |
Eskom Holdings SOC Ltd., | |
7.13%, 2/11/25 | | | 200 | | | | 183 | | |
8.45%, 8/10/28 (a) | | | 200 | | | | 189 | | |
Republic of South Africa Government Bond, | |
8.25%, 3/31/32 | | ZAR | 2,012 | | | | 126 | | |
8.75%, 1/31/44 | | | 820 | | | | 51 | | |
9.00%, 1/31/40 | | | 1,500 | | | | 96 | | |
South Africa Government Bond, | |
6.75%, 3/31/21 | | | 770 | | | | 53 | | |
8.00%, 1/31/30 | | | 13,671 | | | | 860 | | |
| | | | 1,558 | | |
| | | | 1,758 | | |
Sri Lanka (0.5%) | |
Sovereign (0.5%) | |
Sri Lanka Government International Bond, | |
6.75%, 4/18/28 | | $ | 200 | | | | 183 | | |
Tanzania, United Republic of (0.6%) | |
Corporate Bond (0.6%) | |
HTA Group Ltd., | |
9.13%, 3/8/22 (a) | | | 200 | | | | 204 | | |
Thailand (1.0%) | |
Sovereign (1.0%) | |
Thailand Government Bond, | |
4.88%, 6/22/29 | | THB | 9,304 | | | | 344 | | |
Turkey (2.9%) | |
Sovereign (2.9%) | |
Turkey Government Bond, | |
8.00%, 3/12/25 | | TRY | 133 | | | | 17 | | |
10.60%, 2/11/26 | | | 609 | | | | 90 | | |
11.00%, 2/24/27 | | | 3,500 | | | | 512 | | |
Turkey Government International Bond, | |
7.25%, 12/23/23 | | $ | 400 | | | | 412 | | |
| | | | 1,031 | | |
Ukraine (3.1%) | |
Sovereign (3.1%) | |
Ukraine Government International Bond, | |
7.38%, 9/25/32 (a) | | | 600 | | | | 478 | | |
7.75%, 9/1/23 - 9/1/26 | | | 500 | | | | 442 | | |
9.75%, 11/1/28 (a) | | | 200 | | | | 188 | | |
| | | | 1,108 | | |
United Arab Emirates (1.1%) | |
Corporate Bond (1.1%) | |
DP World Ltd., | |
5.63%, 9/25/48 (a) | | | 400 | | | | 378 | | |
| | | Face
Amount
(000) | | Value
(000) | |
Venezuela (0.7%) | |
Sovereign (0.7%) | |
Petroleos de Venezuela SA, | |
6.00%, 11/15/26 (e)(f) | | $ | 1,582 | | | $ | 239 | | |
Total Fixed Income Securities (Cost $34,805) | | | 32,426 | | |
| | | No. of
Warrants | | | |
Warrant (0.0%) | |
Venezuela (0.0%) | |
Venezuela Government International Bond,
Oil-Linked Payment Obligation, 0.00%,
expires 4/15/20 (g) (Cost $—) | | | 495 | | | | 1 | | |
| | | Shares | | | |
Short-Term Investments (6.3%) | |
United States (4.5%) | |
Investment Company (4.5%) | |
Morgan Stanley Institutional Liquidity
Funds — Treasury Securities Portfolio —
Institutional Class (See Note G)
(Cost $1,580) | | | 1,579,551 | | | | 1,580 | | |
| | | Face
Amount
(000) | | | |
Egypt (1.7%) | |
Sovereign (1.7%) | |
Egypt Treasury Bills, | |
16.40%, 3/5/19 | | EGP | 5,500 | | | | 299 | | |
16.57%, 3/5/19 | | | 5,625 | | | | 305 | | |
Total Sovereign (Cost $614) | | | 604 | | |
United States (0.1%) | |
U.S. Treasury Security (0.1%) | |
U.S. Treasury Bill, | |
| 2.38%, 3/21/19 (h) (Cost $30) | | $ | 30 | | | | 30 | | |
Total Short-Term Investments (Cost $2,224) | | | 2,214 | | |
Total Investments (98.1%) (Cost $37,029) (i)(j) | | | 34,641 | | |
Other Assets in Excess of Liabilities (1.9%) | | | 687 | | |
Net Assets (100.0%) | | $ | 35,328 | | |
Country assignments and aggregations are based generally on third party vendor classifications and information, and may be different from the assignments and aggregations under the policies set forth in the Fund's prospectus and/or statement of additional information relating to geographic classifications.
(a) 144A security — Certain conditions for public sale may exist. Unless otherwise noted, these securities are deemed to be liquid.
(b) Floating or Variable rate securities: The rates disclosed are as of December 31, 2018. For securities based on a published reference rate and spread, the reference rate and spread are indicated in the description in the Portfolio of Investments. Certain variable rate securities may not be based on a published reference rate and spread but are determined by the issuer or agent and are based on current market conditions. These securities do not indicate a reference rate and spread in their description in the Portfolio of Investments.
(c) Consists of one or more classes of securities traded together as a unit.
The accompanying notes are an integral part of the financial statements.
10
Morgan Stanley Institutional Fund, Inc.
Annual Report — December 31, 2018
Portfolio of Investments (cont'd)
Emerging Markets Fixed Income Opportunities Portfolio
(d) Perpetual — One or more securities do not have a predetermined maturity date. Rates for these securities are fixed for a period of time, after which they revert to a floating rate. Interest rates in effect are as of December 31, 2018.
(e) Non-income producing security; bond in default.
(f) Issuer in bankruptcy.
(g) Security has been deemed illiquid at December 31, 2018.
(h) Rate shown is the yield to maturity at December 31, 2018.
(i) Securities are available for collateral in connection with open foreign currency forward exchange contracts.
(j) At December 31, 2018, the aggregate cost for federal income tax purposes is approximately $37,206,000. The aggregate gross unrealized appreciation is approximately $404,000 and the aggregate gross unrealized depreciation is approximately $3,002,000, resulting in net unrealized depreciation of approximately $2,598,000.
BADLAR Buenos Aires Deposits of Large Amount Rate.
OFZ Obilgatsyi Federal'novo Zaima (Russian Federal Loan Obligation).
Foreign Currency Forward Exchange Contracts:
The Fund had the following foreign currency forward exchange contracts open at December 31, 2018:
Counterparty | | Contracts to
Deliver
(000) | | In Exchange
For
(000) | | Delivery
Date | | Unrealized
Appreciation
(Depreciation)
(000) | |
JPMorgan Chase Bank NA | | BRL | 1,457 | | | $ | 376 | | | 1/3/19 | | $ | — | @ | |
JPMorgan Chase Bank NA | | BRL | 250 | | | $ | 65 | | | 1/3/19 | | | — | @ | |
JPMorgan Chase Bank NA | | BRL | 1,207 | | | $ | 311 | | | 1/3/19 | | | — | @ | |
JPMorgan Chase Bank NA | | $ | 65 | | | BRL | 250 | | | 1/3/19 | | | (— | @) | |
JPMorgan Chase Bank NA | | $ | 308 | | | BRL | 1,207 | | | 1/3/19 | | | 4 | | |
JPMorgan Chase Bank NA | | $ | 376 | | | BRL | 1,457 | | | 1/3/19 | | | (— | @) | |
Goldman Sachs International | | HUF | 28,960 | | | $ | 103 | | | 1/11/19 | | | (— | @) | |
JPMorgan Chase Bank NA | | $ | 105 | | | RON | 429 | | | 1/11/19 | | | — | @ | |
JPMorgan Chase Bank NA | | $ | 314 | | | THB | 10,350 | | | 1/16/19 | | | 4 | | |
JPMorgan Chase Bank NA | | $ | 107 | | | THB | 3,500 | | | 1/16/19 | | | 1 | | |
JPMorgan Chase Bank NA | | $ | 494 | | | CLP | 334,000 | | | 1/17/19 | | | (13 | ) | |
JPMorgan Chase Bank NA | | $ | 61 | | | CLP | 41,300 | | | 1/17/19 | | | (1 | ) | |
Goldman Sachs International | | MXN | 17,380 | | | $ | 859 | | | 1/25/19 | | | (23 | ) | |
JPMorgan Chase Bank NA | | $ | 26 | | | COP | 83,250 | | | 1/25/19 | | | (— | @) | |
JPMorgan Chase Bank NA | | EUR | 100 | | | $ | 114 | | | 1/29/19 | | | (1 | ) | |
JPMorgan Chase Bank NA | | BRL | 1,207 | | | $ | 307 | | | 2/4/19 | | | (4 | ) | |
| | | | | | | | | $ | (33 | ) | |
@ Value is less than $500.
ARS — Argentine Peso
BRL — Brazilian Real
CLP — Chilean Peso
COP — Colombian Peso
EGP — Egyptian Pound
EUR — Euro
GEL — Georgian Lari
HUF — Hungarian Forint
IDR — Indonesian Rupiah
MXN — Mexican Peso
MYR — Malaysian Ringgit
PEN — Peruvian Nuevo Sol
PLN — Polish Zloty
RON — Romanian New Leu
RUB — Russian Ruble
THB — Thai Baht
TRY — Turkish Lira
ZAR — South African Rand
The accompanying notes are an integral part of the financial statements.
11
Morgan Stanley Institutional Fund, Inc.
Annual Report — December 31, 2018
Portfolio of Investments (cont'd)
Emerging Markets Fixed Income Opportunities Portfolio
Portfolio Composition
Classification | | Percentage of
Total Investments | |
Sovereign | | | 68.1 | % | |
Corporate Bonds | | | 25.5 | | |
Short-Term Investments | | | 6.4 | | |
Other* | | | 0.0 | ** | |
Total Investments | | | 100.0 | %*** | |
* Industries and/or investment types representing less than 5% of total investments.
** Amount is less than 0.05%.
*** Does not include open foreign currency forward exchange contracts with net unrealized depreciation of approximately $33,000.
The accompanying notes are an integral part of the financial statements.
12
Morgan Stanley Institutional Fund, Inc.
Annual Report — December 31, 2018
Emerging Markets Fixed Income Opportunities Portfolio
Statement of Assets and Liabilities | | December 31, 2018
(000) | |
Assets: | |
Investments in Securities of Unaffiliated Issuers, at Value (Cost $35,449) | | $ | 33,061 | | |
Investment in Security of Affiliated Issuer, at Value (Cost $1,580) | | | 1,580 | | |
Total Investments in Securities, at Value (Cost $37,029) | | | 34,641 | | |
Foreign Currency, at Value (Cost $8) | | | 9 | | |
Interest Receivable | | | 767 | | |
Due from Adviser | | | 46 | | |
Receivable for Fund Shares Sold | | | 17 | | |
Unrealized Appreciation on Foreign Currency Forward Exchange Contracts | | | 9 | | |
Tax Reclaim Receivable | | | 4 | | |
Due from Broker | | | 4 | | |
Receivable from Affiliate | | | 4 | | |
Dividends Receivable | | | — | @ | |
Other Assets | | | 33 | | |
Total Assets | | | 35,534 | | |
Liabilities: | |
Payable for Professional Fees | | | 87 | | |
Unrealized Depreciation on Foreign Currency Forward Exchange Contracts | | | 42 | | |
Payable for Fund Shares Redeemed | | | 28 | | |
Payable for Directors' Fees and Expenses | | | 11 | | |
Payable for Custodian Fees | | | 9 | | |
Deferred Capital Gain Country Tax | | | 7 | | |
Payable for Transfer Agency Fees — Class I | | | 1 | | |
Payable for Transfer Agency Fees — Class A | | | 1 | | |
Payable for Transfer Agency Fees — Class L | | | 1 | | |
Payable for Transfer Agency Fees — Class C | | | 1 | | |
Payable for Transfer Agency Fees — Class IS | | | 1 | | |
Payable for Administration Fees | | | 2 | | |
Payable for Sub Transfer Agency Fees — Class I | | | 1 | | |
Payable for Sub Transfer Agency Fees — Class A | | | — | @ | |
Payable for Sub Transfer Agency Fees — Class L | | | — | @ | |
Payable for Sub Transfer Agency Fees — Class C | | | — | @ | |
Payable for Shareholder Services Fees — Class A | | | — | @ | |
Payable for Distribution and Shareholder Services Fees — Class L | | | — | @ | |
Payable for Distribution and Shareholder Services Fees — Class C | | | — | @ | |
Other Liabilities | | | 14 | | |
Total Liabilities | | | 206 | | |
Net Assets | | $ | 35,328 | | |
Net Assets Consist of: | |
Paid-in-Capital | | $ | 42,910 | | |
Total Accumulated Loss | | | (7,582 | ) | |
Net Assets | | $ | 35,328 | | |
The accompanying notes are an integral part of the financial statements.
13
Morgan Stanley Institutional Fund, Inc.
Annual Report — December 31, 2018
Emerging Markets Fixed Income Opportunities Portfolio
Statement of Assets and Liabilities (cont'd) | | December 31, 2018
(000) | |
CLASS I: | |
Net Assets | | $ | 32,575 | | |
| Shares Outstanding $0.001 par value shares of beneficial interest (unlimited shares authorized) (not in 000's) | | | 3,825,141 | | |
Net Asset Value, Offering and Redemption Price Per Share | | $ | 8.52 | | |
CLASS A: | |
Net Assets | | $ | 1,306 | | |
| Shares Outstanding $0.001 par value shares of beneficial interest (unlimited shares authorized) (not in 000's) | | | 153,477 | | |
Net Asset Value, Redemption Price Per Share | | $ | 8.51 | | |
Maximum Sales Load | | | 4.25 | % | |
Maximum Sales Charge | | $ | 0.38 | | |
Maximum Offering Price Per Share | | $ | 8.89 | | |
CLASS L: | |
Net Assets | | $ | 727 | | |
| Shares Outstanding $0.001 par value shares of beneficial interest (unlimited shares authorized) (not in 000's) | | | 85,501 | | |
Net Asset Value, Offering and Redemption Price Per Share | | $ | 8.50 | | |
CLASS C: | |
Net Assets | | $ | 48 | | |
| Shares Outstanding $0.001 par value shares of beneficial interest (unlimited shares authorized) (not in 000's) | | | 5,668 | | |
Net Asset Value, Offering and Redemption Price Per Share | | $ | 8.50 | | |
CLASS IS: | |
Net Assets | | $ | 672 | | |
| Shares Outstanding $0.001 par value shares of beneficial interest (unlimited shares authorized) (not in 000's) | | | 78,874 | | |
Net Asset Value, Offering and Redemption Price Per Share | | $ | 8.52 | | |
@ Amount is less than $500.
The accompanying notes are an integral part of the financial statements.
14
Morgan Stanley Institutional Fund, Inc.
Annual Report — December 31, 2018
Emerging Markets Fixed Income Opportunities Portfolio
Statement of Operations | | Year Ended
December 31, 2018
(000) | |
Investment Income: | |
Interest from Securities of Unaffiliated Issuers (Net of $19 of Foreign Taxes Withheld) | | $ | 1,915 | | |
Dividends from Security of Affiliated Issuer (Note G) | | | 23 | | |
Total Investment Income | | | 1,938 | | |
Expenses: | |
Advisory Fees (Note B) | | | 206 | | |
Professional Fees | | | 151 | | |
Registration Fees | | | 68 | | |
Custodian Fees (Note F) | | | 29 | | |
Administration Fees (Note C) | | | 22 | | |
Shareholder Reporting Fees | | | 20 | | |
Transfer Agency Fees — Class I (Note E) | | | 3 | | |
Transfer Agency Fees — Class A (Note E) | | | 3 | | |
Transfer Agency Fees — Class L (Note E) | | | 2 | | |
Transfer Agency Fees — Class C (Note E) | | | 2 | | |
Transfer Agency Fees — Class IS (Note E) | | | 2 | | |
Shareholder Services Fees — Class A (Note D) | | | 3 | | |
Distribution and Shareholder Services Fees — Class L (Note D) | | | 4 | | |
Distribution and Shareholder Services Fees — Class C (Note D) | | | 3 | | |
Pricing Fees | | | 9 | | |
Sub Transfer Agency Fees — Class I | | | 3 | | |
Sub Transfer Agency Fees — Class A | | | 1 | | |
Sub Transfer Agency Fees — Class L | | | — | @ | |
Sub Transfer Agency Fees — Class C | | | — | @ | |
Directors' Fees and Expenses | | | 4 | | |
Other Expenses | | | 29 | | |
Total Expenses | | | 564 | | |
Waiver of Advisory Fees (Note B) | | | (206 | ) | |
Expenses Reimbursed by Adviser (Note B) | | | (105 | ) | |
Reimbursement of Class Specific Expenses — Class A (Note B) | | | (2 | ) | |
Reimbursement of Class Specific Expenses — Class L (Note B) | | | (2 | ) | |
Reimbursement of Class Specific Expenses — Class C (Note B) | | | (2 | ) | |
Reimbursement of Class Specific Expenses — Class IS (Note B) | | | (2 | ) | |
Rebate from Morgan Stanley Affiliate (Note G) | | | (2 | ) | |
Net Expenses | | | 243 | | |
Net Investment Income | | | 1,695 | | |
Realized Gain (Loss): | |
Investments Sold (Net of $8 of Capital Gain Country Tax) | | | (706 | ) | |
Foreign Currency Forward Exchange Contracts | | | 8 | | |
Foreign Currency Translation | | | (36 | ) | |
Futures Contracts | | | (2 | ) | |
Net Realized Loss | | | (736 | ) | |
Change in Unrealized Appreciation (Depreciation): | |
Investments (Net of Increase in Deferred Capital Gain Country Tax of $4) | | | (2,815 | ) | |
Foreign Currency Forward Exchange Contracts | | | (53 | ) | |
Foreign Currency Translation | | | (5 | ) | |
Futures Contracts | | | (2 | ) | |
Net Change in Unrealized Appreciation (Depreciation) | | | (2,875 | ) | |
Net Realized Loss and Change in Unrealized Appreciation (Depreciation) | | | (3,611 | ) | |
Net Decrease in Net Assets Resulting from Operations | | $ | (1,916 | ) | |
@ Amount is less than $500.
The accompanying notes are an integral part of the financial statements.
15
Morgan Stanley Institutional Fund, Inc.
Annual Report — December 31, 2018
Emerging Markets Fixed Income Opportunities Portfolio
Statements of Changes in Net Assets | | Year Ended
December 31, 2018
(000) | | Year Ended
December 31, 2017
(000) | |
Increase (Decrease) in Net Assets: | |
Operations: | |
Net Investment Income | | $ | 1,695 | | | $ | 1,652 | | |
Net Realized Gain (Loss) | | | (736 | ) | | | 474 | | |
Net Change in Unrealized Appreciation (Depreciation) | | | (2,875 | ) | | | 846 | | |
Net Increase (Decrease) in Net Assets Resulting from Operations | | | (1,916 | ) | | | 2,972 | | |
Dividends and Distributions to Shareholders: | |
Class I | | | (1,377 | ) | | | (1,274 | )* | |
Class A | | | (66 | ) | | | (58 | )* | |
Class L | | | (36 | ) | | | (42 | )* | |
Class C | | | (12 | ) | | | (13 | )* | |
Class IS | | | (39 | ) | | | (44 | )* | |
Total Dividends and Distributions to Shareholders | | | (1,530 | ) | | | (1,431 | ) | |
Capital Share Transactions:(1) | |
Class I: | |
Subscribed | | | 16,805 | | | | 1,173 | | |
Distributions Reinvested | | | 407 | | | | 172 | | |
Redeemed | | | (3,837 | ) | | | (820 | ) | |
Class A: | |
Subscribed | | | 2,017 | | | | 226 | | |
Distributions Reinvested | | | 57 | | | | 48 | | |
Redeemed | | | (1,712 | ) | | | (160 | ) | |
Class L: | |
Distributions Reinvested | | | 32 | | | | 38 | | |
Redeemed | | | (51 | ) | | | (25 | ) | |
Class C: | |
Subscribed | | | 17 | | | | 32 | | |
Distributions Reinvested | | | 11 | | | | 12 | | |
Redeemed | | | (230 | ) | | | (1 | ) | |
Net Increase in Net Assets Resulting from Capital Share Transactions | | | 13,516 | | | | 695 | | |
Redemption Fees | | | — | @ | | | — | @ | |
Total Increase in Net Assets | | | 10,070 | | | | 2,236 | | |
Net Assets: | |
Beginning of Period | | | 25,258 | | | | 23,022 | | |
End of Period | | $ | 35,328 | | | $ | 25,258 | † | |
The accompanying notes are an integral part of the financial statements.
16
Morgan Stanley Institutional Fund, Inc.
Annual Report — December 31, 2018
Emerging Markets Fixed Income Opportunities Portfolio
Statements of Changes in Net Assets (cont'd) | | Year Ended
December 31, 2018
(000) | | Year Ended
December 31, 2017
(000) | |
(1) Capital Share Transactions: | |
Class I: | |
Shares Subscribed | | | 1,896 | | | | 122 | | |
Shares Issued on Distributions Reinvested | | | 47 | | | | 18 | | |
Shares Redeemed | | | (414 | ) | | | (86 | ) | |
Net Increase in Class I Shares Outstanding | | | 1,529 | | | | 54 | | |
Class A: | |
Shares Subscribed | | | 213 | | | | 24 | | |
Shares Issued on Distributions Reinvested | | | 6 | | | | 5 | | |
Shares Redeemed | | | (185 | ) | | | (17 | ) | |
Net Increase in Class A Shares Outstanding | | | 34 | | | | 12 | | |
Class L: | |
Shares Issued on Distributions Reinvested | | | 4 | | | | 4 | | |
Shares Redeemed | | | (6 | ) | | | (3 | ) | |
Net Increase (Decrease) in Class L Shares Outstanding | | | (2 | ) | | | 1 | | |
Class C: | |
Shares Subscribed | | | 2 | | | | 4 | | |
Shares Issued on Distributions Reinvested | | | 1 | | | | 1 | | |
Shares Redeemed | | | (27 | ) | | | (— | @@) | |
Net Increase (Decrease) in Class C Shares Outstanding | | | (24 | ) | | | 5 | | |
@ Amount is less than $500.
@@ Amount is less than 500 shares.
The following information was previously reported in the December 31, 2017 financial statements. The distribution information for the year ended December 31, 2017 presented on the Statements of Changes in Net Assets is presented for comparative purposes to the December 31, 2018 financial statements, which conform to the SEC Final Rule on Disclosure Update and Simplification which was effective November 5, 2018.
* Dividends and Distributions to Shareholders for the year ended December 31, 2017 were as follows:
Class I: | |
Net Investment Income | | $ | (1,274 | ) | |
Class A: | |
Net Investment Income | | $ | (58 | ) | |
Class L: | |
Net Investment Income | | $ | (42 | ) | |
Class C: | |
Net Investment Income | | $ | (13 | ) | |
Class IS: | |
Net Investment Income | | $ | (44 | ) | |
† Distributions in Excess of Net Investment Income for the year ended December 31, 2017 was $(62).
The accompanying notes are an integral part of the financial statements.
17
Morgan Stanley Institutional Fund, Inc.
Annual Report — December 31, 2018
Financial Highlights
Emerging Markets Fixed Income Opportunities Portfolio
| | | Class I | |
| | | Year Ended December 31, | |
Selected Per Share Data and Ratios | | 2018 | | 2017 | | 2016(1) | | 2015 | | 2014 | |
Net Asset Value, Beginning of Period | | $ | 9.68 | | | $ | 9.07 | | | $ | 8.53 | | | $ | 9.22 | | | $ | 9.40 | | |
Income (Loss) from Investment Operations: | |
Net Investment Income(2) | | | 0.57 | | | | 0.65 | | | | 0.67 | | | | 0.52 | | | | 0.51 | | |
Net Realized and Unrealized Gain (Loss) | | | (1.24 | ) | | | 0.52 | | | | 0.42 | | | | (0.68 | ) | | | (0.19 | ) | |
Total from Investment Operations | | | (0.67 | ) | | | 1.17 | | | | 1.09 | | | | (0.16 | ) | | | 0.32 | | |
Distributions from and/or in Excess of: | |
Net Investment Income | | | (0.49 | ) | | | (0.56 | ) | | | (0.55 | ) | | | (0.53 | ) | | | (0.50 | ) | |
Redemption Fees | | | 0.00 | (3) | | | 0.00 | (3) | | | 0.00 | (3) | | | 0.00 | (3) | | | — | | |
Net Asset Value, End of Period | | $ | 8.52 | | | $ | 9.68 | | | $ | 9.07 | | | $ | 8.53 | | | $ | 9.22 | | |
Total Return(4) | | | (6.93 | )% | | | 12.94 | % | | | 12.80 | % | | | (1.83 | )% | | | 3.38 | % | |
Ratios and Supplemental Data: | |
Net Assets, End of Period (Thousands) | | $ | 32,575 | | | $ | 22,219 | | | $ | 20,332 | | | $ | 19,219 | | | $ | 18,492 | | |
Ratio of Expenses to Average Net Assets(7) | | | 0.84 | %(5) | | | 0.83 | %(5) | | | 0.84 | %(5) | | | 0.83 | %(5) | | | 0.83 | %(5) | |
Ratio of Net Investment Income to Average Net Assets(7) | | | 6.24 | %(5) | | | 6.73 | %(5) | | | 7.32 | %(5) | | | 5.74 | %(5) | | | 5.23 | %(5) | |
Ratio of Rebate from Morgan Stanley Affiliates to Average Net Assets | | | 0.01 | % | | | 0.01 | % | | | 0.00 | %(6) | | | 0.00 | %(6) | | | 0.00 | %(6) | |
Portfolio Turnover Rate | | | 47 | % | | | 77 | % | | | 116 | % | | | 111 | % | | | 95 | % | |
(7) Supplemental Information on the Ratios to Average Net Assets: | |
Ratios Before Expense Limitation: | |
Expenses to Average Net Assets | | | 1.98 | % | | | 2.01 | % | | | 2.03 | % | | | 1.82 | % | | | 1.91 | % | |
Net Investment Income to Average Net Assets | | | 5.10 | % | | | 5.55 | % | | | 6.13 | % | | | 4.75 | % | | | 4.15 | % | |
(1) Reflects prior period Custodian out-of-pocket expenses that were reimbursed in September 2016. The amount of the reimbursement was immaterial on a per share basis and did not impact the total return of Class I shares. The Ratio of Expenses to Average Net Assets and the Ratio of Net Investment Income to Average Net Assets would be unchanged as the reimbursement of Custodian fees was offset against expense waivers/reimbursements with no impact to net expenses or net investment income.
(2) Per share amount is based on average shares outstanding.
(3) Amount is less than $0.005 per share.
(4) Calculated based on the net asset value as of the last business day of the period.
(5) The Ratios of Expenses and Net Investment Income reflect the rebate of certain Fund expenses in connection with the investments in Morgan Stanley affiliates during the period. The effect of the rebate on the ratios is disclosed in the above table as "Ratio of Rebate from Morgan Stanley Affiliates to Average Net Assets."
(6) Amount is less than 0.005%.
The accompanying notes are an integral part of the financial statements.
18
Morgan Stanley Institutional Fund, Inc.
Annual Report — December 31, 2018
Financial Highlights
Emerging Markets Fixed Income Opportunities Portfolio
| | | Class A | |
| | | Year Ended December 31, | |
Selected Per Share Data and Ratios | | 2018 | | 2017 | | 2016(1) | | 2015 | | 2014 | |
Net Asset Value, Beginning of Period | | $ | 9.67 | | | $ | 9.06 | | | $ | 8.52 | | | $ | 9.21 | | | $ | 9.40 | | |
Income (Loss) from Investment Operations: | |
Net Investment Income(2) | | | 0.52 | | | | 0.61 | | | | 0.64 | | | | 0.50 | | | | 0.47 | | |
Net Realized and Unrealized Gain (Loss) | | | (1.22 | ) | | | 0.52 | | | | 0.42 | | | | (0.69 | ) | | | (0.19 | ) | |
Total from Investment Operations | | | (0.70 | ) | | | 1.13 | | | | 1.06 | | | | (0.19 | ) | | | 0.28 | | |
Distributions from and/or in Excess of: | |
Net Investment Income | | | (0.46 | ) | | | (0.52 | ) | | | (0.52 | ) | | | (0.50 | ) | | | (0.47 | ) | |
Redemption Fees | | | 0.00 | (3) | | | 0.00 | (3) | | | 0.00 | (3) | | | 0.00 | (3) | | | — | | |
Net Asset Value, End of Period | | $ | 8.51 | | | $ | 9.67 | | | $ | 9.06 | | | $ | 8.52 | | | $ | 9.21 | | |
Total Return(4) | | | (7.29 | )% | | | 12.54 | % | | | 12.53 | % | | | (2.14 | )% | | | 2.90 | % | |
Ratios and Supplemental Data: | |
Net Assets, End of Period (Thousands) | | $ | 1,306 | | | $ | 1,150 | | | $ | 972 | | | $ | 1,103 | | | $ | 291 | | |
Ratio of Expenses to Average Net Assets(7) | | | 1.19 | %(5) | | | 1.19 | %(5) | | | 1.09 | %(5) | | | 1.20 | %(5) | | | 1.20 | %(5) | |
Ratio of Net Investment Income to Average Net Assets(7) | | | 5.74 | %(5) | | | 6.37 | %(5) | | | 7.03 | %(5) | | | 5.61 | %(5) | | | 4.88 | %(5) | |
Ratio of Rebate from Morgan Stanley Affiliates to Average Net Assets | | | 0.01 | % | | | 0.01 | % | | | 0.00 | %(6) | | | 0.00 | %(6) | | | 0.00 | %(6) | |
Portfolio Turnover Rate | | | 47 | % | | | 77 | % | | | 116 | % | | | 111 | % | | | 95 | % | |
(7) Supplemental Information on the Ratios to Average Net Assets: | |
Ratios Before Expense Limitation: | |
Expenses to Average Net Assets | | | 2.49 | % | | | 2.51 | % | | | 2.28 | % | | | 2.49 | % | | | 2.85 | % | |
Net Investment Income to Average Net Assets | | | 4.44 | % | | | 5.05 | % | | | 5.84 | % | | | 4.32 | % | | | 3.23 | % | |
(1) Reflects prior period Custodian out-of-pocket expenses that were reimbursed in September 2016. The amount of the reimbursement was immaterial on a per share basis and did not impact the total return of Class A shares. The Ratio of Expenses to Average Net Assets and the Ratio of Net Investment Income to Average Net Assets would be unchanged as the reimbursement of Custodian fees was offset against expense waivers/reimbursements with no impact to net expenses or net investment income.
(2) Per share amount is based on average shares outstanding.
(3) Amount is less than $0.005 per share.
(4) Calculated based on the net asset value which does not reflect sales charges, if applicable, as of the last business day of the period.
(5) The Ratios of Expenses and Net Investment Income reflect the rebate of certain Fund expenses in connection with the investments in Morgan Stanley affiliates during the period. The effect of the rebate on the ratios is disclosed in the above table as "Ratio of Rebate from Morgan Stanley Affiliates to Average Net Assets."
(6) Amount is less than 0.005%.
The accompanying notes are an integral part of the financial statements.
19
Morgan Stanley Institutional Fund, Inc.
Annual Report — December 31, 2018
Financial Highlights
Emerging Markets Fixed Income Opportunities Portfolio
| | | Class L | |
| | | Year Ended December 31, | |
Selected Per Share Data and Ratios | | 2018 | | 2017 | | 2016(1) | | 2015 | | 2014 | |
Net Asset Value, Beginning of Period | | $ | 9.65 | | | $ | 9.05 | | | $ | 8.51 | | | $ | 9.22 | | | $ | 9.39 | | |
Income (Loss) from Investment Operations: | |
Net Investment Income(2) | | | 0.50 | | | | 0.59 | | | | 0.62 | | | | 0.49 | | | | 0.45 | | |
Net Realized and Unrealized Gain (Loss) | | | (1.22 | ) | | | 0.51 | | | | 0.41 | | | | (0.72 | ) | | | (0.18 | ) | |
Total from Investment Operations | | | (0.72 | ) | | | 1.10 | | | | 1.03 | | | | (0.23 | ) | | | 0.27 | | |
Distributions from and/or in Excess of: | |
Net Investment Income | | | (0.43 | ) | | | (0.50 | ) | | | (0.49 | ) | | | (0.48 | ) | | | (0.44 | ) | |
Redemption Fees | | | 0.00 | (3) | | | 0.00 | (3) | | | 0.00 | (3) | | | 0.00 | (3) | | | — | | |
Net Asset Value, End of Period | | $ | 8.50 | | | $ | 9.65 | | | $ | 9.05 | | | $ | 8.51 | | | $ | 9.22 | | |
Total Return(4) | | | (7.52 | )% | | | 12.28 | % | | | 12.15 | % | | | (2.53 | )% | | | 2.85 | % | |
Ratios and Supplemental Data: | |
Net Assets, End of Period (Thousands) | | $ | 727 | | | $ | 842 | | | $ | 777 | | | $ | 735 | | | $ | 98 | | |
Ratio of Expenses to Average Net Assets(7) | | | 1.44 | %(5) | | | 1.44 | %(5) | | | 1.45 | %(5) | | | 1.45 | %(5) | | | 1.45 | %(5) | |
Ratio of Net Investment Income to Average Net Assets(7) | | | 5.51 | %(5) | | | 6.11 | %(5) | | | 6.70 | %(5) | | | 5.44 | %(5) | | | 4.62 | %(5) | |
Ratio of Rebate from Morgan Stanley Affiliates to Average Net Assets | | | 0.01 | % | | | 0.01 | % | | | 0.00 | %(6) | | | 0.00 | %(6) | | | 0.00 | %(6) | |
Portfolio Turnover Rate | | | 47 | % | | | 77 | % | | | 116 | % | | | 111 | % | | | 95 | % | |
(7) Supplemental Information on the Ratios to Average Net Assets: | |
Ratios Before Expense Limitation: | |
Expenses to Average Net Assets | | | 2.78 | % | | | 2.77 | % | | | 2.78 | % | | | 2.94 | % | | | 4.10 | % | |
Net Investment Income to Average Net Assets | | | 4.17 | % | | | 4.78 | % | | | 5.37 | % | | | 3.95 | % | | | 1.97 | % | |
(1) Reflects prior period Custodian out-of-pocket expenses that were reimbursed in September 2016. The amount of the reimbursement was immaterial on a per share basis and did not impact the total return of Class L shares. The Ratio of Expenses to Average Net Assets and the Ratio of Net Investment Income to Average Net Assets would be unchanged as the reimbursement of Custodian fees was offset against expense waivers/reimbursements with no impact to net expenses or net investment income.
(2) Per share amount is based on average shares outstanding.
(3) Amount is less than $0.005 per share.
(4) Calculated based on the net asset value as of the last business day of the period.
(5) The Ratios of Expenses and Net Investment Income reflect the rebate of certain Fund expenses in connection with the investments in Morgan Stanley affiliates during the period. The effect of the rebate on the ratios is disclosed in the above table as "Ratio of Rebate from Morgan Stanley Affiliates to Average Net Assets."
(6) Amount is less than 0.005%.
The accompanying notes are an integral part of the financial statements.
20
Morgan Stanley Institutional Fund, Inc.
Annual Report — December 31, 2018
Financial Highlights
Emerging Markets Fixed Income Opportunities Portfolio
| | | Class C | |
| | | Year Ended December 31, | | Period from
April 30, 2015(2) to | |
Selected Per Share Data and Ratios | | 2018 | | 2017 | | 2016(1) | | December 31, 2015 | |
Net Asset Value, Beginning of Period | | $ | 9.65 | | | $ | 9.05 | | | $ | 8.52 | | | $ | 9.52 | | |
Income (Loss) from Investment Operations: | |
Net Investment Income(3) | | | 0.46 | | | | 0.50 | | | | 0.54 | | | | 0.32 | | |
Net Realized and Unrealized Gain (Loss) | | | (1.22 | ) | | | 0.55 | | | | 0.43 | | | | (0.97 | ) | |
Total from Investment Operations | | | (0.76 | ) | | | 1.05 | | | | 0.97 | | | | (0.65 | ) | |
Distributions from and/or in Excess of: | |
Net Investment Income | | | (0.39 | ) | | | (0.45 | ) | | | (0.44 | ) | | | (0.35 | ) | |
Redemption Fees | | | 0.00 | (4) | | | 0.00 | (4) | | | 0.00 | (4) | | | 0.00 | (4) | |
Net Asset Value, End of Period | | $ | 8.50 | | | $ | 9.65 | | | $ | 9.05 | | | $ | 8.52 | | |
Total Return(5) | | | (7.98 | )% | | | 11.76 | % | | | 11.60 | % | | | (6.95 | )%(8) | |
Ratios and Supplemental Data: | |
Net Assets, End of Period (Thousands) | | $ | 48 | | | $ | 284 | | | $ | 225 | | | $ | 202 | | |
Ratio of Expenses to Average Net Assets(10) | | | 1.94 | %(6) | | | 1.94 | %(6) | | | 1.95 | %(6) | | | 1.95 | %(6)(9) | |
Ratio of Net Investment Income to Average Net Assets(10) | | | 5.09 | %(6) | | | 5.18 | %(6) | | | 5.87 | %(6) | | | 5.34 | %(6)(9) | |
Ratio of Rebate from Morgan Stanley Affiliates to Average Net Assets | | | 0.01 | % | | | 0.01 | % | | | 0.00 | %(7) | | | 0.00 | %(7)(9) | |
Portfolio Turnover Rate | | | 47 | % | | | 77 | % | | | 116 | % | | | 111 | % | |
(10) Supplemental Information on the Ratios to Average Net Assets: | |
Ratios Before Expense Limitation: | |
Expenses to Average Net Assets | | | 3.79 | % | | | 3.84 | % | | | 3.97 | % | | | 6.28 | %(9) | |
Net Investment Income to Average Net Assets | | | 3.24 | % | | | 3.28 | % | | | 3.85 | % | | | 1.01 | %(9) | |
(1) Reflects prior period Custodian out-of-pocket expenses that were reimbursed in September 2016. The amount of the reimbursement was immaterial on a per share basis and did not impact the total return of Class C shares. The Ratio of Expenses to Average Net Assets and the Ratio of Net Investment Income to Average Net Assets would be unchanged as the reimbursement of Custodian fees was offset against expense waivers/reimbursements with no impact to net expenses or net investment income.
(2) Commencement of Offering.
(3) Per share amount is based on average shares outstanding.
(4) Amount is less than $0.005 per share.
(5) Calculated based on the net asset value which does not reflect sales charges, if applicable, as of the last business day of the period.
(6) The Ratios of Expenses and Net Investment Income reflect the rebate of certain Fund expenses in connection with the investments in Morgan Stanley affiliates during the period. The effect of the rebate on the ratios is disclosed in the above table as "Ratio of Rebate from Morgan Stanley Affiliates to Average Net Assets."
(7) Amount is less than 0.005%.
(8) Not annualized.
(9) Annualized.
The accompanying notes are an integral part of the financial statements.
21
Morgan Stanley Institutional Fund, Inc.
Annual Report — December 31, 2018
Financial Highlights
Emerging Markets Fixed Income Opportunities Portfolio
| | | Class IS | |
| | | Year Ended December 31, | |
Selected Per Share Data and Ratios | | 2018 | | 2017 | | 2016(1) | | 2015 | | 2014 | |
Net Asset Value, Beginning of Period | | $ | 9.68 | | | $ | 9.07 | | | $ | 8.53 | | | $ | 9.22 | | | $ | 9.40 | | |
Income (Loss) from Investment Operations: | |
Net Investment Income(2) | | | 0.56 | | | | 0.65 | | | | 0.67 | | | | 0.50 | | | | 0.51 | | |
Net Realized and Unrealized Gain (Loss) | | | (1.23 | ) | | | 0.52 | | | | 0.42 | | | | (0.66 | ) | | | (0.19 | ) | |
Total from Investment Operations | | | (0.67 | ) | | | 1.17 | | | | 1.09 | | | | (0.16 | ) | | | 0.32 | | |
Distributions from and/or in Excess of: | |
Net Investment Income | | | (0.49 | ) | | | (0.56 | ) | | | (0.55 | ) | | | (0.53 | ) | | | (0.50 | ) | |
Redemption Fees | | | 0.00 | (3) | | | 0.00 | (3) | | | 0.00 | (3) | | | 0.00 | (3) | | | — | | |
Net Asset Value, End of Period | | $ | 8.52 | | | $ | 9.68 | | | $ | 9.07 | | | $ | 8.53 | | | $ | 9.22 | | |
Total Return(4) | | | (6.91 | )% | | | 12.95 | % | | | 12.81 | % | | | (1.83 | )% | | | 3.39 | % | |
Ratios and Supplemental Data: | |
Net Assets, End of Period (Thousands) | | $ | 672 | | | $ | 763 | | | $ | 716 | | | $ | 673 | | | $ | 10 | | |
Ratio of Expenses to Average Net Assets(7) | | | 0.81 | %(5) | | | 0.81 | %(5) | | | 0.82 | %(5) | | | 0.82 | %(5) | | | 0.82 | %(5) | |
Ratio of Net Investment Income to Average Net Assets(7) | | | 6.15 | %(5) | | | 6.74 | %(5) | | | 7.33 | %(5) | | | 5.45 | %(5) | | | 5.25 | %(5) | |
Ratio of Rebate from Morgan Stanley Affiliates to Average Net Assets | | | 0.01 | % | | | 0.01 | % | | | 0.00 | %(6) | | | 0.00 | %(6) | | | 0.00 | %(6) | |
Portfolio Turnover Rate | | | 47 | % | | | 77 | % | | | 116 | % | | | 111 | % | | | 95 | % | |
(7) Supplemental Information on the Ratios to Average Net Assets: | |
Ratios Before Expense Limitation: | |
Expenses to Average Net Assets | | | 2.22 | % | | | 2.25 | % | | | 2.25 | % | | | 1.86 | % | | | 21.21 | % | |
Net Investment Income (Loss) to Average Net Assets | | | 4.74 | % | | | 5.30 | % | | | 5.90 | % | | | 4.41 | % | | | (15.14 | )% | |
(1) Reflects prior period Custodian out-of-pocket expenses that were reimbursed in September 2016. The amount of the reimbursement was immaterial on a per share basis and did not impact the total return of Class IS shares. The Ratio of Expenses to Average Net Assets and the Ratio of Net Investment Income to Average Net Assets would be unchanged as the reimbursement of Custodian fees was offset against expense waivers/reimbursements with no impact to net expenses or net investment income.
(2) Per share amount is based on average shares outstanding.
(3) Amount is less than $0.005 per share.
(4) Calculated based on the net asset value as of the last business day of the period.
(5) The Ratios of Expenses and Net Investment Income reflect the rebate of certain Fund expenses in connection with the investments in Morgan Stanley affiliates during the period. The effect of the rebate on the ratios is disclosed in the above table as "Ratio of Rebate from Morgan Stanley Affiliates to Average Net Assets."
(6) Amount is less than 0.005%.
The accompanying notes are an integral part of the financial statements.
22
Morgan Stanley Institutional Fund, Inc.
Annual Report — December 31, 2018
Notes to Financial Statements
Morgan Stanley Institutional Fund, Inc. (the "Company") is registered under the Investment Company Act of 1940, as amended (the "Act"), as an open-end management investment company. The Company is comprised of thirty separate, active, diversified and non-diversified funds (individually referred to as a "Fund", collectively as the "Funds"). The Company applies investment company accounting and reporting guidance.
The accompanying financial statements relate to the Emerging Markets Fixed Income Opportunities Portfolio. The Fund seeks high total return.
The Fund offers five classes of shares — Class I, Class A, Class L, Class C and Class IS. On April 30, 2015, the Fund suspended offering of Class L shares. Existing Class L shareholders may invest through reinvestment of dividends and distributions.
A. Significant Accounting Policies: The following significant accounting policies are in conformity with U.S. generally accepted accounting principles ("GAAP"). Such policies are consistently followed by the Company in the preparation of its financial statements. GAAP may require management to make estimates and assumptions that affect the reported amounts and disclosures in the financial statements. Actual results may differ from those estimates.
In August 2018, the Financial Accounting Standards Board ("FASB") issued Accounting Standards Update ("ASU") 2018-13, Fair Value Measurement (Topic 820) — Disclosures Framework — Changes to Disclosure Requirements of Fair Value Measurement ("ASU 2018-13") which introduces new fair value disclosure requirements as well as eliminates and modifies certain existing fair value disclosure requirements. ASU 2018-13 would be effective for fiscal years beginning after December 15, 2019 and for interim periods within those fiscal years; however, management has elected to early adopt ASU 2018-13 effective with the current reporting period as permitted by the standard. The impact of the Fund's adoption was limited to changes in the Fund's financial statement disclosures regarding fair value, primarily those disclosures related to transfers between levels of the fair value hierarchy and disclosure of the range and weighted average used to develop significant unobservable inputs for Level 3 fair value measurements, when applicable.
1. Security Valuation: (1) Certain portfolio securities may be valued by an outside pricing service/vendor approved by the Company's Board of Directors (the "Directors").
The pricing service/vendor may employ a pricing model that takes into account, among other things, bids, yield spreads and/or other market data and specific security characteristics. Alternatively, if a valuation is not available from an outside pricing service/vendor, and the security trades on an exchange, the security may be valued at its latest reported sale price (or at the exchange official closing price if such exchange reports an official closing price), prior to the time when assets are valued. If there are no sales on a given day and if there is no official exchange closing price for that day, the security is valued at the mean between the last reported bid and asked prices if such bid and asked prices are available in the relevant exchanges; (2) an equity portfolio security listed or traded on an exchange is valued at its latest reported sales price (or at the exchange official closing price if such exchange reports an official closing price), and if there were no sales on a given day and if there is no official exchange closing price for that day, the security is valued at the mean between the last reported bid and asked prices if such bid and asked prices are available on the relevant exchanges. Listed equity securities not traded on the valuation date with no reported bid and asked prices available on the exchange are valued at the mean between the current bid and asked prices obtained from one or more reputable brokers or dealers. In cases where a security is traded on more than one exchange, the security is valued on the exchange designated as the primary market; (3) all other equity portfolio securities for which over-the-counter ("OTC") market quotations are readily available are valued at the latest reported sales price (or at the market official closing price if such market reports an official closing price), and if there was no trading in the security on a given day and if there is no official closing price from relevant markets for that day, the security is valued at the mean between the last reported bid and asked prices if such bid and asked prices are available on the relevant markets. An unlisted equity security that does not trade on the valuation date and for which bid and asked prices from the relevant markets are unavailable is valued at the mean between the current bid and asked prices obtained from one or more reputable brokers or dealers; (4) futures are valued at the settlement price on the exchange on which they trade or, if a settlement price is unavailable, at the last sale price on the exchange; (5) when market quotations are not readily available, including circumstances under which Morgan Stanley Investment
23
Morgan Stanley Institutional Fund, Inc.
Annual Report — December 31, 2018
Notes to Financial Statements (cont'd)
Management Inc. (the "Adviser") determines that the closing price, last sale price or the mean between the last reported bid and asked prices are not reflective of a security's market value, portfolio securities are valued at their fair value as determined in good faith under procedures established by and under the general supervision of the Directors. Occasionally, developments affecting the closing prices of securities and other assets may occur between the times at which valuations of such securities are determined (that is, close of the foreign market on which the securities trade) and the close of business of the New York Stock Exchange ("NYSE"). If developments occur during such periods that are expected to materially affect the value of such securities, such valuations may be adjusted to reflect the estimated fair value of such securities as of the close of the NYSE, as determined in good faith by the Directors or by the Adviser using a pricing service and/or procedures approved by the Directors; (6) quotations of foreign portfolio securities, other assets and liabilities and forward contracts stated in foreign currency are translated into U.S. dollar equivalents at the prevailing market rates prior to the close of the NYSE; and (7) investments in mutual funds, including the Morgan Stanley Institutional Liquidity Funds, are valued at the net asset value ("NAV") as of the close of each business day.
The Directors have responsibility for determining in good faith the fair value of the investments, and the Directors may appoint others, such as the Company's Adviser or a valuation committee, to assist the Directors in determining fair value and to make the actual calculations pursuant to the fair valuation methodologies previously approved by the Directors. Under procedures approved by the Directors, the Company's Adviser has formed a Valuation Committee whose members are approved by the Directors. The Valuation Committee provides administration and oversight of the Company's valuation policies and procedures, which are reviewed at least annually by the Directors. These procedures allow the Company to utilize independent pricing services, quotations from securities and financial instrument dealers and other market sources to determine fair value.
2. Fair Value Measurement: FASB Accounting Standards CodificationTM ("ASC") 820, "Fair Value Measurement" ("ASC 820"), defines fair value as the value that the Fund would receive to sell an investment or pay to transfer a liability in a timely transaction with an
independent buyer in the principal market, or in the absence of a principal market, the most advantageous market for the investment or liability. ASC 820 establishes a three-tier hierarchy to distinguish between (1) inputs that reflect the assumptions market participants would use in valuing an asset or liability developed based on market data obtained from sources independent of the reporting entity (observable inputs) and (2) inputs that reflect the reporting entity's own assumptions about the assumptions market participants would use in valuing an asset or liability developed based on the best information available in the circumstances (unobservable inputs) and to establish classification of fair value measurements for disclosure purposes. Various inputs are used in determining the value of the Fund's investments. The inputs are summarized in the three broad levels listed below:
• Level 1 – unadjusted quoted prices in active markets for identical investments
• Level 2 – other significant observable inputs (including quoted prices for similar investments, interest rates, prepayment speeds, credit risk, etc.)
• Level 3 – significant unobservable inputs including the Fund's own assumptions in determining the fair value of investments. Factors considered in making this determination may include, but are not limited to, information obtained by contacting the issuer, analysts, or the appropriate stock exchange (for exchange-traded securities), analysis of the issuer's financial statements or other available documents and, if necessary, available information concerning other securities in similar circumstances
The inputs or methodology used for valuing securities are not necessarily an indication of the risk associated with investing in those securities and the determination of the significance of a particular input to the fair value measurement in its entirety requires judgment and considers factors specific to each security.
24
Morgan Stanley Institutional Fund, Inc.
Annual Report — December 31, 2018
Notes to Financial Statements (cont'd)
The following is a summary of the inputs used to value the Fund's investments as of December 31, 2018:
Investment Type | | Level 1
Unadjusted
quoted
prices
(000) | | Level 2
Other
significant
observable
inputs
(000) | | Level 3
Significant
unobservable
inputs
(000) | | Total
(000) | |
Assets: | |
Fixed Income Securities | |
Corporate Bonds | | $ | — | | | $ | 8,822 | | | $ | — | | | $ | 8,822 | | |
Sovereign | | | — | | | | 23,604 | | | | — | | | | 23,604 | | |
Total Fixed Income Securities | | | — | | | | 32,426 | | | | — | | | | 32,426 | | |
Warrant | | | — | | | | 1 | | | | — | | | | 1 | | |
Short-Term Investments | |
Investment Company | | | 1,580 | | | | — | | | | — | | | | 1,580 | | |
Sovereign | | | — | | | | 604 | | | | — | | | | 604 | | |
U.S. Treasury Security | | | — | | | | 30 | | | | — | | | | 30 | | |
Total Short-Term Investments | | | 1,580 | | | | 634 | | | | — | | | | 2,214 | | |
Foreign Currency Forward
Exchange Contracts | | | — | | | | 9 | | | | — | | | | 9 | | |
Total Assets | | | 1,580 | | | | 33,070 | | | | — | | | | 34,650 | | |
Liabilities: | |
Foreign Currency Forward
Exchange Contracts | | | — | | | | (42 | ) | | | — | | | | (42 | ) | |
Total | | $ | 1,580 | | | $ | 33,028 | | | $ | — | | | $ | 34,608 | | |
Transfers between investment levels may occur as the markets fluctuate and/or the availability of data used in an investment's valuation changes.
3. Foreign Currency Translation and Foreign Investments: The books and records of the Fund are maintained in U.S. dollars. Foreign currency amounts are translated into U.S. dollars as follows:
– investments, other assets and liabilities at the prevailing rate of exchange on the valuation date;
– investment transactions and investment income at the prevailing rates of exchange on the dates of such transactions.
Although the net assets of the Fund are presented at the foreign exchange rates and market values at the close of the period, the Fund does not isolate that portion of the results of operations arising as a result of changes in the foreign exchange rates from the fluctuations arising from changes in the market prices of securities held at period end. Similarly, the Fund does not isolate the effect of changes in foreign exchange rates from the fluctuations arising from changes in the market prices of securities sold during the period. Accordingly, realized and unrealized foreign currency gains (losses) on investments in securities are included in the reported net
realized and unrealized gains (losses) on investment transactions and balances. However, pursuant to U.S. federal income tax regulations, gains and losses from certain foreign currency transactions and the foreign currency portion of gains and losses realized on sales and maturities of foreign denominated debt securities are treated as ordinary income for U.S. federal income tax purposes.
Net realized gains (losses) on foreign currency transactions represent net foreign exchange gains (losses) from foreign currency forward exchange contracts, disposition of foreign currencies, currency gains (losses) realized between the trade and settlement dates on securities transactions, and the difference between the amount of investment income and foreign withholding taxes recorded on the Fund's books and the U.S. dollar equivalent amounts actually received or paid. Net unrealized currency gains (losses) from valuing foreign currency denominated assets and liabilities at period end exchange rates are reflected as a component of unrealized appreciation (depreciation) in the Statement of Assets and Liabilities. The change in unrealized currency gains (losses) on foreign currency translations for the period is reflected in the Statement of Operations.
Foreign security and currency transactions may involve certain considerations and risks not typically associated with those of U.S. dollar denominated transactions as a result of, among other factors, fluctuations of exchange rates in relation to the U.S. dollar, the possibility of lower levels of governmental supervision and regulation of foreign securities markets and the possibility of political or economic instability.
Governmental approval for foreign investments may be required in advance of making an investment under certain circumstances in some countries, and the extent of foreign investments in domestic companies may be subject to limitation in other countries. Foreign ownership limitations also may be imposed by the charters of individual companies to prevent, among other concerns, violations of foreign investment limitations. As a result, an additional class of shares (identified as "Foreign" in the Portfolio of Investments) may be created and offered for investment. The "local" and "foreign shares" market values may differ. In the absence of trading of the foreign shares in such markets, the
25
Morgan Stanley Institutional Fund, Inc.
Annual Report — December 31, 2018
Notes to Financial Statements (cont'd)
Fund values the foreign shares at the closing exchange price of the local shares.
4. Structured Investments: The Fund invested a portion of its assets in structured investments. A structured investment is a derivative security designed to offer a return linked to a particular underlying security, currency, commodity or market. Structured investments may come in various forms including notes (such as exchange-traded notes), warrants and options to purchase securities. The Fund will typically use structured investments to gain exposure to a permitted underlying security, currency, commodity or market when direct access to a market is limited or inefficient from a tax or cost standpoint. There can be no assurance that structured investments will trade at the same price or have the same value as the underlying security, currency, commodity or market. Investments in structured investments involve risks including issuer risk, counterparty risk and market risk. Holders of structured investments bear risks of the underlying investment and are subject to issuer or counterparty risk because the Fund is relying on the creditworthiness of such issuer or counterparty and has no rights with respect to the underlying investment. Certain structured investments may be thinly traded or have a limited trading market and may have the effect of increasing the Fund's illiquidity to the extent that the Fund, at a particular time, may be unable to find qualified buyers for these securities.
5. Derivatives: The Fund may, but is not required to, use derivative instruments for a variety of purposes, including hedging, risk management, portfolio management or to earn income. Derivatives are financial instruments whose value is based, in part, on the value of an underlying asset, interest rate, index or financial instrument. Prevailing interest rates and volatility levels, among other things, also affect the value of derivative instruments. A derivative instrument often has risks similar to its underlying asset and may have additional risks, including imperfect correlation between the value of the derivative and the underlying asset, risks of default by the counterparty to certain transactions, magnification of losses incurred due to changes in the market value of the securities, instruments, indices or interest rates to which the derivative instrument relates, risks that the transactions may not be liquid and risks arising from margin requirements. The use of derivatives involves risks that are different from, and possibly greater than, the risks
associated with other portfolio investments. Derivatives may involve the use of highly specialized instruments that require investment techniques and risk analyses different from those associated with other portfolio investments. All of the Fund's holdings, including derivative instruments, are marked-to-market each day with the change in value reflected in unrealized appreciation (depreciation). Upon disposition, a realized gain or loss is recognized.
Certain derivative transactions may give rise to a form of leverage. Leverage magnifies the potential for gain and the risk of loss. Leverage associated with derivative transactions may cause the Fund to liquidate portfolio positions when it may not be advantageous to do so to satisfy its obligations or to meet earmarking or segregation requirements, pursuant to applicable Securities and Exchange Commission ("SEC") rules and regulations, or may cause the Fund to be more volatile than if the Fund had not been leveraged. Although the Adviser seeks to use derivatives to further the Fund's investment objectives, there is no assurance that the use of derivatives will achieve this result.
Following is a description of the derivative instruments and techniques that the Fund used during the period and their associated risks:
Foreign Currency Forward Exchange Contracts: In connection with its investments in foreign securities, the Fund also entered into contracts with banks, brokers or dealers to purchase or sell securities or foreign currencies at a future date. A foreign currency forward exchange contract ("currency contract") is a negotiated agreement between the contracting parties to exchange a specified amount of currency at a specified future time at a specified rate. The rate can be higher or lower than the spot rate between the currencies that are the subject of the contract. Currency contracts may be used to protect against uncertainty in the level of future foreign currency exchange rates or to gain or modify exposure to a particular currency. To the extent hedged by the use of currency contracts, the precise matching of the currency contract amounts and the value of the securities involved will not generally be possible because the future value of such securities in foreign currencies will change as a consequence of market movements in the value of those securities between the date on which the contract is entered into and the date it matures. Furthermore, such transactions may reduce or preclude
26
Morgan Stanley Institutional Fund, Inc.
Annual Report — December 31, 2018
Notes to Financial Statements (cont'd)
the opportunity for gain if the value of the currency should move in the direction opposite to the position taken. There is additional risk to the extent that currency contracts create exposure to currencies in which the Fund's securities are not denominated. Unanticipated changes in currency prices may result in poorer overall performance for the Fund than if it had not entered into such contracts. The use of currency contracts involves the risk of loss from the insolvency or bankruptcy of the counterparty to the contract or the failure of the counterparty to make payments or otherwise comply with the terms of the contract. A currency contract is marked-to-market daily and the change in market value is recorded by the Fund as unrealized gain or loss. The Fund records realized gains (losses) when the currency contract is closed equal to the difference between the value of the currency contract at the time it was opened and the value at the time it was closed.
Futures: A futures contract is a standardized, exchange-traded agreement to buy or sell a specific quantity of an underlying asset, reference rate or index at a specific price at a specific future time. The value of a futures contract tends to increase and decrease in tandem with the value of the underlying instrument. Depending on the terms of the particular contract, futures contracts are settled through either physical delivery of the underlying instrument on the settlement date or by payment of a cash settlement amount on the settlement date. During the period the futures contract is open, payments are received from or made to the broker based upon changes in the value of the contract (the variation margin). A decision as to whether, when and how to use futures contracts involves the exercise of skill and judgment and even a well-conceived futures transaction may be unsuccessful because of market behavior or unexpected events. In addition to the derivatives risks discussed above, the prices of futures contracts can be highly volatile, using futures contracts can lower total return and the potential loss from futures contracts can exceed the Fund's initial investment in such contracts. No assurance can be given that a liquid market will exist for any particular futures contract at any particular time. There is also the risk of loss by the Fund of margin deposits in the event of bankruptcy of a broker with which the Fund has open positions in the futures contract.
As of December 31, 2018, the Fund did not have any open futures contracts.
FASB ASC 815, "Derivatives and Hedging" ("ASC 815"), is intended to improve financial reporting about derivative instruments by requiring enhanced disclosures to enable investors to better understand how and why the Fund uses derivative instruments, how these derivative instruments are accounted for and their effects on the Fund's financial position and results of operations.
The following tables set forth the fair value of the Fund's derivative contracts by primary risk exposure as of December 31, 2018:
| | | Asset Derivatives
Statement of Assets and
Liabilities Location | | Primary Risk
Exposure | | Value
(000) | |
Foreign Currency
Forward Exchange
Contracts | | Unrealized Appreciation on
Foreign Currency Forward
Exchange Contracts | |
Currency Risk | | $ | 9 | | |
| | | Liability Derivatives
Statement of Assets and
Liabilities Location | | Primary Risk
Exposure | | Value
(000) | |
Foreign Currency
Forward Exchange
Contracts | | Unrealized Depreciation on
Foreign Currency Forward
Exchange Contracts | |
Currency Risk | | $ | (42 | ) | |
The following tables set forth by primary risk exposure the Fund's realized gains (losses) and change in unrealized appreciation (depreciation) by type of derivative contract for the year ended December 31, 2018 in accordance with ASC 815:
Realized Gain (Loss) | |
Primary Risk Exposure | | Derivative Type | | Value
(000) | |
Currency Risk | | Foreign Currency Forward
Exchange Contracts | | $ | 8 | | |
Interest Rate Risk | | Futures Contracts | | | (2 | ) | |
Total | | | | $ | 6 | | |
Change in Unrealized Appreciation (Depreciation) | |
Primary Risk Exposure | | Derivative Type | | Value
(000) | |
Currency Risk | | Foreign Currency Forward
Exchange Contracts | | $ | (53 | ) | |
Interest Rate Risk | | Futures Contracts | | | (2 | ) | |
Total | | | | $ | (55 | ) | |
At December 31, 2018, the Fund's derivative assets and liabilities are as follows:
Gross Amounts of Assets and Liabilities
Presented in the Statement of Assets and Liabilities | |
Derivatives(a) | | Assets(a)
(000) | | Liabilities(a)
(000) | |
Foreign Currency Forward Exchange Contracts | | $ | 9 | | | $ | 42 | | |
(a) Absent an event of default or early termination, OTC derivative assets and liabilities are presented gross and not offset in the Statement of Assets and Liabilities.
27
Morgan Stanley Institutional Fund, Inc.
Annual Report — December 31, 2018
Notes to Financial Statements (cont'd)
The Fund typically enters into International Swaps and Derivatives Association, Inc. Master Agreements ("ISDA Master Agreements") or similar master agreements (collectively, "Master Agreements") with its contract counterparties for certain OTC derivatives in order to, among other things, reduce its credit risk to counterparties. ISDA Master Agreements include provisions for general obligations, representations, collateral and events of default or termination. Under an ISDA Master Agreement, the Fund typically may offset with the counterparty certain OTC derivative financial instruments' payables and/or receivables with collateral held and/or posted and create one single net payment (close-out netting) in the event of default, termination and/or potential deterioration in the credit quality of the counterparty. Various Master Agreements govern the terms of certain transactions with counterparties, including transactions such as swap, forward, repurchase and reverse repurchase agreements. These Master Agreements typically attempt to reduce the counterparty risk associated with such transactions by specifying credit protection mechanisms and providing standardization that improves legal certainty. Cross-termination provisions under Master Agreements typically provide that a default in connection with one transaction between the Fund and a counterparty gives the non-defaulting party the right to terminate any other transactions in place with the defaulting party to create one single net payment due to/due from the defaulting party and may be a feature in certain Master Agreements. In the event the Fund exercises its right to terminate a Master Agreement after a counterparty experiences a termination event as defined in the Master Agreement, the return of collateral with market value in excess of the Fund's net liability may be delayed or denied.
The following tables present derivative financial instruments that are subject to enforceable netting arrangements as of December 31, 2018:
Gross Amounts Not Offset in the Statement of Assets and Liabilities | |
| Counterparty | | Gross Asset
Derivatives
Presented in the
Statement of
Assets and
Liabilities
(000) | | Financial
Instrument
(000) | | Collateral
Received
(000) | | Net
Amount
(not less
than $0)
(000) | |
JPMorgan Chase Bank NA | | $ | 9 | | | $ | (9 | ) | | $ | — | | | $ | 0 | | |
Gross Amounts Not Offset in the Statement of Assets and Liabilities | |
Counterparty | | Gross Liability
Derivatives
Presented in the
Statement of
Assets and
Liabilities
(000) | | Financial
Instrument
(000) | | Collateral
Pledged
(000) | | Net
Amount
(not less
than $0)
(000) | |
Goldman Sachs International | | $ | 23 | | | $ | — | | | $ | — | | | $ | 23 | | |
JPMorgan Chase Bank NA | | | 19 | | | | (9 | ) | | | — | | | | 10 | | |
Total | | $ | 42 | | | $ | (9 | ) | | $ | — | | | $ | 33 | | |
For the year ended December 31, 2018, the approximate average monthly amount outstanding for each derivative type is as follows:
Foreign Currency Forward Exchange Contracts: | |
Average monthly principal amount | | $ | 4,648,000 | | |
Futures Contracts: | |
Average monthly notional value | | $ | 111,000 | | |
6. Redemption Fees: The Fund will assess a 2% redemption fee on Class I shares, Class A shares, Class L shares, Class C shares and Class IS shares, which is paid directly to the Fund, for shares redeemed or exchanged within thirty days of purchase, subject to certain exceptions. The redemption fee is designed to protect the Fund and its remaining shareholders from the effects of short-term trading. These fees, if any, are included in the Statements of Changes in Net Assets.
7. Indemnifications: The Company enters into contracts that contain a variety of indemnifications. The Company's maximum exposure under these arrangements is unknown. However, the Company has not had prior claims or losses pursuant to these contracts and expects the risk of loss to be remote.
8. Dividends and Distributions to Shareholders: Dividends and distributions to shareholders are recorded on the ex-dividend date. Dividends from net investment income, if any, are declared and paid quarterly. Net realized capital gains, if any, are distributed at least annually.
9. Security Transactions, Income and Expenses: Security transactions are accounted for on the trade date (date the order to buy or sell is executed). Realized gains and losses on the sale of investment securities are determined on the specific identified cost method. Dividend income and other distributions are recorded on the ex-dividend date. Interest income is recognized on the accrual basis except where collection is in doubt. Discounts are
28
Morgan Stanley Institutional Fund, Inc.
Annual Report — December 31, 2018
Notes to Financial Statements (cont'd)
accreted and premiums are amortized over the life of the respective securities. Most expenses of the Company can be directly attributed to a particular Fund. Expenses which cannot be directly attributed are apportioned among the Funds based upon relative net assets or other appropriate methods. Income, expenses (other than class specific expenses — distribution and shareholder services, transfer agency and sub transfer agency fees) and realized and unrealized gains or losses are allocated to each class of shares based upon their relative net assets.
B. Advisory Fees: The Adviser, a wholly-owned subsidiary of Morgan Stanley, provides the Fund with advisory services under the terms of an Investment Advisory Agreement, paid quarterly, at the annual rate based on the daily net assets as follows:
First $500
million | | Next $500
million | | Over $1
billion | |
| | 0.75 | % | | | 0.70 | % | | | 0.65 | % | |
For the year ended December 31, 2018, the advisory fee rate (net of waiver/rebate) was equivalent to an annual effective rate of 0.00% of the Fund's average daily net assets.
The Adviser has agreed to reduce its advisory fee and/or reimburse the Fund so that total annual portfolio operating expenses, excluding certain investment related expenses, taxes, interest and other extraordinary expenses (including litigation), will not exceed 0.85% for Class I shares, 1.20% for Class A shares, 1.45% for Class L shares, 1.95% for Class C shares and 0.82% for Class IS shares. The fee waivers and/or expense reimbursements will continue for at least one year from the date of the Fund's prospectus or until such time as the Directors act to discontinue all or a portion of such waivers and/or reimbursements when they deem such action is appropriate. For the year ended December 31, 2018, approximately $206,000 of advisory fees were waived and approximately $113,000 of other expenses were reimbursed by the Adviser pursuant to this arrangement.
C. Administration Fees: The Adviser also serves as Administrator to the Company and provides administrative services pursuant to an Administration Agreement for an annual fee, accrued daily and paid monthly, of 0.08% of the Fund's average daily net assets.
Under a Sub-Administration Agreement between the Administrator and State Street Bank and Trust Company ("State Street"), State Street provides certain administrative services to the Company. For such services, the Administrator
pays State Street a portion of the fee the Administrator receives from the Fund.
D. Distribution and Shareholder Services Fees: Morgan Stanley Distribution, Inc. ("MSDI" or the "Distributor"), a wholly-owned subsidiary of the Adviser and an indirect subsidiary of Morgan Stanley, serves as the Company's Distributor of Fund shares pursuant to a Distribution Agreement. The Company has adopted a Shareholder Services Plan with respect to Class A shares pursuant to Rule 12b-1 under the Act. Under the Shareholder Services Plan, the Fund pays the Distributor a shareholder services fee, accrued daily and paid monthly, at an annual rate of 0.25% of the Fund's average daily net assets attributable to Class A shares.
The Company has adopted a Distribution and Shareholder Services Plan with respect to Class L shares pursuant to Rule 12b-1 under the Act. Under the Distribution and Shareholder Services Plan, the Fund pays the Distributor a distribution fee, accrued daily and paid monthly, at an annual rate of 0.25% and a shareholder services fee, accrued daily and paid monthly, at an annual rate of 0.25% of the Fund's average daily net assets attributable to Class L shares.
The Company has adopted a Distribution and Shareholder Services Plan with respect to Class C shares pursuant to Rule 12b-1 under the Act. Under the Distribution and Shareholder Services Plan, the Fund pays the Distributor a distribution fee, accrued daily and paid monthly, at an annual rate of 0.75% and a shareholder services fee, accrued daily and paid monthly, at an annual rate of 0.25% of the Fund's average daily net assets attributable to Class C shares.
The distribution and shareholder services fees are used to support the expenses associated with servicing and maintaining accounts. The Distributor may compensate other parties for providing shareholder support services to investors who purchase Class A, Class L and Class C shares.
E. Dividend Disbursing and Transfer Agent: The Company's dividend disbursing and transfer agent is DST Asset Manager Solutions, Inc. ("DST"). Pursuant to a Transfer Agency Agreement, the Company pays DST a fee based on the number of classes, accounts and transactions relating to the Funds of the Company.
F. Custodian Fees: State Street (the "Custodian") also serves as Custodian for the Company in accordance with a Custodian Agreement. The Custodian holds cash, securities and other assets of the Company as required by the Act. Custody fees are payable monthly based on assets held in custody,
29
Morgan Stanley Institutional Fund, Inc.
Annual Report — December 31, 2018
Notes to Financial Statements (cont'd)
investment purchases and sales activity and account maintenance fees, plus reimbursement for certain out-of-pocket expenses.
G. Security Transactions and Transactions with Affiliates: For the year ended December 31, 2018, purchases and sales of investment securities for the Fund, other than long-term U.S. Government securities and short-term investments were approximately $24,088,000 and $12,001,000, respectively. There were no purchases and sales of long-term U.S. Government securities for the year ended December 31, 2018.
The Fund invests in the Institutional Class of the Morgan Stanley Institutional Liquidity Funds — Treasury Securities Portfolio (the "Liquidity Funds"), an open-end management investment company managed by the Adviser. Advisory fees paid by the Fund are reduced by an amount equal to its pro-rata share of the advisory and administration fees paid by the Fund due to its investment in the Liquidity Funds. For the year ended December 31, 2018, advisory fees paid were reduced by approximately $2,000 relating to the Fund's investment in the Liquidity Funds.
A summary of the Fund's transactions in shares of affiliated investments during the year ended December 31, 2018 is as follows:
Affiliated
Investment
Company | | Value
December 31,
2017
(000) | | Purchases
at Cost
(000) | | Proceeds
from Sales
(000) | | Dividend
Income
(000) | |
Liquidity Funds | | $ | 173 | | | $ | 26,190 | | | $ | 24,783 | | | $ | 23 | | |
Affiliated
Investment
Company (cont'd) | | Realized
Gain
(Loss)
(000) | | Change in
Unrealized
Appreciation
(Depreciation)
(000) | | Value
December 31,
2018
(000) | |
Liquidity Funds | | $ | — | | | $ | — | | | $ | 1,580 | | |
The Fund is permitted to purchase and sell securities ("cross-trade") from and to other Morgan Stanley funds as well as other funds and client accounts for which the Adviser or an affiliate of the Adviser serves as investment adviser, pursuant to procedures approved by the Directors in compliance with Rule 17a-7 under the Act (the "Rule"). Each cross-trade is executed at the current market price in compliance with provisions of the Rule. For the year ended December 31, 2018, the Fund did not engage in any cross-trade transactions.
The Fund has an unfunded Deferred Compensation Plan (the "Compensation Plan"), which allows each independent Director to defer payment of all, or a portion, of the fees he or she receives for serving on the Board of Directors. Each eligible
Director generally may elect to have the deferred amounts credited with a return equal to the total return on one or more of the Morgan Stanley funds that are offered as investment options under the Compensation Plan. Appreciation/depreciation and distributions received from these investments are recorded with an offsetting increase/decrease in the deferred compensation obligation and do not affect the NAV of the Fund.
H. Federal Income Taxes: It is the Fund's intention to continue to qualify as a regulated investment company and distribute all of its taxable and tax-exempt income. Accordingly, no provision for Federal income taxes is required in the financial statements.
The Fund may be subject to taxes imposed by countries in which it invests. Such taxes are generally based on income and/or capital gains earned or repatriated. Taxes are accrued based on net investment income, net realized gains and net unrealized appreciation as such income and/or gains are earned. Taxes may also be based on transactions in foreign currency and are accrued based on the value of investments denominated in such currency.
FASB ASC 740-10, "Income Taxes — Overall", sets forth a minimum threshold for financial statement recognition of the benefit of a tax position taken or expected to be taken in a tax return. Management has concluded there are no significant uncertain tax positions that would require recognition in the financial statements. If applicable, the Fund recognizes interest accrued related to unrecognized tax benefits in "Interest Expense" and penalties in "Other Expenses" in the Statement of Operations. The Fund files tax returns with the U.S. Internal Revenue Service, New York and various states. Generally, each of the tax years in the four-year period ended December 31, 2018 remains subject to examination by taxing authorities.
The tax character of distributions paid may differ from the character of distributions for GAAP purposes due to short-term capital gains being treated as ordinary income for tax purposes. The tax character of distributions paid during fiscal years 2018 and 2017 was as follows:
2018
Distributions
Paid From: | | 2017
Distributions
Paid From: | |
Ordinary
Income
(000) | | Long-Term
Capital Gain
(000) | | Ordinary
Income
(000) | | Long-Term
Capital Gain
(000) | |
| $ | 1,530 | | | $ | — | | | $ | 1,431 | | | $ | — | | |
The amount and character of income and gains to be distributed are determined in accordance with income tax regulations
30
Morgan Stanley Institutional Fund, Inc.
Annual Report — December 31, 2018
Notes to Financial Statements (cont'd)
which may differ from GAAP. These book/tax differences are either considered temporary or permanent in nature.
Temporary differences are primarily due to differing book and tax treatments in the timing of the recognition of gains (losses) on certain investment transactions and the timing of the deductibility of certain expenses.
Permanent differences, primarily due to a nondeductible expense, resulted in the following reclassifications among the components of net assets at December 31, 2018:
Total
Accumulated
Loss
(000) | | Paid-in-
Capital
(000) | |
| $ | 5 | | | $ | (5 | ) | |
At December 31, 2018, the Fund had no distributable earnings on a tax basis.
At December 31, 2018, the Fund had available for federal income tax purposes unused short-term and long-term capital losses of approximately $1,186,000 and $3,650,000 respectively, that do not have an expiration date. These amounts include capital losses acquired from MSIF Emerging Markets Domestic Debt that may be subject to limitation under IRC Section 382 in future years.
To the extent that capital loss carryforwards are used to offset any future capital gains realized, no capital gains tax liability will be incurred by the Fund for gains realized and not distributed. To the extent that capital gains are offset, such gains will not be distributed to the shareholders.
Qualified late year losses are capital losses and specified ordinary losses, including currency losses, incurred after October 31 but within the taxable year that, if elected, are deemed to arise on the first day of the Fund's next taxable year. For the year ended December 31, 2018, the Fund intends to defer to January 1, 2019 for U.S. federal income tax purposes the following losses:
Qualified
Late Year
Ordinary
Losses
(000) | | Post-October
Capital Losses
(000) | |
| $ | 12 | | | $ | — | | |
I. Credit Facility: The Company and other Morgan Stanley funds participated in a $150,000,000 committed, unsecured revolving line of credit facility (the "Facility") with State Street. This Facility is to be used for temporary emergency purposes or funding of shareholder redemption requests. The interest rate on borrowings is based on the federal funds rate or 1 month
LIBOR rate plus a spread. The Facility also has a commitment fee of 0.25% per annum based on the unused portion of the Facility. During the year ended December 31, 2018, the Fund did not have any borrowings under the Facility.
J. Other: At December 31, 2018, the Fund had record owners of 10% or greater. Investment activities of these shareholders could have a material impact on the Fund. The aggregate percentage of such owners was 35.1%.
K. Accounting Pronouncement: In March 2017, FASB issued an Accounting Standard Update, ASU 2017-08, Receivables-Nonrefundable Fees and Other Costs (Subtopic 310-20), Premium Amortization on Purchased Callable Debt Securities ("ASU 2017-08") which amends the amortization period for certain purchased callable debt securities held at a premium, shortening such period to the earliest call date. ASU 2017-08 does not require any accounting change for debt securities held at a discount; the discount continues to be accreted to maturity. ASU 2017-08 is effective for fiscal years, and interim periods within those fiscal years, beginning after December 15, 2018. At this time, management is evaluating the implications of these changes on the financial statements.
31
Morgan Stanley Institutional Fund, Inc.
Annual Report — December 31, 2018
Report of Independent Registered Public Accounting Firm
To the Shareholders and Board of Directors of
Morgan Stanley Institutional Fund, Inc. —
Emerging Markets Fixed Income Opportunities Portfolio
Opinion on the Financial Statements
We have audited the accompanying statement of assets and liabilities of Emerging Markets Fixed Income Opportunities Portfolio (the "Fund") (one of the funds constituting the Morgan Stanley Institutional Fund, Inc. (the "Company")), including the portfolio of investments, as of December 31, 2018, and the related statement of operations for the year then ended, the statements of changes in net assets for each of the two years in the period then ended, the financial highlights for each of the five years in the period then ended and the related notes (collectively referred to as the "financial statements"). In our opinion, the financial statements present fairly, in all material respects, the financial position of Emerging Markets Fixed Income Opportunities Portfolio (one of the funds constituting Morgan Stanley Institutional Fund, Inc.) at December 31, 2018, the results of its operations for the year then ended, the changes in its net assets for each of the two years in the period then ended and its financial highlights for each of the five years in the period then ended, in conformity with U.S. generally accepted accounting principles.
Basis for Opinion
These financial statements are the responsibility of the Company's management. Our responsibility is to express an opinion on the Fund's financial statements based on our audits. We are a public accounting firm registered with the Public Company Accounting Oversight Board (United States) ("PCAOB") and are required to be independent with respect to the Company in accordance with the U.S. federal securities law and the applicable rules and regulations of the Securities and Exchange Commission and the PCAOB.
We conducted our audits in accordance with the standards of the PCAOB. Those standards require that we plan and perform the audit to obtain reasonable assurance about whether the financial statements are free of material misstatement, whether due to error or fraud. The Company is not required to have, nor were we engaged to perform, an audit of the Company's internal control over financial reporting. As part of our audits, we are required to obtain an understanding of internal control over financial reporting, but not for the purpose of expressing an opinion on the effectiveness of the Company's internal control over financial reporting. Accordingly, we express no such opinion.
Our audits included performing procedures to assess the risks of material misstatement of the financial statements, whether due to error or fraud, and performing procedures that respond to those risks. Such procedures included examining, on a test basis, evidence regarding the amounts and disclosures in the financial statements. Our procedures included confirmation of securities owned as of December 31, 2018 by correspondence with the custodian and others or by other appropriate auditing procedures where replies from others were not received. Our audits also included evaluating the accounting principles used and significant estimates made by management, as well as evaluating the overall presentation of the financial statements. We believe that our audits provide a reasonable basis for our opinion.

We have served as the auditor of one or more Morgan Stanley investment companies since 2000.
Boston, Massachusetts
February 26, 2019
32
Morgan Stanley Institutional Fund, Inc.
Annual Report — December 31, 2018
Privacy Notice (unaudited)
MORGAN STANLEY INVESTMENT MANAGEMENT INC.
AN IMPORTANT NOTICE CONCERNING OUR U.S. PRIVACY POLICY
We are required by federal law to provide you with a copy of our privacy policy annually. This policy applies to current and former individual investors in funds managed or sponsored by Morgan Stanley Investment Management Inc. ("MSIM") as well as current and former individual clients of MSIM. This policy is not applicable to partnerships, corporations, trusts or other non-individual clients or investors. Please note that we may amend this policy at any time, and will inform you of any changes as required by law.
WE RESPECT YOUR PRIVACY
We appreciate that you have provided us with your personal financial information. We strive to maintain the privacy of such information while we help you achieve your financial objectives. This Notice describes what non-public personal information we collect about you, why we collect it, when we may share it with others and how certain others may use it. It discusses the steps you may take to limit our sharing of certain information about you to affiliated companies in the Morgan Stanley family of companies ("other Morgan Stanley companies"). It also discloses how you may limit use of certain shared information for marketing purposes by other Morgan Stanley branded companies. Throughout this policy, we refer to the non-public information that personally identifies you or your accounts as "personal information."
1. WHAT PERSONAL INFORMATION DO WE COLLECT ABOUT YOU?
We obtain personal information from applications and other forms you submit to us, from your dealings with us, from consumer reporting agencies, from our Web sites and from third parties and other sources.
For example:
• We may collect information such as your name, address, e-mail address, telephone/fax numbers, assets, income and investment objectives through subscription documents, applications and other forms you submit to us.
• We may obtain information about account balances, your use of account(s) and the types of products and services you prefer to receive from us through your dealings and transactions with us and other sources.
• We may obtain information about your creditworthiness and credit history from consumer reporting agencies.
• We may collect background information from and through third-party vendors to verify representations you have made and to comply with various regulatory requirements.
• If you interact with us through our public and private Web sites, we may collect information that you provide directly through online communications (such as an e-mail address). We may also collect information about your Internet service provider, your domain name, your computer's operating system and Web browser, your use of our Web sites and your product and service preferences, through the use of "cookies." Please consult the Terms of Use of these sites for more details.
2. WHEN DO WE DISCLOSE PERSONAL INFORMATION WE COLLECT ABOUT YOU?
We may disclose personal information we collect about you to other Morgan Stanley companies and to non-affiliated third parties.
a. Information We Disclose to Other Morgan Stanley Companies.
We may disclose personal information to other Morgan Stanley companies for a variety of reasons, including to manage your account(s) effectively, to service and process your transactions, to let you know about products and services offered by us and other Morgan Stanley companies, to manage our business, and as otherwise required or permitted by law. Offers for products and services from other Morgan Stanley companies are developed under conditions designed to safeguard your personal information.
33
Morgan Stanley Institutional Fund, Inc.
Annual Report — December 31, 2018
Privacy Notice (unaudited) (cont'd)
b. Information We Disclose to Non-affiliated Third Parties.
We do not disclose personal information that we collect about you to non-affiliated third parties except to those who provide marketing services on our behalf, to financial institutions with whom we have joint marketing agreements, and as otherwise required or permitted by law. For example, we may disclose personal information to non-affiliated third parties for servicing and processing transactions, to offer our own products and services, to protect against fraud, for institutional risk control, to respond to judicial process or to perform services on our behalf. When we share personal information with a non-affiliated third party, they are required to limit their use of personal information to the particular purpose for which it was shared and they are not allowed to share personal information with others except to fulfill that limited purpose or as may be permitted or required by law.
3. HOW DO WE PROTECT THE SECURITY AND CONFIDENTIALITY OF PERSONAL INFORMATION WE COLLECT ABOUT YOU?
We maintain physical, electronic and procedural security measures to help safeguard the personal information we collect about you. We have internal policies governing the proper handling of client information. Third parties that provide support or marketing services on our behalf may also receive personal information, and we require them to adhere to confidentiality standards with respect to such information.
4. HOW CAN YOU LIMIT THE SHARING OF CERTAIN TYPES OF PERSONAL INFORMATION WITH OTHER MORGAN STANLEY COMPANIES?
We offer you choices as to whether we share with other Morgan Stanley companies the personal information that was collected to determine your eligibility for products and services you request ("eligibility information"). Eligibility information does not include your identification information or personal information pertaining to our transactions or experiences with you. Please note that, even if you direct us not to share eligibility information with other Morgan Stanley companies ("opt-out"), we may still share personal information, including eligibility information, with those companies in circumstances excluded from the opt-out under applicable law, such as to process transactions or to service your account.
5. HOW CAN YOU LIMIT THE USE OF CERTAIN TYPES OF PERSONAL INFORMATION BY OTHER MORGAN STANLEY COMPANIES FOR MARKETING?
By following the opt-out instructions in Section 6 below, you may limit other Morgan Stanley branded companies from marketing their products or services to you based on personal information we disclose to them. This information may include, for example, your income and account history with us. Please note that, even if you choose to limit Other Morgan Stanley Companies from using personal information about you that we may share with them for marketing their products and services to you, Other Morgan Stanley Companies may use your personal information that they obtain from us to market to you in circumstances permitted by law, such as if the Other Morgan Stanley Company has its own relationship with you.
6. HOW CAN YOU SEND US AN OPT-OUT INSTRUCTION?
If you wish to limit our sharing of eligibility information about you with other Morgan Stanley companies or other Morgan Stanley companies' use of personal information for marketing purposes, as described in this notice, you may do so by:
• Calling us at (800) 548-7786
Monday–Friday between 8a.m. and 6p.m. (EST)
• Writing to us at the following address:
DST Asset Manager Solutions, Inc.
c/o Privacy Coordinator
P.O. Box 219804
Kansas City, Missouri 64121
34
Morgan Stanley Institutional Fund, Inc.
Annual Report — December 31, 2018
Privacy Notice (unaudited) (cont'd)
Your written request should include your name, address, telephone number and account number(s) to which the opt-out applies and whether you are opting out with respect to sharing of eligibility information (Section 4 above), or if information used for Marketing (Section 5 above) or both. Written opt-out requests should not be sent with any other correspondence. In order to process your request, we require that the request be provided by you directly and not through a third party.
Your opt-out preference will remain in effect with respect to this policy (as it may be amended) until you notify us otherwise. If you have a joint account, your direction for us not to share this information with other Morgan Stanley companies and for those other Morgan Stanley companies not to use your personal information for marketing will be applied to all account holders on that account. Please understand that if you limit our sharing or our affiliated companies' use of personal information, you and any joint account holder(s) may not receive information about Morgan Stanley products and services, including products or services that could help you manage your financial resources and achieve your investment objectives.
7. WHAT IF AN AFFILIATED COMPANY BECOMES A NON-AFFILIATED THIRD PARTY?
If, at any time in the future, an affiliated company becomes a non-affiliated third party, further disclosures of personal information made to the former affiliated company will be limited to those described in Section 2(b) above relating to non-affiliated third parties. If you elected under Section 6 to limit disclosures we make to affiliated companies, or use of personal information by affiliated companies, your election will not apply to use by any former affiliated company of your personal information in their possession once it becomes a non-affiliated third party.
SPECIAL NOTICE TO RESIDENTS OF VERMONT
The following section supplements our Policy with respect to our individual clients who have a Vermont address and supersedes anything to the contrary in the above Policy with respect to those clients only.
The state of Vermont requires financial institutions to obtain your consent prior to sharing personal information that they collect about you with affiliated companies and non-affiliated third parties other than in certain limited circumstances. Except as permitted by law, we will not share personal information we collect about you with non-affiliated third parties or other Morgan Stanley companies unless you provide us with your written consent to share such information ("opt-in").
If you wish to receive offers for investment products and services offered by or through other Morgan Stanley companies, please notify us in writing at the following address:
DST Asset Manager Solutions, Inc.
c/o Privacy Coordinator
P.O. Box 219804
Kansas City, Missouri 64121
Your authorization should include your name, address, telephone number and account number(s) to which the opt-in applies and should not be sent with any other correspondence. In order to process your authorization, we require that the authorization be provided by you directly and not through a third party.
SPECIAL NOTICE TO RESIDENTS OF CALIFORNIA
The following section supplements our Policy with respect to our individual clients who have a California address and supersedes anything to the contrary in the above Policy with respect to those clients only.
In response to a California law, if your account has a California home address, your personal information will not be disclosed to non-affiliated third parties except as permitted by applicable California law, and we will limit sharing such information with our affiliates to comply with California privacy laws that apply to us.
35
Morgan Stanley Institutional Fund, Inc.
Annual Report — December 31, 2018
Director and Officer Information (unaudited)
Independent Directors:
Name, Age and Address of
Independent Director | | Position(s)
Held with
Registrant | | Length of Time
Served* | | Principal Occupation(s) During Past 5 Years
and Other Relevant Professional Experience | | Number of
Portfolios in
Fund Complex
Overseen by
Independent
Director** | | Other Directorships
Held by Independent
Director*** | |
Frank L. Bowman (74)
c/o Perkins Coie LLP
Counsel to the Independent
Directors
30 Rockefeller Plaza
New York, NY 10112 | | Director | | Since
August
2006 | | President, Strategic Decisions, LLC (consulting) (since February 2009); Director or Trustee of various Morgan Stanley Funds (since August 2006); Chairperson of the Compliance and Insurance Committee (since October 2015); formerly, Chairperson of the Insurance Sub-Committee of the Compliance and Insurance Committee (2007-2015); served as President and Chief Executive Officer of the Nuclear Energy Institute (policy organization) (February 2005-November 2008); retired as Admiral, U.S. Navy after serving over 38 years on active duty including 8 years as Director of the Naval Nuclear Propulsion Program in the Department of the Navy and the U.S. Department of Energy (1996-2004); served as Chief of Naval Personnel (July 1994-September 1996) and on the Joint Staff as Director of Political Military Affairs (June 1992-July 1994); knighted as Honorary Knight Commander of the Most Excellent Order of the British Empire; awarded the Officier de l'Orde National du Mérite by the French Government; elected to the National Academy of Engineering (2009). | | | 82 | | | Director of BP p.l.c.; Director of Naval and Nuclear Technologies LLP; Director Emeritus of the Armed Services YMCA; Member of the National Security Advisory Council of the Center for U.S. Global Engagement and a member of the CNA Military Advisory Board; Trustee of Fairhaven United Methodist Church; Member of the Board of Advisors of the Dolphin Scholarship Foundation; and Director of other various non-profit organizations. | |
Kathleen A. Dennis (65)
c/o Perkins Coie LLP
Counsel to the Independent Directors
30 Rockefeller Plaza
New York, NY 10112 | | Director | | Since
August
2006 | | President, Cedarwood Associates (mutual fund and investment management consulting) (since July 2006); Chairperson of the Liquidity and Alternatives Sub-Committee of the Investment Committee (since October 2006) and Director or Trustee of various Morgan Stanley Funds (since August 2006); formerly, Senior Managing Director of Victory Capital Management (1993-2006). | | | 82 | | | Director of various non-profit organizations. | |
Nancy C. Everett (63)
c/o Perkins Coie LLP
Counsel to the Independent Directors
30 Rockefeller Plaza
New York, NY 10112 | | Director | | Since
January
2015 | | Chief Executive Officer, Virginia Commonwealth University Investment Company (since November 2015); Owner, OBIR, LLC (institutional investment management consulting) (since June 2014); formerly, Managing Director, BlackRock Inc. (February 2011-December 2013); and Chief Executive Officer, General Motors Asset Management (a/k/a Promark Global Advisors, Inc.) (June 2005-May 2010). | | | 83 | | | Formerly, Member of Virginia Commonwealth University School of Business Foundation (2005-2016); Member of Virginia Commonwealth University Board of Visitors (2013-2015); Member of Committee on Directors for Emerging Markets Growth Fund, Inc. (2007-2010); Chairperson of Performance Equity Management, LLC (2006-2010); and Chairperson, GMAM Absolute Return Strategies Fund, LLC (2006-2010). | |
36
Morgan Stanley Institutional Fund, Inc.
Annual Report — December 31, 2018
Director and Officer Information (unaudited) (cont'd)
Independent Directors: (cont'd)
Name, Age and Address of
Independent Director | | Position(s)
Held with
Registrant | | Length of Time
Served* | | Principal Occupation(s) During Past 5 Years
and Other Relevant Professional Experience | | Number of
Portfolios in
Fund Complex
Overseen by
Independent
Director** | | Other Directorships
Held by Independent
Director*** | |
Jakki L. Haussler (61)
c/o Perkins Coie LLP
Counsel to the Independent Directors
30 Rockefeller Plaza
New York, NY 10112 | | Director | | Since
January
2015 | | Chairman and Chief Executive Officer, Opus Capital Group (since January 1996); formerly, Director, Capvest Venture Fund, LP (May 2000-December 2011); Partner, Adena Ventures, LP (July 1999-December 2010); Director, The Victory Funds (February 2005-July 2008). | | | 83 | | | Director of Service Corporation International and Member, Audit Committee and Investment Committee; Director of Cincinnati Bell Inc. and Member, Audit Committee and Governance and Nominating Committee; Chairman of Northern Kentucky University Member Investment Committee; Member of Chase College of Law Transactional Law Practice Center Board of Advisors; Director of Best Transport; Director of Chase College of Law Board of Visitors; formerly, Member, University of Cincinnati Foundation Investment Committee; Member, Miami University Board of Visitors (2008-2011); Trustee of Victory Funds (2005-2008) and Chairman, Investment Committee (2007-2008) and Member, Service Provider Committee (2005-2008). | |
Dr. Manuel H. Johnson (69)
c/o Johnson Smick
International, Inc.
220 I Street, NE — Suite 200
Washington, D.C. 20002 | | Director | | Since
July
1991 | | Senior Partner, Johnson Smick International, Inc. (consulting firm); Chairperson of the Investment Committee (since October 2006) and Director or Trustee of various Morgan Stanley Funds (since July 1991); Co-Chairman and a founder of the Group of Seven Council (G7C) (international economic commission); formerly, Chairperson of the Audit Committee (July 1991-September 2006), Vice Chairman of the Board of Governors of the Federal Reserve System and Assistant Secretary of the U.S. Treasury. | | | 82 | | | Director of NVR, Inc. (home construction). | |
Joseph J. Kearns (76)
c/o Perkins Coie LLP
Counsel to the Independent Directors
30 Rockefeller Plaza
New York, NY 10112 | | Director | | Since
August
1994 | | Senior Adviser, Kearns & Associates LLC (investment consulting); Chairperson of the Audit Committee (since October 2006) and Director or Trustee of various Morgan Stanley Funds (since August 1994); formerly, Deputy Chairperson of the Audit Committee (July 2003-September 2006) and Chairperson of the Audit Committee of various Morgan Stanley Funds (since August 1994); CFO of the J. Paul Getty Trust. | | | 83 | | | Prior to August 10, 2016, Director of Electro Rent Corporation (equipment leasing); Prior to December 31, 2013, Director of The Ford Family Foundation. | |
37
Morgan Stanley Institutional Fund, Inc.
Annual Report — December 31, 2018
Director and Officer Information (unaudited) (cont'd)
Independent Directors: (cont'd)
Name, Age and Address of
Independent Director | | Position(s)
Held with
Registrant | | Length of Time
Served* | | Principal Occupation(s) During Past 5 Years
and Other Relevant Professional Experience | | Number of
Portfolios in
Fund Complex
Overseen by
Independent
Director** | | Other Directorships
Held by Independent
Director*** | |
Michael F. Klein (60)
c/o Perkins Coie LLP
Counsel to the Independent Directors
30 Rockefeller Plaza
New York, NY 10112 | | Director | | Since
August
2006 | | Managing Director, Aetos Alternatives Management, LP (since March 2000); Co-President, Aetos Alternatives Management, LP (since January 2004) and Co-Chief Executive Officer of Aetos Alternatives Management, LP (since August 2013); Chairperson of the Fixed Income Sub-Committee of the Investment Committee (since October 2006) and Director or Trustee of various Morgan Stanley Funds (since August 2006); formerly, Managing Director, Morgan Stanley & Co. Inc. and Morgan Stanley Dean Witter Investment Management and President, various Morgan Stanley Funds (June 1998-March 2000); Principal, Morgan Stanley & Co. Inc. and Morgan Stanley Dean Witter Investment Management (August 1997-December 1999). | | | 82 | | | Director of certain investment funds managed or sponsored by Aetos Alternatives Management, LP; Director of Sanitized AG and Sanitized Marketing AG (specialty chemicals). | |
Patricia Maleski (58)
c/o Perkins Coie LLP
Counsel to the Independent Directors
30 Rockefeller Plaza
New York, NY 10112 | | Director | | Since
January
2017 | | Managing Director, JPMorgan Asset Management (2004-2016); Oversight and Control Head of Fiduciary and Conflicts of Interest Program (2015-2016); Chief Control Officer-Global Asset Management (2013-2015); President, JPMorgan Funds (2010-2013); Chief Administrative Officer (2004-2013); various other positions including Treasurer and Board Liaison (since 2001). | | | 83 | | | None. | |
Michael E. Nugent (82)
522 Fifth Avenue
New York, NY 10036 | | Chair of the Board and Director | | Chair of the Boards since July 2006 and Director since July 1991 | | Chair of the Boards of various Morgan Stanley Funds (since July 2006); Chairperson of the Closed-End Fund Committee (since June 2012) Governance Committee (since January 2019) and Director or Trustee of various Morgan Stanley Funds (since July 1991); formerly, Chairperson of the Insurance Committee (until July 2006); General Partner, Triumph Capital, L.P. (private investment partnership) (1988-2013). | | | 82 | | | None. | |
W. Allen Reed (71)
c/o Perkins Coie LLP
Counsel to the Independent Directors
30 Rockefeller Plaza
New York, NY 10112 | | Director | | Since
August
2006 | | Chairperson of the Equity Sub-Committee of the Investment Committee (since October 2006) and Director or Trustee of various Morgan Stanley Funds (since August 2006); formerly, President and CEO of General Motors Asset Management; Chairman and Chief Executive Officer of the GM Trust Bank and Corporate Vice President of General Motors Corporation (August 1994-December 2005). | | | 82 | | | Director of Legg Mason, Inc.; formerly, Director of the Auburn University Foundation (2010-2015). | |
Fergus Reid (86)****
c/o Joe Pietryka, Inc.
85 Charles Colman Blvd.
Pawling, NY 12564 | | Director | | Since
June
1992 | | Chairman, Joe Pietryka, Inc.; Chairperson of the Governance Committee and Director or Trustee of various Morgan Stanley Funds (since June 1992). | | | 83 | | | Formerly, Trustee and Director of certain investment companies in the JP Morgan Fund Complex managed by JP Morgan Investment Management Inc. (1987-2012). | |
* This is the earliest date the Director began serving the Morgan Stanley Funds. Each Director serves an indefinite term, until his or her successor is elected.
** The Fund Complex includes (as of December 31, 2018) all open-end and closed-end funds (including all of their portfolios) advised by Morgan Stanley Investment Management Inc. (the "Adviser") and any funds that have an adviser that is an affiliated person of the Adviser (including, but not limited to, Morgan Stanley AIP GP LP).
*** This includes any directorships at public companies and registered investment companies held by the Director at any time during the past five years.
**** Effective date of retirement is December 31, 2018.
38
Morgan Stanley Institutional Fund, Inc.
Annual Report — December 31, 2018
Director and Officer Information (unaudited) (cont'd)
Executive Officers:
Name, Age and Address of Executive Officer | | Position(s) Held
with
Registrant | | Length of
Time Served* | | Principal Occupation(s) During Past 5 Years | |
John H. Gernon (55)
522 Fifth Avenue
New York, NY 10036 | | President and Principal Executive Officer | | Since
September
2013 | | President and Principal Executive Officer of the Equity and Fixed Income Funds and the Morgan Stanley AIP Funds (since September 2013) and the Liquidity Funds and various money market funds (since May 2014) in the Fund Complex; Managing Director of the Adviser; Head of Product (since 2006). | |
Timothy J. Knierim (59)
522 Fifth Avenue
New York, NY 10036 | | Chief Compliance Officer | | Since
December
2016 | | Managing Director of the Adviser and various entities affiliated with the Adviser; Chief Compliance Officer of various Morgan Stanley Funds and the Adviser (since December 2016) and Chief Compliance Officer of Morgan Stanley AIP GP LP (since 2014). Formerly, Managing Director and Deputy Chief Compliance Officer of the Adviser (2014-2016); and formerly, Chief Compliance Officer of Prudential Investment Management, Inc. (2007-2014). | |
Francis J. Smith (53)
522 Fifth Avenue
New York, NY 10036 | | Treasurer and Principal Financial Officer | | Treasurer since July 2003 and Principal Financial Officer since September 2002 | | Managing Director of the Adviser and various entities affiliated with the Adviser; Treasurer (since July 2003) and Principal Financial Officer of various Morgan Stanley Funds (since September 2002). | |
Mary E. Mullin (51)
522 Fifth Avenue
New York, NY 10036 | | Secretary | | Since
June
1999 | | Managing Director of the Adviser; Secretary of various Morgan Stanley Funds (since June 1999). | |
Michael J. Key (39)
522 Fifth Avenue
New York, NY 10036 | | Vice President | | Since
June
2017 | | Vice President of the Equity and Fixed Income Funds, Liquidity Funds, various money market funds and the Morgan Stanley AIP Funds in the Fund Complex (since June 2017); Executive Director of the Adviser; Head of Product Development for Equity and Fixed Income Funds (since August 2013). | |
* This is the earliest date the officer began serving the Morgan Stanley Funds. Each officer serves a one-year term, until his or her successor is elected and qualifies.
39
Morgan Stanley Institutional Fund, Inc.
Annual Report — December 31, 2018
Adviser and Administrator
Morgan Stanley Investment Management Inc.
522 Fifth Avenue
New York, New York 10036
Distributor
Morgan Stanley Distribution, Inc.
522 Fifth Avenue
New York, New York 10036
Dividend Disbursing and Transfer Agent
DST Asset Manager Solutions, Inc.
2000 Crown Colony Drive
Quincy, Massachusetts 02169
Custodian
State Street Bank and Trust Company
One Lincoln Street
Boston, Massachusetts 02111
Legal Counsel
Dechert LLP
1095 Avenue of the Americas
New York, New York 10036
Counsel to the Independent Directors
Perkins Coie LLP
30 Rockefeller Plaza
New York, New York 10112
Independent Registered Public Accounting Firm
Ernst & Young LLP
200 Clarendon Street
Boston, Massachusetts 02116
Reporting to Shareholders
Each Morgan Stanley fund provides a complete schedule of portfolio holdings in its semi-annual and the annual reports within 60 days of the end of the fund's second and fourth fiscal quarters. The semi-annual and annual reports are filed electronically with the Securities and Exchange Commission ("SEC") on Form N-CSRS and Form N-CSR, respectively. Morgan Stanley also delivers the semi-annual and annual reports to fund shareholders and makes these reports available on its public website, www.morganstanley.com/im/shareholderreports. Each Morgan Stanley fund also files a complete schedule of portfolio holdings with the SEC for the fund's first and third fiscal quarters on Form N-Q. Morgan Stanley does not deliver the reports for the first and third fiscal quarters to shareholders, nor are the reports posted to the Morgan Stanley public website. You may, however, obtain the Form N-Q filings (as well as the Form N-CSR and N-CSRS filings) by accessing the SEC's website, www.sec.gov. You can also request copies of these materials, upon payment of a duplicating fee, by electronic request at the SEC's email address (publicinfo@sec.gov).
Proxy Voting Policies and Procedures and Proxy Voting Record
You may obtain a copy of the Company's Proxy Voting Policy and Procedures and information regarding how the Company voted proxies relating to portfolio securities during the most recent twelve-month period ended June 30, without charge, upon request, by calling toll free 1 (800) 548-7786 or by visiting our website at www.morganstanley.com/im/shareholderreports. This information is also available on the SEC's website at www.sec.gov.
This report is authorized for distribution only when preceded or accompanied by a prospectus or summary prospectus of the applicable Fund of Morgan Stanley Institutional Fund, Inc., which describes in detail the Fund's investment policies, risks, fees and expenses. Please read the prospectus carefully before you invest or send money. For additional information, including information regarding the investments comprising the Fund, please visit our website at www.morganstanley.com/im/shareholderreports or call toll free 1 (800) 548-7786.
40
Printed in U.S.A.
This Report has been prepared for shareholders and may be distributed to others only if preceded or accompanied by a current prospectus.
Morgan Stanley Investment Management Inc.
522 Fifth Avenue
New York, New York 10036
© 2019 Morgan Stanley. Morgan Stanley Distribution, Inc.

IFIEMEDANN
2398587 EXP. 02.29.20

Morgan Stanley Institutional Fund, Inc.
Emerging Markets Leaders Portfolio
Annual Report
December 31, 2018
Beginning on January 1, 2021, as permitted by regulations adopted by the Securities and Exchange Commission ("SEC"), paper copies of the Fund's Annual and Semi-Annual Reports to Shareholders ("Shareholder Reports") will no longer be sent by mail, unless you specifically request paper copies of the Shareholder Reports from the Fund or from your financial intermediary, such as a broker-dealer or a bank. Instead, the Shareholder Reports will be made available on the Fund's website, https://www.morganstanley.com/im/shareholderreports and you will be notified by mail each time a Shareholder Report is posted and provided with a website link to access the Shareholder Report. If you already elected to receive Shareholder Reports electronically, you will not be affected by this change and you need not take any action. You may elect to receive Shareholder Reports and other communications from the Fund electronically anytime by contacting your financial intermediary or, if you are a direct investor, please follow the instructions on the envelope.
Beginning on January 1, 2019, you may elect to receive all future Shareholder Reports in paper free of charge. If you invest through a financial intermediary, you can contact your financial intermediary to request that you continue to receive paper copies of your Shareholder Reports. If you invest directly with the Fund, please follow the instructions on the envelope to let the Fund know you wish to continue receiving paper copies of your Shareholder Reports. Your election to receive Shareholder Reports in paper will apply to all funds held in your account if you invest through your financial intermediary or all funds held with the fund complex if you invest directly with a fund.

Morgan Stanley Institutional Fund, Inc.
Annual Report — December 31, 2018
Shareholders' Letter | | | 2 | | |
Expense Example | | | 3 | | |
Investment Overview | | | 4 | | |
Portfolio of Investments | | | 6 | | |
Statement of Assets and Liabilities | | | 7 | | |
Statement of Operations | | | 9 | | |
Statements of Changes in Net Assets | | | 10 | | |
Financial Highlights | | | 12 | | |
Notes to Financial Statements | | | 16 | | |
Report of Independent Registered Public Accounting Firm | | | 23 | | |
Federal Tax Notice | | | 24 | | |
Privacy Notice | | | 25 | | |
Director and Officer Information | | | 28 | | |
This report is authorized for distribution only when preceded or accompanied by a prospectus or summary prospectus of the applicable Fund of Morgan Stanley Institutional Fund, Inc. To receive a prospectus and/or statement of additional information (SAI), which contains more complete information such as investment objectives, charges, expenses, policies for voting proxies, risk considerations and describes in detail each of the Fund's investment policies to the prospective investor, please call toll free 1 (800) 548-7786. Please read the prospectuses carefully before you invest or send money.
Additionally, you can access information about the Fund, including performance, characteristics and investment team commentary, through Morgan Stanley Investment Management's website: www.morganstanley.com/im/shareholderreports.
Market forecasts provided in this report may not necessarily come to pass. There is no guarantee that any sectors mentioned will continue to perform as discussed herein or that securities in such sectors will be held by the Fund in the future. There is no assurance that a fund will achieve its investment objective. Funds are subject to market risk, which is the possibility that market values of securities owned by the Fund will decline and, therefore, the value of the Fund's shares may be less than what you paid for them. Accordingly, you can lose money investing in this Fund. Please see the prospectus for more complete information on investment risks.
1
Morgan Stanley Institutional Fund, Inc.
Annual Report — December 31, 2018
Shareholders' Letter (unaudited)
Dear Shareholders,
We are pleased to provide this Annual report, in which you will learn how your investment in Emerging Markets Leaders Portfolio (the "Fund") performed during the latest twelve-month period.
Morgan Stanley Investment Management is a client-centric, investor-led organization. Our global presence, intellectual capital, and breadth of products and services enable us to partner with investors to meet the evolving challenges of today's financial markets. We aim to deliver superior investment service and to empower our clients to make the informed decisions that help them reach their investment goals.
As always, we thank you for selecting Morgan Stanley Investment Management, and look forward to working with you in the months and years ahead.
Sincerely,

John H. Gernon
President and Principal Executive Officer
January 2019
2
Morgan Stanley Institutional Fund, Inc.
Annual Report — December 31, 2018
Expense Example (unaudited)
Emerging Markets Leaders Portfolio
As a shareholder of the Fund, you incur two types of costs: (1) transactional costs, including redemption fees; and (2) ongoing costs, which may include advisory fees, administration fees, distribution and shareholder services fees and other Fund expenses. This example is intended to help you understand your ongoing costs (in dollars) of investing in the Fund and to compare these costs with the ongoing costs of investing in other mutual funds.
This example is based on an investment of $1,000 invested at the beginning of the six-month period ended December 31, 2018 and held for the entire six-month period.
Actual Expenses
The table below provides information about actual account values and actual expenses. You may use the information in this table, together with the amount you invested, to estimate the expenses that you paid over the period. Simply divide your account value by $1,000 (for example, an $8,600 account value divided by $1,000 = 8.6), then multiply the result by the number in the table under the heading entitled "Actual Expenses Paid During Period" to estimate the expenses you paid on your account during this period.
Hypothetical Example for Comparison Purposes
The table below provides information about hypothetical account values and hypothetical expenses based on the Fund's actual expense ratio and an assumed rate of return of 5% per year before expenses, which is not the Fund's actual return. The hypothetical account values and expenses may not be used to estimate the actual ending account balance or expenses you paid for the period. You may use this information to compare the ongoing costs of investing in the Fund and other funds. To do so, compare this 5% hypothetical example with the 5% hypothetical examples that appear in the shareholder reports of the other funds.
Please note that the expenses shown in the table are meant to highlight your ongoing costs only and do not reflect any transactional costs, such as sales charges (loads) and redemption fees. Therefore, the information for each class in the table is useful in comparing ongoing costs only, and will not help you determine the relative total costs of owning different funds. In addition, if these transactional costs were included, your costs would have been higher.
| | | Beginning
Account
Value
7/1/18 | | Actual Ending
Account
Value
12/31/18 | | Hypothetical
Ending Account
Value | | Actual
Expenses
Paid
During
Period* | | Hypothetical
Expenses Paid
During Period* | | Net
Expense
Ratio
During
Period** | |
Emerging Markets Leaders Portfolio Class I | | $ | 1,000.00 | | | $ | 920.20 | | | $ | 1,019.21 | | | $ | 5.76 | | | $ | 6.06 | | | | 1.19 | % | |
Emerging Markets Leaders Portfolio Class A | | | 1,000.00 | | | | 919.20 | | | | 1,017.44 | | | | 7.45 | | | | 7.83 | | | | 1.54 | | |
Emerging Markets Leaders Portfolio Class C | | | 1,000.00 | | | | 915.20 | | | | 1,013.66 | | | | 11.05 | | | | 11.62 | | | | 2.29 | | |
Emerging Markets Leaders Portfolio Class IS | | | 1,000.00 | | | | 921.20 | | | | 1,019.71 | | | | 5.28 | | | | 5.55 | | | | 1.09 | | |
* Expenses are calculated using each Fund Class' annualized net expense ratio (as disclosed), multiplied by the average account value over the period and multiplied by 184/365 (to reflect the most recent one-half year period).
** Annualized.
3
Morgan Stanley Institutional Fund, Inc.
Annual Report — December 31, 2018
Investment Overview (unaudited)
Emerging Markets Leaders Portfolio
The Fund seeks long-term capital appreciation.
Performance
For the fiscal year ended December 31, 2018, the Fund's Class I shares had a total return based on net asset value and reinvestment of distributions per share of –14.12%, net of fees. The Fund's Class I shares outperformed the Fund's benchmark, MSCI Emerging Markets Net Index (the "Index"), which returned –14.57%.
Factors Affecting Performance
• In 2018, emerging markets were marked by a return of volatility and driven by news flow around negative trade relations, oil price and currency volatility, the tech sell-off and a sell-off in small- and mid-cap stocks. Emerging market equities declined –14.57% over the period as measured by the Index. The Fund outperformed on a relative basis.
• The top contributors to performance over the year were our holdings in an Indian hospital company, an Indonesian mini-mart company and a Peruvian financial company.
• The largest detractors from performance were our holdings in a Latin American online travel agent, a Korean furniture company and a global luggage company.
Management Strategies
• We consolidated the portfolio throughout the year, exiting positions which had exceeded our price targets or where the thesis did not pan out as per expectations. We remain confident in the portfolio as we own number of companies which had been in either an investment phase or facing headwinds, and now are close to an earnings inflection or are encountering an easing in local market challenges. When companies in the portfolio do face business challenges, we continue to assess our thesis and remain invested in those where we believe the disruptions will prove transitory and the long-term growth potential remains intact.
• We reiterate our single-minded focus on owning high-quality growth businesses exposed to secular growth themes in emerging markets. We continue to favor consumer plays benefiting from healthy domestic demand, and we see rising demand for
health care, travel and leisure activities. We are constructive on emerging market financials benefiting from underpenetrated credit markets and favorable interest rate environments in individual countries. We own technology companies which are growing for structural reasons, while avoiding more cyclical tech plays, and also have exposure to high-quality small- and mid-cap companies.
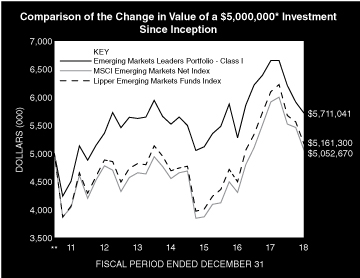
* Minimum Investment for Class I shares
** Commenced Operations on June 30, 2011. Performance shown for the Fund's Class I shares reflects the performance of the Morgan Stanley Emerging Markets Leaders Fund (Cayman) LP, a private fund managed by the Adviser for periods prior to close of business on January 5, 2015, when the Fund acquired substantially all of the assets and liabilities of the Private Fund in exchange for shares of the Fund (the "Emerging Markets Leaders Reorganization").
In accordance with SEC regulations, the Fund's performance shown assumes that all recurring fees (including management fees) were deducted and all dividends and distributions were reinvested. The performance of Class A, C and IS shares will vary from the performance of Class I shares based upon their different inception dates and will be negatively impacted by additional fees assessed to those classes (if applicable).
4
Morgan Stanley Institutional Fund, Inc.
Annual Report — December 31, 2018
Investment Overview (unaudited) (cont'd)
Emerging Markets Leaders Portfolio
Performance Compared to the MSCI Emerging Markets Net Index(1) and the Lipper Emerging Markets Funds Index(2)
| | | Period Ended December 31, 2018
Total Returns(3) | |
| | | One
Year | | Five
Years | | Ten
Years | | Since
Inception(6) | |
Fund — Class I Shares
w/o sales charges(4) | | | –14.12 | % | | | 0.32 | % | | | — | | | | 1.79 | % | |
Fund — Class A Shares
w/o sales charges(4) | | | –14.41 | | | | 0.01 | | | | — | | | | 1.58 | | |
Fund — Class A Shares with
maximum 5.25% sales charges(4) | | | –18.91 | | | | –1.06 | | | | — | | | | 0.85 | | |
Fund — Class C Shares
w/o sales charges(5) | | | –15.02 | | | | — | | | | — | | | | –1.00 | | |
Fund — Class C Shares with
maximum 1.00% deferred
sales charges(5) | | | –15.87 | | | | — | | | | — | | | | –1.00 | | |
Fund — Class IS Shares
w/o sales charges(4) | | | –14.03 | | | | 0.35 | | | | — | | | | 1.81 | | |
MSCI Emerging Markets
Net Index | | | –14.57 | | | | 1.65 | | | | — | | | | 0.14 | | |
Lipper Emerging Markets
Funds Index | | | –15.34 | | | | 1.38 | | | | — | | | | 0.42 | | |
Performance data quoted represents past performance, which is no guarantee of future results, and current performance may be lower or higher than the figures shown. Performance assumes that all dividends and distributions, if any, were reinvested. For the most recent month-end performance figures, please visit www.morganstanley.com/im/shareholderreports. Investment return and principal value will fluctuate so that Fund shares, when redeemed, may be worth more or less than their original cost. Total returns do not reflect the deduction of taxes that a shareholder would pay on Fund distributions or the redemption of Fund shares. Performance of share classes will vary due to difference in sales charges and expenses.
(1) The MSCI Emerging Markets Net Index is a free float-adjusted market capitalization weighted index that is designed to measure equity market performance of emerging markets. The term "free float" represents the portion of shares outstanding that are deemed to be available for purchase in the public equity markets by investors. The MSCI Emerging Markets Net Index currently consists of 24 emerging market country indices. The performance of the Index is listed in U.S. dollars and assumes reinvestment of net dividends. Net total return indices reinvest dividends after the deduction of withholding taxes, using (for international indices) a tax rate applicable to non-resident institutional investors who do not benefit from double taxation treaties. The Index is unmanaged and its returns do not include any sales charges or fees. Such costs would lower performance. It is not possible to invest directly in an index.
(2) The Lipper Emerging Markets Funds Index is an equally weighted performance index of the largest qualifying funds (based on net assets) in the Lipper Emerging Markets Funds classification. The Index, which is adjusted for capital gains distributions and income dividends, is unmanaged and should not be considered an investment. There are currently 30 funds represented in this Index. As of the date of this report, the Fund is in the Lipper Emerging Markets Funds classification.
(3) Total returns for the Fund reflect fees waived and expenses reimbursed, if applicable, by Morgan Stanley Investment Management Inc. (the "Adviser"). Without such waivers and reimbursements, total returns would have been lower.
(4) Pursuant to an agreement and plan of reorganization, between Morgan Stanley Institutional Fund, Inc., on behalf of the Fund, and Morgan Stanley Emerging Markets Leaders Fund (Cayman) LP, a private fund managed by the Adviser (the "Private Fund"), following close of business on January 5, 2015, the Fund acquired substantially all of the assets and liabilities of the Private Fund in exchange for shares of the Fund (the "Emerging Markets Leaders Reorganization"). The Private Fund commenced operations on June 30, 2011. The Fund adopted the performance history of the Private Fund. Performance shown for the Fund's Class I, Class A and Class IS shares reflects the performance of the limited partnership interests of the Private Fund, adjusted to reflect any applicable sales charge of the Class, but not adjusted for any other differences in expenses. If adjusted for other expenses, the historical returns would be different.
(5) Commenced offering on April 30, 2015.
(6) For comparative purposes, average annual since inception returns listed for the Indexes refer to the inception date of Class I of the Fund, not the inception of the Index.
5
Morgan Stanley Institutional Fund, Inc.
Annual Report — December 31, 2018
Portfolio of Investments
Emerging Markets Leaders Portfolio
| | | Shares | | Value
(000) | |
Common Stocks (96.6%) | |
Argentina (1.7%) | |
Despegar.com Corp. (a) | | | 75,046 | | | $ | 931 | | |
China (11.7%) | |
Alibaba Group Holding Ltd. ADR (a) | | | 20,798 | | | | 2,851 | | |
Tencent Holdings Ltd. (b) | | | 86,500 | | | | 3,429 | | |
| | | | 6,280 | | |
Germany (5.3%) | |
Adidas AG | | | 13,744 | | | | 2,872 | | |
Hong Kong (9.1%) | |
AIA Group Ltd. | | | 347,400 | | | | 2,858 | | |
Samsonite International SA (a) | | | 730,500 | | | | 2,062 | | |
| | | | 4,920 | | |
Hungary (1.0%) | |
OTP Bank Nyrt | | | 13,604 | | | | 549 | | |
India (26.1%) | |
Apollo Hospitals Enterprise Ltd. | | | 267,334 | | | | 4,819 | | |
AU Small Finance Bank Ltd. | | | 195,839 | | | | 1,749 | | |
Crompton Greaves Consumer Electricals Ltd. | | | 542,853 | | | | 1,776 | | |
IndusInd Bank Ltd. | | | 95,626 | | | | 2,194 | | |
L&T Finance Holdings Ltd. | | | 848,827 | | | | 1,846 | | |
Marico Ltd. | | | 305,362 | | | | 1,631 | | |
| | | | 14,015 | | |
Indonesia (5.2%) | |
Bank Mandiri Persero Tbk PT | | | 3,713,100 | | | | 1,903 | | |
Sumber Alfaria Trijaya Tbk PT | | | 13,788,791 | | | | 897 | | |
| | | | 2,800 | | |
Korea, Republic of (2.6%) | |
Osstem Implant Co., Ltd. (a) | | | 28,863 | | | | 1,388 | | |
Mexico (2.1%) | |
Alsea SAB de CV | | | 423,601 | | | | 1,104 | | |
Peru (3.0%) | |
Credicorp Ltd. | | | 7,198 | | | | 1,596 | | |
Poland (2.1%) | |
Eurocash SA | | | 243,772 | | | | 1,146 | | |
South Africa (3.2%) | |
Famous Brands Ltd. (a) | | | 256,291 | | | | 1,737 | | |
Taiwan (18.5%) | |
King Slide Works Co., Ltd. | | | 185,000 | | | | 1,920 | | |
Poya International Co., Ltd. | | | 144,304 | | | | 1,484 | | |
Silergy Corp. | | | 84,000 | | | | 1,223 | | |
Taiwan Semiconductor Manufacturing Co., Ltd. | | | 416,000 | | | | 3,020 | | |
Voltronic Power Technology Corp. | | | 131,750 | | | | 2,298 | | |
| | | | 9,945 | | |
Thailand (3.1%) | |
Kasikornbank PCL NVDR | | | 297,700 | | | | 1,694 | | |
United States (1.9%) | |
Visa, Inc., Class A | | | 7,586 | | | | 1,001 | | |
Total Common Stocks (Cost $48,602) | | | 51,978 | | |
| | | Shares | | Value
(000) | |
Short-Term Investment (3.3%) | |
Investment Company (3.3%) | |
Morgan Stanley Institutional Liquidity
Funds — Government Portfolio —
Institutional Class (See Note G)
(Cost $1,782) | | | 1,782,021 | | | $ | 1,782 | | |
Total Investments (99.9%) (Cost $50,384) (c)(d) | | | 53,760 | | |
Other Assets in Excess of Liabilities (0.1%) | | | 29 | | |
Net Assets (100.0%) | | $ | 53,789 | | |
Country assignments and aggregations are based generally on third party vendor classifications and information, and may be different from the assignments and aggregations under the policies set forth in the Fund's prospectus and/or statement of additional information relating to geographic classifications.
(a) Non-income producing security.
(b) Security trades on the Hong Kong exchange.
(c) The approximate fair value and percentage of net assets, $44,495,000 and 82.7%, respectively, represent the securities that have been fair valued under the fair valuation policy for international investments as described in Note A-1 within the Notes to the Financial Statements.
(d) At December 31, 2018, the aggregate cost for federal income tax purposes is approximately $51,429,000. The aggregate gross unrealized appreciation is approximately $5,220,000 and the aggregate gross unrealized depreciation is approximately $2,889,000, resulting in net unrealized appreciation of approximately $2,331,000.
ADR American Depositary Receipt
NVDR Non-Voting Depositary Receipt
Portfolio Composition
Classification | | Percentage of
Total Investments | |
Other* | | | 33.7 | % | |
Banks | | | 18.0 | | |
Interactive Media & Services | | | 11.7 | | |
Textiles, Apparel & Luxury Goods | | | 9.2 | | |
Health Care Providers & Services | | | 8.9 | | |
Semiconductors & Semiconductor Equipment | | | 7.9 | | |
Insurance | | | 5.3 | | |
Hotels, Restaurants & Leisure | | | 5.3 | | |
Total Investments | | | 100.0 | % | |
* Industries and/or investment types representing less than 5% of total investments.
The accompanying notes are an integral part of the financial statements.
6
Morgan Stanley Institutional Fund, Inc.
Annual Report — December 31, 2018
Emerging Markets Leaders Portfolio
Statement of Assets and Liabilities | | December 31, 2018
(000) | |
Assets: | |
Investments in Securities of Unaffiliated Issuers, at Value (Cost $48,602) | | $ | 51,978 | | |
Investment in Security of Affiliated Issuer, at Value (Cost $1,782) | | | 1,782 | | |
Total Investments in Securities, at Value (Cost $50,384) | | | 53,760 | | |
Foreign Currency, at Value (Cost —@) | | | — | @ | |
Tax Reclaim Receivable | | | 116 | | |
Receivable for Fund Shares Sold | | | 76 | | |
Receivable from Affiliate | | | 3 | | |
Dividends Receivable | | | — | @ | |
Other Assets | | | 43 | | |
Total Assets | | | 53,998 | | |
Liabilities: | |
Payable for Professional Fees | | | 90 | | |
Payable for Advisory Fees | | | 60 | | |
Payable for Custodian Fees | | | 14 | | |
Deferred Capital Gain Country Tax | | | 14 | | |
Payable for Fund Shares Redeemed | | | 7 | | |
Payable for Administration Fees | | | 4 | | |
Payable for Sub Transfer Agency Fees — Class I | | | 4 | | |
Payable for Sub Transfer Agency Fees — Class A | | | — | @ | |
Payable for Sub Transfer Agency Fees — Class C | | | — | @ | |
Payable for Transfer Agency Fees — Class I | | | 1 | | |
Payable for Transfer Agency Fees — Class A | | | 1 | | |
Payable for Transfer Agency Fees — Class C | | | 1 | | |
Payable for Transfer Agency Fees — Class IS | | | 1 | | |
Payable for Shareholder Services Fees — Class A | | | — | @ | |
Payable for Distribution and Shareholder Services Fees — Class C | | | 1 | | |
Payable to the Advisor (Note F) | | | 2 | | |
Other Liabilities | | | 9 | | |
Total Liabilities | | | 209 | | |
Net Assets | | $ | 53,789 | | |
Net Assets Consist of: | |
Paid-in-Capital | | $ | 50,871 | | |
Total Distributable Earnings | | | 2,918 | | |
Net Assets | | $ | 53,789 | | |
The accompanying notes are an integral part of the financial statements.
7
Morgan Stanley Institutional Fund, Inc.
Annual Report — December 31, 2018
Emerging Markets Leaders Portfolio
Statement of Assets and Liabilities (cont'd) | | December 31, 2018
(000) | |
CLASS I: | |
Net Assets | | $ | 39,206 | | |
| Shares Outstanding $0.001 par value shares of beneficial interest (unlimited shares authorized) (not in 000's) | | | 3,775,934 | | |
Net Asset Value, Offering and Redemption Price Per Share | | $ | 10.38 | | |
CLASS A: | |
Net Assets | | $ | 1,024 | | |
| Shares Outstanding $0.001 par value shares of beneficial interest (unlimited shares authorized) (not in 000's) | | | 99,493 | | |
Net Asset Value, Redemption Price Per Share | | $ | 10.29 | | |
Maximum Sales Load | | | 5.25 | % | |
Maximum Sales Charge | | $ | 0.57 | | |
Maximum Offering Price Per Share | | $ | 10.86 | | |
CLASS C: | |
Net Assets | | $ | 780 | | |
| Shares Outstanding $0.001 par value shares of beneficial interest (unlimited shares authorized) (not in 000's) | | | 77,376 | | |
Net Asset Value, Offering and Redemption Price Per Share | | $ | 10.08 | | |
CLASS IS: | |
Net Assets | | $ | 12,779 | | |
| Shares Outstanding $0.001 par value shares of beneficial interest (unlimited shares authorized) (not in 000's) | | | 1,231,150 | | |
Net Asset Value, Offering and Redemption Price Per Share | | $ | 10.38 | | |
@ Amount is less than $500.
The accompanying notes are an integral part of the financial statements.
8
Morgan Stanley Institutional Fund, Inc.
Annual Report — December 31, 2018
Emerging Markets Leaders Portfolio
Statement of Operations | | Year Ended
December 31, 2018
(000) | |
Investment Income: | |
Dividends from Securities of Unaffiliated Issuers (Net of $135 of Foreign Taxes Withheld) | | $ | 958 | | |
Dividends from Security of Affiliated Issuer (Note G) | | | 37 | | |
Total Investment Income | | | 995 | | |
Expenses: | |
Advisory Fees (Note B) | | | 610 | | |
Professional Fees | | | 149 | | |
Registration Fees | | | 71 | | |
Administration Fees (Note C) | | | 54 | | |
Sub Transfer Agency Fees — Class I | | | 35 | | |
Sub Transfer Agency Fees — Class A | | | 1 | | |
Sub Transfer Agency Fees — Class C | | | 1 | | |
Custodian Fees (Note F) | | | 33 | | |
Shareholder Reporting Fees | | | 16 | | |
Shareholder Services Fees — Class A (Note D) | | | 3 | | |
Distribution and Shareholder Services Fees — Class C (Note D) | | | 9 | | |
Transfer Agency Fees — Class I (Note E) | | | 3 | | |
Transfer Agency Fees — Class A (Note E) | | | 2 | | |
Transfer Agency Fees — Class C (Note E) | | | 2 | | |
Transfer Agency Fees — Class IS (Note E) | | | 2 | | |
Directors' Fees and Expenses | | | 5 | | |
Other Expenses | | | 19 | | |
Expenses Before Non Operating Expenses | | | 1,015 | | |
Bank Overdraft Expense | | | 4 | | |
Total Expenses | | | 1,019 | | |
Waiver of Advisory Fees (Note B) | | | (211 | ) | |
Reimbursement of Class Specific Expenses — Class A (Note B) | | | (1 | ) | |
Reimbursement of Class Specific Expenses — Class C (Note B) | | | (1 | ) | |
Reimbursement of Class Specific Expenses — Class IS (Note B) | | | (2 | ) | |
Rebate from Morgan Stanley Affiliate (Note G) | | | (4 | ) | |
Net Expenses | | | 800 | | |
Net Investment Income | | | 195 | | |
Realized Gain (Loss): | |
Investments Sold | | | 1,239 | | |
Foreign Currency Translation | | | (130 | ) | |
Net Realized Gain | | | 1,109 | | |
Change in Unrealized Appreciation (Depreciation): | |
Investments (Net Decrease in Deferred Capital Gain Country Tax of $62) | | | (10,899 | ) | |
Foreign Currency Translation | | | (3 | ) | |
Net Change in Unrealized Appreciation (Depreciation) | | | (10,902 | ) | |
Net Realized Gain and Change in Unrealized Appreciation (Depreciation) | | | (9,793 | ) | |
Net Decrease in Net Assets Resulting from Operations | | $ | (9,598 | ) | |
The accompanying notes are an integral part of the financial statements.
9
Morgan Stanley Institutional Fund, Inc.
Annual Report — December 31, 2018
Emerging Markets Leaders Portfolio
Statements of Changes in Net Assets | | Year Ended
December 31, 2018
(000) | | Year Ended
December 31, 2017
(000) | |
Increase (Decrease) in Net Assets: | |
Operations: | |
Net Investment Income | | $ | 195 | | | $ | 632 | | |
Net Realized Gain | | | 1,109 | | | | 4,249 | | |
Net Change in Unrealized Appreciation (Depreciation) | | | (10,902 | ) | | | 18,107 | | |
Net Increase (Decrease) in Net Assets Resulting from Operations | | | (9,598 | ) | | | 22,988 | | |
Dividends and Distributions to Shareholders: | |
Class I | | | (189 | ) | | | (712 | )* | |
Class A | | | (4 | ) | | | (5 | )* | |
Class C | | | (3 | ) | | | (3 | )* | |
Class IS | | | (72 | ) | | | (145 | )* | |
Total Dividends and Distributions to Shareholders | | | (268 | ) | | | (865 | ) | |
Capital Share Transactions:(1) | |
Class I: | |
Subscribed | | | 8,770 | | | | 47,849 | | |
Distributions Reinvested | | | 153 | | | | 490 | | |
Redeemed | | | (35,622 | ) | | | (10,905 | ) | |
Class A: | |
Subscribed | | | 387 | | | | 594 | | |
Distributions Reinvested | | | 4 | | | | 6 | | |
Redeemed | | | (270 | ) | | | (504 | ) | |
Class C: | |
Subscribed | | | 314 | | | | 247 | | |
Distributions Reinvested | | | 3 | | | | 3 | | |
Redeemed | | | (325 | ) | | | (64 | ) | |
Class IS: | |
Subscribed | | | — | | | | 750 | | |
Distributions Reinvested | | | 72 | | | | 145 | | |
Redeemed | | | — | | | | (86,228 | ) | |
Net Decrease in Net Assets Resulting from Capital Share Transactions | | | (26,514 | ) | | | (47,617 | ) | |
Redemption Fees | | | — | @ | | | 1 | | |
Total Decrease in Net Assets | | | (36,380 | ) | | | (25,493 | ) | |
Net Assets: | |
Beginning of Period | | | 90,169 | | | | 115,662 | | |
End of Period | | $ | 53,789 | | | $ | 90,169 | † | |
The accompanying notes are an integral part of the financial statements.
10
Morgan Stanley Institutional Fund, Inc.
Annual Report — December 31, 2018
Emerging Markets Leaders Portfolio
Statements of Changes in Net Assets (cont'd) | | Year Ended
December 31, 2018
(000) | | Year Ended
December 31, 2017
(000) | |
(1) Capital Share Transactions: | |
Class I: | |
Shares Subscribed | | | 757 | | | | 4,336 | | |
Shares Issued on Distributions Reinvested | | | 14 | | | | 41 | | |
Shares Redeemed | | | (3,029 | ) | | | (950 | ) | |
Net Increase (Decrease) in Class I Shares Outstanding | | | (2,258 | ) | | | 3,427 | | |
Class A: | |
Shares Subscribed | | | 32 | | | | 52 | | |
Shares Issued on Distributions Reinvested | | | — | @@ | | | — | @@ | |
Shares Redeemed | | | (24 | ) | | | (46 | ) | |
Net Increase in Class A Shares Outstanding | | | 8 | | | | 6 | | |
Class C: | |
Shares Subscribed | | | 29 | | | | 22 | | |
Shares Issued on Distributions Reinvested | | | — | @@ | | | — | @@ | |
Shares Redeemed | | | (29 | ) | | | (5 | ) | |
Net Increase in Class C Shares Outstanding | | | — | @@ | | | 17 | | |
Class IS: | |
Shares Subscribed | | | — | | | | 65 | | |
Shares Issued on Distributions Reinvested | | | 7 | | | | 12 | | |
Shares Redeemed | | | — | | | | (7,984 | ) | |
Net Increase (Decrease) in Class IS Shares Outstanding | | | 7 | | | | (7,907 | ) | |
@ Amount is less than $500.
@@ Amount is less than 500 shares.
The following information was previously reported in the December 31, 2017 financial statements. The distribution information for the year ended December 31, 2017 presented on the Statements of Changes in Net Assets is presented for comparative purposes to the December 31, 2018 financial statements, which conform to the SEC Final Rule on Disclosure Update and Simplification which was effective November 5, 2018.
* Dividends and Distributions to Shareholders for the year ended December 31, 2017 were as follows:
Class I: | |
Net Investment Income | | $ | (463 | ) | |
Net Realized Gain | | $ | (249 | ) | |
Class A: | |
Net Investment Income | | $ | (2 | ) | |
Net Realized Gain | | $ | (3 | ) | |
Class C: | |
Net Realized Gain | | $ | (3 | ) | |
Class IS: | |
Net Investment Income | | $ | (95 | ) | |
Net Realized Gain | | $ | (50 | ) | |
† Distributions in Excess of Net Investment Income for the year ended December 31, 2017 was $(220).
The accompanying notes are an integral part of the financial statements.
11
Morgan Stanley Institutional Fund, Inc.
Annual Report — December 31, 2018
Financial Highlights
Emerging Markets Leaders Portfolio
| | | Class I | |
| | | Year Ended December 31, | | Period from
January 5, 2015(2) to | |
Selected Per Share Data and Ratios | | 2018 | | 2017 | | 2016(1) | | December 31, 2015 | |
Net Asset Value, Beginning of Period | | $ | 12.14 | | | $ | 9.73 | | | $ | 9.45 | | | $ | 10.00 | | |
Income (Loss) from Investment Operations: | |
Net Investment Income(3) | | | 0.03 | | | | 0.08 | | | | 0.04 | | | | 0.06 | | |
Net Realized and Unrealized Gain (Loss) | | | (1.74 | ) | | | 2.45 | | | | 0.25 | | | | (0.49 | ) | |
Total from Investment Operations | | | (1.71 | ) | | | 2.53 | | | | 0.29 | | | | (0.43 | ) | |
Distributions from and/or in Excess of: | |
Net Investment Income | | | (0.01 | ) | | | (0.08 | ) | | | (0.01 | ) | | | (0.12 | ) | |
Net Realized Gain | | | (0.04 | ) | | | (0.04 | ) | | | — | | | | — | | |
Paid-in-Capital | | | — | | | | — | | | | (0.00 | )(4) | | | — | | |
Total Distributions | | | (0.05 | ) | | | (0.12 | ) | | | (0.01 | ) | | | (0.12 | ) | |
Redemption Fees | | | 0.00 | (4) | | | 0.00 | (4) | | | 0.00 | (4) | | | — | | |
Net Asset Value, End of Period | | $ | 10.38 | | | $ | 12.14 | | | $ | 9.73 | | | $ | 9.45 | | |
Total Return(5) | | | (14.12 | )% | | | 26.01 | % | | | 3.08 | % | | | (4.26 | )%(7) | |
Ratios and Supplemental Data: | |
Net Assets, End of Period (Thousands) | | $ | 39,206 | | | $ | 73,273 | | | $ | 25,374 | | | $ | 13,379 | | |
Ratio of Expenses to Average Net Assets(9) | | | 1.17 | %(6) | | | 1.11 | %(6) | | | 1.10 | %(6) | | | 1.14 | %(6)(8) | |
Ratio of Expenses to Average Net Assets Excluding Non Operating Expenses | | | 1.16 | %(6) | | | N/A | | | | N/A | | | | N/A | | |
Ratio of Net Investment Income to Average Net Assets(9) | | | 0.29 | %(6) | | | 0.67 | %(6) | | | 0.37 | %(6) | | | 0.65 | %(6)(8) | |
Ratio of Rebate from Morgan Stanley Affiliates to Average Net Assets | | | 0.01 | % | | | 0.01 | % | | | 0.02 | % | | | 0.01 | %(8) | |
Portfolio Turnover Rate | | | 47 | % | | | 79 | % | | | 45 | % | | | 36 | % | |
(9) Supplemental Information on the Ratios to Average Net Assets: | |
Ratios Before Expense Limitation: | |
Expenses to Average Net Assets | | | 1.48 | % | | | 1.43 | % | | | 1.32 | % | | | 2.80 | %(8) | |
Net Investment Income (Loss) to Average Net Assets | | | (0.02 | )% | | | 0.35 | % | | | 0.15 | % | | | (1.01 | )%(8) | |
(1) Reflects prior period Custodian out-of-pocket expenses that were reimbursed in September 2016. The amount of the reimbursement was immaterial on a per share basis and did not impact the total return of Class I shares. The Ratio of Expenses to Average Net Assets and the Ratio of Net Investment Income to Average Net Assets would be unchanged as the reimbursement of Custodian fees was offset against expense waivers/reimbursements with no impact to net expenses or net investment income.
(2) Date of Reorganization (close of business).
(3) Per share amount is based on average shares outstanding.
(4) Amount is less than $0.005 per share.
(5) Calculated based on the net asset value as of the last business day of the period.
(6) The Ratios of Expenses and Net Investment Income reflect the rebate of certain Fund expenses in connection with the investments in Morgan Stanley affiliates during the period. The effect of the rebate on the ratios is disclosed in the above table as "Ratio of Rebate from Morgan Stanley Affiliates to Average Net Assets."
(7) Not annualized.
(8) Annualized.
The accompanying notes are an integral part of the financial statements.
12
Morgan Stanley Institutional Fund, Inc.
Annual Report — December 31, 2018
Financial Highlights
Emerging Markets Leaders Portfolio
| | | Class A | |
| | | Year Ended December 31, | | Period from
January 5, 2015(2) to | |
Selected Per Share Data and Ratios | | 2018 | | 2017 | | 2016(1) | | December 31, 2015 | |
Net Asset Value, Beginning of Period | | $ | 12.06 | | | $ | 9.67 | | | $ | 9.43 | | | $ | 10.00 | | |
Income (Loss) from Investment Operations: | |
Net Investment Income (Loss)(3) | | | (0.00 | )(4) | | | 0.02 | | | | (0.03 | ) | | | 0.02 | | |
Net Realized and Unrealized Gain (Loss) | | | (1.73 | ) | | | 2.44 | | | | 0.28 | | | | (0.48 | ) | |
Total from Investment Operations | | | (1.73 | ) | | | 2.46 | | | | 0.25 | | | | (0.46 | ) | |
Distributions from and/or in Excess of: | |
Net Investment Income | | | — | | | | (0.03 | ) | | | (0.01 | ) | | | (0.11 | ) | |
Net Realized Gain | | | (0.04 | ) | | | (0.04 | ) | | | — | | | | — | | |
Paid-in-Capital | | | — | | | | — | | | | (0.00 | )(4) | | | — | | |
Total Distributions | | | (0.04 | ) | | | (0.07 | ) | | | (0.01 | ) | | | (0.11 | ) | |
Redemption Fees | | | 0.00 | (4) | | | 0.00 | (4) | | | 0.00 | (4) | | | — | | |
Net Asset Value, End of Period | | $ | 10.29 | | | $ | 12.06 | | | $ | 9.67 | | | $ | 9.43 | | |
Total Return(5) | | | (14.41 | )% | | | 25.46 | % | | | 2.63 | % | | | (4.61 | )%(7) | |
Ratios and Supplemental Data: | |
Net Assets, End of Period (Thousands) | | $ | 1,024 | | | $ | 1,102 | | | $ | 821 | | | $ | 182 | | |
Ratio of Expenses to Average Net Assets(9) | | | 1.55 | %(6) | | | 1.54 | %(6) | | | 1.53 | %(6) | | | 1.54 | %(6)(8) | |
Ratio of Expenses to Average Net Assets Excluding Non Operating Expenses | | | 1.54 | %(6) | | | N/A | | | | N/A | | | | N/A | | |
Ratio of Net Investment Income (Loss) to Average Net Assets(9) | | | (0.04 | )%(6) | | | 0.18 | %(6) | | | (0.33 | )%(6) | | | 0.21 | %(6)(8) | |
Ratio of Rebate from Morgan Stanley Affiliates to Average Net Assets | | | 0.01 | % | | | 0.01 | % | | | 0.02 | % | | | 0.01 | %(8) | |
Portfolio Turnover Rate | | | 47 | % | | | 79 | % | | | 45 | % | | | 36 | % | |
(9) Supplemental Information on the Ratios to Average Net Assets: | |
Ratios Before Expense Limitation: | |
Expenses to Average Net Assets | | | 1.93 | % | | | 2.01 | % | | | 1.96 | % | | | 5.89 | %(8) | |
Net Investment Loss to Average Net Assets | | | (0.42 | )% | | | (0.29 | )% | | | (0.76 | )% | | | (4.14 | )%(8) | |
(1) Reflects prior period Custodian out-of-pocket expenses that were reimbursed in September 2016. The amount of the reimbursement was immaterial on a per share basis and did not impact the total return of Class A shares. The Ratio of Expenses to Average Net Assets and the Ratio of Net Investment Loss to Average Net Assets would be unchanged as the reimbursement of Custodian fees was offset against expense waivers/reimbursements with no impact to net expenses or net investment loss.
(2) Date of Reorganization (close of business).
(3) Per share amount is based on average shares outstanding.
(4) Amount is less than $0.005 per share.
(5) Calculated based on the net asset value which does not reflect sales charges, if applicable, as of the last business day of the period.
(6) The Ratios of Expenses and Net Investment Income (Loss) reflect the rebate of certain Fund expenses in connection with the investments in Morgan Stanley affiliates during the period. The effect of the rebate on the ratios is disclosed in the above table as "Ratio of Rebate from Morgan Stanley Affiliates to Average Net Assets."
(7) Not annualized.
(8) Annualized.
The accompanying notes are an integral part of the financial statements.
13
Morgan Stanley Institutional Fund, Inc.
Annual Report — December 31, 2018
Financial Highlights
Emerging Markets Leaders Portfolio
| | | Class C | |
| | | Year Ended December 31, | | Period from
April 30, 2015(2) to | |
Selected Per Share Data and Ratios | | 2018 | | 2017 | | 2016(1) | | December 31, 2015 | |
Net Asset Value, Beginning of Period | | $ | 11.90 | | | $ | 9.59 | | | $ | 9.42 | | | $ | 10.61 | | |
Income (Loss) from Investment Operations: | |
Net Investment Loss(3) | | | (0.09 | ) | | | (0.06 | ) | | | (0.10 | ) | | | (0.06 | ) | |
Net Realized and Unrealized Gain (Loss) | | | (1.69 | ) | | | 2.41 | | | | 0.28 | | | | (1.07 | ) | |
Total from Investment Operations | | | (1.78 | ) | | | 2.35 | | | | 0.18 | | | | (1.13 | ) | |
Distributions from and/or in Excess of: | |
Net Investment Income | | | — | | | | — | | | | (0.01 | ) | | | (0.06 | ) | |
Net Realized Gain | | | (0.04 | ) | | | (0.04 | ) | | | — | | | | — | | |
Paid-in-Capital | | | — | | | | — | | | | (0.00 | )(4) | | | — | | |
Total Distributions | | | (0.04 | ) | | | (0.04 | ) | | | (0.01 | ) | | | (0.06 | ) | |
Redemption Fees | | | 0.00 | (4) | | | 0.00 | (4) | | | 0.00 | (4) | | | — | | |
Net Asset Value, End of Period | | $ | 10.08 | | | $ | 11.90 | | | $ | 9.59 | | | $ | 9.42 | | |
Total Return(5) | | | (15.02 | )% | | | 24.53 | % | | | 1.89 | % | | | (10.61 | )%(8) | |
Ratios and Supplemental Data: | |
Net Assets, End of Period (Thousands) | | $ | 780 | | | $ | 926 | | | $ | 587 | | | $ | 100 | | |
Ratio of Expenses to Average Net Assets(10) | | | 2.30 | %(6) | | | 2.29 | %(6) | | | 2.28 | %(6) | | | 2.30 | %(6)(9) | |
Ratio of Expenses to Average Net Assets Excluding Non Operating Expenses | | | 2.29 | %(6) | | | N/A | | | | N/A | | | | N/A | | |
Ratio of Net Investment Loss to Average Net Assets(10) | | | (0.83 | )%(6) | | | (0.49 | )%(6) | | | (0.99 | )%(6) | | | (0.85 | )%(6)(9) | |
Ratio of Rebate from Morgan Stanley Affiliates to Average Net Assets | | | 0.01 | % | | | 0.01 | % | | | 0.02 | % | | | 0.00 | %(7)(9) | |
Portfolio Turnover Rate | | | 47 | % | | | 79 | % | | | 45 | % | | | 36 | % | |
(10) Supplemental Information on the Ratios to Average Net Assets: | |
Ratios Before Expense Limitation: | |
Expenses to Average Net Assets | | | 2.75 | % | | | 2.80 | % | | | 3.08 | % | | | 5.73 | %(9) | |
Net Investment Loss to Average Net Assets | | | (1.28 | )% | | | (1.00 | )% | | | (1.79 | )% | | | (4.28 | )%(9) | |
(1) Reflects prior period Custodian out-of-pocket expenses that were reimbursed in September 2016. The amount of the reimbursement was immaterial on a per share basis and did not impact the total return of Class C shares. The Ratio of Expenses to Average Net Assets and the Ratio of Net Investment Loss to Average Net Assets would be unchanged as the reimbursement of Custodian fees was offset against expense waivers/reimbursements with no impact to net expenses or net investment loss.
(2) Commencement of Offering.
(3) Per share amount is based on average shares outstanding.
(4) Amount is less than $0.005 per share.
(5) Calculated based on the net asset value which does not reflect sales charges, if applicable, as of the last business day of the period.
(6) The Ratios of Expenses and Net Investment Loss reflect the rebate of certain Fund expenses in connection with the investments in Morgan Stanley affiliates during the period. The effect of the rebate on the ratios is disclosed in the above table as "Ratio of Rebate from Morgan Stanley Affiliates to Average Net Assets."
(7) Amount is less than 0.005%.
(8) Not annualized.
(9) Annualized.
The accompanying notes are an integral part of the financial statements.
14
Morgan Stanley Institutional Fund, Inc.
Annual Report — December 31, 2018
Financial Highlights
Emerging Markets Leaders Portfolio
| | | Class IS | |
| | | Year Ended December 31, | | Period from
January 5, 2015(2) to | |
Selected Per Share Data and Ratios | | 2018 | | 2017 | | 2016(1) | | December 31, 2015 | |
Net Asset Value, Beginning of Period | | $ | 12.14 | | | $ | 9.73 | | | $ | 9.45 | | | $ | 10.00 | | |
Income (Loss) from Investment Operations: | |
Net Investment Income (Loss)(3) | | | 0.04 | | | | 0.08 | | | | (0.00 | )(4) | | | 0.07 | | |
Net Realized and Unrealized Gain (Loss) | | | (1.74 | ) | | | 2.45 | | | | 0.29 | | | | (0.50 | ) | |
Total from Investment Operations | | | (1.70 | ) | | | 2.53 | | | | 0.29 | | | | (0.43 | ) | |
Distributions from and/or in Excess of: | |
Net Investment Income | | | (0.02 | ) | | | (0.08 | ) | | | (0.01 | ) | | | (0.12 | ) | |
Net Realized Gain | | | (0.04 | ) | | | (0.04 | ) | | | — | | | | — | | |
Paid-in-Capital | | | — | | | | — | | | | (0.00 | )(4) | | | — | | |
Total Distributions | | | (0.06 | ) | | | (0.12 | ) | | | (0.01 | ) | | | (0.12 | ) | |
Redemption Fees | | | 0.00 | (4) | | | 0.00 | (4) | | | 0.00 | (4) | | | — | | |
Net Asset Value, End of Period | | $ | 10.38 | | | $ | 12.14 | | | $ | 9.73 | | | $ | 9.45 | | |
Total Return(5) | | | (14.03 | )% | | | 26.02 | % | | | 3.09 | % | | | (4.25 | )%(9) | |
Ratios and Supplemental Data: | |
Net Assets, End of Period (Thousands) | | $ | 12,779 | | | $ | 14,868 | | | $ | 88,880 | | | $ | 15,925 | | |
Ratio of Expenses to Average Net Assets(11) | | | 1.10 | %(6) | | | 1.09 | %(6) | | | 1.08 | %(6) | | | 1.12 | %(6)(7)(10) | |
Ratio of Expenses to Average Net Assets Excluding Non Operating Expenses | | | 1.09 | %(6) | | | N/A | | | | N/A | | | | N/A | | |
Ratio of Net Investment Income (Loss) to Average Net Assets(11) | | | 0.38 | %(6) | | | 0.72 | %(6) | | | (0.00 | )%(6)(8) | | | 0.75 | %(6)(10) | |
Ratio of Rebate from Morgan Stanley Affiliates to Average Net Assets | | | 0.01 | % | | | 0.01 | % | | | 0.02 | % | | | 0.01 | %(10) | |
Portfolio Turnover Rate | | | 47 | % | | | 79 | % | | | 45 | % | | | 36 | % | |
(11) Supplemental Information on the Ratios to Average Net Assets: | |
Ratios Before Expense Limitation: | |
Expenses to Average Net Assets | | | 1.44 | % | | | 1.42 | % | | | 1.31 | % | | | 2.65 | %(10) | |
Net Investment Income (Loss) to Average Net Assets | | | 0.04 | % | | | 0.39 | % | | | (0.23 | )% | | | (0.78 | )%(10) | |
(1) Reflects prior period Custodian out-of-pocket expenses that were reimbursed in September 2016. The amount of the reimbursement was immaterial on a per share basis and did not impact the total return of Class IS shares. The Ratio of Expenses to Average Net Assets and the Ratio of Net Investment Loss to Average Net Assets would be unchanged as the reimbursement of Custodian fees was offset against expense waivers/reimbursements with no impact to net expenses or net investment loss.
(2) Date of Reorganization (close of business).
(3) Per share amount is based on average shares outstanding.
(4) Amount is less than $0.005 per share.
(5) Calculated based on the net asset value as of the last business day of the period.
(6) The Ratios of Expenses and Net Investment Income (Loss) reflect the rebate of certain Fund expenses in connection with the investments in Morgan Stanley affiliates during the period. The effect of the rebate on the ratios is disclosed in the above table as "Ratio of Rebate from Morgan Stanley Affiliates to Average Net Assets."
(7) Effective September 30, 2015, the Adviser has agreed to limit the ratio of expenses to average net assets to the maximum ratio of 1.10% for Class IS shares. Prior to September 30, 2015, the maximum ratio was 1.15% for Class IS shares.
(8) Amount is less than 0.005%.
(9) Not annualized.
(10) Annualized.
The accompanying notes are an integral part of the financial statements.
15
Morgan Stanley Institutional Fund, Inc.
Annual Report — December 31, 2018
Notes to Financial Statements
Morgan Stanley Institutional Fund, Inc. (the "Company") is registered under the Investment Company Act of 1940, as amended (the "Act"), as an open-end management investment company. The Company is comprised of thirty separate, active, diversified and non-diversified funds (individually referred to as a "Fund", collectively as the "Funds"). The Company applies investment company accounting and reporting guidance.
The accompanying financial statements relate to the Emerging Markets Leaders Portfolio. The Fund seeks long-term capital appreciation.
The Fund offers four classes of shares — Class I, Class A, Class C and Class IS.
A. Significant Accounting Policies: The following significant accounting policies are in conformity with U.S. generally accepted accounting principles ("GAAP"). Such policies are consistently followed by the Company in the preparation of its financial statements. GAAP may require management to make estimates and assumptions that affect the reported amounts and disclosures in the financial statements. Actual results may differ from those estimates.
In August 2018, the Financial Accounting Standards Board ("FASB") issued Accounting Standards Update ("ASU") 2018-13, Fair Value Measurement (Topic 820) — Disclosures Framework — Changes to Disclosure Requirements of Fair Value Measurement ("ASU 2018-13") which introduces new fair value disclosure requirements as well as eliminates and modifies certain existing fair value disclosure requirements. ASU 2018-13 would be effective for fiscal years beginning after December 15, 2019 and for interim periods within those fiscal years; however, management has elected to early adopt ASU 2018-13 effective with the current reporting period as permitted by the standard. The impact of the Fund's adoption was limited to changes in the Fund's financial statement disclosures regarding fair value, primarily those disclosures related to transfers between levels of the fair value hierarchy and disclosure of the range and weighted average used to develop significant unobservable inputs for Level 3 fair value measurements, when applicable.
1. Security Valuation: (1) An equity portfolio security listed or traded on an exchange is valued at its latest reported sales price (or at the exchange official closing price if such exchange reports an official closing price), and if there were no sales on a given day and if there is no official
exchange closing price for that day, the security is valued at the mean between the last reported bid and asked prices if such bid and asked prices are available on the relevant exchanges. Listed equity securities not traded on the valuation date with no reported bid and asked prices available on the exchange are valued at the mean between the current bid and asked prices obtained from one or more reputable brokers or dealers. In cases where a security is traded on more than one exchange, the security is valued on the exchange designated as the primary market; (2) all other equity portfolio securities for which over-the-counter ("OTC") market quotations are readily available are valued at the latest reported sales price (or at the market official closing price if such market reports an official closing price), and if there was no trading in the security on a given day and if there is no official closing price from relevant markets for that day, the security is valued at the mean between the last reported bid and asked prices if such bid and asked prices are available on the relevant markets. An unlisted equity security that does not trade on the valuation date and for which bid and asked prices from the relevant markets are unavailable is valued at the mean between the current bid and asked prices obtained from one or more reputable brokers or dealers; (3) certain portfolio securities may be valued by an outside pricing service/vendor approved by the Company's Board of Directors (the "Directors"). The pricing service/vendor may employ a pricing model that takes into account, among other things, bids, yield spreads and/or other market data and specific security characteristics. Alternatively, if a valuation is not available from an outside pricing service/vendor, and the security trades on an exchange, the security may be valued at its latest reported sale price (or at the exchange official closing price if such exchange reports an official closing price), prior to the time when assets are valued. If there are no sales on a given day and if there is no official exchange closing price for that day, the security is valued at the mean between the last reported bid and asked prices if such bid and asked prices are available in the relevant exchanges; (4) when market quotations are not readily available, including circumstances under which Morgan Stanley Investment Management Inc. (the "Adviser") or Morgan Stanley Investment Management Company ("MSIM Company") (the "Sub-Adviser"), each a wholly-owned subsidiary of Morgan Stanley, determines
16
Morgan Stanley Institutional Fund, Inc.
Annual Report — December 31, 2018
Notes to Financial Statements (cont'd)
that the closing price, last sale price or the mean between the last reported bid and asked prices are not reflective of a security's market value, portfolio securities are valued at their fair value as determined in good faith under procedures established by and under the general supervision of the Directors . Occasionally, developments affecting the closing prices of securities and other assets may occur between the times at which valuations of such securities are determined (that is, close of the foreign market on which the securities trade) and the close of business of the New York Stock Exchange ("NYSE"). If developments occur during such periods that are expected to materially affect the value of such securities, such valuations may be adjusted to reflect the estimated fair value of such securities as of the close of the NYSE, as determined in good faith by the Directors or by the Adviser using a pricing service and/or procedures approved by the Directors; (5) quotations of foreign portfolio securities, other assets and liabilities and forward contracts stated in foreign currency are translated into U.S. dollar equivalents at the prevailing market rates prior to the close of the NYSE; and (6) investments in mutual funds, including the Morgan Stanley Institutional Liquidity Funds, are valued at the net asset value ("NAV") as of the close of each business day.
The Directors have responsibility for determining in good faith the fair value of the investments, and the Directors may appoint others, such as the Company's Adviser or a valuation committee, to assist the Directors in determining fair value and to make the actual calculations pursuant to the fair valuation methodologies previously approved by the Directors. Under procedures approved by the Directors, the Company's Adviser has formed a Valuation Committee whose members are approved by the Directors. The Valuation Committee provides administration and oversight of the Company's valuation policies and procedures, which are reviewed at least annually by the Directors. These procedures allow the Company to utilize independent pricing services, quotations from securities and financial instrument dealers and other market sources to determine fair value.
2. Fair Value Measurement: FASB Accounting Standards CodificationTM ("ASC") 820, "Fair Value Measurement" ("ASC 820"), defines fair value as the value that the
Fund would receive to sell an investment or pay to transfer a liability in a timely transaction with an independent buyer in the principal market, or in the absence of a principal market, the most advantageous market for the investment or liability. ASC 820 establishes a three-tier hierarchy to distinguish between (1) inputs that reflect the assumptions market participants would use in valuing an asset or liability developed based on market data obtained from sources independent of the reporting entity (observable inputs) and (2) inputs that reflect the reporting entity's own assumptions about the assumptions market participants would use in valuing an asset or liability developed based on the best information available in the circumstances (unobservable inputs) and to establish classification of fair value measurements for disclosure purposes. Various inputs are used in determining the value of the Fund's investments. The inputs are summarized in the three broad levels listed below:
• Level 1 – unadjusted quoted prices in active markets for identical investments
• Level 2 – other significant observable inputs (including quoted prices for similar investments, interest rates, prepayment speeds, credit risk, etc.)
• Level 3 – significant unobservable inputs including the Fund's own assumptions in determining the fair value of investments. Factors considered in making this determination may include, but are not limited to, information obtained by contacting the issuer, analysts, or the appropriate stock exchange (for exchange-traded securities), analysis of the issuer's financial statements or other available documents and, if necessary, available information concerning other securities in similar circumstances
The inputs or methodology used for valuing securities are not necessarily an indication of the risk associated with investing in those securities and the determination of the significance of a particular input to the fair value measurement in its entirety requires judgment and considers factors specific to each security.
17
Morgan Stanley Institutional Fund, Inc.
Annual Report — December 31, 2018
Notes to Financial Statements (cont'd)
The following is a summary of the inputs used to value the Fund's investments as of December 31, 2018:
Investment Type | | Level 1
Unadjusted
quoted
prices
(000) | | Level 2
Other
significant
observable
inputs
(000) | | Level 3
Significant
unobservable
inputs
(000) | | Total
(000) | |
Assets: | |
Common Stocks | |
Banks | | $ | 1,596 | | | $ | 8,089 | | | $ | — | | | $ | 9,685 | | |
Diversified Financial
Services | | | — | | | | 1,846 | | | | — | | | | 1,846 | | |
Electrical Equipment | | | — | | | | 2,298 | | | | — | | | | 2,298 | | |
Food & Staples Retailing | | | — | | | | 2,043 | | | | — | | | | 2,043 | | |
Health Care Equipment &
Supplies | | | — | | | | 1,388 | | | | — | | | | 1,388 | | |
Health Care Providers &
Services | | | — | | | | 4,819 | | | | — | | | | 4,819 | | |
Hotels, Restaurants &
Leisure | | | 1,104 | | | | 1,737 | | | | — | | | | 2,841 | | |
Household Durables | | | — | | | | 1,776 | | | | — | | | | 1,776 | | |
Information Technology
Services | | | 1,001 | | | | — | | | | — | | | | 1,001 | | |
Insurance | | | — | | | | 2,858 | | | | — | | | | 2,858 | | |
Interactive Media &
Services | | | 2,851 | | | | 3,429 | | | | — | | | | 6,280 | | |
Internet & Direct Marketing
Retail | | | 931 | | | | — | | | | — | | | | 931 | | |
Machinery | | | — | | | | 1,920 | | | | — | | | | 1,920 | | |
Multi-Line Retail | | | — | | | | 1,484 | | | | — | | | | 1,484 | | |
Personal Products | | | — | | | | 1,631 | | | | — | | | | 1,631 | | |
Semiconductors &
Semiconductor
Equipment | | | — | | | | 4,243 | | | | — | | | | 4,243 | | |
Textiles, Apparel & Luxury
Goods | | | — | | | | 4,934 | | | | — | | | | 4,934 | | |
Total Common Stocks | | | 7,483 | | | | 44,495 | | | | — | | | | 51,978 | | |
Short-Term Investment | |
Investment Company | | | 1,782 | | | | — | | | | — | | | | 1,782 | | |
Total Assets | | $ | 9,265 | | | $ | 44,495 | | | $ | — | | | $ | 53,760 | | |
Transfers between investment levels may occur as the markets fluctuate and/or the availability of data used in an investment's valuation changes.
3. Foreign Currency Translation and Foreign Investments: The books and records of the Fund are maintained in U.S. dollars. Foreign currency amounts are translated into U.S. dollars as follows:
– investments, other assets and liabilities at the prevailing rate of exchange on the valuation date;
– investment transactions and investment income at the prevailing rates of exchange on the dates of such transactions.
Although the net assets of the Fund are presented at the foreign exchange rates and market values at the close of
the period, the Fund does not isolate that portion of the results of operations arising as a result of changes in the foreign exchange rates from the fluctuations arising from changes in the market prices of securities held at period end. Similarly, the Fund does not isolate the effect of changes in foreign exchange rates from the fluctuations arising from changes in the market prices of securities sold during the period. Accordingly, realized and unrealized foreign currency gains (losses) on investments in securities are included in the reported net realized and unrealized gains (losses) on investment transactions and balances. However, pursuant to U.S. federal income tax regulations, gains and losses from certain foreign currency transactions and the foreign currency portion of gains and losses realized on sales and maturities of foreign denominated debt securities are treated as ordinary income for U.S. federal income tax purposes.
Net realized gains (losses) on foreign currency transactions represent net foreign exchange gains (losses) from foreign currency forward exchange contracts, disposition of foreign currencies, currency gains (losses) realized between the trade and settlement dates on securities transactions, and the difference between the amount of investment income and foreign withholding taxes recorded on the Fund's books and the U.S. dollar equivalent amounts actually received or paid. Net unrealized currency gains (losses) from valuing foreign currency denominated assets and liabilities at period end exchange rates are reflected as a component of unrealized appreciation (depreciation) in the Statement of Assets and Liabilities. The change in unrealized currency gains (losses) on foreign currency translations for the period is reflected in the Statement of Operations.
Foreign security and currency transactions may involve certain considerations and risks not typically associated with those of U.S. dollar denominated transactions as a result of, among other factors, fluctuations of exchange rates in relation to the U.S. dollar, the possibility of lower levels of governmental supervision and regulation of foreign securities markets and the possibility of political or economic instability.
Governmental approval for foreign investments may be required in advance of making an investment under certain circumstances in some countries, and the extent of
18
Morgan Stanley Institutional Fund, Inc.
Annual Report — December 31, 2018
Notes to Financial Statements (cont'd)
foreign investments in domestic companies may be subject to limitation in other countries. Foreign ownership limitations also may be imposed by the charters of individual companies to prevent, among other concerns, violations of foreign investment limitations. As a result, an additional class of shares (identified as "Foreign" in the Portfolio of Investments) may be created and offered for investment. The "local" and "foreign shares" market values may differ. In the absence of trading of the foreign shares in such markets, the Fund values the foreign shares at the closing exchange price of the local shares.
4. Redemption Fees: The Fund will assess a 2% redemption fee on Class I shares, Class A shares, Class C shares and Class IS shares, which is paid directly to the Fund, for shares redeemed or exchanged within thirty days of purchase, subject to certain exceptions. The redemption fee is designed to protect the Fund and its remaining shareholders from the effects of short-term trading. These fees, if any, are included in the Statements of Changes in Net Assets.
5. Indemnifications: The Company enters into contracts that contain a variety of indemnifications. The Company's maximum exposure under these arrangements is unknown. However, the Company has not had prior claims or losses pursuant to these contracts and expects the risk of loss to be remote.
6. Dividends and Distributions to Shareholders: Dividends and distributions to shareholders are recorded on the ex-dividend date. Dividends from net investment income, if any, are declared and paid annually. Net realized capital gains, if any, are distributed at least annually.
7. Security Transactions, Income and Expenses: Security transactions are accounted for on the trade date (date the order to buy or sell is executed). Realized gains and losses on the sale of investment securities are determined on the specific identified cost method. Dividend income and other distributions are recorded on the ex-dividend date (except for certain foreign dividends which may be recorded as soon as the Fund is informed of such dividends) net of applicable withholding taxes. Interest income is recognized on the accrual basis except where collection is in doubt. Discounts are accreted and premiums are amortized over the life of the respective securities. Most expenses of the Company can be directly attributed to a particular Fund. Expenses which cannot be directly attributed are apportioned among the Funds based upon
relative net assets or other appropriate methods. Income, expenses (other than class specific expenses — distribution and shareholder services, transfer agency and sub transfer agency fees) and realized and unrealized gains or losses are allocated to each class of shares based upon their relative net assets.
B. Advisory/Sub-Advisory Fees: The Adviser, a wholly-owned subsidiary of Morgan Stanley, provides the Fund with advisory services under the terms of an Investment Advisory Agreement, paid quarterly, at the annual rate based on the daily net assets as follows:
First $1
billion | | Over $1
billion | |
| | 0.90 | % | | | 0.85 | % | |
For the year ended December 31, 2018, the advisory fee rate (net of waiver/rebate) was equivalent to an annual effective rate of 0.58% of the Fund's average daily net assets.
The Adviser has agreed to reduce its advisory fee and/or reimburse the Fund so that total annual portfolio operating expenses, excluding certain investment related expenses, taxes, interest and other extraordinary expenses (including litigation), will not exceed 1.20% for Class I shares, 1.55% for Class A shares, 2.30% for Class C shares and 1.10% for Class IS shares. The fee waivers and/or expense reimbursements will continue for at least one year from the date of the Fund's prospectus or until such time as the Directors act to discontinue all or a portion of such waivers and/or reimbursements when they deem such action is appropriate. For the year ended December 31, 2018, approximately $211,000 of advisory fees were waived and approximately $4,000 of other expenses were reimbursed by the Adviser pursuant to this arrangement.
The Adviser has entered into a Sub-Advisory Agreement with the Sub-Adviser, a wholly-owned subsidiary of Morgan Stanley. The Sub-Adviser provides the Fund with advisory services subject to the overall supervision of the Adviser and the Fund's Officers and Directors. The Adviser pays the Sub-Adviser on a monthly basis a portion of the net advisory fees the Adviser receives from the Fund.
C. Administration Fees: The Adviser also serves as Administrator to the Company and provides administrative services pursuant to an Administration Agreement for an annual fee, accrued daily and paid monthly, of 0.08% of the Fund's average daily net assets.
Under a Sub-Administration Agreement between the Administrator and State Street Bank and Trust Company ("State Street"), State Street provides certain administrative services to
19
Morgan Stanley Institutional Fund, Inc.
Annual Report — December 31, 2018
Notes to Financial Statements (cont'd)
the Company. For such services, the Administrator pays State Street a portion of the fee the Administrator receives from the Fund.
D. Distribution and Shareholder Services Fees: Morgan Stanley Distribution, Inc. ("MSDI" or the "Distributor"), a wholly-owned subsidiary of the Adviser and an indirect subsidiary of Morgan Stanley, serves as the Company's Distributor of Fund shares pursuant to a Distribution Agreement. The Company has adopted a Shareholder Services Plan with respect to Class A shares pursuant to Rule 12b-1 under the Act. Under the Shareholder Services Plan, the Fund pays the Distributor a shareholder services fee, accrued daily and paid monthly, at an annual rate of 0.25% of the Fund's average daily net assets attributable to Class A shares.
The Company has adopted a Distribution and Shareholder Services Plan with respect to Class C shares pursuant to Rule 12b-1 under the Act. Under the Distribution and Shareholder Services Plan, the Fund pays the Distributor a distribution fee, accrued daily and paid monthly, at an annual rate of 0.75% and a shareholder services fee, accrued daily and paid monthly, at an annual rate of 0.25% of the Fund's average daily net assets attributable to Class C shares.
The distribution and shareholder services fees are used to support the expenses associated with servicing and maintaining accounts. The Distributor may compensate other parties for providing shareholder support services to investors who purchase Class A and Class C shares.
E. Dividend Disbursing and Transfer Agent: The Company's dividend disbursing and transfer agent is DST Asset Manager Solutions, Inc. ("DST"). Pursuant to a Transfer Agency Agreement, the Company pays DST a fee based on the number of classes, accounts and transactions relating to the Funds of the Company.
F. Custodian Fees: State Street (the "Custodian") also serves as Custodian for the Company in accordance with a Custodian Agreement. The Custodian holds cash, securities and other assets of the Company as required by the Act. Custody fees are payable monthly based on assets held in custody, investment purchases and sales activity and account maintenance fees, plus reimbursement for certain out-of-pocket expenses.
G. Security Transactions and Transactions with Affiliates: For the year ended December 31, 2018, purchases and sales of investment securities for the Fund, other than
long-term U.S. Government securities and short-term investments were approximately $31,484,000 and $56,352,000, respectively. There were no purchases and sales of long-term U.S. Government securities for the year ended December 31, 2018.
The Fund invests in the Institutional Class of the Morgan Stanley Institutional Liquidity Funds — Government Portfolio (the "Liquidity Funds"), an open-end management investment company managed by the Adviser. Advisory fees paid by the Fund are reduced by an amount equal to its pro-rata share of the advisory and administration fees paid by the Fund due to its investment in the Liquidity Funds. For the year ended December 31, 2018, advisory fees paid were reduced by approximately $4,000 relating to the Fund's investment in the Liquidity Funds.
A summary of the Fund's transactions in shares of affiliated investments during the year ended December 31, 2018 is as follows:
Affiliated
Investment
Company | | Value
December 31,
2017
(000) | | Purchases
at Cost
(000) | | Proceeds
from Sales
(000) | | Dividend
Income
(000) | |
Liquidity Funds | | $ | 3,309 | | | $ | 32,769 | | | $ | 34,296 | | | $ | 37 | | |
Affiliated
Investment
Company (cont'd) | | Realized
Gain (Loss)
(000) | | Change in
Unrealized
Appreciation
(Depreciation)
(000) | | Value
December 31,
2018
(000) | |
Liquidity Funds | | $ | — | | | $ | — | | | $ | 1,782 | | |
During the year ended December 31, 2018, the Fund incurred approximately $1,000 in brokerage commissions with Morgan Stanley & Co. LLC, an affiliate of the Adviser/Administrator, Sub-Adviser and Distributor, for portfolio transactions executed on behalf of the Fund.
The Fund is permitted to purchase and sell securities ("cross-trade") from and to other Morgan Stanley funds as well as other funds and client accounts for which the Adviser or an affiliate of the Adviser serves as investment adviser, pursuant to procedures approved by the Directors in compliance with Rule 17a-7 under the Act (the "Rule"). Each cross-trade is executed at the current market price in compliance with provisions of the Rule. For the year ended December 31, 2018, the Fund did not engage in any cross-trade transactions.
The Fund has an unfunded Deferred Compensation Plan (the "Compensation Plan"), which allows each independent Director to defer payment of all, or a portion, of the fees he or she receives for serving on the Board of Directors. Each eligible Director generally may elect to have the deferred amounts
20
Morgan Stanley Institutional Fund, Inc.
Annual Report — December 31, 2018
Notes to Financial Statements (cont'd)
credited with a return equal to the total return on one or more of the Morgan Stanley funds that are offered as investment options under the Compensation Plan. Appreciation/depreciation and distributions received from these investments are recorded with an offsetting increase/decrease in the deferred compensation obligation and do not affect the NAV of the Fund.
H. Federal Income Taxes: It is the Fund's intention to continue to qualify as a regulated investment company and distribute all of its taxable and tax-exempt income. Accordingly, no provision for Federal income taxes is required in the financial statements.
The Fund may be subject to taxes imposed by countries in which it invests. Such taxes are generally based on income and/or capital gains earned or repatriated. Taxes are accrued based on net investment income, net realized gains and net unrealized appreciation as such income and/or gains are earned. Taxes may also be based on transactions in foreign currency and are accrued based on the value of investments denominated in such currency.
FASB ASC 740-10, "Income Taxes — Overall", sets forth a minimum threshold for financial statement recognition of the benefit of a tax position taken or expected to be taken in a tax return. Management has concluded there are no significant uncertain tax positions that would require recognition in the financial statements. If applicable, the Fund recognizes interest accrued related to unrecognized tax benefits in "Interest Expense" and penalties in "Other Expenses" in the Statement of Operations. The Fund files tax returns with the U.S. Internal Revenue Service, New York and various states. Generally, each of the tax years in the four-year period ended December 31, 2018 remains subject to examination by taxing authorities.
The tax character of distributions paid may differ from the character of distributions for GAAP purposes due to short-term capital gains being treated as ordinary income for tax purposes. The tax character of distributions paid during fiscal years 2018 and 2017 was as follows:
2018
Distributions
Paid From: | | 2017
Distributions
Paid From: | |
Ordinary
Income
(000) | | Long-Term
Capital Gain
(000) | | Ordinary
Income
(000) | | Long-Term
Capital Gain
(000) | |
| $ | 61 | | | $ | 207 | | | $ | 555 | | | $ | 310 | | |
The amount and character of income and gains to be distributed are determined in accordance with income tax regulations which may differ from GAAP. These book/tax differences are either considered temporary or permanent in nature.
Temporary differences are primarily due to differing book and tax treatments in the timing of the recognition of gains (losses) on certain investment transactions and the timing of the deductibility of certain expenses.
Permanent differences, primarily due to a nondeductible expense, resulted in the following reclassifications among the components of net assets at December 31, 2018:
Total
Distributable
Earnings
(000) | | Paid-in-
Capital
(000) | |
| $ | 1 | | | $ | (1 | ) | |
At December 31, 2018, the components of distributable earnings for the Fund on a tax basis were as follows:
Undistributed
Ordinary
Income
(000) | | Undistributed
Long-Term
Capital Gain
(000) | |
| $ | — | | | $ | 800 | | |
Qualified late year losses are capital losses and specified ordinary losses, including currency losses, incurred after October 31 but within the taxable year that, if elected, are deemed to arise on the first day of the Fund's next taxable year. For the year ended December 31, 2018, the Fund intends to defer to January 1, 2019 for U.S. federal income tax purposes the following losses:
Qualified
Late Year
Ordinary
Losses
(000) | | Post-October
Capital Losses
(000) | |
| $ | 13 | | | $ | — | | |
I. Credit Facility: The Company and other Morgan Stanley funds participated in a $150,000,000 committed, unsecured revolving line of credit facility (the "Facility") with State Street. This Facility is to be used for temporary emergency purposes or funding of shareholder redemption requests. The interest rate on borrowings is based on the federal funds rate or 1 month LIBOR rate plus a spread. The Facility also has a commitment fee of 0.25% per annum based on the unused portion of the Facility. During the year ended December 31, 2018, the Fund did not have any borrowings under the Facility.
21
Morgan Stanley Institutional Fund, Inc.
Annual Report — December 31, 2018
Notes to Financial Statements (cont'd)
J. Other: At December 31, 2018, the Fund had record owners of 10% or greater. Investment activities of these shareholders could have a material impact on the Fund. The aggregate percentage of such owners was 76.6%.
22
Morgan Stanley Institutional Fund, Inc.
Annual Report — December 31, 2018
Report of Independent Registered Public Accounting Firm
To the Stockholders and Board of Directors of
Morgan Stanley Institutional Fund, Inc. —
Emerging Markets Leaders Portfolio
Opinion on the Financial Statements
We have audited the accompanying statement of assets and liabilities of Emerging Markets Leaders Portfolio (the "Fund") (one of the funds constituting the Morgan Stanley Institutional Fund, Inc. (the "Company")), including the portfolio of investments, as of December 31, 2018, and the related statement of operations for the year then ended, the statements of changes in net assets for each of the two years in the period then ended, the financial highlights for each of the three years in the period then ended and the period from January 5, 2015 (commencement of operations) through December 31, 2015 and the related notes (collectively referred to as the "financial statements"). In our opinion, the financial statements present fairly, in all material respects, the financial position of Emerging Markets Leaders Portfolio (one of the funds constituting Morgan Stanley Institutional Fund, Inc.) at December 31, 2018, the results of its operations for the year then ended, the changes in its net assets for each of the two years in the period then ended and its financial highlights for each of the three years in the period then ended and the period from January 5, 2015 (commencement of operations) through December 31, 2015, in conformity with U.S. generally accepted accounting principles.
Basis for Opinion
These financial statements are the responsibility of the Company's management. Our responsibility is to express an opinion on the Fund's financial statements based on our audits. We are a public accounting firm registered with the Public Company Accounting Oversight Board (United States) ("PCAOB") and are required to be independent with respect to the Company in accordance with the U.S. federal securities law and the applicable rules and regulations of the Securities and Exchange Commission and the PCAOB.
We conducted our audits in accordance with the standards of the PCAOB. Those standards require that we plan and perform the audit to obtain reasonable assurance about whether the financial statements are free of material misstatement, whether due to error or fraud. The Company is not required to have, nor were we engaged to perform, an audit of the Company's internal control over financial reporting. As part of our audits, we are required to obtain an understanding of internal control over financial reporting, but not for the purpose of expressing an opinion on the effectiveness of the Company's internal control over financial reporting. Accordingly, we express no such opinion.
Our audits included performing procedures to assess the risks of material misstatement of the financial statements, whether due to error or fraud, and performing procedures that respond to those risks. Such procedures included examining, on a test basis, evidence regarding the amounts and disclosures in the financial statements. Our procedures included confirmation of securities owned as of December 31, 2018 by correspondence with the custodian and others or by other appropriate auditing procedures where replies from others were not received. Our audits also included evaluating the accounting principles used and significant estimates made by management, as well as evaluating the overall presentation of the financial statements. We believe that our audits provide a reasonable basis for our opinion.

We have served as the auditor of one or more Morgan Stanley investment companies since 2000.
Boston, Massachusetts
February 26, 2019
23
Morgan Stanley Institutional Fund, Inc.
Annual Report — December 31, 2018
Federal Tax Notice (unaudited)
For federal income tax purposes, the following information is furnished with respect to the distributions paid by the Fund during its taxable year ended December 31, 2018.
The Fund designated and paid approximately $206,000 as a long-term capital gain distribution.
For federal income tax purposes, the following information is furnished with respect to the Fund's earnings for its taxable year ended December 31, 2018. When distributed, certain earnings may be subject to a maximum tax rate of 15% as provided for by the Jobs and Growth Tax Relief Reconciliation Act of 2003. The Fund designated up to a maximum of approximately $204,000 as taxable at this lower rate.
The Fund intends to pass through foreign tax credits of approximately $124,000 and has derived net income from sources within foreign countries amounting to approximately $1,093,000.
In January, the Fund provides tax information to shareholders for the preceding calendar year.
24
Morgan Stanley Institutional Fund, Inc.
Annual Report — December 31, 2018
Privacy Notice (unaudited)
MORGAN STANLEY INVESTMENT MANAGEMENT INC.
AN IMPORTANT NOTICE CONCERNING OUR U.S. PRIVACY POLICY
We are required by federal law to provide you with a copy of our privacy policy annually. This policy applies to current and former individual investors in funds managed or sponsored by Morgan Stanley Investment Management Inc. ("MSIM") as well as current and former individual clients of MSIM. This policy is not applicable to partnerships, corporations, trusts or other non-individual clients or investors. Please note that we may amend this policy at any time, and will inform you of any changes as required by law.
WE RESPECT YOUR PRIVACY
We appreciate that you have provided us with your personal financial information. We strive to maintain the privacy of such information while we help you achieve your financial objectives. This Notice describes what non-public personal information we collect about you, why we collect it, when we may share it with others and how certain others may use it. It discusses the steps you may take to limit our sharing of certain information about you to affiliated companies in the Morgan Stanley family of companies ("other Morgan Stanley companies"). It also discloses how you may limit use of certain shared information for marketing purposes by other Morgan Stanley branded companies. Throughout this policy, we refer to the non-public information that personally identifies you or your accounts as "personal information."
1. WHAT PERSONAL INFORMATION DO WE COLLECT ABOUT YOU?
We obtain personal information from applications and other forms you submit to us, from your dealings with us, from consumer reporting agencies, from our Web sites and from third parties and other sources.
For example:
• We may collect information such as your name, address, e-mail address, telephone/fax numbers, assets, income and investment objectives through subscription documents, applications and other forms you submit to us.
• We may obtain information about account balances, your use of account(s) and the types of products and services you prefer to receive from us through your dealings and transactions with us and other sources.
• We may obtain information about your creditworthiness and credit history from consumer reporting agencies.
• We may collect background information from and through third-party vendors to verify representations you have made and to comply with various regulatory requirements.
• If you interact with us through our public and private Web sites, we may collect information that you provide directly through online communications (such as an e-mail address). We may also collect information about your Internet service provider, your domain name, your computer's operating system and Web browser, your use of our Web sites and your product and service preferences, through the use of "cookies." Please consult the Terms of Use of these sites for more details.
2. WHEN DO WE DISCLOSE PERSONAL INFORMATION WE COLLECT ABOUT YOU?
We may disclose personal information we collect about you to other Morgan Stanley companies and to non-affiliated third parties.
a. Information We Disclose to Other Morgan Stanley Companies.
We may disclose personal information to other Morgan Stanley companies for a variety of reasons, including to manage your account(s) effectively, to service and process your transactions, to let you know about products and services offered by us and other Morgan Stanley companies, to manage our business, and as otherwise required or permitted by law. Offers for products and services from other Morgan Stanley companies are developed under conditions designed to safeguard your personal information.
25
Morgan Stanley Institutional Fund, Inc.
Annual Report — December 31, 2018
Privacy Notice (unaudited) (cont'd)
b. Information We Disclose to Non-affiliated Third Parties.
We do not disclose personal information that we collect about you to non-affiliated third parties except to those who provide marketing services on our behalf, to financial institutions with whom we have joint marketing agreements, and as otherwise required or permitted by law. For example, we may disclose personal information to non-affiliated third parties for servicing and processing transactions, to offer our own products and services, to protect against fraud, for institutional risk control, to respond to judicial process or to perform services on our behalf. When we share personal information with a non-affiliated third party, they are required to limit their use of personal information to the particular purpose for which it was shared and they are not allowed to share personal information with others except to fulfill that limited purpose or as may be permitted or required by law.
3. HOW DO WE PROTECT THE SECURITY AND CONFIDENTIALITY OF PERSONAL INFORMATION WE COLLECT ABOUT YOU?
We maintain physical, electronic and procedural security measures to help safeguard the personal information we collect about you. We have internal policies governing the proper handling of client information. Third parties that provide support or marketing services on our behalf may also receive personal information, and we require them to adhere to confidentiality standards with respect to such information.
4. HOW CAN YOU LIMIT THE SHARING OF CERTAIN TYPES OF PERSONAL INFORMATION WITH OTHER MORGAN STANLEY COMPANIES?
We offer you choices as to whether we share with other Morgan Stanley companies the personal information that was collected to determine your eligibility for products and services you request ("eligibility information"). Eligibility information does not include your identification information or personal information pertaining to our transactions or experiences with you. Please note that, even if you direct us not to share eligibility information with other Morgan Stanley companies ("opt-out"), we may still share personal information, including eligibility information, with those companies in circumstances excluded from the opt-out under applicable law, such as to process transactions or to service your account.
5. HOW CAN YOU LIMIT THE USE OF CERTAIN TYPES OF PERSONAL INFORMATION BY OTHER MORGAN STANLEY COMPANIES FOR MARKETING?
By following the opt-out instructions in Section 6 below, you may limit other Morgan Stanley branded companies from marketing their products or services to you based on personal information we disclose to them. This information may include, for example, your income and account history with us. Please note that, even if you choose to limit Other Morgan Stanley Companies from using personal information about you that we may share with them for marketing their products and services to you, Other Morgan Stanley Companies may use your personal information that they obtain from us to market to you in circumstances permitted by law, such as if the Other Morgan Stanley Company has its own relationship with you.
6. HOW CAN YOU SEND US AN OPT-OUT INSTRUCTION?
If you wish to limit our sharing of eligibility information about you with other Morgan Stanley companies or other Morgan Stanley companies' use of personal information for marketing purposes, as described in this notice, you may do so by:
• Calling us at (800) 548-7786
Monday–Friday between 8a.m. and 6p.m. (EST)
• Writing to us at the following address:
DST Asset Manager Solutions, Inc.
c/o Privacy Coordinator
P.O. Box 219804
Kansas City, Missouri 64121
26
Morgan Stanley Institutional Fund, Inc.
Annual Report — December 31, 2018
Privacy Notice (unaudited) (cont'd)
Your written request should include your name, address, telephone number and account number(s) to which the opt-out applies and whether you are opting out with respect to sharing of eligibility information (Section 4 above), or if information used for Marketing (Section 5 above) or both. Written opt-out requests should not be sent with any other correspondence. In order to process your request, we require that the request be provided by you directly and not through a third party.
Your opt-out preference will remain in effect with respect to this policy (as it may be amended) until you notify us otherwise. If you have a joint account, your direction for us not to share this information with other Morgan Stanley companies and for those other Morgan Stanley companies not to use your personal information for marketing will be applied to all account holders on that account. Please understand that if you limit our sharing or our affiliated companies' use of personal information, you and any joint account holder(s) may not receive information about Morgan Stanley products and services, including products or services that could help you manage your financial resources and achieve your investment objectives.
7. WHAT IF AN AFFILIATED COMPANY BECOMES A NON-AFFILIATED THIRD PARTY?
If, at any time in the future, an affiliated company becomes a non-affiliated third party, further disclosures of personal information made to the former affiliated company will be limited to those described in Section 2(b) above relating to non-affiliated third parties. If you elected under Section 6 to limit disclosures we make to affiliated companies, or use of personal information by affiliated companies, your election will not apply to use by any former affiliated company of your personal information in their possession once it becomes a non-affiliated third party.
SPECIAL NOTICE TO RESIDENTS OF VERMONT
The following section supplements our Policy with respect to our individual clients who have a Vermont address and supersedes anything to the contrary in the above Policy with respect to those clients only.
The state of Vermont requires financial institutions to obtain your consent prior to sharing personal information that they collect about you with affiliated companies and non-affiliated third parties other than in certain limited circumstances. Except as permitted by law, we will not share personal information we collect about you with non-affiliated third parties or other Morgan Stanley companies unless you provide us with your written consent to share such information ("opt-in").
If you wish to receive offers for investment products and services offered by or through other Morgan Stanley companies, please notify us in writing at the following address:
DST Asset Manager Solutions, Inc.
c/o Privacy Coordinator
P.O. Box 219804
Kansas City, Missouri 64121
Your authorization should include your name, address, telephone number and account number(s) to which the opt-in applies and should not be sent with any other correspondence. In order to process your authorization, we require that the authorization be provided by you directly and not through a third party.
SPECIAL NOTICE TO RESIDENTS OF CALIFORNIA
The following section supplements our Policy with respect to our individual clients who have a California address and supersedes anything to the contrary in the above Policy with respect to those clients only.
In response to a California law, if your account has a California home address, your personal information will not be disclosed to non-affiliated third parties except as permitted by applicable California law, and we will limit sharing such information with our affiliates to comply with California privacy laws that apply to us.
27
Morgan Stanley Institutional Fund, Inc.
Annual Report — December 31, 2018
Director and Officer Information (unaudited)
Independent Directors:
Name, Age and Address of
Independent Director | | Position(s)
Held with
Registrant | | Length of Time
Served* | | Principal Occupation(s) During Past 5 Years
and Other Relevant Professional Experience | | Number of
Portfolios in
Fund Complex
Overseen by
Independent
Director** | | Other Directorships
Held by Independent
Director*** | |
Frank L. Bowman (74)
c/o Perkins Coie LLP
Counsel to the Independent
Directors
30 Rockefeller Plaza
New York, NY 10112 | | Director | | Since
August
2006 | | President, Strategic Decisions, LLC (consulting) (since February 2009); Director or Trustee of various Morgan Stanley Funds (since August 2006); Chairperson of the Compliance and Insurance Committee (since October 2015); formerly, Chairperson of the Insurance Sub-Committee of the Compliance and Insurance Committee (2007-2015); served as President and Chief Executive Officer of the Nuclear Energy Institute (policy organization) (February 2005-November 2008); retired as Admiral, U.S. Navy after serving over 38 years on active duty including 8 years as Director of the Naval Nuclear Propulsion Program in the Department of the Navy and the U.S. Department of Energy (1996-2004); served as Chief of Naval Personnel (July 1994-September 1996) and on the Joint Staff as Director of Political Military Affairs (June 1992-July 1994); knighted as Honorary Knight Commander of the Most Excellent Order of the British Empire; awarded the Officier de l'Orde National du Mérite by the French Government; elected to the National Academy of Engineering (2009). | | | 82 | | | Director of BP p.l.c.; Director of Naval and Nuclear Technologies LLP; Director Emeritus of the Armed Services YMCA; Member of the National Security Advisory Council of the Center for U.S. Global Engagement and a member of the CNA Military Advisory Board; Trustee of Fairhaven United Methodist Church; Member of the Board of Advisors of the Dolphin Scholarship Foundation; and Director of other various non-profit organizations. | |
Kathleen A. Dennis (65)
c/o Perkins Coie LLP
Counsel to the Independent Directors
30 Rockefeller Plaza
New York, NY 10112 | | Director | | Since
August
2006 | | President, Cedarwood Associates (mutual fund and investment management consulting) (since July 2006); Chairperson of the Liquidity and Alternatives Sub-Committee of the Investment Committee (since October 2006) and Director or Trustee of various Morgan Stanley Funds (since August 2006); formerly, Senior Managing Director of Victory Capital Management (1993-2006). | | | 82 | | | Director of various non-profit organizations. | |
Nancy C. Everett (63)
c/o Perkins Coie LLP
Counsel to the Independent Directors
30 Rockefeller Plaza
New York, NY 10112 | | Director | | Since
January
2015 | | Chief Executive Officer, Virginia Commonwealth University Investment Company (since November 2015); Owner, OBIR, LLC (institutional investment management consulting) (since June 2014); formerly, Managing Director, BlackRock Inc. (February 2011-December 2013); and Chief Executive Officer, General Motors Asset Management (a/k/a Promark Global Advisors, Inc.) (June 2005-May 2010). | | | 83 | | | Formerly, Member of Virginia Commonwealth University School of Business Foundation (2005-2016); Member of Virginia Commonwealth University Board of Visitors (2013-2015); Member of Committee on Directors for Emerging Markets Growth Fund, Inc. (2007-2010); Chairperson of Performance Equity Management, LLC (2006-2010); and Chairperson, GMAM Absolute Return Strategies Fund, LLC (2006-2010). | |
28
Morgan Stanley Institutional Fund, Inc.
Annual Report — December 31, 2018
Director and Officer Information (unaudited) (cont'd)
Independent Directors: (cont'd)
Name, Age and Address of
Independent Director | | Position(s)
Held with
Registrant | | Length of Time
Served* | | Principal Occupation(s) During Past 5 Years
and Other Relevant Professional Experience | | Number of
Portfolios in
Fund Complex
Overseen by
Independent
Director** | | Other Directorships
Held by Independent
Director*** | |
Jakki L. Haussler (61)
c/o Perkins Coie LLP
Counsel to the Independent Directors
30 Rockefeller Plaza
New York, NY 10112 | | Director | | Since
January
2015 | | Chairman and Chief Executive Officer, Opus Capital Group (since January 1996); formerly, Director, Capvest Venture Fund, LP (May 2000-December 2011); Partner, Adena Ventures, LP (July 1999-December 2010); Director, The Victory Funds (February 2005-July 2008). | | | 83 | | | Director of Service Corporation International and Member, Audit Committee and Investment Committee; Director of Cincinnati Bell Inc. and Member, Audit Committee and Governance and Nominating Committee; Chairman of Northern Kentucky University Member Investment Committee; Member of Chase College of Law Transactional Law Practice Center Board of Advisors; Director of Best Transport; Director of Chase College of Law Board of Visitors; formerly, Member, University of Cincinnati Foundation Investment Committee; Member, Miami University Board of Visitors (2008-2011); Trustee of Victory Funds (2005-2008) and Chairman, Investment Committee (2007-2008) and Member, Service Provider Committee (2005-2008). | |
Dr. Manuel H. Johnson (69)
c/o Johnson Smick
International, Inc.
220 I Street, NE — Suite 200
Washington, D.C. 20002 | | Director | | Since
July
1991 | | Senior Partner, Johnson Smick International, Inc. (consulting firm); Chairperson of the Investment Committee (since October 2006) and Director or Trustee of various Morgan Stanley Funds (since July 1991); Co-Chairman and a founder of the Group of Seven Council (G7C) (international economic commission); formerly, Chairperson of the Audit Committee (July 1991-September 2006), Vice Chairman of the Board of Governors of the Federal Reserve System and Assistant Secretary of the U.S. Treasury. | | | 82 | | | Director of NVR, Inc. (home construction). | |
Joseph J. Kearns (76)
c/o Perkins Coie LLP
Counsel to the Independent Directors
30 Rockefeller Plaza
New York, NY 10112 | | Director | | Since
August
1994 | | Senior Adviser, Kearns & Associates LLC (investment consulting); Chairperson of the Audit Committee (since October 2006) and Director or Trustee of various Morgan Stanley Funds (since August 1994); formerly, Deputy Chairperson of the Audit Committee (July 2003-September 2006) and Chairperson of the Audit Committee of various Morgan Stanley Funds (since August 1994); CFO of the J. Paul Getty Trust. | | | 83 | | | Prior to August 10, 2016, Director of Electro Rent Corporation (equipment leasing); Prior to December 31, 2013, Director of The Ford Family Foundation. | |
29
Morgan Stanley Institutional Fund, Inc.
Annual Report — December 31, 2018
Director and Officer Information (unaudited) (cont'd)
Independent Directors: (cont'd)
Name, Age and Address of
Independent Director | | Position(s)
Held with
Registrant | | Length of Time
Served* | | Principal Occupation(s) During Past 5 Years
and Other Relevant Professional Experience | | Number of
Portfolios in
Fund Complex
Overseen by
Independent
Director** | | Other Directorships
Held by Independent
Director*** | |
Michael F. Klein (60)
c/o Perkins Coie LLP
Counsel to the Independent Directors
30 Rockefeller Plaza
New York, NY 10112 | | Director | | Since
August
2006 | | Managing Director, Aetos Alternatives Management, LP (since March 2000); Co-President, Aetos Alternatives Management, LP (since January 2004) and Co-Chief Executive Officer of Aetos Alternatives Management, LP (since August 2013); Chairperson of the Fixed Income Sub-Committee of the Investment Committee (since October 2006) and Director or Trustee of various Morgan Stanley Funds (since August 2006); formerly, Managing Director, Morgan Stanley & Co. Inc. and Morgan Stanley Dean Witter Investment Management and President, various Morgan Stanley Funds (June 1998-March 2000); Principal, Morgan Stanley & Co. Inc. and Morgan Stanley Dean Witter Investment Management (August 1997-December 1999). | | | 82 | | | Director of certain investment funds managed or sponsored by Aetos Alternatives Management, LP; Director of Sanitized AG and Sanitized Marketing AG (specialty chemicals). | |
Patricia Maleski (58)
c/o Perkins Coie LLP
Counsel to the Independent Directors
30 Rockefeller Plaza
New York, NY 10112 | | Director | | Since
January
2017 | | Managing Director, JPMorgan Asset Management (2004-2016); Oversight and Control Head of Fiduciary and Conflicts of Interest Program (2015-2016); Chief Control Officer-Global Asset Management (2013-2015); President, JPMorgan Funds (2010-2013); Chief Administrative Officer (2004-2013); various other positions including Treasurer and Board Liaison (since 2001). | | | 83 | | | None. | |
Michael E. Nugent (82)
522 Fifth Avenue
New York, NY 10036 | | Chair of the Board and Director | | Chair of the Boards since July 2006 and Director since July 1991 | | Chair of the Boards of various Morgan Stanley Funds (since July 2006); Chairperson of the Closed-End Fund Committee (since June 2012) Governance Committee (since January 2019) and Director or Trustee of various Morgan Stanley Funds (since July 1991); formerly, Chairperson of the Insurance Committee (until July 2006); General Partner, Triumph Capital, L.P. (private investment partnership) (1988-2013). | | | 82 | | | None. | |
W. Allen Reed (71)
c/o Perkins Coie LLP
Counsel to the Independent Directors
30 Rockefeller Plaza
New York, NY 10112 | | Director | | Since
August
2006 | | Chairperson of the Equity Sub-Committee of the Investment Committee (since October 2006) and Director or Trustee of various Morgan Stanley Funds (since August 2006); formerly, President and CEO of General Motors Asset Management; Chairman and Chief Executive Officer of the GM Trust Bank and Corporate Vice President of General Motors Corporation (August 1994-December 2005). | | | 82 | | | Director of Legg Mason, Inc.; formerly, Director of the Auburn University Foundation (2010-2015). | |
Fergus Reid (86)****
c/o Joe Pietryka, Inc.
85 Charles Colman Blvd.
Pawling, NY 12564 | | Director | | Since
June
1992 | | Chairman, Joe Pietryka, Inc.; Chairperson of the Governance Committee and Director or Trustee of various Morgan Stanley Funds (since June 1992). | | | 83 | | | Formerly, Trustee and Director of certain investment companies in the JP Morgan Fund Complex managed by JP Morgan Investment Management Inc. (1987-2012). | |
* This is the earliest date the Director began serving the Morgan Stanley Funds. Each Director serves an indefinite term, until his or her successor is elected.
** The Fund Complex includes (as of December 31, 2018) all open-end and closed-end funds (including all of their portfolios) advised by Morgan Stanley Investment Management Inc. (the "Adviser") and any funds that have an adviser that is an affiliated person of the Adviser (including, but not limited to, Morgan Stanley AIP GP LP).
*** This includes any directorships at public companies and registered investment companies held by the Director at any time during the past five years.
**** Effective date of retirement is December 31, 2018.
30
Morgan Stanley Institutional Fund, Inc.
Annual Report — December 31, 2018
Director and Officer Information (unaudited) (cont'd)
Executive Officers:
Name, Age and Address of Executive Officer | | Position(s) Held
with
Registrant | | Length of
Time Served* | | Principal Occupation(s) During Past 5 Years | |
John H. Gernon (55)
522 Fifth Avenue
New York, NY 10036 | | President and Principal Executive Officer | | Since
September
2013 | | President and Principal Executive Officer of the Equity and Fixed Income Funds and the Morgan Stanley AIP Funds (since September 2013) and the Liquidity Funds and various money market funds (since May 2014) in the Fund Complex; Managing Director of the Adviser; Head of Product (since 2006). | |
Timothy J. Knierim (59)
522 Fifth Avenue
New York, NY 10036 | | Chief Compliance Officer | | Since
December
2016 | | Managing Director of the Adviser and various entities affiliated with the Adviser; Chief Compliance Officer of various Morgan Stanley Funds and the Adviser (since December 2016) and Chief Compliance Officer of Morgan Stanley AIP GP LP (since 2014). Formerly, Managing Director and Deputy Chief Compliance Officer of the Adviser (2014-2016); and formerly, Chief Compliance Officer of Prudential Investment Management, Inc. (2007-2014). | |
Francis J. Smith (53)
522 Fifth Avenue
New York, NY 10036 | | Treasurer and Principal Financial Officer | | Treasurer since July 2003 and Principal Financial Officer since September 2002 | | Managing Director of the Adviser and various entities affiliated with the Adviser; Treasurer (since July 2003) and Principal Financial Officer of various Morgan Stanley Funds (since September 2002). | |
Mary E. Mullin (51)
522 Fifth Avenue
New York, NY 10036 | | Secretary | | Since
June
1999 | | Managing Director of the Adviser; Secretary of various Morgan Stanley Funds (since June 1999). | |
Michael J. Key (39)
522 Fifth Avenue
New York, NY 10036 | | Vice President | | Since
June
2017 | | Vice President of the Equity and Fixed Income Funds, Liquidity Funds, various money market funds and the Morgan Stanley AIP Funds in the Fund Complex (since June 2017); Executive Director of the Adviser; Head of Product Development for Equity and Fixed Income Funds (since August 2013). | |
* This is the earliest date the officer began serving the Morgan Stanley Funds. Each officer serves a one-year term, until his or her successor is elected and qualifies.
31
Morgan Stanley Institutional Fund, Inc.
Annual Report — December 31, 2018
Adviser and Administrator
Morgan Stanley Investment Management Inc.
522 Fifth Avenue
New York, New York 10036
Sub-Adviser
Morgan Stanley Investment Management Company
23 Church Street
16-01 Capital Square, Singapore 049481
Distributor
Morgan Stanley Distribution, Inc.
522 Fifth Avenue
New York, New York 10036
Dividend Disbursing and Transfer Agent
DST Asset Manager Solutions, Inc.
2000 Crown Colony Drive
Quincy, Massachusetts 02169
Custodian
State Street Bank and Trust Company
One Lincoln Street
Boston, Massachusetts 02111
Legal Counsel
Dechert LLP
1095 Avenue of the Americas
New York, New York 10036
Counsel to the Independent Directors
Perkins Coie LLP
30 Rockefeller Plaza
New York, New York 10112
Independent Registered Public Accounting Firm
Ernst & Young LLP
200 Clarendon Street
Boston, Massachusetts 02116
Reporting to Shareholders
Each Morgan Stanley fund provides a complete schedule of portfolio holdings in its semi-annual and the annual reports within 60 days of the end of the fund's second and fourth fiscal quarters. The semi-annual and annual reports are filed electronically with the Securities and Exchange Commission ("SEC") on Form N-CSRS and Form N-CSR, respectively. Morgan Stanley also delivers the semi-annual and annual reports to fund shareholders and makes these reports available on its public website, www.morganstanley.com/im/shareholderreports. Each Morgan Stanley fund also files a complete schedule of portfolio holdings with the SEC for the fund's first and third fiscal quarters on Form N-Q. Morgan Stanley does not deliver the reports for the first and third fiscal quarters to shareholders, nor are the reports posted to the Morgan Stanley public website. You may, however, obtain the Form N-Q filings (as well as the Form N-CSR and N-CSRS filings) by accessing the SEC's website, www.sec.gov. You can also request copies of these materials, upon payment of a duplicating fee, by electronic request at the SEC's email address (publicinfo@sec.gov).
Proxy Voting Policies and Procedures and Proxy Voting Record
You may obtain a copy of the Company's Proxy Voting Policy and Procedures and information regarding how the Company voted proxies relating to portfolio securities during the most recent twelve-month period ended June 30, without charge, upon request, by calling toll free 1 (800) 548-7786 or by visiting our website at www.morganstanley.com/im/shareholderreports. This information is also available on the SEC's website at www.sec.gov.
This report is authorized for distribution only when preceded or accompanied by a prospectus or summary prospectus of the applicable Fund of Morgan Stanley Institutional Fund, Inc., which describes in detail the Fund's investment policies, risks, fees and expenses. Please read the prospectus carefully before you invest or send money. For additional information, including information regarding the investments comprising the Fund, please visit our website at www.morganstanley.com/im/shareholderreports or call toll free 1 (800) 548-7786.
32
Printed in U.S.A.
This Report has been prepared for shareholders and may be distributed to others only if preceded or accompanied by a current prospectus.
Morgan Stanley Investment Management Inc.
522 Fifth Avenue
New York, New York 10036
© 2019 Morgan Stanley. Morgan Stanley Distribution, Inc.

IFIEMLANN
2398526 EXP. 02.29.20

Morgan Stanley Institutional Fund, Inc.
Emerging Markets Portfolio
Annual Report
December 31, 2018
Beginning on January 1, 2021, as permitted by regulations adopted by the Securities and Exchange Commission ("SEC"), paper copies of the Fund's Annual and Semi-Annual Reports to Shareholders ("Shareholder Reports") will no longer be sent by mail, unless you specifically request paper copies of the Shareholder Reports from the Fund or from your financial intermediary, such as a broker-dealer or a bank. Instead, the Shareholder Reports will be made available on the Fund's website, https://www.morganstanley.com/im/shareholderreports and you will be notified by mail each time a Shareholder Report is posted and provided with a website link to access the Shareholder Report. If you already elected to receive Shareholder Reports electronically, you will not be affected by this change and you need not take any action. You may elect to receive Shareholder Reports and other communications from the Fund electronically anytime by contacting your financial intermediary or, if you are a direct investor, please follow the instructions on the envelope.
Beginning on January 1, 2019, you may elect to receive all future Shareholder Reports in paper free of charge. If you invest through a financial intermediary, you can contact your financial intermediary to request that you continue to receive paper copies of your Shareholder Reports. If you invest directly with the Fund, please follow the instructions on the envelope to let the Fund know you wish to continue receiving paper copies of your Shareholder Reports. Your election to receive Shareholder Reports in paper will apply to all funds held in your account if you invest through your financial intermediary or all funds held with the fund complex if you invest directly with a fund.

Morgan Stanley Institutional Fund, Inc.
Annual Report — December 31, 2018
Shareholders' Letter | | | 2 | | |
Expense Example | | | 3 | | |
Investment Overview | | | 4 | | |
Portfolio of Investments | | | 8 | | |
Statement of Assets and Liabilities | | | 11 | | |
Statement of Operations | | | 13 | | |
Statements of Changes in Net Assets | | | 14 | | |
Financial Highlights | | | 16 | | |
Notes to Financial Statements | | | 22 | | |
Report of Independent Registered Public Accounting Firm | | | 32 | | |
Federal Tax Notice | | | 33 | | |
Privacy Notice | | | 34 | | |
Director and Officer Information | | | 37 | | |
This report is authorized for distribution only when preceded or accompanied by a prospectus or summary prospectus of the applicable Fund of Morgan Stanley Institutional Fund, Inc. To receive a prospectus and/or statement of additional information (SAI), which contains more complete information such as investment objectives, charges, expenses, policies for voting proxies, risk considerations and describes in detail each of the Fund's investment policies to the prospective investor, please call toll free 1 (800) 548-7786. Please read the prospectuses carefully before you invest or send money.
Additionally, you can access information about the Fund, including performance, characteristics and investment team commentary, through Morgan Stanley Investment Management's website: www.morganstanley.com/im/shareholderreports.
Market forecasts provided in this report may not necessarily come to pass. There is no guarantee that any sectors mentioned will continue to perform as discussed herein or that securities in such sectors will be held by the Fund in the future. There is no assurance that a fund will achieve its investment objective. Funds are subject to market risk, which is the possibility that market values of securities owned by the Fund will decline and, therefore, the value of the Fund's shares may be less than what you paid for them. Accordingly, you can lose money investing in this Fund. Please see the prospectus for more complete information on investment risks.
1
Morgan Stanley Institutional Fund, Inc.
Annual Report — December 31, 2018
Shareholders' Letter (unaudited)
Dear Shareholders,
We are pleased to provide this Annual report, in which you will learn how your investment in Emerging Markets Portfolio (the "Fund") performed during the latest twelve-month period.
Morgan Stanley Investment Management is a client-centric, investor-led organization. Our global presence, intellectual capital, and breadth of products and services enable us to partner with investors to meet the evolving challenges of today's financial markets. We aim to deliver superior investment service and to empower our clients to make the informed decisions that help them reach their investment goals.
As always, we thank you for selecting Morgan Stanley Investment Management, and look forward to working with you in the months and years ahead.
Sincerely,

John H. Gernon
President and Principal Executive Officer
January 2019
2
Morgan Stanley Institutional Fund, Inc.
Annual Report — December 31, 2018
Expense Example (unaudited)
Emerging Markets Portfolio
As a shareholder of the Fund, you incur two types of costs: (1) transactional costs, including redemption fees; and (2) ongoing costs, which may include advisory fees, administration fees, distribution and shareholder services fees and other Fund expenses. This example is intended to help you understand your ongoing costs (in dollars) of investing in the Fund and to compare these costs with the ongoing costs of investing in other mutual funds.
This example is based on an investment of $1,000 invested at the beginning of the six-month period ended December 31, 2018 and held for the entire six-month period.
Actual Expenses
The table below provides information about actual account values and actual expenses. You may use the information in this table, together with the amount you invested, to estimate the expenses that you paid over the period. Simply divide your account value by $1,000 (for example, an $8,600 account value divided by $1,000 = 8.6), then multiply the result by the number in the table under the heading entitled "Actual Expenses Paid During Period" to estimate the expenses you paid on your account during this period.
Hypothetical Example for Comparison Purposes
The table below provides information about hypothetical account values and hypothetical expenses based on the Fund's actual expense ratio and an assumed rate of return of 5% per year before expenses, which is not the Fund's actual return. The hypothetical account values and expenses may not be used to estimate the actual ending account balance or expenses you paid for the period. You may use this information to compare the ongoing costs of investing in the Fund and other funds. To do so, compare this 5% hypothetical example with the 5% hypothetical examples that appear in the shareholder reports of the other funds.
Please note that the expenses shown in the table are meant to highlight your ongoing costs only and do not reflect any transactional costs, such as sales charges (loads) and redemption fees. Therefore, the information for each class in the table is useful in comparing ongoing costs only, and will not help you determine the relative total costs of owning different funds. In addition, if these transactional costs were included, your costs would have been higher.
| | | Beginning
Account
Value
7/1/18 | | Actual Ending
Account
Value
12/31/18 | | Hypothetical
Ending Account
Value | | Actual
Expenses
Paid
During
Period* | | Hypothetical
Expenses Paid
During Period* | | Net
Expense
Ratio
During
Period** | |
Emerging Markets Portfolio Class I | | $ | 1,000.00 | | | $ | 910.90 | | | $ | 1,019.96 | | | $ | 5.01 | | | $ | 5.30 | | | | 1.04 | % | |
Emerging Markets Portfolio Class A | | | 1,000.00 | | | | 909.40 | | | | 1,018.30 | | | | 6.59 | | | | 6.97 | | | | 1.37 | | |
Emerging Markets Portfolio Class L | | | 1,000.00 | | | | 907.20 | | | | 1,015.68 | | | | 9.09 | | | | 9.60 | | | | 1.89 | | |
Emerging Markets Portfolio Class C | | | 1,000.00 | | | | 905.80 | | | | 1,014.42 | | | | 10.28 | | | | 10.87 | | | | 2.14 | | |
Emerging Markets Portfolio Class IS | | | 1,000.00 | | | | 911.30 | | | | 1,020.47 | | | | 4.53 | | | | 4.79 | | | | 0.94 | | |
Emerging Markets Portfolio Class IR | | | 1,000.00 | | | | 911.40 | | | | 1,020.52 | | | | 4.48 | | | | 4.74 | | | | 0.93 | | |
* Expenses are calculated using each Fund Class' annualized net expense ratio (as disclosed), multiplied by the average account value over the period and multiplied by 184/365 (to reflect the most recent one-half year period).
** Annualized.
3
Morgan Stanley Institutional Fund, Inc.
Annual Report — December 31, 2018
Investment Overview (unaudited)
Emerging Markets Portfolio
The Fund seeks long-term capital appreciation by investing primarily in growth-oriented equity securities of issuers in emerging market countries.
Performance
For the fiscal year ended December 31, 2018, the Fund's Class I shares had a total return based on net asset value and reinvestment of distributions per share of –17.32%, net of fees. The Fund's Class I shares underperformed the Fund's benchmark, the MSCI Emerging Markets Index (the "Index"), which returned –14.57%.
Factors Affecting Performance
• Developed market equities outperformed emerging market (EM) equities in 2018 with the Index returning –14.57% versus the MSCI World Index return of –8.71%. We think the U.S. economy is late cycle compared to the other large economies in the advanced world (euro area, Japan) and emerging markets are early in their economic revival cycle. Valuations in the MSCI All Country World Index ex U.S. are much more attractive than they are in the U.S., where they are nearing all-time highs only surpassed by the 2001 tech bubble. Just as the 1980s belonged to Japan and the 2000s to emerging nations, the last decade belonged to America. But economies that are hot in one decade rarely stay hot in the next. Most booms eventually create excesses that sow the seeds of their own destruction, and we believe the excesses that could end the American decade are coming into view. The stock market is now 50% larger than the American economy, a scale it has reached only twice in the past century, during the manias of the 1920s and late 1990s.(i)
• Over the past few years, investors became so focused on the tech-heavy Asian markets, they appeared to ignore the fundamentals of economic growth. Beginning with the launch of the MSCI Emerging Markets Index in 1988, the best returns had come in the fastest growing economies, but after 2016 economies with the highest growth rates underperformed the EM index, and those with the lowest growth rates outperformed(ii). Many of the outperformers were tech-heavy. As investors sell out of tech, they are rediscovering some overlooked markets of Eastern Europe and Latin America. Those markets had been battered in part by the strong dollar, which historically sucks money out of
EM, but may not last this time. Since the early 1980s, the dollar has rarely traded more than 15% above or below its long-term range, and it is now at the high end of that range.(i) Dollar bear markets have tended to last around seven years. Our view is that the dollar's rise in 2018 is a temporary rally within the downtrend that began in early 2016 and could prove long-lasting.
• The upshot is that many emerging markets look like compelling long-term buys. We believe many of the beaten down countries are well-insulated from crisis and are caught in an anti-bubble — gasping in a vacuum of attention because even now investors are focused on tech and tech-heavy markets like China. As a sense of normalcy returns to markets, other sectors and countries are likely to pick up momentum. While trying to time markets is a fool's game, the time to make long-term investments is in periods like the current one, when stock prices in many high-growth emerging markets appear to be cheap for no good reason.
• Positive contributors to the Fund's relative performance included our stock selection in and overweight allocations to Brazil and Peru, zero weight to Turkey and stock selection in Mexico.
• The primary detractors from relative results were our stock selection in Korea, Poland, India and Argentina. Our stock selection and underweight in Taiwan also underperformed.
• The Fund sometimes uses derivative instruments to manage certain market or currency exposures. This contributed positively to performance in the period.
Management Strategies
• We continue to overweight the Central and Eastern European region. We think that growth in Central and Eastern Europe should remain healthy, driven by strong consumption, which has been supported by increases in both employment and real wages. We also now expect fixed investment growth to accelerate, which could bolster overall growth and improve its quality. Inflation has remained surprisingly low despite continuing wage pressures and will likely pick up as the year progresses. In sum, we see the region as offering attractive investment opportunities through a
(i) Source: Morgan Stanley Investment Management, Bloomberg, FactSet, Haver Analytics
(ii) Source: Morgan Stanley Investment Management, FactSet, IMF.
4
Morgan Stanley Institutional Fund, Inc.
Annual Report — December 31, 2018
Investment Overview (unaudited) (cont'd)
Emerging Markets Portfolio
combination of this solid economic growth, a potential pickup in inflation and overlooked equity markets. We continue to like stocks that are exposed to secular growth opportunities in consumer markets in the region. We have built a substantial position in financials in the region, which we believe could particularly benefit from an increase in inflation expectations after having suffered from tighter regulation and low rates.
• We remain overweight in Mexico. Investors worried about the policy intentions of President-elect Andres Manuel Lopez Obrador (AMLO), when he announced in October 2018 that the new Mexico City Airport construction project was voted down in a narrow referendum. After AMLO was sworn in as president on December 1, 2018, however, his administration sent more encouraging signals on a fairly responsible fiscal budget. We remain broadly constructive on the steadily improving Mexican consumer story, which has been bolstered by a combination of AMLO's victory, strong remittance flows, the potential for minimum wage hikes and continuing improved access to credit from a low base. All of this should support private consumption at the lower income levels. North American trade fears largely subsided as the U.S., Mexico and Canada agreed to replace the North American Free Trade Agreement with a new agreement the U.S. refers to as the USMCA (U.S.-Mexico-Canada Agreement). We remain focused on stocks that can benefit from stable growth, a healthy consumer and structural improvements stemming from direct investment.
• We remain overweight in Brazil. The election of Jair Bolsonaro as president in October reflected voter discontent with the political establishment as well as corruption and insecurity. Congressional and state elections signaled the same. Bolsonaro took office January 1, 2019, and his new government inherits a pressing fiscal situation but also an economy that has stabilized and is beginning to grow after a severe multi-year downturn. We are encouraged by the market-friendly policy reform goals articulated by Economy Minister Paul Guedes while also acknowledging that social security reform is still a daunting task requiring congressional support. That said, supportive factors for Brazil include subdued inflation with expectations well-
anchored, the current account near zero, continued foreign direct investment, limited external debt, high foreign exchange reserves, cautiously optimistic corporates, and the president's election with a solid majority on a reform agenda. We remain focused in a large energy company and domestic Brazil and underweight the exporters.
• China continues to rebalance from an investment-led economy to a consumption-based economy. We continue to expect growth to moderate as a result of its credit expansion over the past 10 years, weakening trade and policy tightening. While the rest of EM has seen its non-financial debt climb by 20 percentage points as a share of GDP since the global financial crisis of 2008, China's debt has grown by more than 100 percentage points.(i) As our "Kiss of Debt" rule of the road indicates, excess debt always contributes to economic slowdown, which has been the case for China for several years. On the policy front, China is calling on local governments to complete debt disposals of so-called "zombie" companies and those with excessive production capacity by 2020. As we have noted previously, the world began to enter a deglobalization phase with the Global Financial Crisis in 2008. And as trade flows have fallen from their 2008 peak, they have also begun to shift. China's share of global manufacturing exports peaked at more than 17% in 2014 and began to fall, particularly in cheap, labor-intensive sectors like apparel.(i)
• China's tech firms are also facing new scrutiny from a bureaucracy that used to focus less on regulating their business behavior than on protecting them from U.S. competitors. In an environment where regulators left tech firms free to lay their golden eggs, they came to dominate global markets. Of the world's 10 largest companies by market cap, seven are in tech.(iii) And of the 20 largest internet companies, public and private, 11 are American and the other nine are Chinese.(iii) In an age of tightening rules, this kind of dominance will be much harder to sustain.
• Despite these challenges, we think the wage growth of highly skilled, well-educated Chinese workers can continue to gradually improve, considering their large differential with developed country peers. The
(i) Source: Morgan Stanley Investment Management, Bloomberg, FactSet, Haver Analytics
(iii) Source: Bloomberg L.P.
5
Morgan Stanley Institutional Fund, Inc.
Annual Report — December 31, 2018
Investment Overview (unaudited) (cont'd)
Emerging Markets Portfolio
consumption power within this segment can continue to expand, providing ample room for companies to conceive of new products and services to satisfy the demand of this expanding middle class. In our portfolio positions in China, we are actively focused on good quality structural growth stories involving upgrades to consumption and greater demand for services broadly.
• We remain underweight in Taiwan as we view it as a mature economy lacking the dynamic growth characteristics of other EM countries and vulnerable to further disruptions in global trade. The administration of President Tsai Ing-wen has been slow to implement major changes, despite being in office since 2016. Local elections held in November 2018 saw a significant setback for the president as voters unexpectedly largely supported the opposition Kuomintang party, resulting in President Ing-wen stepping down as chairman of the Democratic Progressive Party (though remaining as president). However, we do see some investment opportunities among Taiwanese financials — in particular, the good quality banks — for their defensiveness and ability to benefit from a rising global rate environment. Taiwan remains a capital surplus economy and has the highest current account surplus per GDP versus its Asian peers. Taiwanese regulators are very conservative and Basel III capital requirements have pushed non-performing loan coverage to high levels in the current low non-performing loan environment. The banks are also benefiting from a steady wealth management business with abundant liquidity and are facing benign cost pressures in the near future.
• Our large underweight to Korea contributed positively to performance for 2018 overall. Korea scores on the low end by our rules of the road, in large part on its mature economy, expensive currency, strong dependence on global trade and heavier state spending under the Moon administration. While we are comfortable with the underweight, we note that at the margin certain stocks are getting cheaper and more neglected. Foreign investors have been selling, while local investors have been hiding in telecom, gaming and a few other names. We believe that the market may increasingly be driven by improving relations with
China and the government becoming less socialist as it realizes its policies have not yielded the desired results. To capitalize on this, we have begun to make some changes in the portfolio focusing on select cosmetics — to meet rising China cosmetic demand — and retail, which should benefit from the minimum wage hike. We have also added to the refining sector as sentiment has been beaten down. Lower oil prices in our view will be actually supportive for refining margins.
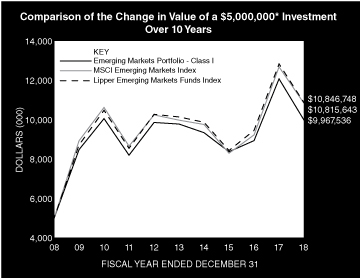
* Minimum Investment for Class I shares
In accordance with SEC regulations, the Fund's performance shown assumes that all recurring fees (including management fees) were deducted and all dividends and distributions were reinvested. The performance of Class A, L, C, IS and IR shares will vary from the performance of Class I shares based upon their different inception dates and will be negatively impacted by additional fees assessed to those classes (if applicable).
6
Morgan Stanley Institutional Fund, Inc.
Annual Report — December 31, 2018
Investment Overview (unaudited) (cont'd)
Emerging Markets Portfolio
Performance Compared to the MSCI Emerging Markets Index(1) and the Lipper Emerging Markets Funds Index(2)
| | | Period Ended December 31, 2018
Total Returns(3) | |
| | | | | Average Annual | |
| | | One
Year | | Five
Years | | Ten
Years | | Since
Inception(10) | |
Fund — Class I Shares
w/o sales charges(4) | | | –17.32 | % | | | 0.40 | % | | | 7.14 | % | | | 7.11 | % | |
Fund — Class A Shares
w/o sales charges(5) | | | –17.58 | | | | 0.08 | | | | 6.83 | | | | 5.95 | | |
Fund — Class A Shares with
maximum 5.25% sales charges(5) | | | –21.91 | | | | –0.99 | | | | 6.26 | | | | 5.70 | | |
Fund — Class L Shares
w/o sales charges(6) | | | –18.03 | | | | –0.46 | | | | — | | | | 0.32 | | |
Fund — Class C Shares
w/o sales charges(8) | | | –18.26 | | | | — | | | | — | | | | –1.56 | | |
Fund — Class C Shares
with maximum 1.00% deferred
sales charges(8) | | | –19.07 | | | | — | | | | — | | | | –1.56 | | |
Fund — Class IS Shares
w/o sales charges(7) | | | –17.25 | | | | 0.48 | | | | — | | | | 0.80 | | |
Fund — Class IR Shares
w/o sales charges(9) | | | — | | | | — | | | | — | | | | –11.82 | | |
MSCI Emerging Markets Index | | | –14.57 | | | | 1.65 | | | | 8.02 | | | | 7.04 | | |
Lipper Emerging Markets
Funds Index | | | –15.34 | | | | 1.38 | | | | 8.05 | | | | N/A | | |
Performance data quoted represents past performance, which is no guarantee of future results, and current performance may be lower or higher than the figures shown. Performance assumes that all dividends and distributions, if any, were reinvested. For the most recent month-end performance figures, please visit www.morganstanley.com/im/shareholderreports. Investment return and principal value will fluctuate so that Fund shares, when redeemed, may be worth more or less than their original cost. Returns for periods less than one year are not annualized. Total returns do not reflect the deduction of taxes that a shareholder would pay on Fund distributions or the redemption of Fund shares. Performance of share classes will vary due to difference in sales charges and expenses.
(1) The MSCI Emerging Markets Index is a free float-adjusted market capitalization weighted index that is designed to measure equity market performance of emerging markets. The term "free float" represents the portion of shares outstanding that are deemed to be available for purchase in the public equity markets by investors. The MSCI Emerging Markets Index currently consists of 24 emerging market country indices. The performance of the Index is listed in U.S. dollars and assumes reinvestment of net dividends. Returns, including periods prior to January 1, 2001, are calculated using the return data of the MSCI Emerging Markets Index (gross dividends) through December 31, 2000 and the return data of the MSCI Emerging Markets Net Index (net dividends) after December 31, 2000. Net total return indices reinvest dividends after the deduction of withholding taxes, using (for international indices) a tax rate applicable to non-resident institutional investors who do not benefit from double taxation treaties. The Index is unmanaged and its returns do not include any sales charges or fees. Such costs would lower performance. It is not possible to invest directly in an index.
(2) The Lipper Emerging Markets Funds Index is an equally weighted performance index of the largest qualifying funds (based on net assets) in the Lipper Emerging Markets Funds classification. The Index, which is adjusted for capital gains distributions and income dividends, is unmanaged and should not be considered an investment. There are currently 30 funds represented in this Index. As of the date of this report, the Fund is in the Lipper Emerging Markets Funds classification.
(3) Total returns for the Fund reflect fees waived and expenses reimbursed, if applicable, by Morgan Stanley Investment Management Inc. (the "Adviser"). Without such waivers and reimbursements, total returns would have been lower.
(4) Commenced operations on September 25, 1992.
(5) Commenced offering on January 2, 1996.
(6) Commenced offering on April 27, 2012.
(7) Commenced offering on September 13, 2013.
(8) Commenced offering on April 30, 2015.
(9) Commenced offering June 15, 2018.
(10) For comparative purposes, average annual since inception returns listed for the Indexes refer to the inception date of Class I of the Fund, not the inception of the Index.
7
Morgan Stanley Institutional Fund, Inc.
Annual Report — December 31, 2018
Portfolio of Investments
Emerging Markets Portfolio
| | | Shares | | Value
(000) | |
Common Stocks (93.4%) | |
Argentina (0.3%) | |
Grupo Financiero Galicia SA ADR | | | 122,487 | | | $ | 3,377 | | |
Austria (0.7%) | |
Erste Group Bank AG (a) | | | 208,671 | | | | 6,953 | | |
Brazil (9.1%) | |
Ambev SA | | | 3,625,704 | | | | 14,373 | | |
B3 SA — Brasil Bolsa Balcao | | | 1,549,762 | | | | 10,705 | | |
Banco Bradesco SA (Preference) | | | 1,829,167 | | | | 18,223 | | |
Itau Unibanco Holding SA (Preference) | | | 2,105,410 | | | | 19,376 | | |
Lojas Renner SA | | | 981,814 | | | | 10,778 | | |
Petroleo Brasileiro SA | | | 1,656,724 | | | | 10,797 | | |
Petroleo Brasileiro SA (Preference) | | | 1,746,203 | | | | 10,138 | | |
| | | | 94,390 | | |
Chile (2.0%) | |
Banco Santander Chile | | | 96,498,482 | | | | 7,184 | | |
Banco Santander Chile ADR | | | 44,029 | | | | 1,316 | | |
SACI Falabella | | | 1,690,242 | | | | 12,344 | | |
| | | | 20,844 | | |
China (21.0%) | |
Alibaba Group Holding Ltd. ADR (a) | | | 171,347 | | | | 23,487 | | |
Anhui Conch Cement Co., Ltd., Class A | | | 1,494,429 | | | | 6,407 | | |
Baidu, Inc. ADR (a) | | | 34,948 | | | | 5,543 | | |
Bank of China Ltd. H Shares (b) | | | 47,684,000 | | | | 20,488 | | |
China Construction Bank Corp. H Shares (b) | | | 35,111,750 | | | | 28,788 | | |
China Life Insurance Co., Ltd. H Shares (b) | | | 1,745,000 | | | | 3,690 | | |
China Mengniu Dairy Co., Ltd. (a)(b) | | | 2,946,000 | | | | 9,106 | | |
China Mobile Ltd. (b) | | | 1,426,000 | | | | 13,743 | | |
China Overseas Land & Investment Ltd. (b) | | | 1,616,000 | | | | 5,562 | | |
China Pacific Insurance Group Co., Ltd.
H Shares (b) | | | 2,669,600 | | | | 8,585 | | |
China Resources Land Ltd. (b) | | | 888,000 | | | | 3,390 | | |
China Resources Power Holdings Co., Ltd. (b) | | | 1,624,000 | | | | 3,111 | | |
China Unicom Hong Kong Ltd. (b) | | | 5,466,000 | | | | 5,806 | | |
CSPC Pharmaceutical Group Ltd. (b) | | | 3,030,000 | | | | 4,331 | | |
Kweichow Moutai Co., Ltd., Class A | | | 34,260 | | | | 2,941 | | |
New Oriental Education & Technology Group, Inc.
ADR (a) | | | 96,319 | | | | 5,279 | | |
PetroChina Co., Ltd. H Shares (b) | | | 10,582,000 | | | | 6,542 | | |
Shanghai Pharmaceuticals Holding Co., Ltd.
H Shares (b) | | | 1,273,400 | | | | 2,578 | | |
Shenzhou International Group Holdings Ltd. (b) | | | 994,000 | | | | 11,184 | | |
Sino Biopharmaceutical Ltd. (b) | | | 2,703,000 | | | | 1,760 | | |
Sinopharm Group Co., Ltd. H Shares (b) | | | 652,000 | | | | 2,730 | | |
TAL Education Group ADR (a) | | | 139,386 | | | | 3,719 | | |
Tencent Holdings Ltd. (b) | | | 1,014,500 | | | | 40,214 | | |
| | | | 218,984 | | |
Egypt (0.7%) | |
Commercial International Bank Egypt SAE | | | 1,759,263 | | | | 7,366 | | |
Germany (0.9%) | |
Adidas AG | | | 45,468 | | | | 9,502 | | |
| | | Shares | | Value
(000) | |
Hong Kong (1.0%) | |
Samsonite International SA (a)(d) | | | 3,582,600 | | | $ | 10,114 | | |
Hungary (1.7%) | |
OTP Bank Nyrt | | | 364,848 | | | | 14,715 | | |
Richter Gedeon Nyrt | | | 157,691 | | | | 3,055 | | |
| | | | 17,770 | | |
India (10.1%) | |
Ashok Leyland Ltd. | | | 7,077,496 | | | | 10,360 | | |
Eicher Motors Ltd. | | | 25,122 | | | | 8,301 | | |
Housing Development Finance Corp., Ltd. | | | 387,057 | | | | 10,916 | | |
ICICI Bank Ltd. | | | 1,331,220 | | | | 6,879 | | |
ICICI Bank Ltd. ADR | | | 470,200 | | | | 4,838 | | |
IndusInd Bank Ltd. | | | 429,674 | | | | 9,860 | | |
L&T Finance Holdings Ltd. | | | 1,919,182 | | | | 4,175 | | |
Marico Ltd. | | | 2,424,421 | | | | 12,945 | | |
Maruti Suzuki India Ltd. | | | 112,231 | | | | 11,969 | | |
Shree Cement Ltd. | | | 46,525 | | | | 11,487 | | |
Tata Consultancy Services Ltd. | | | 293,066 | | | | 7,951 | | |
Zee Entertainment Enterprises Ltd. | | | 799,646 | | | | 5,441 | | |
| | | | 105,122 | | |
Indonesia (4.7%) | |
Astra International Tbk PT | | | 21,453,600 | | | | 12,350 | | |
Bank Central Asia Tbk PT | | | 3,613,900 | | | | 6,533 | | |
Bank Mandiri Persero Tbk PT | | | 17,184,600 | | | | 8,809 | | |
Bank Rakyat Indonesia Persero Tbk PT | | | 7,391,450 | | | | 1,887 | | |
Telekomunikasi Indonesia Persero Tbk PT | | | 37,170,700 | | | | 9,703 | | |
Unilever Indonesia Tbk PT | | | 3,156,300 | | | | 9,984 | | |
| | | | 49,266 | | |
Korea, Republic of (5.7%) | |
BGF retail Co., Ltd. | | | 13,233 | | | | 2,419 | | |
E-MART, Inc. | | | 16,030 | | | | 2,614 | | |
GS Retail Co., Ltd. | | | 66,310 | | | | 2,406 | | |
LG Household & Health Care Ltd. | | | 6,267 | | | | 6,188 | | |
S-Oil Corp. | | | 46,046 | | | | 4,018 | | |
Samsung Electronics Co., Ltd. | | | 910,525 | | | | 31,505 | | |
Samsung Electronics Co., Ltd. (Preference) | | | 92,786 | | | | 2,647 | | |
Shinhan Financial Group Co., Ltd. | | | 90,694 | | | | 3,218 | | |
SK Hynix, Inc. | | | 72,662 | | | | 3,928 | | |
| | | | 58,943 | | |
Malaysia (2.6%) | |
Genting Malaysia Bhd | | | 1,229,700 | | | | 899 | | |
Malayan Banking Bhd | | | 3,549,329 | | | | 8,146 | | |
Malaysia Airports Holdings Bhd | | | 3,434,800 | | | | 6,972 | | |
Public Bank Bhd | | | 693,800 | | | | 4,150 | | |
Sime Darby Plantation Bhd | | | 6,083,500 | | | | 6,967 | | |
| | | | 27,134 | | |
Mexico (4.8%) | |
Alsea SAB de CV | | | 2,399,152 | | | | 6,256 | | |
Fomento Economico Mexicano SAB de CV ADR | | | 174,047 | | | | 14,978 | | |
Grupo Financiero Banorte SAB de CV Series O | | | 2,254,103 | | | | 11,003 | | |
The accompanying notes are an integral part of the financial statements.
8
Morgan Stanley Institutional Fund, Inc.
Annual Report — December 31, 2018
Portfolio of Investments (cont'd)
Emerging Markets Portfolio
| | | Shares | | Value
(000) | |
Mexico (cont'd) | |
Infraestructura Energetica Nova SAB de CV | | | 1,090,830 | | | $ | 4,053 | | |
Wal-Mart de Mexico SAB de CV | | | 5,266,607 | | | | 13,394 | | |
| | | | 49,684 | | |
Peru (2.3%) | |
Cia de Minas Buenaventura SA ADR | | | 808,315 | | | | 13,111 | | |
Credicorp Ltd. | | | 51,419 | | | | 11,398 | | |
| | | | 24,509 | | |
Philippines (1.5%) | |
Ayala Corp. | | | 240,310 | | | | 4,113 | | |
Ayala Land, Inc. | | | 3,486,700 | | | | 2,698 | | |
SM Investments Corp. | | | 480,330 | | | | 8,379 | | |
| | | | 15,190 | | |
Poland (4.1%) | |
CCC SA | | | 107,567 | | | | 5,584 | | |
Jeronimo Martins SGPS SA | | | 835,068 | | | | 9,886 | | |
LPP SA | | | 3,889 | | | | 8,153 | | |
Powszechna Kasa Oszczednosci Bank Polski SA | | | 763,659 | | | | 8,048 | | |
Santander Bank Polska SA | | | 118,430 | | | | 11,399 | | |
| | | | 43,070 | | |
Russia (4.0%) | |
MMC Norilsk Nickel PJSC ADR | | | 633,154 | | | | 11,879 | | |
MMC Norilsk Nickel PJSC ADR (c) | | | 26,330 | | | | 496 | | |
Sberbank of Russia PJSC ADR | | | 583,755 | | | | 6,399 | | |
X5 Retail Group N.V. GDR | | | 475,537 | | | | 11,784 | | |
Yandex N.V., Class A (a) | | | 389,742 | | | | 10,659 | | |
| | | | 41,217 | | |
South Africa (5.8%) | |
AVI Ltd. | | | 911,893 | | | | 6,443 | | |
Bidvest Group Ltd. (The) | | | 684,796 | | | | 9,858 | | |
Capitec Bank Holdings Ltd. (c) | | | 139,780 | | | | 10,810 | | |
Clicks Group Ltd. | | | 586,307 | | | | 7,777 | | |
Nedbank Group Ltd. | | | 546,904 | | | | 10,406 | | |
Reunert Ltd. | | | 867,397 | | | | 4,252 | | |
Sanlam Ltd. | | | 1,951,741 | | | | 10,824 | | |
| | | | 60,370 | | |
Taiwan (8.4%) | |
ASE Technology Holding Co., Ltd. (a) | | | 2,465,626 | | | | 4,623 | | |
Cathay Financial Holding Co., Ltd. | | | 4,828,000 | | | | 7,348 | | |
CTBC Financial Holding Co., Ltd. | | | 8,784,000 | | | | 5,738 | | |
Hon Hai Precision Industry Co., Ltd. | | | 909,360 | | | | 2,099 | | |
MediaTek, Inc. | | | 747,000 | | | | 5,509 | | |
Mega Financial Holding Co. Ltd. | | | 4,235,000 | | | | 3,561 | | |
Nanya Technology Corp. | | | 789,000 | | | | 1,394 | | |
President Chain Store Corp. | | | 465,000 | | | | 4,698 | | |
Taiwan Cement Corp. | | | 1,435,000 | | | | 1,650 | | |
Taiwan Semiconductor Manufacturing Co., Ltd. | | | 6,770,205 | | | | 49,147 | | |
Vanguard International Semiconductor Corp. | | | 914,000 | | | | 1,740 | | |
| | | | 87,507 | | |
| | | Shares | | Value
(000) | |
Thailand (2.0%) | |
Bangkok Dusit Medical Services PCL (Foreign) | | | 7,108,400 | | | $ | 5,434 | | |
Central Pattana PCL (Foreign) | | | 1,808,000 | | | | 4,144 | | |
| CP ALL PCL (Foreign) | | | 1,621,600 | | | | 3,411 | | |
PTT PCL (Foreign) | | | 5,925,600 | | | | 8,357 | | |
| | | | 21,346 | | |
Total Common Stocks (Cost $867,852) | | | 972,658 | | |
Short-Term Investments (7.6%) | |
Securities held as Collateral on Loaned Securities (0.9%) | |
Investment Company (0.9%) | |
Morgan Stanley Institutional Liquidity
Funds — Government Portfolio —
Institutional Class (See Note G)
(Cost $8,887) | | | 8,887,214 | | | | 8,887 | | |
Investment Company (6.7%) | |
Morgan Stanley Institutional Liquidity
Funds — Government Portfolio —
Institutional Class (See Note G)
(Cost $69,310) | | | 69,310,431 | | | | 69,310 | | |
Total Short-Term Investments (Cost $78,197) | | | 78,197 | | |
Total Investments (101.0%) (Cost $946,049)
Including $8,747 of Securities Loaned (e)(f)(g) | | | 1,050,855 | | |
| Liabilities in Excess of Other Assets (–1.0%) | | | (10,479 | ) | |
Net Assets (100.0%) | | $ | 1,040,376 | | |
Country assignments and aggregations are based generally on third party vendor classifications and information, and may be different from the assignments and aggregations under the policies set forth in the Fund's prospectus and/or statement of additional information relating to geographic classifications.
(a) Non-income producing security.
(b) Security trades on the Hong Kong exchange.
(c) All or a portion of this security was on loan at December 31, 2018.
(d) 144A security — Certain conditions for public sale may exist. Unless otherwise noted, these securities are deemed to be liquid.
(e) Securities are available for collateral in connection with open foreign currency forward exchange contracts and future contract.
(f) The approximate fair value and percentage of net assets, $839,751,000 and 80.7%, respectively, represent the securities that have been fair valued under the fair valuation policy for international investments as described in Note A-1 within the Notes to the Financial Statements.
(g) At December 31, 2018, the aggregate cost for federal income tax purposes is approximately $948,668,000. The aggregate gross unrealized appreciation is approximately $146,780,000 and the aggregate gross unrealized depreciation is approximately $46,725,000, resulting in net unrealized appreciation of approximately $100,055,000.
ADR American Depositary Receipt.
GDR Global Depositary Receipt.
PJSC Public Joint Stock Company.
The accompanying notes are an integral part of the financial statements.
9
Morgan Stanley Institutional Fund, Inc.
Annual Report — December 31, 2018
Portfolio of Investments (cont'd)
Emerging Markets Portfolio
Foreign Currency Forward Exchange Contracts:
The Fund had the following foreign currency forward exchange contracts open at December 31, 2018:
Counterparty | | Contracts to
Deliver
(000) | | In Exchange
For
(000) | | Delivery
Date | | Unrealized
Appreciation
(Depreciation)
(000) | |
UBS AG | | ZAR | 645,875 | | | $ | 42,665 | | | 1/17/19 | | $ | (2,154 | ) | |
Goldman Sachs International | | HKD | 1,270,507 | | | $ | 162,913 | | | 3/1/19 | | | 384 | | |
| | | | | | | | | $ | (1,770 | ) | |
HKD — Hong Kong Dollar
ZAR — South African Rand
Futures Contract:
The Fund had the following futures contract open at December 31, 2018:
| | | Number
of
Contracts | | Expiration
Date | | Notional
Amount
(000) | | Value
(000) | | Unrealized
Depreciation
(000) | |
Long: | |
MSCI Emerging Market E Mini (United States) | | | 301 | | | Mar-19 | | | 15 | | | $ | 14,550 | | | $ | (363 | ) | |
Portfolio Composition*
Classification | | Percentage of
Total Investments | |
Other** | | | 48.7 | % | |
Banks | | | 25.0 | | |
Interactive Media & Services | | | 7.7 | | |
Short-Term Investments | | | 6.6 | | |
Semiconductors & Semiconductor Equipment | | | 6.4 | | |
Food & Staples Retailing | | | 5.6 | | |
Total Investments | | | 100.0 | %*** | |
* Percentages indicated are based upon total investments (excluding Securities held as Collateral on Loaned Securities) as of December 31, 2018.
** Industries and/or investment types representing less than 5% of total investments.
*** Does not include an open long futures contract with a value of approximately $14,550,000 and net unrealized depreciation of approximately $363,000. Does not include open foreign currency forward exchange contracts with net unrealized depreciation of approximately $1,770,000.
The accompanying notes are an integral part of the financial statements.
10
Morgan Stanley Institutional Fund, Inc.
Annual Report — December 31, 2018
Emerging Markets Portfolio
Statement of Assets and Liabilities | | December 31, 2018
(000) | |
Assets: | |
Investments in Securities of Unaffiliated Issuers, at Value(1) (Cost $867,852) | | $ | 972,658 | | |
Investment in Security of Affiliated Issuer, at Value (Cost $78,197) | | | 78,197 | | |
Total Investments in Securities, at Value (Cost $946,049) | | | 1,050,855 | | |
Foreign Currency, at Value (Cost $255) | | | 254 | | |
Receivable for Investments Sold | | | 1,915 | | |
Dividends Receivable | | | 1,257 | | |
Receivable for Variation Margin on Futures Contracts | | | 808 | | |
Unrealized Appreciation on Foreign Currency Forward Exchange Contract | | | 384 | | |
Receivable for Fund Shares Sold | | | 351 | | |
Tax Reclaim Receivable | | | 150 | | |
Receivable from Affiliate | | | 133 | | |
Receivable from Securities Lending Income | | | 4 | | |
Other Assets | | | 100 | | |
Total Assets | | | 1,056,211 | | |
Liabilities: | |
Collateral on Securities Loaned, at Value | | | 8,887 | | |
Unrealized Depreciation on Foreign Currency Forward Exchange Contract | | | 2,154 | | |
Payable for Advisory Fees | | | 2,090 | | |
Payable for Fund Shares Redeemed | | | 1,040 | | |
Payable for Investments Purchased | | | 412 | | |
Payable for Custodian Fees | | | 172 | | |
Deferred Capital Gain Country Tax | | | 675 | | |
Payable for Directors' Fees and Expenses | | | 121 | | |
Payable for Professional Fees | | | 83 | | |
Payable for Administration Fees | | | 71 | | |
Payable for Sub Transfer Agency Fees — Class I | | | 46 | | |
Payable for Sub Transfer Agency Fees — Class A | | | 4 | | |
Payable for Sub Transfer Agency Fees — Class L | | | — | @ | |
Payable for Sub Transfer Agency Fees — Class C | | | — | @ | |
Payable for Transfer Agency Fees — Class I | | | 4 | | |
Payable for Transfer Agency Fees — Class A | | | 2 | | |
Payable for Transfer Agency Fees — Class L | | | 1 | | |
Payable for Transfer Agency Fees — Class C | | | 1 | | |
Payable for Transfer Agency Fees — Class IS | | | 1 | | |
Payable for Transfer Agency Fees — Class IR | | | — | @ | |
Payable for Shareholder Services Fees — Class A | | | 3 | | |
Payable for Distribution and Shareholder Services Fees — Class L | | | — | @ | |
Payable for Distribution and Shareholder Services Fees — Class C | | | — | @ | |
Bank Overdraft | | | — | @ | |
Other Liabilities | | | 68 | | |
Total Liabilities | | | 15,835 | | |
Net Assets | | $ | 1,040,376 | | |
Net Assets Consist of: | |
Paid-in-Capital | | $ | 942,480 | | |
Total Distributable Earnings | | | 97,896 | | |
Net Assets | | $ | 1,040,376 | | |
The accompanying notes are an integral part of the financial statements.
11
Morgan Stanley Institutional Fund, Inc.
Annual Report — December 31, 2018
Emerging Markets Portfolio
Statement of Assets and Liabilities (cont'd) | | December 31, 2018
(000) | |
CLASS I: | |
Net Assets | | $ | 229,132 | | |
| Shares Outstanding $0.001 par value shares of beneficial interest (unlimited shares authorized) (not in 000's) | | | 10,170,939 | | |
Net Asset Value, Offering and Redemption Price Per Share | | $ | 22.53 | | |
CLASS A: | |
Net Assets | | $ | 13,605 | | |
| Shares Outstanding $0.001 par value shares of beneficial interest (unlimited shares authorized) (not in 000's) | | | 618,828 | | |
Net Asset Value, Redemption Price Per Share | | $ | 21.99 | | |
Maximum Sales Load | | | 5.25 | % | |
Maximum Sales Charge | | $ | 1.22 | | |
Maximum Offering Price Per Share | | $ | 23.21 | | |
CLASS L: | |
Net Assets | | $ | 292 | | |
| Shares Outstanding $0.001 par value shares of beneficial interest (unlimited shares authorized) (not in 000's) | | | 13,472 | | |
Net Asset Value, Offering and Redemption Price Per Share | | $ | 21.64 | | |
CLASS C: | |
Net Assets | | $ | 309 | | |
| Shares Outstanding $0.001 par value shares of beneficial interest (unlimited shares authorized) (not in 000's) | | | 14,326 | | |
Net Asset Value, Offering and Redemption Price Per Share | | $ | 21.57 | | |
CLASS IS: | |
Net Assets | | $ | 797,029 | | |
| Shares Outstanding $0.001 par value shares of beneficial interest (unlimited shares authorized) (not in 000's) | | | 35,387,203 | | |
Net Asset Value, Offering and Redemption Price Per Share | | $ | 22.52 | | |
CLASS IR: | |
Net Assets | | $ | 9 | | |
| Shares Outstanding $0.001 par value shares of beneficial interest (unlimited shares authorized) (not in 000's) | | | 381 | | |
Net Asset Value, Offering and Redemption Price Per Share | | $ | 22.54 | | |
(1) Including:
Securities on Loan, at Value: | | $ | 8,747 | | |
@ Amount is less than $500.
The accompanying notes are an integral part of the financial statements.
12
Morgan Stanley Institutional Fund, Inc.
Annual Report — December 31, 2018
Emerging Markets Portfolio
Statement of Operations | | Year Ended
December 31, 2018
(000) | |
Investment Income: | |
Dividends from Securities of Unaffiliated Issuers (Net of $3,351 of Foreign Taxes Withheld) | | $ | 26,349 | | |
Dividends from Security of Affiliated Issuer (Note G) | | | 950 | | |
Income from Securities Loaned — Net | | | 173 | | |
Total Investment Income | | | 27,472 | | |
Expenses: | |
Advisory Fees (Note B) | | | 10,072 | | |
Administration Fees (Note C) | | | 1,037 | | |
Custodian Fees (Note F) | | | 584 | | |
Sub Transfer Agency Fees — Class I | | | 290 | | |
Sub Transfer Agency Fees — Class A | | | 30 | | |
Sub Transfer Agency Fees — Class L | | | — | @ | |
Sub Transfer Agency Fees — Class C | | | — | @ | |
Professional Fees | | | 156 | | |
Registration Fees | | | 91 | | |
Shareholder Services Fees — Class A (Note D) | | | 53 | | |
Distribution and Shareholder Services Fees — Class L (Note D) | | | 2 | | |
Distribution and Shareholder Services Fees — Class C (Note D) | | | 6 | | |
Shareholder Reporting Fees | | | 49 | | |
Directors' Fees and Expenses | | | 37 | | |
Transfer Agency Fees — Class I (Note E) | | | 13 | | |
Transfer Agency Fees — Class A (Note E) | | | 5 | | |
Transfer Agency Fees — Class L (Note E) | | | 2 | | |
Transfer Agency Fees — Class C (Note E) | | | 2 | | |
Transfer Agency Fees — Class IS (Note E) | | | 2 | | |
Transfer Agency Fees — Class IR (Note E) | | | 1 | | |
Pricing Fees | | | 6 | | |
Other Expenses | | | 71 | | |
Total Expenses | | | 12,509 | | |
Rebate from Morgan Stanley Affiliate (Note G) | | | (88 | ) | |
Reimbursement of Class Specific Expenses — Class L (Note B) | | | (2 | ) | |
Reimbursement of Class Specific Expenses — Class C (Note B) | | | (1 | ) | |
Reimbursement of Class Specific Expenses — Class IR (Note B) | | | (1 | ) | |
Net Expenses | | | 12,417 | | |
Net Investment Income | | | 15,055 | | |
Realized Gain (Loss): | |
Investments Sold (Net of $625 of Capital Gain Country Tax) | | | 46,035 | | |
Foreign Currency Forward Exchange Contracts | | | 3,770 | | |
Foreign Currency Translation | | | (1,839 | ) | |
Futures Contracts | | | 1,150 | | |
Net Realized Gain | | | 49,116 | | |
Change in Unrealized Appreciation (Depreciation): | |
Investments (Net Decrease in Deferred Capital Gain Country Tax of $1,152) | | | (301,586 | ) | |
Foreign Currency Forward Exchange Contracts | | | (1,770 | ) | |
Foreign Currency Translation | | | (22 | ) | |
Futures Contracts | | | (363 | ) | |
Net Change in Unrealized Appreciation (Depreciation) | | | (303,741 | ) | |
Net Realized Gain and Change in Unrealized Appreciation (Depreciation) | | | (254,625 | ) | |
Net Decrease in Net Assets Resulting from Operations | | $ | (239,570 | ) | |
@ Amount is less than $500.
The accompanying notes are an integral part of the financial statements.
13
Morgan Stanley Institutional Fund, Inc.
Annual Report — December 31, 2018
Emerging Markets Portfolio
Statements of Changes in Net Assets | | Year Ended
December 31, 2018
(000) | | Year Ended
December 31, 2017
(000) | |
Increase (Decrease) in Net Assets: | |
Operations: | |
Net Investment Income | | $ | 15,055 | | | $ | 9,451 | | |
Net Realized Gain | | | 49,116 | | | | 42,245 | | |
Net Change in Unrealized Appreciation (Depreciation) | | | (303,741 | ) | | | 294,057 | | |
Net Increase (Decrease) in Net Assets Resulting from Operations | | | (239,570 | ) | | | 345,753 | | |
Dividends and Distributions to Shareholders: | |
Class I | | | (5,586 | ) | | | (2,064 | )* | |
Class A | | | (266 | ) | | | (80 | )* | |
Class L | | | (3 | ) | | | (— | @)* | |
Class C | | | (3 | ) | | | (1 | )* | |
Class IS | | | (20,307 | ) | | | (6,989 | )* | |
Class IR | | | (— | @) | | | — | | |
Total Dividends and Distributions to Shareholders | | | (26,165 | ) | | | (9,134 | ) | |
Capital Share Transactions:(1) | |
Class I: | |
Subscribed | | | 60,621 | | | | 48,189 | | |
Distributions Reinvested | | | 5,497 | | | | 2,027 | | |
Redeemed | | | (120,158 | ) | | | (82,161 | ) | |
Class A: | |
Subscribed | | | 7,227 | | | | 6,843 | | |
Distributions Reinvested | | | 258 | | | | 77 | | |
Redeemed | | | (13,497 | ) | | | (7,956 | ) | |
Class L: | |
Exchanged | | | 118 | | | | 7 | | |
Distributions Reinvested | | | 3 | | | | — | @ | |
Redeemed | | | (33 | ) | | | (68 | ) | |
Class C: | |
Subscribed | | | 96 | | | | 56 | | |
Distributions Reinvested | | | 3 | | | | 1 | | |
Redeemed | | | (500 | ) | | | (50 | ) | |
Class IS: | |
Subscribed | | | 135,108 | | | | 172,808 | | |
Distributions Reinvested | | | 18,614 | | | | 6,744 | | |
Redeemed | | | (189,029 | ) | | | (40,828 | ) | |
Class IR: | |
Subscribed | | | 10 | (a) | | | — | | |
Net Increase (Decrease) in Net Assets Resulting from Capital Share Transactions | | | (95,662 | ) | | | 105,689 | | |
Redemption Fees | | | 3 | | | | 11 | | |
Total Increase (Decrease) in Net Assets | | | (361,394 | ) | | | 442,319 | | |
Net Assets: | |
Beginning of Period | | | 1,401,770 | | | | 959,451 | | |
End of Period | | $ | 1,040,376 | | | $ | 1,401,770 | † | |
The accompanying notes are an integral part of the financial statements.
14
Morgan Stanley Institutional Fund, Inc.
Annual Report — December 31, 2018
Emerging Markets Portfolio
Statements of Changes in Net Assets (cont'd) | | Year Ended
December 31, 2018
(000) | | Year Ended
December 31, 2017
(000) | |
(1) Capital Share Transactions: | |
Class I: | |
Shares Subscribed | | | 2,291 | | | | 1,924 | | |
Shares Issued on Distributions Reinvested | | | 246 | | | | 75 | | |
Shares Redeemed | | | (4,615 | ) | | | (3,319 | ) | |
Net Decrease in Class I Shares Outstanding | | | (2,078 | ) | | | (1,320 | ) | |
Class A: | |
Shares Subscribed | | | 277 | | | | 277 | | |
Shares Issued on Distributions Reinvested | | | 12 | | | | 3 | | |
Shares Redeemed | | | (549 | ) | | | (328 | ) | |
Net Decrease in Class A Shares Outstanding | | | (260 | ) | | | (48 | ) | |
Class L: | |
Shares Exchanged | | | 5 | | | | — | @@ | |
Shares Issued on Distributions Reinvested | | | — | @@ | | | — | @@ | |
Shares Redeemed | | | (1 | ) | | | (2 | ) | |
Net Increase (Decrease) in Class L Shares Outstanding | | | 4 | | | | (2 | ) | |
Class C: | |
Shares Subscribed | | | 4 | | | | 2 | | |
Shares Issued on Distributions Reinvested | | | — | @@ | | | — | @@ | |
Shares Redeemed | | | (20 | ) | | | (2 | ) | |
Net Increase (Decrease) in Class C Shares Outstanding | | | (16 | ) | | | — | @@ | |
Class IS: | |
Shares Subscribed | | | 4,875 | | | | 6,862 | | |
Shares Issued on Distributions Reinvested | | | 834 | | | | 249 | | |
Shares Redeemed | | | (7,321 | ) | | | (1,653 | ) | |
Net Increase (Decrease) in Class IS Shares Outstanding | | | (1,612 | ) | | | 5,458 | | |
Class IR: | |
Shares Subscribed | | | — | @@(a) | | | — | | |
The following information was previously reported in the December 31, 2017 financial statements. The distribution information for the year ended December 31, 2017 presented on the Statements of Changes in Net Assets is presented for comparative purposes to the December 31, 2018 financial statements, which conform to the SEC Final Rule on Disclosure Update and Simplification which was effective November 5, 2018.
* Dividends and Distributions to Shareholders for the year ended December 31, 2017 were as follows:
Class I: | |
Net Investment Income | | $ | (2,064 | ) | |
Class A: | |
Net Investment Income | | $ | (80 | ) | |
Class L: | |
Net Investment Income | | $ | (— | @) | |
Class C: | |
Net Investment Income | | $ | (1 | ) | |
Class IS: | |
Net Investment Income | | $ | (6,989 | ) | |
† Distributions in Excess of Net Investment Income for the year ended December 31, 2017 was $(17).
(a) For the period June 15, 2018 through December 31, 2018.
@ Amount is less than $500.
@@ Amount is less than 500 shares.
The accompanying notes are an integral part of the financial statements.
15
Morgan Stanley Institutional Fund, Inc.
Annual Report — December 31, 2018
Financial Highlights
Emerging Markets Portfolio
| | | Class I | |
| | | Year Ended December 31, | |
Selected Per Share Data and Ratios | | 2018 | | 2017 | | 2016(1) | | 2015 | | 2014 | |
Net Asset Value, Beginning of Period | | $ | 27.95 | | | $ | 20.83 | | | $ | 19.68 | | | $ | 22.13 | | | $ | 24.64 | | |
Income (Loss) from Investment Operations: | |
Net Investment Income(2) | | | 0.28 | | | | 0.19 | | | | 0.17 | | | | 0.15 | | | | 0.17 | | |
Net Realized and Unrealized Gain (Loss) | | | (5.15 | ) | | | 7.10 | | | | 1.15 | | | | (2.43 | ) | | | (1.30 | ) | |
Total from Investment Operations | | | (4.87 | ) | | | 7.29 | | | | 1.32 | | | | (2.28 | ) | | | (1.13 | ) | |
Distributions from and/or in Excess of: | |
Net Investment Income | | | (0.35 | ) | | | (0.17 | ) | | | (0.17 | ) | | | (0.17 | ) | | | (0.20 | ) | |
Net Realized Gain | | | (0.20 | ) | | | — | | | | — | | | | — | | | | (1.18 | ) | |
Total Distributions | | | (0.55 | ) | | | (0.17 | ) | | | (0.17 | ) | | | (0.17 | ) | | | (1.38 | ) | |
Redemption Fees | | | 0.00 | (3) | | | 0.00 | (3) | | | 0.00 | (3) | | | 0.00 | (3) | | | 0.00 | (3) | |
Net Asset Value, End of Period | | $ | 22.53 | | | $ | 27.95 | | | $ | 20.83 | | | $ | 19.68 | | | $ | 22.13 | | |
Total Return(4) | | | (17.32 | )% | | | 34.97 | % | | | 6.73 | % | | | (10.33 | )% | | | (4.47 | )% | |
Ratios and Supplemental Data: | |
Net Assets, End of Period (Thousands) | | $ | 229,132 | | | $ | 342,400 | | | $ | 282,674 | | | $ | 531,194 | | | $ | 644,537 | | |
Ratio of Expenses to Average Net Assets(9) | | | 1.03 | %(5) | | | 1.04 | %(5) | | | 1.11 | %(5)(7) | | | 1.24 | %(5)(6) | | | 1.25 | %(5) | |
Ratio of Net Investment Income to Average Net Assets(9) | | | 1.08 | %(5) | | | 0.75 | %(5) | | | 0.83 | %(5) | | | 0.68 | %(5) | | | 0.68 | %(5) | |
Ratio of Rebate from Morgan Stanley Affiliates to Average Net Assets | | | 0.01 | % | | | 0.00 | %(8) | | | 0.00 | %(8) | | | 0.00 | %(8) | | | 0.00 | %(8) | |
Portfolio Turnover Rate | | | 56 | % | | | 35 | % | | | 33 | % | | | 40 | % | | | 43 | % | |
(9) Supplemental Information on the Ratios to Average Net Assets: | |
Ratios Before Expense Limitation: | |
Expenses to Average Net Assets | | | N/A | | | | 1.07 | % | | | 1.16 | % | | | 1.45 | % | | | 1.52 | % | |
Net Investment Income to Average Net Assets | | | N/A | | | | 0.72 | % | | | 0.78 | % | | | 0.47 | % | | | 0.41 | % | |
(1) Reflects prior period Custodian out-of-pocket expenses that were reimbursed in September 2016. The amount of the reimbursement was immaterial on a per share basis and did not impact the total return of Class I shares. The Ratio of Expenses to Average Net Assets and the Ratio of Net Investment Income to Average Net Assets would be unchanged as the reimbursement of Custodian fees was offset against expense waivers/reimbursements with no impact to net expenses or net investment income.
(2) Per share amount is based on average shares outstanding.
(3) Amount is less than $0.005 per share.
(4) Calculated based on the net asset value as of the last business day of the period.
(5) The Ratios of Expenses and Net Investment Income reflect the rebate of certain Fund expenses in connection with the investments in Morgan Stanley affiliates during the period. The effect of the rebate on the ratios is disclosed in the above table as "Ratio of Rebate from Morgan Stanley Affiliates to Average Net Assets."
(6) Effective September 30, 2015, the Adviser has agreed to limit the ratio of expenses to average net assets to the maximum ratio of 1.20% for Class I shares. Prior to September 30, 2015, the maximum ratio was 1.25% for Class I shares.
(7) Effective September 30, 2016, the Adviser has agreed to limit the ratio of expenses to average net assets to the maximum ratio of 1.05% for Class I shares. Prior to September 30, 2016, the maximum ratio was 1.20% for Class I shares.
(8) Amount is less than 0.005%.
The accompanying notes are an integral part of the financial statements.
16
Morgan Stanley Institutional Fund, Inc.
Annual Report — December 31, 2018
Financial Highlights
Emerging Markets Portfolio
| | | Class A | |
| | | Year Ended December 31, | |
Selected Per Share Data and Ratios | | 2018 | | 2017 | | 2016(1) | | 2015 | | 2014 | |
Net Asset Value, Beginning of Period | | $ | 27.24 | | | $ | 20.31 | | | $ | 19.19 | | | $ | 21.57 | | | $ | 24.02 | | |
Income (Loss) from Investment Operations: | |
Net Investment Income(2) | | | 0.20 | | | | 0.10 | | | | 0.11 | | | | 0.07 | | | | 0.11 | | |
Net Realized and Unrealized Gain (Loss) | | | (5.01 | ) | | | 6.92 | | | | 1.11 | | | | (2.36 | ) | | | (1.28 | ) | |
Total from Investment Operations | | | (4.81 | ) | | | 7.02 | | | | 1.22 | | | | (2.29 | ) | | | (1.17 | ) | |
Distributions from and/or in Excess of: | |
Net Investment Income | | | (0.24 | ) | | | (0.09 | ) | | | (0.10 | ) | | | (0.09 | ) | | | (0.10 | ) | |
Net Realized Gain | | | (0.20 | ) | | | — | | | | — | | | | — | | | | (1.18 | ) | |
Total Distributions | | | (0.44 | ) | | | (0.09 | ) | | | (0.10 | ) | | | (0.09 | ) | | | (1.28 | ) | |
Redemption Fees | | | 0.00 | (3) | | | 0.00 | (3) | | | 0.00 | (3) | | | 0.00 | (3) | | | 0.00 | (3) | |
Net Asset Value, End of Period | | $ | 21.99 | | | $ | 27.24 | | | $ | 20.31 | | | $ | 19.19 | | | $ | 21.57 | | |
Total Return(4) | | | (17.58 | )% | | | 34.54 | % | | | 6.37 | % | | | (10.63 | )% | | | (4.77 | )% | |
Ratios and Supplemental Data: | |
Net Assets, End of Period (Thousands) | | $ | 13,605 | | | $ | 23,952 | | | $ | 18,824 | | | $ | 19,065 | | | $ | 26,701 | | |
Ratio of Expenses to Average Net Assets(9) | | | 1.34 | %(5) | | | 1.36 | %(5) | | | 1.45 | %(5)(7) | | | 1.56 | %(5)(6) | | | 1.57 | %(5) | |
Ratio of Net Investment Income to Average Net Assets(9) | | | 0.78 | %(5) | | | 0.42 | %(5) | | | 0.55 | %(5) | | | 0.34 | %(5) | | | 0.45 | %(5) | |
Ratio of Rebate from Morgan Stanley Affiliates to Average Net Assets | | | 0.01 | % | | | 0.00 | %(8) | | | 0.00 | %(8) | | | 0.00 | %(8) | | | 0.00 | %(8) | |
Portfolio Turnover Rate | | | 56 | % | | | 35 | % | | | 33 | % | | | 40 | % | | | 43 | % | |
(9) Supplemental Information on the Ratios to Average Net Assets: | |
Ratios Before Expense Limitation: | |
Expenses to Average Net Assets | | | N/A | | | | 1.40 | % | | | 1.48 | % | | | 1.76 | % | | | 1.82 | % | |
Net Investment Income to Average Net Assets | | | N/A | | | | 0.38 | % | | | 0.52 | % | | | 0.14 | % | | | 0.20 | % | |
(1) Reflects prior period Custodian out-of-pocket expenses that were reimbursed in September 2016. The amount of the reimbursement was immaterial on a per share basis and did not impact the total return of Class A shares. The Ratio of Expenses to Average Net Assets and the Ratio of Net Investment Income to Average Net Assets would be unchanged as the reimbursement of Custodian fees was offset against expense waivers/reimbursements with no impact to net expenses ornet investment income.
(2) Per share amount is based on average shares outstanding.
(3) Amount is less than $0.005 per share.
(4) Calculated based on the net asset value which does not reflect sales charges, if applicable, as of the last business day of the period.
(5) The Ratios of Expenses and Net Investment Income reflect the rebate of certain Fund expenses in connection with the investments in Morgan Stanley affiliates during the period. The effect of the rebate on the ratios is disclosed in the above table as "Ratio of Rebate from Morgan Stanley Affiliates to Average Net Assets."
(6) Effective September 30, 2015, the Adviser has agreed to limit the ratio of expenses to average net assets to the maximum ratio of 1.55% for Class A shares. Prior to September 30, 2015, the maximum ratio was 1.60% for Class A shares.
(7) Effective September 30, 2016, the Adviser has agreed to limit the ratio of expenses to average net assets to the maximum ratio of 1.40% for Class A shares. Prior to September 30, 2016, the maximum ratio was 1.55% for Class A shares.
(8) Amount is less than 0.005%.
The accompanying notes are an integral part of the financial statements.
17
Morgan Stanley Institutional Fund, Inc.
Annual Report — December 31, 2018
Financial Highlights
Emerging Markets Portfolio
| | | Class L | |
| | | Year Ended December 31, | |
Selected Per Share Data and Ratios | | 2018 | | 2017 | | 2016(1) | | 2015 | | 2014 | |
Net Asset Value, Beginning of Period | | $ | 26.85 | | | $ | 20.08 | | | $ | 18.98 | | | $ | 21.39 | | | $ | 23.91 | | |
Income (Loss) from Investment Operations: | |
Net Investment Income (Loss)(2) | | | 0.05 | | | | (0.01 | ) | | | 0.00 | (3) | | | (0.04 | ) | | | (0.05 | ) | |
Net Realized and Unrealized Gain (Loss) | | | (4.91 | ) | | | 6.80 | | | | 1.10 | | | | (2.33 | ) | | | (1.23 | ) | |
Total from Investment Operations | | | (4.86 | ) | | | 6.79 | | | | 1.10 | | | | (2.37 | ) | | | (1.28 | ) | |
Distributions from and/or in Excess of: | |
Net Investment Income | | | (0.15 | ) | | | (0.02 | ) | | | — | | | | (0.04 | ) | | | (0.06 | ) | |
Net Realized Gain | | | (0.20 | ) | | | — | | | | — | | | | — | | | | (1.18 | ) | |
Total Distributions | | | (0.35 | ) | | | (0.02 | ) | | | — | | | | (0.04 | ) | | | (1.24 | ) | |
Redemption Fees | | | 0.00 | (3) | | | 0.00 | (3) | | | 0.00 | (3) | | | 0.00 | (3) | | | 0.00 | (3) | |
Net Asset Value, End of Period | | $ | 21.64 | | | $ | 26.85 | | | $ | 20.08 | | | $ | 18.98 | | | $ | 21.39 | | |
Total Return(4) | | | (18.03 | )% | | | 33.80 | % | | | 5.80 | % | | | (11.11 | )% | | | (5.26 | )% | |
Ratios and Supplemental Data: | |
Net Assets, End of Period (Thousands) | | $ | 292 | | | $ | 253 | | | $ | 239 | | | $ | 226 | | | $ | 210 | | |
Ratio of Expenses to Average Net Assets(9) | | | 1.89 | %(5) | | | 1.90 | %(5) | | | 2.01 | %(5)(7) | | | 2.09 | %(5)(6) | | | 2.10 | %(5) | |
Ratio of Net Investment Income (Loss) to Average Net Assets(9) | | | 0.20 | %(5) | | | (0.03 | )%(5) | | | 0.00 | %(5)(8) | | | (0.19 | )%(5) | | | (0.21 | )%(5) | |
Ratio of Rebate from Morgan Stanley Affiliates to Average Net Assets | | | 0.01 | % | | | 0.00 | %(8) | | | 0.00 | %(8) | | | 0.00 | %(8) | | | 0.00 | %(8) | |
Portfolio Turnover Rate | | | 56 | % | | | 35 | % | | | 33 | % | | | 40 | % | | | 43 | % | |
(9) Supplemental Information on the Ratios to Average Net Assets: | |
Ratios Before Expense Limitation: | |
Expenses to Average Net Assets | | | 2.55 | % | | | 2.54 | % | | | 2.69 | % | | | 2.78 | % | | | 2.97 | % | |
Net Investment Loss to Average Net Assets | | | (0.46 | )% | | | (0.67 | )% | | | (0.68 | )% | | | (0.88 | )% | | | (1.08 | )% | |
(1) Reflects prior period Custodian out-of-pocket expenses that were reimbursed in September 2016. The amount of the reimbursement was immaterial on a per share basis and did not impact the total return of Class L shares. The Ratio of Expenses to Average Net Assets and the Ratio of Net Investment Income to Average Net Assets would be unchanged as the reimbursement of Custodian fees was offset against expense waivers/reimbursements with no impact to net expenses or net investment income.
(2) Per share amount is based on average shares outstanding.
(3) Amount is less than $0.005 per share.
(4) Calculated based on the net asset value as of the last business day of the period.
(5) The Ratios of Expenses and Net Investment Income (Loss) reflect the rebate of certain Fund expenses in connection with the investments in Morgan Stanley affiliates during the period. The effect of the rebate on the ratios is disclosed in the above table as "Ratio of Rebate from Morgan Stanley Affiliates to Average Net Assets."
(6) Effective September 30, 2015, the Adviser has agreed to limit the ratio of expenses to average net assets to the maximum ratio of 2.05% for Class L shares. Prior to September 30, 2015, the maximum ratio was 2.10% for Class L shares.
(7) Effective September 30, 2016, the Adviser has agreed to limit the ratio of expenses to average net assets to the maximum ratio of 1.90% for Class L shares. Prior to September 30, 2016, the maximum ratio was 2.05% for Class L shares.
(8) Amount is less than 0.005%.
The accompanying notes are an integral part of the financial statements.
18
Morgan Stanley Institutional Fund, Inc.
Annual Report — December 31, 2018
Financial Highlights
Emerging Markets Portfolio
| | | Class C | |
| | | Year Ended December 31, | | Period from
April 30, 2015(2) to | |
Selected Per Share Data and Ratios | | 2018 | | 2017 | | 2016(1) | | December 31, 2015 | |
Net Asset Value, Beginning of Period | | $ | 26.66 | | | $ | 19.99 | | | $ | 18.95 | | | $ | 23.16 | | |
Income (Loss) from Investment Operations: | |
Net Investment Income (Loss)(3) | | | 0.04 | | | | (0.09 | ) | | | (0.04 | ) | | | (0.03 | ) | |
Net Realized and Unrealized Gain | | | (4.93 | ) | | | 6.78 | | | | 1.09 | | | | (4.14 | ) | |
Total from Investment Operations | | | (4.89 | ) | | | 6.69 | | | | 1.05 | | | | (4.17 | ) | |
Distributions from and/or in Excess of: | |
Net Investment Income | | | (0.00 | )(4) | | | (0.02 | ) | | | (0.01 | ) | | | (0.04 | ) | |
Net Realized Gain | | | (0.20 | ) | | | — | | | | — | | | | — | | |
Total Distributions | | | (0.20 | ) | | | (0.02 | ) | | | (0.01 | ) | | | (0.04 | ) | |
Redemption Fees | | | 0.00 | (4) | | | 0.00 | (4) | | | 0.00 | (4) | | | 0.00 | (4) | |
Net Asset Value, End of Period | | $ | 21.57 | | | $ | 26.66 | | | $ | 19.99 | | | $ | 18.95 | | |
Total Return(5) | | | (18.26 | )% | | | 33.45 | % | | | 5.56 | % | | | (18.03 | )%(10) | |
Ratios and Supplemental Data: | |
Net Assets, End of Period (Thousands) | | $ | 309 | | | $ | 817 | | | $ | 608 | | | $ | 10 | | |
Ratio of Expenses to Average Net Assets(12) | | | 2.14 | %(6) | | | 2.15 | %(6) | | | 2.24 | %(6)(8) | | | 2.33 | %(6)(7)(11) | |
Ratio of Net Investment Income (Loss) to Average Net Assets(12) | | | 0.17 | %(6) | | | (0.36 | )%(6) | | | (0.19 | )%(6) | | | (0.23 | )%(6)(11) | |
Ratio of Rebate from Morgan Stanley Affiliates to Average Net Assets | | | 0.01 | % | | | 0.00 | %(9) | | | 0.00 | %(9) | | | 0.00 | %(9)(11) | |
Portfolio Turnover Rate | | | 56 | % | | | 35 | % | | | 33 | % | | | 40 | % | |
(12) Supplemental Information on the Ratios to Average Net Assets: | |
Ratios Before Expense Limitation: | |
Expenses to Average Net Assets | | | 2.37 | % | | | 2.30 | % | | | 2.58 | % | | | 22.89 | %(11) | |
Net Investment Loss to Average Net Assets | | | (0.06 | )% | | | (0.51 | )% | | | (0.53 | )% | | | (20.79 | )%(11) | |
(1) Reflects prior period Custodian out-of-pocket expenses that were reimbursed in September 2016. The amount of the reimbursement was immaterial on a per share basis and did not impact the total return of Class C shares. The Ratio of Expenses to Average Net Assets and the Ratio of Net Investment Loss to Average Net Assets would be unchanged as the reimbursement of Custodian fees was offset against expense waivers/reimbursements with no impact to net expenses or net investment loss.
(2) Commencement of Offering.
(3) Per share amount is based on average shares outstanding.
(4) Amount is less than $0.005 per share.
(5) Calculated based on the net asset value which does not reflect sales charges, if applicable, as of the last business day of the period.
(6) The Ratios of Expenses and Net Investment Income (Loss) reflect the rebate of certain Fund expenses in connection with the investments in Morgan Stanley affiliates during the period. The effect of the rebate on the ratios is disclosed in the above table as "Ratio of Rebate from Morgan Stanley Affiliates to Average Net Assets."
(7) Effective September 30, 2015, the Adviser has agreed to limit the ratio of expenses to average net assets to the maximum ratio of 2.30% for Class C shares. Prior to September 30, 2015, the maximum ratio was 2.35% for Class C shares.
(8) Effective September 30, 2016, the Adviser has agreed to limit the ratio of expenses to average net assets to the maximum ratio of 2.15% for Class C shares. Prior to September 30, 2016, the maximum ratio was 2.30% for Class C shares.
(9) Amount is less than 0.005%.
(10) Not annualized.
(11) Annualized.
The accompanying notes are an integral part of the financial statements.
19
Morgan Stanley Institutional Fund, Inc.
Annual Report — December 31, 2018
Financial Highlights
Emerging Markets Portfolio
| | | Class IS | |
| | | Year Ended December 31, | |
Selected Per Share Data and Ratios | | 2018 | | 2017 | | 2016(1) | | 2015 | | 2014 | |
Net Asset Value, Beginning of Period | | $ | 27.96 | | | $ | 20.83 | | | $ | 19.68 | | | $ | 22.14 | | | $ | 24.64 | | |
Income (Loss) from Investment Operations: | |
Net Investment Income(2) | | | 0.31 | | | | 0.21 | | | | 0.21 | | | | 0.17 | | | | 0.22 | | |
Net Realized and Unrealized Gain (Loss) | | | (5.17 | ) | | | 7.11 | | | | 1.12 | | | | (2.44 | ) | | | (1.32 | ) | |
Total from Investment Operations | | | (4.86 | ) | | | 7.32 | | | | 1.33 | | | | (2.27 | ) | | | (1.10 | ) | |
Distributions from and/or in Excess of: | |
Net Investment Income | | | (0.38 | ) | | | (0.19 | ) | | | (0.18 | ) | | | (0.19 | ) | | | (0.22 | ) | |
Net Realized Gain | | | (0.20 | ) | | | — | | | | — | | | | — | | | | (1.18 | ) | |
Total Distributions | | | (0.58 | ) | | | (0.19 | ) | | | (0.18 | ) | | | (0.19 | ) | | | (1.40 | ) | |
Redemption Fees | | | 0.00 | (3) | | | 0.00 | (3) | | | 0.00 | (3) | | | 0.00 | (3) | | | 0.00 | (3) | |
Net Asset Value, End of Period | | $ | 22.52 | | | $ | 27.96 | | | $ | 20.83 | | | $ | 19.68 | | | $ | 22.14 | | |
Total Return(4) | | | (17.25 | )% | | | 35.09 | % | | | 6.79 | % | | | (10.29 | )% | | | (4.36 | )% | |
Ratios and Supplemental Data: | |
Net Assets, End of Period (Thousands) | | $ | 797,029 | | | $ | 1,034,348 | | | $ | 657,106 | | | $ | 297,469 | | | $ | 325,029 | | |
Ratio of Expenses to Average Net Assets(9) | | | 0.92 | %(5) | | | 0.95 | %(5) | | | 1.04 | %(5)(7) | | | 1.16 | %(5)(6) | | | 1.18 | %(5) | |
Ratio of Net Investment Income to Average Net Assets(9) | | | 1.21 | %(5) | | | 0.82 | %(5) | | | 0.99 | %(5) | | | 0.75 | %(5) | | | 0.89 | %(5) | |
Ratio of Rebate from Morgan Stanley Affiliates to Average Net Assets | | | 0.01 | % | | | 0.00 | %(8) | | | 0.00 | %(8) | | | 0.00 | %(8) | | | 0.00 | %(8) | |
Portfolio Turnover Rate | | | 56 | % | | | 35 | % | | | 33 | % | | | 40 | % | | | 43 | % | |
(9) Supplemental Information on the Ratios to Average Net Assets: | |
Ratios Before Expense Limitation: | |
Expenses to Average Net Assets | | | N/A | | | | 0.98 | % | | | 1.07 | % | | | 1.35 | % | | | 1.42 | % | |
Net Investment Income to Average Net Assets | | | N/A | | | | 0.79 | % | | | 0.96 | % | | | 0.56 | % | | | 0.65 | % | |
(1) Reflects prior period Custodian out-of-pocket expenses that were reimbursed in September 2016. The amount of the reimbursement was immaterial on a per share basis and did not impact the total return of Class IS shares. The Ratio of Expenses to Average Net Assets and the Ratio of Net Investment Income to Average Net Assets would be unchanged as the reimbursement of Custodian fees was offset against expense waivers/reimbursements with no impact to net expenses or net investment income.
(2) Per share amount is based on average shares outstanding.
(3) Amount is less than $0.005 per share.
(4) Calculated based on the net asset value as of the last business day of the period.
(5) The Ratios of Expenses and Net Investment Income reflect the rebate of certain Fund expenses in connection with the investments in Morgan Stanley affiliates during the period. The effect of the rebate on the ratios is disclosed in the above table as "Ratio of Rebate from Morgan Stanley Affiliates to Average Net Assets."
(6) Effective September 30, 2015, the Adviser has agreed to limit the ratio of expenses to average net assets to the maximum ratio of 1.10% for Class IS shares. Prior to September 30, 2015, the maximum ratio was 1.18% for Class IS shares.
(7) Effective September 30, 2016, the Adviser has agreed to limit the ratio of expenses to average net assets to the maximum ratio of 0.95% for Class IS shares. Prior to September 30, 2016, the maximum ratio was 1.10% for Class IS shares.
(8) Amount is less than 0.005%.
The accompanying notes are an integral part of the financial statements.
20
Morgan Stanley Institutional Fund, Inc.
Annual Report — December 31, 2018
Financial Highlights
Emerging Markets Portfolio
| | | Class IR | |
Selected Per Share Data and Ratios | | Period from
June 15, 2018(1) to
December 31, 2018 | |
Net Asset Value, Beginning of Period | | $ | 26.23 | | |
Income (Loss) from Investment Operations: | |
Net Investment Income(2) | | | 0.20 | | |
Net Realized and Unrealized Loss | | | (3.31 | ) | |
Total from Investment Operations | | | (3.11 | ) | |
Distributions from and/or in Excess of: | |
Net Investment Income | | | (0.38 | ) | |
Net Realized Gain | | | (0.20 | ) | |
Total Distributions | | | (0.58 | ) | |
Redemption Fees | | | 0.00 | (3) | |
Net Asset Value, End of Period | | $ | 22.54 | | |
Total Return(4) | | | (11.82 | )%(6) | |
Ratios and Supplemental Data: | |
Net Assets, End of Period, (Thousands) | | $ | 9 | | |
Ratios of Expenses to Average Net Assets(8) | | | 0.93 | %(5)(7) | |
Ratio of Net Investment Income to Average Net Assets(8) | | | 1.56 | %(5)(7) | |
Ratio of Rebate from Morgan Stanley Affiliates to Average Net Assets | | | 0.01 | %(7) | |
Portfolio Turnover Rate | | | 56 | % | |
(8) Supplemental Information on the Ratios to Average Net Assets: | |
Ratios Before Expense Limitation: | |
Expenses to Average Net Assets | | | 19.46 | %(7) | |
Net Investment Loss to Average Net Assets | | | (16.97 | )%(7) | |
(1) Commencement of Offering.
(2) Per share amount is based on average shares outstanding.
(3) Amount is less than $0.005 per share.
(4) Calculated based on the net asset value as of the last business day of the period.
(5) The Ratios of Expenses and Net Investment Income reflect the rebate of certain Fund expenses in connection with the investments in Morgan Stanley affiliates during the period. The effect of the rebate on the ratios is disclosed in the above table as "Ratio of Rebate from Morgan Stanley Affiliates to Average Net Assets."
(6) Not annualized.
(7) Annualized.
The accompanying notes are an integral part of the financial statements.
21
Morgan Stanley Institutional Fund, Inc.
Annual Report — December 31, 2018
Notes to Financial Statements
Morgan Stanley Institutional Fund, Inc. (the "Company") is registered under the Investment Company Act of 1940, as amended (the "Act"), as an open-end management investment company. The Company is comprised of thirty separate, active, diversified and non-diversified funds (individually referred to as a "Fund", collectively as the "Funds"). The Company applies investment company accounting and reporting guidance.
The accompanying financial statements relate to the Emerging Markets Portfolio. The Fund seeks long-term capital appreciation by investing primarily in growth-oriented equity securities of issuers in emerging market countries.
The Fund offers six classes of shares — Class I, Class A, Class L, Class C, Class IS and Class IR. On April 30, 2015, the Fund suspended offering of Class L shares. Existing Class L shareholders may invest through reinvestment of dividends and distributions. On June 15, 2018, the Fund commenced offering Class IR shares.
A. Significant Accounting Policies: The following significant accounting policies are in conformity with U.S. generally accepted accounting principles ("GAAP"). Such policies are consistently followed by the Company in the preparation of its financial statements. GAAP may require management to make estimates and assumptions that affect the reported amounts and disclosures in the financial statements. Actual results may differ from those estimates.
In August 2018, the Financial Accounting Standards Board ("FASB") issued Accounting Standards Update ("ASU") 2018-13, Fair Value Measurement (Topic 820) — Disclosures Framework — Changes to Disclosure Requirements of Fair Value Measurement ("ASU 2018-13") which introduces new fair value disclosure requirements as well as eliminates and modifies certain existing fair value disclosure requirements. ASU 2018-13 would be effective for fiscal years beginning after December 15, 2019 and for interim periods within those fiscal years; however, management has elected to early adopt ASU 2018-13 effective with the current reporting period as permitted by the standard. The impact of the Fund's adoption was limited to changes in the Fund's financial statement disclosures regarding fair value, primarily those disclosures related to transfers between levels of the fair value hierarchy and disclosure of the range and weighted average used to develop significant unobservable inputs for Level 3 fair value measurements, when applicable.
1. Security Valuation: (1) An equity portfolio security listed or traded on an exchange is valued at its latest
reported sales price (or at the exchange official closing price if such exchange reports an official closing price), and if there were no sales on a given day and if there is no official exchange closing price for that day, the security is valued at the mean between the last reported bid and asked prices if such bid and asked prices are available on the relevant exchanges. Listed equity securities not traded on the valuation date with no reported bid and asked prices available on the exchange are valued at the mean between the current bid and asked prices obtained from one or more reputable brokers or dealers. In cases where a security is traded on more than one exchange, the security is valued on the exchange designated as the primary market; (2) all other equity portfolio securities for which over-the-counter ("OTC") market quotations are readily available are valued at the latest reported sales price (or at the market official closing price if such market reports an official closing price), and if there was no trading in the security on a given day and if there is no official closing price from relevant markets for that day, the security is valued at the mean between the last reported bid and asked prices if such bid and asked prices are available on the relevant markets. An unlisted equity security that does not trade on the valuation date and for which bid and asked prices from the relevant markets are unavailable is valued at the mean between the current bid and asked prices obtained from one or more reputable brokers or dealers; (3) certain portfolio securities may be valued by an outside pricing service/vendor approved by the Company's Board of Directors (the "Directors"). The pricing service/vendor may employ a pricing model that takes into account, among other things, bids, yield spreads and/or other market data and specific security characteristics. Alternatively, if a valuation is not available from an outside pricing service/vendor, and the security trades on an exchange, the security may be valued at its latest reported sale price (or at the exchange official closing price if such exchange reports an official closing price), prior to the time when assets are valued. If there are no sales on a given day and if there is no official exchange closing price for that day, the security is valued at the mean between the last reported bid and asked prices if such bid and asked prices are available in the relevant exchanges; (4) when market quotations are not readily available, including circumstances under which Morgan Stanley Investment Management Inc. (the "Adviser") or Morgan Stanley Investment Management Company ("MSIM Company") (the "Sub-Adviser"), each a
22
Morgan Stanley Institutional Fund, Inc.
Annual Report — December 31, 2018
Notes to Financial Statements
wholly-owned subsidiary of Morgan Stanley, determines that the closing price, last sale price or the mean between the last reported bid and asked prices are not reflective of a security's market value, portfolio securities are valued at their fair value as determined in good faith under procedures established by and under the general supervision of the Directors (the "Directors"). Occasionally, developments affecting the closing prices of securities and other assets may occur between the times at which valuations of such securities are determined (that is, close of the foreign market on which the securities trade) and the close of business of the New York Stock Exchange ("NYSE"). If developments occur during such periods that are expected to materially affect the value of such securities, such valuations may be adjusted to reflect the estimated fair value of such securities as of the close of the NYSE, as determined in good faith by the Directors or by the Adviser using a pricing service and/or procedures approved by the Directors; (5) quotations of foreign portfolio securities, other assets and liabilities and forward contracts stated in foreign currency are translated into U.S. dollar equivalents at the prevailing market rates prior to the close of the NYSE; and (6) investments in mutual funds, including the Morgan Stanley Institutional Liquidity Funds, are valued at the net asset value ("NAV") as of the close of each business day.
The Directors have responsibility for determining in good faith the fair value of the investments, and the Directors may appoint others, such as the Company's Adviser or a valuation committee, to assist the Directors in determining fair value and to make the actual calculations pursuant to the fair valuation methodologies previously approved by the Directors. Under procedures approved by the Directors, the Company's Adviser has formed a Valuation Committee whose members are approved by the Directors. The Valuation Committee provides administration and oversight of the Company's valuation policies and procedures, which are reviewed at least annually by the Directors. These procedures allow the Company to utilize independent pricing services, quotations from securities and financial instrument dealers and other market sources to determine fair value.
2. Fair Value Measurement: FASB Accounting Standards CodificationTM ("ASC") 820, "Fair Value Measurement" ("ASC 820"), defines fair value as the value that the Fund would receive to sell an investment or pay to transfer a liability in a timely transaction with an independent
buyer in the principal market, or in the absence of a principal market, the most advantageous market for the investment or liability. ASC 820 establishes a three-tier hierarchy to distinguish between (1) inputs that reflect the assumptions market participants would use in valuing an asset or liability developed based on market data obtained from sources independent of the reporting entity (observable inputs) and (2) inputs that reflect the reporting entity's own assumptions about the assumptions market participants would use in valuing an asset or liability developed based on the best information available in the circumstances (unobservable inputs) and to establish classification of fair value measurements for disclosure purposes. Various inputs are used in determining the value of the Fund's investments. The inputs are summarized in the three broad levels listed below:
• Level 1 – unadjusted quoted prices in active markets for identical investments
• Level 2 – other significant observable inputs (including quoted prices for similar investments, interest rates, prepayment speeds, credit risk, etc.)
• Level 3 – significant unobservable inputs including the Fund's own assumptions in determining the fair value of investments. Factors considered in making this determination may include, but are not limited to, information obtained by contacting the issuer, analysts, or the appropriate stock exchange (for exchange-traded securities), analysis of the issuer's financial statements or other available documents and, if necessary, available information concerning other securities in similar circumstances
The inputs or methodology used for valuing securities are not necessarily an indication of the risk associated with investing in those securities and the determination of the significance of a particular input to the fair value measurement in its entirety requires judgment and considers factors specific to each security.
23
Morgan Stanley Institutional Fund, Inc.
Annual Report — December 31, 2018
Notes to Financial Statements
The following is a summary of the inputs used to value the Fund's investments as of December 31, 2018:
Investment Type | | Level 1
Unadjusted
quoted
prices
(000) | | Level 2
Other
significant
observable
inputs
(000) | | Level 3
Significant
unobservable
inputs
(000) | | Total
(000) | |
Assets: | |
Common Stocks | |
Automobiles | | $ | — | | | $ | 32,620 | | | $ | — | | | $ | 32,620 | | |
Banks | | | 31,932 | | | | 228,936 | | | | — | | | | 260,868 | | |
Beverages | | | 14,978 | | | | 17,314 | | | | — | | | | 32,292 | | |
Capital Markets | | | — | | | | 10,705 | | | | — | | | | 10,705 | | |
Construction Materials | | | — | | | | 19,544 | | | | — | | | | 19,544 | | |
Diversified Consumer
Services | | | 8,998 | | | | — | | | | — | | | | 8,998 | | |
Diversified Financial
Services | | | — | | | | 8,288 | | | | — | | | | 8,288 | | |
Diversified
Telecommunication
Services | | | — | | | | 15,509 | | | | — | | | | 15,509 | | |
Electronic Equipment,
Instruments &
Components | | | — | | | | 2,099 | | | | — | | | | 2,099 | | |
Food & Staples Retailing | | | 13,394 | | | | 44,995 | | | | — | | | | 58,389 | | |
Food Products | | | — | | | | 22,516 | | | | — | | | | 22,516 | | |
Gas Utilities | | | 4,053 | | | | — | | | | — | | | | 4,053 | | |
Health Care Providers &
Services | | | — | | | | 10,742 | | | | — | | | | 10,742 | | |
Hotels, Restaurants &
Leisure | | | 6,256 | | | | 899 | | | | — | | | | 7,155 | | |
Household Products | | | — | | | | 9,984 | | | | — | | | | 9,984 | | |
Independent Power &
Renewable Electricity
Producers | | | — | | | | 3,111 | | | | — | | | | 3,111 | | |
Industrial Conglomerates | | | — | | | | 22,489 | | | | — | | | | 22,489 | | |
Information Technology
Services | | | — | | | | 7,951 | | | | — | | | | 7,951 | | |
Insurance | | | — | | | | 30,447 | | | | — | | | | 30,447 | | |
Interactive Media &
Services | | | 39,689 | | | | 40,214 | | | | — | | | | 79,903 | | |
Machinery | | | — | | | | 10,360 | | | | — | | | | 10,360 | | |
Media | | | — | | | | 5,441 | | | | — | | | | 5,441 | | |
Metals & Mining | | | 13,607 | | | | 11,879 | | | | — | | | | 25,486 | | |
Multi-Line Retail | | | — | | | | 23,122 | | | | — | | | | 23,122 | | |
Oil, Gas & Consumable
Fuels | | | — | | | | 39,852 | | | | — | | | | 39,852 | | |
Personal Products | | | — | | | | 19,134 | | | | — | | | | 19,134 | | |
Pharmaceuticals | | | — | | | | 9,146 | | | | — | | | | 9,146 | | |
Real Estate
Management &
Development | | | — | | | | 15,794 | | | | — | | | | 15,794 | | |
Semiconductors &
Semiconductor
Equipment | | | — | | | | 66,341 | | | | — | | | | 66,341 | | |
Tech Hardware,
Storage & Peripherals | | | — | | | | 34,152 | | | | — | | | | 34,152 | | |
Textiles, Apparel &
Luxury Goods | | | — | | | | 44,537 | | | | — | | | | 44,537 | | |
Thrifts & Mortgage
Finance | | | — | | | | 10,916 | | | | — | | | | 10,916 | | |
Transportation
Infrastructure | | | — | | | | 6,972 | | | | — | | | | 6,972 | | |
Investment Type | | Level 1
Unadjusted
quoted
prices
(000) | | Level 2
Other
significant
observable
inputs
(000) | | Level 3
Significant
unobservable
inputs
(000) | | Total
(000) | |
Common Stocks (cont'd) | |
Wireless
Telecommunication
Services | | $ | — | | | $ | 13,742 | | | $ | — | | | $ | 13,742 | | |
Total Common Stocks | | | 132,907 | | | | 839,751 | | | | — | | | | 972,658 | | |
Short-Term Investments | |
Investment Company | | | 78,197 | | | | — | | | | — | | | | 78,197 | | |
Foreign Currency
Forward Exchange
Contract | | | — | | | | 384 | | | | — | | | | 384 | | |
Total Assets | | | 211,104 | | | | 840,135 | | | | — | | | | 1,051,239 | | |
Liabilities: | |
Foreign Currency
Forward Exchange
Contract | | | — | | | | (2,154 | ) | | | — | | | | (2,154 | ) | |
Futures Contract | | | (363 | ) | | | — | | | | — | | | | (363 | ) | |
Total Liabilities | | | (363 | ) | | | (2,154 | ) | | | — | | | | (2,517 | ) | |
Total | | $ | 210,741 | | | $ | 837,981 | | | $ | — | | | $ | 1,048,722 | | |
Transfers between investment levels may occur as the markets fluctuate and/or the availability of data used in an investment's valuation changes.
3. Foreign Currency Translation and Foreign Investments: The books and records of the Fund are maintained in U.S. dollars. Foreign currency amounts are translated into U.S. dollars as follows:
– investments, other assets and liabilities at the prevailing rate of exchange on the valuation date;
– investment transactions and investment income at the prevailing rates of exchange on the dates of such transactions.
Although the net assets of the Fund are presented at the foreign exchange rates and market values at the close of the period, the Fund does not isolate that portion of the results of operations arising as a result of changes in the foreign exchange rates from the fluctuations arising from changes in the market prices of securities held at period end. Similarly, the Fund does not isolate the effect of changes in foreign exchange rates from the fluctuations arising from changes in the market prices of securities sold during the period. Accordingly, realized and unrealized foreign currency gains (losses) on investments in securities are included in the reported net realized and unrealized gains (losses) on investment transactions and balances. However, pursuant to U.S. federal income tax regulations, gains and losses from
24
Morgan Stanley Institutional Fund, Inc.
Annual Report — December 31, 2018
Notes to Financial Statements
certain foreign currency transactions and the foreign currency portion of gains and losses realized on sales and maturities of foreign denominated debt securities are treated as ordinary income for U.S. federal income tax purposes.
Net realized gains (losses) on foreign currency transactions represent net foreign exchange gains (losses) from foreign currency forward exchange contracts, disposition of foreign currencies, currency gains (losses) realized between the trade and settlement dates on securities transactions, and the difference between the amount of investment income and foreign withholding taxes recorded on the Fund's books and the U.S. dollar equivalent amounts actually received or paid. Net unrealized currency gains (losses) from valuing foreign currency denominated assets and liabilities at period end exchange rates are reflected as a component of unrealized appreciation (depreciation) in the Statement of Assets and Liabilities. The change in unrealized currency gains (losses) on foreign currency translations for the period is reflected in the Statement of Operations.
Foreign security and currency transactions may involve certain considerations and risks not typically associated with those of U.S. dollar denominated transactions as a result of, among other factors, fluctuations of exchange rates in relation to the U.S. dollar, the possibility of lower levels of governmental supervision and regulation of foreign securities markets and the possibility of political or economic instability.
Governmental approval for foreign investments may be required in advance of making an investment under certain circumstances in some countries, and the extent of foreign investments in domestic companies may be subject to limitation in other countries. Foreign ownership limitations also may be imposed by the charters of individual companies to prevent, among other concerns, violations of foreign investment limitations. As a result, an additional class of shares (identified as "Foreign" in the Portfolio of Investments) may be created and offered for investment. The "local" and "foreign shares" market values may differ. In the absence of trading of the foreign shares in such markets, the Fund values the foreign shares at the closing exchange price of the local shares.
4. Derivatives: The Fund may, but is not required to, use derivative instruments for a variety of purposes, including
hedging, risk management, portfolio management or to earn income. Derivatives are financial instruments whose value is based, in part, on the value of an underlying asset, interest rate, index or financial instrument. Prevailing interest rates and volatility levels, among other things, also affect the value of derivative instruments. A derivative instrument often has risks similar to its underlying asset and may have additional risks, including imperfect correlation between the value of the derivative and the underlying asset, risks of default by the counterparty to certain transactions, magnification of losses incurred due to changes in the market value of the securities, instruments, indices or interest rates to which the derivative instrument relates, risks that the transactions may not be liquid and risks arising from margin requirements. The use of derivatives involves risks that are different from, and possibly greater than, the risks associated with other portfolio investments. Derivatives may involve the use of highly specialized instruments that require investment techniques and risk analyses different from those associated with other portfolio investments. All of the Fund's holdings, including derivative instruments, are marked-to-market each day with the change in value reflected in unrealized appreciation (depreciation). Upon disposition, a realized gain or loss is recognized.
Certain derivative transactions may give rise to a form of leverage. Leverage magnifies the potential for gain and the risk of loss. Leverage associated with derivative transactions may cause the Fund to liquidate portfolio positions when it may not be advantageous to do so to satisfy its obligations or to meet earmarking or segregation requirements, pursuant to applicable Securities and Exchange Commission ("SEC") rules and regulations, or may cause the Fund to be more volatile than if the Fund had not been leveraged. Although the Adviser and/or Sub-Adviser seek to use derivatives to further the Fund's investment objectives, there is no assurance that the use of derivatives will achieve this result.
Following is a description of the derivative instruments and techniques that the Fund used during the period and their associated risks:
Foreign Currency Forward Exchange Contracts: In connection with its investments in foreign securities, the Fund also entered into contracts with banks, brokers or dealers to purchase or sell securities or foreign currencies at a future date. A foreign currency forward exchange
25
Morgan Stanley Institutional Fund, Inc.
Annual Report — December 31, 2018
Notes to Financial Statements
contract ("currency contract") is a negotiated agreement between the contracting parties to exchange a specified amount of currency at a specified future time at a specified rate. The rate can be higher or lower than the spot rate between the currencies that are the subject of the contract. Currency contracts may be used to protect against uncertainty in the level of future foreign currency exchange rates or to gain or modify exposure to a particular currency. To the extent hedged by the use of currency contracts, the precise matching of the currency contract amounts and the value of the securities involved will not generally be possible because the future value of such securities in foreign currencies will change as a consequence of market movements in the value of those securities between the date on which the contract is entered into and the date it matures. Furthermore, such transactions may reduce or preclude the opportunity for gain if the value of the currency should move in the direction opposite to the position taken. There is additional risk to the extent that currency contracts create exposure to currencies in which the Fund's securities are not denominated. Unanticipated changes in currency prices may result in poorer overall performance for the Fund than if it had not entered into such contracts. The use of currency contracts involves the risk of loss from the insolvency or bankruptcy of the counterparty to the contract or the failure of the counterparty to make payments or otherwise comply with the terms of the contract. A currency contract is marked-to-market daily and the change in market value is recorded by the Fund as unrealized gain or loss. The Fund records realized gains (losses) when the currency contract is closed equal to the difference between the value of the currency contract at the time it was opened and the value at the time it was closed.
Futures: A futures contract is a standardized, exchange-traded agreement to buy or sell a specific quantity of an underlying asset, reference rate or index at a specific price at a specific future time. The value of a futures contract tends to increase and decrease in tandem with the value of the underlying instrument. Depending on the terms of the particular contract, futures contracts are settled through either physical delivery of the underlying instrument on the settlement date or by payment of a cash settlement amount on the settlement date. During the period the futures contract is open, payments are
received from or made to the broker based upon changes in the value of the contract (the variation margin). A decision as to whether, when and how to use futures contracts involves the exercise of skill and judgment and even a well-conceived futures transaction may be unsuccessful because of market behavior or unexpected events. In addition to the derivatives risks discussed above, the prices of futures contracts can be highly volatile, using futures contracts can lower total return and the potential loss from futures contracts can exceed the Fund's initial investment in such contracts. No assurance can be given that a liquid market will exist for any particular futures contract at any particular time. There is also the risk of loss by the Fund of margin deposits in the event of bankruptcy of a broker with which the Fund has open positions in the futures contract.
FASB ASC 815, "Derivatives and Hedging" ("ASC 815"), is intended to improve financial reporting about derivative instruments by requiring enhanced disclosures to enable investors to better understand how and why the Fund uses derivative instruments, how these derivative instruments are accounted for and their effects on the Fund's financial position and results of operations.
The following tables set forth the fair value of the Fund's derivative contracts by primary risk exposure as of December 31, 2018:
| | | Asset Derivatives
Statement of Assets and
Liabilities Location | | Primary Risk
Exposure | | Value
(000) | |
Foreign Currency
Forward Exchange
Contract | | Unrealized Appreciation on
Foreign Currency Forward
Exchange Contract | |
Currency Risk | | $ | 384 | | |
| | | Liability Derivatives
Statement of Assets and
Liabilities Location | | Primary Risk
Exposure | | Value
(000) | |
Foreign Currency
Forward Exchange | | Unrealized Depreciation on
Foreign Currency Forward | |
| | | |
Contract | | Exchange Contract | | Currency Risk | | $ | (2,154 | ) | |
Futures Contract
| | Variation Margin on
Futures Contract | |
Equity Risk | | | (363 | )(a) | |
Total | | | | | | $ | (2,517 | ) | |
(a) This amount represents the cumulative appreciation (depreciation) as reported in the Portfolio of Investments. The Statement of Assets and Liabilities only reflects the current day's net variation margin.
The following tables set forth by primary risk exposure the Fund's realized gains (losses) and change in unrealized appreciation (depreciation) by type of derivative
26
Morgan Stanley Institutional Fund, Inc.
Annual Report — December 31, 2018
Notes to Financial Statements
contract for the year ended December 31, 2018 in accordance with ASC 815:
Realized Gain (Loss) | |
Primary Risk Exposure | | Derivative Type | | Value
(000) | |
Currency Risk
| | Foreign Currency
Forward Exchange
Contracts | | $ | 3,770 | | |
Equity Risk | | Futures Contract | | | 1,150 | | |
Total | | | | $ | 4,920 | | |
Change in Unrealized Appreciation (Depreciation) | |
Primary Risk Exposure | | Derivative Type | | Value
(000) | |
Currency Risk
| | Foreign Currency
Forward Exchange
Contracts | | $ | (1,770 | ) | |
Equity Risk | | Futures Contract | | | (363 | ) | |
Total | | | | $ | (2,133 | ) | |
At December 31, 2018, the Fund's derivative assets and liabilities are as follows:
Gross Amounts of Assets and Liabilities
Presented in the Statement of Assets and Liabilities | |
Derivatives(b) | | Assets(c)
(000) | | Liabilities(c)
(000) | |
Foreign Currency Forward Exchange Contracts | | $ | 384 | | | $ | (2,154 | ) | |
(b) Excludes exchange-traded derivatives.
(c) Absent an event of default or early termination, OTC derivative assets and liabilities are presented gross and not offset in the Statement of Assets and Liabilities.
The Fund typically enters into International Swaps and Derivatives Association, Inc. Master Agreements ("ISDA Master Agreements") or similar master agreements (collectively, "Master Agreements") with its contract counterparties for certain OTC derivatives in order to, among other things, reduce its credit risk to counterparties. ISDA Master Agreements include provisions for general obligations, representations, collateral and events of default or termination. Under an ISDA Master Agreement, the Fund typically may offset with the counterparty certain OTC derivative financial instruments' payables and/or receivables with collateral held and/or posted and create one single net payment (close-out netting) in the event of default, termination and/or potential deterioration in the credit quality of the counterparty. Various Master Agreements govern the terms of certain transactions with counterparties, including transactions such as swap, forward, repurchase and reverse repurchase agreements. These Master Agreements typically attempt to reduce the counterparty risk associated with such transactions by specifying credit protection mechanisms and providing standardization that improves legal certainty. Cross-termination provisions
under Master Agreements typically provide that a default in connection with one transaction between the Fund and a counterparty gives the non-defaulting party the right to terminate any other transactions in place with the defaulting party to create one single net payment due to/due from the defaulting party and may be a feature in certain Master Agreements. In the event the Fund exercises its right to terminate a Master Agreement after a counterparty experiences a termination event as defined in the Master Agreement, the return of collateral with market value in excess of the Fund's net liability may be delayed or denied.
The following tables present derivative financial instruments that are subject to enforceable netting arrangements as of December 31, 2018:
Gross Amounts Not Offset in the Statement of Assets and Liabilities | |
Counterparty | | Gross Asset
Derivatives
Presented in
the Statement of
Assets and
Liabilities
(000) | | Financial
Instrument
(000) | | Collateral
Pledged
(000) | | Net
Amount
(not less
than $0)
(000) | |
Goldman Sachs International | | $ | 384 | | | $ | — | | | $ | — | | | $ | 384 | | |
Gross Amounts Not Offset in the Statement of Assets and Liabilities | |
Counterparty | | Gross Liability
Derivatives
Presented in
the Statement of
Assets and
Liabilities
(000) | | Financial
Instrument
(000) | | Collateral
Pledged
(000) | | Net
Amount
(not less
than $0)
(000) | |
UBS AG | | $ | 2,154 | | | $ | — | | | $ | — | | | $ | 2,154 | | |
For the year ended December 31, 2018, the approximate average monthly amount outstanding for each derivative type is as follows:
Foreign Currency Forward Exchange Contract: | |
Average monthly principal amount | | $ | 132,677,000 | | |
Futures Contracts: | |
Average monthly notional value | | $ | 6,048,000 | | |
5. Securities Lending: The Fund lends securities to qualified financial institutions, such as broker-dealers, to earn additional income. Any increase or decrease in the fair value of the securities loaned that might occur and any interest earned or dividends declared on those securities during the term of the loan would remain in the Fund. The Fund would receive cash or securities as collateral in an amount equal to or exceeding 100% of the current fair value of the loaned securities. The collateral is marked-to-market daily by State Street Bank and Trust Company
27
Morgan Stanley Institutional Fund, Inc.
Annual Report — December 31, 2018
Notes to Financial Statements
("State Street"), the securities lending agent, to ensure that a minimum of 100% collateral coverage is maintained.
Based on pre-established guidelines, the securities lending agent invests any cash collateral that is received in an affiliated money market portfolio and repurchase agreements. Securities lending income is generated from the earnings on the invested collateral and borrowing fees, less any rebates owed to the borrowers and compensation to the lending agent, and is recorded as "Income from Securities Loaned — Net" in the Fund's Statement of Operations. Risks in securities lending transactions are that a borrower may not provide additional collateral when required or return the securities when due, and that the value of the short-term investments will be less than the amount of cash collateral plus any rebate that is required to be returned to the borrower.
The Fund has the right under the securities lending agreement to recover the securities from the borrower on demand.
The following table presents financial instruments that are subject to enforceable netting arrangements as of December 31, 2018:
Gross Amounts Not Offset in the Statement of Assets and Liabilities | |
Gross Asset
Amounts
Presented in
the Statement
of Assets and
Liabilities
(000) | | Financial
Instrument
(000) | | Collateral
Received
(000) | | Net
Amount
(not less
than $0)
(000) | |
| $ | 8,747 | (d) | | $ | — | | | $ | 8,747 | (e)(f) | | $ | 0 | | |
(d) Represents market value of loaned securities at year end.
(e) The Fund received cash collateral of approximately $8,887,000, which was subsequently invested in Morgan Stanley Institutional Liquidity Funds as reported in the Portfolio of Investments. In addition, the Fund received non-cash collateral of approximately $236,000 in the form of U.S. Government obligations, which the Fund cannot sell or repledge, and accordingly are not reflected in the Portfolio of Investments.
(f) The actual collateral received is greater than the amount shown here due to overcollateralization.
FASB ASC 860, "Transfers & Servicing: Repurchase-to-Maturity Transactions, Repurchase Financings, and Disclosures", is intended to provide increased transparency about the types of collateral pledged in securities lending transactions and other similar transactions that are accounted for as secured borrowing.
The following table displays a breakdown of transactions accounted for as secured borrowings, the gross obligations by class of collateral pledged and the remaining
contractual maturity of those transactions as of December 31, 2018:
Remaining Contractual Maturity of the Agreements | |
| | | Overnight and
Continuous
(000) | | <30 days
(000) | | Between
30 &
90 days
(000) | | >90 days
(000) | | Total
(000) | |
Securities Lending
Transactions | |
Common Stocks | | $ | 8,887 | | | $ | — | | | $ | — | | | $ | — | | | $ | 8,887 | | |
Total Borrowings | | $ | 8,887 | | | $ | — | | | $ | — | | | $ | — | | | $ | 8,887 | | |
Gross amount of
recognized liabilities
for securities lending
transactions | | | | | | | | | | $ | 8,887 | | |
6. Redemption Fees: The Fund will assess a 2% redemption fee on Class I shares, Class A shares, Class L shares, Class C shares, Class IS shares and Class IR shares which is paid directly to the Fund, for shares redeemed or exchanged within thirty days of purchase, subject to certain exceptions. The redemption fee is designed to protect the Fund and its remaining shareholders from the effects of short-term trading. These fees, if any, are included in the Statements of Changes in Net Assets.
7. Indemnifications: The Company enters into contracts that contain a variety of indemnifications. The Company's maximum exposure under these arrangements is unknown. However, the Company has not had prior claims or losses pursuant to these contracts and expects the risk of loss to be remote.
8. Dividends and Distributions to Shareholders: Dividends and distributions to shareholders are recorded on the ex-dividend date. Dividends from net investment income, if any, are declared and paid annually. Net realized capital gains, if any, are distributed at least annually.
9. Security Transactions, Income and Expenses: Security transactions are accounted for on the trade date (date the order to buy or sell is executed). Realized gains and losses on the sale of investment securities are determined on the specific identified cost method. Dividend income and other distributions are recorded on the ex-dividend date (except for certain foreign dividends which may be recorded as soon as the Fund is informed of such dividends) net of applicable withholding taxes. Interest income is recognized on the accrual basis except where collection is in doubt. Discounts are accreted and premiums are amortized over the life of the respective securities. Most expenses of the Company can be directly
28
Morgan Stanley Institutional Fund, Inc.
Annual Report — December 31, 2018
Notes to Financial Statements
attributed to a particular Fund. Expenses which cannot be directly attributed are apportioned among the Funds based upon relative net assets or other appropriate methods. Income, expenses (other than class specific expenses — distribution and shareholder services, transfer agency and sub transfer agency fees) and realized and unrealized gains or losses are allocated to each class of shares based upon their relative net assets.
B. Advisory/Sub-Advisory Fees: The Adviser, a wholly-owned subsidiary of Morgan Stanley, provides the Fund with advisory services under the terms of an Investment Advisory Agreement, paid quarterly, at the annual rate based on the daily net assets as follows:
First $500
million | | Next $500
million | | Next $1.5
billion | | Over $2.5
billion | |
| | 0.85 | % | | | 0.75 | % | | | 0.70 | % | | | 0.65 | % | |
For the year ended December 31, 2018, the advisory fee rate (net of rebate) was equivalent to an annual effective rate of 0.77% of the Fund's average daily net assets.
The Adviser has agreed to reduce its advisory fee and/or reimburse the Fund so that total annual portfolio operating expenses, excluding certain investment related expenses, taxes, interest and other extraordinary expenses (including litigation), will not exceed 1.05% for Class I shares, 1.40% for Class A shares, 1.90% for Class L shares, 2.15% for Class C shares, 0.95% for Class IS shares and 0.95% for Class IR shares. The fee waivers and/or expense reimbursements will continue for at least one year from the date of the Fund's prospectus or until such time as the Directors act to discontinue all or a portion of such waivers and/or reimbursements when they deem such action is appropriate. For the year ended December 31, 2018, approximately $4,000 of other expenses were reimbursed by the Adviser pursuant to this arrangement.
The Adviser has entered into a Sub-Advisory Agreement with the Sub-Adviser, a wholly-owned subsidiary of Morgan Stanley. The Sub-Adviser provides the Fund with advisory services subject to the overall supervision of the Adviser and the Fund's Officers and Directors. The Adviser pays the Sub-Adviser on a monthly basis a portion of the net advisory fees the Adviser receives from the Fund.
C. Administration Fees: The Adviser also serves as Administrator to the Company and provides administrative services pursuant to an Administration Agreement for an annual fee, accrued daily and paid monthly, of 0.08% of the Fund's average daily net assets.
Under a Sub-Administration Agreement between the Administrator and State Street, State Street provides certain administrative services to the Company. For such services, the Administrator pays State Street a portion of the fee the Administrator receives from the Fund.
D. Distribution and Shareholder Services Fees: Morgan Stanley Distribution, Inc. ("MSDI" or the "Distributor"), a wholly-owned subsidiary of the Adviser and an indirect subsidiary of Morgan Stanley, serves as the Company's Distributor of Fund shares pursuant to a Distribution Agreement. The Company has adopted a Shareholder Services Plan with respect to Class A shares pursuant to Rule 12b-1 under the Act. Under the Shareholder Services Plan, the Fund pays the Distributor a shareholder services fee, accrued daily and paid monthly, at an annual rate of 0.25% of the Fund's average daily net assets attributable to Class A shares.
The Company has adopted a Distribution and Shareholder Services Plan with respect to Class L shares pursuant to Rule 12b-1 under the Act. Under the Distribution and Shareholder Services Plan, the Fund pays the Distributor a distribution fee, accrued daily and paid monthly, at an annual rate of 0.50% and a shareholder services fee, accrued daily and paid monthly, at an annual rate of 0.25% of the Fund's average daily net assets attributable to Class L shares.
The Company has adopted a Distribution and Shareholder Services Plan with respect to Class C shares pursuant to Rule 12b-1 under the Act. Under the Distribution and Shareholder Services Plan, the Fund pays the Distributor a distribution fee, accrued daily and paid monthly, at an annual rate of 0.75% and a shareholder services fee, accrued daily and paid monthly, at an annual rate of 0.25% of the Fund's average daily net assets attributable to Class C shares.
The distribution and shareholder services fees are used to support the expenses associated with servicing and maintaining accounts. The Distributor may compensate other parties for providing shareholder support services to investors who purchase Class A, Class L and Class C shares.
E. Dividend Disbursing and Transfer Agent: The Company's dividend disbursing and transfer agent is DST Asset Manager Solutions, Inc. ("DST"). Pursuant to a Transfer Agency Agreement, the Company pays DST a fee based on the number of classes, accounts and transactions relating to the Funds of the Company.
29
Morgan Stanley Institutional Fund, Inc.
Annual Report — December 31, 2018
Notes to Financial Statements
F. Custodian Fees: State Street (the "Custodian") also serves as Custodian for the Company in accordance with a Custodian Agreement. The Custodian holds cash, securities and other assets of the Company as required by the Act. Custody fees are payable monthly based on assets held in custody, investment purchases and sales activity and account maintenance fees, plus reimbursement for certain out-of-pocket expenses.
G. Security Transactions and Transactions with Affiliates: For the year ended December 31, 2018, purchases and sales of investment securities for the Fund, other than long-term U.S. Government securities and short-term investments were approximately $694,332,000 and $825,090,000, respectively. There were no purchases and sales of long-term U.S. Government securities for the year ended December 31, 2018.
The Fund invests in the Institutional Class of the Morgan Stanley Institutional Liquidity Funds — Government Portfolio (the "Liquidity Funds"), an open-end management investment company managed by the Adviser, both directly and as a portion of the securities held as collateral on loaned securities. Advisory fees paid by the Fund are reduced by an amount equal to its pro-rata share of the advisory and administration fees paid by the Fund due to its investment in the Liquidity Funds. For the year ended December 31, 2018, advisory fees paid were reduced by approximately $88,000 relating to the Fund's investment in the Liquidity Funds.
A summary of the Fund's transactions in shares of affiliated investments during the year ended December 31, 2018 is as follows:
Affiliated
Investment
Company | | Value
December 31,
2017
(000) | | Purchases
at Cost
(000) | | Proceeds
from Sales
(000) | | Dividend
Income
(000) | |
Liquidity Funds | | $ | 46,342 | | | $ | 415,197 | | | $ | 383,342 | | | $ | 950 | | |
Affiliated
Investment
Company (cont'd) | | Realized
Gain
(Loss)
(000) | | Change in
Unrealized
Appreciation
(Depreciation)
(000) | | Value
December 31,
2018
(000) | |
Liquidity Funds | | $ | — | | | $ | — | | | $ | 78,197 | | |
During the year ended December 31, 2018, the Fund incurred approximately $1,000 in brokerage commissions with Morgan Stanley & Co. LLC, an affiliate of the Adviser/Administrator, Sub-Adviser and Distributor, for portfolio transactions executed on behalf of the Fund.
The Fund is permitted to purchase and sell securities ("cross-trade") from and to other Morgan Stanley funds as well as
other funds and client accounts for which the Adviser or an affiliate of the Adviser serves as investment adviser, pursuant to procedures approved by the Directors in compliance with Rule 17a-7 under the Act (the "Rule"). Each cross-trade is executed at the current market price in compliance with provisions of the Rule. For the year ended December 31, 2018, the Fund did not engage in any cross-trade transactions.
The Fund has an unfunded Deferred Compensation Plan (the "Compensation Plan"), which allows each independent Director to defer payment of all, or a portion, of the fees he or she receives for serving on the Board of Directors. Each eligible Director generally may elect to have the deferred amounts credited with a return equal to the total return on one or more of the Morgan Stanley funds that are offered as investment options under the Compensation Plan. Appreciation/depreciation and distributions received from these investments are recorded with an offsetting increase/decrease in the deferred compensation obligation and do not affect the NAV of the Fund.
H. Federal Income Taxes: It is the Fund's intention to continue to qualify as a regulated investment company and distribute all of its taxable and tax-exempt income. Accordingly, no provision for Federal income taxes is required in the financial statements.
The Fund may be subject to taxes imposed by countries in which it invests. Such taxes are generally based on income and/or capital gains earned or repatriated. Taxes are accrued based on net investment income, net realized gains and net unrealized appreciation as such income and/or gains are earned. Taxes may also be based on transactions in foreign currency and are accrued based on the value of investments denominated in such currency.
FASB ASC 740-10, "Income Taxes — Overall", sets forth a minimum threshold for financial statement recognition of the benefit of a tax position taken or expected to be taken in a tax return. Management has concluded there are no significant uncertain tax positions that would require recognition in the financial statements. If applicable, the Fund recognizes interest accrued related to unrecognized tax benefits in "Interest Expense" and penalties in "Other Expenses" in the Statement of Operations. The Fund files tax returns with the U.S. Internal Revenue Service, New York and various states. Generally, each of the tax years in the four-year period ended December 31, 2018 remains subject to examination by taxing authorities.
30
Morgan Stanley Institutional Fund, Inc.
Annual Report — December 31, 2018
Notes to Financial Statements
The tax character of distributions paid may differ from the character of distributions for GAAP purposes due to short-term capital gains being treated as ordinary income for tax purposes. The tax character of distributions paid during fiscal years 2018 and 2017 was as follows:
2018
Distributions
Paid From: | | 2017
Distributions
Paid From: | |
Ordinary
Income
(000) | | Long-Term
Capital Gain
(000) | | Ordinary
Income
(000) | | Long-Term
Capital Gain
(000) | |
| $ | 17,069 | | | $ | 9,096 | | | $ | 9,134 | | | $ | — | | |
The amount and character of income and gains to be distributed are determined in accordance with income tax regulations which may differ from GAAP. These book/tax differences are either considered temporary or permanent in nature.
Temporary differences are primarily due to differing book and tax treatments in the timing of the recognition of gains (losses) on certain investment transactions and the timing of the deductibility of certain expenses.
Permanent differences, primarily due to equalization debits, resulted in the following reclassifications among the components of net assets at December 31, 2018:
Total
Distributable
Earnings
(000) | | Paid-in-
Capital
(000) | |
| $ | (3,586 | ) | | $ | 3,586 | | |
At December 31, 2018, the components of distributable earnings for the Fund on a tax basis were as follows:
Undistributed
Ordinary
Income
(000) | | Undistributed
Long-Term
Capital Gain
(000) | |
| $ | — | | | $ | 926 | | |
During the year ended December 31, 2018, the Fund utilized capital loss carryforwards for U. S. federal income tax purposes of approximately $33,443,000.
Qualified late year losses are capital losses and specified ordinary losses, including currency losses, incurred after October 31 but within the taxable year that, if elected, are deemed to arise on the first day of the Fund's next taxable year. For the year ended
December 31, 2018, the Fund intends to defer to January 1, 2019 for U.S. federal income tax purposes the following losses:
Qualified
Late Year
Ordinary
Losses
(000) | | Post-October
Capital Losses
(000) | |
| $ | 2,835 | | | $ | — | | |
I. Credit Facility: The Company and other Morgan Stanley funds participated in a $150,000,000 committed, unsecured revolving line of credit facility (the "Facility") with State Street. This Facility is to be used for temporary emergency purposes or funding of shareholder redemption requests. The interest rate on borrowings is based on the federal funds rate or 1 month LIBOR rate plus a spread. The Facility also has a commitment fee of 0.25% per annum based on the unused portion of the Facility. During the year ended December 31, 2018, the Fund did not have any borrowings under the Facility.
J. Other: At December 31, 2018, the Fund had record owners of 10% or greater. Investment activities of these shareholders could have a material impact on the Fund. The aggregate percentage of such owners was 66.9%.
31
Morgan Stanley Institutional Fund, Inc.
Annual Report — December 31, 2018
Report of Independent Registered Public Accounting Firm
To the Shareholders and Board of Directors of
Morgan Stanley Institutional Fund, Inc. —
Emerging Markets Portfolio
Opinion on the Financial Statements
We have audited the accompanying statement of assets and liabilities of Emerging Markets Portfolio (the "Fund") (one of the funds constituting the Morgan Stanley Institutional Fund, Inc. (the "Company")), including the portfolio of investments, as of December 31, 2018, and the related statement of operations for the year then ended, the statements of changes in net assets for each of the two years in the period then ended, the financial highlights for each of the five years in the period then ended and the related notes (collectively referred to as the "financial statements"). In our opinion, the financial statements present fairly, in all material respects, the financial position of Emerging Markets Portfolio (one of the funds constituting Morgan Stanley Institutional Fund, Inc.) at December 31, 2018, the results of its operations for the year then ended, the changes in its net assets for each of the two years in the period then ended and its financial highlights for each of the five years in the period then ended, in conformity with U.S. generally accepted accounting principles.
Basis for Opinion
These financial statements are the responsibility of the Company's management. Our responsibility is to express an opinion on the Fund's financial statements based on our audits. We are a public accounting firm registered with the Public Company Accounting Oversight Board (United States) ("PCAOB") and are required to be independent with respect to the Company in accordance with the U.S. federal securities law and the applicable rules and regulations of the Securities and Exchange Commission and the PCAOB.
We conducted our audits in accordance with the standards of the PCAOB. Those standards require that we plan and perform the audit to obtain reasonable assurance about whether the financial statements are free of material misstatement, whether due to error or fraud. The Company is not required to have, nor were we engaged to perform, an audit of the Company's internal control over financial reporting. As part of our audits, we are required to obtain an understanding of internal control over financial reporting, but not for the purpose of expressing an opinion on the effectiveness of the Company's internal control over financial reporting. Accordingly, we express no such opinion.
Our audits included performing procedures to assess the risks of material misstatement of the financial statements, whether due to error or fraud, and performing procedures that respond to those risks. Such procedures included examining, on a test basis, evidence regarding the amounts and disclosures in the financial statements. Our procedures included confirmation of securities owned as of December 31, 2018 by correspondence with the custodian and others or by other appropriate auditing procedures where replies from others were not received. Our audits also included evaluating the accounting principles used and significant estimates made by management, as well as evaluating the overall presentation of the financial statements. We believe that our audits provide a reasonable basis for our opinion.

We have served as the auditor of one or more Morgan Stanley investment companies since 2000.
Boston, Massachusetts
February 26, 2019
32
Morgan Stanley Institutional Fund, Inc.
Annual Report — December 31, 2018
Federal Tax Notice (unaudited)
For federal income tax purposes, the following information is furnished with respect to the distributions paid by the Fund during its taxable year ended December 31, 2018.
The Fund designated and paid approximately $9,096,000 as a long-term capital gain distribution.
For federal income tax purposes, the following information is furnished with respect to the Fund's earnings for its taxable year ended December 31, 2018. When distributed, certain earnings may be subject to a maximum tax rate of 15% as provided for the Jobs and Growth Tax Relief Reconciliation Act of 2003. The Fund designated up to a maximum of approximately $16,632,000 as taxable at this lower rate.
The Fund intends to pass through foreign tax credits of approximately $3,105,000 and has derived net income from sources within foreign countries amounting to approximately $29,708,000.
In January, the Fund provides tax information to shareholders for the preceding calendar year.
33
Morgan Stanley Institutional Fund, Inc.
Annual Report — December 31, 2018
Privacy Notice (unaudited)
MORGAN STANLEY INVESTMENT MANAGEMENT INC.
AN IMPORTANT NOTICE CONCERNING OUR U.S. PRIVACY POLICY
We are required by federal law to provide you with a copy of our privacy policy annually. This policy applies to current and former individual investors in funds managed or sponsored by Morgan Stanley Investment Management Inc. ("MSIM") as well as current and former individual clients of MSIM. This policy is not applicable to partnerships, corporations, trusts or other non-individual clients or investors. Please note that we may amend this policy at any time, and will inform you of any changes as required by law.
WE RESPECT YOUR PRIVACY
We appreciate that you have provided us with your personal financial information. We strive to maintain the privacy of such information while we help you achieve your financial objectives. This Notice describes what non-public personal information we collect about you, why we collect it, when we may share it with others and how certain others may use it. It discusses the steps you may take to limit our sharing of certain information about you to affiliated companies in the Morgan Stanley family of companies ("other Morgan Stanley companies"). It also discloses how you may limit use of certain shared information for marketing purposes by other Morgan Stanley branded companies. Throughout this policy, we refer to the non-public information that personally identifies you or your accounts as "personal information."
1. WHAT PERSONAL INFORMATION DO WE COLLECT ABOUT YOU?
We obtain personal information from applications and other forms you submit to us, from your dealings with us, from consumer reporting agencies, from our Web sites and from third parties and other sources.
For example:
• We may collect information such as your name, address, e-mail address, telephone/fax numbers, assets, income and investment objectives through subscription documents, applications and other forms you submit to us.
• We may obtain information about account balances, your use of account(s) and the types of products and services you prefer to receive from us through your dealings and transactions with us and other sources.
• We may obtain information about your creditworthiness and credit history from consumer reporting agencies.
• We may collect background information from and through third-party vendors to verify representations you have made and to comply with various regulatory requirements.
• If you interact with us through our public and private Web sites, we may collect information that you provide directly through online communications (such as an e-mail address). We may also collect information about your Internet service provider, your domain name, your computer's operating system and Web browser, your use of our Web sites and your product and service preferences, through the use of "cookies." Please consult the Terms of Use of these sites for more details.
2. WHEN DO WE DISCLOSE PERSONAL INFORMATION WE COLLECT ABOUT YOU?
We may disclose personal information we collect about you to other Morgan Stanley companies and to non-affiliated third parties.
a. Information We Disclose to Other Morgan Stanley Companies.
We may disclose personal information to other Morgan Stanley companies for a variety of reasons, including to manage your account(s) effectively, to service and process your transactions, to let you know about products and services offered by us and other Morgan Stanley companies, to manage our business, and as otherwise required or permitted by law. Offers for products and services from other Morgan Stanley companies are developed under conditions designed to safeguard your personal information.
34
Morgan Stanley Institutional Fund, Inc.
Annual Report — December 31, 2018
Privacy Notice (unaudited) (cont'd)
b. Information We Disclose to Non-affiliated Third Parties.
We do not disclose personal information that we collect about you to non-affiliated third parties except to those who provide marketing services on our behalf, to financial institutions with whom we have joint marketing agreements, and as otherwise required or permitted by law. For example, we may disclose personal information to non-affiliated third parties for servicing and processing transactions, to offer our own products and services, to protect against fraud, for institutional risk control, to respond to judicial process or to perform services on our behalf. When we share personal information with a non-affiliated third party, they are required to limit their use of personal information to the particular purpose for which it was shared and they are not allowed to share personal information with others except to fulfill that limited purpose or as may be permitted or required by law.
3. HOW DO WE PROTECT THE SECURITY AND CONFIDENTIALITY OF PERSONAL INFORMATION WE COLLECT ABOUT YOU?
We maintain physical, electronic and procedural security measures to help safeguard the personal information we collect about you. We have internal policies governing the proper handling of client information. Third parties that provide support or marketing services on our behalf may also receive personal information, and we require them to adhere to confidentiality standards with respect to such information.
4. HOW CAN YOU LIMIT THE SHARING OF CERTAIN TYPES OF PERSONAL INFORMATION WITH OTHER MORGAN STANLEY COMPANIES?
We offer you choices as to whether we share with other Morgan Stanley companies the personal information that was collected to determine your eligibility for products and services you request ("eligibility information"). Eligibility information does not include your identification information or personal information pertaining to our transactions or experiences with you. Please note that, even if you direct us not to share eligibility information with other Morgan Stanley companies ("opt-out"), we may still share personal information, including eligibility information, with those companies in circumstances excluded from the opt-out under applicable law, such as to process transactions or to service your account.
5. HOW CAN YOU LIMIT THE USE OF CERTAIN TYPES OF PERSONAL INFORMATION BY OTHER MORGAN STANLEY COMPANIES FOR MARKETING?
By following the opt-out instructions in Section 6 below, you may limit other Morgan Stanley branded companies from marketing their products or services to you based on personal information we disclose to them. This information may include, for example, your income and account history with us. Please note that, even if you choose to limit Other Morgan Stanley Companies from using personal information about you that we may share with them for marketing their products and services to you, Other Morgan Stanley Companies may use your personal information that they obtain from us to market to you in circumstances permitted by law, such as if the Other Morgan Stanley Company has its own relationship with you.
6. HOW CAN YOU SEND US AN OPT-OUT INSTRUCTION?
If you wish to limit our sharing of eligibility information about you with other Morgan Stanley companies or other Morgan Stanley companies' use of personal information for marketing purposes, as described in this notice, you may do so by:
• Calling us at (800) 548-7786
Monday–Friday between 8a.m. and 6p.m. (EST)
• Writing to us at the following address:
DST Asset Manager Solutions, Inc.
c/o Privacy Coordinator
P.O. Box 219804
Kansas City, Missouri 64121
35
Morgan Stanley Institutional Fund, Inc.
Annual Report — December 31, 2018
Privacy Notice (unaudited) (cont'd)
Your written request should include your name, address, telephone number and account number(s) to which the opt-out applies and whether you are opting out with respect to sharing of eligibility information (Section 4 above), or if information used for Marketing (Section 5 above) or both. Written opt-out requests should not be sent with any other correspondence. In order to process your request, we require that the request be provided by you directly and not through a third party.
Your opt-out preference will remain in effect with respect to this policy (as it may be amended) until you notify us otherwise. If you have a joint account, your direction for us not to share this information with other Morgan Stanley companies and for those other Morgan Stanley companies not to use your personal information for marketing will be applied to all account holders on that account. Please understand that if you limit our sharing or our affiliated companies' use of personal information, you and any joint account holder(s) may not receive information about Morgan Stanley products and services, including products or services that could help you manage your financial resources and achieve your investment objectives.
7. WHAT IF AN AFFILIATED COMPANY BECOMES A NON-AFFILIATED THIRD PARTY?
If, at any time in the future, an affiliated company becomes a non-affiliated third party, further disclosures of personal information made to the former affiliated company will be limited to those described in Section 2(b) above relating to non-affiliated third parties. If you elected under Section 6 to limit disclosures we make to affiliated companies, or use of personal information by affiliated companies, your election will not apply to use by any former affiliated company of your personal information in their possession once it becomes a non-affiliated third party.
SPECIAL NOTICE TO RESIDENTS OF VERMONT
The following section supplements our Policy with respect to our individual clients who have a Vermont address and supersedes anything to the contrary in the above Policy with respect to those clients only.
The state of Vermont requires financial institutions to obtain your consent prior to sharing personal information that they collect about you with affiliated companies and non-affiliated third parties other than in certain limited circumstances. Except as permitted by law, we will not share personal information we collect about you with non-affiliated third parties or other Morgan Stanley companies unless you provide us with your written consent to share such information ("opt-in").
If you wish to receive offers for investment products and services offered by or through other Morgan Stanley companies, please notify us in writing at the following address:
DST Asset Manager Solutions, Inc.
c/o Privacy Coordinator
P.O. Box 219804
Kansas City, Missouri 64121
Your authorization should include your name, address, telephone number and account number(s) to which the opt-in applies and should not be sent with any other correspondence. In order to process your authorization, we require that the authorization be provided by you directly and not through a third party.
SPECIAL NOTICE TO RESIDENTS OF CALIFORNIA
The following section supplements our Policy with respect to our individual clients who have a California address and supersedes anything to the contrary in the above Policy with respect to those clients only.
In response to a California law, if your account has a California home address, your personal information will not be disclosed to non-affiliated third parties except as permitted by applicable California law, and we will limit sharing such information with our affiliates to comply with California privacy laws that apply to us.
36
Morgan Stanley Institutional Fund, Inc.
Annual Report — December 31, 2018
Director and Officer Information (unaudited)
Independent Directors:
Name, Age and Address of
Independent Director | | Position(s)
Held with
Registrant | | Length of Time
Served* | | Principal Occupation(s) During Past 5 Years
and Other Relevant Professional Experience | | Number of
Portfolios in
Fund Complex
Overseen by
Independent
Director** | | Other Directorships
Held by Independent
Director*** | |
Frank L. Bowman (74)
c/o Perkins Coie LLP
Counsel to the Independent
Directors
30 Rockefeller Plaza
New York, NY 10112 | | Director | | Since
August
2006 | | President, Strategic Decisions, LLC (consulting) (since February 2009); Director or Trustee of various Morgan Stanley Funds (since August 2006); Chairperson of the Compliance and Insurance Committee (since October 2015); formerly, Chairperson of the Insurance Sub-Committee of the Compliance and Insurance Committee (2007-2015); served as President and Chief Executive Officer of the Nuclear Energy Institute (policy organization) (February 2005-November 2008); retired as Admiral, U.S. Navy after serving over 38 years on active duty including 8 years as Director of the Naval Nuclear Propulsion Program in the Department of the Navy and the U.S. Department of Energy (1996-2004); served as Chief of Naval Personnel (July 1994-September 1996) and on the Joint Staff as Director of Political Military Affairs (June 1992-July 1994); knighted as Honorary Knight Commander of the Most Excellent Order of the British Empire; awarded the Officier de l'Orde National du Mérite by the French Government; elected to the National Academy of Engineering (2009). | | | 82 | | | Director of BP p.l.c.; Director of Naval and Nuclear Technologies LLP; Director Emeritus of the Armed Services YMCA; Member of the National Security Advisory Council of the Center for U.S. Global Engagement and a member of the CNA Military Advisory Board; Trustee of Fairhaven United Methodist Church; Member of the Board of Advisors of the Dolphin Scholarship Foundation; and Director of other various non-profit organizations. | |
Kathleen A. Dennis (65)
c/o Perkins Coie LLP
Counsel to the Independent Directors
30 Rockefeller Plaza
New York, NY 10112 | | Director | | Since
August
2006 | | President, Cedarwood Associates (mutual fund and investment management consulting) (since July 2006); Chairperson of the Liquidity and Alternatives Sub-Committee of the Investment Committee (since October 2006) and Director or Trustee of various Morgan Stanley Funds (since August 2006); formerly, Senior Managing Director of Victory Capital Management (1993-2006). | | | 82 | | | Director of various non-profit organizations. | |
Nancy C. Everett (63)
c/o Perkins Coie LLP
Counsel to the Independent Directors
30 Rockefeller Plaza
New York, NY 10112 | | Director | | Since
January
2015 | | Chief Executive Officer, Virginia Commonwealth University Investment Company (since November 2015); Owner, OBIR, LLC (institutional investment management consulting) (since June 2014); formerly, Managing Director, BlackRock Inc. (February 2011-December 2013); and Chief Executive Officer, General Motors Asset Management (a/k/a Promark Global Advisors, Inc.) (June 2005-May 2010). | | | 83 | | | Formerly, Member of Virginia Commonwealth University School of Business Foundation (2005-2016); Member of Virginia Commonwealth University Board of Visitors (2013-2015); Member of Committee on Directors for Emerging Markets Growth Fund, Inc. (2007-2010); Chairperson of Performance Equity Management, LLC (2006-2010); and Chairperson, GMAM Absolute Return Strategies Fund, LLC (2006-2010). | |
37
Morgan Stanley Institutional Fund, Inc.
Annual Report — December 31, 2018
Director and Officer Information (unaudited) (cont'd)
Independent Directors: (cont'd)
Name, Age and Address of
Independent Director | | Position(s)
Held with
Registrant | | Length of Time
Served* | | Principal Occupation(s) During Past 5 Years
and Other Relevant Professional Experience | | Number of
Portfolios in
Fund Complex
Overseen by
Independent
Director** | | Other Directorships
Held by Independent
Director*** | |
Jakki L. Haussler (61)
c/o Perkins Coie LLP
Counsel to the Independent Directors
30 Rockefeller Plaza
New York, NY 10112 | | Director | | Since
January
2015 | | Chairman and Chief Executive Officer, Opus Capital Group (since January 1996); formerly, Director, Capvest Venture Fund, LP (May 2000-December 2011); Partner, Adena Ventures, LP (July 1999-December 2010); Director, The Victory Funds (February 2005-July 2008). | | | 83 | | | Director of Service Corporation International and Member, Audit Committee and Investment Committee; Director of Cincinnati Bell Inc. and Member, Audit Committee and Governance and Nominating Committee; Chairman of Northern Kentucky University Member Investment Committee; Member of Chase College of Law Transactional Law Practice Center Board of Advisors; Director of Best Transport; Director of Chase College of Law Board of Visitors; formerly, Member, University of Cincinnati Foundation Investment Committee; Member, Miami University Board of Visitors (2008-2011); Trustee of Victory Funds (2005-2008) and Chairman, Investment Committee (2007-2008) and Member, Service Provider Committee (2005-2008). | |
Dr. Manuel H. Johnson (69)
c/o Johnson Smick
International, Inc.
220 I Street, NE — Suite 200
Washington, D.C. 20002 | | Director | | Since
July
1991 | | Senior Partner, Johnson Smick International, Inc. (consulting firm); Chairperson of the Investment Committee (since October 2006) and Director or Trustee of various Morgan Stanley Funds (since July 1991); Co-Chairman and a founder of the Group of Seven Council (G7C) (international economic commission); formerly, Chairperson of the Audit Committee (July 1991-September 2006), Vice Chairman of the Board of Governors of the Federal Reserve System and Assistant Secretary of the U.S. Treasury. | | | 82 | | | Director of NVR, Inc. (home construction). | |
Joseph J. Kearns (76)
c/o Perkins Coie LLP
Counsel to the Independent Directors
30 Rockefeller Plaza
New York, NY 10112 | | Director | | Since
August
1994 | | Senior Adviser, Kearns & Associates LLC (investment consulting); Chairperson of the Audit Committee (since October 2006) and Director or Trustee of various Morgan Stanley Funds (since August 1994); formerly, Deputy Chairperson of the Audit Committee (July 2003-September 2006) and Chairperson of the Audit Committee of various Morgan Stanley Funds (since August 1994); CFO of the J. Paul Getty Trust. | | | 83 | | | Prior to August 10, 2016, Director of Electro Rent Corporation (equipment leasing); Prior to December 31, 2013, Director of The Ford Family Foundation. | |
38
Morgan Stanley Institutional Fund, Inc.
Annual Report — December 31, 2018
Director and Officer Information (unaudited) (cont'd)
Independent Directors: (cont'd)
Name, Age and Address of
Independent Director | | Position(s)
Held with
Registrant | | Length of Time
Served* | | Principal Occupation(s) During Past 5 Years
and Other Relevant Professional Experience | | Number of
Portfolios in
Fund Complex
Overseen by
Independent
Director** | | Other Directorships
Held by Independent
Director*** | |
Michael F. Klein (60)
c/o Perkins Coie LLP
Counsel to the Independent Directors
30 Rockefeller Plaza
New York, NY 10112 | | Director | | Since
August
2006 | | Managing Director, Aetos Alternatives Management, LP (since March 2000); Co-President, Aetos Alternatives Management, LP (since January 2004) and Co-Chief Executive Officer of Aetos Alternatives Management, LP (since August 2013); Chairperson of the Fixed Income Sub-Committee of the Investment Committee (since October 2006) and Director or Trustee of various Morgan Stanley Funds (since August 2006); formerly, Managing Director, Morgan Stanley & Co. Inc. and Morgan Stanley Dean Witter Investment Management and President, various Morgan Stanley Funds (June 1998-March 2000); Principal, Morgan Stanley & Co. Inc. and Morgan Stanley Dean Witter Investment Management (August 1997-December 1999). | | | 82 | | | Director of certain investment funds managed or sponsored by Aetos Alternatives Management, LP; Director of Sanitized AG and Sanitized Marketing AG (specialty chemicals). | |
Patricia Maleski (58)
c/o Perkins Coie LLP
Counsel to the Independent Directors
30 Rockefeller Plaza
New York, NY 10112 | | Director | | Since
January
2017 | | Managing Director, JPMorgan Asset Management (2004-2016); Oversight and Control Head of Fiduciary and Conflicts of Interest Program (2015-2016); Chief Control Officer-Global Asset Management (2013-2015); President, JPMorgan Funds (2010-2013); Chief Administrative Officer (2004-2013); various other positions including Treasurer and Board Liaison (since 2001). | | | 83 | | | None. | |
Michael E. Nugent (82)
522 Fifth Avenue
New York, NY 10036 | | Chair of the Board and Director | | Chair of the Boards since July 2006 and Director since July 1991 | | Chair of the Boards of various Morgan Stanley Funds (since July 2006); Chairperson of the Closed-End Fund Committee (since June 2012) Governance Committee (since January 2019) and Director or Trustee of various Morgan Stanley Funds (since July 1991); formerly, Chairperson of the Insurance Committee (until July 2006); General Partner, Triumph Capital, L.P. (private investment partnership) (1988-2013). | | | 82 | | | None. | |
W. Allen Reed (71)
c/o Perkins Coie LLP
Counsel to the Independent Directors
30 Rockefeller Plaza
New York, NY 10112 | | Director | | Since
August
2006 | | Chairperson of the Equity Sub-Committee of the Investment Committee (since October 2006) and Director or Trustee of various Morgan Stanley Funds (since August 2006); formerly, President and CEO of General Motors Asset Management; Chairman and Chief Executive Officer of the GM Trust Bank and Corporate Vice President of General Motors Corporation (August 1994-December 2005). | | | 82 | | | Director of Legg Mason, Inc.; formerly, Director of the Auburn University Foundation (2010-2015). | |
Fergus Reid (86)****
c/o Joe Pietryka, Inc.
85 Charles Colman Blvd.
Pawling, NY 12564 | | Director | | Since
June
1992 | | Chairman, Joe Pietryka, Inc.; Chairperson of the Governance Committee and Director or Trustee of various Morgan Stanley Funds (since June 1992). | | | 83 | | | Formerly, Trustee and Director of certain investment companies in the JP Morgan Fund Complex managed by JP Morgan Investment Management Inc. (1987-2012). | |
* This is the earliest date the Director began serving the Morgan Stanley Funds. Each Director serves an indefinite term, until his or her successor is elected.
** The Fund Complex includes (as of December 31, 2018) all open-end and closed-end funds (including all of their portfolios) advised by Morgan Stanley Investment Management Inc. (the "Adviser") and any funds that have an adviser that is an affiliated person of the Adviser (including, but not limited to, Morgan Stanley AIP GP LP).
*** This includes any directorships at public companies and registered investment companies held by the Director at any time during the past five years.
**** Effective date of retirement is December 31, 2018.
39
Morgan Stanley Institutional Fund, Inc.
Annual Report — December 31, 2018
Director and Officer Information (unaudited) (cont'd)
Executive Officers:
Name, Age and Address of Executive Officer | | Position(s) Held
with
Registrant | | Length of Time
Served* | | Principal Occupation(s) During Past 5 Years | |
John H. Gernon (55)
522 Fifth Avenue
New York, NY 10036 | | President and Principal Executive Officer | | Since
September
2013 | | President and Principal Executive Officer of the Equity and Fixed Income Funds and the Morgan Stanley AIP Funds (since September 2013) and the Liquidity Funds and various money market funds (since May 2014) in the Fund Complex; Managing Director of the Adviser; Head of Product (since 2006). | |
Timothy J. Knierim (59)
522 Fifth Avenue
New York, NY 10036 | | Chief Compliance Officer | | Since
December
2016 | | Managing Director of the Adviser and various entities affiliated with the Adviser; Chief Compliance Officer of various Morgan Stanley Funds and the Adviser (since December 2016) and Chief Compliance Officer of Morgan Stanley AIP GP LP (since 2014). Formerly, Managing Director and Deputy Chief Compliance Officer of the Adviser (2014-2016); and formerly, Chief Compliance Officer of Prudential Investment Management, Inc. (2007-2014). | |
Francis J. Smith (53)
522 Fifth Avenue
New York, NY 10036 | | Treasurer and Principal Financial Officer | | Treasurer since July 2003 and Principal Financial Officer since September 2002 | | Managing Director of the Adviser and various entities affiliated with the Adviser; Treasurer (since July 2003) and Principal Financial Officer of various Morgan Stanley Funds (since September 2002). | |
Mary E. Mullin (51)
522 Fifth Avenue
New York, NY 10036 | | Secretary | | Since
June
1999 | | Managing Director of the Adviser; Secretary of various Morgan Stanley Funds (since June 1999). | |
Michael J. Key (39)
522 Fifth Avenue
New York, NY 10036 | | Vice President | | Since
June
2017 | | Vice President of the Equity and Fixed Income Funds, Liquidity Funds, various money market funds and the Morgan Stanley AIP Funds in the Fund Complex (since June 2017); Executive Director of the Adviser; Head of Product Development for Equity and Fixed Income Funds (since August 2013). | |
* This is the earliest date the officer began serving the Morgan Stanley Funds. Each officer serves a one-year term, until his or her successor is elected and qualifies.
40
Morgan Stanley Institutional Fund, Inc.
Annual Report — December 31, 2018
Adviser and Administrator
Morgan Stanley Investment Management Inc.
522 Fifth Avenue
New York, New York 10036
Sub-Adviser
Morgan Stanley Investment Management Company
23 Church Street
16-01 Capital Square, Singapore 049481
Distributor
Morgan Stanley Distribution, Inc.
522 Fifth Avenue
New York, New York 10036
Dividend Disbursing and Transfer Agent
DST Asset Manager Solutions, Inc.
2000 Crown Colony Drive
Quincy, Massachusetts 02169
Custodian
State Street Bank and Trust Company
One Lincoln Street
Boston, Massachusetts 02111
Legal Counsel
Dechert LLP
1095 Avenue of the Americas
New York, New York 10036
Counsel to the Independent Directors
Perkins Coie LLP
30 Rockefeller Plaza
New York, New York 10112
Independent Registered Public Accounting Firm
Ernst & Young LLP
200 Clarendon Street
Boston, Massachusetts 02116
Reporting to Shareholders
Each Morgan Stanley fund provides a complete schedule of portfolio holdings in its semi-annual and the annual reports within 60 days of the end of the fund's second and fourth fiscal quarters. The semi-annual and annual reports are filed electronically with the Securities and Exchange Commission (SEC) on Form N-CSRS and Form N-CSR, respectively. Morgan Stanley also delivers the semi-annual and annual reports to fund shareholders and makes these reports available on its public website, www.morganstanley.com/im/shareholderreports. Each Morgan Stanley fund also files a complete schedule of portfolio holdings with the SEC for the fund's first and third fiscal quarters on Form N-Q. Morgan Stanley does not deliver the reports for the first and third fiscal quarters to shareholders, nor are the reports posted to the Morgan Stanley public website. You may, however, obtain the Form N-Q filings (as well as the Form N-CSR and N-CSRS filings) by accessing the SEC's website, www.sec.gov. You can also request copies of these materials, upon payment of a duplicating fee, by electronic request at the SEC's email address (publicinfo@sec.gov).
Proxy Voting Policies and Procedures and Proxy Voting Record
You may obtain a copy of the Company's Proxy Voting Policy and Procedures and information regarding how the Company voted proxies relating to portfolio securities during the most recent twelve-month period ended June 30, without charge, upon request, by calling toll free 1 (800) 548-7786 or by visiting our website at www.morganstanley.com/im/shareholderreports. This information is also available on the SEC's website at www.sec.gov.
This report is authorized for distribution only when preceded or accompanied by a prospectus or summary prospectus of the applicable Fund of Morgan Stanley Institutional Fund, Inc., which describes in detail the Fund's investment policies, risks, fees and expenses. Please read the prospectus carefully before you invest or send money. For additional information, including information regarding the investments comprising the Fund, please visit our website at www.morganstanley.com/im/shareholderreports or call toll free 1 (800) 548-7786.
41
Printed in U.S.A.
This Report has been prepared for shareholders and may be distributed to others only if preceded or accompanied by a current prospectus.
Morgan Stanley Investment Management Inc.
522 Fifth Avenue
New York, New York 10036
© 2019 Morgan Stanley. Morgan Stanley Distribution, Inc.

IFIEMANN
2400856 EXP. 02.29.20

Morgan Stanley Institutional Fund, Inc.
Emerging Markets Small Cap Portfolio
Annual Report
December 31, 2018
Beginning on January 1, 2021, as permitted by regulations adopted by the Securities and Exchange Commission ("SEC"), paper copies of the Fund's Annual and Semi-Annual Reports to Shareholders ("Shareholder Reports") will no longer be sent by mail, unless you specifically request paper copies of the Shareholder Reports from the Fund or from your financial intermediary, such as a broker-dealer or a bank. Instead, the Shareholder Reports will be made available on the Fund's website, https://www.morganstanley.com/im/shareholderreports and you will be notified by mail each time a Shareholder Report is posted and provided with a website link to access the Shareholder Report. If you already elected to receive Shareholder Reports electronically, you will not be affected by this change and you need not take any action. You may elect to receive Shareholder Reports and other communications from the Fund electronically anytime by contacting your financial intermediary or, if you are a direct investor, please follow the instructions on the envelope.
Beginning on January 1, 2019, you may elect to receive all future Shareholder Reports in paper free of charge. If you invest through a financial intermediary, you can contact your financial intermediary to request that you continue to receive paper copies of your Shareholder Reports. If you invest directly with the Fund, please follow the instructions on the envelope to let the Fund know you wish to continue receiving paper copies of your Shareholder Reports. Your election to receive Shareholder Reports in paper will apply to all funds held in your account if you invest through your financial intermediary or all funds held with the fund complex if you invest directly with a fund.

Morgan Stanley Institutional Fund, Inc.
Annual Report — December 31, 2018
Shareholders' Letter | | | 2 | | |
Expense Example | | | 3 | | |
Investment Overview | | | 4 | | |
Portfolio of Investments | | | 6 | | |
Statement of Assets and Liabilities | | | 9 | | |
Statement of Operations | | | 11 | | |
Statements of Changes in Net Assets | | | 12 | | |
Financial Highlights | | | 14 | | |
Notes to Financial Statements | | | 18 | | |
Report of Independent Registered Public Accounting Firm | | | 27 | | |
Federal Tax Notice | | | 28 | | |
Privacy Notice | | | 29 | | |
Director and Officer Information | | | 32 | | |
This report is authorized for distribution only when preceded or accompanied by a prospectus or summary prospectus of the applicable Fund of Morgan Stanley Institutional Fund, Inc. To receive a prospectus and/or statement of additional information (SAI), which contains more complete information such as investment objectives, charges, expenses, policies for voting proxies, risk considerations and describes in detail each of the Fund's investment policies to the prospective investor, please call toll free 1 (800) 548-7786. Please read the prospectuses carefully before you invest or send money.
Additionally, you can access information about the Fund, including performance, characteristics and investment team commentary, through Morgan Stanley Investment Management's website: www.morganstanley.com/im/shareholderreports.
Market forecasts provided in this report may not necessarily come to pass. There is no guarantee that any sectors mentioned will continue to perform as discussed herein or that securities in such sectors will be held by the Fund in the future. There is no assurance that a fund will achieve its investment objective. Funds are subject to market risk, which is the possibility that market values of securities owned by the Fund will decline and, therefore, the value of the Fund's shares may be less than what you paid for them. Accordingly, you can lose money investing in this Fund. Please see the prospectus for more complete information on investment risks.
1
Morgan Stanley Institutional Fund, Inc.
Annual Report — December 31, 2018
Shareholders' Letter (unaudited)
Dear Shareholders,
We are pleased to provide this Annual report, in which you will learn how your investment in Emerging Markets Small Cap Portfolio (the "Fund") performed during the latest twelve-month period.
Morgan Stanley Investment Management is a client-centric, investor-led organization. Our global presence, intellectual capital, and breadth of products and services enable us to partner with investors to meet the evolving challenges of today's financial markets. We aim to deliver superior investment service and to empower our clients to make the informed decisions that help them reach their investment goals.
As always, we thank you for selecting Morgan Stanley Investment Management, and look forward to working with you in the months and years ahead.
Sincerely,

John H. Gernon
President and Principal Executive Officer
January 2019
2
Morgan Stanley Institutional Fund, Inc.
Annual Report — December 31, 2018
Expense Example (unaudited)
Emerging Markets Small Cap Portfolio
As a shareholder of the Fund, you incur two types of costs: (1) transactional costs, including redemption fees; and (2) ongoing costs, which may include advisory fees, administration fees, distribution and shareholder services fees and other Fund expenses. This example is intended to help you understand your ongoing costs (in dollars) of investing in the Fund and to compare these costs with the ongoing costs of investing in other mutual funds.
This example is based on an investment of $1,000 invested at the beginning of the six-month period ended December 31, 2018 and held for the entire six-month period.
Actual Expenses
The table below provides information about actual account values and actual expenses. You may use the information in this table, together with the amount you invested, to estimate the expenses that you paid over the period. Simply divide your account value by $1,000 (for example, an $8,600 account value divided by $1,000 = 8.6), then multiply the result by the number in the table under the heading entitled "Actual Expenses Paid During Period" to estimate the expenses you paid on your account during this period.
Hypothetical Example for Comparison Purposes
The table below provides information about hypothetical account values and hypothetical expenses based on the Fund's actual expense ratio and an assumed rate of return of 5% per year before expenses, which is not the Fund's actual return. The hypothetical account values and expenses may not be used to estimate the actual ending account balance or expenses you paid for the period. You may use this information to compare the ongoing costs of investing in the Fund and other funds. To do so, compare this 5% hypothetical example with the 5% hypothetical examples that appear in the shareholder reports of the other funds.
Please note that the expenses shown in the table are meant to highlight your ongoing costs only and do not reflect any transactional costs, such as sales charges (loads) and redemption fees. Therefore, the information for each class in the table is useful in comparing ongoing costs only, and will not help you determine the relative total costs of owning different funds. In addition, if these transactional costs were included, your costs would have been higher.
| | | Beginning
Account
Value
7/1/18 | | Actual Ending
Account
Value
12/31/18 | | Hypothetical
Ending Account
Value | | Actual
Expenses
Paid
During
Period* | | Hypothetical
Expenses Paid
During Period* | | Net
Expense
Ratio
During
Period** | |
Emerging Markets Small Cap Portfolio Class I | | $ | 1,000.00 | | | $ | 892.30 | | | $ | 1,018.60 | | | $ | 6.25 | | | $ | 6.67 | | | | 1.31 | % | |
Emerging Markets Small Cap Portfolio Class A | | | 1,000.00 | | | | 891.60 | | | | 1,016.79 | | | | 7.96 | | | | 8.49 | | | | 1.67 | | |
Emerging Markets Small Cap Portfolio Class C | | | 1,000.00 | | | | 887.60 | | | | 1,013.01 | | | | 11.51 | | | | 12.28 | | | | 2.42 | | |
Emerging Markets Small Cap Portfolio Class IS | | | 1,000.00 | | | | 893.20 | | | | 1,018.85 | | | | 6.01 | | | | 6.41 | | | | 1.26 | | |
* Expenses are calculated using each Fund Class' annualized net expense ratio (as disclosed), multiplied by the average account value over the period and multiplied by 184/365 (to reflect the most recent one-half year period).
** Annualized.
3
Morgan Stanley Institutional Fund, Inc.
Annual Report — December 31, 2018
Investment Overview (unaudited)
Emerging Markets Small Cap Portfolio
The Fund seeks long-term capital appreciation.
Performance
For the fiscal year ended December 31, 2018, the Fund's Class I shares had a total return based on net asset value and reinvestment of distributions per share of –15.73%, net of fees. The Fund's Class I shares outperformed the Fund's benchmark, the MSCI Emerging Markets Small Cap Net Index (the "Index"), which returned –18.59%.
Factors Affecting Performance
• Emerging markets (EM) small-cap equities underperformed the broad emerging markets equities universe during the one-year period ending December 31, 2018, with the Index returning –18.59% versus the MSCI Emerging Markets Net Index's return of –14.57%.
• Positive contributors to the Fund's performance during the period included our stock selection in Malaysia and Taiwan, and our stock selection in and underweight allocation to Thailand. Our stock selection in and overweight allocation to Indonesia and overweight allocations to Kuwait and Brazil also contributed.
• Key detractors from performance included the Fund's stock selection in Korea and allocation to Argentina. Our stock selection in Qatar and India and allocation to Vietnam also detracted.
• From a sector perspective, our stock selection in consumer staples, industrials and information technology contributed to returns. Our stock selection in financials and consumer discretionary detracted, though our overweight allocations to these sectors added to returns.
Management Strategies
• Before its downturn during the fourth quarter of 2018, technology had dominated returns in emerging markets for nearly three years, showing high correlation with its U.S. counterparts. As a sector, tech had contributed around 40% of EM returns over the prior three years — a share matched only by energy in
2007.(i) Tech-heavy China had accounted for nearly half of all returns during this same three-year period. The infatuation with big tech stocks had driven the relative performance of small- and medium-cap stocks (on an equal-weighted index) to nearly two standard deviations below its historical trend in the emerging markets.(ii) This is highly unusual.
• Our argument for some time has been that when market imbalances grow this extreme, they don't persist. Now that we have begun to see major falls in tech and the tech-heavy MSCI China Index, the question is how the rebalancing is likely to play out. After the busts of tech and telecom in 2000 and energy in 2008, the beaten-down sectors recovered, small and medium caps came back to life and forgotten countries were rediscovered.
• Investors are also rediscovering overlooked markets in Eastern Europe and Latin America. Those markets had been battered in part by the strong U.S. dollar, which historically sucks money out of EM. Since the early 1980s, the dollar has rarely traded more than 15% above or below its long-term range, and it is now at the high end of that range.(iii) Dollar bear markets have tended to last around seven years. Our view is that the dollar's rise in 2018 was a temporary rally within the downtrend that began in 2016 and could prove long-lasting.
• Some of the hardest hit EM currencies have stabilized, and there is no reason to expect the broad collapse to resume. As a group, emerging markets — even excluding China — are in current account surplus. This contrasts with the aggregate current account deficit in 2013 when the "taper tantrum" rattled countries with large deficits, such as Brazil and India. Both those countries and others have seen their deficits narrow since then. Concerns about emerging market debt are really reflecting worries about China's debt. While the rest of EM has seen its non-financial debt climb by 20 percentage points as a share of gross domestic product (GDP) since the global financial crisis of 2008, China's debt has grown by more than 100 percentage points.(iii)
(i) Source: Morgan Stanley Investment Management, MSCI, as of December 31, 2017
(ii) Source: FAME, FactSet, as of June 14, 2018. The analysis is based on the relative performance trend of an equal-weighted MSCI EM Index versus a cap-weighted MSCI EM Index measured over the past 20 years.
(iii) Source: Morgan Stanley Investment Management, Bloomberg, FactSet, Haver Analytics
4
Morgan Stanley Institutional Fund, Inc.
Annual Report — December 31, 2018
Investment Overview (unaudited) (cont'd)
Emerging Markets Small Cap Portfolio
• We believe our portfolio is well positioned to benefit from the current market environment. In keeping with our long-standing process, we are overweight countries where we think that economic growth is stable or accelerating over the next several years. We have a significant portion of the portfolio in stocks in the financials and consumer discretionary sectors, which traditionally perform well during economic recoveries — as the majority of EM countries are experiencing.
• Indonesia, the Philippines and India are still low GDP per capita countries with enormous catch-up potential. Indonesia and Malaysia have adjusted successfully to lower commodity prices, leading to better current and fiscal account positions. The Philippines is one of the highest growing countries in EM, and we think this can translate into superior earnings growth in select companies.
• We are constructive on EM financials benefiting from underpenetrated credit markets and favorable interest rate environments in individual countries. We favor consumer plays benefiting from healthy domestic demand (driven by improving access to credit and rising GDP per capita) and believe there is rising demand for health care, travel and leisure activities.
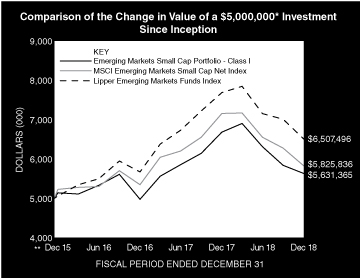
* Minimum Investment for Class I shares
** Commenced Operations on December 15, 2015.
In accordance with SEC regulations, the Fund's performance shown assumes that all recurring fees (including management fees) were deducted and all dividends and distributions were reinvested. The performance of Class A, C and IS shares will vary from the performance of Class I shares and will be negatively impacted by additional fees assessed to those classes (if applicable).
Performance Compared to the MSCI Emerging Markets Small Cap Net Index(1) and the Lipper Emerging Markets Funds Index(2)
| | | Period Ended December 31, 2018
Total Returns(3) | |
| | | | Average Annual | |
| | | One
Year | | Five
Years | | Ten
Years | | Since
Inception(5) | |
Fund — Class I Shares
w/o sales charges(4) | | | –15.73 | % | | | — | | | | — | | | | 3.98 | % | |
Fund — Class A Shares
w/o sales charges(4) | | | –16.03 | | | | — | | | | — | | | | 3.60 | | |
Fund — Class A Shares with
maximum 5.25% sales charges(4) | | | –20.41 | | | | — | | | | — | | | | 1.79 | | |
Fund — Class C Shares
w/o sales charges(4) | | | –16.66 | | | | — | | | | — | | | | 2.82 | | |
Fund — Class C Shares with
maximum 1.00% deferred
sales charges(4) | | | –17.48 | | | | — | | | | — | | | | 2.82 | | |
Fund — Class IS Shares
w/o sales charges(4) | | | –15.65 | | | | — | | | | — | | | | 4.02 | | |
MSCI Emerging Markets
Small Cap Net Index | | | –18.59 | | | | — | | | | — | | | | 5.15 | | |
Lipper Emerging Markets
Funds Index | | | –15.34 | | | | — | | | | — | | | | 9.04 | | |
Performance data quoted represents past performance, which is no guarantee of future results, and current performance may be lower or higher than the figures shown. Performance assumes that all dividends and distributions, if any, were reinvested. For the most recent month-end performance figures, please visit www.morganstanley.com/im/shareholderreports. Investment return and principal value will fluctuate so that Fund shares, when redeemed, may be worth more or less than their original cost. Total returns do not reflect the deduction of taxes that a shareholder would pay on Fund distributions or the redemption of Fund shares. Performance of share classes will vary due to difference in sales charges and expenses.
(1) The MSCI Emerging Markets Small Cap Net Index is a free float-adjusted market capitalization weighted index that is designed to measure small cap equity market performance of emerging markets. The term "free float" represents the portion of shares outstanding that are deemed to be available for purchase in the public equity markets by investors. The performance of the Index is listed in U.S. dollars and assumes reinvestment of net dividends. Net total return indices reinvest dividends after the deduction of withholding taxes, using (for international indices) a tax rate applicable to non-resident institutional investors who do not benefit from double taxation treaties. The Index is unmanaged and its returns do not include any sales charges or fees. Such costs would lower performance. It is not possible to invest directly in an index.
(2) The Lipper Emerging Markets Funds Index is an equally weighted performance index of the largest qualifying funds (based on net assets) in the Lipper Emerging Markets Funds classification. The Index, which is adjusted for capital gains distributions and income dividends, is unmanaged and should not be considered an investment. There are currently 30 funds represented in this Index. As of the date of this report, the Fund is in the Lipper Emerging Markets Funds classification.
(3) Total returns for the Fund reflect fees waived and expenses reimbursed, if applicable, by Morgan Stanley Investment Management Inc. (the "Adviser"). Without such waivers and reimbursements, total returns would have been lower.
(4) Commenced operations on December 15, 2015.
(5) For comparative purposes, average annual since inception returns listed for the Indexes refer to the inception date of the Fund, not the inception of the Index.
5
Morgan Stanley Institutional Fund, Inc.
Annual Report — December 31, 2018
Portfolio of Investments
Emerging Markets Small Cap Portfolio
| | | Shares | | Value
(000) | |
Common Stocks (99.1%) | |
Argentina (1.2%) | |
Globant SA (a) | | | 11,769 | | | $ | 663 | | |
Brazil (9.2%) | |
Banco ABC Brasil SA (Preference) | | | 196,979 | | | | 861 | | |
BK Brasil Operacao e Assessoria a
Restaurantes SA | | | 211,633 | | | | 1,133 | | |
Fleury SA | | | 108,903 | | | | 559 | | |
Linx SA | | | 77,630 | | | | 652 | | |
Localiza Rent a Car SA | | | 105,743 | | | | 810 | | |
Lojas Americanas SA (Preference) | | | 120,500 | | | | 615 | | |
Odontoprev SA | | | 165,338 | | | | 587 | | |
| | | | 5,217 | | |
China (12.2%) | |
Baozun, Inc ADR (a)(b) | | | 14,501 | | | | 424 | | |
Beijing Thunisoft Corp., Ltd., Class A | | | 444,000 | | | | 974 | | |
Canvest Environmental Protection Group
Co., Ltd. (b)(c) | | | 1,171,000 | | | | 615 | | |
China Education Group Holdings Ltd. (a)(c) | | | 422,000 | | | | 511 | | |
China Everbright Greentech Ltd. (c) | | | 671,000 | | | | 478 | | |
China New Higher Education Group Ltd. (c) | | | 854,000 | | | | 370 | | |
Focused Photonics Hangzhou, Inc., Class A | | | 210,900 | | | | 792 | | |
JNBY Design Ltd. (c) | | | 345,500 | | | | 484 | | |
OneSmart International Education Group
Ltd. ADR (a)(b) | | | 110,351 | | | | 861 | | |
Secoo Holding Ltd. ADR (a)(b) | | | 70,040 | | | | 635 | | |
Shenzhen Airport Co. Ltd., Class A | | | 631,000 | | | | 718 | | |
| | | | 6,862 | | |
Egypt (3.6%) | |
Credit Agricole Egypt SAE | | | 323,149 | | | | 740 | | |
Integrated Diagnostics Holdings PLC | | | 147,361 | | | | 612 | | |
Juhayna Food Industries | | | 1,078,004 | | | | 677 | | |
| | | | 2,029 | | |
India (18.2%) | |
Blue Star Ltd. | | | 61,719 | | | | 551 | | |
CreditAccess Grameen Ltd. (a) | | | 129,919 | | | | 712 | | |
Gujarat Gas Ltd. | | | 76,526 | | | | 733 | | |
Gulf Oil Lubricants India Ltd. | | | 66,926 | | | | 787 | | |
Indraprastha Gas Ltd. | | | 197,325 | | | | 757 | | |
Inox Leisure Ltd. (a) | | | 186,856 | | | | 661 | | |
Persistent Systems Ltd. | | | 93,876 | | | | 838 | | |
PVR Ltd. | | | 26,982 | | | | 619 | | |
Ramco Cements Ltd. (The) | | | 103,323 | | | | 948 | | |
Sterlite Technologies Ltd. | | | 257,168 | | | | 1,077 | | |
TCI Express Ltd. | | | 102,459 | | | | 921 | | |
Voltas Ltd. | | | 89,961 | | | | 711 | | |
Westlife Development Ltd. (a) | | | 171,416 | | | | 950 | | |
| | | | 10,265 | | |
Indonesia (7.3%) | |
Ace Hardware Indonesia Tbk PT | | | 7,606,900 | | | | 788 | | |
Bank Tabungan Negara Persero Tbk PT | | | 5,688,100 | | | | 1,004 | | |
| | | Shares | | Value
(000) | |
Bank Tabungan Pensiunan Nasional Syariah
Tbk PT (a) | | | 4,871,200 | | | $ | 608 | | |
Mitra Adiperkasa Tbk PT | | | 11,479,600 | | | | 643 | | |
Nippon Indosari Corpindo Tbk PT | | | 12,654,200 | | | | 1,056 | | |
| | | | 4,099 | | |
Korea, Republic of (12.5%) | |
AfreecaTV Co. Ltd. | | | 15,994 | | | | 561 | | |
BusinessOn Communication Co. Ltd. | | | 34,698 | | | | 463 | | |
Cafe24 Corp. (a) | | | 6,100 | | | | 597 | | |
Dentium Co., Ltd. | | | 15,728 | | | | 808 | | |
Douzone Bizon Co., Ltd. | | | 24,265 | | | | 1,133 | | |
Innocean Worldwide, Inc. | | | 17,362 | | | | 984 | | |
JB Financial Group Co. Ltd. | | | 166,707 | | | | 850 | | |
JYP Entertainment Corp. (a) | | | 30,600 | | | | 825 | | |
Koh Young Technology, Inc. | | | 11,506 | | | | 849 | | |
| | | | 7,070 | | |
Kuwait (1.3%) | |
Boubyan Bank KSCP | | | 225,275 | | | | 415 | | |
Humansoft Holding Co. KSC | | | 29,750 | | | | 322 | | |
| | | | 737 | | |
Malaysia (4.0%) | |
Bermaz Auto Bhd | | | 1,254,900 | | | | 652 | | |
Carlsberg Brewery Malaysia Bhd, Class B | | | 170,500 | | | | 812 | | |
Mynews Holdings Bhd | | | 2,258,900 | | | | 821 | | |
| | | | 2,285 | | |
Mexico (2.4%) | |
Grupo Aeroportuario del Centro Norte
SAB de CV | | | 100,757 | | | | 481 | | |
Regional SAB de CV | | | 158,567 | | | | 729 | | |
Unifin Financiera SAB de CV SOFOM ENR | | | 60,276 | | | | 128 | | |
| | | | 1,338 | | |
Morocco (1.2%) | |
Societe d'Exploitation des Ports | | | 37,995 | | | | 652 | | |
Nigeria (1.1%) | |
Guaranty Trust Bank PLC | | | 6,364,118 | | | | 603 | | |
Philippines (3.3%) | |
MacroAsia Corp. | | | 1,758,250 | | | | 568 | | |
Security Bank Corp. | | | 188,230 | | | | 556 | | |
Wilcon Depot, Inc. | | | 3,060,900 | | | | 735 | | |
| | | | 1,859 | | |
Poland (1.2%) | |
Dino Polska SA (a) | | | 27,695 | | | | 708 | | |
South Africa (2.4%) | |
AVI Ltd. | | | 112,479 | | | | 795 | | |
Reunert Ltd. | | | 110,641 | | | | 542 | | |
| | | | 1,337 | | |
Taiwan (13.9%) | |
ASPEED Technology, Inc. | | | 31,000 | | | | 585 | | |
Bizlink Holding, Inc. | | | 116,560 | | | | 838 | | |
Cub Elecparts, Inc. | | | 104,983 | | | | 811 | | |
King Slide Works Co., Ltd. | | | 56,000 | | | | 581 | | |
The accompanying notes are an integral part of the financial statements.
6
Morgan Stanley Institutional Fund, Inc.
Annual Report — December 31, 2018
Portfolio of Investments (cont'd)
Emerging Markets Small Cap Portfolio
| | | Shares | | Value
(000) | |
Taiwan (cont'd) | |
Poya International Co., Ltd. | | | 87,492 | | | $ | 900 | | |
President Chain Store Corp. | | | 71,000 | | | | 717 | | |
Sunny Friend Environmental Technology Co. Ltd. | | | 150,000 | | | | 987 | | |
TCI Co., Ltd. | | | 79,894 | | | | 1,332 | | |
Voltronic Power Technology Corp. | | | 64,000 | | | | 1,116 | | |
| | | | 7,867 | | |
Thailand (1.7%) | |
Muangthai Capital PCL (Foreign) | | | 658,500 | | | | 990 | | |
Turkey (0.3%) | |
Coca-Cola Icecek AS | | | 33,837 | | | | 197 | | |
Vietnam (2.1%) | |
Ho Chi Minh City Development Joint Stock
Commercial Bank | | | 436,100 | | | | 569 | | |
Sai Gon Cargo Service Corp. | | | 97,800 | | | | 607 | | |
| | | | 1,176 | | |
Total Common Stocks (Cost $57,915) | | | 55,954 | | |
Short-Term Investments (2.7%) | |
Securities held as Collateral on Loaned Securities (1.8%) | |
Investment Company (1.8%) | |
Morgan Stanley Institutional Liquidity
Funds — Government Portfolio —
Institutional Class (See Note G)
(Cost $1,002) | | | 1,002,156 | | | | 1,002 | | |
Investment Company (0.9%) | |
Morgan Stanley Institutional Liquidity
Funds — Government Portfolio —
Institutional Class (See Note G)
(Cost $515) | | | 514,812 | | | | 515 | | |
Total Short-Term Investments (Cost $1,517) | | | 1,517 | | |
Total Investments (101.8%) (Cost $59,432)
Including $1,072 of Securities Loaned (d)(e)(f) | | | 57,471 | | |
Liabilities in Excess of Other Assets (–1.8%) | | | (1,015 | ) | |
Net Assets (100.0%) | | $ | 56,456 | | |
Country assignments and aggregations are based generally on third party vendor classifications and information, and may be different from the assignments and aggregations under the policies set forth in the Fund's prospectus and/or statement of additional information relating to geographic classifications.
(a) Non-income producing security.
(b) All or a portion of this security was on loan at December 31, 2018.
(c) Security trades on the Hong Kong exchange.
(d) Securities are available for collateral in connection with open foreign currency forward exchange contract.
(e) The approximate fair value and percentage of net assets, $49,569,000 and 87.8%, respectively, represent the securities that have been fair valued under the fair valuation policy for international investments as described in Note A-1 within the Notes to the Financial Statements.
(f) At December 31, 2018, the aggregate cost for federal income tax purposes is approximately $59,436,000. The aggregate gross unrealized appreciation is approximately $3,098,000 and the aggregate gross unrealized depreciation is approximately $5,060,000, resulting in net unrealized depreciation of approximately $1,962,000.
ADR American Depositary Receipt.
Foreign Currency Forward Exchange Contract:
The Fund had the following foreign currency forward exchange contract open at December 31, 2018:
Counterparty | | Contract to
Deliver
(000) | | In Exchange
For
(000) | | Delivery
Date | | Unrealized
Appreciation
(000) | |
UBS AG | | HKD | 13,096 | | | $ | 1,675 | | | 2/28/19 | | $ | 3 | | |
HKD — Hong Kong Dollar
The accompanying notes are an integral part of the financial statements.
7
Morgan Stanley Institutional Fund, Inc.
Annual Report — December 31, 2018
Portfolio of Investments (cont'd)
Emerging Markets Small Cap Portfolio
Portfolio Composition*
Classification | | Percentage of
Total Investments | |
Other** | | | 75.5 | % | |
Banks | | | 12.3 | | |
Software | | | 6.9 | | |
Specialty Retail | | | 5.3 | | |
Total Investments | | | 100.0 | %*** | |
* Percentages indicated are based upon total investments (excluding Securities held as Collateral on Loaned Securities) as of December 31, 2018.
** Industries and/or investment types representing less than 5% of total investments.
*** Does not include an open foreign currency forward exchange contract with unrealized appreciation of $3,000.
The accompanying notes are an integral part of the financial statements.
8
Morgan Stanley Institutional Fund, Inc.
Annual Report — December 31, 2018
Emerging Markets Small Cap Portfolio
Statement of Assets and Liabilities | | December 31, 2018
(000) | |
Assets: | |
Investments in Securities of Unaffiliated Issuers, at Value(1) (Cost $57,915) | | $ | 55,954 | | |
Investment in Security of Affiliated Issuer, at Value (Cost $1,517) | | | 1,517 | | |
Total Investments in Securities, at Value (Cost $59,432) | | | 57,471 | | |
Foreign Currency, at Value (Cost $28) | | | 28 | | |
Receivable for Investments Sold | | | 142 | | |
Dividends Receivable | | | 21 | | |
Unrealized Appreciation on Foreign Currency Forward Exchange Contract | | | 3 | | |
Receivable from Affiliate | | | 2 | | |
Receivable from Securities Lending Income | | | 2 | | |
Tax Reclaim Receivable | | | — | @ | |
Other Assets | | | 43 | | |
Total Assets | | | 57,712 | | |
Liabilities: | |
Collateral on Securities Loaned, at Value | | | 1,002 | | |
Payable for Professional Fees | | | 85 | | |
Payable for Fund Shares Redeemed | | | 61 | | |
Payable for Investments Purchased | | | 42 | | |
Payable for Advisory Fees | | | 23 | | |
Payable for Custodian Fees | | | 22 | | |
Payable for Sub Transfer Agency Fees — Class I | | | 5 | | |
Payable for Sub Transfer Agency Fees — Class A | | | — | @ | |
Payable for Administration Fees | | | 4 | | |
Payable for Transfer Agency Fees — Class I | | | 1 | | |
Payable for Transfer Agency Fees — Class A | | | 1 | | |
Payable for Transfer Agency Fees — Class C | | | 1 | | |
Payable for Transfer Agency Fees — Class IS | | | 1 | | |
Bank Overdraft | | | 2 | | |
Payable for Shareholder Services Fees — Class A | | | — | @ | |
Payable for Distribution and Shareholder Services Fees — Class C | | | — | @ | |
Other Liabilities | | | 6 | | |
Total Liabilities | | | 1,256 | | |
Net Assets | | $ | 56,456 | | |
Net Assets Consist of: | |
Paid-in-Capital | | $ | 60,019 | | |
Total Accumulated Loss | | | (3,563 | ) | |
Net Assets | | $ | 56,456 | | |
The accompanying notes are an integral part of the financial statements.
9
Morgan Stanley Institutional Fund, Inc.
Annual Report — December 31, 2018
Emerging Markets Small Cap Portfolio
Statement of Assets and Liabilities (cont'd) | | December 31, 2018
(000) | |
CLASS I: | |
Net Assets | | $ | 48,965 | | |
| Shares Outstanding $0.001 par value shares of beneficial interest (unlimited shares authorized) (not in 000's) | | | 4,614,462 | | |
Net Asset Value, Offering and Redemption Price Per Share | | $ | 10.61 | | |
CLASS A: | |
Net Assets | | $ | 179 | | |
| Shares Outstanding $0.001 par value shares of beneficial interest (unlimited shares authorized) (not in 000's) | | | 16,994 | | |
Net Asset Value, Redemption Price Per Share | | $ | 10.53 | | |
Maximum Sales Load | | | 5.25 | % | |
Maximum Sales Charge | | $ | 0.58 | | |
Maximum Offering Price Per Share | | $ | 11.11 | | |
CLASS C: | |
Net Assets | | $ | 33 | | |
| Shares Outstanding $0.001 par value shares of beneficial interest (unlimited shares authorized) (not in 000's) | | | 3,227 | | |
Net Asset Value, Offering and Redemption Price Per Share | | $ | 10.35 | | |
CLASS IS: | |
Net Assets | | $ | 7,279 | | |
| Shares Outstanding $0.001 par value shares of beneficial interest (unlimited shares authorized) (not in 000's) | | | 685,646 | | |
Net Asset Value, Offering and Redemption Price Per Share | | $ | 10.62 | | |
(1) Including:
Securities on Loan, at Value: | | $ | 1,072 | | |
@ Amount is less than $500.
The accompanying notes are an integral part of the financial statements.
10
Morgan Stanley Institutional Fund, Inc.
Annual Report — December 31, 2018
Emerging Markets Small Cap Portfolio
Statement of Operations | | Year Ended
December 31, 2018
(000) | |
Investment Income: | |
Dividends from Securities of Unaffiliated Issuers (Net of $66 of Foreign Taxes Withheld) | | $ | 602 | | |
Dividends from Security of Affiliated Issuer (Note G) | | | 26 | | |
Income from Securities Loaned — Net | | | 24 | | |
Total Investment Income | | | 652 | | |
Expenses: | |
Advisory Fees (Note B) | | | 533 | | |
Professional Fees | | | 178 | | |
Custodian Fees (Note F) | | | 70 | | |
Registration Fees | | | 52 | | |
Administration Fees (Note C) | | | 34 | | |
Sub Transfer Agency Fees — Class I | | | 15 | | |
Sub Transfer Agency Fees — Class A | | | — | @ | |
Sub Transfer Agency Fees — Class C | | | — | @ | |
Shareholder Reporting Fees | | | 15 | | |
Transfer Agency Fees — Class I (Note E) | | | 2 | | |
Transfer Agency Fees — Class A (Note E) | | | 2 | | |
Transfer Agency Fees — Class C (Note E) | | | 2 | | |
Transfer Agency Fees — Class IS (Note E) | | | 2 | | |
Directors' Fees and Expenses | | | 4 | | |
Pricing Fees | | | 4 | | |
Shareholder Services Fees — Class A (Note D) | | | 1 | | |
Distribution and Shareholder Services Fees — Class C (Note D) | | | — | @ | |
Other Expenses | | | 19 | | |
Total Expenses | | | 933 | | |
Waiver of Advisory Fees (Note B) | | | (323 | ) | |
Reimbursement of Class Specific Expenses — Class I (Note B) | | | (4 | ) | |
Reimbursement of Class Specific Expenses — Class A (Note B) | | | (2 | ) | |
Reimbursement of Class Specific Expenses — Class C (Note B) | | | (2 | ) | |
Reimbursement of Class Specific Expenses — Class IS (Note B) | | | (2 | ) | |
Rebate from Morgan Stanley Affiliate (Note G) | | | (2 | ) | |
Net Expenses | | | 598 | | |
Net Investment Income | | | 54 | | |
Realized Loss: | |
Investments Sold (Net of $32 of Capital Gain Country Tax) | | | (1,530 | ) | |
Foreign Currency Translation | | | (83 | ) | |
Net Realized Loss | | | (1,613 | ) | |
Change in Unrealized Appreciation (Depreciation): | |
Investments (Net Decrease in Deferred Capital Gain Country Tax of $97) | | | (6,839 | ) | |
Foreign Currency Forward Exchange Contract | | | 3 | | |
Foreign Currency Translation | | | (— | @) | |
Net Change in Unrealized Appreciation (Depreciation) | | | (6,836 | ) | |
Net Realized Loss and Change in Unrealized Appreciation (Depreciation) | | | (8,449 | ) | |
Net Decrease in Net Assets Resulting from Operations | | $ | (8,395 | ) | |
@ Amount is less than $500.
The accompanying notes are an integral part of the financial statements.
11
Morgan Stanley Institutional Fund, Inc.
Annual Report — December 31, 2018
Emerging Markets Small Cap Portfolio
Statements of Changes in Net Assets | | Year Ended
December 31, 2018
(000) | | Year Ended
December 31, 2017
(000) | |
Increase (Decrease) in Net Assets: | |
Operations: | |
Net Investment Income (Loss) | | $ | 54 | | | $ | (21 | ) | |
Net Realized Gain (Loss) | | | (1,613 | ) | | | 2,590 | | |
Net Change in Unrealized Appreciation (Depreciation) | | | (6,836 | ) | | | 4,176 | | |
Net Increase (Decrease) in Net Assets Resulting from Operations | | | (8,395 | ) | | | 6,745 | | |
Dividends and Distributions to Shareholders: | |
Class I | | | (774 | ) | | | (891 | )* | |
Class A | | | (3 | ) | | | (1 | )* | |
Class C | | | (1 | ) | | | (— | @)* | |
Class IS | | | (114 | ) | | | (— | @)* | |
Total Dividends and Distributions to Shareholders | | | (892 | ) | | | (892 | ) | |
Capital Share Transactions:(1) | |
Class I: | |
Subscribed | | | 35,038 | | | | 247 | | |
Distributions Reinvested | | | 203 | | | | 2 | | |
Redeemed | | | (3,753 | ) | | | — | | |
Class A: | |
Subscribed | | | 82 | | | | 172 | | |
Distributions Reinvested | | | 3 | | | | — | @ | |
Redeemed | | | (48 | ) | | | (1 | ) | |
Class C: | |
Subscribed | | | 17 | | | | 11 | | |
Distributions Reinvested | | | — | @ | | | — | @ | |
Class IS: | |
Subscribed | | | 8,100 | | | | — | | |
Distributions Reinvested | | | 114 | | | | — | | |
Net Increase in Net Assets Resulting from Capital Share Transactions | | | 39,756 | | | | 431 | | |
Redemption Fees | | | — | @ | | | — | | |
Total Increase in Net Assets | | | 30,469 | | | | 6,284 | | |
Net Assets: | |
Beginning of Period | | | 25,987 | | | | 19,703 | | |
End of Period | | $ | 56,456 | | | $ | 25,987 | † | |
The accompanying notes are an integral part of the financial statements.
12
Morgan Stanley Institutional Fund, Inc.
Annual Report — December 31, 2018
Emerging Markets Small Cap Portfolio
Statements of Changes in Net Assets (cont'd) | | Year Ended
December 31, 2018
(000) | | Year Ended
December 31, 2017
(000) | |
(1) Capital Share Transactions: | |
Class I: | |
Shares Subscribed | | | 2,938 | | | | 20 | | |
Shares Issued on Distributions Reinvested | | | 17 | | | | — | @@ | |
Shares Redeemed | | | (357 | ) | | | — | | |
Net Increase in Class I Shares Outstanding | | | 2,598 | | | | 20 | | |
Class A: | |
Shares Subscribed | | | 6 | | | | 14 | | |
Shares Issued on Distributions Reinvested | | | — | @@ | | | — | @@ | |
Shares Redeemed | | | (4 | ) | | | (— | @@) | |
Net Increase in Class A Shares Outstanding | | | 2 | | | | 14 | | |
Class C: | |
Shares Subscribed | | | 1 | | | | 1 | | |
Shares Issued on Distributions Reinvested | | | — | @@ | | | — | @@ | |
Net Increase in Class C Shares Outstanding | | | 1 | | | | 1 | | |
Class IS: | |
Shares Subscribed | | | 675 | | | | — | | |
Shares Issued on Distributions Reinvested | | | 10 | | | | — | | |
Net Increase in Class IS Shares Outstanding | | | 685 | | | | — | | |
The following information was previously reported in the December 31, 2017 financial statements. The distribution information for the year ended December 31, 2017 presented on the Statements of Changes in Net Assets is presented for comparative purposes to the December 31, 2018 financial statements, which conform to the SEC Final Rule on Disclosure Update and Simplification which was effective November 5, 2018.
* Dividends and Distributions to Shareholders for the year ended December 31, 2017 were as follows:
Class I: | |
Net Realized Gain | | $ | (891 | ) | |
Class A: | |
Net Realized Gain | | $ | (1 | ) | |
Class C: | |
Net Realized Gain | | $ | (— | @) | |
Class IS: | |
Net Realized Gain | | $ | (— | @) | |
† Accumulated Net Investment Loss for the year ended December 31, 2017 was $(103).
@ Amount is less than $500.
@@ Amount is less than 500 shares.
The accompanying notes are an integral part of the financial statements.
13
Morgan Stanley Institutional Fund, Inc.
Annual Report — December 31, 2018
Financial Highlights
Emerging Markets Small Cap Portfolio
| | | Class I | |
| | | Year Ended December 31, | | Period from
December 15, 2015(1) to | |
Selected Per Share Data and Ratios | | 2018 | | 2017 | | 2016 | | December 31, 2015 | |
Net Asset Value, Beginning of Period | | $ | 12.77 | | | $ | 9.85 | | | $ | 10.28 | | | $ | 10.00 | | |
Income (Loss) from Investment Operations: | |
Net Investment Income (Loss)(2) | | | 0.02 | | | | (0.01 | ) | | | 0.02 | | | | 0.01 | | |
Net Realized and Unrealized Gain (Loss) | | | (2.01 | ) | | | 3.38 | | | | (0.35 | ) | | | 0.27 | | |
Total from Investment Operations | | | (1.99 | ) | | | 3.37 | | | | (0.33 | ) | | | 0.28 | | |
Distributions from and/or in Excess of: | |
Net Investment Income | | | — | | | | — | | | | (0.10 | ) | | | — | | |
Net Realized Gain | | | (0.17 | ) | | | (0.45 | ) | | | — | | | | — | | |
Total Distributions | | | (0.17 | ) | | | (0.45 | ) | | | (0.10 | ) | | | — | | |
Redemption Fees | | | 0.00 | (3) | | | — | | | | — | | | | — | | |
Net Asset Value, End of Period | | $ | 10.61 | | | $ | 12.77 | | | $ | 9.85 | | | $ | 10.28 | | |
Total Return(4) | | | (15.73 | )% | | | 34.29 | % | | | (3.19 | )% | | | 2.80 | %(8) | |
Ratios and Supplemental Data: | |
Net Assets, End of Period (Thousands) | | $ | 48,965 | | | $ | 25,762 | | | $ | 19,673 | | | $ | 20,536 | | |
Ratio of Expenses to Average Net Assets(10) | | | 1.41 | %(5)(6) | | | 1.57 | %(5) | | | 1.61 | %(5) | | | 1.58 | %(5)(9) | |
Ratio of Net Investment Income (Loss) to Average Net Assets(10) | | | 0.14 | %(5) | | | (0.09 | )%(5) | | | 0.16 | %(5) | | | 1.01 | %(5)(9) | |
Ratio of Rebate from Morgan Stanley Affiliates to Average Net Assets | | | 0.01 | % | | | 0.04 | % | | | 0.00 | %(7) | | | 0.03 | %(9) | |
Portfolio Turnover Rate | | | 70 | % | | | 71 | % | | | 69 | % | | | 5 | %(8) | |
(10) Supplemental Information on the Ratios to Average Net Assets: | |
Ratios Before Expense Limitation: | |
Expenses to Average Net Assets | | | 2.18 | % | | | 2.58 | % | | | 2.63 | % | | | 7.62 | %(9) | |
Net Investment Loss to Average Net Assets | | | (0.63 | )% | | | (1.10 | )% | | | (0.86 | )% | | | (5.03 | )%(9) | |
(1) Commencement of Operations.
(2) Per share amount is based on average shares outstanding.
(3) Amount is less than $0.005 per share.
(4) Calculated based on the net asset value as of the last business day of the period.
(5) The Ratios of Expenses and Net Investment Income (Loss) reflect the rebate of certain Fund expenses in connection with the investments in Morgan Stanley affiliates during the period. The effect of the rebate on the ratios is disclosed in the above table as "Ratio of Rebate from Morgan Stanley Affiliates to Average Net Assets."
(6) Effective July 13, 2018, the Adviser has agreed to limit the ratio of expenses to average net assets to the maximum ratio of 1.30% for Class I shares. Prior to July 13, 2018, the maximum ratio was 1.65% for Class I shares.
(7) Amount is less than 0.005%.
(8) Not annualized.
(9) Annualized.
The accompanying notes are an integral part of the financial statements.
14
Morgan Stanley Institutional Fund, Inc.
Annual Report — December 31, 2018
Financial Highlights
Emerging Markets Small Cap Portfolio
| | | Class A | |
| | | Year Ended December 31, | | Period from
December 15, 2015(1) to | |
Selected Per Share Data and Ratios | | 2018 | | 2017 | | 2016 | | December 31, 2015 | |
Net Asset Value, Beginning of Period | | $ | 12.72 | | | $ | 9.85 | | | $ | 10.28 | | | $ | 10.00 | | |
Income (Loss) from Investment Operations: | |
Net Investment Income (Loss)(2) | | | (0.01 | ) | | | (0.06 | ) | | | (0.02 | ) | | | 0.00 | (3) | |
Net Realized and Unrealized Gain (Loss) | | | (2.01 | ) | | | 3.38 | | | | (0.35 | ) | | | 0.28 | | |
Total from Investment Operations | | | (2.02 | ) | | | 3.32 | | | | (0.37 | ) | | | 0.28 | | |
Distributions from and/or in Excess of: | |
Net Investment Income | | | — | | | | — | | | | (0.06 | ) | | | — | | |
Net Realized Gain | | | (0.17 | ) | | | (0.45 | ) | | | — | | | | — | | |
Total Distributions | | | (0.17 | ) | | | (0.45 | ) | | | (0.06 | ) | | | — | | |
Redemption Fees | | | 0.00 | (3) | | | — | | | | — | | | | — | | |
Net Asset Value, End of Period | | $ | 10.53 | | | $ | 12.72 | | | $ | 9.85 | | | $ | 10.28 | | |
Total Return(4) | | | (16.03 | )% | | | 33.79 | % | | | (3.58 | )% | | | 2.80 | %(8) | |
Ratios and Supplemental Data: | |
Net Assets, End of Period (Thousands) | | $ | 179 | | | $ | 188 | | | $ | 10 | | | $ | 10 | | |
Ratio of Expenses to Average Net Assets(10) | | | 1.83 | %(5)(6) | | | 1.96 | %(5) | | | 2.00 | %(5) | | | 1.97 | %(5)(9) | |
Ratio of Net Investment Income (Loss) to Average Net Assets(10) | | | (0.11 | )%(5) | | | (0.50 | )%(5) | | | (0.22 | )%(5) | | | 0.62 | %(5)(9) | |
Ratio of Rebate from Morgan Stanley Affiliates to Average Net Assets | | | 0.01 | % | | | 0.04 | % | | | 0.00 | %(7) | | | 0.03 | %(9) | |
Portfolio Turnover Rate | | | 70 | % | | | 71 | % | | | 69 | % | | | 5 | %(8) | |
(10) Supplemental Information on the Ratios to Average Net Assets: | |
Ratios Before Expense Limitation: | |
Expenses to Average Net Assets | | | 3.49 | %(8) | | | 12.38 | % | | | 22.65 | % | | | 21.45 | %(9) | |
Net Investment Loss to Average Net Assets | | | (1.77 | )%(8) | | | (10.92 | )% | | | (20.87 | )% | | | (18.86 | )%(9) | |
(1) Commencement of Operations.
(2) Per share amount is based on average shares outstanding.
(3) Amount is less than $0.005 per share.
(4) Calculated based on the net asset value which does not reflect sales charges, if applicable, as of the last business day of the period.
(5) The Ratios of Expenses and Net Investment Income (Loss) reflect the rebate of certain Fund expenses in connection with the investments in Morgan Stanley affiliates during the period. The effect of the rebate on the ratios is disclosed in the above table as "Ratio of Rebate from Morgan Stanley Affiliates to Average Net Assets."
(6) Effective July 13, 2018, the Adviser has agreed to limit the ratio of expenses to average net assets to the maximum ratio of 1.65% for Class A shares. Prior to July 13, 2018, the maximum ratio was 2.00% for Class A shares.
(7) Amount is less than 0.005%.
(8) Not annualized.
(9) Annualized.
The accompanying notes are an integral part of the financial statements.
15
Morgan Stanley Institutional Fund, Inc.
Annual Report — December 31, 2018
Financial Highlights
Emerging Markets Small Cap Portfolio
| | | Class C | |
| | | Year Ended December 31, | | Period from
December 15, 2015(1) to | |
Selected Per Share Data and Ratios | | 2018 | | 2017 | | 2016 | | December 31, 2015 | |
Net Asset Value, Beginning of Period | | $ | 12.60 | | | $ | 9.84 | | | $ | 10.28 | | | $ | 10.00 | | |
Income (Loss) from Investment Operations: | |
Net Investment Loss(2) | | | (0.10 | ) | | | (0.15 | ) | | | (0.10 | ) | | | (0.00 | )(3) | |
Net Realized and Unrealized Gain (Loss) | | | (1.98 | ) | | | 3.36 | | | | (0.34 | ) | | | 0.28 | | |
Total from Investment Operations | | | (2.08 | ) | | | 3.21 | | | | (0.44 | ) | | | 0.28 | | |
Distributions from and/or in Excess of: | |
Net Realized Gain | | | (0.17 | ) | | | (0.45 | ) | | | — | | | | — | | |
Redemption Fees | | | 0.00 | (3) | | | — | | | | — | | | | — | | |
Net Asset Value, End of Period | | $ | 10.35 | | | $ | 12.60 | | | $ | 9.84 | | | $ | 10.28 | | |
Total Return(4) | | | (16.66 | )% | | | 32.70 | % | | | (4.28 | )% | | | 2.80 | %(8) | |
Ratios and Supplemental Data: | |
Net Assets, End of Period (Thousands) | | $ | 33 | | | $ | 24 | | | $ | 10 | | | $ | 10 | | |
Ratio of Expenses to Average Net Assets(10) | | | 2.58 | %(5)(6) | | | 2.71 | %(5) | | | 2.75 | %(5) | | | 2.73 | %(5)(9) | |
Ratio of Net Investment Loss to Average Net Assets(10) | | | (0.84 | )%(5) | | | (1.27 | )%(5) | | | (0.99 | )%(5) | | | (0.14 | )%(5)(9) | |
Ratio of Rebate from Morgan Stanley Affiliates to Average Net Assets | | | 0.01 | % | | | 0.04 | % | | | 0.00 | %(7) | | | 0.02 | %(9) | |
Portfolio Turnover Rate | | | 70 | % | | | 71 | % | | | 69 | % | | | 5 | %(8) | |
(10) Supplemental Information on the Ratios to Average Net Assets: | |
Ratios Before Expense Limitation: | |
Expenses to Average Net Assets | | | 9.02 | % | | | 20.48 | % | | | 23.48 | % | | | 22.20 | %(9) | |
Net Investment Loss to Average Net Assets | | | (7.28 | )% | | | (19.04 | )% | | | (21.72 | )% | | | (19.61 | )%(9) | |
(1) Commencement of Operations.
(2) Per share amount is based on average shares outstanding.
(3) Amount is less than $0.005 per share.
(4) Calculated based on the net asset value which does not reflect sales charges, if applicable, as of the last business day of the period.
(5) The Ratios of Expenses and Net Investment Loss reflect the rebate of certain Fund expenses in connection with the investments in Morgan Stanley affiliates during the period. The effect of the rebate on the ratios is disclosed in the above table as "Ratio of Rebate from Morgan Stanley Affiliates to Average Net Assets."
(6) Effective July 13, 2018, the Adviser has agreed to limit the ratio of expenses to average net assets to the maximum ratio of 2.40% for Class C shares. Prior to July 13, 2018, the maximum ratio was 2.75% for Class C shares.
(7) Amount is less than 0.005%.
(8) Not annualized.
(9) Annualized.
The accompanying notes are an integral part of the financial statements.
16
Morgan Stanley Institutional Fund, Inc.
Annual Report — December 31, 2018
Financial Highlights
Emerging Markets Small Cap Portfolio
| | | Class IS | |
| | | Year Ended December 31, | | Period from
December 15, 2015(1) to | |
Selected Per Share Data and Ratios | | 2018 | | 2017 | | 2016 | | December 31, 2015 | |
Net Asset Value, Beginning of Period | | $ | 12.77 | | | $ | 9.85 | | | $ | 10.28 | | | $ | 10.00 | | |
Income (Loss) from Investment Operations: | |
Net Investment Income (Loss)(2) | | | 0.00 | (3) | | | (0.01 | ) | | | 0.02 | | | | 0.01 | | |
Net Realized and Unrealized Gain (Loss) | | | (1.98 | ) | | | 3.38 | | | | (0.35 | ) | | | 0.27 | | |
Total from Investment Operations | | | (1.98 | ) | | | 3.37 | | | | (0.33 | ) | | | 0.28 | | |
Distributions from and/or in Excess of: | |
Net Investment Income | | | — | | | | — | | | | (0.10 | ) | | | — | | |
Net Realized Gain | | | (0.17 | ) | | | (0.45 | ) | | | — | | | | — | | |
Total Distributions | | | (0.17 | ) | | | (0.45 | ) | | | (0.10 | ) | | | — | | |
Redemption Fees | | | 0.00 | (3) | | | — | | | | — | | | | — | | |
Net Asset Value, End of Period | | $ | 10.62 | | | $ | 12.77 | | | $ | 9.85 | | | $ | 10.28 | | |
Total Return(4) | | | (15.65 | )% | | | 34.29 | % | | | (3.18 | )% | | | 2.80 | %(8) | |
Ratios and Supplemental Data: | |
Net Assets, End of Period (Thousands) | | $ | 7,279 | | | $ | 13 | | | $ | 10 | | | $ | 10 | | |
Ratio of Expenses to Average Net Assets(10) | | | 1.26 | %(5)(6) | | | 1.55 | %(5) | | | 1.60 | %(5) | | | 1.58 | %(5)(9) | |
Ratio of Net Investment Income (Loss) to Average Net Assets(10) | | | 0.03 | %(5) | | | (0.08 | )%(5) | | | 0.16 | %(5) | | | 1.01 | %(5)(9) | |
Ratio of Rebate from Morgan Stanley Affiliates to Average Net Assets | | | 0.01 | % | | | 0.05 | % | | | 0.00 | %(7) | | | 0.02 | %(9) | |
Portfolio Turnover Rate | | | 70 | % | | | 71 | % | | | 69 | % | | | 5 | %(8) | |
(10) Supplemental Information on the Ratios to Average Net Assets: | |
Ratios Before Expense Limitation: | |
Expenses to Average Net Assets | | | 2.10 | % | | | 19.47 | % | | | 21.37 | % | | | 21.20 | %(9) | |
Net Investment Loss to Average Net Assets | | | (0.81 | )% | | | (18.00 | )% | | | (19.61 | )% | | | (18.61 | )%(9) | |
(1) Commencement of Operations.
(2) Per share amount is based on average shares outstanding.
(3) Amount is less than $0.005 per share.
(4) Calculated based on the net asset value as of the last business day of the period.
(5) The Ratios of Expenses and Net Investment Income (Loss) reflect the rebate of certain Fund expenses in connection with the investments in Morgan Stanley affiliates during the period. The effect of the rebate on the ratios is disclosed in the above table as "Ratio of Rebate from Morgan Stanley Affiliates to Average Net Assets."
(6) Effective July 13, 2018, the Adviser has agreed to limit the ratio of expenses to average net assets to the maximum ratio of 1.25% for Class IS shares. Prior to July 13, 2018, the maximum ratio was 1.60% for Class IS shares.
(7) Amount is less than 0.005%.
(8) Not annualized.
(9) Annualized.
The accompanying notes are an integral part of the financial statements.
17
Morgan Stanley Institutional Fund, Inc.
Annual Report — December 31, 2018
Notes to Financial Statements
Morgan Stanley Institutional Fund, Inc. (the "Company") is registered under the Investment Company Act of 1940, as amended (the "Act"), as an open-end management investment company. The Company is comprised of thirty separate, active, diversified and non-diversified funds (individually referred to as a "Fund", collectively as the "Funds"). The Company applies investment company accounting and reporting guidance.
The accompanying financial statements relate to the Emerging Markets Small Cap Portfolio. The Fund seeks long-term capital appreciation.
The Fund offers four classes of shares — Class I, Class A, Class C and Class IS.
A. Significant Accounting Policies: The following significant accounting policies are in conformity with U.S. generally accepted accounting principles ("GAAP"). Such policies are consistently followed by the Company in the preparation of its financial statements. GAAP may require management to make estimates and assumptions that affect the reported amounts and disclosures in the financial statements. Actual results may differ from those estimates.
In August 2018, the Financial Accounting Standards Board ("FASB") issued Accounting Standards Update ("ASU") 2018-13, Fair Value Measurement (Topic 820) — Disclosures Framework — Changes to Disclosure Requirements of Fair Value Measurement ("ASU 2018-13") which introduces new fair value disclosure requirements as well as eliminates and modifies certain existing fair value disclosure requirements. ASU 2018-13 would be effective for fiscal years beginning after December 15, 2019 and for interim periods within those fiscal years; however, management has elected to early adopt ASU 2018-13 effective with the current reporting period as permitted by the standard. The impact of the Fund's adoption was limited to changes in the Fund's financial statement disclosures regarding fair value, primarily those disclosures related to transfers between levels of the fair value hierarchy and disclosure of the range and weighted average used to develop significant unobservable inputs for Level 3 fair value measurements, when applicable.
1. Security Valuation: (1) An equity portfolio security listed or traded on an exchange is valued at its latest reported sales price (or at the exchange official closing price if such exchange reports an official closing price), and if there were no sales on a given day and if there is no official exchange closing price for that day, the security is valued
at the mean between the last reported bid and asked prices if such bid and asked prices are available on the relevant exchanges. Listed equity securities not traded on the valuation date with no reported bid and asked prices available on the exchange are valued at the mean between the current bid and asked prices obtained from one or more reputable brokers or dealers. In cases where a security is traded on more than one exchange, the security is valued on the exchange designated as the primary market; (2) all other equity portfolio securities for which over-the-counter ("OTC") market quotations are readily available are valued at the latest reported sales price (or at the market official closing price if such market reports an official closing price), and if there was no trading in the security on a given day and if there is no official closing price from relevant markets for that day, the security is valued at the mean between the last reported bid and asked prices if such bid and asked prices are available on the relevant markets. An unlisted equity security that does not trade on the valuation date and for which bid and asked prices from the relevant markets are unavailable is valued at the mean between the current bid and asked prices obtained from one or more reputable brokers or dealers; (3) certain portfolio securities may be valued by an outside pricing service/vendor approved by the Company's Board of Directors (the "Directors"). The pricing service/vendor may employ a pricing model that takes into account, among other things, bids, yield spreads and/or other market data and specific security characteristics. Alternatively, if a valuation is not available from an outside pricing service/vendor, and the security trades on an exchange, the security may be valued at its latest reported sale price (or at the exchange official closing price if such exchange reports an official closing price), prior to the time when assets are valued. If there are no sales on a given day and if there is no official exchange closing price for that day, the security is valued at the mean between the last reported bid and asked prices if such bid and asked prices are available in the relevant exchanges; (4) when market quotations are not readily available, including circumstances under which Morgan Stanley Investment Management Inc. (the "Adviser") determines that the closing price, last sale price or the mean between the last reported bid and asked prices are not reflective of a security's market value, portfolio securities are valued at their fair value as determined in good faith under procedures established by and under the general supervision of the Directors. Occasionally,
18
Morgan Stanley Institutional Fund, Inc.
Annual Report — December 31, 2018
Notes to Financial Statements (cont'd)
developments affecting the closing prices of securities and other assets may occur between the times at which valuations of such securities are determined (that is, close of the foreign market on which the securities trade) and the close of business of the New York Stock Exchange ("NYSE"). If developments occur during such periods that are expected to materially affect the value of such securities, such valuations may be adjusted to reflect the estimated fair value of such securities as of the close of the NYSE, as determined in good faith by the Directors or by the Adviser using a pricing service and/or procedures approved by the Directors; (5) quotations of foreign portfolio securities, other assets and liabilities and forward contracts stated in foreign currency are translated into U.S. dollar equivalents at the prevailing market rates prior to the close of the NYSE; and (6) investments in mutual funds, including the Morgan Stanley Institutional Liquidity Funds, are valued at the net asset value ("NAV") as of the close of each business day.
The Directors have responsibility for determining in good faith the fair value of the investments, and the Directors may appoint others, such as the Company's Adviser or a valuation committee, to assist the Directors in determining fair value and to make the actual calculations pursuant to the fair valuation methodologies previously approved by the Directors. Under procedures approved by the Directors, the Company's Adviser has formed a Valuation Committee whose members are approved by the Directors. The Valuation Committee provides administration and oversight of the Company's valuation policies and procedures, which are reviewed at least annually by the Directors. These procedures allow the Company to utilize independent pricing services, quotations from securities and financial instrument dealers and other market sources to determine fair value.
2. Fair Value Measurement: FASB Accounting Standards CodificationTM ("ASC") 820, "Fair Value Measurement" ("ASC 820"), defines fair value as the value that the Fund would receive to sell an investment or pay to transfer a liability in a timely transaction with an independent buyer in the principal market, or in the absence
of a principal market, the most advantageous market for the investment or liability. ASC 820 establishes a three-tier hierarchy to distinguish between (1) inputs that reflect the assumptions market participants would use in valuing an asset or liability developed based on market data obtained from sources independent of the reporting entity (observable inputs) and (2) inputs that reflect the reporting entity's own assumptions about the assumptions market participants would use in valuing an asset or liability developed based on the best information available in the circumstances (unobservable inputs) and to establish classification of fair value measurements for disclosure purposes. Various inputs are used in determining the value of the Fund's investments. The inputs are summarized in the three broad levels listed below:
• Level 1 – unadjusted quoted prices in active markets for identical investments
• Level 2 – other significant observable inputs (including quoted prices for similar investments, interest rates, prepayment speeds, credit risk, etc.)
• Level 3 – significant unobservable inputs including the Fund's own assumptions in determining the fair value of investments. Factors considered in making this determination may include, but are not limited to, information obtained by contacting the issuer, analysts, or the appropriate stock exchange (for exchange-traded securities), analysis of the issuer's financial statements or other available documents and, if necessary, available information concerning other securities in similar circumstances
The inputs or methodology used for valuing securities are not necessarily an indication of the risk associated with investing in those securities and the determination of the significance of a particular input to the fair value measurement in its entirety requires judgment and considers factors specific to each security.
19
Morgan Stanley Institutional Fund, Inc.
Annual Report — December 31, 2018
Notes to Financial Statements (cont'd)
The following is a summary of the inputs used to value the Fund's investments as of December 31, 2018:
Investment Type | | Level 1
Unadjusted
quoted
prices
(000) | | Level 2
Other
significant
observable
inputs
(000) | | Level 3
Significant
unobservable
inputs
(000) | | Total
(000) | |
Assets: | |
Common Stocks | |
Air Freight & Logistics | | $ | — | | | $ | 1,528 | | | $ | — | | | $ | 1,528 | | |
Auto Components | | | — | | | | 811 | | | | — | | | | 811 | | |
Banks | | | 729 | | | | 6,206 | | | | — | | | | 6,935 | | |
Beverages | | | — | | | | 1,009 | | | | — | | | | 1,009 | | |
Building Products | | | — | | | | 551 | | | | — | | | | 551 | | |
Chemicals | | | — | | | | 787 | | | | — | | | | 787 | | |
Commercial Services &
Supplies | | | — | | | | 1,779 | | | | — | | | | 1,779 | | |
Communications Equipment | | | — | | | | 1,077 | | | | — | | | | 1,077 | | |
Construction & Engineering | | | — | | | | 711 | | | | — | | | | 711 | | |
Construction Materials | | | — | | | | 948 | | | | — | | | | 948 | | |
Consumer Finance | | | 128 | | | | 1,702 | | | | — | | | | 1,830 | | |
Diversified Consumer
Services | | | 861 | | | | 1,203 | | | | — | | | | 2,064 | | |
Electrical Equipment | | | — | | | | 1,954 | | | | — | | | | 1,954 | | |
Entertainment | | | — | | | | 2,105 | | | | — | | | | 2,105 | | |
Food & Staples Retailing | | | — | | | | 1,425 | | | | — | | | | 1,425 | | |
Food Products | | | — | | | | 2,528 | | | | — | | | | 2,528 | | |
Gas Utilities | | | — | | | | 1,490 | | | | — | | | | 1,490 | | |
Health Care Equipment &
Supplies | | | — | | | | 808 | | | | — | | | | 808 | | |
Health Care Providers &
Services | | | — | | | | 1,758 | | | | — | | | | 1,758 | | |
Hotels, Restaurants &
Leisure | | | — | | | | 2,083 | | | | — | | | | 2,083 | | |
Independent Power &
Renewable Electricity
Producers | | | — | | | | 1,093 | | | | — | | | | 1,093 | | |
Industrial Conglomerates | | | — | | | | 542 | | | | — | | | | 542 | | |
Information Technology
Services | | | — | | | | 1,435 | | | | — | | | | 1,435 | | |
Interactive Media &
Services | | | — | | | | 561 | | | | — | | | | 561 | | |
Internet & Direct Marketing
Retail | | | 1,059 | | | | — | | | | — | | | | 1,059 | | |
Machinery | | | — | | | | 581 | | | | — | | | | 581 | | |
Media | | | — | | | | 984 | | | | — | | | | 984 | | |
Multi-Line Retail | | | — | | | | 2,158 | | | | — | | | | 2,158 | | |
Personal Products | | | — | | | | 1,332 | | | | — | | | | 1,332 | | |
Road & Rail | | | — | | | | 810 | | | | — | | | | 810 | | |
Semiconductors &
Semiconductor
Equipment | | | — | | | | 1,434 | | | | — | | | | 1,434 | | |
Software | | | 663 | | | | 3,222 | | | | — | | | | 3,885 | | |
Specialty Retail | | | — | | | | 2,996 | | | | — | | | | 2,996 | | |
Textiles, Apparel & Luxury
Goods | | | — | | | | 484 | | | | — | | | | 484 | | |
Transportation
Infrastructure | | | 481 | | | | 1,938 | | | | — | | | | 2,419 | | |
Total Common Stocks | | | 3,921 | | | | 52,033 | | | | — | | | | 55,954 | | |
Short-Term Investments | |
Investment Company | | | 1,517 | | | | — | | | | — | | | | 1,517 | | |
Foreign Currency Forward
Exchange Contract | | | — | | | | 3 | | | | — | | | | 3 | | |
Total Assets | | $ | 5,438 | | | $ | 52,036 | | | $ | — | | | $ | 57,474 | | |
Transfers between investment levels may occur as the markets fluctuate and/or the availability of data used in an investment's valuation changes.
3. Foreign Currency Translation and Foreign Investments: The books and records of the Fund are maintained in U.S. dollars. Foreign currency amounts are translated into U.S. dollars as follows:
– investments, other assets and liabilities at the prevailing rate of exchange on the valuation date;
– investment transactions and investment income at the prevailing rates of exchange on the dates of such transactions.
Although the net assets of the Fund are presented at the foreign exchange rates and market values at the close of the period, the Fund does not isolate that portion of the results of operations arising as a result of changes in the foreign exchange rates from the fluctuations arising from changes in the market prices of securities held at period end. Similarly, the Fund does not isolate the effect of changes in foreign exchange rates from the fluctuations arising from changes in the market prices of securities sold during the period. Accordingly, realized and unrealized foreign currency gains (losses) on investments in securities are included in the reported net realized and unrealized gains (losses) on investment transactions and balances. However, pursuant to U.S. federal income tax regulations, gains and losses from certain foreign currency transactions and the foreign currency portion of gains and losses realized on sales and maturities of foreign denominated debt securities are treated as ordinary income for U.S. federal income tax purposes.
Net realized gains (losses) on foreign currency transactions represent net foreign exchange gains (losses) from foreign currency forward exchange contracts, disposition of foreign currencies, currency gains (losses) realized between the trade and settlement dates on securities transactions, and the difference between the amount of investment income and foreign withholding taxes recorded on the Fund's books and the U.S. dollar equivalent amounts actually received or paid. Net unrealized currency gains (losses) from valuing foreign currency denominated assets and liabilities at period end exchange rates are reflected as a component of unrealized appreciation (depreciation) in the Statement of Assets
20
Morgan Stanley Institutional Fund, Inc.
Annual Report — December 31, 2018
Notes to Financial Statements (cont'd)
and Liabilities. The change in unrealized currency gains (losses) on foreign currency translations for the period is reflected in the Statement of Operations.
A significant portion of the Fund's net assets consist of securities of issuers located in emerging markets, which are denominated in foreign currencies. Such securities may be concentrated in a limited number of countries and regions and may vary throughout the year. Changes in currency exchange rates will affect the value of securities and investment income from foreign currency denominated securities. Emerging market securities are often subject to greater price volatility, limited capitalization and liquidity, and higher rates of inflation than securities of companies based in the U.S. In addition, emerging market issuers may be subject to substantial governmental involvement in the economy and greater social, economic and political uncertainty.
Governmental approval for foreign investments may be required in advance of making an investment under certain circumstances in some countries, and the extent of foreign investments in domestic companies may be subject to limitation in other countries. Foreign ownership limitations also may be imposed by the charters of individual companies to prevent, among other concerns, violations of foreign investment limitations. As a result, an additional class of shares (identified as "Foreign" in the Portfolio of Investments) may be created and offered for investment. The "local" and "foreign shares" market values may differ. In the absence of trading of the foreign shares in such markets, the Fund values the foreign shares at the closing exchange price of the local shares.
4. Derivatives: The Fund may, but is not required to, use derivative instruments for a variety of purposes, including hedging, risk management, portfolio management or to earn income. Derivatives are financial instruments whose value is based, in part, on the value of an underlying asset, interest rate, index or financial instrument. Prevailing interest rates and volatility levels, among other things, also affect the value of derivative instruments. A derivative instrument often has risks similar to its underlying asset and may have additional risks, including imperfect correlation between the value of the derivative and the underlying asset, risks of default by the counterparty to certain transactions, magnification of losses incurred due to changes in the market value of the securities, instruments, indices or interest rates to which the derivative instrument relates,
risks that the transactions may not be liquid and risks arising from margin requirements. The use of derivatives involves risks that are different from, and possibly greater than, the risks associated with other portfolio investments. Derivatives may involve the use of highly specialized instruments that require investment techniques and risk analyses different from those associated with other portfolio investments. All of the Fund's holdings, including derivative instruments, are marked-to-market each day with the change in value reflected in unrealized appreciation (depreciation). Upon disposition, a realized gain or loss is recognized.
Certain derivative transactions may give rise to a form of leverage. Leverage magnifies the potential for gain and the risk of loss. Leverage associated with derivative transactions may cause the Fund to liquidate portfolio positions when it may not be advantageous to do so to satisfy its obligations or to meet earmarking or segregation requirements, pursuant to applicable Securities and Exchange Commission ("SEC") rules and regulations, or may cause the Fund to be more volatile than if the Fund had not been leveraged. Although the Adviser seek to use derivatives to further the Fund's investment objectives, there is no assurance that the use of derivatives will achieve this result.
Following is a description of the derivative instruments and techniques that the Fund used during the period and their associated risks:
Foreign Currency Forward Exchange Contracts: In connection with its investments in foreign securities, the Fund also entered into contracts with banks, brokers or dealers to purchase or sell securities or foreign currencies at a future date. A foreign currency forward exchange contract ("currency contract") is a negotiated agreement between the contracting parties to exchange a specified amount of currency at a specified future time at a specified rate. The rate can be higher or lower than the spot rate between the currencies that are the subject of the contract. Currency contracts may be used to protect against uncertainty in the level of future foreign currency exchange rates or to gain or modify exposure to a particular currency. To the extent hedged by the use of currency contracts, the precise matching of the currency contract amounts and the value of the securities involved will not generally be possible because the future value of such securities in foreign currencies will change
21
Morgan Stanley Institutional Fund, Inc.
Annual Report — December 31, 2018
Notes to Financial Statements (cont'd)
as a consequence of market movements in the value of those securities between the date on which the contract is entered into and the date it matures. Furthermore, such transactions may reduce or preclude the opportunity for gain if the value of the currency should move in the direction opposite to the position taken. There is additional risk to the extent that currency contracts create exposure to currencies in which the Fund's securities are not denominated. Unanticipated changes in currency prices may result in poorer overall performance for the Fund than if it had not entered into such contracts. The use of currency contracts involves the risk of loss from the insolvency or bankruptcy of the counterparty to the contract or the failure of the counterparty to make payments or otherwise comply with the terms of the contract. A currency contract is marked-to-market daily and the change in market value is recorded by the Fund as unrealized gain or loss. The Fund records realized gains (losses) when the currency contract is closed equal to the difference between the value of the currency contract at the time it was opened and the value at the time it was closed.
FASB ASC 815, "Derivatives and Hedging" ("ASC 815"), is intended to improve financial reporting about derivative instruments by requiring enhanced disclosures to enable investors to better understand how and why the Fund uses derivative instruments, how these derivative instruments are accounted for and their effects on the Fund's financial position and results of operations.
The following table sets forth the fair value of the Fund's derivative contracts by primary risk exposure as of December 31, 2018:
| | | Liability Derivatives
Statement of Assets and
Liabilities Location | | Primary Risk
Exposure | | Value
(000) | |
Foreign Currency
Forward Exchange
Contract | | Unrealized Depreciation on
Foreign Currency Forward
Exchange Contract | | Currency Risk | | $ | 3 | | |
The following table sets forth by primary risk exposure the Fund's change in unrealized appreciation (depreciation) by type of derivative contract for the year ended December 31, 2018 in accordance with ASC 815:
Change in Unrealized Appreciation (Depreciation) | |
Primary Risk Exposure | | Derivative Type | | Value
(000) | |
Currency Risk | | Foreign Currency
Forward Exchange Contract | | $ | 3 | | |
At December 31, 2018, the Fund's derivative assets and liabilities are as follows:
Gross Amounts of Assets and Liabilities
Presented in the Statement of Assets and Liabilities | |
Derivatives | | Assets(a)
(000) | | Liabilities(a)
(000) | |
Foreign Currency Forward
Exchange Contract | | $ | 3 | | | $ | — | | |
(a) Absent an event of default or early termination, OTC derivative assets and liabilities are presented gross and not offset in the Statement of Assets and Liabilities.
The Fund typically enters into International Swaps and Derivatives Association, Inc. Master Agreements ("ISDA Master Agreements") or similar master agreements (collectively, "Master Agreements") with its contract counterparties for certain OTC derivatives in order to, among other things, reduce its credit risk to counterparties. ISDA Master Agreements include provisions for general obligations, representations, collateral and events of default or termination. Under an ISDA Master Agreement, the Fund typically may offset with the counterparty certain OTC derivative financial instruments' payables and/or receivables with collateral held and/or posted and create one single net payment (close-out netting) in the event of default, termination and/or potential deterioration in the credit quality of the counterparty. Various Master Agreements govern the terms of certain transactions with counterparties, including transactions such as swap, forward, repurchase and reverse repurchase agreements. These Master Agreements typically attempt to reduce the counterparty risk associated with such transactions by specifying credit protection mechanisms and providing standardization that improves legal certainty. Cross-termination provisions under Master Agreements typically provide that a default in connection with one transaction between the Fund and a counterparty gives the non-defaulting party the right to terminate any other transactions in place with the defaulting party to create one single net payment due to/due from the defaulting party and may be a feature in certain Master Agreements. In the event the Fund exercises its right to terminate a Master Agreement after a counterparty experiences a termination event as defined in the Master Agreement, the return of collateral with market value in excess of the Fund's net liability may be delayed or denied.
22
Morgan Stanley Institutional Fund, Inc.
Annual Report — December 31, 2018
Notes to Financial Statements (cont'd)
The following table presents derivative financial instruments that are subject to enforceable netting arrangements as of December 31, 2018:
Gross Amounts Not Offset in the Statement of Assets and Liabilities | |
Counterparty | | Gross Liability
Derivatives
Presented in
the Statement of
Assets and
Liabilities
(000) | | Financial
Instrument
(000) | | Collateral
Received
(000) | | Net Amount
(not less
than $0)
(000) | |
UBS AG | | $ | 3 | | | $ | — | | | $ | — | | | $ | 3 | | |
For the year ended December 31, 2018, the approximate average monthly amount outstanding for each derivative type is as follows:
Foreign Currency Forward Exchange Contracts: | |
Average monthly principal amount | | $ | 975,000 | | |
5. Securities Lending: The Fund lends securities to qualified financial institutions, such as broker-dealers, to earn additional income. Any increase or decrease in the fair value of the securities loaned that might occur and any interest earned or dividends declared on those securities during the term of the loan would remain in the Fund. The Fund would receive cash or securities as collateral in an amount equal to or exceeding 100% of the current fair value of the loaned securities. The collateral is marked-to-market daily by State Street Bank and Trust Company ("State Street"), the securities lending agent, to ensure that a minimum of 100% collateral coverage is maintained.
Based on pre-established guidelines, the securities lending agent invests any cash collateral that is received in an affiliated money market portfolio and repurchase agreements. Securities lending income is generated from the earnings on the invested collateral and borrowing fees, less any rebates owed to the borrowers and compensation to the lending agent, and is recorded as "Income from Securities Loaned — Net" in the Fund's Statement of Operations. Risks in securities lending transactions are that a borrower may not provide additional collateral when required or return the securities when due, and that the value of the short-term investments will be less than the amount of cash collateral plus any rebate that is required to be returned to the borrower.
The Fund has the right under the securities lending agreement to recover the securities from the borrower on demand.
The following table presents financial instruments that are subject to enforceable netting arrangements as of December 31, 2018:
Gross Amounts Not Offset in the Statement of Assets and Liabilities | |
Gross Asset
Amounts
Presented in
the Statement of
Assets and
Liabilities
(000) | | Financial
Instrument
(000) | | Collateral
Received
(000) | | Net Amount
(not less
than $0)
(000) | |
| $ | 1,072 | (b) | | $ | — | | | $ | 1,072 | (c)(d) | | $ | 0 | | |
(b) Represents market value of loaned securities at year end.
(c) The Fund received cash collateral of approximately $1,002,000 which was subsequently invested in Morgan Stanley Institutional Liquidity Funds as reported in the Portfolio of Investments. In addition, the Fund received non-cash collateral of approximately $115,000 in the form of U.S. Government obligations, which the Fund cannot sell or repledge, and accordingly are not reflected in the Portfolio of Investments.
(d) The actual collateral received is greater than the amount shown here due to overcollateralization.
FASB ASC 860, "Transfers & Servicing: Repurchase-to-Maturity Transactions, Repurchase Financings, and Disclosures", is intended to provide increased transparency about the types of collateral pledged in securities lending transactions and other similar transactions that are accounted for as secured borrowing.
The following table displays a breakdown of transactions accounted for as secured borrowings, the gross obligations by class of collateral pledged and the remaining contractual maturity of those transactions as of December 31, 2018:
Remaining Contractual Maturity of the Agreements | |
| | | Overnight and
Continuous
(000) | | <30 days
(000) | | Between
30 &
90 days
(000) | | >90 days
(000) | | Total
(000) | |
Securities Lending
Transactions | |
Common Stocks | | $ | 1,002 | | | $ | — | | | $ | — | | | $ | — | | | $ | 1,002 | | |
Total Borrowings | | $ | 1,002 | | | $ | — | | | $ | — | | | $ | — | | | $ | 1,002 | | |
Gross amount of
recognized liabilities
for securities lending
transactions | | | | | | | | | | $ | 1,002 | | |
6. Redemption Fees: The Fund will assess a 2% redemption fee, on Class I shares, Class A shares, Class C shares and Class IS shares, which is paid directly to the Fund, for shares redeemed or exchanged within thirty days of purchase, subject to certain exceptions. The redemption fee is designed to protect the Fund and its remaining shareholders from the effects of short-term trading. These fees, if any, are included in the Statements of Changes in Net Assets.
23
Morgan Stanley Institutional Fund, Inc.
Annual Report — December 31, 2018
Notes to Financial Statements (cont'd)
7. Indemnifications: The Company enters into contracts that contain a variety of indemnifications. The Company's maximum exposure under these arrangements is unknown. However, the Company has not had prior claims or losses pursuant to these contracts and expects the risk of loss to be remote.
8. Dividends and Distributions to Shareholders: Dividends and distributions to shareholders are recorded on the ex-dividend date. Dividends from net investment income, if any, are declared and paid annually. Net realized capital gains, if any, are distributed at least annually.
9. Security Transactions, Income and Expenses: Security transactions are accounted for on the trade date (date the order to buy or sell is executed). Realized gains and losses on the sale of investment securities are determined on the specific identified cost method. Dividend income and other distributions are recorded on the ex-dividend date (except for certain foreign dividends which may be recorded as soon as the Fund is informed of such dividends) net of applicable withholding taxes. Interest income is recognized on the accrual basis except where collection is in doubt. Discounts are accreted and premiums are amortized over the life of the respective securities. Most expenses of the Company can be directly attributed to a particular Fund. Expenses which cannot be directly attributed are apportioned among the Funds based upon relative net assets or other appropriate methods. Income, expenses (other than class specific expenses — distribution and shareholder services, transfer agency and sub transfer agency fees) and realized and unrealized gains or losses are allocated to each class of shares based upon their relative net assets.
B. Advisory Fees: The Adviser, a wholly-owned subsidiary of Morgan Stanley, provides the Fund with advisory services under the terms of an Investment Advisory Agreement, paid quarterly, at an annual rate of 1.25% of the average daily net assets of the Fund.
The Adviser has agreed to reduce its advisory fee and/or reimburse the Fund so that total annual portfolio operating expenses, excluding certain investment related expenses, taxes, interest and other extraordinary expenses (including litigation), will not exceed 1.65% for Class I shares, 2.00% for Class A shares, 2.75% for Class C shares and 1.60% for Class IS shares. Effective July 13, 2018, the Adviser has agreed to reduce its advisory fee and/or reimburse the Fund so that the
total annual operating expenses will not exceed for 1.30% Class I shares, 1.65% for Class A shares, 2.40% for Class C shares and 1.25% for Class IS shares. The fee waivers and/or expense reimbursements will continue for at least one year from the date of the Fund's prospectus or until such time as the Directors act to discontinue all or a portion of such waivers and/or reimbursements when they deem such action is appropriate. For the year ended December 31, 2018, approximately $323,000 of advisory fees were waived and approximately $10,000 of other expenses were reimbursed by the Adviser pursuant to this arrangement.
C. Administration Fees: The Adviser also serves as Administrator to the Company and provides administrative services pursuant to an Administration Agreement for an annual fee, accrued daily and paid monthly, of 0.08% of the Fund's average daily net assets.
Under a Sub-Administration Agreement between the Administrator and State Street, State Street provides certain administrative services to the Company. For such services, the Administrator pays State Street a portion of the fee the Administrator receives from the Fund.
D. Distribution and Shareholder Services Fees: Morgan Stanley Distribution, Inc. ("MSDI" or the "Distributor"), a wholly-owned subsidiary of the Adviser and an indirect subsidiary of Morgan Stanley, serves as the Company's Distributor of Fund shares pursuant to a Distribution Agreement. The Company has adopted a Shareholder Services Plan with respect to Class A shares pursuant to Rule 12b-1 under the Act. Under the Shareholder Services Plan, the Fund pays the Distributor a shareholder services fee, accrued daily and paid monthly, at an annual rate of 0.25% of the Fund's average daily net assets attributable to Class A shares.
The Company has adopted a Distribution and Shareholder Services Plan with respect to Class C shares pursuant to Rule 12b-1 under the Act. Under the Distribution and Shareholder Services Plan, the Fund pays the Distributor a distribution fee, accrued daily and paid monthly, at an annual rate of 0.75% and a shareholder services fee, accrued daily and paid monthly, at an annual rate of 0.25% of the Fund's average daily net assets attributable to Class C shares.
The distribution and shareholder services fees are used to support the expenses associated with servicing and maintaining accounts. The Distributor may compensate other parties for providing shareholder support services to investors who purchase Class A and Class C shares.
24
Morgan Stanley Institutional Fund, Inc.
Annual Report — December 31, 2018
Notes to Financial Statements (cont'd)
E. Dividend Disbursing and Transfer Agent: The Company's dividend disbursing and transfer agent is DST Asset Manager Solutions, Inc. ("DST"). Pursuant to a Transfer Agency Agreement, the Company pays DST a fee based on the number of classes, accounts and transactions relating to the Funds of the Company.
F. Custodian Fees: State Street (the "Custodian") also serves as Custodian for the Company in accordance with a Custodian Agreement. The Custodian holds cash, securities and other assets of the Company as required by the Act. Custody fees are payable monthly based on assets held in custody, investment purchases and sales activity and account maintenance fees, plus reimbursement for certain out-of-pocket expenses.
G. Security Transactions and Transactions with Affiliates: For the year ended December 31, 2018, purchases and sales of investment securities for the Fund, other than long-term U.S. Government securities and short-term investments were approximately $67,660,000 and $28,439,000, respectively. There were no purchases and sales of long-term U.S. Government securities for the year ended December 31, 2018.
The Fund invests in the Institutional Class of the Morgan Stanley Institutional Liquidity Funds — Government Portfolio (the "Liquidity Funds"), an open-end management investment company managed by the Adviser, both directly and as a portion of the securities held as collateral on loaned securities. Advisory fees paid by the Fund are reduced by an amount equal to its pro-rata share of the advisory and administration fees paid by the Fund due to its investment in the Liquidity Funds. For the year ended December 31, 2018, advisory fees paid were reduced by approximately $2,000 relating to the Fund's investment in the Liquidity Funds.
A summary of the Fund's transactions in shares of affiliated investments during the year ended December 31, 2018 is as follows:
Affiliated
Investment
Company | | Value
December 31,
2017
(000) | | Purchases
at Cost
(000) | | Proceeds
from Sales
(000) | | Dividend
Income
(000) | |
Liquidity Funds | | $ | 1,424 | | | $ | 47,803 | | | $ | 47,710 | | | $ | 26 | | |
Affiliated
Investment
Company (cont'd) | | Realized
Gain (Loss)
(000) | | Change in
Unrealized
Appreciation
(Depreciation)
(000) | | Value
December 31,
2018
(000) | |
Liquidity Funds | | $ | — | | | $ | — | | | $ | 1,517 | | |
The Fund is permitted to purchase and sell securities ("cross-trade") from and to other Morgan Stanley funds as well as other funds and client accounts for which the Adviser or an affiliate of the Adviser serves as investment adviser, pursuant to procedures approved by the Directors in compliance with Rule 17a-7 under the Act (the "Rule"). Each cross-trade is executed at the current market price in compliance with provisions of the Rule. For the year ended December 31, 2018, the Fund did not engage in any cross-trade transactions.
The Fund has an unfunded Deferred Compensation Plan (the "Compensation Plan"), which allows each independent Director to defer payment of all, or a portion, of the fees he or she receives for serving on the Board of Directors. Each eligible Director generally may elect to have the deferred amounts credited with a return equal to the total return on one or more of the Morgan Stanley funds that are offered as investment options under the Compensation Plan. Appreciation/depreciation and distributions received from these investments are recorded with an offsetting increase/decrease in the deferred compensation obligation and do not affect the NAV of the Fund.
H. Federal Income Taxes: It is the Fund's intention to continue to qualify as a regulated investment company and distribute all of its taxable and tax-exempt income. Accordingly, no provision for federal income taxes is required in the financial statements.
The Fund may be subject to taxes imposed by countries in which it invests. Such taxes are generally based on income and/or capital gains earned or repatriated. Taxes are accrued based on net investment income, net realized gains and net unrealized appreciation as such income and/or gains are earned. Taxes may also be based on transactions in foreign currency and are accrued based on the value of investments denominated in such currency.
FASB ASC 740-10, "Income Taxes — Overall", sets forth a minimum threshold for financial statement recognition of the benefit of a tax position taken or expected to be taken in a tax return. Management has concluded there are no significant uncertain tax positions that would require recognition in the financial statements. If applicable, the Fund recognizes interest accrued related to unrecognized tax benefits in "Interest Expense" and penalties in "Other Expenses" in the Statement of Operations. The Fund files tax returns with the U.S. Internal Revenue Service, New York and various states. Generally, each of the tax years in the four-year period ended December 31, 2018 remains subject to examination by taxing authorities.
25
Morgan Stanley Institutional Fund, Inc.
Annual Report — December 31, 2018
Notes to Financial Statements (cont'd)
The tax character of distributions paid may differ from the character of distributions shown for GAAP purposes due to short-term capital gains being treated as ordinary income for tax purposes. The tax character of distributions paid during fiscal years 2018 and 2017 was as follows:
2018
Distributions
Paid From: | | 2017
Distributions
Paid From: | |
Ordinary
Income
(000) | | Long-Term
Capital Gain
(000) | | Ordinary
Income
(000) | | Long-Term
Capital Gain
(000) | |
| $ | — | | | $ | 892 | | | $ | — | | | $ | 892 | | |
The amount and character of income and gains to be distributed are determined in accordance with income tax regulations which may differ from GAAP. These book/tax differences are either considered temporary or permanent in nature.
Temporary differences are attributable to differing book and tax treatments for the timing of the recognition of gains (losses) on certain investment transactions and the timing of the deductibility of certain expenses.
Permanent differences, primarily due to a net operating loss, resulted in the following reclassifications among the components of net assets at December 31, 2018:
Total
Accumulated
Loss
(000) | | Paid-in
Capital
(000) | |
| $ | 59 | | | $ | (59 | ) | |
At December 31, 2018, the Fund had no distributable earnings on a tax basis.
At December 31, 2018, the Fund had available for federal income tax purposes unused short-term capital losses of approximately $1,496,000 that do not have an expiration date.
To the extent that capital loss carryforwards are used to offset any future capital gains realized, no capital gains tax liability will be incurred by the Fund for gains realized and not distributed. To the extent that capital gains are offset, such gains will not be distributed to the shareholders.
Qualified late year losses are capital losses and specified ordinary losses, including currency losses, incurred after October 31 but within the taxable year that, if elected, are deemed to arise on the first day of the Fund's next taxable year. For the
year ended December 31, 2018, the Fund intends to defer to January 1, 2019 for U.S. federal income tax purposes the following losses:
Qualified
Late Year
Ordinary Losses
(000) | | Post-October
Capital Losses
(000) | |
| $ | 9 | | | $ | — | | |
I. Credit Facility: The Company and other Morgan Stanley funds participated in a $150,000,000 committed, unsecured revolving line of credit facility (the "Facility") with State Street. This Facility is to be used for temporary emergency purposes or funding of shareholder redemption requests. The interest rate on borrowings is based on the federal funds rate or 1 month LIBOR rate plus a spread. The Facility also has a commitment fee of 0.25% per annum based on the unused portion of the Facility. During the year ended December 31, 2018, the Fund did not have any borrowings under the Facility.
J. Other: At December 31, 2018, the Fund had record owners of 10% or greater. Investment activities of these shareholders could have a material impact on the Fund. The aggregate percentage of such owners was 60.5%.
26
Morgan Stanley Institutional Fund, Inc.
Annual Report — December 31, 2018
Report of Independent Registered Public Accounting Firm
To the Shareholders and Board of Directors of
Morgan Stanley Institutional Fund, Inc. —
Emerging Markets Small Cap Portfolio
Opinion on the Financial Statements
We have audited the accompanying statement of assets and liabilities of Emerging Markets Small Cap Portfolio (the "Fund") (one of the funds constituting the Morgan Stanley Institutional Fund, Inc. (the "Company")), including the portfolio of investments, as of December 31, 2018, and the related statement of operations for the year then ended, the statements of changes in net assets for each of the two years in the period then ended, the financial highlights for each of the three years in the period then ended and the period from December 15, 2015 (commencement of operations) through December 31, 2015 and the related notes (collectively referred to as the "financial statements"). In our opinion, the financial statements present fairly, in all material respects, the financial position of Emerging Markets Small Cap Portfolio (one of the funds constituting Morgan Stanley Institutional Fund, Inc.) at December 31, 2018, the results of its operations for the year then ended, the changes in its net assets for each of the two years in the period then ended and its financial highlights for each of the three years in the period then ended and the period from December 15, 2015 (commencement of operations) through December 31, 2015, in conformity with U.S. generally accepted accounting principles.
Basis for Opinion
These financial statements are the responsibility of the Company's management. Our responsibility is to express an opinion on the Fund's financial statements based on our audits. We are a public accounting firm registered with the Public Company Accounting Oversight Board (United States) ("PCAOB") and are required to be independent with respect to the Company in accordance with the U.S. federal securities law and the applicable rules and regulations of the Securities and Exchange Commission and the PCAOB.
We conducted our audits in accordance with the standards of the PCAOB. Those standards require that we plan and perform the audit to obtain reasonable assurance about whether the financial statements are free of material misstatement, whether due to error or fraud. The Company is not required to have, nor were we engaged to perform, an audit of the Company's internal control over financial reporting. As part of our audits, we are required to obtain an understanding of internal control over financial reporting, but not for the purpose of expressing an opinion on the effectiveness of the Company's internal control over financial reporting. Accordingly, we express no such opinion.
Our audits included performing procedures to assess the risks of material misstatement of the financial statements, whether due to error or fraud, and performing procedures that respond to those risks. Such procedures included examining, on a test basis, evidence regarding the amounts and disclosures in the financial statements. Our procedures included confirmation of securities owned as of December 31, 2018 by correspondence with the custodian and others or by other appropriate auditing procedures where replies from others were not received. Our audits also included evaluating the accounting principles used and significant estimates made by management, as well as evaluating the overall presentation of the financial statements. We believe that our audits provide a reasonable basis for our opinion.

We have served as the auditor of one or more Morgan Stanley investment companies since 2000.
Boston, Massachusetts
February 26, 2019
27
Morgan Stanley Institutional Fund, Inc.
Annual Report — December 31, 2018
Federal Tax Notice (unaudited)
For federal income tax purposes, the following information is furnished with respect to the distributions paid by the Fund during its taxable year ended December 31, 2018.
The Fund designated and paid approximately $892,000 as a long-term capital gain distribution.
In January, the Fund provides tax information to shareholders for the preceding calendar year.
28
Morgan Stanley Institutional Fund, Inc.
Annual Report — December 31, 2018
Privacy Notice (unaudited)
MORGAN STANLEY INVESTMENT MANAGEMENT INC.
AN IMPORTANT NOTICE CONCERNING OUR U.S. PRIVACY POLICY
We are required by federal law to provide you with a copy of our privacy policy annually. This policy applies to current and former individual investors in funds managed or sponsored by Morgan Stanley Investment Management Inc. ("MSIM") as well as current and former individual clients of MSIM. This policy is not applicable to partnerships, corporations, trusts or other non-individual clients or investors. Please note that we may amend this policy at any time, and will inform you of any changes as required by law.
WE RESPECT YOUR PRIVACY
We appreciate that you have provided us with your personal financial information. We strive to maintain the privacy of such information while we help you achieve your financial objectives. This Notice describes what non-public personal information we collect about you, why we collect it, when we may share it with others and how certain others may use it. It discusses the steps you may take to limit our sharing of certain information about you to affiliated companies in the Morgan Stanley family of companies ("other Morgan Stanley companies"). It also discloses how you may limit use of certain shared information for marketing purposes by other Morgan Stanley branded companies. Throughout this policy, we refer to the non-public information that personally identifies you or your accounts as "personal information."
1. WHAT PERSONAL INFORMATION DO WE COLLECT ABOUT YOU?
We obtain personal information from applications and other forms you submit to us, from your dealings with us, from consumer reporting agencies, from our Web sites and from third parties and other sources.
For example:
• We may collect information such as your name, address, e-mail address, telephone/fax numbers, assets, income and investment objectives through subscription documents, applications and other forms you submit to us.
• We may obtain information about account balances, your use of account(s) and the types of products and services you prefer to receive from us through your dealings and transactions with us and other sources.
• We may obtain information about your creditworthiness and credit history from consumer reporting agencies.
• We may collect background information from and through third-party vendors to verify representations you have made and to comply with various regulatory requirements.
• If you interact with us through our public and private Web sites, we may collect information that you provide directly through online communications (such as an e-mail address). We may also collect information about your Internet service provider, your domain name, your computer's operating system and Web browser, your use of our Web sites and your product and service preferences, through the use of "cookies." Please consult the Terms of Use of these sites for more details.
2. WHEN DO WE DISCLOSE PERSONAL INFORMATION WE COLLECT ABOUT YOU?
We may disclose personal information we collect about you to other Morgan Stanley companies and to non-affiliated third parties.
a. Information We Disclose to Other Morgan Stanley Companies.
We may disclose personal information to other Morgan Stanley companies for a variety of reasons, including to manage your account(s) effectively, to service and process your transactions, to let you know about products and services offered by us and other Morgan Stanley companies, to manage our business, and as otherwise required or permitted by law. Offers for products and services from other Morgan Stanley companies are developed under conditions designed to safeguard your personal information.
29
Morgan Stanley Institutional Fund, Inc.
Annual Report — December 31, 2018
Privacy Notice (unaudited) (cont'd)
b. Information We Disclose to Non-affiliated Third Parties.
We do not disclose personal information that we collect about you to non-affiliated third parties except to those who provide marketing services on our behalf, to financial institutions with whom we have joint marketing agreements, and as otherwise required or permitted by law. For example, we may disclose personal information to non-affiliated third parties for servicing and processing transactions, to offer our own products and services, to protect against fraud, for institutional risk control, to respond to judicial process or to perform services on our behalf. When we share personal information with a non-affiliated third party, they are required to limit their use of personal information to the particular purpose for which it was shared and they are not allowed to share personal information with others except to fulfill that limited purpose or as may be permitted or required by law.
3. HOW DO WE PROTECT THE SECURITY AND CONFIDENTIALITY OF PERSONAL INFORMATION WE COLLECT ABOUT YOU?
We maintain physical, electronic and procedural security measures to help safeguard the personal information we collect about you. We have internal policies governing the proper handling of client information. Third parties that provide support or marketing services on our behalf may also receive personal information, and we require them to adhere to confidentiality standards with respect to such information.
4. HOW CAN YOU LIMIT THE SHARING OF CERTAIN TYPES OF PERSONAL INFORMATION WITH OTHER MORGAN STANLEY COMPANIES?
We offer you choices as to whether we share with other Morgan Stanley companies the personal information that was collected to determine your eligibility for products and services you request ("eligibility information"). Eligibility information does not include your identification information or personal information pertaining to our transactions or experiences with you. Please note that, even if you direct us not to share eligibility information with other Morgan Stanley companies ("opt-out"), we may still share personal information, including eligibility information, with those companies in circumstances excluded from the opt-out under applicable law, such as to process transactions or to service your account.
5. HOW CAN YOU LIMIT THE USE OF CERTAIN TYPES OF PERSONAL INFORMATION BY OTHER MORGAN STANLEY COMPANIES FOR MARKETING?
By following the opt-out instructions in Section 6 below, you may limit other Morgan Stanley branded companies from marketing their products or services to you based on personal information we disclose to them. This information may include, for example, your income and account history with us. Please note that, even if you choose to limit Other Morgan Stanley Companies from using personal information about you that we may share with them for marketing their products and services to you, Other Morgan Stanley Companies may use your personal information that they obtain from us to market to you in circumstances permitted by law, such as if the Other Morgan Stanley Company has its own relationship with you.
6. HOW CAN YOU SEND US AN OPT-OUT INSTRUCTION?
If you wish to limit our sharing of eligibility information about you with other Morgan Stanley companies or other Morgan Stanley companies' use of personal information for marketing purposes, as described in this notice, you may do so by:
• Calling us at (800) 548-7786
Monday–Friday between 8a.m. and 6p.m.(EST)
• Writing to us at the following address:
DST Asset Manager Solutions, Inc.
c/o Privacy Coordinator
P.O. Box 219804
Kansas City, Missouri 64121
30
Morgan Stanley Institutional Fund, Inc.
Annual Report — December 31, 2018
Privacy Notice (unaudited) (cont'd)
Your written request should include your name, address, telephone number and account number(s) to which the opt-out applies and whether you are opting out with respect to sharing of eligibility information (Section 4 above), or if information used for Marketing (Section 5 above) or both. Written opt-out requests should not be sent with any other correspondence. In order to process your request, we require that the request be provided by you directly and not through a third party.
Your opt-out preference will remain in effect with respect to this policy (as it may be amended) until you notify us otherwise. If you have a joint account, your direction for us not to share this information with other Morgan Stanley companies and for those other Morgan Stanley companies not to use your personal information for marketing will be applied to all account holders on that account. Please understand that if you limit our sharing or our affiliated companies' use of personal information, you and any joint account holder(s) may not receive information about Morgan Stanley products and services, including products or services that could help you manage your financial resources and achieve your investment objectives.
7. WHAT IF AN AFFILIATED COMPANY BECOMES A NON-AFFILIATED THIRD PARTY?
If, at any time in the future, an affiliated company becomes a non-affiliated third party, further disclosures of personal information made to the former affiliated company will be limited to those described in Section 2(b) above relating to non-affiliated third parties. If you elected under Section 6 to limit disclosures we make to affiliated companies, or use of personal information by affiliated companies, your election will not apply to use by any former affiliated company of your personal information in their possession once it becomes a non-affiliated third party.
SPECIAL NOTICE TO RESIDENTS OF VERMONT
The following section supplements our Policy with respect to our individual clients who have a Vermont address and supersedes anything to the contrary in the above Policy with respect to those clients only.
The state of Vermont requires financial institutions to obtain your consent prior to sharing personal information that they collect about you with affiliated companies and non-affiliated third parties other than in certain limited circumstances. Except as permitted by law, we will not share personal information we collect about you with non-affiliated third parties or other Morgan Stanley companies unless you provide us with your written consent to share such information ("opt-in").
If you wish to receive offers for investment products and services offered by or through other Morgan Stanley companies, please notify us in writing at the following address:
DST Asset Manager Solutions, Inc.
c/o Privacy Coordinator
P.O. Box 219804
Kansas City, Missouri 64121
Your authorization should include your name, address, telephone number and account number(s) to which the opt-in applies and should not be sent with any other correspondence. In order to process your authorization, we require that the authorization be provided by you directly and not through a third party.
SPECIAL NOTICE TO RESIDENTS OF CALIFORNIA
The following section supplements our Policy with respect to our individual clients who have a California address and supersedes anything to the contrary in the above Policy with respect to those clients only.
In response to a California law, if your account has a California home address, your personal information will not be disclosed to non-affiliated third parties except as permitted by applicable California law, and we will limit sharing such information with our affiliates to comply with California privacy laws that apply to us.
31
Morgan Stanley Institutional Fund, Inc.
Annual Report — December 31, 2018
Director and Officer Information (unaudited)
Independent Directors:
Name, Age and Address of
Independent Director | | Position(s)
Held with
Registrant | | Length of Time
Served* | | Principal Occupation(s) During Past 5 Years
and Other Relevant Professional Experience | | Number of
Portfolios in
Fund Complex
Overseen by
Independent
Director** | | Other Directorships
Held by Independent
Director*** | |
Frank L. Bowman (74)
c/o Perkins Coie LLP
Counsel to the Independent
Directors
30 Rockefeller Plaza
New York, NY 10112 | | Director | | Since
August
2006 | | President, Strategic Decisions, LLC (consulting) (since February 2009); Director or Trustee of various Morgan Stanley Funds (since August 2006); Chairperson of the Compliance and Insurance Committee (since October 2015); formerly, Chairperson of the Insurance Sub-Committee of the Compliance and Insurance Committee (2007-2015); served as President and Chief Executive Officer of the Nuclear Energy Institute (policy organization) (February 2005-November 2008); retired as Admiral, U.S. Navy after serving over 38 years on active duty including 8 years as Director of the Naval Nuclear Propulsion Program in the Department of the Navy and the U.S. Department of Energy (1996-2004); served as Chief of Naval Personnel (July 1994-September 1996) and on the Joint Staff as Director of Political Military Affairs (June 1992-July 1994); knighted as Honorary Knight Commander of the Most Excellent Order of the British Empire; awarded the Officier de l'Orde National du Mérite by the French Government; elected to the National Academy of Engineering (2009). | | | 82 | | | Director of BP p.l.c.; Director of Naval and Nuclear Technologies LLP; Director Emeritus of the Armed Services YMCA; Member of the National Security Advisory Council of the Center for U.S. Global Engagement and a member of the CNA Military Advisory Board; Trustee of Fairhaven United Methodist Church; Member of the Board of Advisors of the Dolphin Scholarship Foundation; and Director of other various non-profit organizations. | |
Kathleen A. Dennis (65)
c/o Perkins Coie LLP
Counsel to the Independent Directors
30 Rockefeller Plaza
New York, NY 10112 | | Director | | Since
August
2006 | | President, Cedarwood Associates (mutual fund and investment management consulting) (since July 2006); Chairperson of the Liquidity and Alternatives Sub-Committee of the Investment Committee (since October 2006) and Director or Trustee of various Morgan Stanley Funds (since August 2006); formerly, Senior Managing Director of Victory Capital Management (1993-2006). | | | 82 | | | Director of various non-profit organizations. | |
Nancy C. Everett (63)
c/o Perkins Coie LLP
Counsel to the Independent Directors
30 Rockefeller Plaza
New York, NY 10112 | | Director | | Since
January
2015 | | Chief Executive Officer, Virginia Commonwealth University Investment Company (since November 2015); Owner, OBIR, LLC (institutional investment management consulting) (since June 2014); formerly, Managing Director, BlackRock Inc. (February 2011-December 2013); and Chief Executive Officer, General Motors Asset Management (a/k/a Promark Global Advisors, Inc.) (June 2005-May 2010). | | | 83 | | | Formerly, Member of Virginia Commonwealth University School of Business Foundation (2005-2016); Member of Virginia Commonwealth University Board of Visitors (2013-2015); Member of Committee on Directors for Emerging Markets Growth Fund, Inc. (2007-2010); Chairperson of Performance Equity Management, LLC (2006-2010); and Chairperson, GMAM Absolute Return Strategies Fund, LLC (2006-2010). | |
32
Morgan Stanley Institutional Fund, Inc.
Annual Report — December 31, 2018
Director and Officer Information (unaudited) (cont'd)
Independent Directors: (cont'd)
Name, Age and Address of
Independent Director | | Position(s)
Held with
Registrant | | Length of Time
Served* | | Principal Occupation(s) During Past 5 Years
and Other Relevant Professional Experience | | Number of
Portfolios in
Fund Complex
Overseen by
Independent
Director** | | Other Directorships
Held by Independent
Director*** | |
Jakki L. Haussler (61)
c/o Perkins Coie LLP
Counsel to the Independent Directors
30 Rockefeller Plaza
New York, NY 10112 | | Director | | Since
January
2015 | | Chairman and Chief Executive Officer, Opus Capital Group (since January 1996); formerly, Director, Capvest Venture Fund, LP (May 2000-December 2011); Partner, Adena Ventures, LP (July 1999-December 2010); Director, The Victory Funds (February 2005-July 2008). | | | 83 | | | Director of Service Corporation International and Member, Audit Committee and Investment Committee; Director of Cincinnati Bell Inc. and Member, Audit Committee and Governance and Nominating Committee; Chairman of Northern Kentucky University Member Investment Committee; Member of Chase College of Law Transactional Law Practice Center Board of Advisors; Director of Best Transport; Director of Chase College of Law Board of Visitors; formerly, Member, University of Cincinnati Foundation Investment Committee; Member, Miami University Board of Visitors (2008-2011); Trustee of Victory Funds (2005-2008) and Chairman, Investment Committee (2007-2008) and Member, Service Provider Committee (2005-2008). | |
Dr. Manuel H. Johnson (69)
c/o Johnson Smick
International, Inc.
220 I Street, NE — Suite 200
Washington, D.C. 20002 | | Director | | Since
July
1991 | | Senior Partner, Johnson Smick International, Inc. (consulting firm); Chairperson of the Investment Committee (since October 2006) and Director or Trustee of various Morgan Stanley Funds (since July 1991); Co-Chairman and a founder of the Group of Seven Council (G7C) (international economic commission); formerly, Chairperson of the Audit Committee (July 1991-September 2006), Vice Chairman of the Board of Governors of the Federal Reserve System and Assistant Secretary of the U.S. Treasury. | | | 82 | | | Director of NVR, Inc. (home construction). | |
Joseph J. Kearns (76)
c/o Perkins Coie LLP
Counsel to the Independent Directors
30 Rockefeller Plaza
New York, NY 10112 | | Director | | Since
August
1994 | | Senior Adviser, Kearns & Associates LLC (investment consulting); Chairperson of the Audit Committee (since October 2006) and Director or Trustee of various Morgan Stanley Funds (since August 1994); formerly, Deputy Chairperson of the Audit Committee (July 2003-September 2006) and Chairperson of the Audit Committee of various Morgan Stanley Funds (since August 1994); CFO of the J. Paul Getty Trust. | | | 83 | | | Prior to August 10, 2016, Director of Electro Rent Corporation (equipment leasing); Prior to December 31, 2013, Director of The Ford Family Foundation. | |
33
Morgan Stanley Institutional Fund, Inc.
Annual Report — December 31, 2018
Director and Officer Information (unaudited) (cont'd)
Independent Directors: (cont'd)
Name, Age and Address of
Independent Director | | Position(s)
Held with
Registrant | | Length of Time
Served* | | Principal Occupation(s) During Past 5 Years
and Other Relevant Professional Experience | | Number of
Portfolios in
Fund Complex
Overseen by
Independent
Director** | | Other Directorships
Held by Independent
Director*** | |
Michael F. Klein (60)
c/o Perkins Coie LLP
Counsel to the Independent Directors
30 Rockefeller Plaza
New York, NY 10112 | | Director | | Since
August
2006 | | Managing Director, Aetos Alternatives Management, LP (since March 2000); Co-President, Aetos Alternatives Management, LP (since January 2004) and Co-Chief Executive Officer of Aetos Alternatives Management, LP (since August 2013); Chairperson of the Fixed Income Sub-Committee of the Investment Committee (since October 2006) and Director or Trustee of various Morgan Stanley Funds (since August 2006); formerly, Managing Director, Morgan Stanley & Co. Inc. and Morgan Stanley Dean Witter Investment Management and President, various Morgan Stanley Funds (June 1998-March 2000); Principal, Morgan Stanley & Co. Inc. and Morgan Stanley Dean Witter Investment Management (August 1997-December 1999). | | | 82 | | | Director of certain investment funds managed or sponsored by Aetos Alternatives Management, LP; Director of Sanitized AG and Sanitized Marketing AG (specialty chemicals). | |
Patricia Maleski (58)
c/o Perkins Coie LLP
Counsel to the Independent Directors
30 Rockefeller Plaza
New York, NY 10112 | | Director | | Since
January
2017 | | Managing Director, JPMorgan Asset Management (2004-2016); Oversight and Control Head of Fiduciary and Conflicts of Interest Program (2015-2016); Chief Control Officer-Global Asset Management (2013-2015); President, JPMorgan Funds (2010-2013); Chief Administrative Officer (2004-2013); various other positions including Treasurer and Board Liaison (since 2001). | | | 83 | | | None. | |
Michael E. Nugent (82)
522 Fifth Avenue
New York, NY 10036 | | Chair of the Board and Director | | Chair of the Boards since July 2006 and Director since July 1991 | | Chair of the Boards of various Morgan Stanley Funds (since July 2006); Chairperson of the Closed-End Fund Committee (since June 2012) Governance Committee (since January 2019) and Director or Trustee of various Morgan Stanley Funds (since July 1991); formerly, Chairperson of the Insurance Committee (until July 2006); General Partner, Triumph Capital, L.P. (private investment partnership) (1988-2013). | | | 82 | | | None. | |
W. Allen Reed (71)
c/o Perkins Coie LLP
Counsel to the Independent Directors
30 Rockefeller Plaza
New York, NY 10112 | | Director | | Since
August
2006 | | Chairperson of the Equity Sub-Committee of the Investment Committee (since October 2006) and Director or Trustee of various Morgan Stanley Funds (since August 2006); formerly, President and CEO of General Motors Asset Management; Chairman and Chief Executive Officer of the GM Trust Bank and Corporate Vice President of General Motors Corporation (August 1994-December 2005). | | | 82 | | | Director of Legg Mason, Inc.; formerly, Director of the Auburn University Foundation (2010-2015). | |
Fergus Reid (86)****
c/o Joe Pietryka, Inc.
85 Charles Colman Blvd.
Pawling, NY 12564 | | Director | | Since
June
1992 | | Chairman, Joe Pietryka, Inc.; Chairperson of the Governance Committee and Director or Trustee of various Morgan Stanley Funds (since June 1992). | | | 83 | | | Formerly, Trustee and Director of certain investment companies in the JP Morgan Fund Complex managed by JP Morgan Investment Management Inc. (1987-2012). | |
* This is the earliest date the Director began serving the Morgan Stanley Funds. Each Director serves an indefinite term, until his or her successor is elected.
** The Fund Complex includes (as of December 31, 2018) all open-end and closed-end funds (including all of their portfolios) advised by Morgan Stanley Investment Management Inc. (the "Adviser") and any funds that have an adviser that is an affiliated person of the Adviser (including, but not limited to, Morgan Stanley AIP GP LP).
*** This includes any directorships at public companies and registered investment companies held by the Director at any time during the past five years.
**** Effective date of retirement is December 31, 2018.
34
Morgan Stanley Institutional Fund, Inc.
Annual Report — December 31, 2018
Director and Officer Information (unaudited) (cont'd)
Executive Officers:
Name, Age and Address of Executive Officer | | Position(s) Held
with
Registrant | | Length of Time
Served* | | Principal Occupation(s) During Past 5 Years | |
John H. Gernon (55)
522 Fifth Avenue
New York, NY 10036 | | President and Principal Executive Officer | | Since
September
2013 | | President and Principal Executive Officer of the Equity and Fixed Income Funds and the Morgan Stanley AIP Funds (since September 2013) and the Liquidity Funds and various money market funds (since May 2014) in the Fund Complex; Managing Director of the Adviser; Head of Product (since 2006). | |
Timothy J. Knierim (59)
522 Fifth Avenue
New York, NY 10036 | | Chief Compliance Officer | | Since
December
2016 | | Managing Director of the Adviser and various entities affiliated with the Adviser; Chief Compliance Officer of various Morgan Stanley Funds and the Adviser (since December 2016) and Chief Compliance Officer of Morgan Stanley AIP GP LP (since 2014). Formerly, Managing Director and Deputy Chief Compliance Officer of the Adviser (2014-2016); and formerly, Chief Compliance Officer of Prudential Investment Management, Inc. (2007-2014). | |
Francis J. Smith (53)
522 Fifth Avenue
New York, NY 10036 | | Treasurer and Principal Financial Officer | | Treasurer since July 2003 and Principal Financial Officer since September 2002 | | Managing Director of the Adviser and various entities affiliated with the Adviser; Treasurer (since July 2003) and Principal Financial Officer of various Morgan Stanley Funds (since September 2002). | |
Mary E. Mullin (51)
522 Fifth Avenue
New York, NY 10036 | | Secretary | | Since
June
1999 | | Managing Director of the Adviser; Secretary of various Morgan Stanley Funds (since June 1999). | |
Michael J. Key (39)
522 Fifth Avenue
New York, NY 10036 | | Vice President | | Since
June
2017 | | Vice President of the Equity and Fixed Income Funds, Liquidity Funds, various money market funds and the Morgan Stanley AIP Funds in the Fund Complex (since June 2017); Executive Director of the Adviser; Head of Product Development for Equity and Fixed Income Funds (since August 2013). | |
* This is the earliest date the officer began serving the Morgan Stanley Funds. Each officer serves a one-year term, until his or her successor is elected and qualifies.
35
Morgan Stanley Institutional Fund, Inc.
Annual Report — December 31, 2018
Adviser and Administrator
Morgan Stanley Investment Management Inc.
522 Fifth Avenue
New York, New York 10036
Distributor
Morgan Stanley Distribution, Inc.
522 Fifth Avenue
New York, New York 10036
Dividend Disbursing and Transfer Agent
DST Asset Manager Solutions, Inc.
2000 Crown Colony Drive
Quincy, Massachusetts 02169
Custodian
State Street Bank and Trust Company
One Lincoln Street
Boston, Massachusetts 02111
Legal Counsel
Dechert LLP
1095 Avenue of the Americas
New York, New York 10036
Counsel to the Independent Directors
Perkins Coie LLP
30 Rockefeller Plaza
New York, New York 10112
Independent Registered Public Accounting Firm
Ernst & Young LLP
200 Clarendon Street
Boston, Massachusetts 02116
Reporting to Shareholders
Each Morgan Stanley fund provides a complete schedule of portfolio holdings in its semi-annual and the annual reports within 60 days of the end of the fund's second and fourth fiscal quarters. The semi-annual and annual reports are filed electronically with the Securities and Exchange Commission ("SEC") on Form N-CSRS and Form N-CSR, respectively. Morgan Stanley also delivers the semi-annual and annual reports to fund shareholders and makes these reports available on its public website, www.morganstanley.com/im/shareholderreports. Each Morgan Stanley fund also files a complete schedule of portfolio holdings with the SEC for the fund's first and third fiscal quarters on Form N-Q. Morgan Stanley does not deliver the reports for the first and third fiscal quarters to shareholders, nor are the reports posted to the Morgan Stanley public website. You may, however, obtain the Form N-Q filings (as well as the Form N-CSR and N-CSRS filings) by accessing the SEC's website, www.sec.gov. You can also request copies of these materials, upon payment of a duplicating fee, by electronic request at the SEC's email address (publicinfo@sec.gov).
Proxy Voting Policies and Procedures and Proxy Voting Record
You may obtain a copy of the Company's Proxy Voting Policy and Procedures and information regarding how the Company voted proxies relating to portfolio securities during the most recent twelve-month period ended June 30, without charge, upon request, by calling toll free 1 (800) 548-7786 or by visiting our website at www.morganstanley.com/im/shareholderreports. This information is also available on the SEC's website at www.sec.gov.
This report is authorized for distribution only when preceded or accompanied by a prospectus or summary prospectus of the applicable Fund of Morgan Stanley Institutional Fund, Inc., which describes in detail the Fund's investment policies, risks, fees and expenses. Please read the prospectus carefully before you invest or send money. For additional information, including information regarding the investments comprising the Fund, please visit our website at www.morganstanley.com/im/shareholderreports or call toll free 1 (800) 548-7786.
36
Printed in U.S.A.
This Report has been prepared for shareholders and may be distributed to others only if preceded or accompanied by a current prospectus.
Morgan Stanley Investment Management Inc.
522 Fifth Avenue
New York, New York 10036
© 2019 Morgan Stanley. Morgan Stanley Distribution, Inc.

IFIEMSCANN
2401007 EXP. 02.29.20

Morgan Stanley Institutional Fund, Inc.
Frontier Markets Portfolio
Annual Report
December 31, 2018
Beginning on January 1, 2021, as permitted by regulations adopted by the Securities and Exchange Commission ("SEC"), paper copies of the Fund's Annual and Semi-Annual Reports to Shareholders ("Shareholder Reports") will no longer be sent by mail, unless you specifically request paper copies of the Shareholder Reports from the Fund or from your financial intermediary, such as a broker-dealer or a bank. Instead, the Shareholder Reports will be made available on the Fund's website, https://www.morganstanley.com/im/shareholderreports and you will be notified by mail each time a Shareholder Report is posted and provided with a website link to access the Shareholder Report. If you already elected to receive Shareholder Reports electronically, you will not be affected by this change and you need not take any action. You may elect to receive Shareholder Reports and other communications from the Fund electronically anytime by contacting your financial intermediary or, if you are a direct investor, please follow the instructions on the envelope.
Beginning on January 1, 2019, you may elect to receive all future Shareholder Reports in paper free of charge. If you invest through a financial intermediary, you can contact your financial intermediary to request that you continue to receive paper copies of your Shareholder Reports. If you invest directly with the Fund, please follow the instructions on the envelope to let the Fund know you wish to continue receiving paper copies of your Shareholder Reports. Your election to receive Shareholder Reports in paper will apply to all funds held in your account if you invest through your financial intermediary or all funds held with the fund complex if you invest directly with a fund.

Morgan Stanley Institutional Fund, Inc.
Annual Report — December 31, 2018
Shareholders' Letter | | | 2 | | |
Expense Example | | | 3 | | |
Investment Overview | | | 4 | | |
Portfolio of Investments | | | 7 | | |
Statement of Assets and Liabilities | | | 9 | | |
Statement of Operations | | | 11 | | |
Statements of Changes in Net Assets | | | 12 | | |
Financial Highlights | | | 14 | | |
Notes to Financial Statements | | | 19 | | |
Report of Independent Registered Public Accounting Firm | | | 26 | | |
Federal Tax Notice | | | 27 | | |
Privacy Notice | | | 28 | | |
Director and Officer Information | | | 31 | | |
This report is authorized for distribution only when preceded or accompanied by a prospectus or summary prospectus of the applicable Fund of Morgan Stanley Institutional Fund, Inc. To receive a prospectus and/or statement of additional information (SAI), which contains more complete information such as investment objectives, charges, expenses, policies for voting proxies, risk considerations and describes in detail each of the Fund's investment policies to the prospective investor, please call toll free 1 (800) 548-7786. Please read the prospectuses carefully before you invest or send money.
Additionally, you can access information about the Fund including performance, characteristics and investment team commentary, through Morgan Stanley Investment Management's website: www.morganstanley.com/im/shareholderreports.
Market forecasts provided in this report may not necessarily come to pass. There is no guarantee that any sectors mentioned will continue to perform as discussed herein or that securities in such sectors will be held by the Fund in the future. There is no assurance that a fund will achieve its investment objective. Funds are subject to market risk, which is the possibility that market values of securities owned by the Fund will decline and, therefore, the value of the Fund's shares may be less than what you paid for them. Accordingly, you can lose money investing in this Fund. Please see the prospectus for more complete information on investment risks.
1
Morgan Stanley Institutional Fund, Inc.
Annual Report — December 31, 2018
Shareholders' Letter (unaudited)
Dear Shareholders,
We are pleased to provide this Annual report, in which you will learn how your investment in Frontier Markets Portfolio (the "Fund") performed during the latest twelve-month period.
Morgan Stanley Investment Management is a client-centric, investor-led organization. Our global presence, intellectual capital, and breadth of products and services enable us to partner with investors to meet the evolving challenges of today's financial markets. We aim to deliver superior investment service and to empower our clients to make the informed decisions that help them reach their investment goals.
As always, we thank you for selecting Morgan Stanley Investment Management, and look forward to working with you in the months and years ahead.
Sincerely,

John H. Gernon
President and Principal Executive Officer
January 2019
2
Morgan Stanley Institutional Fund, Inc.
Annual Report — December 31, 2018
Expense Example (unaudited)
Frontier Markets Portfolio
As a shareholder of the Fund, you incur two types of costs: (1) transactional costs, including redemption fees; and (2) ongoing costs, which may include advisory fees, administration fees, distribution and shareholder services fees and other Fund expenses. This example is intended to help you understand your ongoing costs (in dollars) of investing in the Fund and to compare these costs with the ongoing costs of investing in other mutual funds.
This example is based on an investment of $1,000 invested at the beginning of the six-month period ended December 31, 2018 and held for the entire six-month period.
Actual Expenses
The table below provides information about actual account values and actual expenses. You may use the information in this table, together with the amount you invested, to estimate the expenses that you paid over the period. Simply divide your account value by $1,000 (for example, an $8,600 account value divided by $1,000 = 8.6), then multiply the result by the number in the table under the heading entitled "Actual Expenses Paid During Period" to estimate the expenses you paid on your account during this period.
Hypothetical Example for Comparison Purposes
The table below provides information about hypothetical account values and hypothetical expenses based on the Fund's actual expense ratio and an assumed rate of return of 5% per year before expenses, which is not the Fund's actual return. The hypothetical account values and expenses may not be used to estimate the actual ending account balance or expenses you paid for the period. You may use this information to compare the ongoing costs of investing in the Fund and other funds. To do so, compare this 5% hypothetical example with the 5% hypothetical examples that appear in the shareholder reports of the other funds.
Please note that the expenses shown in the table are meant to highlight your ongoing costs only and do not reflect any transactional costs, such as sales charges (loads) and redemption fees. Therefore, the information for each class in the table is useful in comparing ongoing costs only, and will not help you determine the relative total costs of owning different funds. In addition, if these transactional costs were included, your costs would have been higher.
| | | Beginning
Account
Value
7/1/18 | | Actual Ending
Account
Value
12/31/18 | | Hypothetical
Ending Account
Value | | Actual
Expenses
Paid
During
Period* | | Hypothetical
Expenses Paid
During Period* | | Net
Expense
Ratio
During
Period** | |
Frontier Markets Portfolio Class I | | $ | 1,000.00 | | | $ | 887.20 | | | $ | 1,015.73 | | | $ | 8.94 | | | $ | 9.55 | | | | 1.88 | % | |
Frontier Markets Portfolio Class A | | | 1,000.00 | | | | 885.90 | | | | 1,014.22 | | | | 10.36 | | | | 11.07 | | | | 2.18 | | |
Frontier Markets Portfolio Class L | | | 1,000.00 | | | | 883.80 | | | | 1,011.90 | | | | 12.54 | | | | 13.39 | | | | 2.64 | | |
Frontier Markets Portfolio Class C | | | 1,000.00 | | | | 882.10 | | | | 1,010.49 | | | | 13.85 | | | | 14.80 | | | | 2.92 | | |
Frontier Markets Portfolio Class IS | | | 1,000.00 | | | | 886.70 | | | | 1,015.17 | | | | 9.46 | | | | 10.11 | | | | 1.99 | | |
* Expenses are calculated using each Fund Class' annualized net expense ratio (as disclosed), multiplied by the average account value over the period and multiplied by 184/365 (to reflect the most recent one-half year period).
** Annualized.
3
Morgan Stanley Institutional Fund, Inc.
Annual Report — December 31, 2018
Investment Overview (unaudited)
Frontier Markets Portfolio
The Fund seeks long-term capital appreciation.
Performance
For the fiscal year ended December 31, 2018, the Fund's Class I shares had a total return based on net asset value and reinvestment of distributions per share of –22.60%, net of fees. The Fund's Class I shares underperformed the Fund's benchmark, the MSCI Frontier Markets Index (the "Index"), which returned –16.41%.
Factors Affecting Performance
• The MSCI Frontier Markets Index (–16.41%) underperformed the MSCI Emerging Markets Index (–14.57%). Within the Index, Kuwait (+15.42%), Tunisia (+13.38%), Serbia (+2.56%) and Romania (+1.75%) led market returns. Argentina (–50.84%) was the worst-performing market as it suffered currency weakness in April and again in August. Mauritius (–21.28%), Bangladesh (–14.72%) and Nigeria (–14.34%) also underperformed in the region.
• Argentina was the biggest headwind to the Fund in the second and third quarters of 2018. Argentina experienced a swift rate and currency adjustment beginning in late April that passed through to higher inflation and forecasts for slower growth for the rest of 2018. The central bank hiked interest rates to 60% at the end of August, which resulted in banks selling off by an average of 60% in U.S. dollar terms for the year.(i)
• The Fund's allocation to a South African mobile operator also detracted from performance. We had been positive on its operations in Nigeria, as we believed the company would benefit from an improving macro story in the country, currency stability and foreign exchange availability, and weakened competition. However, at the end of August its Nigeria subsidiary was hit with two large regulatory and taxation issues. Given the heightened political risk in Nigeria and lack of clarity on the future of the company's Nigerian business, we exited the position.
• The Fund has not been invested in Bahrain because the country remains dependent on the Gulf
Cooperation Council (GCC) and suffers from weak macro fundamentals, with twin deficits and critically low levels of reserves. Bahrain outperformed during the year on the back of two event-driven rallies. In June the GCC announced measures to support Bahrain and in July a Kuwait bank and a Bahrain bank, which is the largest constituent of the MSCI Bahrain Index, began merger talks that would potentially create one of the Gulf's largest Islamic banks.
• The Fund's underweight allocation to Romania and stock selection in Vietnam hampered returns. From a sector perspective, stock selection in financials, real estate and communication services detracted from performance.
• The Fund's allocations to Saudi Arabia, Qatar, Hungary and Egypt contributed to performance. Our underweight allocation to Senegal also contributed. From a sector perspective, our stock selection in and underweight allocation to utilities and stock selection in industrials and consumer discretionary added to returns.
Management Strategies
• We remain positive on the opportunity in frontier markets (FM) as the global growth reset should see higher upside in frontier. Frontier gross domestic product (GDP) growth should start to accelerate in 2019, picking up from 2.9% in 2018 to 3.2% in 2019 and 3.6% in 2020.(ii) During this time emerging markets (EM) ex-China economies are expected to see growth stable at 3.3%.(iii) The last time we saw a narrowing then widening of the GDP growth differential between FM and EM economies was in 2013-2015 when FM equities outperformed EM equities materially.
• Frontier markets debt levels in aggregate are much lower than EM, allowing policymakers to use credit creation to support economic expansion. Frontier countries are also less exposed to a trade war, given their low percentage of total exports to China. Excluding oil, total frontier exports to China is only 8% versus 15% for emerging markets countries.(iv) Given this, if there is a trade war and China growth
(i) Source: Blomberg L.P.
(ii) Source: International Monetary Fund
(iii) Source: Haver Analytics, Morgan Stanley Investment Management
(iv) Source: Haver Analytics
4
Morgan Stanley Institutional Fund, Inc.
Annual Report — December 31, 2018
Investment Overview (unaudited) (cont'd)
Frontier Markets Portfolio
slows, FM countries should be more insulated, and some economies such as Vietnam could be net beneficiaries of manufacturing moving out of China over the medium term.
• Frontier currencies are now in aggregate undervalued and back to the valuation levels of 2013, as virtually all FM currencies have had material adjustments with only two currencies left overvalued, the Bangladeshi taka and the Kenyan schilling. From a bottom-up perspective, frontier corporates are growing top-line faster with better returns than those in emerging markets. Frontier corporates are seeing higher sales growth and return on equity, and corporate debt-to-EBITDA (earnings before interest, taxes, depreciation and amortization) are at lower levels than emerging markets and developed markets.
• The correlation of frontier equities to other equity asset classes has fallen materially since peaking in 2013 and is now very low to MSCI Emerging Markets Index, MSCI All Country World Index and MSCI EAFE Index equities.(v) In addition, the volatility of frontier equities has remained significantly lower than Emerging Markets equities on a five-year basis.(v) Frontier markets have historically been a good way to diversify and reduce risk in a global equity allocation, and we believe this benefit is now even stronger.
• We continuously assess the growth levers providing tailwinds to frontier economies such as strong demographics with labor force growth sufficient for high GDP growth, an underpenetrated credit cycle, a relatively low level of private debt-to-GDP and healthy domestic demand. Many of the frontier markets are recovering off a low in GDP growth and experienced significant resets in the economy, including markets like Nigeria and select markets across the Middle East.
• From a thematic perspective, we continue to own and seek companies benefiting from healthy domestic demand, particularly in regards to health care, and select consumer discretionary and staples. We also see demand for financial services in countries with low credit penetration. We are seeking to minimize our exposure to countries highly dependent on trade as protectionism is increasingly part of the platform on new populist leaders.
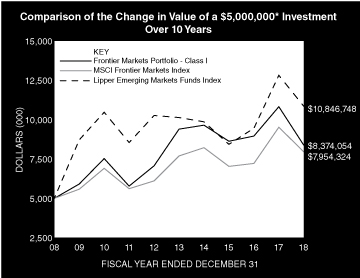
* Minimum Investment for Class I shares
In accordance with SEC regulations, the Fund's performance shown assumes that all recurring fees (including management fees) were deducted and all dividends and distributions were reinvested. The performance of Class A, L, C and IS shares will vary from the performance of Class I shares based upon their different inception dates and will be negatively impacted by additional fees assessed to those classes (if applicable).
5
Morgan Stanley Institutional Fund, Inc.
Annual Report — December 31, 2018
Investment Overview (unaudited) (cont'd)
Frontier Markets Portfolio
Performance Compared to the MSCI Frontier Markets Index(1) and the Lipper Emerging Markets Funds Index(2)
| | | Period Ended December 31, 2018
Total Returns(3) | |
| | | | | Average Annual | |
| | | One
Year | | Five
Years | | Ten
Years | | Since
Inception(8) | |
Fund — Class I Shares
w/o sales charges(4) | | | –22.60 | % | | | –2.28 | % | | | 5.29 | % | | | –0.48 | % | |
Fund — Class A Shares
w/o sales charges(5) | | | –22.80 | | | | –2.58 | | | | — | | | | 3.30 | | |
Fund — Class A Shares with
maximum 5.25% sales charges(5) | | | –26.84 | | | | –3.62 | | | | — | | | | 2.42 | | |
Fund — Class L Shares
w/o sales charges(5) | | | –23.19 | | | | –3.19 | | | | — | | | | 2.68 | | |
Fund — Class C Shares
w/o sales charges(7) | | | –23.42 | | | | — | | | | ��� | | | | –5.68 | | |
Fund — Class C Shares with
maximum 1.00% deferred
sales charges(7) | | | –24.18 | | | | — | | | | — | | | | –5.68 | | |
Fund — Class IS Shares
w/o sales charges(6) | | | –22.61 | | | | — | | | | — | | | | –3.76 | | |
MSCI Frontier Markets Index | | | –16.41 | | | | 0.67 | | | | 4.75 | | | | –1.96 | | |
Lipper Emerging Markets
Funds Index | | | –15.34 | | | | 1.38 | | | | 8.05 | | | | 2.33 | | |
Performance data quoted represents past performance, which is no guarantee of future results, and current performance may be lower or higher than the figures shown. Performance assumes that all dividends and distributions, if any, were reinvested. For the most recent month-end performance figures, please visit www.morganstanley.com/im/shareholderreports. Investment return and principal value will fluctuate so that Fund shares, when redeemed, may be worth more or less than their original cost. Total returns do not reflect the deduction of taxes that a shareholder would pay on Fund distributions or the redemption of Fund shares. Performance of share classes will vary due to difference in sales charges and expenses.
(1) The MSCI Frontier Markets Index is a free float-adjusted market capitalization index that is designed to measure equity market performance of frontier markets. The MSCI Frontier Markets Index currently consists of 29 frontier market country indices. The performance of the Index is calculated in U.S. dollars and assumes reinvestment of net dividends. Net total return indices reinvest dividends after the deduction of withholding taxes, using (for international indices) a tax rate applicable to non-resident institutional investors who do not benefit from double taxation treaties. The Index is unmanaged and its returns do not include any sales charges or fees. Such costs would lower performance. It is not possible to invest directly in an index.
(2) The Lipper Emerging Markets Funds Index is an equally weighted performance index of the largest qualifying funds (based on net assets) in the Lipper Emerging Markets Funds classification. The Index, which is adjusted for capital gains distributions and income dividends, is unmanaged and should not be considered an investment. There are currently 30 funds represented in this Index. As of the date of this report, the Fund is in the Lipper Emerging Markets Funds classification.
(3) Total returns for the Fund reflect fees waived and expenses reimbursed, if applicable, by Morgan Stanley Investment Management Inc. (the "Adviser"). Without such waivers and reimbursements, total returns would have been lower.
(4) On September 17, 2012, all assets of Morgan Stanley Frontier Emerging Markets Fund, Inc. (the "Predecessor Fund") were reorganized into Class I shares of Morgan Stanley Institutional Fund, Inc. Frontier Markets Portfolio ("the Fund"). Performance shown for Class I shares reflects the performance of the shares of the Predecessor Fund for periods prior to September 17, 2012. The Predecessor Fund may have performed differently if it were an open-end fund since closed-end funds are generally not subject to the cash flow fluctuations of an open-end fund. In addition, Class I shares' returns of the Fund will differ from the Predecessor Fund as they have different expenses. The Predecessor Fund commenced operations on August 25, 2008.
(5) Commenced offering on September 14, 2012.
(6) Commenced offering on February 27, 2015.
(7) Commenced offering on April 30, 2015.
(8) For comparative purposes, average annual since inception returns listed for the Indexes refer to the inception date of Class I of the Fund, not the inception of the Index.
6
Morgan Stanley Institutional Fund, Inc.
Annual Report — December 31, 2018
Portfolio of Investments
Frontier Markets Portfolio
| | | Shares | | Value
(000) | |
Common Stocks (97.2%) | |
Argentina (19.4%) | |
Arcos Dorados Holdings, Inc., Class A | | | 364,787 | | | $ | 2,882 | | |
Banco Macro SA ADR | | | 169,203 | | | | 7,482 | | |
Despegar.com Corp. (a) | | | 128,122 | | | | 1,590 | | |
Globant SA (a) | | | 126,560 | | | | 7,128 | | |
Grupo Financiero Galicia SA ADR | | | 329,764 | | | | 9,091 | | |
Grupo Supervielle SA ADR | | | 370,823 | | | | 3,219 | | |
Pampa Energia SA ADR (a) | | | 198,387 | | | | 6,311 | | |
Telecom Argentina SA ADR | | | 430,472 | | | | 6,698 | | |
YPF SA ADR | | | 614,145 | | | | 8,223 | | |
| | | | 52,624 | | |
Bangladesh (3.4%) | |
Beximco Pharmaceuticals Ltd. | | | 3,312,957 | | | | 3,108 | | |
Square Pharmaceuticals Ltd. | | | 2,056,390 | | | | 6,223 | | |
| | | | 9,331 | | |
Egypt (4.6%) | |
Commercial International Bank Egypt SAE | | | 1,083,505 | | | | 4,536 | | |
Egyptian Financial Group-Hermes Holding Co. (a) | | | 3,707,119 | | | | 3,115 | | |
Integrated Diagnostics Holdings PLC | | | 743,493 | | | | 3,089 | | |
Juhayna Food Industries | | | 2,632,972 | | | | 1,654 | | |
| | | | 12,394 | | |
Hungary (0.6%) | |
OTP Bank Nyrt | | | 38,239 | | | | 1,542 | | |
Indonesia (0.6%) | |
Mitra Adiperkasa Tbk PT | | | 27,431,100 | | | | 1,536 | | |
Kazakhstan (0.5%) | |
Halyk Savings Bank of Kazakhstan JSC GDR | | | 145,269 | | | | 1,502 | | |
Kenya (1.8%) | |
Safaricom PLC | | | 23,042,619 | | | | 5,032 | | |
Kuwait (20.3%) | |
Boubyan Bank KSCP | | | 3,011,725 | | | | 5,554 | | |
Humansoft Holding Co. KSC | | | 658,321 | | | | 7,115 | | |
Mobile Telecommunications Co. KSC | | | 9,521,799 | | | | 14,076 | | |
National Bank of Kuwait | | | 10,334,704 | | | | 28,382 | | |
| | | | 55,127 | | |
Morocco (5.4%) | |
Attijariwafa Bank | | | 209,784 | | | | 9,945 | | |
Societe d'Exploitation des Ports | | | 270,573 | | | | 4,643 | | |
| | | | 14,588 | | |
Nigeria (9.8%) | |
Dangote Cement PLC | | | 9,408,188 | | | | 4,910 | | |
Guaranty Trust Bank PLC | | | 98,813,684 | | | | 9,364 | | |
Nestle Nigeria PLC | | | 1,429,035 | | | | 5,838 | | |
Zenith Bank PLC | | | 102,706,344 | | | | 6,512 | | |
| | | | 26,624 | | |
Oman (1.1%) | |
Bank Muscat SAOG | | | 2,746,949 | | | | 2,883 | | |
Pakistan (1.1%) | |
MCB Bank Ltd. | | | 2,095,900 | | | | 2,929 | | |
| | | Shares | | Value
(000) | |
Panama (0.6%) | |
Copa Holdings SA, Class A | | | 21,263 | | | $ | 1,674 | | |
Romania (3.2%) | |
Banca Transilvania SA | | | 11,517,682 | | | | 5,684 | | |
Societatea Nationala de Gaze Naturale
ROMGAZ SA | | | 461,357 | | | | 3,153 | | |
| | | | 8,837 | | |
Saudi Arabia (2.3%) | |
Bupa Arabia for Cooperative Insurance Co. (a) | | | 147,581 | | | | 3,187 | | |
United International Transportation Co. (a) | | | 427,341 | | | | 3,002 | | |
| | | | 6,189 | | |
Sri Lanka (1.0%) | |
Commercial Bank of Ceylon PLC | | | 4,469,184 | | | | 2,810 | | |
Tanzania, United Republic of (0.9%) | |
NMB Bank PLC | | | 6,718,721 | | | | 2,556 | | |
Turkey (0.1%) | |
Coca-Cola Icecek AS | | | 54,343 | | | | 317 | | |
United Arab Emirates (2.8%) | |
Dubai Islamic Bank PJSC | | | 571,641 | | | | 778 | | |
First Abu Dhabi Bank PJSC | | | 788,476 | | | | 3,027 | | |
NMC Health PLC | | | 106,627 | | | | 3,728 | | |
| | | | 7,533 | | |
United Kingdom (0.7%) | |
Coca-Cola HBC AG (a) | | | 57,856 | | | | 1,800 | | |
United States (0.4%) | |
MercadoLibre, Inc. | | | 4,185 | | | | 1,226 | | |
Vietnam (16.6%) | |
Ho Chi Minh City Development Joint Stock
Commercial Bank | | | 2,170,720 | | | | 2,834 | | |
Masan Group Corp. (a) | | | 1,874,560 | | | | 6,265 | | |
Mobile World Investment Corp. | | | 619,463 | | | | 2,836 | | |
Sai Gon Cargo Service Corp. | | | 473,510 | | | | 2,939 | | |
Saigon Beer Alcohol Beverage Corp. | | | 419,670 | | | | 4,850 | | |
Vietjet Aviation JSC | | | 913,112 | | | | 4,735 | | |
Vietnam Dairy Products JSC | | | 1,512,744 | | | | 7,828 | | |
Vincom Retail JSC (a) | | | 4,958,873 | | | | 5,966 | | |
Vinhomes JSC (a) | | | 2,193,302 | | | | 6,942 | | |
| | | | 45,195 | | |
Total Common Stocks (Cost $262,822) | | | 264,249 | | |
Participation Notes (3.2%) | |
Saudi Arabia (3.2%) | |
Almarai Co. JSC, Equity Linked Notes,
expires 2/12/20 (a) | | | 235,180 | | | | 3,009 | | |
Jarir Marketing Co., Equity Linked Notes,
expires 1/19/21 (a) | | | 70,115 | | | | 2,841 | | |
Saudi British Bank, Equity Linked Notes,
expires 3/24/20 (a) | | | 339,681 | | | | 2,957 | | |
Total Participation Notes (Cost $8,125) | | | 8,807 | | |
The accompanying notes are an integral part of the financial statements.
7
Morgan Stanley Institutional Fund, Inc.
Annual Report — December 31, 2018
Portfolio of Investments (cont'd)
Frontier Markets Portfolio
| | | No. of
Warrants | | Value
(000) | |
Warrant (1.2%) | |
Saudi Arabia (1.2%) | |
National Commercial Bank, expires 10/21/20 (a)
(Cost $2,935) | | | 249,440 | | | $ | 3,182 | | |
Total Investments (101.6%) (Cost $273,882) (b)(c) | | | | | 276,238 | | |
Liabilities in Excess of Other Assets (–1.6%) | | | (4,365 | ) | |
Net Assets (100.0%) | | $ | 271,873 | | |
Country assignments and aggregations are based generally on third party vendor classifications and information, and may be different from the assignments and aggregations under the policies set forth in the Fund's prospectus and/or statement of additional information relating to geographic classifications.
(a) Non-income producing security.
(b) The approximate fair value and percentage of net assets, $208,725,000 and 76.8%, respectively, represent the securities that have been fair valued under the fair valuation policy for international investments as described in Note A-1 within the Notes to the Financial Statements.
(c) At December 31, 2018, the aggregate cost for federal income tax purposes is approximately $279,075,000. The aggregate gross unrealized appreciation is approximately $31,599,000 and the aggregate gross unrealized depreciation is approximately $34,437,000, resulting in net unrealized depreciation of approximately $2,838,000.
ADR American Depositary Receipt.
GDR Global Depositary Receipt.
PJSC Public Joint Stock Company.
Portfolio Composition
Classification | | Percentage of
Total Investments | |
Banks | | | 42.3 | % | |
Other* | | | 41.9 | | |
Food Products | | | 8.9 | | |
Wireless Telecommunication Services | | | 6.9 | | |
Total Investments | | | 100.0 | % | |
* Industries and/or investment types representing less than 5% of total investments.
The accompanying notes are an integral part of the financial statements.
8
Morgan Stanley Institutional Fund, Inc.
Annual Report — December 31, 2018
Frontier Markets Portfolio
Statement of Assets and Liabilities | | December 31, 2018
(000) | |
Assets: | |
Investments in Securities of Unaffiliated Issuers, at Value (Cost $273,882) | | $ | 276,238 | | |
Foreign Currency, at Value (Cost $1,798) | | | 1,797 | | |
Cash | | | 21 | | |
Receivable for Investments Sold | | | 8,401 | | |
Receivable for Fund Shares Sold | | | 2,113 | | |
Dividends Receivable | | | 282 | | |
Receivable from Affiliate | | | — | @ | |
Other Assets | | | 89 | | |
Total Assets | | | 288,941 | | |
Liabilities: | |
Bank Overdraft | | | 7,966 | | |
Payable for Fund Shares Redeemed | | | 4,959 | | |
Payable for Investments Purchased | | | 2,251 | | |
Payable for Advisory Fees | | | 1,130 | | |
Payable for Custodian Fees | | | 358 | | |
Deferred Capital Gain Country Tax | | | 134 | | |
Payable for Professional Fees | | | 94 | | |
Payable for Sub Transfer Agency Fees — Class I | | | 51 | | |
Payable for Sub Transfer Agency Fees — Class A | | | 5 | | |
Payable for Sub Transfer Agency Fees — Class L | | | — | @ | |
Payable for Sub Transfer Agency Fees — Class C | | | — | @ | |
Payable for Transfer Agency Fees — Class I | | | 39 | | |
Payable for Transfer Agency Fees — Class A | | | 2 | | |
Payable for Transfer Agency Fees — Class L | | | 1 | | |
Payable for Transfer Agency Fees — Class C | | | 1 | | |
Payable for Transfer Agency Fees — Class IS | | | 1 | | |
Payable for Administration Fees | | | 22 | | |
Payable for Shareholder Services Fees — Class A | | | 7 | | |
Payable for Distribution and Shareholder Services Fees — Class L | | | 1 | | |
Payable for Distribution and Shareholder Services Fees — Class C | | | 1 | | |
Other Liabilities | | | 45 | | |
Total Liabilities | | | 17,068 | | |
Net Assets | | $ | 271,873 | | |
Net Assets Consist of: | |
Paid-in-Capital | | $ | 353,568 | | |
Total Accumulated Loss | | | (81,695 | ) | |
Net Assets | | $ | 271,873 | | |
The accompanying notes are an integral part of the financial statements.
9
Morgan Stanley Institutional Fund, Inc.
Annual Report — December 31, 2018
Frontier Markets Portfolio
Statement of Assets and Liabilities (cont'd) | | December 31, 2018
(000) | |
CLASS I: | |
Net Assets | | $ | 229,688 | | |
| Shares Outstanding $0.001 par value shares of beneficial interest (unlimited shares authorized) (not in 000's) | | | 14,694,241 | | |
Net Asset Value, Offering and Redemption Price Per Share | | $ | 15.63 | | |
CLASS A: | |
Net Assets | | $ | 34,654 | | |
| Shares Outstanding $0.001 par value shares of beneficial interest (unlimited shares authorized) (not in 000's) | | | 2,220,565 | | |
Net Asset Value, Redemption Price Per Share | | $ | 15.61 | | |
Maximum Sales Load | | | 5.25 | % | |
Maximum Sales Charge | | $ | 0.86 | | |
Maximum Offering Price Per Share | | $ | 16.47 | | |
CLASS L: | |
Net Assets | | $ | 1,241 | | |
| Shares Outstanding $0.001 par value shares of beneficial interest (unlimited shares authorized) (not in 000's) | | | 79,589 | | |
Net Asset Value, Offering and Redemption Price Per Share | | $ | 15.59 | | |
CLASS C: | |
Net Assets | | $ | 1,657 | | |
| Shares Outstanding $0.001 par value shares of beneficial interest (unlimited shares authorized) (not in 000's) | | | 107,747 | | |
Net Asset Value, Offering and Redemption Price Per Share | | $ | 15.38 | | |
CLASS IS: | |
Net Assets | | $ | 4,633 | | |
| Shares Outstanding $0.001 par value shares of beneficial interest (unlimited shares authorized) (not in 000's) | | | 296,476 | | |
Net Asset Value, Offering and Redemption Price Per Share | | $ | 15.63 | | |
@ Amount is less than $500.
The accompanying notes are an integral part of the financial statements.
10
Morgan Stanley Institutional Fund, Inc.
Annual Report — December 31, 2018
Frontier Markets Portfolio
Statement of Operations | | Year Ended
December 31, 2018
(000) | |
Investment Income: | |
Dividends from Securities of Unaffiliated Issuers (Net of $1,796 of Foreign Taxes Withheld) | | $ | 19,920 | | |
Dividends from Security of Affiliated Issuer (Note G) | | | 84 | | |
Total Investment Income | | | 20,004 | | |
Expenses: | |
Advisory Fees (Note B) | | | 7,100 | | |
Custodian Fees (Note F) | | | 1,396 | | |
Sub Transfer Agency Fees — Class I | | | 405 | | |
Sub Transfer Agency Fees — Class A | | | 91 | | |
Sub Transfer Agency Fees — Class L | | | 1 | | |
Sub Transfer Agency Fees — Class C | | | 1 | | |
Administration Fees (Note C) | | | 454 | | |
Shareholder Services Fees — Class A (Note D) | | | 155 | | |
Distribution and Shareholder Services Fees — Class L (Note D) | | | 16 | | |
Distribution and Shareholder Services Fees — Class C (Note D) | | | 23 | | |
Professional Fees | | | 170 | | |
Transfer Agency Fees — Class I (Note E) | | | 99 | | |
Transfer Agency Fees — Class A (Note E) | | | 5 | | |
Transfer Agency Fees — Class L (Note E) | | | 2 | | |
Transfer Agency Fees — Class C (Note E) | | | 3 | | |
Transfer Agency Fees — Class IS (Note E) | | | 10 | | |
Registration Fees | | | 106 | | |
Shareholder Reporting Fees | | | 70 | | |
Directors' Fees and Expenses | | | 19 | | |
Pricing Fees | | | 2 | | |
Other Expenses | | | 99 | | |
Expenses Before Non Operating Expenses | | | 10,227 | | |
Bank Overdraft Expense | | | 46 | | |
Total Expenses | | | 10,273 | | |
Rebate from Morgan Stanley Affiliate (Note G) | | | (9 | ) | |
Net Expenses | | | 10,264 | | |
Net Investment Income | | | 9,740 | | |
Realized Loss: | |
Investments Sold (Net of $322 of Capital Gain Country Tax) | | | (9,183 | ) | |
Foreign Currency Translation | | | (867 | ) | |
Net Realized Loss | | | (10,050 | ) | |
Change in Unrealized Appreciation (Depreciation): | |
Investments (Net Decrease in Deferred Capital Gain Country Tax of $1,962) | | | (135,959 | ) | |
Foreign Currency Translation | | | 12 | | |
Net Change in Unrealized Appreciation (Depreciation) | | | (135,947 | ) | |
Net Realized Loss and Change in Unrealized Appreciation (Depreciation) | | | (145,997 | ) | |
Net Decrease in Net Assets Resulting from Operations | | $ | (136,257 | ) | |
The accompanying notes are an integral part of the financial statements.
11
Morgan Stanley Institutional Fund, Inc.
Annual Report — December 31, 2018
Frontier Markets Portfolio
Statements of Changes in Net Assets | | Year Ended
December 31, 2018
(000) | | Year Ended
December 31, 2017
(000) | |
Increase (Decrease) in Net Assets: | |
Operations: | |
Net Investment Income | | $ | 9,740 | | | $ | 5,369 | | |
Net Realized Gain (Loss) | | | (10,050 | ) | | | 56,268 | | |
Net Change in Unrealized Appreciation (Depreciation) | | | (135,947 | ) | | | 67,858 | | |
Net Increase (Decrease) in Net Assets Resulting from Operations | | | (136,257 | ) | | | 129,495 | | |
Dividends and Distributions to Shareholders: | |
Class I | | | (13,142 | ) | | | — | | |
Class A | | | (1,255 | ) | | | — | | |
Class L | | | (20 | ) | | | — | | |
Class C | | | (26 | ) | | | — | | |
Class IS | | | (190 | ) | | | — | | |
Total Dividends and Distributions to Shareholders | | | (14,633 | ) | | | — | | |
Capital Share Transactions:(1) | |
Class I: | |
Subscribed | | | 134,972 | | | | 209,840 | | |
Distributions Reinvested | | | 9,070 | | | | — | | |
Redeemed | | | (416,758 | ) | | | (212,122 | ) | |
Class A: | |
Subscribed | | | 21,353 | | | | 15,862 | | |
Distributions Reinvested | | | 1,253 | | | | — | | |
Redeemed | | | (59,351 | ) | | | (37,356 | ) | |
Class L: | |
Exchanged | | | 16 | | | | — | | |
Distributions Reinvested | | | 20 | | | | — | | |
Redeemed | | | (810 | ) | | | (526 | ) | |
Class C: | |
Subscribed | | | 207 | | | | 1,066 | | |
Distributions Reinvested | | | 25 | | | | — | | |
Redeemed | | | (818 | ) | | | (578 | ) | |
Class IS: | |
Subscribed | | | 21,329 | | | | 16,912 | | |
Distributions Reinvested | | | 190 | | | | — | | |
Redeemed | | | (28,473 | ) | | | (15,164 | ) | |
Net Decrease in Net Assets Resulting from Capital Share Transactions | | | (317,775 | ) | | | (22,066 | ) | |
Redemption Fees | | | 8 | | | | 10 | | |
Total Increase (Decrease) in Net Assets | | | (468,657 | ) | | | 107,439 | | |
Net Assets: | |
Beginning of Period | | | 740,530 | | | | 633,091 | | |
End of Period | | $ | 271,873 | | | $ | 740,530 | † | |
The accompanying notes are an integral part of the financial statements.
12
Morgan Stanley Institutional Fund, Inc.
Annual Report — December 31, 2018
Frontier Markets Portfolio
Statements of Changes in Net Assets (cont'd) | | Year Ended
December 31, 2018
(000) | | Year Ended
December 31, 2017
(000) | |
(1) Capital Share Transactions: | |
Class I: | |
Shares Subscribed | | | 6,991 | | | | 10,845 | | |
Shares Issued on Distributions Reinvested | | | 542 | | | | — | | |
Shares Redeemed | | | (22,923 | ) | | | (10,982 | ) | |
Net Decrease in Class I Shares Outstanding | | | (15,390 | ) | | | (137 | ) | |
Class A: | |
Shares Subscribed | | | 1,230 | | | | 851 | | |
Shares Issued on Distributions Reinvested | | | 75 | | | | — | | |
Shares Redeemed | | | (3,224 | ) | | | (1,958 | ) | |
Net Decrease in Class A Shares Outstanding | | | (1,919 | ) | | | (1,107 | ) | |
Class L: | |
Shares Exchanged | | | 1 | | | | — | | |
Shares Issued on Distributions Reinvested | | | 1 | | | | — | | |
Shares Redeemed | | | (47 | ) | | | (28 | ) | |
Net Decrease in Class L Shares Outstanding | | | (45 | ) | | | (28 | ) | |
Class C: | |
Shares Subscribed | | | 11 | | | | 57 | | |
Shares Issued on Distributions Reinvested | | | 2 | | | | — | | |
Shares Redeemed | | | (45 | ) | | | (30 | ) | |
Net Increase (Decrease) in Class C Shares Outstanding | | | (32 | ) | | | 27 | | |
Class IS: | |
Shares Subscribed | | | 1,005 | | | | 863 | | |
Shares Issued on Distributions Reinvested | | | 11 | | | | — | | |
Shares Redeemed | | | (1,497 | ) | | | (779 | ) | |
Net Increase (Decrease) in Class IS Shares Outstanding | | | (481 | ) | | | 84 | | |
† Accumulated Undistributed Net Investment Income for the year ended December 31, 2017 was $1,389.
The accompanying notes are an integral part of the financial statements.
13
Morgan Stanley Institutional Fund, Inc.
Annual Report — December 31, 2018
Financial Highlights
Frontier Markets Portfolio
| | | Class I | |
| | | Year Ended December 31, | |
Selected Per Share Data and Ratios | | 2018 | | 2017 | | 2016(1) | | 2015 | | 2014 | |
Net Asset Value, Beginning of Period | | $ | 21.02 | | | $ | 17.39 | | | $ | 16.98 | | | $ | 19.15 | | | $ | 18.86 | | |
Income (Loss) from Investment Operations: | |
Net Investment Income(2) | | | 0.33 | | | | 0.16 | | | | 0.31 | | | | 0.19 | | | | 0.25 | | |
Net Realized and Unrealized Gain (Loss) | | | (5.07 | ) | | | 3.47 | | | | 0.33 | | | | (2.21 | ) | | | 0.23 | | |
Total from Investment Operations | | | (4.74 | ) | | | 3.63 | | | | 0.64 | | | | (2.02 | ) | | | 0.48 | | |
Distributions from and/or in Excess of: | |
Net Investment Income | | | (0.65 | ) | | | — | | | | (0.23 | ) | | | (0.14 | ) | | | (0.18 | ) | |
Paid-in-Capital | | | — | | | | — | | | | (0.00 | )(3) | | | (0.01 | ) | | | (0.01 | ) | |
Total Distributions | | | (0.65 | ) | | | — | | | | (0.23 | ) | | | (0.15 | ) | | | (0.19 | ) | |
Redemption Fees | | | 0.00 | (3) | | | 0.00 | (3) | | | 0.00 | (3) | | | 0.00 | (3) | | | 0.00 | (3) | |
Net Asset Value, End of Period | | $ | 15.63 | | | $ | 21.02 | | | $ | 17.39 | | | $ | 16.98 | | | $ | 19.15 | | |
Total Return(4) | | | (22.60 | )% | | | 20.82 | % | | | 3.83 | % | | | (10.58 | )% | | | 2.66 | % | |
Ratios and Supplemental Data: | |
Net Assets, End of Period (Thousands) | | $ | 229,688 | | | $ | 632,435 | | | $ | 525,664 | | | $ | 531,927 | | | $ | 547,535 | | |
Ratio of Expenses to Average Net Assets(7) | | | 1.77 | %(5) | | | 1.73 | %(5) | | | 1.67 | %(5) | | | 1.72 | %(5) | | | 1.69 | %(5) | |
Ratio of Expenses to Average Net Assets Excluding Non Operating Expenses | | | 1.76 | %(5) | | | 1.73 | %(5) | | | N/A | | | | N/A | | | | 1.71 | %(5) | |
Ratio of Net Investment Income to Average Net Assets(7) | | | 1.68 | %(5) | | | 0.82 | %(5) | | | 1.82 | %(5) | | | 1.02 | %(5) | | | 1.23 | %(5) | |
Ratio of Rebate from Morgan Stanley Affiliates to Average Net Assets | | | 0.00 | %(6) | | | 0.00 | %(6) | | | 0.00 | %(6) | | | 0.00 | %(6) | | | 0.01 | % | |
Portfolio Turnover Rate | | | 61 | % | | | 52 | % | | | 30 | % | | | 37 | % | | | 52 | % | |
(7) Supplemental Information on the Ratios to Average Net Assets: | |
Ratios Before Expense Limitation: | |
Expenses to Average Net Assets | | | N/A | | | | N/A | | | | 1.69 | % | | | N/A | | | | 1.72 | % | |
Net Investment Income to Average Net Assets | | | N/A | | | | N/A | | | | 1.80 | % | | | N/A | | | | 1.20 | % | |
(1) Reflects prior period Custodian out-of-pocket expenses that were reimbursed in September 2016. The amount of the reimbursement was immaterial on a per share basis and did not impact the total return of Class I shares. The Ratio of Expenses to Average Net Assets would have been 0.01% higher and the Ratio of Net Investment Income to Average Net Assets would have been 0.01% lower had the Custodian not reimbursed the Fund.
(2) Per share amount is based on average shares outstanding.
(3) Amount is less than $0.005 per share.
(4) Calculated based on the net asset value as of the last business day of the period.
(5) The Ratios of Expenses and Net Investment Income reflect the rebate of certain Fund expenses in connection with the investments in Morgan Stanley affiliates during the period. The effect of the rebate on the ratios is disclosed in the above table as "Ratio of Rebate from Morgan Stanley Affiliates to Average Net Assets."
(6) Amount is less than 0.005%.
The accompanying notes are an integral part of the financial statements.
14
Morgan Stanley Institutional Fund, Inc.
Annual Report — December 31, 2018
Financial Highlights
Frontier Markets Portfolio
| | | Class A | |
| | | Year Ended December 31, | |
Selected Per Share Data and Ratios | | 2018 | | 2017 | | 2016(1) | | 2015 | | 2014 | |
Net Asset Value, Beginning of Period | | $ | 20.86 | | | $ | 17.31 | | | $ | 16.90 | | | $ | 19.06 | | | $ | 18.78 | | |
Income (Loss) from Investment Operations: | |
Net Investment Income(2) | | | 0.34 | | | | 0.11 | | | | 0.24 | | | | 0.11 | | | | 0.18 | | |
Net Realized and Unrealized Gain (Loss) | | | (5.10 | ) | | | 3.44 | | | | 0.35 | | | | (2.18 | ) | | | 0.24 | | |
Total from Investment Operations | | | (4.76 | ) | | | 3.55 | | | | 0.59 | | | | (2.07 | ) | | | 0.42 | | |
Distributions from and/or in Excess of: | |
Net Investment Income | | | (0.49 | ) | | | — | | | | (0.18 | ) | | | (0.08 | ) | | | (0.13 | ) | |
Paid-in-Capital | | | — | | | | — | | | | (0.00 | )(3) | | | (0.01 | ) | | | (0.01 | ) | |
Total Distributions | | | (0.49 | ) | | | — | | | | (0.18 | ) | | | (0.09 | ) | | | (0.14 | ) | |
Redemption Fees | | | 0.00 | (3) | | | 0.00 | (3) | | | 0.00 | (3) | | | 0.00 | (3) | | | 0.00 | (3) | |
Net Asset Value, End of Period | | $ | 15.61 | | | $ | 20.86 | | | $ | 17.31 | | | $ | 16.90 | | | $ | 19.06 | | |
Total Return(4) | | | (22.80 | )% | | | 20.39 | % | | | 3.49 | % | | | (10.90 | )% | | | 2.39 | % | |
Ratios and Supplemental Data: | |
Net Assets, End of Period (Thousands) | | $ | 34,654 | | | $ | 86,324 | | | $ | 90,817 | | | $ | 82,480 | | | $ | 76,839 | | |
Ratio of Expenses to Average Net Assets(7) | | | 2.07 | %(5) | | | 2.05 | %(5) | | | 2.01 | %(5) | | | 2.07 | %(5) | | | 2.02 | %(5) | |
Ratio of Expenses to Average Net Assets Excluding Non Operating Expenses | | | 2.06 | %(5) | | | 2.05 | %(5) | | | N/A | | | | N/A | | | | 2.04 | %(5) | |
Ratio of Net Investment Income to Average Net Assets(7) | | | 1.71 | %(5) | | | 0.59 | %(5) | | | 1.40 | %(5) | | | 0.60 | %(5) | | | 0.90 | %(5) | |
Ratio of Rebate from Morgan Stanley Affiliates to Average Net Assets | | | 0.00 | %(6) | | | 0.00 | %(6) | | | 0.00 | %(6) | | | 0.00 | %(6) | | | 0.01 | % | |
Portfolio Turnover Rate | | | 61 | % | | | 52 | % | | | 30 | % | | | 37 | % | | | 52 | % | |
(7) Supplemental Information on the Ratios to Average Net Assets: | |
Ratios Before Expense Limitation: | |
Expenses to Average Net Assets | | | N/A | | | | N/A | | | | 2.03 | % | | | N/A | | | | 2.05 | % | |
Net Investment Income to Average Net Assets | | | N/A | | | | N/A | | | | 1.38 | % | | | N/A | | | | 0.87 | % | |
(1) Reflects prior period Custodian out-of-pocket expenses that were reimbursed in September 2016. The amount of the reimbursement was immaterial on a per share basis and did not impact the total return of Class A shares. The Ratio of Expenses to Average Net Assets would have been 0.01% higher and the Ratio of Net Investment Income to Average Net Assets would have been 0.01% lower had the Custodian not reimbursed the Fund.
(2) Per share amount is based on average shares outstanding.
(3) Amount is less than $0.005 per share.
(4) Calculated based on the net asset value which does not reflect sales charges, if applicable, as of the last business day of the period.
(5) The Ratios of Expenses and Net Investment Income reflect the rebate of certain Fund expenses in connection with the investments in Morgan Stanley affiliates during the period. The effect of the rebate on the ratios is disclosed in the above table as "Ratio of Rebate from Morgan Stanley Affiliates to Average Net Assets."
(6) Amount is less than 0.005%.
The accompanying notes are an integral part of the financial statements.
15
Morgan Stanley Institutional Fund, Inc.
Annual Report — December 31, 2018
Financial Highlights
Frontier Markets Portfolio
| | | Class L | |
| | | Year Ended December 31, | |
Selected Per Share Data and Ratios | | 2018 | | 2017 | | 2016(1) | | 2015 | | 2014 | |
Net Asset Value, Beginning of Period | | $ | 20.65 | | | $ | 17.25 | | | $ | 16.79 | | | $ | 18.96 | | | $ | 18.71 | | |
Income (Loss) from Investment Operations: | |
Net Investment Income (Loss)(2) | | | 0.17 | | | | (0.02 | ) | | | 0.15 | | | | 0.05 | | | | 0.06 | | |
Net Realized and Unrealized Gain (Loss) | | | (4.98 | ) | | | 3.42 | | | | 0.32 | | | | (2.22 | ) | | | 0.25 | | |
Total from Investment Operations | | | (4.81 | ) | | | 3.40 | | | | 0.47 | | | | (2.17 | ) | | | 0.31 | | |
Distributions from and/or in Excess of: | |
Net Investment Income | | | (0.25 | ) | | | — | | | | (0.01 | ) | | | — | | | | (0.05 | ) | |
Paid-in-Capital | | | — | | | | — | | | | (0.00 | )(3) | | | — | | | | (0.01 | ) | |
Total Distributions | | | (0.25 | ) | | | — | | | | (0.01 | ) | | | — | | | | (0.06 | ) | |
Redemption Fees | | | 0.00 | (3) | | | 0.00 | (3) | | | 0.00 | (3) | | | 0.00 | (3) | | | 0.00 | (3) | |
Net Asset Value, End of Period | | $ | 15.59 | | | $ | 20.65 | | | $ | 17.25 | | | $ | 16.79 | | | $ | 18.96 | | |
Total Return(4) | | | (23.19 | )% | | | 19.59 | % | | | 2.77 | % | | | (11.49 | )% | | | 1.77 | % | |
Ratios and Supplemental Data: | |
Net Assets, End of Period (Thousands) | | $ | 1,241 | | | $ | 2,570 | | | $ | 2,630 | | | $ | 4,490 | | | $ | 8,003 | | |
Ratio of Expenses to Average Net Assets(7) | | | 2.57 | %(5) | | | 2.70 | %(5) | | | 2.70 | %(5) | | | 2.70 | %(5) | | | 2.65 | %(5) | |
Ratio of Expenses to Average Net Assets Excluding Non Operating Expenses | | | 2.56 | %(5) | | | 2.70 | %(5) | | | N/A | | | | N/A | | | | 2.67 | %(5) | |
Ratio of Net Investment Income (Loss) to Average Net Assets(7) | | | 0.88 | %(5) | | | (0.13 | )%(5) | | | 0.88 | %(5) | | | 0.26 | %(5) | | | 0.27 | %(5) | |
Ratio of Rebate from Morgan Stanley Affiliates to Average Net Assets | | | 0.00 | %(6) | | | 0.00 | %(6) | | | 0.00 | %(6) | | | 0.00 | %(6) | | | 0.01 | % | |
Portfolio Turnover Rate | | | 61 | % | | | 52 | % | | | 30 | % | | | 37 | % | | | 52 | % | |
(7) Supplemental Information on the Ratios to Average Net Assets: | |
Ratios Before Expense Limitation: | |
Expenses to Average Net Assets | | | N/A | | | | 2.76 | % | | | 2.80 | % | | | 2.73 | % | | | 2.68 | % | |
Net Investment Income (Loss) to Average Net Assets | | | N/A | | | | (0.19 | )% | | | 0.78 | % | | | 0.23 | % | | | 0.24 | % | |
(1) Reflects prior period Custodian out-of-pocket expenses that were reimbursed in September 2016. The amount of the reimbursement was immaterial on a per share basis and did not impact the total return of Class L shares. The Ratio of Expenses to Average Net Assets and the Ratio of Net Investment Income to Average Net Assets would be unchanged as the reimbursement of Custodian fees was offset against expense waivers/reimbursements with no impact to net expenses or net investment income.
(2) Per share amount is based on average shares outstanding.
(3) Amount is less than $0.005 per share.
(4) Calculated based on the net asset value as of the last business day of the period.
(5) The Ratios of Expenses and Net Investment Income (Loss) reflect the rebate of certain Fund expenses in connection with the investments in Morgan Stanley affiliates during the period. The effect of the rebate on the ratios is disclosed in the above table as "Ratio of Rebate from Morgan Stanley Affiliates to Average Net Assets."
(6) Amount is less than 0.005%.
The accompanying notes are an integral part of the financial statements.
16
Morgan Stanley Institutional Fund, Inc.
Annual Report — December 31, 2018
Financial Highlights
Frontier Markets Portfolio
| | | Class C | |
| | | Year Ended December 31, | | Period from
April 30, 2015(2) to | |
Selected Per Share Data and Ratios | | 2018 | | 2017 | | 2016(1) | | December 31, 2015 | |
Net Asset Value, Beginning of Period | | $ | 20.41 | | | $ | 17.07 | | | $ | 16.69 | | | $ | 19.53 | | |
Income (Loss) from Investment Operations: | |
Net Investment Income (Loss)(3) | | | 0.11 | | | | (0.05 | ) | | | 0.10 | | | | (0.16 | ) | |
Net Realized and Unrealized Gain (Loss) | | | (4.90 | ) | | | 3.39 | | | | 0.34 | | | | (2.60 | ) | |
Total from Investment Operations | | | (4.79 | ) | | | 3.34 | | | | 0.44 | | | | (2.76 | ) | |
Distributions from and/or in Excess of: | |
Net Investment Income | | | (0.24 | ) | | | — | | | | (0.06 | ) | | | (0.07 | ) | |
Paid-in-Capital | | | — | | | | — | | | | (0.00 | )(4) | | | (0.01 | ) | |
Total Distributions | | | (0.24 | ) | | | — | | | | (0.06 | ) | | | (0.08 | ) | |
Redemption Fees | | | 0.00 | (4) | | | 0.00 | (4) | | | 0.00 | (4) | | | 0.00 | (4) | |
Net Asset Value, End of Period | | $ | 15.38 | | | $ | 20.41 | | | $ | 17.07 | | | $ | 16.69 | | |
Total Return(5) | | | (23.42 | )% | | | 19.51 | % | | | 2.63 | % | | | (14.10 | )%(8) | |
Ratios and Supplemental Data: | |
Net Assets, End of Period (Thousands) | | $ | 1,657 | | | $ | 2,857 | | | $ | 1,925 | | | $ | 1,400 | | |
Ratio of Expenses to Average Net Assets(10) | | | 2.83 | %(6) | | | 2.81 | %(6) | | | 2.88 | %(6) | | | 2.95 | %(6)(9) | |
Ratio of Expenses to Average Net Assets Excluding Non Operating Expenses | | | 2.82 | %(6) | | | 2.81 | %(6) | | | N/A | | | | N/A | | |
Ratio of Net Investment Income (Loss) to Average Net Assets(10) | | | 0.56 | %(6) | | | (0.26 | )%(6) | | | 0.57 | %(6) | | | (1.38 | )%(6)(9) | |
Ratio of Rebate from Morgan Stanley Affiliates to Average Net Assets | | | 0.00 | %(7) | | | 0.00 | %(7) | | | 0.00 | %(7) | | | 0.00 | %(7)(9) | |
Portfolio Turnover Rate | | | 61 | % | | | 52 | % | | | 30 | % | | | 37 | % | |
(10) Supplemental Information on the Ratios to Average Net Assets: | |
Ratios Before Expense Limitation: | |
Expenses to Average Net Assets | | | N/A | | | | N/A | | | | 2.89 | % | | | 3.17 | %(9) | |
Net Investment Income (Loss) to Average Net Assets | | | N/A | | | | N/A | | | | 0.56 | % | | | (1.60 | )%(9) | |
(1) Reflects prior period Custodian out-of-pocket expenses that were reimbursed in September 2016. The amount of the reimbursement was immaterial on a per share basis and did not impact the total return of Class C shares. The Ratio of Expenses to Average Net Assets would have been 0.01% higher and the Ratio of Net Investment Income to Average Net Assets would have been 0.01% lower had the Custodian not reimbursed the Fund.
(2) Commencement of Offering.
(3) Per share amount is based on average shares outstanding.
(4) Amount is less than $0.005 per share.
(5) Calculated based on the net asset value which does not reflect sales charges, if applicable, as of the last business day of the period.
(6) The Ratios of Expenses and Net Investment Income (Loss) reflect the rebate of certain Fund expenses in connection with the investments in Morgan Stanley affiliates during the period. The effect of the rebate on the ratios is disclosed in the above table as "Ratio of Rebate from Morgan Stanley Affiliates to Average Net Assets."
(7) Amount is less than 0.005%.
(8) Not annualized.
(9) Annualized.
The accompanying notes are an integral part of the financial statements.
17
Morgan Stanley Institutional Fund, Inc.
Annual Report — December 31, 2018
Financial Highlights
Frontier Markets Portfolio
| | | Class IS | |
| | | Year Ended December 31, | | Period from
February 27, 2015(2) to | |
Selected Per Share Data and Ratios | | 2018 | | 2017 | | 2016(1) | | December 31, 2015 | |
Net Asset Value, Beginning of Period | | $ | 21.02 | | | $ | 17.39 | | | $ | 16.97 | | | $ | 19.28 | | |
Income (Loss) from Investment Operations: | |
Net Investment Income(3) | | | 0.58 | | | | 0.13 | | | | 0.30 | | | | 0.26 | | |
Net Realized and Unrealized Gain (Loss) | | | (5.33 | ) | | | 3.50 | | | | 0.36 | | | | (2.41 | ) | |
Total from Investment Operations | | | (4.75 | ) | | | 3.63 | | | | 0.66 | | | | (2.15 | ) | |
Distributions from and/or in Excess of: | |
Net Investment Income | | | (0.64 | ) | | | — | | | | (0.24 | ) | | | (0.15 | ) | |
Paid-in-Capital | | | — | | | | — | | | | (0.00 | )(4) | | | (0.01 | ) | |
Total Distributions | | | (0.64 | ) | | | — | | | | (0.24 | ) | | | (0.16 | ) | |
Redemption Fees | | | 0.00 | (4) | | | 0.00 | (4) | | | 0.00 | (4) | | | 0.00 | (4) | |
Net Asset Value, End of Period | | $ | 15.63 | | | $ | 21.02 | | | $ | 17.39 | | | $ | 16.97 | | |
Total Return(5) | | | (22.61 | )% | | | 20.83 | % | | | 3.88 | % | | | (11.14 | )%(8) | |
Ratios and Supplemental Data: | |
Net Assets, End of Period (Thousands) | | $ | 4,633 | | | $ | 16,344 | | | $ | 12,055 | | | $ | 7,732 | | |
Ratio of Expenses to Average Net Assets(10) | | | 1.74 | %(6) | | | 1.69 | %(6) | | | 1.62 | %(6) | | | 1.68 | %(6)(9) | |
Ratio of Expenses to Average Net Assets Excluding Non Operating Expenses | | | 1.73 | %(6) | | | 1.69 | %(6) | | | N/A | | | | N/A | | |
Ratio of Net Investment Income to Average Net Assets(10) | | | 2.85 | %(6) | | | 0.65 | %(6) | | | 1.75 | %(6) | | | 1.67 | %(6)(9) | |
Ratio of Rebate from Morgan Stanley Affiliates to Average Net Assets | | | 0.00 | %(7) | | | 0.00 | %(7) | | | 0.00 | %(7) | | | 0.00 | %(7)(9) | |
Portfolio Turnover Rate | | | 61 | % | | | 52 | % | | | 30 | % | | | 37 | % | |
(10) Supplemental Information on the Ratios to Average Net Assets: | |
Ratios Before Expense Limitation: | |
Expenses to Average Net Assets | | | N/A | | | | N/A | | | | 1.64 | % | | | 1.68 | %(9) | |
Net Investment Income to Average Net Assets | | | N/A | | | | N/A | | | | 1.73 | % | | | 1.67 | %(9) | |
(1) Reflects prior period Custodian out-of-pocket expenses that were reimbursed in September 2016. The amount of the reimbursement was immaterial on a per share basis and did not impact the total return of Class IS shares. The Ratio of Expenses to Average Net Assets would have been 0.01% higher and the Ratio of Net Investment Income to Average Net Assets would have been 0.01% lower had the Custodian not reimbursed the Fund.
(2) Commencement of Offering.
(3) Per share amount is based on average shares outstanding.
(4) Amount is less than $0.005 per share.
(5) Calculated based on the net asset value as of the last business day of the period.
(6) The Ratios of Expenses and Net Investment Income reflect the rebate of certain Fund expenses in connection with the investments in Morgan Stanley affiliates during the period. The effect of the rebate on the ratios is disclosed in the above table as "Ratio of Rebate from Morgan Stanley Affiliates to Average Net Assets."
(7) Amount is less than 0.005%.
(8) Not annualized.
(9) Annualized.
The accompanying notes are an integral part of the financial statements.
18
Morgan Stanley Institutional Fund, Inc.
Annual Report — December 31, 2018
Notes to Financial Statements
Morgan Stanley Institutional Fund, Inc. (the "Company") is registered under the Investment Company Act of 1940, as amended (the "Act"), as an open-end management investment company. The Company is comprised of thirty separate, active, diversified and non-diversified funds (individually referred to as a "Fund", collectively as the "Funds"). The Company applies investment company accounting and reporting guidance.
The accompanying financial statements relate to the Frontier Markets Portfolio. The Fund seeks long-term capital appreciation.
The Fund offers five classes of shares — Class I, Class A, Class L, Class C and Class IS. On April 30, 2015, the Fund suspended offering of Class L shares. Existing Class L shareholders may invest through reinvestment of dividends and distributions.
A. Significant Accounting Policies: The following significant accounting policies are in conformity with U.S. generally accepted accounting principles ("GAAP"). Such policies are consistently followed by the Company in the preparation of its financial statements. GAAP may require management to make estimates and assumptions that affect the reported amounts and disclosures in the financial statements. Actual results may differ from those estimates.
In August 2018, the Financial Accounting Standards Board ("FASB") issued Accounting Standards Update ("ASU") 2018-13, Fair Value Measurement (Topic 820) — Disclosures Framework — Changes to Disclosure Requirements of Fair Value Measurement ("ASU 2018-13") which introduces new fair value disclosure requirements as well as eliminates and modifies certain existing fair value disclosure requirements. ASU 2018-13 would be effective for fiscal years beginning after December 15, 2019 and for interim periods within those fiscal years; however, management has elected to early adopt ASU 2018-13 effective with the current reporting period as permitted by the standard. The impact of the Fund's adoption was limited to changes in the Fund's financial statement disclosures regarding fair value, primarily those disclosures related to transfers between levels of the fair value hierarchy and disclosure of the range and weighted average used to develop significant unobservable inputs for Level 3 fair value measurements, when applicable.
1. Security Valuation: (1) An equity portfolio security listed or traded on an exchange is valued at its latest reported sales price (or at the exchange official closing price if such exchange reports an official closing price), and if there were no sales on a given day and if there is no official exchange closing price for that day, the security is valued at the mean between the last reported bid and asked prices if such bid and asked prices are available on the relevant exchanges. Listed equity securities not traded on the valuation date with no reported bid and asked prices available on the exchange are valued at the mean between the current bid and asked prices obtained from one or more reputable brokers or dealers. In cases where a security is traded on more than one exchange, the security is valued on the exchange designated as the primary market; (2) all other equity portfolio securities for which over-the-counter ("OTC") market quotations are readily available are valued at the latest reported sales price (or at the market official closing price if such market reports an official closing price), and if there was no trading in the security on a given day and if there is no official closing price from relevant markets for that day, the security is valued at the mean between the last reported bid and asked prices if such bid and asked prices are available on the relevant markets. An unlisted equity security that does not trade on the valuation date and for which bid and asked prices from the relevant markets are unavailable is valued at the mean between the current bid and asked prices obtained from one or more reputable brokers or dealers; (3) certain portfolio securities may be valued by an outside pricing service/vendor approved by the Company's Board of Directors (the "Directors"). The pricing service/vendor may employ a pricing model that takes into account, among other things, bids, yield spreads and/or other market data and specific security characteristics. Alternatively, if a valuation is not available from an outside pricing service/vendor, and the security trades on an exchange, the security may be valued at its latest reported sale price (or at the exchange official closing price if such exchange reports an official closing price), prior to the time when assets are valued. If there are no sales on a given day and if there is no official exchange closing price for that day, the security is valued at the mean between the last reported bid and asked prices if such bid and asked prices are available in the relevant exchanges; (4) when
19
Morgan Stanley Institutional Fund, Inc.
Annual Report — December 31, 2018
Notes to Financial Statements (cont'd)
market quotations are not readily available, including circumstances under which Morgan Stanley Investment Management Inc. (the "Adviser") determines that the closing price, last sale price or the mean between the last reported bid and asked prices are not reflective of a security's market value, portfolio securities are valued at their fair value as determined in good faith under procedures established by and under the general supervision of the Directors. Occasionally, developments affecting the closing prices of securities and other assets may occur between the times at which valuations of such securities are determined (that is, close of the foreign market on which the securities trade) and the close of business of the New York Stock Exchange ("NYSE"). If developments occur during such periods that are expected to materially affect the value of such securities, such valuations may be adjusted to reflect the estimated fair value of such securities as of the close of the NYSE, as determined in good faith by the Directors or by the Adviser using a pricing service and/or procedures approved by the Directors; (5) quotations of foreign portfolio securities, other assets and liabilities and forward contracts stated in foreign currency are translated into U.S. dollar equivalents at the prevailing market rates prior to the close of the NYSE; and (6) investments in mutual funds, including the Morgan Stanley Institutional Liquidity Funds, are valued at the net asset value ("NAV") as of the close of each business day.
The Directors have responsibility for determining in good faith the fair value of the investments, and the Directors may appoint others, such as the Company's Adviser or a valuation committee, to assist the Directors in determining fair value and to make the actual calculations pursuant to the fair valuation methodologies previously approved by the Directors. Under procedures approved by the Directors, the Company's Adviser has formed a Valuation Committee whose members are approved by the Directors. The Valuation Committee provides administration and oversight of the Company's valuation policies and procedures, which are reviewed at least annually by the Directors. These procedures allow the Company to utilize independent pricing services, quotations from securities and financial instrument dealers and other market sources to determine fair value.
2. Fair Value Measurement: FASB Accounting Standards CodificationTM ("ASC") 820, "Fair Value Measurement" ("ASC 820"), defines fair value as the value that the Fund would receive to sell an investment or pay to transfer a liability in a timely transaction with an independent buyer in the principal market, or in the absence of a principal market, the most advantageous market for the investment or liability. ASC 820 establishes a three-tier hierarchy to distinguish between (1) inputs that reflect the assumptions market participants would use in valuing an asset or liability developed based on market data obtained from sources independent of the reporting entity (observable inputs) and (2) inputs that reflect the reporting entity's own assumptions about the assumptions market participants would use in valuing an asset or liability developed based on the best information available in the circumstances (unobservable inputs) and to establish classification of fair value measurements for disclosure purposes. Various inputs are used in determining the value of the Fund's investments. The inputs are summarized in the three broad levels listed below:
• Level 1 – unadjusted quoted prices in active markets for identical investments
• Level 2 – other significant observable inputs (including quoted prices for similar investments, interest rates, prepayment speeds, credit risk, etc.)
• Level 3 – significant unobservable inputs including the Fund's own assumptions in determining the fair value of investments. Factors considered in making this determination may include, but are not limited to, information obtained by contacting the issuer, analysts, or the appropriate stock exchange (for exchange-traded securities), analysis of the issuer's financial statements or other available documents and, if necessary, available information concerning other securities in similar circumstances
The inputs or methodology used for valuing securities are not necessarily an indication of the risk associated with investing in those securities and the determination of the significance of a particular input to the fair value measurement in its entirety requires judgment and considers factors specific to each security.
20
Morgan Stanley Institutional Fund, Inc.
Annual Report — December 31, 2018
Notes to Financial Statements (cont'd)
The following is a summary of the inputs used to value the Fund's investments as of December 31, 2018:
Investment Type | | Level 1
Unadjusted
quoted
prices
(000) | | Level 2
Other
significant
observable
inputs
(000) | | Level 3
Significant
unobservable
inputs
(000) | | Total
(000) | |
Assets: | |
Common Stocks | |
Air Freight & Logistics | | $ | — | | | $ | 2,939 | | | $ | — | | | $ | 2,939 | | |
Airlines | | | 1,674 | | | | 4,735 | | | | — | | | | 6,409 | | |
Banks | | | 19,792 | | | | 94,025 | | | | — | | | | 113,817 | | |
Beverages | | | — | | | | 6,967 | | | | — | | | | 6,967 | | |
Capital Markets | | | — | | | | 3,115 | | | | — | | | | 3,115 | | |
Construction Materials | | | — | | | | 4,910 | | | | — | | | | 4,910 | | |
Diversified Consumer
Services | | | — | | | | 7,115 | | | | — | | | | 7,115 | | |
Diversified
Telecommunication
Services | | | 6,698 | | | | — | | | | — | | | | 6,698 | | |
Electric Utilities | | | 6,311 | | | | — | | | | — | | | | 6,311 | | |
Food Products | | | — | | | | 21,585 | | | | — | | | | 21,585 | | |
Health Care Providers &
Services | | | — | | | | 6,817 | | | | — | | | | 6,817 | | |
Hotels, Restaurants &
Leisure | | | 2,882 | | | | — | | | | — | | | | 2,882 | | |
Internet & Direct
Marketing Retail | | | 2,816 | | | | — | | | | — | | | | 2,816 | | |
Multi-Line Retail | | | — | | | | 1,536 | | | | — | | | | 1,536 | | |
Oil, Gas & Consumable
Fuels | | | 8,223 | | | | 3,153 | | | | — | | | | 11,376 | | |
Pharmaceuticals | | | — | | | | 9,331 | | | | — | | | | 9,331 | | |
Real Estate
Management &
Development | | | — | | | | 12,908 | | | | — | | | | 12,908 | | |
Road & Rail | | | — | | | | 3,002 | | | | — | | | | 3,002 | | |
Software | | | 7,128 | | | | — | | | | — | | | | 7,128 | | |
Specialty Retail | | | — | | | | 2,836 | | | | — | | | | 2,836 | | |
Transportation
Infrastructure | | | — | | | | 4,643 | | | | — | | | | 4,643 | | |
Wireless
Telecommunication
Services | | | — | | | | 19,108 | | | | — | | | | 19,108 | | |
Total Common Stocks | | | 55,524 | | | | 208,725 | | | | — | | | | 264,249 | | |
Participation Notes | | | — | | | | 8,807 | | | | — | | | | 8,807 | | |
Warrants | | | — | | | | 3,182 | | | | — | | | | 3,182 | | |
Total Assets | | $ | 55,524 | | | $ | 220,714 | | | $ | — | | | $ | 276,238 | | |
Transfers between investment levels may occur as the markets fluctuate and/or the availability of data used in an investment's valuation changes.
3. Foreign Currency Translation and Foreign Investments: The books and records of the Fund are maintained in U.S. dollars. Foreign currency amounts are translated into U.S. dollars as follows:
– investments, other assets and liabilities at the prevailing rate of exchange on the valuation date;
– investment transactions and investment income at the prevailing rates of exchange on the dates of such transactions.
Although the net assets of the Fund are presented at the foreign exchange rates and market values at the close of the period, the Fund does not isolate that portion of the results of operations arising as a result of changes in the foreign exchange rates from the fluctuations arising from changes in the market prices of securities held at period end. Similarly, the Fund does not isolate the effect of changes in foreign exchange rates from the fluctuations arising from changes in the market prices of securities sold during the period. Accordingly, realized and unrealized foreign currency gains (losses) on investments in securities are included in the reported net realized and unrealized gains (losses) on investment transactions and balances. However, pursuant to U.S. federal income tax regulations, gains and losses from certain foreign currency transactions and the foreign currency portion of gains and losses realized on sales and maturities of foreign denominated debt securities are treated as ordinary income for U.S. federal income tax purposes.
Net realized gains (losses) on foreign currency transactions represent net foreign exchange gains (losses) from foreign currency forward exchange contracts, disposition of foreign currencies, currency gains (losses) realized between the trade and settlement dates on securities transactions, and the difference between the amount of investment income and foreign withholding taxes recorded on the Fund's books and the U.S. dollar equivalent amounts actually received or paid. Net unrealized currency gains (losses) from valuing foreign currency denominated assets and liabilities at period end exchange rates are reflected as a component of unrealized appreciation (depreciation) in the Statement of Assets and Liabilities. The change in unrealized currency gains (losses) on foreign currency translations for the period is reflected in the Statement of Operations.
A significant portion of the Fund's net assets consist of securities of issuers located in emerging markets, which are denominated in foreign currencies. Such securities may be concentrated in a limited number of countries and regions and may vary throughout the year. Changes in currency exchange rates will affect the value of securities and investment income from foreign currency denominated securities. Emerging market securities are
21
Morgan Stanley Institutional Fund, Inc.
Annual Report — December 31, 2018
Notes to Financial Statements (cont'd)
often subject to greater price volatility, limited capitalization and liquidity, and higher rates of inflation than securities of companies based in the U.S. In addition, emerging market issuers may be subject to substantial governmental involvement in the economy and greater social, economic and political uncertainty.
Governmental approval for foreign investments may be required in advance of making an investment under certain circumstances in some countries, and the extent of foreign investments in domestic companies may be subject to limitation in other countries. Foreign ownership limitations also may be imposed by the charters of individual companies to prevent, among other concerns, violations of foreign investment limitations. As a result, an additional class of shares (identified as "Foreign" in the Portfolio of Investments) may be created and offered for investment. The "local" and "foreign shares" market values may differ. In the absence of trading of the foreign shares in such markets, the Fund values the foreign shares at the closing exchange price of the local shares.
4. Structured Investments: The Fund invested a portion of its assets in structured investments. A structured investment is a derivative security designed to offer a return linked to a particular underlying security, currency, commodity or market. Structured investments may come in various forms including notes (such as exchange-traded notes), warrants and options to purchase securities. The Fund will typically use structured investments to gain exposure to a permitted underlying security, currency, commodity or market when direct access to a market is limited or inefficient from a tax or cost standpoint. There can be no assurance that structured investments will trade at the same price or have the same value as the underlying security, currency, commodity or market. Investments in structured investments involve risks including issuer risk, counterparty risk and market risk. Holders of structured investments bear risks of the underlying investment and are subject to issuer or counterparty risk because the Fund is relying on the creditworthiness of such issuer or counterparty and has no rights with respect to the underlying investment. Certain structured investments may be thinly traded or have a limited trading market and may have the effect of increasing the Fund's illiquidity to the extent that the Fund, at a particular time, may be unable to find qualified buyers for these securities.
5. Redemption Fees: The Fund will assess a 2% redemption fee on Class I shares, Class A shares, Class L shares, Class C shares and Class IS shares, which is paid directly to the Fund, for shares redeemed or exchanged within thirty days of purchase, subject to certain exceptions. The redemption fee is designed to protect the Fund and its remaining shareholders from the effects of short-term trading. These fees, if any, are included in the Statements of Changes in Net Assets.
6. Indemnifications: The Company enters into contracts that contain a variety of indemnifications. The Company's maximum exposure under these arrangements is unknown. However, the Company has not had prior claims or losses pursuant to these contracts and expects the risk of loss to be remote.
7. Dividends and Distributions to Shareholders: Dividend income and distributions to shareholders are recorded on the ex-dividend date. Dividends from net investment income, if any, are declared and paid annually. Net realized capital gains, if any, are distributed at least annually.
8. Security Transactions, Income and Expenses: Security transactions are accounted for on the trade date (date the order to buy or sell is executed). Realized gains and losses on the sale of investment securities are determined on the specific identified cost method. Dividend income and other distributions are recorded on the ex-dividend date (except for certain foreign dividends which may be recorded as soon as the Fund is informed of such dividends) net of applicable withholding taxes. Interest income is recognized on the accrual basis except where collection is in doubt. Discounts are accreted and premiums are amortized over the life of the respective securities. Most expenses of the Company can be directly attributed to a particular Fund. Expenses which cannot be directly attributed are apportioned among the Funds based upon relative net assets or other appropriate methods. Income, expenses (other than class specific expenses — distribution and shareholder services, transfer agency and sub transfer agency fees) and realized and unrealized gains or losses are allocated to each class of shares based upon their relative net assets.
B. Advisory Fees: The Adviser, a wholly-owned subsidiary of Morgan Stanley, provides the Fund with advisory services under the terms of an Investment Advisory Agreement, paid
22
Morgan Stanley Institutional Fund, Inc.
Annual Report — December 31, 2018
Notes to Financial Statements (cont'd)
quarterly, at an annual rate of 1.25% of the daily net assets of the Fund.
The Adviser has agreed to reduce its advisory fee and/or reimburse the Fund so that total annual portfolio operating expenses, excluding certain investment related expenses, taxes, interest and other extraordinary expenses (including litigation), will not exceed 1.85% for Class I shares, 2.20% for Class A shares, 2.70% for Class L shares, 2.95% for Class C shares and 1.80% for Class IS shares. The fee waivers and/or expense reimbursements will continue for at least one year from the date of the Fund's prospectus or until such time as the Directors act to discontinue all or a portion of such waivers and/or reimbursements when they deem such action is appropriate. This arrangement had no effect for the year ended December 31, 2018.
C. Administration Fees: The Adviser also serves as Administrator to the Company and provides administrative services pursuant to an Administration Agreement for an annual fee, accrued daily and paid monthly, of 0.08% of the Fund's average daily net assets.
Under a Sub-Administration Agreement between the Administrator and State Street Bank and Trust Company ("State Street"), State Street provides certain administrative services to the Company. For such services, the Administrator pays State Street a portion of the fee the Administrator receives from the Fund.
D. Distribution and Shareholder Services Fees: Morgan Stanley Distribution, Inc. ("MSDI" or the "Distributor"), a wholly-owned subsidiary of the Adviser and an indirect subsidiary of Morgan Stanley, serves as the Company's Distributor of Fund shares pursuant to a Distribution Agreement. The Company has adopted a Shareholder Services Plan with respect to Class A shares pursuant to Rule 12b-1 under the Act. Under the Shareholder Services Plan, the Fund pays the Distributor a shareholder services fee, accrued daily and paid monthly, at an annual rate of 0.25% of the Fund's average daily net assets attributable to Class A shares.
The Company has adopted a Distribution and Shareholder Services Plan with respect to Class L shares pursuant to Rule 12b-1 under the Act. Under the Distribution and Shareholder Services Plan, the Fund pays the Distributor a distribution fee, accrued daily and paid monthly, at an annual rate of 0.50% and a shareholder services fee, accrued daily and paid monthly, at an annual rate of 0.25% of the Fund's average daily net assets attributable to Class L shares.
The Company has adopted a Distribution and Shareholder Services Plan with respect to Class C shares pursuant to Rule 12b-1 under the Act. Under the Distribution and Shareholder Services Plan, the Fund pays the Distributor a distribution fee, accrued daily and paid monthly, at an annual rate of 0.75% and a shareholder services fee, accrued daily and paid monthly, at an annual rate of 0.25% of the Fund's average daily net assets attributable to Class C shares.
The distribution and shareholder services fees are used to support the expenses associated with servicing and maintaining accounts. The Distributor may compensate other parties for providing shareholder support services to investors who purchase Class A, Class L and Class C shares.
E. Dividend Disbursing and Transfer Agent: The Company's dividend disbursing and transfer agent is DST Asset Manager Solutions, Inc. ("DST"). Pursuant to a Transfer Agency Agreement, the Company pays DST a fee based on the number of classes, accounts and transactions relating to the Funds of the Company.
F. Custodian Fees: State Street (the "Custodian") also serves as Custodian for the Company in accordance with a Custodian Agreement. The Custodian holds cash, securities and other assets of the Company as required by the Act. Custody fees are payable monthly based on assets held in custody, investment purchases and sales activity and account maintenance fees, plus reimbursement for certain out-of-pocket expenses.
G. Security Transactions and Transactions with Affiliates: For the year ended December 31, 2018, purchases and sales of investment securities for the Fund, other than long-term U.S. Government securities and short-term investments were approximately $334,148,000 and $614,999,000, respectively. There were no purchases and sales of long-term U.S. Government securities for the year ended December 31, 2018.
The Fund invests in the Institutional Class of the Morgan Stanley Institutional Liquidity Funds — Government Portfolio (the "Liquidity Funds"), an open-end management investment company managed by the Adviser. Advisory fees paid by the Fund are reduced by an amount equal to its pro-rata share of the advisory and administration fees paid by the Fund due to its investment in the Liquidity Funds. For the year ended December 31, 2018, advisory fees paid were reduced by approximately $9,000 relating to the Fund's investment in the Liquidity Funds.
23
Morgan Stanley Institutional Fund, Inc.
Annual Report — December 31, 2018
Notes to Financial Statements (cont'd)
A summary of the Fund's transactions in shares of affiliated investments during the year ended December 31, 2018 is as follows:
Affiliated
Investment
Company | | Value
December 31,
2017
(000) | | Purchases
at Cost
(000) | | Proceeds
from Sales
(000) | | Dividend
Income
(000) | |
Liquidity Funds | | $ | 14,764 | | | $ | 186,584 | | | $ | 201,348 | | | $ | 84 | | |
Affiliated
Investment
Company (cont'd) | | Realized
Gain
(Loss)
(000) | | Change in
Unrealized
Appreciation
(Depreciation)
(000) | | Value
December 31,
2018
(000) | |
Liquidity Funds | | $ | — | | | $ | — | | | $ | — | | |
During the year ended December 31, 2018, the Fund incurred approximately $1,000 in brokerage commissions with Morgan Stanley & Co. LLC, an affiliate of the Adviser/Administrator and Distributor, for portfolio transactions executed on behalf of the Fund.
The Fund is permitted to purchase and sell securities ("cross-trade") from and to other Morgan Stanley funds as well as other funds and client accounts for which the Adviser or an affiliate of the Adviser serves as investment adviser, pursuant to procedures approved by the Directors in compliance with Rule 17a-7 under the Act (the "Rule"). Each cross-trade is executed at the current market price in compliance with provisions of the Rule. For the year ended December 31, 2018, the Fund did not engage in any cross-trade transactions.
The Fund has an unfunded Deferred Compensation Plan (the "Compensation Plan"), which allows each independent Director to defer payment of all, or a portion, of the fees he or she receives for serving on the Board of Directors. Each eligible Director generally may elect to have the deferred amounts credited with a return equal to the total return on one or more of the Morgan Stanley funds that are offered as investment options under the Compensation Plan. Appreciation/depreciation and distributions received from these investments are recorded with an offsetting increase/decrease in the deferred compensation obligation and do not affect the NAV of the Fund.
H. Federal Income Taxes: It is the Fund's intention to continue to qualify as a regulated investment company and distribute all of its taxable and tax-exempt income. Accordingly, no provision for Federal income taxes is required in the financial statements.
The Fund may be subject to taxes imposed by countries in which it invests. Such taxes are generally based on income and/or capital
gains earned or repatriated. Taxes are accrued based on net investment income, net realized gains and net unrealized appreciation as such income and/or gains are earned. Taxes may also be based on transactions in foreign currency and are accrued based on the value of investments denominated in such currency.
FASB ASC 740-10, "Income Taxes — Overall", sets forth a minimum threshold for financial statement recognition of the benefit of a tax position taken or expected to be taken in a tax return. Management has concluded there are no significant uncertain tax positions that would require recognition in the financial statements. If applicable, the Fund recognizes interest accrued related to unrecognized tax benefits in "Interest Expense" and penalties in "Other Expenses" in the Statement of Operations. The Fund files tax returns with the U.S. Internal Revenue Service, New York and various states. Generally, each of the tax years in the four-year period ended December 31, 2018 remains subject to examination by taxing authorities.
The tax character of distributions paid may differ from the character of distributions for GAAP purposes due to short-term capital gains being treated as ordinary income for tax purposes. The tax character of distributions paid during fiscal years 2018 and 2017 was as follows:
2018
Distributions
Paid From: | | 2017
Distributions
Paid From: | |
Ordinary
Income
(000) | | Long-Term
Capital Gain
(000) | | Ordinary
Income
(000) | | Long-Term
Capital Gain
(000) | |
| $ | 14,633 | | | $ | — | | | $ | — | | | $ | — | | |
The amount and character of income and gains to be distributed are determined in accordance with income tax regulations which may differ from GAAP. These book/tax differences are either considered temporary or permanent in nature.
Temporary differences are attributable to differing book and tax treatments for the timing of the recognition of gains (losses) on certain investment transactions and the timing of the deductibility of certain expenses.
Permanent differences, primarily due to a nondeductible expense, resulted in the following reclassifications among the components of net assets at December 31, 2018:
Total
Accumulated
Loss
(000) | | Paid-in-
Capital
(000) | |
| $ | 91 | | | $ | (91 | ) | |
24
Morgan Stanley Institutional Fund, Inc.
Annual Report — December 31, 2018
Notes to Financial Statements (cont'd)
At December 31, 2018, the Fund had no distributable earnings on a tax basis.
At December 31, 2018, the Fund had available for federal income tax purposes unused short-term capital losses of approximately $78,733,000 that do not have an expiration date.
To the extent that capital loss carryforwards are used to offset any future capital gains realized, no capital gains tax liability will be incurred by the Fund for gains realized and not distributed. To the extent that capital gains are offset, such gains will not be distributed to the shareholders.
Qualified late year losses are capital losses and specified ordinary losses, including currency losses, incurred after October 31 but within the taxable year that, if elected, are deemed to arise on the first day of the Fund's next taxable year. For the year ended December 31, 2018, the Fund intends to defer to January 1, 2019 for U.S. federal income tax purposes the following losses:
Qualified
Late Year
Ordinary
Losses
(000) | | Post-October
Capital
Losses
(000) | |
| $ | 103 | | | $ | — | | |
I. Credit Facility: The Company and other Morgan Stanley funds participated in a $150,000,000 committed, unsecured revolving line of credit facility (the "Facility") with State Street. This Facility is to be used for temporary emergency purposes or funding of shareholder redemption requests. The interest rate on borrowings is based on the federal funds rate or 1 month LIBOR rate plus a spread. The Facility also has a commitment fee of 0.25% per annum based on the unused portion of the Facility. During the year ended December 31, 2018, the Fund did not have any borrowings under the Facility.
J. Other: At December 31, 2018, the Fund had record owners of 10% or greater. Investment activities of these shareholders could have a material impact on the Fund. The aggregate percentage of such owners was 41.6%.
25
Morgan Stanley Institutional Fund, Inc.
Annual Report — December 31, 2018
Report of Independent Registered Public Accounting Firm
To the Shareholders and Board of Directors of
Morgan Stanley Institutional Fund, Inc. —
Frontier Markets Portfolio
Opinion on the Financial Statements
We have audited the accompanying statement of assets and liabilities of Frontier Markets Portfolio (the "Fund") (one of the funds constituting the Morgan Stanley Institutional Fund, Inc. (the "Company")), including the portfolio of investments, as of December 31, 2018, and the related statement of operations for the year then ended, the statements of changes in net assets for each of the two years in the period then ended, the financial highlights for each of the five years in the period then ended and the related notes (collectively referred to as the "financial statements"). In our opinion, the financial statements present fairly, in all material respects, the financial position of Frontier Markets Portfolio (one of the funds constituting Morgan Stanley Institutional Fund, Inc.) at December 31, 2018, the results of its operations for the year then ended, the changes in its net assets for each of the two years in the period then ended and its financial highlights for each of the five years in the period then ended, in conformity with U.S. generally accepted accounting principles.
Basis for Opinion
These financial statements are the responsibility of the Company's management. Our responsibility is to express an opinion on the Fund's financial statements based on our audits. We are a public accounting firm registered with the Public Company Accounting Oversight Board (United States) ("PCAOB") and are required to be independent with respect to the Company in accordance with the U.S. federal securities law and the applicable rules and regulations of the Securities and Exchange Commission and the PCAOB.
We conducted our audits in accordance with the standards of the PCAOB. Those standards require that we plan and perform the audit to obtain reasonable assurance about whether the financial statements are free of material misstatement, whether due to error or fraud. The Company is not required to have, nor were we engaged to perform, an audit of the Company's internal control over financial reporting. As part of our audits, we are required to obtain an understanding of internal control over financial reporting, but not for the purpose of expressing an opinion on the effectiveness of the Company's internal control over financial reporting. Accordingly, we express no such opinion.
Our audits included performing procedures to assess the risks of material misstatement of the financial statements, whether due to error or fraud, and performing procedures that respond to those risks. Such procedures included examining, on a test basis, evidence regarding the amounts and disclosures in the financial statements. Our procedures included confirmation of securities owned as of December 31, 2018 by correspondence with the custodian and others or by other appropriate auditing procedures where replies from others were not received. Our audits also included evaluating the accounting principles used and significant estimates made by management, as well as evaluating the overall presentation of the financial statements. We believe that our audits provide a reasonable basis for our opinion.

We have served as the auditor of one or more Morgan Stanley investment companies since 2000.
Boston, Massachusetts
February 26, 2019
26
Morgan Stanley Institutional Fund, Inc.
Annual Report — December 31, 2018
Federal Tax Notice (unaudited)
For federal income tax purposes, the following information is furnished with respect to the Fund's earnings for its taxable year ended December 31, 2018. When distributed, certain earnings may be subject to a maximum tax rate of 15% as provided for by the Jobs and Growth Tax Relief Reconciliation Act of 2003. The Fund designated up to a maximum of approximately $13,574,000 as taxable at this lower rate.
The Fund intends to pass through foreign tax credits of approximately $1,637,000 and has derived net income from sources within foreign countries amounting to approximately $21,716,000.
In January, the Fund provides tax information to shareholders for the preceding calendar year.
27
Morgan Stanley Institutional Fund, Inc.
Annual Report — December 31, 2018
Privacy Notice (unaudited)
MORGAN STANLEY INVESTMENT MANAGEMENT INC.
AN IMPORTANT NOTICE CONCERNING OUR U.S. PRIVACY POLICY
We are required by federal law to provide you with a copy of our privacy policy annually. This policy applies to current and former individual investors in funds managed or sponsored by Morgan Stanley Investment Management Inc. ("MSIM") as well as current and former individual clients of MSIM. This policy is not applicable to partnerships, corporations, trusts or other non-individual clients or investors. Please note that we may amend this policy at any time, and will inform you of any changes as required by law.
WE RESPECT YOUR PRIVACY
We appreciate that you have provided us with your personal financial information. We strive to maintain the privacy of such information while we help you achieve your financial objectives. This Notice describes what non-public personal information we collect about you, why we collect it, when we may share it with others and how certain others may use it. It discusses the steps you may take to limit our sharing of certain information about you to affiliated companies in the Morgan Stanley family of companies ("other Morgan Stanley companies"). It also discloses how you may limit use of certain shared information for marketing purposes by other Morgan Stanley branded companies. Throughout this policy, we refer to the non-public information that personally identifies you or your accounts as "personal information.''
1. WHAT PERSONAL INFORMATION DO WE COLLECT ABOUT YOU?
We obtain personal information from applications and other forms you submit to us, from your dealings with us, from consumer reporting agencies, from our Web sites and from third parties and other sources.
For example:
• We may collect information such as your name, address, e-mail address, telephone/fax numbers, assets, income and investment objectives through subscription documents, applications and other forms you submit to us.
• We may obtain information about account balances, your use of account(s) and the types of products and services you prefer to receive from us through your dealings and transactions with us and other sources.
• We may obtain information about your creditworthiness and credit history from consumer reporting agencies.
• We may collect background information from and through third-party vendors to verify representations you have made and to comply with various regulatory requirements.
• If you interact with us through our public and private Web sites, we may collect information that you provide directly through online communications (such as an e-mail address). We may also collect information about your Internet service provider, your domain name, your computer's operating system and Web browser, your use of our Web sites and your product and service preferences, through the use of "cookies." Please consult the Terms of Use of these sites for more details.
2. WHEN DO WE DISCLOSE PERSONAL INFORMATION WE COLLECT ABOUT YOU?
We may disclose personal information we collect about you to other Morgan Stanley companies and to non-affiliated third parties.
a. Information We Disclose to Other Morgan Stanley Companies.
We may disclose personal information to other Morgan Stanley companies for a variety of reasons, including to manage your account(s) effectively, to service and process your transactions, to let you know about products and services offered by us and other Morgan Stanley companies, to manage our business, and as otherwise required or permitted by law. Offers for products and services from other Morgan Stanley companies are developed under conditions designed to safeguard your personal information.
28
Morgan Stanley Institutional Fund, Inc.
Annual Report — December 31, 2018
Privacy Notice (unaudited) (cont'd)
b. Information We Disclose to Non-affiliated Third Parties.
We do not disclose personal information that we collect about you to non-affiliated third parties except to those who provide marketing services on our behalf, to financial institutions with whom we have joint marketing agreements, and as otherwise required or permitted by law. For example, we may disclose personal information to non-affiliated third parties for servicing and processing transactions, to offer our own products and services, to protect against fraud, for institutional risk control, to respond to judicial process or to perform services on our behalf. When we share personal information with a non-affiliated third party, they are required to limit their use of personal information to the particular purpose for which it was shared and they are not allowed to share personal information with others except to fulfill that limited purpose or as may be permitted or required by law.
3. HOW DO WE PROTECT THE SECURITY AND CONFIDENTIALITY OF PERSONAL INFORMATION WE COLLECT ABOUT YOU?
We maintain physical, electronic and procedural security measures to help safeguard the personal information we collect about you. We have internal policies governing the proper handling of client information. Third parties that provide support or marketing services on our behalf may also receive personal information, and we require them to adhere to confidentiality standards with respect to such information.
4. HOW CAN YOU LIMIT THE SHARING OF CERTAIN TYPES OF PERSONAL INFORMATION WITH OTHER MORGAN STANLEY COMPANIES?
We offer you choices as to whether we share with other Morgan Stanley companies the personal information that was collected to determine your eligibility for products and services you request ("eligibility information"). Eligibility information does not include your identification information or personal information pertaining to our transactions or experiences with you. Please note that, even if you direct us not to share eligibility information with other Morgan Stanley companies ("opt-out"), we may still share personal information, including eligibility information, with those companies in circumstances excluded from the opt-out under applicable law, such as to process transactions or to service your account.
5. HOW CAN YOU LIMIT THE USE OF CERTAIN TYPES OF PERSONAL INFORMATION BY OTHER MORGAN STANLEY COMPANIES FOR MARKETING?
By following the opt-out instructions in Section 6 below, you may limit other Morgan Stanley branded companies from marketing their products or services to you based on personal information we disclose to them. This information may include, for example, your income and account history with us. Please note that, even if you choose to limit Other Morgan Stanley Companies from using personal information about you that we may share with them for marketing their products and services to you, Other Morgan Stanley Companies may use your personal information that they obtain from us to market to you in circumstances permitted by law, such as if the Other Morgan Stanley Company has its own relationship with you.
6. HOW CAN YOU SEND US AN OPT-OUT INSTRUCTION?
If you wish to limit our sharing of eligibility information about you with other Morgan Stanley companies or other Morgan Stanley companies' use of personal information for marketing purposes, as described in this notice, you may do so by:
• Calling us at (800) 548-7786
Monday–Friday between 8a.m. and 6p.m. (EST)
• Writing to us at the following address:
DST Asset Manager Solutions, Inc.
c/o Privacy Coordinator
P.O. Box 219804
Kansas City, Missouri 64121
29
Morgan Stanley Institutional Fund, Inc.
Annual Report — December 31, 2018
Privacy Notice (unaudited) (cont'd)
Your written request should include your name, address, telephone number and account number(s) to which the opt-out applies and whether you are opting out with respect to sharing of eligibility information (Section 4 above), or if information used for Marketing (Section 5 above) or both. Written opt-out requests should not be sent with any other correspondence. In order to process your request, we require that the request be provided by you directly and not through a third party.
Your opt-out preference will remain in effect with respect to this policy (as it may be amended) until you notify us otherwise. If you have a joint account, your direction for us not to share this information with other Morgan Stanley companies and for those other Morgan Stanley companies not to use your personal information for marketing will be applied to all account holders on that account. Please understand that if you limit our sharing or our affiliated companies' use of personal information, you and any joint account holder(s) may not receive information about Morgan Stanley products and services, including products or services that could help you manage your financial resources and achieve your investment objectives.
7. WHAT IF AN AFFILIATED COMPANY BECOMES A NON-AFFILIATED THIRD PARTY?
If, at any time in the future, an affiliated company becomes a non-affiliated third party, further disclosures of personal information made to the former affiliated company will be limited to those described in Section 2(b) above relating to non-affiliated third parties. If you elected under Section 6 to limit disclosures we make to affiliated companies, or use of personal information by affiliated companies, your election will not apply to use by any former affiliated company of your personal information in their possession once it becomes a non-affiliated third party.
SPECIAL NOTICE TO RESIDENTS OF VERMONT
The following section supplements our Policy with respect to our individual clients who have a Vermont address and supersedes anything to the contrary in the above Policy with respect to those clients only.
The state of Vermont requires financial institutions to obtain your consent prior to sharing personal information that they collect about you with affiliated companies and non-affiliated third parties other than in certain limited circumstances. Except as permitted by law, we will not share personal information we collect about you with non-affiliated third parties or other Morgan Stanley companies unless you provide us with your written consent to share such information ("opt-in").
If you wish to receive offers for investment products and services offered by or through other Morgan Stanley companies, please notify us in writing at the following address:
DST Asset Manager Solutions, Inc.
c/o Privacy Coordinator
P.O. Box 219804
Kansas City, Missouri 64121
Your authorization should include your name, address, telephone number and account number(s) to which the opt-in applies and should not be sent with any other correspondence. In order to process your authorization, we require that the authorization be provided by you directly and not through a third party.
SPECIAL NOTICE TO RESIDENTS OF CALIFORNIA
The following section supplements our Policy with respect to our individual clients who have a California address and supersedes anything to the contrary in the above Policy with respect to those clients only.
In response to a California law, if your account has a California home address, your personal information will not be disclosed to non-affiliated third parties except as permitted by applicable California law, and we will limit sharing such information with our affiliates to comply with California privacy laws that apply to us.
30
Morgan Stanley Institutional Fund, Inc.
Annual Report — December 31, 2018
Director and Officer Information (unaudited)
Independent Directors:
Name, Age and Address of
Independent Director | | Position(s)
Held with
Registrant | | Length of Time
Served* | | Principal Occupation(s) During Past 5 Years
and Other Relevant Professional Experience | | Number of
Portfolios in
Fund Complex
Overseen by
Independent
Director** | | Other Directorships
Held by Independent
Director*** | |
Frank L. Bowman (74)
c/o Perkins Coie LLP
Counsel to the Independent
Directors
30 Rockefeller Plaza
New York, NY 10112 | | Director | | Since
August
2006 | | President, Strategic Decisions, LLC (consulting) (since February 2009); Director or Trustee of various Morgan Stanley Funds (since August 2006); Chairperson of the Compliance and Insurance Committee (since October 2015); formerly, Chairperson of the Insurance Sub-Committee of the Compliance and Insurance Committee (2007-2015); served as President and Chief Executive Officer of the Nuclear Energy Institute (policy organization) (February 2005-November 2008); retired as Admiral, U.S. Navy after serving over 38 years on active duty including 8 years as Director of the Naval Nuclear Propulsion Program in the Department of the Navy and the U.S. Department of Energy (1996-2004); served as Chief of Naval Personnel (July 1994-September 1996) and on the Joint Staff as Director of Political Military Affairs (June 1992-July 1994); knighted as Honorary Knight Commander of the Most Excellent Order of the British Empire; awarded the Officier de l'Orde National du Mérite by the French Government; elected to the National Academy of Engineering (2009). | | | 82 | | | Director of BP p.l.c.; Director of Naval and Nuclear Technologies LLP; Director Emeritus of the Armed Services YMCA; Member of the National Security Advisory Council of the Center for U.S. Global Engagement and a member of the CNA Military Advisory Board; Trustee of Fairhaven United Methodist Church; Member of the Board of Advisors of the Dolphin Scholarship Foundation; and Director of other various non-profit organizations. | |
Kathleen A. Dennis (65)
c/o Perkins Coie LLP
Counsel to the Independent Directors
30 Rockefeller Plaza
New York, NY 10112 | | Director | | Since
August
2006 | | President, Cedarwood Associates (mutual fund and investment management consulting) (since July 2006); Chairperson of the Liquidity and Alternatives Sub-Committee of the Investment Committee (since October 2006) and Director or Trustee of various Morgan Stanley Funds (since August 2006); formerly, Senior Managing Director of Victory Capital Management (1993-2006). | | | 82 | | | Director of various non-profit organizations. | |
Nancy C. Everett (63)
c/o Perkins Coie LLP
Counsel to the Independent Directors
30 Rockefeller Plaza
New York, NY 10112 | | Director | | Since
January
2015 | | Chief Executive Officer, Virginia Commonwealth University Investment Company (since November 2015); Owner, OBIR, LLC (institutional investment management consulting) (since June 2014); formerly, Managing Director, BlackRock Inc. (February 2011-December 2013); and Chief Executive Officer, General Motors Asset Management (a/k/a Promark Global Advisors, Inc.) (June 2005-May 2010). | | | 83 | | | Formerly, Member of Virginia Commonwealth University School of Business Foundation (2005-2016); Member of Virginia Commonwealth University Board of Visitors (2013-2015); Member of Committee on Directors for Emerging Markets Growth Fund, Inc. (2007-2010); Chairperson of Performance Equity Management, LLC (2006-2010); and Chairperson, GMAM Absolute Return Strategies Fund, LLC (2006-2010). | |
31
Morgan Stanley Institutional Fund, Inc.
Annual Report — December 31, 2018
Director and Officer Information (unaudited) (cont'd)
Independent Directors: (cont'd)
Name, Age and Address of
Independent Director | | Position(s)
Held with
Registrant | | Length of Time
Served* | | Principal Occupation(s) During Past 5 Years
and Other Relevant Professional Experience | | Number of
Portfolios in
Fund Complex
Overseen by
Independent
Director** | | Other Directorships
Held by Independent
Director*** | |
Jakki L. Haussler (61)
c/o Perkins Coie LLP
Counsel to the Independent Directors
30 Rockefeller Plaza
New York, NY 10112 | | Director | | Since
January
2015 | | Chairman and Chief Executive Officer, Opus Capital Group (since January 1996); formerly, Director, Capvest Venture Fund, LP (May 2000-December 2011); Partner, Adena Ventures, LP (July 1999-December 2010); Director, The Victory Funds (February 2005-July 2008). | | | 83 | | | Director of Service Corporation International and Member, Audit Committee and Investment Committee; Director of Cincinnati Bell Inc. and Member, Audit Committee and Governance and Nominating Committee; Chairman of Northern Kentucky University Member Investment Committee; Member of Chase College of Law Transactional Law Practice Center Board of Advisors; Director of Best Transport; Director of Chase College of Law Board of Visitors; formerly, Member, University of Cincinnati Foundation Investment Committee; Member, Miami University Board of Visitors (2008-2011); Trustee of Victory Funds (2005-2008) and Chairman, Investment Committee (2007-2008) and Member, Service Provider Committee (2005-2008). | |
Dr. Manuel H. Johnson (69)
c/o Johnson Smick
International, Inc.
220 I Street, NE — Suite 200
Washington, D.C. 20002 | | Director | | Since
July
1991 | | Senior Partner, Johnson Smick International, Inc. (consulting firm); Chairperson of the Investment Committee (since October 2006) and Director or Trustee of various Morgan Stanley Funds (since July 1991); Co-Chairman and a founder of the Group of Seven Council (G7C) (international economic commission); formerly, Chairperson of the Audit Committee (July 1991-September 2006), Vice Chairman of the Board of Governors of the Federal Reserve System and Assistant Secretary of the U.S. Treasury. | | | 82 | | | Director of NVR, Inc. (home construction). | |
Joseph J. Kearns (76)
c/o Perkins Coie LLP
Counsel to the Independent Directors
30 Rockefeller Plaza
New York, NY 10112 | | Director | | Since
August
1994 | | Senior Adviser, Kearns & Associates LLC (investment consulting); Chairperson of the Audit Committee (since October 2006) and Director or Trustee of various Morgan Stanley Funds (since August 1994); formerly, Deputy Chairperson of the Audit Committee (July 2003-September 2006) and Chairperson of the Audit Committee of various Morgan Stanley Funds (since August 1994); CFO of the J. Paul Getty Trust. | | | 83 | | | Prior to August 10, 2016, Director of Electro Rent Corporation (equipment leasing); Prior to December 31, 2013, Director of The Ford Family Foundation. | |
32
Morgan Stanley Institutional Fund, Inc.
Annual Report — December 31, 2018
Director and Officer Information (unaudited) (cont'd)
Independent Directors: (cont'd)
Name, Age and Address of
Independent Director | | Position(s)
Held with
Registrant | | Length of Time
Served* | | Principal Occupation(s) During Past 5 Years
and Other Relevant Professional Experience | | Number of
Portfolios in
Fund Complex
Overseen by
Independent
Director** | | Other Directorships
Held by Independent
Director*** | |
Michael F. Klein (60)
c/o Perkins Coie LLP
Counsel to the Independent Directors
30 Rockefeller Plaza
New York, NY 10112 | | Director | | Since
August
2006 | | Managing Director, Aetos Alternatives Management, LP (since March 2000); Co-President, Aetos Alternatives Management, LP (since January 2004) and Co-Chief Executive Officer of Aetos Alternatives Management, LP (since August 2013); Chairperson of the Fixed Income Sub-Committee of the Investment Committee (since October 2006) and Director or Trustee of various Morgan Stanley Funds (since August 2006); formerly, Managing Director, Morgan Stanley & Co. Inc. and Morgan Stanley Dean Witter Investment Management and President, various Morgan Stanley Funds (June 1998-March 2000); Principal, Morgan Stanley & Co. Inc. and Morgan Stanley Dean Witter Investment Management (August 1997-December 1999). | | | 82 | | | Director of certain investment funds managed or sponsored by Aetos Alternatives Management, LP; Director of Sanitized AG and Sanitized Marketing AG (specialty chemicals). | |
Patricia Maleski (58)
c/o Perkins Coie LLP
Counsel to the Independent Directors
30 Rockefeller Plaza
New York, NY 10112 | | Director | | Since
January
2017 | | Managing Director, JPMorgan Asset Management (2004-2016); Oversight and Control Head of Fiduciary and Conflicts of Interest Program (2015-2016); Chief Control Officer-Global Asset Management (2013-2015); President, JPMorgan Funds (2010-2013); Chief Administrative Officer (2004-2013); various other positions including Treasurer and Board Liaison (since 2001). | | | 83 | | | None. | |
Michael E. Nugent (82)
522 Fifth Avenue
New York, NY 10036 | | Chair of the Board and Director | | Chair of the Boards since July 2006 and Director since July 1991 | | Chair of the Boards of various Morgan Stanley Funds (since July 2006); Chairperson of the Closed-End Fund Committee (since June 2012) Governance Committee (since January 2019) and Director or Trustee of various Morgan Stanley Funds (since July 1991); formerly, Chairperson of the Insurance Committee (until July 2006); General Partner, Triumph Capital, L.P. (private investment partnership) (1988-2013). | | | 82 | | | None. | |
W. Allen Reed (71)
c/o Perkins Coie LLP
Counsel to the Independent Directors
30 Rockefeller Plaza
New York, NY 10112 | | Director | | Since
August
2006 | | Chairperson of the Equity Sub-Committee of the Investment Committee (since October 2006) and Director or Trustee of various Morgan Stanley Funds (since August 2006); formerly, President and CEO of General Motors Asset Management; Chairman and Chief Executive Officer of the GM Trust Bank and Corporate Vice President of General Motors Corporation (August 1994-December 2005). | | | 82 | | | Director of Legg Mason, Inc.; formerly, Director of the Auburn University Foundation (2010-2015). | |
Fergus Reid (86)****
c/o Joe Pietryka, Inc.
85 Charles Colman Blvd.
Pawling, NY 12564 | | Director | | Since
June
1992 | | Chairman, Joe Pietryka, Inc.; Chairperson of the Governance Committee and Director or Trustee of various Morgan Stanley Funds (since June 1992). | | | 83 | | | Formerly, Trustee and Director of certain investment companies in the JP Morgan Fund Complex managed by JP Morgan Investment Management Inc. (1987-2012). | |
* This is the earliest date the Director began serving the Morgan Stanley Funds. Each Director serves an indefinite term, until his or her successor is elected.
** The Fund Complex includes (as of December 31, 2018) all open-end and closed-end funds (including all of their portfolios) advised by Morgan Stanley Investment Management Inc. (the "Adviser") and any funds that have an adviser that is an affiliated person of the Adviser (including, but not limited to, Morgan Stanley AIP GP LP).
*** This includes any directorships at public companies and registered investment companies held by the Director at any time during the past five years.
**** Effective date of retirement is December 31, 2018.
33
Morgan Stanley Institutional Fund, Inc.
Annual Report — December 31, 2018
Director and Officer Information (unaudited) (cont'd)
Executive Officers:
Name, Age and Address of Executive Officer | | Position(s) Held
with
Registrant | | Length of Time
Served* | | Principal Occupation(s) During Past 5 Years | |
John H. Gernon (55)
522 Fifth Avenue
New York, NY 10036 | | President and Principal Executive Officer | | Since
September
2013 | | President and Principal Executive Officer of the Equity and Fixed Income Funds and the Morgan Stanley AIP Funds (since September 2013) and the Liquidity Funds and various money market funds (since May 2014) in the Fund Complex; Managing Director of the Adviser; Head of Product (since 2006). | |
Timothy J. Knierim (59)
522 Fifth Avenue
New York, NY 10036 | | Chief Compliance Officer | | Since
December
2016 | | Managing Director of the Adviser and various entities affiliated with the Adviser; Chief Compliance Officer of various Morgan Stanley Funds and the Adviser (since December 2016) and Chief Compliance Officer of Morgan Stanley AIP GP LP (since 2014). Formerly, Managing Director and Deputy Chief Compliance Officer of the Adviser (2014-2016); and formerly, Chief Compliance Officer of Prudential Investment Management, Inc. (2007-2014). | |
Francis J. Smith (53)
522 Fifth Avenue
New York, NY 10036 | | Treasurer and Principal Financial Officer | | Treasurer since July 2003 and Principal Financial Officer since September 2002 | | Managing Director of the Adviser and various entities affiliated with the Adviser; Treasurer (since July 2003) and Principal Financial Officer of various Morgan Stanley Funds (since September 2002). | |
Mary E. Mullin (51)
522 Fifth Avenue
New York, NY 10036 | | Secretary | | Since
June
1999 | | Managing Director of the Adviser; Secretary of various Morgan Stanley Funds (since June 1999). | |
Michael J. Key (39)
522 Fifth Avenue
New York, NY 10036 | | Vice President | | Since
June
2017 | | Vice President of the Equity and Fixed Income Funds, Liquidity Funds, various money market funds and the Morgan Stanley AIP Funds in the Fund Complex (since June 2017); Executive Director of the Adviser; Head of Product Development for Equity and Fixed Income Funds (since August 2013). | |
* This is the earliest date the officer began serving the Morgan Stanley Funds. Each officer serves a one-year term, until his or her successor is elected and qualifies.
34
Morgan Stanley Institutional Fund, Inc.
Annual Report — December 31, 2018
Adviser and Administrator
Morgan Stanley Investment Management Inc.
522 Fifth Avenue
New York, New York 10036
Distributor
Morgan Stanley Distribution, Inc.
522 Fifth Avenue
New York, New York 10036
Dividend Disbursing and Transfer Agent
DST Asset Manager Solutions, Inc.
2000 Crown Colony Drive
Quincy, Massachusetts 02169
Custodian
State Street Bank and Trust Company
One Lincoln Street
Boston, Massachusetts 02111
Legal Counsel
Dechert LLP
1095 Avenue of the Americas
New York, New York 10036
Counsel to the Independent Directors
Perkins Coie LLP
30 Rockefeller Plaza
New York, New York 10112
Independent Registered Public Accounting Firm
Ernst & Young LLP
200 Clarendon Street
Boston, Massachusetts 02116
Reporting to Shareholders
Each Morgan Stanley fund provides a complete schedule of portfolio holdings in its semi-annual and the annual reports within 60 days of the end of the fund's second and fourth fiscal quarters. The semi-annual and annual reports are filed electronically with the Securities and Exchange Commission ("SEC") on Form N-CSRS and Form N-CSR, respectively. Morgan Stanley also delivers the semi-annual and annual reports to fund shareholders and makes these reports available on its public website, www.morganstanley.com/im/shareholderreports. Each Morgan Stanley fund also files a complete schedule of portfolio holdings with the SEC for the fund's first and third fiscal quarters on Form N-Q. Morgan Stanley does not deliver the reports for the first and third fiscal quarters to shareholders, nor are the reports posted to the Morgan Stanley public website. You may, however, obtain the Form N-Q filings (as well as the Form N-CSR and N-CSRS filings) by accessing the SEC's website, www.sec.gov. You can also request copies of these materials, upon payment of a duplicating fee, by electronic request at the SEC's email address (publicinfo@sec.gov).
Proxy Voting Policies and Procedures and Proxy Voting Record
You may obtain a copy of the Company's Proxy Voting Policy and Procedures and information regarding how the Company voted proxies relating to portfolio securities during the most recent twelve-month period ended June 30, without charge, upon request, by calling toll free 1 (800) 548-7786 or by visiting our website at www.morganstanley.com/im/shareholderreports. This information is also available on the SEC's website at www.sec.gov.
This report is authorized for distribution only when preceded or accompanied by a prospectus or summary prospectus of the applicable Fund of Morgan Stanley Institutional Fund, Inc., which describes in detail the Fund's investment policies, risks, fees and expenses. Please read the prospectus carefully before you invest or send money. For additional information, including information regarding the investments comprising the Fund, please visit our website at www.morganstanley.com/im/shareholderreports or call toll free 1 (800) 548-7786.
35
Printed in U.S.A.
This Report has been prepared for shareholders and may be distributed to others only if preceded or accompanied by a current prospectus.
Morgan Stanley Investment Management Inc.
522 Fifth Avenue
New York, New York 10036
© 2019 Morgan Stanley. Morgan Stanley Distribution, Inc.

IFIFEMANN
2401073 EXP. 02.29.20

Morgan Stanley Institutional Fund, Inc.
Global Advantage Portfolio
Annual Report
December 31, 2018
Beginning on January 1, 2021, as permitted by regulations adopted by the Securities and Exchange Commission ("SEC"), paper copies of the Fund's Annual and Semi-Annual Reports to Shareholders ("Shareholder Reports") will no longer be sent by mail, unless you specifically request paper copies of the Shareholder Reports from the Fund or from your financial intermediary, such as a broker-dealer or a bank. Instead, the Shareholder Reports will be made available on the Fund's website, https://www.morganstanley.com/im/shareholderreports and you will be notified by mail each time a Shareholder Report is posted and provided with a website link to access the Shareholder Report. If you already elected to receive Shareholder Reports electronically, you will not be affected by this change and you need not take any action. You may elect to receive Shareholder Reports and other communications from the Fund electronically anytime by contacting your financial intermediary or, if you are a direct investor, please follow the instructions on the envelope.
Beginning on January 1, 2019, you may elect to receive all future Shareholder Reports in paper free of charge. If you invest through a financial intermediary, you can contact your financial intermediary to request that you continue to receive paper copies of your Shareholder Reports. If you invest directly with the Fund, please follow the instructions on the envelope to let the Fund know you wish to continue receiving paper copies of your Shareholder Reports. Your election to receive Shareholder Reports in paper will apply to all funds held in your account if you invest through your financial intermediary or all funds held with the fund complex if you invest directly with a fund.

Morgan Stanley Institutional Fund, Inc.
Annual Report — December 31, 2018
Shareholders' Letter | | | 2 | | |
Expense Example | | | 3 | | |
Investment Overview | | | 4 | | |
Portfolio of Investments | | | 6 | | |
Statement of Assets and Liabilities | | | 8 | | |
Statement of Operations | | | 10 | | |
Statements of Changes in Net Assets | | | 11 | | |
Financial Highlights | | | 13 | | |
Notes to Financial Statements | | | 17 | | |
Report of Independent Registered Public Accounting Firm | | | 27 | | |
Federal Tax Notice | | | 28 | | |
Privacy Notice | | | 29 | | |
Director and Officer Information | | | 32 | | |
This report is authorized for distribution only when preceded or accompanied by a prospectus or summary prospectus of the applicable Fund of Morgan Stanley Institutional Fund, Inc. To receive a prospectus and/or statement of additional information (SAI), which contains more complete information such as investment objectives, charges, expenses, policies for voting proxies, risk considerations and describes in detail each of the Fund's investment policies to the prospective investor, please call toll free 1 (800) 548-7786. Please read the prospectuses carefully before you invest or send money.
Additionally, you can access information about the Fund, including performance, characteristics and investment team commentary, through Morgan Stanley Investment Management's website: www.morganstanley.com/im/shareholderreports.
Market forecasts provided in this report may not necessarily come to pass. There is no guarantee that any sectors mentioned will continue to perform as discussed herein or that securities in such sectors will be held by the Fund in the future. There is no assurance that a fund will achieve its investment objective. Funds are subject to market risk, which is the possibility that market values of securities owned by the Fund will decline and, therefore, the value of the Fund's shares may be less than what you paid for them. Accordingly, you can lose money investing in this Fund. Please see the prospectus for more complete information on investment risks.
1
Morgan Stanley Institutional Fund, Inc.
Annual Report — December 31, 2018
Shareholders' Letter (unaudited)
Dear Shareholders,
We are pleased to provide this Annual report, in which you will learn how your investment in Global Advantage Portfolio (the "Fund") performed during the latest twelve-month period.
Morgan Stanley Investment Management is a client-centric, investor-led organization. Our global presence, intellectual capital, and breadth of products and services enable us to partner with investors to meet the evolving challenges of today's financial markets. We aim to deliver superior investment service and to empower our clients to make the informed decisions that help them reach their investment goals.
As always, we thank you for selecting Morgan Stanley Investment Management, and look forward to working with you in the months and years ahead.
Sincerely,

John H. Gernon
President and Principal Executive Officer
January 2019
2
Morgan Stanley Institutional Fund, Inc.
Annual Report — December 31, 2018
Expense Example (unaudited)
Global Advantage Portfolio
As a shareholder of the Fund, you incur two types of costs: (1) transactional costs; and (2) ongoing costs, which may include advisory fees, administration fees, distribution and shareholder services fees and other Fund expenses. This example is intended to help you understand your ongoing costs (in dollars) of investing in the Fund and to compare these costs with the ongoing costs of investing in other mutual funds.
This example is based on an investment of $1,000 invested at the beginning of the six-month period ended December 31, 2018 and held for the entire six-month period.
Actual Expenses
The table below provides information about actual account values and actual expenses. You may use the information in this table, together with the amount you invested, to estimate the expenses that you paid over the period. Simply divide your account value by $1,000 (for example, an $8,600 account value divided by $1,000 = 8.6), then multiply the result by the number in the table under the heading entitled "Actual Expenses Paid During Period" to estimate the expenses you paid on your account during this period.
Hypothetical Example for Comparison Purposes
The table below provides information about hypothetical account values and hypothetical expenses based on the Fund's actual expense ratio and an assumed rate of return of 5% per year before expenses, which is not the Fund's actual return. The hypothetical account values and expenses may not be used to estimate the actual ending account balance or expenses you paid for the period. You may use this information to compare the ongoing costs of investing in the Fund and other funds. To do so, compare this 5% hypothetical example with the 5% hypothetical examples that appear in the shareholder reports of the other funds.
Please note that the expenses shown in the table are meant to highlight your ongoing costs only and do not reflect any transactional costs, such as sales charges (loads). Therefore, the information for each class in the table is useful in comparing ongoing costs only, and will not help you determine the relative total costs of owning different funds. In addition, if these transactional costs were included, your costs would have been higher.
| | | Beginning
Account
Value
7/1/18 | | Actual Ending
Account
Value
12/31/18 | | Hypothetical
Ending Account
Value | | Actual
Expenses
Paid
During
Period* | | Hypothetical
Expenses Paid
During Period* | | Net
Expense
Ratio
During
Period** | |
Global Advantage Portfolio Class I | | $ | 1,000.00 | | | $ | 868.20 | | | $ | 1,019.71 | | | $ | 5.13 | | | $ | 5.55 | | | | 1.09 | % | |
Global Advantage Portfolio Class A | | | 1,000.00 | | | | 866.70 | | | | 1,018.10 | | | | 6.63 | | | | 7.17 | | | | 1.41 | | |
Global Advantage Portfolio Class L | | | 1,000.00 | | | | 864.70 | | | | 1,015.43 | | | | 9.12 | | | | 9.86 | | | | 1.94 | | |
Global Advantage Portfolio Class C | | | 1,000.00 | | | | 863.70 | | | | 1,014.17 | | | | 10.29 | | | | 11.12 | | | | 2.19 | | |
* Expenses are calculated using each Fund Class' annualized net expense ratio (as disclosed), multiplied by the average account value over the period and multiplied by 184/365 (to reflect the most recent one-half year period).
** Annualized.
3
Morgan Stanley Institutional Fund, Inc.
Annual Report — December 31, 2018
Investment Overview (unaudited)
Global Advantage Portfolio
The Fund seeks long-term capital appreciation.
Performance
For the fiscal year ended December 31, 2018, the Fund's Class I shares had a total return based on net asset value and reinvestment of distributions per share of –5.75%, net of fees. The Fund's Class I shares outperformed the Fund's benchmark, the MSCI All Country World Net Index (the "Index"), which returned –9.41%.
Factors Affecting Performance
• Global growth concerns weighed heavily on global equities in the 12-month period. Economic indicators were signaling slowdowns across China, Europe and the U.K., and Japan while at the same time financial conditions were tightening and geopolitical risks increased, particularly regarding trade protectionism. The U.S. economy was an outlier, as growth accelerated on tailwinds from tax cuts and deregulation. But by the end of the year, U.S. companies downgraded their earnings forecasts as the benefits of fiscal stimulus were expected to recede and business sentiment deteriorated due to the U.S.-China trade regulations. With global growth fading and the outcome of trade disputes, Brexit and other issues still largely unpredictable, investors grew anxious about the duration of the Federal Reserve's monetary tightening and the European Central Bank's decision to begin withdrawing its stimulus. Pricing these risks was challenging, which led to increased equity volatility through the year.
• Within the Index, only the health care and utilities sectors had positive returns for the 12-month period. The materials, financials and industrials sectors were the biggest laggards.
• The long-term investment horizon and conviction-weighted investment approach embraced by the team since 1998 can result in periods of performance deviation from the benchmark and peers. In this reporting period, the Fund's relative outperformance resulted from favorable stock selection. Sector allocations in aggregate modestly detracted from performance.
• Our stock selection in consumer discretionary and information technology added the most to relative performance. The consumer discretionary sector was led by the strong performance of an online retail and cloud computing leader, which was also the top contributor across the whole portfolio in the period. In the information technology sector, the Fund benefited from gains in a provider of cloud-based human resources and financial management software solutions to enterprises.
Management Strategies
• There were no changes to our bottom-up investment process during the period. We continued to look for franchises with strong name recognition and sustainable competitive advantages. We typically favor companies with rising returns on invested capital, above average business visibility, strong free cash flow generation and an attractive risk/reward profile. Our emphasis is on secular growth, and as a result short-term market events are not as meaningful in the stock selection process.
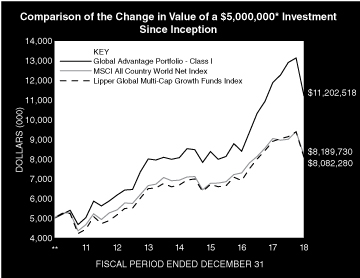
* Minimum Investment for Class I shares
** Commenced Operations on December 28, 2010.
In accordance with SEC regulations, the Fund's performance shown assumes that all recurring fees (including management fees) were deducted and all dividends and distributions were reinvested. The performance of Class A, L and C shares will vary from the performance of Class I shares based upon their different inception dates and will be negatively impacted by additional fees assessed to those classes.
4
Morgan Stanley Institutional Fund, Inc.
Annual Report — December 31, 2018
Investment Overview (unaudited) (cont'd)
Global Advantage Portfolio
Performance Compared to the MSCI All Country World Net Index(1) and the Lipper Global Multi-Cap Growth Funds Index(2)
| | | Period Ended December 31, 2018
Total Returns(3) | |
| | | | | Average Annual | |
| | | One
Year | | Five
Years | | Ten
Years | | Since
Inception(6) | |
Fund — Class I Shares
w/o sales charges(4) | | | –5.75 | % | | | 6.96 | % | | | — | | | | 10.60 | % | |
Fund — Class A Shares
w/o sales charges(4) | | | –6.03 | | | | 6.58 | | | | — | | | | 10.24 | | |
Fund — Class A Shares with
maximum 5.25% sales charges(4) | | | –10.95 | | | | 5.43 | | | | — | | | | 9.51 | | |
Fund — Class L Shares
w/o sales charges(4) | | | –6.50 | | | | 6.04 | | | | — | | | | 9.69 | | |
Fund — Class C Shares
w/o sales charges(5) | | | –6.77 | | | | — | | | | — | | | | 6.38 | | |
Fund — Class C Shares with
maximum 1.00% deferred
sales charges(5) | | | –7.67 | | | | — | | | | — | | | | 6.38 | | |
MSCI All Country World Net Index | | | –9.41 | | | | 4.26 | | | | — | | | | 6.36 | | |
Lipper Global Multi-Cap Growth
Funds Index | | | –9.15 | | | | 4.48 | | | | — | | | | 6.18 | | |
Performance data quoted represents past performance, which is no guarantee of future results, and current performance may be lower or higher than the figures shown. Performance assumes that all dividends and distributions, if any, were reinvested. For the most recent month-end performance figures, please visit www.morganstanley.com/im/shareholderreports. Investment return and principal value will fluctuate so that Fund shares, when redeemed, may be worth more or less than their original cost. Total returns do not reflect the deduction of taxes that a shareholder would pay on Fund distributions or the redemption of Fund shares. Performance of share classes will vary due to difference in sales charges and expenses.
(1) The MSCI All Country World Net Index is a free float-adjusted market capitalization weighted index designed to measure the equity market performance of developed and emerging markets. The term "free float" represents the portion of shares outstanding that are deemed to be available for purchase in the public equity markets by investors. The performance of the Index is listed in U.S. dollars and assumes reinvestment of net dividends. Net total return indices reinvest dividends after the deduction of withholding taxes, using (for international indices) a tax rate applicable to non-resident institutional investors who do not benefit from double taxation treaties. The Index is unmanaged and its returns do not include any sales charges or fees. Such costs would lower performance. It is not possible to invest directly in an index.
(2) The Lipper Global Multi-Cap Growth Funds Index is an equally weighted performance index of the largest qualifying funds (based on net assets) in the Lipper Global Multi-Cap Growth Funds classification. The Index, which is adjusted for capital gains distributions and income dividends, is unmanaged and should not be considered an investment. There are currently 30 funds represented in this Index. As of the date of this report, the Fund is in the Lipper Global Multi-Cap Growth Funds classification.
(3) Total returns for the Fund reflect fees waived and expenses reimbursed, if applicable, by Morgan Stanley Investment Management Inc. (the "Adviser"). Without such waivers and reimbursements, total returns would have been lower.
(4) Commenced operations on December 28, 2010.
(5) Commenced offering on April 30, 2015.
(6) For comparative purposes, average annual since inception returns listed for the Indexes refer to the inception date of Class I of the Fund, not the inception of the Index.
5
Morgan Stanley Institutional Fund, Inc.
Annual Report — December 31, 2018
Portfolio of Investments
Global Advantage Portfolio
| | | Shares | | Value
(000) | |
Common Stocks (98.0%) | |
Canada (9.2%) | |
Canadian National Railway Co. | | | 61,552 | | | $ | 4,562 | | |
Constellation Software, Inc. | | | 7,784 | | | | 4,982 | | |
| | | | 9,544 | | |
France (10.0%) | |
Christian Dior SE | | | 15,226 | | | | 5,802 | | |
Hermes International | | | 5,228 | | | | 2,891 | | |
Ubisoft Entertainment SA (a) | | | 20,329 | | | | 1,631 | | |
| | | | 10,324 | | |
Germany (1.5%) | |
Zalando SE (a) | | | 60,122 | | | | 1,545 | | |
India (3.9%) | |
HDFC Bank Ltd. ADR | | | 39,186 | | | | 4,059 | | |
Italy (3.4%) | |
Brunello Cucinelli SpA | | | 51,479 | | | | 1,769 | | |
Moncler SpA | | | 51,398 | | | | 1,718 | | |
| | | | 3,487 | | |
Netherlands (1.8%) | |
Adyen N.V. (a) | | | 3,375 | | | | 1,821 | | |
New Zealand (2.9%) | |
Xero Ltd. (a) | | | 100,780 | | | | 2,970 | | |
United Kingdom (4.3%) | |
Metro Bank PLC (a) | | | 67,627 | | | | 1,459 | | |
Rentokil Initial PLC | | | 696,739 | | | | 2,982 | | |
| | | | 4,441 | | |
United States (61.0%) | |
Adobe, Inc. (a) | | | 11,923 | | | | 2,698 | | |
Amazon.com, Inc. (a) | | | 4,588 | | | | 6,891 | | |
Elanco Animal Health, Inc. (a) | | | 84,115 | | | | 2,652 | | |
Farfetch Ltd., Class A (a) | | | 196,694 | | | | 3,483 | | |
IAC/InterActiveCorp (a) | | | 10,273 | | | | 1,880 | | |
Intuitive Surgical, Inc. (a) | | | 10,723 | | | | 5,136 | | |
MakeMyTrip Ltd. (a) | | | 73,901 | | | | 1,798 | | |
MercadoLibre, Inc. | | | 16,386 | | | | 4,799 | | |
MSCI, Inc. | | | 11,047 | | | | 1,629 | | |
S&P Global, Inc. | | | 9,100 | | | | 1,546 | | |
salesforce.com, Inc. (a) | | | 21,802 | | | | 2,986 | | |
ServiceNow, Inc. (a) | | | 23,703 | | | | 4,220 | | |
Starbucks Corp. | | | 57,344 | | | | 3,693 | | |
Twitter, Inc. (a) | | | 122,829 | | | | 3,530 | | |
Union Pacific Corp. | | | 26,245 | | | | 3,628 | | |
UnitedHealth Group, Inc. | | | 14,478 | | | | 3,607 | | |
Walt Disney Co. (The) | | | 14,564 | | | | 1,597 | | |
Workday, Inc., Class A (a) | | | 29,548 | | | | 4,718 | | |
Zoetis, Inc. | | | 30,854 | | | | 2,639 | | |
| | | | 63,130 | | |
Total Common Stocks (Cost $102,962) | | | 101,321 | | |
| | | Shares | | Value
(000) | |
Preferred Stocks (0.3%) | |
United States (0.3%) | |
Airbnb, Inc. Series D (a)(b)(c)(d)
(acquisition cost — $78; acquired 4/16/14) | | | 1,917 | | | $ | 231 | | |
Lookout, Inc. Series F (a)(b)(c)(d)
(acquisition cost — $73; acquired 6/17/14) | | | 6,374 | | | | 16 | | |
Palantir Technologies, Inc. Series G (a)(b)(c)(d)
(acquisition cost — $9; acquired 7/19/12) | | | 2,935 | | | | 12 | | |
Palantir Technologies, Inc. Series H (a)(b)(c)(d)
(acquisition cost — $6; acquired 10/25/13) | | | 1,572 | | | | 7 | | |
Palantir Technologies, Inc. Series H1 (a)(b)(c)(d)
(acquisition cost — $6; acquired 10/25/13) | | | 1,572 | | | | 7 | | |
Total Preferred Stocks (Cost $171) | | | 273 | | |
Short-Term Investment (2.6%) | |
Investment Company (2.6%) | |
Morgan Stanley Institutional Liquidity
Funds — Treasury Securities Portfolio —
Institutional Class (See Note G)
(Cost $2,648) | | | 2,648,102 | | | | 2,648 | | |
Total Investments Excluding Purchased
Options (100.9%) (Cost $105,781) | | | 104,242 | | |
Total Purchased Options Outstanding (0.1%)
(Cost $299) | | | 77 | | |
Total Investments (101.0%)
(Cost $106,080) (e)(f) | | | 104,319 | | |
Liabilities in Excess of Other Assets (–1.0%) | | | (1,074 | ) | |
Net Assets (100.0%) | | $ | 103,245 | | |
Country assignments and aggregations are based generally on third party vendor classifications and information, and may be different from the assignments and aggregations under the policies set forth in the Fund's prospectus and/or statement of additional information relating to geographic classifications.
(a) Non-income producing security.
(b) At December 31, 2018, the Fund held fair valued securities valued at approximately $273,000, representing 0.3% of net assets. These securities have been fair valued as determined in good faith under procedures established by and under the general supervision of the Company's Directors.
(c) Security has been deemed illiquid at December 31, 2018.
(d) Security cannot be offered for public resale without first being registered under the Securities Act of 1933 and related rules ("restricted security"). Acquisition date represents the day on which an enforceable right to acquire such security is obtained and is presented along with related cost in the security description. The Fund has registration rights for certain restricted securities. Any costs related to such registration are borne by the issuer. The aggregate value of restricted securities (excluding 144A holdings) at December 31, 2018, amounts to approximately $273,000 and represents 0.3% of net assets.
(e) The approximate fair value and percentage of net assets, $24,588,000 and 23.8%, respectively, represent the securities that have been fair valued under the fair valuation policy for international investments as described in Note A-1 within the Notes to the Financial Statements.
(f) At December 31, 2018, the aggregate cost for federal income tax purposes is approximately $107,395,000. The aggregate gross unrealized appreciation is approximately $5,176,000 and the aggregate gross unrealized depreciation is approximately $8,252,000, resulting in net unrealized depreciation of approximately $3,076,000.
ADR American Depositary Receipt.
The accompanying notes are an integral part of the financial statements.
6
Morgan Stanley Institutional Fund, Inc.
Annual Report — December 31, 2018
Portfolio of Investments (cont'd)
Global Advantage Portfolio
Call Options Purchased:
The Fund had the following call options purchased open at December 31, 2018:
Counterparty | | Description | | Strike
Price | | Expiration
Date | | Number of
Contracts | | Notional
Amount
(000) | | Value
(000) | | Premiums
Paid
(000) | | Unrealized
Depreciation
(000) | |
Royal Bank of Scotland | | USD/CNH | | CNH | 7.16 | | | Jan-19 | | | 3,030,255 | | | | 3,030 | | | $ | — | @ | | $ | 13 | | | $ | (13 | ) | |
Royal Bank of Scotland | | USD/CNH | | CNH | 7.78 | | | Jul-19 | | | 28,325,392 | | | | 28,325 | | | | 31 | | | | 138 | | | | (107 | ) | |
Royal Bank of Scotland | | USD/CNH | | CNH | 8.00 | | | Oct-19 | | | 25,081,610 | | | | 25,082 | | | | 46 | | | | 148 | | | | (102 | ) | |
| | | | | | | | | | | | | $ | 77 | | | $ | 299 | | | $ | (222 | ) | |
CNH — Chinese Yuan Renminbi Offshore
USD — United States Dollar
@ — Value is less than $500.
Portfolio Composition
Classification | | Percentage of
Total Investments | |
Other* | | | 23.6 | % | |
Software | | | 23.3 | | |
Internet & Direct Marketing Retail | | | 18.0 | | |
Textiles, Apparel & Luxury Goods | | | 11.7 | | |
Road & Rail | | | 7.8 | | |
Banks | | | 5.3 | | |
Interactive Media & Services | | | 5.2 | | |
Pharmaceuticals | | | 5.1 | | |
Total Investments | | | 100.0 | % | |
* Industries and/or investment types representing less than 5% of total investments.
The accompanying notes are an integral part of the financial statements.
7
Morgan Stanley Institutional Fund, Inc.
Annual Report — December 31, 2018
Global Advantage Portfolio
Statement of Assets and Liabilities | | December 31, 2018
(000) | |
Assets: | |
Investments in Securities of Unaffiliated Issuers, at Value (Cost $103,432) | | $ | 101,671 | | |
Investment in Security of Affiliated Issuer, at Value (Cost $2,648) | | | 2,648 | | |
Total Investments in Securities, at Value (Cost $106,080) | | | 104,319 | | |
Foreign Currency, at Value (Cost —@) | | | — | @ | |
Receivable for Investments Sold | | | 3,304 | | |
Receivable for Fund Shares Sold | | | 894 | | |
Dividends Receivable | | | 87 | | |
Tax Reclaim Receivable | | | 53 | | |
Receivable from Affiliate | | | 5 | | |
Receivable from Securities Lending Income | | | — | @ | |
Other Assets | | | 105 | | |
Total Assets | | | 108,767 | | |
Liabilities: | |
Payable for Fund Shares Redeemed | | | 5,114 | | |
Payable for Professional Fees | | | 127 | | |
Payable for Advisory Fees | | | 103 | | |
Payable for Reorganization Expense | | | 69 | | |
Payable for Transfer Agency Fees — Class I | | | 14 | | |
Payable for Transfer Agency Fees — Class A | | | 3 | | |
Payable for Transfer Agency Fees — Class L | | | 2 | | |
Payable for Transfer Agency Fees — Class C | | | 6 | | |
Payable for Shareholder Services Fees — Class A | | | 7 | | |
Payable for Distribution and Shareholder Services Fees — Class L | | | — | @ | |
Payable for Distribution and Shareholder Services Fees — Class C | | | 9 | | |
Payable for Sub Transfer Agency Fees — Class I | | | 12 | | |
Payable for Sub Transfer Agency Fees — Class A | | | 1 | | |
Payable for Sub Transfer Agency Fees — Class L | | | — | @ | |
Payable for Sub Transfer Agency Fees — Class C | | | — | @ | |
Payable for Custodian Fees | | | 13 | | |
Payable for Administration Fees | | | 8 | | |
Bank Overdraft | | | 3 | | |
Payable for Investments Purchased | | | — | @ | |
Other Liabilities | | | 31 | | |
Total Liabilities | | | 5,522 | | |
Net Assets | | $ | 103,245 | | |
Net Assets Consist of: | |
Paid-in-Capital | | $ | 110,127 | | |
Total Accumulated Loss | | | (6,882 | ) | |
Net Assets | | $ | 103,245 | | |
The accompanying notes are an integral part of the financial statements.
8
Morgan Stanley Institutional Fund, Inc.
Annual Report — December 31, 2018
Global Advantage Portfolio
Statement of Assets and Liabilities (cont'd) | | December 31, 2018
(000) | |
CLASS I: | |
Net Assets | | $ | 60,271 | | |
| Shares Outstanding $0.001 par value shares of beneficial interest (unlimited shares authorized) (not in 000's) | | | 4,316,531 | | |
Net Asset Value, Offering and Redemption Price Per Share | | $ | 13.96 | | |
CLASS A: | |
Net Assets | | $ | 33,240 | | |
| Shares Outstanding $0.001 par value shares of beneficial interest (unlimited shares authorized) (not in 000's) | | | 2,424,165 | | |
Net Asset Value, Redemption Price Per Share | | $ | 13.71 | | |
Maximum Sales Load | | | 5.25 | % | |
Maximum Sales Charge | | $ | 0.76 | | |
Maximum Offering Price Per Share | | $ | 14.47 | | |
CLASS L: | |
Net Assets | | $ | 462 | | |
| Shares Outstanding $0.001 par value shares of beneficial interest (unlimited shares authorized) (not in 000's) | | | 34,956 | | |
Net Asset Value, Offering and Redemption Price Per Share | | $ | 13.21 | | |
CLASS C: | |
Net Assets | | $ | 9,272 | | |
| Shares Outstanding $0.001 par value shares of beneficial interest (unlimited shares authorized) (not in 000's) | | | 711,772 | | |
Net Asset Value, Offering and Redemption Price Per Share | | $ | 13.03 | | |
@ Amount is less than $500.
The accompanying notes are an integral part of the financial statements.
9
Morgan Stanley Institutional Fund, Inc.
Annual Report — December 31, 2018
Global Advantage Portfolio
Statement of Operations | | Year Ended
December 31, 2018
(000) | |
Investment Income: | |
Dividends from Securities of Unaffiliated Issuers (Net of $24 of Foreign Taxes Withheld) | | $ | 239 | | |
Non-Cash Dividends from Securities of Unaffiliated Issuers | | | 29 | | |
Dividends from Security of Affiliated Issuer (Note G) | | | 25 | | |
Income from Securities Loaned — Net | | | — | @ | |
Total Investment Income | | | 293 | | |
Expenses: | |
Advisory Fees (Note B) | | | 264 | | |
Professional Fees | | | 117 | | |
Registration Fees | | | 54 | | |
Shareholder Services Fees — Class A (Note D) | | | 24 | | |
Distribution and Shareholder Services Fees — Class L (Note D) | | | 3 | | |
Distribution and Shareholder Services Fees — Class C (Note D) | | | 20 | | |
Transfer Agency Fees — Class I (Note E) | | | 23 | | |
Transfer Agency Fees — Class A (Note E) | | | 3 | | |
Transfer Agency Fees — Class L (Note E) | | | 2 | | |
Transfer Agency Fees — Class C (Note E) | | | 4 | | |
Custodian Fees (Note F) | | | 27 | | |
Administration Fees (Note C) | | | 26 | | |
Sub Transfer Agency Fees — Class I | | | 17 | | |
Sub Transfer Agency Fees — Class A | | | 6 | | |
Sub Transfer Agency Fees — Class L | | | — | @ | |
Sub Transfer Agency Fees — Class C | | | 1 | | |
Shareholder Reporting Fees | | | 15 | | |
Directors' Fees and Expenses | | | 4 | | |
Pricing Fees | | | 1 | | |
Other Expenses | | | 26 | | |
Total Expenses | | | 637 | | |
Waiver of Advisory Fees (Note B) | | | (170 | ) | |
Reimbursement of Class Specific Expenses — Class I (Note B) | | | (41 | ) | |
Reimbursement of Class Specific Expenses — Class A (Note B) | | | (3 | ) | |
Reimbursement of Class Specific Expenses — Class L (Note B) | | | (2 | ) | |
Reimbursement of Class Specific Expenses — Class C (Note B) | | | (2 | ) | |
Rebate from Morgan Stanley Affiliate (Note G) | | | (3 | ) | |
Net Expenses | | | 416 | | |
Net Investment Loss | | | (123 | ) | |
Realized Gain (Loss): | |
Investments Sold | | | (3,524 | ) | |
Foreign Currency Translation | | | 6 | | |
Net Realized Loss | | | (3,518 | ) | |
Change in Unrealized Appreciation (Depreciation): | |
Investments | | | (3,993 | ) | |
Foreign Currency Translation | | | (1 | ) | |
Net Change in Unrealized Appreciation (Depreciation) | | | (3,994 | ) | |
Net Realized Loss and Change in Unrealized Appreciation (Depreciation) | | | (7,512 | ) | |
Net Decrease in Net Assets Resulting from Operations | | $ | (7,635 | ) | |
@ Amount is less than $500.
The accompanying notes are an integral part of the financial statements.
10
Morgan Stanley Institutional Fund, Inc.
Annual Report — December 31, 2018
Global Advantage Portfolio
Statements of Changes in Net Assets | | Year Ended
December 31, 2018
(000) | | Year Ended
December 31, 2017
(000) | |
Increase (Decrease) in Net Assets: | |
Operations: | |
Net Investment Loss | | $ | (123 | ) | | $ | (34 | ) | |
Net Realized Gain (Loss) | | | (3,518 | ) | | | 1,743 | | |
Net Change in Unrealized Appreciation (Depreciation) | | | (3,994 | ) | | | 1,152 | | |
Net Increase (Decrease) in Net Assets Resulting from Operations | | | (7,635 | ) | | | 2,861 | | |
Dividends and Distributions to Shareholders: | |
Class I | | | (727 | ) | | | (685 | )* | |
Class A | | | (314 | ) | | | (481 | )* | |
Class L | | | (14 | ) | | | (35 | )* | |
Class C | | | (47 | ) | | | (58 | )* | |
Total Dividends and Distributions to Shareholders | | | (1,102 | ) | | | (1,259 | ) | |
Capital Share Transactions:(1) | |
Class I: | |
Subscribed | | | 25,380 | | | | 2,892 | | |
Issued due to a Tax-free Reorganization | | | 58,648 | | | | — | | |
Distributions Reinvested | | | 619 | | | | 685 | | |
Redeemed | | | (25,880 | ) | | | (601 | ) | |
Class A: | |
Subscribed | | | 6,300 | | | | 1,163 | | |
Issued due to a Tax-free Reorganization | | | 29,480 | | | | — | | |
Distributions Reinvested | | | 313 | | | | 480 | | |
Redeemed | | | (4,930 | ) | | | (402 | ) | |
Class L: | |
Exchanged | | | 16 | | | | 94 | | |
Issued due to a Tax-free Reorganization | | | 191 | | | | — | | |
Distributions Reinvested | | | 14 | | | | 34 | | |
Redeemed | | | (40 | ) | | | (70 | ) | |
Class C: | |
Subscribed | | | 930 | | | | 307 | | |
Issued due to a Tax-free Reorganization | | | 9,958 | | | | — | | |
Distributions Reinvested | | | 46 | | | | 57 | | |
Redeemed | | | (1,521 | ) | | | (49 | ) | |
Net Increase in Net Assets Resulting from Capital Share Transactions | | | 99,524 | | | | 4,590 | | |
Total Increase in Net Assets | | | 90,787 | | | | 6,192 | | |
Net Assets: | |
Beginning of Period | | | 12,458 | | | | 6,266 | | |
End of Period | | $ | 103,245 | | | $ | 12,458 | † | |
The accompanying notes are an integral part of the financial statements.
11
Morgan Stanley Institutional Fund, Inc.
Annual Report — December 31, 2018
Global Advantage Portfolio
Statements of Changes in Net Assets (cont'd) | | Year Ended
December 31, 2018
(000) | | Year Ended
December 31, 2017
(000) | |
(1) Capital Share Transactions: | |
Class I: | |
Shares Subscribed | | | 1,627 | | | | 186 | | |
Shares Issued due to a Tax-free Reorganization | | | 3,982 | | | | — | | |
Shares Issued on Distributions Reinvested | | | 40 | | | | 44 | | |
Shares Redeemed | | | (1,786 | ) | | | (42 | ) | |
Net Increase in Class I Shares Outstanding | | | 3,863 | | | | 188 | | |
Class A: | |
Shares Subscribed | | | 411 | | | | 76 | | |
Shares Issued due to a Tax-free Reorganization | | | 2,037 | | | | — | | |
Shares Issued on Distributions Reinvested | | | 21 | | | | 32 | | |
Shares Redeemed | | | (346 | ) | | | (27 | ) | |
Net Increase in Class A Shares Outstanding | | | 2,123 | | | | 81 | | |
Class L: | |
Shares Exchanged | | | 1 | | | | 7 | | |
Shares Issued due to a Tax-free Reorganization | | | 14 | | | | — | | |
Shares Issued on Distributions Reinvested | | | 1 | | | | 2 | | |
Shares Redeemed | | | (3 | ) | | | (5 | ) | |
Net Increase in Class L Shares Outstanding | | | 13 | | | | 4 | | |
Class C: | |
Shares Subscribed | | | 62 | | | | 21 | | |
Shares Issued due to a Tax-free Reorganization | | | 724 | | | | — | | |
Shares Issued on Distributions Reinvested | | | 3 | | | | 4 | | |
Shares Redeemed | | | (115 | ) | | | (3 | ) | |
Net Increase in Class C Shares Outstanding | | | 674 | | | | 22 | | |
The following information was previously reported in the December 31, 2017 financial statements. The distribution information for the year ended December 31, 2017 presented on the Statements of Changes in Net Assets is presented for comparative purposes to the December 31, 2018 financial statements, which conform to the SEC Final Rule on Disclosure Update and Simplification which was effective November 5, 2018.
* Dividends and Distributions to Shareholders for the year ended December 31, 2017 were as follows:
Class I: | |
Net Realized Gain | | $ | (685 | ) | |
Class A: | |
Net Realized Gain | | $ | (481 | ) | |
Class L: | |
Net Realized Gain | | $ | (35 | ) | |
Class C: | |
Net Realized Gain | | $ | (58 | ) | |
† Net Investment Loss for the year ended December 31, 2017 was $0.
The accompanying notes are an integral part of the financial statements.
12
Morgan Stanley Institutional Fund, Inc.
Annual Report — December 31, 2018
Financial Highlights
Global Advantage Portfolio
| | | Class I | |
| | | Year Ended December 31, | |
Selected Per Share Data and Ratios | | 2018 | | 2017 | | 2016(1) | | 2015 | | 2014 | |
Net Asset Value, Beginning of Period | | $ | 15.43 | | | $ | 12.12 | | | $ | 12.36 | | | $ | 12.74 | | | $ | 13.57 | | |
Income (Loss) from Investment Operations: | |
Net Investment Income (Loss)(2) | | | (0.03 | ) | | | (0.03 | ) | | | 0.00 | (3) | | | 0.05 | | | | 0.05 | | |
Net Realized and Unrealized Gain (Loss) | | | (0.80 | ) | | | 5.07 | | | | 0.02 | | | | 0.46 | | | | 0.04 | | |
Total from Investment Operations | | | (0.83 | ) | | | 5.04 | | | | 0.02 | | | | 0.51 | | | | 0.09 | | |
Distributions from and/or in Excess of: | |
Net Investment Income | | | — | | | | — | | | | — | | | | (0.03 | ) | | | (0.01 | ) | |
Net Realized Gain | | | (0.64 | ) | | | (1.73 | ) | | | (0.26 | ) | | | (0.86 | ) | | | (0.91 | ) | |
Total Distributions | | | (0.64 | ) | | | (1.73 | ) | | | (0.26 | ) | | | (0.89 | ) | | | (0.92 | ) | |
Net Asset Value, End of Period | | $ | 13.96 | | | $ | 15.43 | | | $ | 12.12 | | | $ | 12.36 | | | $ | 12.74 | | |
Total Return(4) | | | (5.75 | )% | | | 41.56 | % | | | 0.21 | % | | | 3.85 | % | | | 0.83 | % | |
Ratios and Supplemental Data: | |
Net Assets, End of Period (Thousands) | | $ | 60,271 | | | $ | 7,005 | | | $ | 3,229 | | | $ | 1,785 | | | $ | 3,181 | | |
Ratio of Expenses to Average Net Assets(8) | | | 1.09 | %(5) | | | 1.09 | %(5) | | | 1.09 | %(5) | | | 1.11 | %(5)(6) | | | 1.30 | %(5) | |
Ratio of Net Investment Income (Loss) to Average Net Assets(8) | | | (0.19 | )%(5) | | | (0.19 | )%(5) | | | 0.04 | %(5) | | | 0.37 | %(5) | | | 0.40 | %(5) | |
Ratio of Rebate from Morgan Stanley Affiliates to Average Net Assets | | | 0.01 | % | | | 0.01 | % | | | 0.01 | % | | | 0.00 | %(7) | | | 0.00 | %(7) | |
Portfolio Turnover Rate | | | 130 | % | | | 103 | % | | | 90 | % | | | 90 | % | | | 46 | % | |
(8) Supplemental Information on the Ratios to Average Net Assets: | |
Ratios Before Expense Limitation: | |
Expenses to Average Net Assets | | | 1.82 | % | | | 3.67 | % | | | 3.82 | % | | | 5.38 | % | | | 5.31 | % | |
Net Investment Loss to Average Net Assets | | | (0.92 | )% | | | (2.77 | )% | | | (2.69 | )% | | | (3.90 | )% | | | (3.61 | )% | |
(1) Reflects prior period Custodian out-of-pocket expenses that were reimbursed in September 2016. The amount of the reimbursement was immaterial on a per share basis and did not impact the total return of Class I shares. The Ratio of Expenses to Average Net Assets and the Ratio of Net Investment Income to Average Net Assets would be unchanged as the reimbursement of Custodian fees was offset against expense waivers/reimbursements with no impact to net expenses or net investment income.
(2) Per share amount is based on average shares outstanding.
(3) Amount is less than $0.005 per share.
(4) Calculated based on the net asset value as of the last business day of the period.
(5) The Ratios of Expenses and Net Investment Income (Loss) reflect the rebate of certain Fund expenses in connection with the investments in Morgan Stanley affiliates during the period. The effect of the rebate on the ratios is disclosed in the above table as "Ratio of Rebate from Morgan Stanley Affiliates to Average Net Assets."
(6) Effective January 23, 2015, the Adviser has agreed to limit the ratio of expenses to average net assets to the maximum ratio of 1.10% for Class I shares. Prior to January 23, 2015, the maximum ratio was 1.30% for Class I shares.
(7) Amount is less than 0.005%.
The accompanying notes are an integral part of the financial statements.
13
Morgan Stanley Institutional Fund, Inc.
Annual Report — December 31, 2018
Financial Highlights
Global Advantage Portfolio
| | | Class A | |
| | | Year Ended December 31, | |
Selected Per Share Data and Ratios | | 2018 | | 2017 | | 2016(1) | | 2015 | | 2014 | |
Net Asset Value, Beginning of Period | | $ | 15.21 | | | $ | 12.01 | | | $ | 12.29 | | | $ | 12.70 | | | $ | 13.57 | | |
Income (Loss) from Investment Operations: | |
Net Investment Income (Loss)(2) | | | (0.08 | ) | | | (0.08 | ) | | | (0.05 | ) | | | (0.04 | ) | | | 0.01 | | |
Net Realized and Unrealized Gain (Loss) | | | (0.78 | ) | | | 5.01 | | | | 0.03 | | | | 0.49 | | | | 0.04 | | |
Total from Investment Operations | | | (0.86 | ) | | | 4.93 | | | | (0.02 | ) | | | 0.45 | | | | 0.05 | | |
Distributions from and/or in Excess of: | |
Net Investment Income | | | — | | | | — | | | | — | | | | — | | | | (0.01 | ) | |
Net Realized Gain | | | (0.64 | ) | | | (1.73 | ) | | | (0.26 | ) | | | (0.86 | ) | | | (0.91 | ) | |
Total Distributions | | | (0.64 | ) | | | (1.73 | ) | | | (0.26 | ) | | | (0.86 | ) | | | (0.92 | ) | |
Net Asset Value, End of Period | | $ | 13.71 | | | $ | 15.21 | | | $ | 12.01 | | | $ | 12.29 | | | $ | 12.70 | | |
Total Return(3) | | | (6.03 | )% | | | 41.02 | % | | | (0.11 | )% | | | 3.40 | % | | | 0.46 | % | |
Ratios and Supplemental Data: | |
Net Assets, End of Period (Thousands) | | $ | 33,240 | | | $ | 4,577 | | | $ | 2,640 | | | $ | 3,414 | | | $ | 790 | | |
Ratio of Expenses to Average Net Assets(8) | | | 1.41 | %(4)(6) | | | 1.41 | %(4) | | | 1.44 | %(4) | | | 1.45 | %(4)(5) | | | 1.65 | %(4) | |
Ratio of Net Investment Income (Loss) to Average Net Assets(8) | | | (0.54 | )%(4) | | | (0.52 | )%(4) | | | (0.38 | )%(4) | | | (0.34 | )%(4) | | | 0.05 | %(4) | |
Ratio of Rebate from Morgan Stanley Affiliates to Average Net Assets | | | 0.01 | % | | | 0.01 | % | | | 0.01 | % | | | 0.01 | % | | | 0.00 | %(7) | |
Portfolio Turnover Rate | | | 130 | % | | | 103 | % | | | 90 | % | | | 90 | % | | | 46 | % | |
(8) Supplemental Information on the Ratios to Average Net Assets: | |
Ratios Before Expense Limitation: | |
Expenses to Average Net Assets | | | 1.95 | % | | | 3.88 | % | | | 4.09 | % | | | 5.92 | % | | | 5.79 | % | |
Net Investment Loss to Average Net Assets | | | (1.08 | )% | | | (2.99 | )% | | | (3.03 | )% | | | (4.81 | )% | | | (4.09 | )% | |
(1) Reflects prior period Custodian out-of-pocket expenses that were reimbursed in September 2016. The amount of the reimbursement was immaterial on a per share basis and did not impact the total return of Class A shares. The Ratio of Expenses to Average Net Assets and the Ratio of Net Investment Loss to Average Net Assets would be unchanged as the reimbursement of Custodian fees was offset against expense waivers/reimbursements with no impact to net expenses or net investment loss.
(2) Per share amount is based on average shares outstanding.
(3) Calculated based on the net asset value which does not reflect sales charges, if applicable, as of the last business day of the period.
(4) The Ratios of Expenses and Net Investment Income (Loss) reflect the rebate of certain Fund expenses in connection with the investments in Morgan Stanley affiliates during the period. The effect of the rebate on the ratios is disclosed in the above table as "Ratio of Rebate from Morgan Stanley Affiliates to Average Net Assets."
(5) Effective January 23, 2015, the Adviser has agreed to limit the ratio of expenses to average net assets to the maximum ratio of 1.45% for Class A shares. Prior to January 23, 2015, the maximum ratio was 1.65% for Class A shares.
(6) Effective November 19, 2018, the Adviser has agreed to limit the ratio of expenses to average net assets to the maximum ratio of 1.42% for Class A shares. Prior to November 19, 2018, the maximum ratio was 1.45% for Class A shares.
(7) Amount is less than 0.005%.
The accompanying notes are an integral part of the financial statements.
14
Morgan Stanley Institutional Fund, Inc.
Annual Report — December 31, 2018
Financial Highlights
Global Advantage Portfolio
| | | Class L | |
| | | Year Ended December 31, | |
Selected Per Share Data and Ratios | | 2018 | | 2017 | | 2016(1) | | 2015 | | 2014 | |
Net Asset Value, Beginning of Period | | $ | 14.75 | | | $ | 11.74 | | | $ | 12.09 | | | $ | 12.56 | | | $ | 13.50 | | |
Income (Loss) from Investment Operations: | |
Net Investment Loss(2) | | | (0.16 | ) | | | (0.15 | ) | | | (0.10 | ) | | | (0.08 | ) | | | (0.06 | ) | |
Net Realized and Unrealized Gain (Loss) | | | (0.74 | ) | | | 4.89 | | | | 0.01 | | | | 0.47 | | | | 0.04 | | |
Total from Investment Operations | | | (0.90 | ) | | | 4.74 | | | | (0.09 | ) | | | 0.39 | | | | (0.02 | ) | |
Distributions from and/or in Excess of: | |
Net Investment Income | | | — | | | | — | | | | — | | | | — | | | | (0.01 | ) | |
Net Realized Gain | | | (0.64 | ) | | | (1.73 | ) | | | (0.26 | ) | | | (0.86 | ) | | | (0.91 | ) | |
Total Distributions | | | (0.64 | ) | | | (1.73 | ) | | | (0.26 | ) | | | (0.86 | ) | | | (0.92 | ) | |
Net Asset Value, End of Period | | $ | 13.21 | | | $ | 14.75 | | | $ | 11.74 | | | $ | 12.09 | | | $ | 12.56 | | |
Total Return(3) | | | (6.50 | )% | | | 40.34 | % | | | (0.70 | )% | | | 2.96 | % | | | (0.07 | )% | |
Ratios and Supplemental Data: | |
Net Assets, End of Period (Thousands) | | $ | 462 | | | $ | 327 | | | $ | 217 | | | $ | 382 | | | $ | 338 | | |
Ratio of Expenses to Average Net Assets(7) | | | 1.94 | %(4) | | | 1.94 | %(4) | | | 1.94 | %(4) | | | 1.96 | %(4)(5) | | | 2.15 | %(4) | |
Ratio of Net Investment Loss to Average Net Assets(7) | | | (1.03 | )%(4) | | | (1.05 | )%(4) | | | (0.86 | )%(4) | | | (0.60 | )%(4) | | | (0.45 | )%(4) | |
Ratio of Rebate from Morgan Stanley Affiliates to Average Net Assets | | | 0.01 | % | | | 0.01 | % | | | 0.01 | % | | | 0.00 | %(6) | | | 0.00 | %(6) | |
Portfolio Turnover Rate | | | 130 | % | | | 103 | % | | | 90 | % | | | 90 | % | | | 46 | % | |
(7) Supplemental Information on the Ratios to Average Net Assets: | |
Ratios Before Expense Limitation: | |
Expenses to Average Net Assets | | | 3.29 | % | | | 5.07 | % | | | 5.12 | % | | | 6.58 | % | | | 6.55 | % | |
Net Investment Loss to Average Net Assets | | | (2.38 | )% | | | (4.18 | )% | | | (4.04 | )% | | | (5.22 | )% | | | (4.85 | )% | |
(1) Reflects prior period Custodian out-of-pocket expenses that were reimbursed in September 2016. The amount of the reimbursement was immaterial on a per share basis and did not impact the total return of Class L shares. The Ratio of Expenses to Average Net Assets and the Ratio of Net Investment Loss to Average Net Assets would be unchanged as the reimbursement of Custodian fees was offset against expense waivers/reimbursements with no impact to net expenses or net investment loss.
(2) Per share amount is based on average shares outstanding.
(3) Calculated based on the net asset value as of the last business day of the period.
(4) The Ratios of Expenses and Net Investment Loss reflect the rebate of certain Fund expenses in connection with the investments in Morgan Stanley affiliates during the period. The effect of the rebate on the ratios is disclosed in the above table as "Ratio of Rebate from Morgan Stanley Affiliates to Average Net Assets."
(5) Effective January 23, 2015, the Adviser has agreed to limit the ratio of expenses to average net assets to the maximum ratio of 1.95% for Class L shares. Prior to January 23, 2015, the maximum ratio was 2.15% for Class L shares.
(6) Amount is less than 0.005%.
The accompanying notes are an integral part of the financial statements.
15
Morgan Stanley Institutional Fund, Inc.
Annual Report — December 31, 2018
Financial Highlights
Global Advantage Portfolio
| | | Class C | |
| | | Year Ended December 31, | | Period from
April 30, 2015(2) to | |
Selected Per Share Data and Ratios | | 2018 | | 2017 | | 2016(1) | | December 31, 2015 | |
Net Asset Value, Beginning of Period | | $ | 14.60 | | | $ | 11.66 | | | $ | 12.04 | | | $ | 13.30 | | |
Income (Loss) from Investment Operations: | |
Net Investment Loss(3) | | | (0.18 | ) | | | (0.19 | ) | | | (0.13 | ) | | | (0.11 | ) | |
Net Realized and Unrealized Gain (Loss) | | | (0.75 | ) | | | 4.86 | | | | 0.01 | | | | (0.26 | ) | |
Total from Investment Operations | | | (0.93 | ) | | | 4.67 | | | | (0.12 | ) | | | (0.37 | ) | |
Distributions from and/or in Excess of: | |
Net Investment Income | | | — | | | | — | | | | — | | | | (0.03 | ) | |
Net Realized Gain | | | (0.64 | ) | | | (1.73 | ) | | | (0.26 | ) | | | (0.86 | ) | |
Total Distributions | | | (0.64 | ) | | | (1.73 | ) | | | (0.26 | ) | | | (0.89 | ) | |
Net Asset Value, End of Period | | $ | 13.03 | | | $ | 14.60 | | | $ | 11.66 | | | $ | 12.04 | | |
Total Return(4) | | | (6.77 | )% | | | 40.02 | % | | | (0.95 | )% | | | (2.94 | )%(7) | |
Ratios and Supplemental Data: | |
Net Assets, End of Period (Thousands) | | $ | 9,272 | | | $ | 549 | | | $ | 180 | | | $ | 59 | | |
Ratio of Expenses to Average Net Assets(9) | | | 2.19 | %(5) | | | 2.19 | %(5) | | | 2.19 | %(5) | | | 2.20 | %(5)(8) | |
Ratio of Net Investment Loss to Average Net Assets(9) | | | (1.29 | )%(5) | | | (1.30 | )%(5) | | | (1.12 | )%(5) | | | (1.33 | )%(5)(8) | |
Ratio of Rebate from Morgan Stanley Affiliates to Average Net Assets | | | 0.01 | % | | | 0.01 | % | | | 0.01 | % | | | 0.00 | %(6)(8) | |
Portfolio Turnover Rate | | | 130 | % | | | 103 | % | | | 90 | % | | | 90 | % | |
(9) Supplemental Information on the Ratios to Average Net Assets: | |
Ratios Before Expense Limitation: | |
Expenses to Average Net Assets | | | 2.70 | % | | | 5.22 | % | | | 6.12 | % | | | 12.84 | %(8) | |
Net Investment Loss to Average Net Assets | | | (1.80 | )% | | | (4.33 | )% | | | (5.05 | )% | | | (11.97 | )%(8) | |
(1) Reflects prior period Custodian out-of-pocket expenses that were reimbursed in September 2016. The amount of the reimbursement was immaterial on a per share basis and did not impact the total return of Class C shares. The Ratio of Expenses to Average Net Assets and the Ratio of Net Investment Loss to Average Net Assets would be unchanged as the reimbursement of Custodian fees was offset against expense waivers/reimbursements with no impact to net expenses or net investment loss.
(2) Commencement of Offering.
(3) Per share amount is based on average shares outstanding.
(4) Calculated based on the net asset value which does not reflect sales charges, if applicable, as of the last business day of the period.
(5) The Ratios of Expenses and Net Investment Loss reflect the rebate of certain Fund expenses in connection with the investments in Morgan Stanley affiliates during the period. The effect of the rebate on the ratios is disclosed in the above table as "Ratio of Rebate from Morgan Stanley Affiliates to Average Net Assets."
(6) Amount is less than 0.005%.
(7) Not annualized.
(8) Annualized.
The accompanying notes are an integral part of the financial statements.
16
Morgan Stanley Institutional Fund, Inc.
Annual Report — December 31, 2018
Notes to Financial Statements
Morgan Stanley Institutional Fund, Inc. (the "Company") is registered under the Investment Company Act of 1940, as amended (the "Act"), as an open-end management investment company. The Company is comprised of thirty separate, active, diversified and non-diversified funds (individually referred to as a "Fund", collectively as the "Funds"). The Company applies investment company accounting and reporting guidance.
The accompanying financial statements relate to the Global Advantage Portfolio. The Fund seeks long-term capital appreciation.
The Fund offers four classes of shares — Class I, Class A, Class L and Class C. On April 30, 2015, the Fund suspended offering Class L shares. Existing Class L shareholders may invest through reinvestment of dividends and distributions.
On November 16, 2018, the Fund acquired the net assets of the Company's Global Insight Portfolio ("Global Insight") and Global Discovery Portfolio ("Global Discovery"), an open-end investment company. Based on the respective valuations as of the close of business on November 16, 2018, pursuant to a Plan of Reorganization approved by the shareholders of Global Insight and Global Discovery on October 17, 2018 ("Reorganization"). The purpose of the transaction was to combine three portfolios managed by Morgan Stanley Investment Management Inc., (the "Adviser") with comparable investment objectives and strategies. The acquisition was accomplished by a tax-free exchange of 454,229 Class I shares of the Fund at a net asset value ("NAV") of $14.73 for 541,872 Class I shares of Global Insight and 3,527,274 Class I shares of the Fund at a NAV of $14.73 for 3,735,808 Class I shares of Global Discovery; 153,953 Class A shares of the Fund at a NAV of $14.47 for 180,488 Class A shares of Global Insight and 1,883,383 Class A shares of the Fund at a NAV of $14.47 for 1,972,973 Class A shares of Global Discovery; 4,092 Class L shares of the Fund at a NAV of $13.95 for 4,734 Class L shares of Global Insight and 9,567 Class L shares of the Fund at a NAV of $13.95 for 9,832 Class L shares of Global Discovery; 20,813 Class C shares of the Fund at a NAV of $13.76 for 24,021 Class C shares of Global Insight and 702,884 Class C shares of the Fund at a NAV of $13.76 for 725,549 Class C shares of Global Discovery. The net assets of Global Insight and Global Discovery before the Reorganization were approximately $9,262,000 and $89,014,000, respectively, including unrealized appreciation (depreciation) of approximately $462,000 and $(32,000), respectively at November 16, 2018. The
investment portfolio of Global Insight and Global Discovery, with a fair value of approximately $9,273,000 and $92,205,000, respectively and identified cost of approximately $8,811,000 and $92,237,000, respectively, on November 16, 2018, was the principal asset acquired by the Fund. For financial reporting purposes, assets received and shares issued by the Fund were recorded at fair value; however, the cost basis of the investments received from Global Insight and Global Discovery was carried forward to align ongoing reporting of the Fund's realized and unrealized gains and losses with amounts distributable to shareholders for tax purposes. Immediately prior to the Reorganization, the net assets of the Fund were approximately $29,406,000. Immediately after the Reorganization, the net assets of the Fund were approximately $127,682,000.
Upon closing of the Reorganization, shareholders of Global Insight and Global Discovery received shares of the Fund as follows:
Global
Insight Portfolio | | Global
Discovery Portfolio | | Global
Advantage Portfolio | |
Class I | | Class I | | Class I | |
Class A | | Class A | | Class A | |
Class L | | Class L | | Class L | |
Class C | | Class C | | Class C | |
Assuming the acquisition had been completed on January 1, 2018, the beginning of the annual reporting period of the Fund, the Fund's pro forma results of operations for the year ended December 31, 2018, are as follows:
Net investment Income(1) | | $ | 3,545,000 | | |
Net realized gain and unrealized gain(2) | | $ | 5,637,000 | | |
Net increase in net assets resulting from operations | | $ | 9,182,000 | | |
(1) Approximately $(123,000) as reported, plus approximately $167,000 from Global Insight and $1,695,000 from Global Discovery prior to the Reorganization, plus approximately $153,000 Global Insight and $1,653,000 from Global Discovery of estimated pro-forma eliminated expenses.
(2) Approximately $(7,512,000) as reported, plus approximately $1,936,000 from Global Insight and $11,213,000 from Global Discovery prior to the Reorganization.
Because the combined investment portfolios have been managed as a single integrated portfolio since the acquisition was completed, it is not practicable to separate the amounts of revenue and earnings of Global Insight and Global Discovery that have been included in the Fund's Statement of Operations since November 16, 2018.
A. Significant Accounting Policies: The following significant accounting policies are in conformity with U.S. generally accepted accounting principles ("GAAP"). Such policies are consistently followed by the Company in the preparation of its
17
Morgan Stanley Institutional Fund, Inc.
Annual Report — December 31, 2018
Notes to Financial Statements (cont'd)
financial statements. GAAP may require management to make estimates and assumptions that affect the reported amounts and disclosures in the financial statements. Actual results may differ from those estimates.
In August 2018, the Financial Accounting Standards Board ("FASB") issued Accounting Standards Update ("ASU") 2018-13, Fair Value Measurement (Topic 820) — Disclosures Framework — Changes to Disclosure Requirements of Fair Value Measurement ("ASU 2018-13") which introduces new fair value disclosure requirements as well as eliminates and modifies certain existing fair value disclosure requirements. ASU 2018-13 would be effective for fiscal years beginning after December 15, 2019 and for interim periods within those fiscal years; however, management has elected to early adopt ASU 2018-13 effective with the current reporting period as permitted by the standard. The impact of the Fund's adoption was limited to changes in the Fund's financial statement disclosures regarding fair value, primarily those disclosures related to transfers between levels of the fair value hierarchy and disclosure of the range and weighted average used to develop significant unobservable inputs for Level 3 fair value measurements, when applicable.
1. Security Valuation: (1) An equity portfolio security listed or traded on an exchange is valued at its latest reported sales price (or at the exchange official closing price if such exchange reports an official closing price), and if there were no sales on a given day and if there is no official exchange closing price for that day, the security is valued at the mean between the last reported bid and asked prices if such bid and asked prices are available on the relevant exchanges. Listed equity securities not traded on the valuation date with no reported bid and asked prices available on the exchange are valued at the mean between the current bid and asked prices obtained from one or more reputable brokers or dealers. In cases where a security is traded on more than one exchange, the security is valued on the exchange designated as the primary market; (2) all other equity portfolio securities for which over-the-counter ("OTC") market quotations are readily available are valued at the latest reported sales price (or at the market official closing price if such market reports an official closing price), and if there was no trading in the security on a given day and if there is no official closing price from relevant markets for that day, the security is valued at the
mean between the last reported bid and asked prices if such bid and asked prices are available on the relevant markets. An unlisted equity security that does not trade on the valuation date and for which bid and asked prices from the relevant markets are unavailable is valued at the mean between the current bid and asked prices obtained from one or more reputable brokers or dealers; (3) listed options are valued at the last reported sales price on the exchange on which they are listed (or at the exchange official closing price if such exchange reports an official closing price). If an official closing price or last reported sales price is unavailable, the listed option should be fair valued at the mean between its latest bid and ask prices. Unlisted options are valued at the mean between their latest bid and ask prices from a broker/dealer or valued by a pricing service/vendor; (4) certain portfolio securities may be valued by an outside pricing service/vendor approved by the Company's Board of Directors (the "Directors"). The pricing service/vendor may employ a pricing model that takes into account, among other things, bids, yield spreads and/or other market data and specific security characteristics. Alternatively, if a valuation is not available from an outside pricing service/vendor, and the security trades on an exchange, the security may be valued at its latest reported sale price (or at the exchange official closing price if such exchange reports an official closing price), prior to the time when assets are valued. If there are no sales on a given day and if there is no official exchange closing price for that day, the security is valued at the mean between the last reported bid and asked prices if such bid and asked prices are available in the relevant exchanges; (5) when market quotations are not readily available, including circumstances under which the Adviser determines that the closing price, last sale price or the mean between the last reported bid and asked prices are not reflective of a security's market value, portfolio securities are valued at their fair value as determined in good faith under procedures established by and under the general supervision of the Directors. Occasionally, developments affecting the closing prices of securities and other assets may occur between the times at which valuations of such securities are determined (that is, close of the foreign market on which the securities trade) and the close of business of the New York Stock Exchange ("NYSE"). If developments occur during such periods that are expected to materially affect the value of
18
Morgan Stanley Institutional Fund, Inc.
Annual Report — December 31, 2018
Notes to Financial Statements (cont'd)
such securities, such valuations may be adjusted to reflect the estimated fair value of such securities as of the close of the NYSE, as determined in good faith by the Directors or by the Adviser using a pricing service and/or procedures approved by the Directors; (6) quotations of foreign portfolio securities, other assets and liabilities and forward contracts stated in foreign currency are translated into U.S. dollar equivalents at the prevailing market rates prior to the close of the NYSE; and (7) investments in mutual funds, including the Morgan Stanley Institutional Liquidity Funds, are valued at the NAV as of the close of each business day.
The Directors have responsibility for determining in good faith the fair value of the investments, and the Directors may appoint others, such as the Company's Adviser or a valuation committee, to assist the Directors in determining fair value and to make the actual calculations pursuant to the fair valuation methodologies previously approved by the Directors. Under procedures approved by the Directors, the Company's Adviser has formed a Valuation Committee whose members are approved by the Directors. The Valuation Committee provides administration and oversight of the Company's valuation policies and procedures, which are reviewed at least annually by the Directors. These procedures allow the Company to utilize independent pricing services, quotations from securities and financial instrument dealers and other market sources to determine fair value.
2. Fair Value Measurement: FASB Accounting Standards CodificationTM ("ASC") 820, "Fair Value Measurement" ("ASC 820"), defines fair value as the value that the Fund would receive to sell an investment or pay to transfer a liability in a timely transaction with an independent buyer in the principal market, or in the absence of a principal market, the most advantageous market for the investment or liability. ASC 820 establishes a three-tier hierarchy to distinguish between (1) inputs that reflect the assumptions market participants would use in valuing an asset or liability developed based on market data obtained from sources independent of the reporting entity (observable inputs) and (2) inputs that reflect the reporting entity's own assumptions about the assumptions market participants would use in valuing an asset or liability developed based on the best information available in the
circumstances (unobservable inputs) and to establish classification of fair value measurements for disclosure purposes. Various inputs are used in determining the value of the Fund's investments. The inputs are summarized in the three broad levels listed below:
• Level 1 – unadjusted quoted prices in active markets for identical investments
• Level 2 – other significant observable inputs (including quoted prices for similar investments, interest rates, prepayment speeds, credit risk, etc.)
• Level 3 – significant unobservable inputs including the Fund's own assumptions in determining the fair value of investments. Factors considered in making this determination may include, but are not limited to, information obtained by contacting the issuer, analysts, or the appropriate stock exchange (for exchange-traded securities), analysis of the issuer's financial statements or other available documents and, if necessary, available information concerning other securities in similar circumstances
The inputs or methodology used for valuing securities are not necessarily an indication of the risk associated with investing in those securities and the determination of the significance of a particular input to the fair value measurement in its entirety requires judgment and considers factors specific to each security.
The following is a summary of the inputs used to value the Fund's investments as of December 31, 2018:
Investment Type | | Level 1
Unadjusted
quoted
prices
(000) | | Level 2
Other
significant
observable
inputs
(000) | | Level 3
Significant
unobservable
inputs
(000) | | Total
(000) | |
Assets: | |
Common Stocks | |
Banks | | $ | 4,059 | | | $ | 1,459 | | | $ | — | | | $ | 5,518 | | |
Capital Markets | | | 3,175 | | | | — | | | | — | | | | 3,175 | | |
Commercial Services &
Supplies | | | — | | | | 2,982 | | | | — | | | | 2,982 | | |
Health Care Equipment &
Supplies | | | 5,136 | | | | — | | | | — | | | | 5,136 | | |
19
Morgan Stanley Institutional Fund, Inc.
Annual Report — December 31, 2018
Notes to Financial Statements (cont'd)
Investment Type | | Level 1
Unadjusted
quoted
prices
(000) | | Level 2
Other
significant
observable
inputs
(000) | | Level 3
Significant
unobservable
inputs
(000) | | Total
(000) | |
Common Stocks (cont'd) | |
Health Care Providers &
Services | | $ | 3,607 | | | $ | — | | | $ | — | | | $ | 3,607 | | |
Hotels, Restaurants &
Leisure | | | 3,693 | | | | — | | | | — | | | | 3,693 | | |
Information Technology
Services | | | — | | | | 1,821 | | | | — | | | | 1,821 | | |
Interactive Media &
Services | | | 5,410 | | | | — | | | | — | | | | 5,410 | | |
Internet & Direct
Marketing Retail | | | 16,971 | | | | 1,545 | | | | — | | | | 18,516 | | |
Media | | | 1,597 | | | | — | | | | — | | | | 1,597 | | |
Pharmaceuticals | | | 5,291 | | | | — | | | | — | | | | 5,291 | | |
Road & Rail | | | 8,190 | | | | — | | | | — | | | | 8,190 | | |
Software | | | 19,604 | | | | 4,601 | | | | — | | | | 24,205 | | |
Textiles, Apparel &
Luxury Goods | | | — | | | | 12,180 | | | | — | | | | 12,180 | | |
Total Common Stocks | | | 76,733 | | | | 24,588 | | | | — | | | | 101,321 | | |
Preferred Stocks | |
Internet & Direct
Marketing Retail | | | — | | | | — | | | | 231 | | | | 231 | | |
Software | | | — | | | | — | | | | 42 | | | | 42 | | |
Total Preferred Stocks | | | — | | | | — | | | | 273 | | | | 273 | | |
Short-Term Investment | |
Investment Company | | | 2,648 | | | | — | | | | — | | | | 2,648 | | |
Call Options Purchased | | | — | | | | 77 | | | | — | | | | 77 | | |
Total Assets | | $ | 79,381 | | | $ | 24,665 | | | $ | 273 | | | $ | 104,319 | | |
Transfers between investment levels may occur as the markets fluctuate and/or the availability of data used in an investment's valuation changes.
Following is a reconciliation of investments in which significant unobservable inputs (Level 3) were used in determining fair value:
| | | Preferred
Stocks
(000) | |
Beginning Balance | | $ | — | | |
Purchases | | | 171 | | |
Sales | | | — | | |
Amortization of discount | | | — | | |
Transfers in | | | — | | |
Transfers out | | | — | | |
Corporate actions | | | — | | |
Change in unrealized appreciation (depreciation) | | | 102 | | |
Realized gains (losses) | | | — | | |
Ending Balance | | $ | 273 | | |
Net change in unrealized appreciation (depreciation) from investments
still held as of December 31, 2018 | | $ | 102 | | |
The following table presents additional information about valuation techniques and inputs used for investments that are measured at fair value and categorized within Level 3 as of December 31, 2018. Various valuation techniques were used in the valuation of certain investments and weighted based on the level of significance. The Fund calculated the weighted averages of the unobservable inputs relative to each investment's fair value as of December 31, 2018.
| | | Fair Value at
December 31, 2018
(000) | | Valuation
Technique | | Unobservable
Input | | Amount or Range/
Weighted Average | | Impact to
Valuation from an
Increase in Input†† | |
Preferred Stocks | | $ | 273 | | | Discounted Cash Flow | | Weighted Average
Cost of Capital | | 14.0%–19.5%/15.25% | | Decrease | |
| | | | | | | Perpetual Growth Rate | | 3.0%–4.0%/3.50% | | Increase | |
| | | | | Market Comparable
Companies | | Enterprise
Value/Revenue | | 1.4x–13.7x/8.53x | | Increase | |
| | | | | | | Discount for Lack
of Marketability | | 10.0%–20.0%/14.82% | | Decrease | |
| | | | | Comparable
Transactions | | Enterprise
Value/Revenue | | 2.3x–16.0x/8.7x | | Increase | |
†† Represents the expected directional change in the fair value of the Level 3 investments that would result from an increase in the corresponding input. A decrease to the unobservable input would have the opposite effect. Significant changes in these inputs could result in significantly higher or lower fair value measurements.
20
Morgan Stanley Institutional Fund, Inc.
Annual Report — December 31, 2018
Notes to Financial Statements (cont'd)
3. Foreign Currency Translation and Foreign Investments: The books and records of the Fund are maintained in U.S. dollars. Foreign currency amounts are translated into U.S. dollars as follows:
– investments, other assets and liabilities at the prevailing rate of exchange on the valuation date;
– investment transactions and investment income at the prevailing rates of exchange on the dates of such transactions.
Although the net assets of the Fund are presented at the foreign exchange rates and market values at the close of the period, the Fund does not isolate that portion of the results of operations arising as a result of changes in the foreign exchange rates from the fluctuations arising from changes in the market prices of securities held at period end. Similarly, the Fund does not isolate the effect of changes in foreign exchange rates from the fluctuations arising from changes in the market prices of securities sold during the period. Accordingly, realized and unrealized foreign currency gains (losses) on investments in securities are included in the reported net realized and unrealized gains (losses) on investment transactions and balances. However, pursuant to U.S. federal income tax regulations, gains and losses from certain foreign currency transactions and the foreign currency portion of gains and losses realized on sales and maturities of foreign denominated debt securities are treated as ordinary income for U.S. federal income tax purposes.
Net realized gains (losses) on foreign currency transactions represent net foreign exchange gains (losses) from foreign currency forward exchange contracts, disposition of foreign currencies, currency gains (losses) realized between the trade and settlement dates on securities transactions, and the difference between the amount of investment income and foreign withholding taxes recorded on the Fund's books and the U.S. dollar equivalent amounts actually received or paid. Net unrealized currency gains (losses) from valuing foreign currency denominated assets and liabilities at period end exchange rates are reflected as a component of unrealized appreciation (depreciation) in the Statement of Assets and Liabilities. The change in unrealized currency gains (losses) on foreign currency translations for the period is reflected in the Statement of Operations.
Foreign security and currency transactions may involve certain considerations and risks not typically associated with those of U.S. dollar denominated transactions as a result of, among other factors, fluctuations of exchange rates in relation to the U.S. dollar, the possibility of lower levels of governmental supervision and regulation of foreign securities markets and the possibility of political or economic instability.
Governmental approval for foreign investments may be required in advance of making an investment under certain circumstances in some countries, and the extent of foreign investments in domestic companies may be subject to limitation in other countries. Foreign ownership limitations also may be imposed by the charters of individual companies to prevent, among other concerns, violations of foreign investment limitations. As a result, an additional class of shares (identified as "Foreign" in the Portfolio of Investments) may be created and offered for investment. The "local" and "foreign shares" market values may differ. In the absence of trading of the foreign shares in such markets, the Fund values the foreign shares at the closing exchange price of the local shares.
4. Derivatives: The Fund may, but is not required to, use derivative instruments for a variety of purposes, including hedging, risk management, portfolio management or to earn income. Derivatives are financial instruments whose value is based, in part, on the value of an underlying asset, interest rate, index or financial instrument. Prevailing interest rates and volatility levels, among other things, also affect the value of derivative instruments. A derivative instrument often has risks similar to its underlying asset and may have additional risks, including imperfect correlation between the value of the derivative and the underlying asset, risks of default by the counterparty to certain transactions, magnification of losses incurred due to changes in the market value of the securities, instruments, indices or interest rates to which the derivative instrument relates, risks that the transactions may not be liquid and risks arising from margin requirements. The use of derivatives involves risks that are different from, and possibly greater than, the risks associated with other portfolio investments. Derivatives may involve the use of highly specialized instruments that require investment techniques and risk analyses different from those associated with other portfolio investments. All of the Fund's holdings, including derivative instruments, are marked-to-market each day with
21
Morgan Stanley Institutional Fund, Inc.
Annual Report — December 31, 2018
Notes to Financial Statements (cont'd)
the change in value reflected in unrealized appreciation (depreciation). Upon disposition, a realized gain or loss is recognized.
Certain derivative transactions may give rise to a form of leverage. Leverage magnifies the potential for gain and the risk of loss. Leverage associated with derivative transactions may cause the Fund to liquidate portfolio positions when it may not be advantageous to do so to satisfy its obligations or to meet earmarking or segregation requirements, pursuant to applicable Securities and Exchange Commission ("SEC") rules and regulations, or may cause the Fund to be more volatile than if the Fund had not been leveraged. Although the Adviser seeks to use derivatives to further the Fund's investment objectives, there is no assurance that the use of derivatives will achieve this result.
Following is a description of the derivative instruments and techniques that the Fund used during the period and their associated risks:
Options: With respect to options, the Fund is subject to equity risk, interest rate risk and foreign currency exchange risk in the normal course of pursuing its investment objectives. If the Fund buys an option, it buys a legal contract giving it the right to buy or sell a specific amount of the underlying instrument or foreign currency, or futures contract on the underlying instrument or foreign currency, at an agreed-upon price during a period of time or on a specified date typically in exchange for a premium paid by the Fund. The Fund may purchase and/or sell put and call options. Purchasing call options tends to increase the Fund's exposure to the underlying (or similar) instrument. Purchasing put options tends to decrease the Fund's exposure to the underlying (or similar) instrument. When entering into purchased option contracts, the Fund bears the risk of interest or exchange rates or securities prices moving unexpectedly, in which case, the Fund may not achieve the anticipated benefits of the purchased option contracts; however the risk of loss is limited to the premium paid. Purchased options are reported as part of "Total Investments in Securities" in the Statement of Assets and Liabilities. Premiums paid for purchasing options which expired are treated as realized losses. If the Fund sells an option, it sells to another party the right to buy from or sell to the Fund a specific amount of the underlying instrument or foreign currency, or futures contract on the
underlying instrument or foreign currency, at an agreed-upon price during a period of time or on a specified date typically in exchange for a premium received by the Fund. When options are purchased OTC, the Fund bears the risk that the counterparty that wrote the option will be unable or unwilling to perform its obligations under the option contract. Options may also be illiquid and the Fund may have difficulty closing out its position. A decision as to whether, when and how to use options involves the exercise of skill and judgment and even a well-conceived option transaction may be unsuccessful because of market behavior or unexpected events. The prices of options can be highly volatile and the use of options can lower total returns.
FASB ASC 815, "Derivatives and Hedging" ("ASC 815"), is intended to improve financial reporting about derivative instruments by requiring enhanced disclosures to enable investors to better understand how and why the Fund uses derivative instruments, how these derivative instruments are accounted for and their effects on the Fund's financial position and results of operations.
The following table sets forth the fair value of the Fund's derivative contracts by primary risk exposure as of December 31, 2018:
| | | Asset Derivatives
Statement of Assets and
Liabilities Location | | Primary Risk
Exposure | | Value
(000) | |
Purchased Options | | Investments, at Value
(Purchased Options) | | |
Currency Risk | | | $ | 77 | (a) | |
(a) Amounts are included in Investments in Securities in the Statement of Assets and Liabilities.
The following tables set forth by primary risk exposure the Fund's realized gains (losses) and change in unrealized appreciation (depreciation) by type of derivative contract for the year ended December 31, 2018 in accordance with ASC 815:
Realized Gain (Loss) | |
Primary Risk Exposure | | Derivative Type | | Value
(000) | |
Currency Risk | | Investments
(Purchased Options) | | $ | (21 | )(b) | |
(b) Amounts are included in Investments Sold in the Statement of Operations.
Change in Unrealized Appreciation (Depreciation) | |
Primary Risk Exposure | | Derivative Type | | Value
(000) | |
Currency Risk | | Investments
(Purchased Options) | | $ | (204 | )(c) | |
(c) Amounts are included in Investments in the Statement of Operations.
22
Morgan Stanley Institutional Fund, Inc.
Annual Report — December 31, 2018
Notes to Financial Statements (cont'd)
At December 31, 2018, the Fund's derivative assets and liabilities are as follows:
Gross Amounts of Assets and Liabilities
Presented in the Statement of Assets and Liabilities | |
Derivatives | | Assets(c)
(000) | | Liabilities(d)
(000) | |
Purchased Options | | $ | 77 | (a) | | $ | — | | |
(a) Amounts are included in Investments in Securities in the Statement of Assets and Liabilities.
(d) Absent an event of default or early termination, OTC derivative assets and liabilities are presented gross and not offset in the Statement of Assets and Liabilities.
The Fund typically enters into International Swaps and Derivatives Association, Inc. Master Agreements ("ISDA Master Agreements") or similar master agreements (collectively, "Master Agreements") with its contract counterparties for certain OTC derivatives in order to, among other things, reduce its credit risk to counterparties. ISDA Master Agreements include provisions for general obligations, representations, collateral and events of default or termination. Under an ISDA Master Agreement, the Fund typically may offset with the counterparty certain OTC derivative financial instruments' payables and/or receivables with collateral held and/or posted and create one single net payment (close-out netting) in the event of default, termination and/or potential deterioration in the credit quality of the counterparty. Various Master Agreements govern the terms of certain transactions with counterparties, including transactions such as swap, forward, repurchase and reverse repurchase agreements. These Master Agreements typically attempt to reduce the counterparty risk associated with such transactions by specifying credit protection mechanisms and providing standardization that improves legal certainty. Cross-termination provisions under Master Agreements typically provide that a default in connection with one transaction between the Fund and a counterparty gives the non-defaulting party the right to terminate any other transactions in place with the defaulting party to create one single net payment due to/due from the defaulting party and may be a feature in certain Master Agreements. In the event the Fund exercises its right to terminate a Master Agreement after a counterparty experiences a termination event as defined in the Master Agreement, the return of collateral with market value in excess of the Fund's net liability may be delayed or denied.
The following table presents derivative financial instruments that are subject to enforceable netting arrangements as of December 31, 2018:
Gross Amounts Not Offset in the Statement of Assets and Liabilities | |
| Counterparty | | Gross Asset
Derivatives
Presented in the
Statement of
Assets and
Liabilities
(000) | | Financial
Instrument
(000) | | Collateral
Received
(000) | | Net Amount
(not less
than $0)
(000) | |
Royal Bank of Scotland | | | 77 | (a) | | $ | — | | | $ | — | | | $ | 77 | | |
(a) Amounts are included in Investments in Securities in the Statement of Assets and Liabilities.
For the year ended December 31, 2018, the approximate average monthly amount outstanding for each derivative type is as follows:
Purchased Options: | |
Average monthly notional amount | | | 17,179,000 | | |
5. Restricted Securities: The Fund invests in unregistered or otherwise restricted securities. The term "restricted securities" refers to securities that are unregistered or are held by control persons of the issuer and securities that are subject to contractual restrictions on their resale. As a result, restricted securities may be more difficult to value and the Fund may have difficulty disposing of such assets either in a timely manner or for a reasonable price. In order to dispose of an unregistered security, the Fund, where it has contractual rights to do so, may have to cause such security to be registered. A considerable period may elapse between the time the decision is made to sell the security and the time the security is registered so that the Fund can sell it. Contractual restrictions on the resale of securities vary in length and scope and are generally the result of a negotiation between the issuer and the acquirer of the securities. The Fund would, in either case, bear market risks during that period. Restricted securities are identified in the Portfolio of Investments.
6. Indemnifications: The Company enters into contracts that contain a variety of indemnifications. The Company's maximum exposure under these arrangements is unknown. However, the Company has not had prior claims or losses pursuant to these contracts and expects the risk of loss to be remote.
7. Dividends and Distributions to Shareholders: Dividends and distributions to shareholders are recorded on the ex-dividend date. Dividends from net investment
23
Morgan Stanley Institutional Fund, Inc.
Annual Report — December 31, 2018
Notes to Financial Statements (cont'd)
income, if any, are declared and paid annually. Net realized capital gains, if any, are distributed at least annually.
8. Security Transactions, Income and Expenses: Security transactions are accounted for on the trade date (date the order to buy or sell is executed). Realized gains and losses on the sale of investment securities are determined on the specific identified cost method. Dividend income and other distributions are recorded on the ex-dividend date (except for certain foreign dividends which may be recorded as soon as the Fund is informed of such dividends) net of applicable withholding taxes. Non-cash dividends received in the form of stock, if any, are recognized on the ex-dividend date and recorded as non-cash dividend income at fair value. Interest income is recognized on the accrual basis except where collection is in doubt. Discounts are accreted and premiums are amortized over the life of the respective securities. Most expenses of the Company can be directly attributed to a particular Fund. Expenses which cannot be directly attributed are apportioned among the Funds based upon relative net assets or other appropriate methods. Income, expenses (other than class specific expenses — distribution and shareholder services, transfer agency and sub transfer agency fees) and realized and unrealized gains or losses are allocated to each class of shares based upon their relative net assets.
B. Advisory Fees: The Adviser, a wholly-owned subsidiary of Morgan Stanley, provides the Fund with advisory services under the terms of an Investment Advisory Agreement, paid quarterly, at the annual rate based on the daily net assets as follows:
First $1
billion | | Over $1
billion | |
| | 0.80 | % | | | 0.75 | % | |
For the year ended December 31, 2018, the advisory fee rate (net of waiver/rebate) was equivalent to an annual effective rate of 0.28% of the Fund's average daily net assets.
The Adviser has agreed to reduce its advisory fee and/or reimburse the Fund so that total annual portfolio operating expenses, excluding certain investment related expenses, taxes, interest and other extraordinary expenses (including litigation), will not exceed 1.10% for Class I shares, 1.45% for Class A shares, 1.95% for Class L shares and 2.20% for Class C shares. Effective November 19, 2018, the Adviser has agreed to reduce
its advisory fee and/or reimburse the Fund so that the total annual operating expenses will not exceed for 1.42% for Class A shares. The fee waivers and/or expense reimbursements will continue for at least two years from the date of the Reorganization or until such time as the Directors act to discontinue all or a portion of such waivers and/or reimbursements when they deem such action is appropriate. For the year ended December 31, 2018, approximately $170,000 of advisory fees were waived and approximately $48,000 of other expenses were reimbursed by the Adviser pursuant to this arrangement.
C. Administration Fees: The Adviser also serves as Administrator to the Company and provides administrative services pursuant to an Administration Agreement for an annual fee, accrued daily and paid monthly, of 0.08% of the Fund's average daily net assets.
Under a Sub-Administration Agreement between the Administrator and State Street Bank and Trust Company ("State Street"), State Street provides certain administrative services to the Company. For such services, the Administrator pays State Street a portion of the fee the Administrator receives from the Fund.
D. Distribution and Shareholder Services Fees: Morgan Stanley Distribution, Inc. ("MSDI" or the "Distributor"), a wholly-owned subsidiary of the Adviser and an indirect subsidiary of Morgan Stanley, serves as the Company's Distributor of Fund shares pursuant to a Distribution Agreement. The Company has adopted a Shareholder Services Plan with respect to Class A shares pursuant to Rule 12b-1 under the Act. Under the Shareholder Services Plan, the Fund pays the Distributor a shareholder services fee, accrued daily and paid monthly, at an annual rate of 0.25% of the Fund's average daily net assets attributable to Class A shares.
The Company has adopted a Distribution and Shareholder Services Plan with respect to Class L shares pursuant to Rule 12b-1 under the Act. Under the Distribution and Shareholder Services Plan, the Fund pays the Distributor a distribution fee, accrued daily and paid monthly, at an annual rate of 0.50% and a shareholder services fee, accrued daily and paid monthly, at an annual rate of 0.25% of the Fund's average daily net assets attributable to Class L shares.
The Company has adopted a Distribution and Shareholder Services Plan with respect to Class C shares pursuant to Rule 12b-1 under the Act. Under the Distribution and
24
Morgan Stanley Institutional Fund, Inc.
Annual Report — December 31, 2018
Notes to Financial Statements (cont'd)
Shareholder Services Plan, the Fund pays the Distributor a distribution fee, accrued daily and paid monthly, at an annual rate of 0.75% and a shareholder services fee, accrued daily and paid monthly, at an annual rate of 0.25% of the Fund's average daily net assets attributable to Class C shares.
The distribution and shareholder services fees are used to support the expenses associated with servicing and maintaining accounts. The Distributor may compensate other parties for providing shareholder support services to investors who purchase Class A, Class L and Class C shares.
E. Dividend Disbursing and Transfer Agent: The Company's dividend disbursing and transfer agent is DST Asset Manager Solutions, Inc. ("DST"). Pursuant to a Transfer Agency Agreement, the Company pays DST a fee based on the number of classes, accounts and transactions relating to the Funds of the Company.
F. Custodian Fees: State Street (the "Custodian") also serves as Custodian for the Company in accordance with a Custodian Agreement. The Custodian holds cash, securities and other assets of the Company as required by the Act. Custody fees are payable monthly based on assets held in custody, investment purchases and sales activity and account maintenance fees, plus reimbursement for certain out-of-pocket expenses.
G. Security Transactions and Transactions with Affiliates: For the year ended December 31, 2018, purchases and sales of investment securities for the Fund, other than long-term U.S. Government securities and short-term investments were approximately $264,347,000 and $196,369,000, respectively. There were no purchases and sales of long-term U.S. Government securities for the year ended December 31, 2018.
The Fund invests in the Institutional Class of the Morgan Stanley Institutional Liquidity Funds — Treasury Securities Portfolio (the "Liquidity Funds"), an open-end management investment company managed by the Adviser. Advisory fees paid by the Fund are reduced by an amount equal to its pro-rata share of the advisory and administration fees paid by the Fund due to its investment in the Liquidity Funds. For the year ended December 31, 2018, advisory fees paid were reduced by approximately $3,000 relating to the Fund's investment in the Liquidity Funds.
A summary of the Fund's transactions in shares of affiliated investments during the year ended December 31, 2018 is as follows:
Affiliated
Investment
Company | | Value
December 31,
2017
(000) | | Purchases
at Cost
(000) | | Proceeds
from Sales
(000) | | Dividend
Income
(000) | |
Liquidity Funds | | $ | 367 | | | $ | 48,156 | | | $ | 45,875 | | | $ | 25 | | |
Affiliated
Investment
Company (cont'd) | | Realized
Gain (Loss)
(000) | | Change in
Unrealized
Appreciation
(Depreciation)
(000) | | Value
December 31,
2018
(000) | |
Liquidity Funds | | $ | — | | | $ | — | | | $ | 2,648 | | |
During the year ended December 31, 2018, the Fund incurred less than $500 in brokerage commissions with Morgan Stanley & Co. LLC, an affiliate of the Adviser/Administrator and Distributor, for portfolio transactions executed on behalf of the Fund.
The Fund is permitted to purchase and sell securities ("cross-trade") from and to other Morgan Stanley Funds as well as other funds and client accounts for which the Adviser or an affiliate of the Adviser serves as investment adviser, pursuant to procedures approved by the Directors in compliance with Rule 17a-7 under the Act (the "Rule"). Each cross-trade is executed at the current market price in compliance with provisions of the Rule. For the year ended December 31, 2018, the Fund did not engage in any cross-trade transactions.
The Fund has an unfunded Deferred Compensation Plan (the "Compensation Plan"), which allows each independent Director to defer payment of all, or a portion, of the fees he or she receives for serving on the Board of Directors. Each eligible Director generally may elect to have the deferred amounts credited with a return equal to the total return on one or more of the Morgan Stanley funds that are offered as investment options under the Compensation Plan. Appreciation/depreciation and distributions received from these investments are recorded with an offsetting increase/decrease in the deferred compensation obligation and do not affect the NAV of the Fund.
H. Federal Income Taxes: It is the Fund's intention to continue to qualify as a regulated investment company and distribute all of its taxable and tax-exempt income. Accordingly, no provision for Federal income taxes is required in the financial statements.
25
Morgan Stanley Institutional Fund, Inc.
Annual Report — December 31, 2018
Notes to Financial Statements (cont'd)
The Fund may be subject to taxes imposed by countries in which it invests. Such taxes are generally based on income and/or capital gains earned or repatriated. Taxes are accrued based on net investment income, net realized gains and net unrealized appreciation as such income and/or gains are earned. Taxes may also be based on transactions in foreign currency and are accrued based on the value of investments denominated in such currency.
FASB ASC 740-10, "Income Taxes — Overall", sets forth a minimum threshold for financial statement recognition of the benefit of a tax position taken or expected to be taken in a tax return. Management has concluded there are no significant uncertain tax positions that would require recognition in the financial statements. If applicable, the Fund recognizes interest accrued related to unrecognized tax benefits in "Interest Expense" and penalties in "Other Expenses" in the Statement of Operations. The Fund files tax returns with the U.S. Internal Revenue Service, New York and various states. Generally, each of the tax years in the four-year period ended December 31, 2018 remains subject to examination by taxing authorities.
The tax character of distributions paid may differ from the character of distributions for GAAP purposes due to short-term capital gains being treated as ordinary income for tax purposes. The tax character of distributions paid during fiscal years 2018 and 2017 was as follows:
2018
Distributions
Paid From: | | 2017
Distributions
Paid From: | |
Ordinary
Income
(000) | | Long-Term
Capital Gain
(000) | | Paid-in-
Capital
(000) | | Ordinary
Income
(000) | | Long-Term
Capital Gain
(000) | |
| $ | 126 | | | $ | 974 | | | $ | 2 | | | $ | 64 | | | $ | 1,195 | | |
The amount and character of income and gains to be distributed are determined in accordance with income tax regulations which may differ from GAAP. These book/tax differences are either considered temporary or permanent in nature.
Temporary differences are primarily due to differing book and tax treatments in the timing of the recognition of gains (losses) on certain investment transactions and the timing of the deductibility of certain expenses.
Permanent differences, primarily due to adjustments related to the Reorganization, a net operating loss and a dividend
redesignation, resulted in the following reclassifications among the components of net assets at December 31, 2018:
Total
Accumulated
Loss
(000) | | Paid-in-
Capital
(000) | |
| $ | (352 | ) | | $ | 352 | | |
At December 31, 2018, the Fund had no distributable earnings on a tax basis.
Qualified late year losses are capital losses and specified ordinary losses, including currency losses, incurred after October 31 but within the taxable year that, if elected, are deemed to arise on the first day of the Fund's next taxable year. For the year ended December 31, 2018, the Fund intends to defer to January 1, 2019 for U.S. federal income tax purposes the following losses:
Qualified
Late Year
Ordinary
Losses
(000) | | Post-October
Capital
Losses
(000) | |
| $ | 66 | | | $ | 3,303 | | |
I. Credit Facility: The Company and other Morgan Stanley funds participated in a $150,000,000 committed, unsecured revolving line of credit facility (the "Facility") with State Street. This Facility is to be used for temporary emergency purposes or funding of shareholder redemption requests. The interest rate on borrowings is based on the federal funds rate or 1 month LIBOR rate plus a spread. The Facility also has a commitment fee of 0.25% per annum based on the unused portion of the Facility. During the year ended December 31, 2018, the Fund did not have any borrowings under the Facility.
J. Other: At December 31, 2018, the Fund had record owners of 10% or greater. Investment activities of these shareholders could have a material impact on the Fund. The aggregate percentage of such owners was 37.5%.
26
Morgan Stanley Institutional Fund, Inc.
Annual Report — December 31, 2018
Report of Independent Registered Public Accounting Firm
To the Shareholders and Board of Directors of
Morgan Stanley Institutional Fund, Inc. —
Global Advantage Portfolio
Opinion on the Financial Statements
We have audited the accompanying statement of assets and liabilities of Global Advantage Portfolio (the "Fund") (one of the funds constituting the Morgan Stanley Institutional Fund, Inc. (the "Company")), including the portfolio of investments, as of December 31, 2018, and the related statement of operations for the year then ended, the statements of changes in net assets for each of the two years in the period then ended, the financial highlights for each of the five years in the period then ended and the related notes (collectively referred to as the "financial statements"). In our opinion, the financial statements present fairly, in all material respects, the financial position of Global Advantage Portfolio (one of the funds constituting Morgan Stanley Institutional Fund, Inc.) at December 31, 2018, the results of its operations for the year then ended, the changes in its net assets for each of the two years in the period then ended and its financial highlights for each of the five years in the period then ended, in conformity with U.S. generally accepted accounting principles.
Basis for Opinion
These financial statements are the responsibility of the Company's management. Our responsibility is to express an opinion on the Fund's financial statements based on our audits. We are a public accounting firm registered with the Public Company Accounting Oversight Board (United States) ("PCAOB") and are required to be independent with respect to the Company in accordance with the U.S. federal securities law and the applicable rules and regulations of the Securities and Exchange Commission and the PCAOB.
We conducted our audits in accordance with the standards of the PCAOB. Those standards require that we plan and perform the audit to obtain reasonable assurance about whether the financial statements are free of material misstatement, whether due to error or fraud. The Company is not required to have, nor were we engaged to perform, an audit of the Company's internal control over financial reporting. As part of our audits, we are required to obtain an understanding of internal control over financial reporting, but not for the purpose of expressing an opinion on the effectiveness of the Company's internal control over financial reporting. Accordingly, we express no such opinion.
Our audits included performing procedures to assess the risks of material misstatement of the financial statements, whether due to error or fraud, and performing procedures that respond to those risks. Such procedures included examining, on a test basis, evidence regarding the amounts and disclosures in the financial statements. Our procedures included confirmation of securities owned as of December 31, 2018 by correspondence with the custodian and others or by other appropriate auditing procedures where replies from others were not received. Our audits also included evaluating the accounting principles used and significant estimates made by management, as well as evaluating the overall presentation of the financial statements. We believe that our audits provide a reasonable basis for our opinion.

We have served as the auditor of one or more Morgan Stanley investment companies since 2000.
Boston, Massachusetts
February 26, 2019
27
Morgan Stanley Institutional Fund, Inc.
Annual Report — December 31, 2018
Federal Tax Notice (unaudited)
For federal income tax purposes, the following information is furnished with respect to the distributions paid by the Fund during its taxable year ended December 31, 2018. For corporate shareholders 18.8% of the dividends qualified for the dividends received deduction.
The Fund designated and paid approximately $974,000 as a long-term capital gain distribution.
For federal income tax purposes, the following information is furnished with respect to the Fund's earnings for its taxable year ended December 31, 2018. When distributed, certain earnings may be subject to a maximum tax rate of 15% as provided for by the Jobs and Growth Tax Relief Reconciliation Act of 2003. The Fund designated up to a maximum of approximately $14,000 as taxable at this lower rate.
In January, the Fund provides tax information to shareholders for the preceding calendar year.
28
Morgan Stanley Institutional Fund, Inc.
Annual Report — December 31, 2018
Privacy Notice (unaudited)
MORGAN STANLEY INVESTMENT MANAGEMENT INC.
AN IMPORTANT NOTICE CONCERNING OUR U.S. PRIVACY POLICY
We are required by federal law to provide you with a copy of our privacy policy annually. This policy applies to current and former individual investors in funds managed or sponsored by Morgan Stanley Investment Management Inc. ("MSIM") as well as current and former individual clients of MSIM. This policy is not applicable to partnerships, corporations, trusts or other non-individual clients or investors. Please note that we may amend this policy at any time, and will inform you of any changes as required by law.
WE RESPECT YOUR PRIVACY
We appreciate that you have provided us with your personal financial information. We strive to maintain the privacy of such information while we help you achieve your financial objectives. This Notice describes what non-public personal information we collect about you, why we collect it, when we may share it with others and how certain others may use it. It discusses the steps you may take to limit our sharing of certain information about you to affiliated companies in the Morgan Stanley family of companies ("other Morgan Stanley companies"). It also discloses how you may limit use of certain shared information for marketing purposes by other Morgan Stanley branded companies. Throughout this policy, we refer to the non-public information that personally identifies you or your accounts as "personal information."
1. WHAT PERSONAL INFORMATION DO WE COLLECT ABOUT YOU?
We obtain personal information from applications and other forms you submit to us, from your dealings with us, from consumer reporting agencies, from our Web sites and from third parties and other sources.
For example:
• We may collect information such as your name, address, e-mail address, telephone/fax numbers, assets, income and investment objectives through subscription documents, applications and other forms you submit to us.
• We may obtain information about account balances, your use of account(s) and the types of products and services you prefer to receive from us through your dealings and transactions with us and other sources.
• We may obtain information about your creditworthiness and credit history from consumer reporting agencies.
• We may collect background information from and through third-party vendors to verify representations you have made and to comply with various regulatory requirements.
• If you interact with us through our public and private Web sites, we may collect information that you provide directly through online communications (such as an e-mail address). We may also collect information about your Internet service provider, your domain name, your computer's operating system and Web browser, your use of our Web sites and your product and service preferences, through the use of "cookies." Please consult the Terms of Use of these sites for more details.
2. WHEN DO WE DISCLOSE PERSONAL INFORMATION WE COLLECT ABOUT YOU?
We may disclose personal information we collect about you to other Morgan Stanley companies and to non-affiliated third parties.
a. Information We Disclose to Other Morgan Stanley Companies.
We may disclose personal information to other Morgan Stanley companies for a variety of reasons, including to manage your account(s) effectively, to service and process your transactions, to let you know about products and services offered by us and other Morgan Stanley companies, to manage our business, and as otherwise required or permitted by law. Offers for products and services from other Morgan Stanley companies are developed under conditions designed to safeguard your personal information.
29
Morgan Stanley Institutional Fund, Inc.
Annual Report — December 31, 2018
Privacy Notice (unaudited) (cont'd)
b. Information We Disclose to Non-affiliated Third Parties.
We do not disclose personal information that we collect about you to non-affiliated third parties except to those who provide marketing services on our behalf, to financial institutions with whom we have joint marketing agreements, and as otherwise required or permitted by law. For example, we may disclose personal information to non-affiliated third parties for servicing and processing transactions, to offer our own products and services, to protect against fraud, for institutional risk control, to respond to judicial process or to perform services on our behalf. When we share personal information with a non-affiliated third party, they are required to limit their use of personal information to the particular purpose for which it was shared and they are not allowed to share personal information with others except to fulfill that limited purpose or as may be permitted or required by law.
3. HOW DO WE PROTECT THE SECURITY AND CONFIDENTIALITY OF PERSONAL INFORMATION WE COLLECT ABOUT YOU?
We maintain physical, electronic and procedural security measures to help safeguard the personal information we collect about you. We have internal policies governing the proper handling of client information. Third parties that provide support or marketing services on our behalf may also receive personal information, and we require them to adhere to confidentiality standards with respect to such information.
4. HOW CAN YOU LIMIT THE SHARING OF CERTAIN TYPES OF PERSONAL INFORMATION WITH OTHER MORGAN STANLEY COMPANIES?
We offer you choices as to whether we share with other Morgan Stanley companies the personal information that was collected to determine your eligibility for products and services you request ("eligibility information"). Eligibility information does not include your identification information or personal information pertaining to our transactions or experiences with you. Please note that, even if you direct us not to share eligibility information with other Morgan Stanley companies ("opt-out"), we may still share personal information, including eligibility information, with those companies in circumstances excluded from the opt-out under applicable law, such as to process transactions or to service your account.
5. HOW CAN YOU LIMIT THE USE OF CERTAIN TYPES OF PERSONAL INFORMATION BY OTHER MORGAN STANLEY COMPANIES FOR MARKETING?
By following the opt-out instructions in Section 6 below, you may limit other Morgan Stanley branded companies from marketing their products or services to you based on personal information we disclose to them. This information may include, for example, your income and account history with us. Please note that, even if you choose to limit Other Morgan Stanley Companies from using personal information about you that we may share with them for marketing their products and services to you, Other Morgan Stanley Companies may use your personal information that they obtain from us to market to you in circumstances permitted by law, such as if the Other Morgan Stanley Company has its own relationship with you.
6. HOW CAN YOU SEND US AN OPT-OUT INSTRUCTION?
If you wish to limit our sharing of eligibility information about you with other Morgan Stanley companies or other Morgan Stanley companies' use of personal information for marketing purposes, as described in this notice, you may do so by:
• Calling us at (800) 548-7786
Monday–Friday between 8a.m. and 6p.m. (EST)
• Writing to us at the following address:
DST Asset Manager Solutions, Inc.
c/o Privacy Coordinator
P.O. Box 219804
Kansas City, Missouri 64121
30
Morgan Stanley Institutional Fund, Inc.
Annual Report — December 31, 2018
Privacy Notice (unaudited) (cont'd)
Your written request should include your name, address, telephone number and account number(s) to which the opt-out applies and whether you are opting out with respect to sharing of eligibility information (Section 4 above), or if information used for Marketing (Section 5 above) or both. Written opt-out requests should not be sent with any other correspondence. In order to process your request, we require that the request be provided by you directly and not through a third party.
Your opt-out preference will remain in effect with respect to this policy (as it may be amended) until you notify us otherwise. If you have a joint account, your direction for us not to share this information with other Morgan Stanley companies and for those other Morgan Stanley companies not to use your personal information for marketing will be applied to all account holders on that account. Please understand that if you limit our sharing or our affiliated companies' use of personal information, you and any joint account holder(s) may not receive information about Morgan Stanley products and services, including products or services that could help you manage your financial resources and achieve your investment objectives.
7. WHAT IF AN AFFILIATED COMPANY BECOMES A NON-AFFILIATED THIRD PARTY?
If, at any time in the future, an affiliated company becomes a non-affiliated third party, further disclosures of personal information made to the former affiliated company will be limited to those described in Section 2(b) above relating to non-affiliated third parties. If you elected under Section 6 to limit disclosures we make to affiliated companies, or use of personal information by affiliated companies, your election will not apply to use by any former affiliated company of your personal information in their possession once it becomes a non-affiliated third party.
SPECIAL NOTICE TO RESIDENTS OF VERMONT
The following section supplements our Policy with respect to our individual clients who have a Vermont address and supersedes anything to the contrary in the above Policy with respect to those clients only.
The state of Vermont requires financial institutions to obtain your consent prior to sharing personal information that they collect about you with affiliated companies and non-affiliated third parties other than in certain limited circumstances. Except as permitted by law, we will not share personal information we collect about you with non-affiliated third parties or other Morgan Stanley companies unless you provide us with your written consent to share such information ("opt-in").
If you wish to receive offers for investment products and services offered by or through other Morgan Stanley companies, please notify us in writing at the following address:
DST Asset Manager Solutions, Inc.
c/o Privacy Coordinator
P.O. Box 219804
Kansas City, Missouri 64121
Your authorization should include your name, address, telephone number and account number(s) to which the opt-in applies and should not be sent with any other correspondence. In order to process your authorization, we require that the authorization be provided by you directly and not through a third party.
SPECIAL NOTICE TO RESIDENTS OF CALIFORNIA
The following section supplements our Policy with respect to our individual clients who have a California address and supersedes anything to the contrary in the above Policy with respect to those clients only.
In response to a California law, if your account has a California home address, your personal information will not be disclosed to non-affiliated third parties except as permitted by applicable California law, and we will limit sharing such information with our affiliates to comply with California privacy laws that apply to us.
31
Morgan Stanley Institutional Fund, Inc.
Annual Report — December 31, 2018
Director and Officer Information (unaudited)
Independent Directors:
Name, Age and Address of
Independent Director | | Position(s)
Held with
Registrant | | Length of Time
Served* | | Principal Occupation(s) During Past 5 Years
and Other Relevant Professional Experience | | Number of
Portfolios in
Fund Complex
Overseen by
Independent
Director** | | Other Directorships
Held by Independent
Director*** | |
Frank L. Bowman (74)
c/o Perkins Coie LLP
Counsel to the Independent
Directors
30 Rockefeller Plaza
New York, NY 10112 | | Director | | Since
August
2006 | | President, Strategic Decisions, LLC (consulting) (since February 2009); Director or Trustee of various Morgan Stanley Funds (since August 2006); Chairperson of the Compliance and Insurance Committee (since October 2015); formerly, Chairperson of the Insurance Sub-Committee of the Compliance and Insurance Committee (2007-2015); served as President and Chief Executive Officer of the Nuclear Energy Institute (policy organization) (February 2005-November 2008); retired as Admiral, U.S. Navy after serving over 38 years on active duty including 8 years as Director of the Naval Nuclear Propulsion Program in the Department of the Navy and the U.S. Department of Energy (1996-2004); served as Chief of Naval Personnel (July 1994-September 1996) and on the Joint Staff as Director of Political Military Affairs (June 1992-July 1994); knighted as Honorary Knight Commander of the Most Excellent Order of the British Empire; awarded the Officier de l'Orde National du Mérite by the French Government; elected to the National Academy of Engineering (2009). | | | 82 | | | Director of BP p.l.c.; Director of Naval and Nuclear Technologies LLP; Director Emeritus of the Armed Services YMCA; Member of the National Security Advisory Council of the Center for U.S. Global Engagement and a member of the CNA Military Advisory Board; Trustee of Fairhaven United Methodist Church; Member of the Board of Advisors of the Dolphin Scholarship Foundation; and Director of other various non-profit organizations. | |
Kathleen A. Dennis (65)
c/o Perkins Coie LLP
Counsel to the Independent Directors
30 Rockefeller Plaza
New York, NY 10112 | | Director | | Since
August
2006 | | President, Cedarwood Associates (mutual fund and investment management consulting) (since July 2006); Chairperson of the Liquidity and Alternatives Sub-Committee of the Investment Committee (since October 2006) and Director or Trustee of various Morgan Stanley Funds (since August 2006); formerly, Senior Managing Director of Victory Capital Management (1993-2006). | | | 82 | | | Director of various non-profit organizations. | |
Nancy C. Everett (63)
c/o Perkins Coie LLP
Counsel to the Independent Directors
30 Rockefeller Plaza
New York, NY 10112 | | Director | | Since
January
2015 | | Chief Executive Officer, Virginia Commonwealth University Investment Company (since November 2015); Owner, OBIR, LLC (institutional investment management consulting) (since June 2014); formerly, Managing Director, BlackRock Inc. (February 2011-December 2013); and Chief Executive Officer, General Motors Asset Management (a/k/a Promark Global Advisors, Inc.) (June 2005-May 2010). | | | 83 | | | Formerly, Member of Virginia Commonwealth University School of Business Foundation (2005-2016); Member of Virginia Commonwealth University Board of Visitors (2013-2015); Member of Committee on Directors for Emerging Markets Growth Fund, Inc. (2007-2010); Chairperson of Performance Equity Management, LLC (2006-2010); and Chairperson, GMAM Absolute Return Strategies Fund, LLC (2006-2010). | |
32
Morgan Stanley Institutional Fund, Inc.
Annual Report — December 31, 2018
Director and Officer Information (unaudited) (cont'd)
Independent Directors: (cont'd)
Name, Age and Address of
Independent Director | | Position(s)
Held with
Registrant | | Length of Time
Served* | | Principal Occupation(s) During Past 5 Years
and Other Relevant Professional Experience | | Number of
Portfolios in
Fund Complex
Overseen by
Independent
Director** | | Other Directorships
Held by Independent
Director*** | |
Jakki L. Haussler (61)
c/o Perkins Coie LLP
Counsel to the Independent Directors
30 Rockefeller Plaza
New York, NY 10112 | | Director | | Since
January
2015 | | Chairman and Chief Executive Officer, Opus Capital Group (since January 1996); formerly, Director, Capvest Venture Fund, LP (May 2000-December 2011); Partner, Adena Ventures, LP (July 1999-December 2010); Director, The Victory Funds (February 2005-July 2008). | | | 83 | | | Director of Service Corporation International and Member, Audit Committee and Investment Committee; Director of Cincinnati Bell Inc. and Member, Audit Committee and Governance and Nominating Committee; Chairman of Northern Kentucky University Member Investment Committee; Member of Chase College of Law Transactional Law Practice Center Board of Advisors; Director of Best Transport; Director of Chase College of Law Board of Visitors; formerly, Member, University of Cincinnati Foundation Investment Committee; Member, Miami University Board of Visitors (2008-2011); Trustee of Victory Funds (2005-2008) and Chairman, Investment Committee (2007-2008) and Member, Service Provider Committee (2005-2008). | |
Dr. Manuel H. Johnson (69)
c/o Johnson Smick
International, Inc.
220 I Street, NE — Suite 200
Washington, D.C. 20002 | | Director | | Since
July
1991 | | Senior Partner, Johnson Smick International, Inc. (consulting firm); Chairperson of the Investment Committee (since October 2006) and Director or Trustee of various Morgan Stanley Funds (since July 1991); Co-Chairman and a founder of the Group of Seven Council (G7C) (international economic commission); formerly, Chairperson of the Audit Committee (July 1991-September 2006), Vice Chairman of the Board of Governors of the Federal Reserve System and Assistant Secretary of the U.S. Treasury. | | | 82 | | | Director of NVR, Inc. (home construction). | |
Joseph J. Kearns (76)
c/o Perkins Coie LLP
Counsel to the Independent Directors
30 Rockfeller Plaza
New York, NY 10112 | | Director | | Since
August
1994 | | Senior Adviser, Kearns & Associates LLC (investment consulting); Chairperson of the Audit Committee (since October 2006) and Director or Trustee of various Morgan Stanley Funds (since August 1994); formerly, Deputy Chairperson of the Audit Committee (July 2003-September 2006) and Chairperson of the Audit Committee of various Morgan Stanley Funds (since August 1994); CFO of the J. Paul Getty Trust. | | | 83 | | | Prior to August 10, 2016, Director of Electro Rent Corporation (equipment leasing); Prior to December 31, 2013, Director of The Ford Family Foundation. | |
33
Morgan Stanley Institutional Fund, Inc.
Annual Report — December 31, 2018
Director and Officer Information (unaudited) (cont'd)
Independent Directors: (cont'd)
Name, Age and Address of
Independent Director | | Position(s)
Held with
Registrant | | Length of Time
Served* | | Principal Occupation(s) During Past 5 Years
and Other Relevant Professional Experience | | Number of
Portfolios in
Fund Complex
Overseen by
Independent
Director** | | Other Directorships
Held by Independent
Director*** | |
Michael F. Klein (60)
c/o Perkins Coie LLP
Counsel to the Independent Directors
30 Rockefeller Plaza
New York, NY 10112 | | Director | | Since
August
2006 | | Managing Director, Aetos Alternatives Management, LP (since March 2000); Co-President, Aetos Alternatives Management, LP (since January 2004) and Co-Chief Executive Officer of Aetos Alternatives Management, LP (since August 2013); Chairperson of the Fixed Income Sub-Committee of the Investment Committee (since October 2006) and Director or Trustee of various Morgan Stanley Funds (since August 2006); formerly, Managing Director, Morgan Stanley & Co. Inc. and Morgan Stanley Dean Witter Investment Management and President, various Morgan Stanley Funds (June 1998-March 2000): Principal, Morgan Stanley & Co. Inc. and Morgan Stanley Dean Witter Investment Management (August 1997-December 1999). | | | 82 | | | Director of certain investment funds managed or sponsored by Aetos Alternatives Management, LP; Director of Sanitized AG and Sanitized Marketing AG (specialty chemicals). | |
Patricia Maleski (58)
c/o Perkins Coie LLP
Counsel to the Independent Directors
30 Rockefeller Plaza
New York, NY 10112 | | Director | | Since
January
2017 | | Managing Director, JPMorgan Asset Management (2004-2016); Oversight and Control Head of Fiduciary and Conflicts of Interest Program (2015-2016); Chief Control Officer-Global Asset Management (2013-2015); President, JPMorgan Funds (2010-2013); Chief Administrative Officer (2004-2013); various other positions including Treasurer and Board Liaison (since 2001). | | | 83 | | | None. | |
Michael E. Nugent (82)
522 Fifth Avenue
New York, NY 10036 | | Chair of the Board and Director | | Chair of the Boards since July 2006 and Director since July 1991 | | Chair of the Boards of various Morgan Stanley Funds (since July 2006); Chairperson of the Closed-End Fund Committee (since June 2012) Governance Committee (since January 2019) and Director or Trustee of various Morgan Stanley Funds (since July 1991); formerly, Chairperson of the Insurance Committee (until July 2006); General Partner, Triumph Capital, L.P. (private investment partnership) (1988-2013). | | | 82 | | | None. | |
W. Allen Reed (71)
c/o Perkins Coie LLP
Counsel to the Independent Directors
30 Rockefeller Plaza
New York, NY 10112 | | Director | | Since
August
2006 | | Chairperson of the Equity Sub-Committee of the Investment Committee (since October 2006) and Director or Trustee of various Morgan Stanley Funds (since August 2006); formerly, President and CEO of General Motors Asset Management; Chairman and Chief Executive Officer of the GM Trust Bank and Corporate Vice President of General Motors Corporation (August 1994-December 2005). | | | 82 | | | Director of Legg Mason, Inc.; formerly, Director of the Auburn University Foundation (2010-2015). | |
Fergus Reid (86)****
c/o Joe Pietryka, Inc.
85 Charles Colman Blvd.
Pawling, NY 12564 | | Director | | Since
June
1992 | | Chairman, Joe Pietryka, Inc.; Chairperson of the Governance Committee and Director or Trustee of various Morgan Stanley Funds (since June 1992). | | | 83 | | | Formerly, Trustee and Director of certain investment companies in the JP Morgan Fund Complex managed by JP Morgan Investment Management Inc. (1987-2012). | |
* This is the earliest date the Director began serving the Morgan Stanley Funds. Each Director serves an indefinite term, until his or her successor is elected.
** The Fund Complex includes (as of December 31, 2018) all open-end and closed-end funds (including all of their portfolios) advised by Morgan Stanley Investment Management Inc. (the "Adviser") and any funds that have an adviser that is an affiliated person of the Adviser (including, but not limited to, Morgan Stanley AIP GP LP).
*** This includes any directorships at public companies and registered investment companies held by the Director at any time during the past five years.
**** Effective date of retirement is December 31, 2018.
34
Morgan Stanley Institutional Fund, Inc.
Annual Report — December 31, 2018
Director and Officer Information (unaudited) (cont'd)
Executive Officers:
Name, Age and Address of Executive Officer | | Position(s) Held
with
Registrant | | Length of
Time Served* | | Principal Occupation(s) During Past 5 Years | |
John H. Gernon (55)
522 Fifth Avenue
New York, NY 10036 | | President and Principal Executive Officer | | Since
September
2013 | | President and Principal Executive Officer of the Equity and Fixed Income Funds and the Morgan Stanley AIP Funds (since September 2013) and the Liquidity Funds and various money market funds (since May 2014) in the Fund Complex; Managing Director of the Adviser; Head of Product (since 2006). | |
Timothy J. Knierim (59)
522 Fifth Avenue
New York, NY 10036 | | Chief Compliance Officer | | Since
December
2016 | | Managing Director of the Adviser and various entities affiliated with the Adviser; Chief Compliance Officer of various Morgan Stanley Funds and the Adviser (since December 2016) and Chief Compliance Officer of Morgan Stanley AIP GP LP (since 2014). Formerly, Managing Director and Deputy Chief Compliance Officer of the Adviser (2014-2016); and formerly, Chief Compliance Officer of Prudential Investment Management, Inc. (2007-2014). | |
Francis J. Smith (53)
522 Fifth Avenue
New York, NY 10036 | | Treasurer and Principal Financial Officer | | Treasurer since July 2003 and Principal Financial Officer since September 2002 | | Managing Director of the Adviser and various entities affiliated with the Adviser; Treasurer (since July 2003) and Principal Financial Officer of various Morgan Stanley Funds (since September 2002). | |
Mary E. Mullin (51)
522 Fifth Avenue
New York, NY 10036 | | Secretary | | Since
June
1999 | | Managing Director of the Adviser; Secretary of various Morgan Stanley Funds (since June 1999). | |
Michael J. Key (39)
522 Fifth Avenue
New York, NY 10036 | | Vice President | | Since
June
2017 | | Vice President of the Equity and Fixed Income Funds, Liquidity Funds, various money market funds and the Morgan Stanley AIP Funds in the Fund Complex (since June 2017); Executive Director of the Adviser; Head of Product Development for Equity and Fixed Income Funds (since August 2013). | |
* This is the earliest date the officer began serving the Morgan Stanley Funds. Each officer serves a one-year term, until his or her successor is elected and qualifies.
35
Morgan Stanley Institutional Fund, Inc.
Annual Report — December 31, 2018
Adviser and Administrator
Morgan Stanley Investment Management Inc.
522 Fifth Avenue
New York, New York 10036
Distributor
Morgan Stanley Distribution, Inc.
522 Fifth Avenue
New York, New York 10036
Dividend Disbursing and Transfer Agent
DST Asset Manager Solutions, Inc.
2000 Crown Colony Drive
Quincy, Massachusetts 02169
Custodian
State Street Bank and Trust Company
One Lincoln Street
Boston, Massachusetts 02111
Legal Counsel
Dechert LLP
1095 Avenue of the Americas
New York, New York 10036
Counsel to the Independent Directors
Perkins Coie LLP
30 Rockefeller Plaza
New York, New York 10112
Independent Registered Public Accounting Firm
Ernst & Young LLP
200 Clarendon Street
Boston, Massachusetts 02116
Reporting to Shareholders
Each Morgan Stanley fund provides a complete schedule of portfolio holdings in its semi-annual and the annual reports within 60 days of the end of the fund's second and fourth fiscal quarters. The semi-annual and annual reports are filed electronically with the Securities and Exchange Commission ("SEC") on Form N-CSRS and Form N-CSR, respectively. Morgan Stanley also delivers the semi-annual and annual reports to fund shareholders and makes these reports available on its public website, www.morganstanley.com/im/shareholderreports. Each Morgan Stanley fund also files a complete schedule of portfolio holdings with the SEC for the fund's first and third fiscal quarters on Form N-Q. Morgan Stanley does not deliver the reports for the first and third fiscal quarters to shareholders, nor are the reports posted to the Morgan Stanley public website. You may, however, obtain the Form N-Q filings (as well as the Form N-CSR and N-CSRS filings) by accessing the SEC's website, www.sec.gov. You can also request copies of these materials, upon payment of a duplicating fee, by electronic request at the SEC's email address (publicinfo@sec.gov).
Proxy Voting Policies and Procedures and Proxy Voting Record
You may obtain a copy of the Company's Proxy Voting Policy and Procedures and information regarding how the Company voted proxies relating to portfolio securities during the most recent twelve-month period ended June 30, without charge, upon request, by calling toll free 1 (800) 548-7786 or by visiting our website at www.morganstanley.com/im/shareholderreports. This information is also available on the SEC's website at www.sec.gov.
This report is authorized for distribution only when preceded or accompanied by a prospectus or summary prospectus of the applicable Fund of Morgan Stanley Institutional Fund, Inc., which describes in detail the Fund's investment policies, risks, fees and expenses. Please read the prospectus carefully before you invest or send money. For additional information, including information regarding the investments comprising the Fund, please visit our website at www.morganstanley.com/im/shareholderreports or call toll free 1 (800) 548-7786.
36
Printed in U.S.A.
This Report has been prepared for shareholders and may be distributed to others only if preceded or accompanied by a current prospectus.
Morgan Stanley Investment Management Inc.
522 Fifth Avenue
New York, New York 10036
© 2019 Morgan Stanley. Morgan Stanley Distribution, Inc.

IFIGAANN
2398660 EXP. 02.29.20

Morgan Stanley Institutional Fund, Inc.
Global Concentrated Real Estate Portfolio
Annual Report
December 31, 2018
Beginning on January 1, 2021, as permitted by regulations adopted by the Securities and Exchange Commission ("SEC"), paper copies of the Fund's Annual and Semi-Annual Reports to Shareholders ("Shareholder Reports") will no longer be sent by mail, unless you specifically request paper copies of the Shareholder Reports from the Fund or from your financial intermediary, such as a broker-dealer or a bank. Instead, the Shareholder Reports will be made available on the Fund's website, https://www.morganstanley.com/im/shareholderreports and you will be notified by mail each time a Shareholder Report is posted and provided with a website link to access the Shareholder Report. If you already elected to receive Shareholder Reports electronically, you will not be affected by this change and you need not take any action. You may elect to receive Shareholder Reports and other communications from the Fund electronically anytime by contacting your financial intermediary or, if you are a direct investor, please follow the instructions on the envelope.
Beginning on January 1, 2019, you may elect to receive all future Shareholder Reports in paper free of charge. If you invest through a financial intermediary, you can contact your financial intermediary to request that you continue to receive paper copies of your Shareholder Reports. If you invest directly with the Fund, please follow the instructions on the envelope to let the Fund know you wish to continue receiving paper copies of your Shareholder Reports. Your election to receive Shareholder Reports in paper will apply to all funds held in your account if you invest through your financial intermediary or all funds held with the fund complex if you invest directly with a fund.

Morgan Stanley Institutional Fund, Inc.
Annual Report — December 31, 2018
Shareholders' Letter | | | 2 | | |
Expense Example | | | 3 | | |
Investment Overview | | | 4 | | |
Portfolio of Investments | | | 6 | | |
Statement of Assets and Liabilities | | | 8 | | |
Statement of Operations | | | 9 | | |
Statement of Changes in Net Assets | | | 10 | | |
Financial Highlights | | | 11 | | |
Notes to Financial Statements | | | 15 | | |
Report of Independent Registered Public Accounting Firm | | | 21 | | |
Federal Tax Notice | | | 22 | | |
Privacy Notice | | | 23 | | |
Director and Officer Information | | | 26 | | |
This report is authorized for distribution only when preceded or accompanied by a prospectus or summary prospectus of the applicable Fund of Morgan Stanley Institutional Fund, Inc. To receive a prospectus and/or statement of additional information (SAI), which contains more complete information such as investment objectives, charges, expenses, policies for voting proxies, risk considerations and describes in detail each of the Fund's investment policies to the prospective investor, please call toll free 1 (800) 548-7786. Please read the prospectuses carefully before you invest or send money.
Additionally, you can access information about the Fund, including performance, characteristics and investment team commentary, through Morgan Stanley Investment Management's website: www.morganstanley.com/im/shareholderreports.
Market forecasts provided in this report may not necessarily come to pass. There is no guarantee that any sectors mentioned will continue to perform as discussed herein or that securities in such sectors will be held by the Fund in the future. There is no assurance that a fund will achieve its investment objective. Funds are subject to market risk, which is the possibility that market values of securities owned by the Fund will decline and, therefore, the value of the Fund's shares may be less than what you paid for them. Accordingly, you can lose money investing in this Fund. Please see the prospectus for more complete information on investment risks.
1
Morgan Stanley Institutional Fund, Inc.
Annual Report — December 31, 2018
Shareholders' Letter (unaudited)
Dear Shareholders,
We are pleased to provide this Annual report, in which you will learn how your investment in Global Concentrated Real Estate Portfolio (the "Fund") performed during the period beginning June 18, 2018 (when the Fund commenced operations) and ended December 31, 2018.
Morgan Stanley Investment Management is a client-centric, investor-led organization. Our global presence, intellectual capital, and breadth of products and services enable us to partner with investors to meet the evolving challenges of today's financial markets. We aim to deliver superior investment service and to empower our clients to make the informed decisions that help them reach their investment goals.
As always, we thank you for selecting Morgan Stanley Investment Management, and look forward to working with you in the months and years ahead.
Sincerely,

John H. Gernon
President and Principal Executive Officer
January 2019
2
Morgan Stanley Institutional Fund, Inc.
Annual Report — December 31, 2018
Expense Example (unaudited)
Global Concentrated Real Estate Portfolio
As a shareholder of the Fund, you incur two types of costs: (1) transactional costs; and (2) ongoing costs, which may include advisory fees, administration fees, distribution and shareholder services fees and other Fund expenses. This example is intended to help you understand your ongoing costs (in dollars) of investing in the Fund and to compare these costs with the ongoing costs of investing in other mutual funds.
This example is based on an investment of $1,000 invested at the beginning of the six-month period ended December 31, 2018 and held for the entire six-month period.
Actual Expenses
The table below provides information about actual account values and actual expenses. You may use the information in this table, together with the amount you invested, to estimate the expenses that you paid over the period. Simply divide your account value by $1,000 (for example, an $8,600 account value divided by $1,000 = 8.6), then multiply the result by the number in the table under the heading entitled "Actual Expenses Paid During Period" to estimate the expenses you paid on your account during this period.
Hypothetical Example for Comparison Purposes
The table below provides information about hypothetical account values and hypothetical expenses based on the Fund's actual expense ratio and an assumed rate of return of 5% per year before expenses, which is not the Fund's actual return. The hypothetical account values and expenses may not be used to estimate the actual ending account balance or expenses you paid for the period. You may use this information to compare the ongoing costs of investing in the Fund and other funds. To do so, compare this 5% hypothetical example with the 5% hypothetical examples that appear in the shareholder reports of the other funds.
Please note that the expenses shown in the table are meant to highlight your ongoing costs only and do not reflect any transactional costs, such as sales charges (loads). Therefore, the information for each class in the table is useful in comparing ongoing costs only, and will not help you determine the relative total costs of owning different funds. In addition, if these transactional costs were included, your costs would have been higher.
| | | Beginning
Account
Value
7/1/18 | | Actual Ending
Account
Value
12/31/18 | | Hypothetical
Ending Account
Value | | Actual
Expenses
Paid
During
Period* | | Hypothetical
Expenses Paid
During Period* | | Net
Expense
Ratio
During
Period** | |
Global Concentrated Real Estate Portfolio Class I | | $ | 1,000.00 | | | $ | 900.60 | | | $ | 1,020.52 | | | $ | 4.46 | | | $ | 4.74 | | | | 0.93 | % | |
Global Concentrated Real Estate Portfolio Class A | | | 1,000.00 | | | | 900.70 | | | | 1,018.65 | | | | 6.23 | | | | 6.61 | | | | 1.30 | | |
Global Concentrated Real Estate Portfolio Class C | | | 1,000.00 | | | | 897.00 | | | | 1,014.87 | | | | 9.80 | | | | 10.41 | | | | 2.05 | | |
Global Concentrated Real Estate Portfolio Class IS | | | 1,000.00 | | | | 900.80 | | | | 1,020.67 | | | | 4.31 | | | | 4.58 | | | | 0.90 | | |
* Expenses are calculated using each Fund Class' annualized net expense ratio (as disclosed), multiplied by the average account value over the period and multiplied by 184/365 (to reflect the most recent one-half year period).
** Annualized.
3
Morgan Stanley Institutional Fund, Inc.
Annual Report — December 31, 2018
Investment Overview (unaudited)
Global Concentrated Real Estate Portfolio
The Fund seeks to provide current income and long-term capital appreciation.
Performance
For the since inception period from June 18, 2018 through December 31, 2018, the Fund's Class I shares had a total return based on net asset value and reinvestment of distributions per share of –9.49%, net of fees. The Fund's Class I shares underperformed the Fund's benchmark, the FTSE EPRA Nareit Developed Real Estate Net Total Return Index, which returned –5.02%.
Factors Affecting Performance
• In 2018, the broader equity market appeared to be pricing in an economic slowdown scenario and specifically in the fourth quarter, a host of global macro concerns appeared to result in a broad-based sell-off, which also negatively impacted listed real estate share prices. Within the Fund, exposure to the U.S. primary central business district (CBD) office sector was the largest detractor for the since inception period as the sector is facing significant negative investor sentiment. Also a key detractor was significant investor preference for market segments viewed as more defensive (U.S. health care and net lease, Japan REITs, Australian REITs), where the Fund was underweight due to less attractive premium share private valuations.
Management Strategies
• Our research process is driven by our bottom-up analysis of each public real estate company. We maintain a strong conviction that a disciplined, bottom-up investment methodology will result in the highest returns and outperformance over the long term. As such, the stock selection process for the Fund is based on our bottom-up analysis of real estate companies. Pursuant to determining which real estate securities, in our view, offer the best value (versus peers and direct real estate valuations) based on our net asset value (NAV) models and other real estate valuation metrics (implied price per square foot, implied capitalization rate, etc.), we apply our analysis to select those securities that we believe offer the highest total expected returns on a risk-adjusted basis. This rigorous portfolio construction process is strictly implemented so that we include
only our highest conviction ideas in the portfolio. Diversification is also a significant consideration in constructing and managing the Fund.
• There is enormous disparity in relative valuations among market segments within each of the major regions. We see the most attractive expected return prospects from companies concentrated in U.S. CBD office (especially NYC office), the Hong Kong commercial property companies, U.S. and Continental Europe high-quality retail, and the U.K. Majors and London office specialists.
• In the U.S., the REIT market ended the period trading at a 5% discount to NAVs,(i) with various segments trading at meaningful discounts. We see the most attractive value in the owners of NYC office assets. We also see attractive value in high-quality retail, CBD office, hotel and apartment stocks. These companies provide exposure to high-quality core assets at significant discounted valuations.
• In Hong Kong, the Hong Kong real estate operating companies (REOCs) continue to represent a significant overweight in the global portfolio, as we believe the stocks offer highly attractive value with the widest overall discrepancy between public and private valuations among public listed global property markets despite healthy operating fundamentals, solid recurring cash flow growth and continued strength in asset values in the private markets, as well as improving corporate governance and capital management. The discounted valuations are further accentuated as the Hong Kong REOCs maintain very modest leverage levels. These NAV discounts could eventually narrow for companies that are willing to recycle assets on the balance sheet to realize their latent gains and engage in corporate restructuring to improve transparency and capital management, and potentially eliminate any holding company discounts, as well as any improvement in recent negative sentiment.
• In the U.K., overall, property stocks ended the period trading at a 21% discount to NAVs.(i) There is attractive value in the large-cap U.K. Majors, which trade at a 35% discount to NAVs,(i) and
(i) Morgan Stanley Investment Management, as of December 31, 2018
4
Morgan Stanley Institutional Fund, Inc.
Annual Report — December 31, 2018
Investment Overview (unaudited) (cont'd)
Global Concentrated Real Estate Portfolio
London office specialists, which trade at a 25% discount.(i) These discounts are well in excess of expected asset value declines and reflect a disparity in value versus Other U.K. stocks. On the Continent, valuations are being supported by stable property fundamentals. Property stocks on the Continent ended the period trading at a 15% discount to NAVs(i) overall, although there is meaningful disparity in valuations, with the Continental retail stocks trading at a 35% discount to NAVs(i) following accelerated share price weakness on concerns over retail challenges despite stable operating results by the companies.
(i) Morgan Stanley Investment Management, as of December 31, 2018
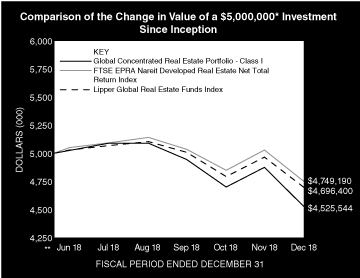
* Minimum Investment for Class I shares
** Commenced Operations on June 18, 2018.
In accordance with SEC regulations, the Fund's performance shown assumes that all recurring fees (including management fees) were deducted and all dividends and distributions were reinvested. The performance of Class A, C and IS shares will vary from the performance of Class I shares and will be negatively impacted by additional fees assessed to those classes (if applicable).
Performance Compared to the FTSE EPRA Nareit Developed Real Estate Net Total Return Index(1) and the Lipper Global Real Estate Funds Index(2)
| | | Period Ended December 31, 2018
Total Returns(3) | |
| | | One
Year | | Five
Years | | Ten
Years | | Since
Inception(5) | |
Fund — Class I Shares
w/o sales charges(4) | | | — | | | | — | | | | — | | | | –9.49 | % | |
Fund — Class A Shares
w/o sales charges(4) | | | — | | | | — | | | | — | | | | –9.57 | | |
Fund — Class A Shares with
maximum 5.25% sales charges(4) | | | — | | | | — | | | | — | | | | –14.28 | | |
Fund — Class C Shares
w/o sales charges(4) | | | — | | | | — | | | | — | | | | –9.94 | | |
Fund — Class C Shares with
maximum 1.00% deferred
sales charges(4) | | | — | | | | — | | | | — | | | | –10.81 | | |
Fund — Class IS Shares
w/o sales charges(4) | | | — | | | | — | | | | — | | | | –9.47 | | |
FTSE EPRA Nareit Developed
Real Estate Net Total Return
Index | | | — | | | | — | | | | — | | | | –5.02 | | |
Lipper Global Real Estate Funds
Index | | | — | | | | — | | | | — | | | | –6.07 | | |
Performance data quoted represents past performance, which is no guarantee of future results, and current performance may be lower or higher than the figures shown. Performance assumes that all dividends and distributions, if any, were reinvested. For the most recent month-end performance figures, please visit www.morganstanley.com/im/shareholderreports. Investment return and principal value will fluctuate so that Fund shares, when redeemed, may be worth more or less than their original cost. Returns for periods less than one year are not annualized. Total returns do not reflect the deduction of taxes that a shareholder would pay on Fund distributions or the redemption of Fund shares. Performance of share classes will vary due to difference in sales charges and expenses.
(1) The FTSE EPRA Nareit Developed Real Estate Net Total Return Index is a market capitalization weighted index designed to reflect the stock performance of companies engaged in the North American, European and Asian real estate markets. The performance of the Index is listed in U.S. dollars and assumes reinvestment of net dividends. The Index is unmanaged and its returns do not include any sales charges or fees. Such costs would lower performance. It is not possible to invest directly in an index.
(2) The Lipper Global Real Estate Funds Index is an equally weighted performance index of the largest qualifying funds (based on net assets) in the Lipper Global Real Estate Funds classification. The Index, which is adjusted for capital gains distributions and income dividends, is unmanaged and should not be considered an investment. There are currently 30 funds represented in this Index. As of the date of this report, the Fund is in the Lipper Global Real Estate Funds classification.
(3) Total returns for the Fund reflect fees waived and expenses reimbursed, if applicable, by Morgan Stanley Investment Management Inc. (the "Adviser"). Without such waivers and reimbursements, total returns would have been lower.
(4) Commenced operations on June 18, 2018.
(5) For comparative purposes, average annual since inception returns listed for the Indexes refer to the inception date of the Fund, not the inception of the Index.
5
Morgan Stanley Institutional Fund, Inc.
Annual Report — December 31, 2018
Portfolio of Investments
Global Concentrated Real Estate Portfolio
| | | Shares | | Value
(000) | |
Common Stocks (99.6%) | |
Australia (1.3%) | |
GPT Group (The) REIT | | | 5,051 | | | $ | 19 | | |
Scentre Group REIT | | | 13,064 | | | | 36 | | |
| | | | 55 | | |
Canada (0.3%) | |
RioCan Real Estate Investment Trust REIT | | | 820 | | | | 14 | | |
China (0.8%) | |
China Overseas Land & Investment Ltd. (a) | | | 9,671 | | | | 33 | | |
Finland (0.3%) | |
Citycon Oyj | | | 6,661 | | | | 12 | | |
France (7.3%) | |
Gecina SA REIT | | | 336 | | | | 43 | | |
ICADE REIT | | | 95 | | | | 7 | | |
Klepierre SA REIT | | | 6,358 | | | | 196 | | |
Unibail-Rodamco-Westfield REIT | | | 445 | | | | 69 | | |
| | | | 315 | | |
Hong Kong (25.4%) | |
CK Asset Holdings Ltd. | | | 1,895 | | | | 14 | | |
Hongkong Land Holdings Ltd. | | | 47,324 | | | | 298 | | |
Hysan Development Co., Ltd. | | | 13,265 | | | | 63 | | |
Link REIT | | | 4,738 | | | | 48 | | |
Mandarin Oriental International Ltd. | | | 58,076 | | | | 118 | | |
New World Development Co., Ltd. | | | 16,108 | | | | 21 | | |
Sino Land Co., Ltd. | | | 9,782 | | | | 17 | | |
Sun Hung Kai Properties Ltd. | | | 23,941 | | | | 339 | | |
Swire Properties Ltd. | | | 39,663 | | | | 139 | | |
Wharf Holdings Ltd. (The) | | | 2,843 | | | | 7 | | |
Wharf Real Estate Investment Co., Ltd. | | | 5,897 | | | | 35 | | |
| | | | 1,099 | | |
Ireland (0.5%) | |
Green REIT PLC | | | 13,368 | | | | 21 | | |
Japan (4.4%) | |
GLP J-REIT | | | 1 | | | | 1 | | |
Invincible Investment Corp. REIT | | | 33 | | | | 14 | | |
Mitsubishi Estate Co., Ltd. | | | 4,995 | | | | 78 | | |
Mitsui Fudosan Co., Ltd. | | | 3,312 | | | | 73 | | |
Nippon Building Fund, Inc. REIT | | | 4 | | | | 25 | | |
| | | | 191 | | |
Netherlands (1.2%) | |
Eurocommercial Properties N.V. CVA REIT | | | 1,723 | | | | 53 | | |
Norway (0.2%) | |
Entra ASA | | | 730 | | | | 10 | | |
Singapore (0.2%) | |
CapitaLand Ltd. | | | 3,032 | | | | 7 | | |
UOL Group Ltd. | | | 917 | | | | 4 | | |
| | | | 11 | | |
Spain (1.1%) | |
Inmobiliaria Colonial Socimi SA REIT | | | 1,049 | | | | 10 | | |
Merlin Properties Socimi SA REIT | | | 3,000 | | | | 37 | | |
| | | | 47 | | |
| | | Shares | | Value
(000) | |
Sweden (0.4%) | |
Hufvudstaden AB, Class A | | | 1,004 | | | $ | 16 | | |
United Kingdom (9.7%) | |
British Land Co., PLC (The) REIT | | | 11,727 | | | | 80 | | |
Derwent London PLC REIT | | | 2,138 | | | | 78 | | |
Great Portland Estates PLC REIT | | | 11,920 | | | | 100 | | |
Hammerson PLC REIT | | | 1,978 | | | | 8 | | |
Land Securities Group PLC REIT | | | 13,260 | | | | 136 | | |
St. Modwen Properties PLC | | | 1,014 | | | | 5 | | |
Urban & Civic PLC | | | 3,764 | | | | 12 | | |
| | | | 419 | | |
United States (46.5%) | |
American Homes 4 Rent, Class A REIT | | | 834 | | | | 17 | | |
Apartment Investment & Management Co.,
Class A REIT | | | 745 | | | | 33 | | |
AvalonBay Communities, Inc. REIT | | | 520 | | | | 90 | | |
Boston Properties, Inc. REIT | | | 1,456 | | | | 164 | | |
Brixmor Property Group, Inc. REIT | | | 4,421 | | | | 65 | | |
Brookfield Property REIT, Inc., Class A REIT | | | 555 | | | | 9 | | |
Camden Property Trust REIT | | | 151 | | | | 13 | | |
Columbia Property Trust, Inc. REIT | | | 302 | | | | 6 | | |
Equity Residential REIT | | | 1,369 | | | | 90 | | |
Essex Property Trust, Inc. REIT | | | 91 | | | | 22 | | |
Federal Realty Investment Trust REIT | | | 184 | | | | 22 | | |
HCP, Inc. REIT | | | 160 | | | | 4 | | |
Healthcare Realty Trust, Inc. REIT | | | 540 | | | | 15 | | |
Host Hotels & Resorts, Inc. REIT | | | 6,813 | | | | 114 | | |
Hudson Pacific Properties, Inc. REIT | | | 1,479 | | | | 43 | | |
JBG SMITH Properties REIT | | | 767 | | | | 27 | | |
Kimco Realty Corp. REIT | | | 1,050 | | | | 15 | | |
Life Storage, Inc. REIT | | | 246 | | | | 23 | | |
Macerich Co. (The) REIT | | | 3,782 | | | | 164 | | |
Mack-Cali Realty Corp. REIT | | | 3,421 | | | | 67 | | |
Mid-America Apartment Communities, Inc. REIT | | | 114 | | | | 11 | | |
Paramount Group, Inc. REIT | | | 2,675 | | | | 34 | | |
Pennsylvania Real Estate Investment Trust REIT | | | 1,014 | | | | 6 | | |
ProLogis, Inc. REIT | | | 512 | | | | 30 | | |
Public Storage REIT | | | 53 | | | | 11 | | |
QTS Realty Trust, Inc., Class A REIT | | | 275 | | | | 10 | | |
Regency Centers Corp. REIT | | | 1,346 | | | | 79 | | |
RLJ Lodging Trust REIT | | | 3,129 | | | | 51 | | |
Simon Property Group, Inc. REIT | | | 1,761 | | | | 296 | | |
SITE Centers Corp. REIT | | | 464 | | | | 5 | | |
SL Green Realty Corp. REIT | | | 3,441 | | | | 272 | | |
Sunstone Hotel Investors, Inc. REIT | | | 738 | | | | 10 | | |
Vornado Realty Trust REIT | | | 3,081 | | | | 191 | | |
| | | | 2,009 | | |
Total Common Stocks (Cost $4,863) | | | 4,305 | | |
The accompanying notes are an integral part of the financial statements.
6
Morgan Stanley Institutional Fund, Inc.
Annual Report — December 31, 2018
Portfolio of Investments (cont'd)
Global Concentrated Real Estate Portfolio
| | | Shares | | Value
(000) | |
Short-Term Investment (0.2%) | |
Investment Company (0.2%) | |
Morgan Stanley Institutional Liquidity
Funds — Treasury Securities Portfolio —
Institutional Class (See Note G)
(Cost $10) | | | 9,720 | | | $ | 10 | | |
Total Investments (99.8%) (Cost $4,873) (b)(c) | | | 4,315 | | |
Other Assets in Excess of Liabilities (0.2%) | | | 7 | | |
Net Assets (100.0%) | | $ | 4,322 | | |
Country assignments and aggregations are based generally on third party vendor classifications and information, and may be different from the assignments and aggregations under the policies set forth in the Fund's prospectus and/or statement of additional information relating to geographic classifications.
(a) Security trades on the Hong Kong exchange.
(b) The approximate market value and percentage of total investments, $2,282,000 and 52.8%, respectively, represent the securities that have been fair valued under the fair valuation policy for international investments as described in Note A-1 within the Notes to Financial Statements.
(c) At December 31, 2018, the aggregate cost for federal income tax purposes is approximately $4,886,000. The aggregate gross unrealized appreciation is approximately $30,000 and the aggregate gross unrealized depreciation is approximately $601,000, resulting in net unrealized depreciation of approximately $571,000.
CVA Certificaten Van Aandelen.
REIT Real Estate Investment Trust.
Portfolio Composition
Classification | | Percentage of
Total Investments | |
Diversified | | | 33.6 | % | |
Retail | | | 25.4 | | |
Office | | | 24.8 | | |
Residential | | | 7.2 | | |
Lodging/Resorts | | | 6.8 | | |
Other* | | | 2.2 | | |
Total Investments | | | 100.0 | % | |
* Industries and/or investment types representing less than 5% of total investments.
The accompanying notes are an integral part of the financial statements.
7
Morgan Stanley Institutional Fund, Inc.
Annual Report — December 31, 2018
Global Concentrated Real Estate Portfolio
Statement of Assets and Liabilities | | December 31, 2018
(000) | |
Assets: | |
Investments in Securities of Unaffiliated Issuers, at Value (Cost $4,863) | | $ | 4,305 | | |
Investment in Security of Affiliated Issuer, at Value (Cost $10) | | | 10 | | |
Total Investments in Securities, at Value (Cost $4,873) | | | 4,315 | | |
Foreign Currency, at Value (Cost $2) | | | 3 | | |
Due from Adviser | | | 90 | | |
Prepaid Offering Costs | | | 81 | | |
Dividends Receivable | | | 14 | | |
Receivable for Investments Sold | | | 1 | | |
Tax Reclaim Receivable | | | — | @ | |
Receivable from Affiliate | | | — | @ | |
Other Assets | | | 4 | | |
Total Assets | | | 4,508 | | |
Liabilities: | |
Payable for Offering Costs | | | 103 | | |
Payable for Professional Fees | | | 69 | | |
Payable for Custodian Fees | | | 5 | | |
Payable for Transfer Agency Fees — Class I | | | 1 | | |
Payable for Transfer Agency Fees — Class A | | | 1 | | |
Payable for Transfer Agency Fees — Class C | | | 1 | | |
Payable for Transfer Agency Fees — Class IS | | | 1 | | |
Payable for Shareholder Services Fees — Class A | | | — | @ | |
Payable for Distribution and Shareholder Services Fees — Class C | | | — | @ | |
Payable for Investments Purchased | | | — | @ | |
Payable for Administration Fees | | | — | @ | |
Other Liabilities | | | 5 | | |
Total Liabilities | | | 186 | | |
Net Assets | | $ | 4,322 | | |
Net Assets Consist of: | |
Paid-in-Capital | | $ | 4,929 | | |
Total Accumulated Loss | | | (607 | ) | |
Net Assets | | $ | 4,322 | | |
CLASS I: | |
Net Assets | | $ | 4,295 | | |
| Shares Outstanding $0.001 par value shares of beneficial interest (unlimited shares authorized) (not in 000's) | | | 497,000 | | |
Net Asset Value, Offering and Redemption Price Per Share | | $ | 8.64 | | |
CLASS A: | |
Net Assets | | $ | 9 | | |
| Shares Outstanding $0.001 par value shares of beneficial interest (unlimited shares authorized) (not in 000's) | | | 1,000 | | |
Net Asset Value, Redemption Price Per Share | | $ | 8.65 | | |
Maximum Sales Load | | | 5.25 | % | |
Maximum Sales Charge | | $ | 0.48 | | |
Maximum Offering Price Per Share | | $ | 9.13 | | |
CLASS C: | |
Net Assets | | $ | 9 | | |
| Shares Outstanding $0.001 par value shares of beneficial interest (unlimited shares authorized) (not in 000's) | | | 1,000 | | |
Net Asset Value, Offering and Redemption Price Per Share | | $ | 8.65 | | |
CLASS IS: | |
Net Assets | | $ | 9 | | |
| Shares Outstanding $0.001 par value shares of beneficial interest (unlimited shares authorized) (not in 000's) | | | 1,000 | | |
Net Asset Value, Offering and Redemption Price Per Share | | $ | 8.64 | | |
@ Amount is less than $500.
The accompanying notes are an integral part of the financial statements.
8
Morgan Stanley Institutional Fund, Inc.
Annual Report — December 31, 2018
Global Concentrated Real Estate Portfolio
Statement of Operations | | Period from
June 18, 2018^ to
December 31, 2018
(000) | |
Investment Income: | |
Dividends from Securities of Unaffiliated Issuers (Net of $4 of Foreign Taxes Withheld) | | $ | 132 | | |
Non-Cash Dividends from Securities of Unaffiliated Issuers | | | 8 | | |
Dividends from Security of Affiliated Issuer (Note G) | | | 1 | | |
Total Investment Income | | | 141 | | |
Expenses: | |
Offering Costs | | | 95 | | |
Professional Fees | | | 85 | | |
Advisory Fees (Note B) | | | 20 | | |
Custodian Fees (Note F) | | | 11 | | |
Shareholder Reporting Fees | | | 10 | | |
Transfer Agency Fees — Class I (Note E) | | | 1 | | |
Transfer Agency Fees — Class A (Note E) | | | 1 | | |
Transfer Agency Fees — Class C (Note E) | | | 1 | | |
Transfer Agency Fees — Class IS (Note E) | | | 1 | | |
Administration Fees (Note C) | | | 2 | | |
Pricing Fees | | | 2 | | |
Shareholder Services Fees — Class A (Note D) | | | — | @ | |
Distribution and Shareholder Services Fees — Class C (Note D) | | | — | @ | |
Registration Fees | | | — | @ | |
Other Expenses | | | 1 | | |
Total Expenses | | | 230 | | |
Expenses Reimbursed by Adviser (Note B) | | | (181 | ) | |
Waiver of Advisory Fees (Note B) | | | (20 | ) | |
Reimbursement of Class Specific Expenses — Class A (Note B) | | | (1 | ) | |
Reimbursement of Class Specific Expenses — Class C (Note B) | | | (1 | ) | |
Reimbursement of Class Specific Expenses — Class IS (Note B) | | | (1 | ) | |
Rebate from Morgan Stanley Affiliate (Note G) | | | (— | @) | |
Net Expenses | | | 26 | | |
Net Investment Income | | | 115 | | |
Realized Loss: | |
Investments Sold | | | (23 | ) | |
Foreign Currency Translation | | | (— | @) | |
Net Realized Loss | | | (23 | ) | |
Change in Unrealized Appreciation (Depreciation): | |
Investments | | | (558 | ) | |
Foreign Currency Translation | | | — | @ | |
Net Change in Unrealized Appreciation (Depreciation) | | | (558 | ) | |
Net Realized Loss and Change in Unrealized Appreciation (Depreciation) | | | (581 | ) | |
Net Decrease in Net Assets Resulting from Operations | | $ | (466 | ) | |
^ Commencement of Operations.
@ Amount is less than $500.
The accompanying notes are an integral part of the financial statements.
9
Morgan Stanley Institutional Fund, Inc.
Annual Report — December 31, 2018
Global Concentrated Real Estate Portfolio
Statement of Changes in Net Assets | | Period from
June 18, 2018^ to
December 31, 2018
(000) | |
Increase (Decrease) in Net Assets: | |
Operations: | |
Net Investment Income | | $ | 115 | | |
Net Realized Loss | | | (23 | ) | |
Net Change in Unrealized Appreciation (Depreciation) | | | (558 | ) | |
Net Decrease in Net Assets Resulting from Operations | | | (466 | ) | |
Dividends and Distributions to Shareholders: | |
Class I | | | (141 | ) | |
Class A | | | (— | @) | |
Class C | | | (— | @) | |
Class IS | | | (— | @) | |
Paid-in-Capital: | |
Class I | | | (71 | ) | |
Class A | | | (— | @) | |
Class C | | | (— | @) | |
Class IS | | | (— | @) | |
Total Dividends and Distributions to Shareholders | | | (212 | ) | |
Capital Share Transactions:(1) | |
Class I: | |
Subscribed | | | 4,970 | | |
Class A: | |
Subscribed | | | 10 | | |
Class C: | |
Subscribed | | | 10 | | |
Class IS: | |
Subscribed | | | 10 | | |
Net Increase in Net Assets Resulting from Capital Share Transactions | | | 5,000 | | |
Total Increase in Net Assets | | | 4,322 | | |
Net Assets: | |
Beginning of Period | | | — | | |
End of Period | | $ | 4,322 | | |
(1) Capital Share Transactions: | |
Class I: | |
Shares Subscribed | | | 497 | | |
Class A: | |
Shares Subscribed | | | 1 | | |
Class C: | |
Shares Subscribed | | | 1 | | |
Class IS: | |
Shares Subscribed | | | 1 | | |
^ Commencement of Operations.
@ Amount is less than $500.
The accompanying notes are an integral part of the financial statements.
10
Morgan Stanley Institutional Fund, Inc.
Annual Report — December 31, 2018
Financial Highlights
Global Concentrated Real Estate Portfolio
| | | Class I | |
| Selected Per Share Data and Ratios | | Period from
June 18, 2018(1) to
December 31, 2018 | |
Net Asset Value, Beginning of Period | | $ | 10.00 | | |
Income (Loss) from Investment Operations: | |
Net Investment Income(2) | | | 0.23 | | |
Net Realized and Unrealized Loss | | | (1.16 | ) | |
Total from Investment Operations | | | (0.93 | ) | |
Distributions from and/or in Excess of: | |
Net Investment Income | | | (0.29 | ) | |
Paid-in-capital | | | (0.14 | ) | |
Total Distributions | | | (0.43 | ) | |
Net Asset Value, End of Period | | $ | 8.64 | | |
Total Return(3) | | | (9.49 | )%(6) | |
Ratios and Supplemental Data: | |
Net Assets, End of Period (Thousands) | | $ | 4,295 | | |
Ratio of Expenses to Average Net Assets(8) | | | 0.94 | %(4)(7) | |
Ratio of Net Investment Income to Average Net Assets(8) | | | 4.42 | %(4)(7) | |
Ratio of Rebate from Morgan Stanley Affiliates to Average Net Assets | | | 0.00 | %(5)(7) | |
Portfolio Turnover Rate | | | 19 | %(6) | |
(8) Supplemental Information on the Ratios to Average Net Assets: | |
Ratios Before Expense Limitation: | |
Expenses to Average Net Assets | | | 8.58 | %(7) | |
Net Investment Loss to Average Net Assets | | | (3.22 | )%(7) | |
(1) Commencement of Operations.
(2) Per share amount is based on average shares outstanding.
(3) Calculated based on the net asset value as of the last business day of the period.
(4) The Ratios of Expenses and Net Investment Income reflect the rebate of certain Fund expenses in connection with the investments in Morgan Stanley affiliates during the period. The effect of the rebate on the ratios is disclosed in the above table as "Ratio of Rebate from Morgan Stanley Affiliates to Average Net Assets."
(5) Amount is less than 0.005%.
(6) Not annualized.
(7) Annualized.
The accompanying notes are an integral part of the financial statements.
11
Morgan Stanley Institutional Fund, Inc.
Annual Report — December 31, 2018
Financial Highlights
Global Concentrated Real Estate Portfolio
| | | Class A | |
| Selected Per Share Data and Ratios | | Period from
June 18, 2018(1) to
December 31, 2018 | |
Net Asset Value, Beginning of Period | | $ | 10.00 | | |
Income (Loss) from Investment Operations: | |
Net Investment Income(2) | | | 0.21 | | |
Net Realized and Unrealized Loss | | | (1.15 | ) | |
Total from Investment Operations | | | (0.94 | ) | |
Distributions from and/or in Excess of: | |
Net Investment Income | | | (0.27 | ) | |
Paid-in-capital | | | (0.14 | ) | |
Total Distributions | | | (0.41 | ) | |
Net Asset Value, End of Period | | $ | 8.65 | | |
Total Return(3) | | | (9.57 | )%(6) | |
Ratios and Supplemental Data: | |
Net Assets, End of Period (Thousands) | | $ | 9 | | |
Ratio of Expenses to Average Net Assets(8) | | | 1.30 | %(4)(7) | |
Ratio of Net Investment Income to Average Net Assets(8) | | | 4.06 | %(4)(7) | |
Ratio of Rebate from Morgan Stanley Affiliates to Average Net Assets | | | 0.00 | %(5)(7) | |
Portfolio Turnover Rate | | | 19 | %(6) | |
(8) Supplemental Information on the Ratios to Average Net Assets: | |
Ratios Before Expense Limitation: | |
Expenses to Average Net Assets | | | 26.73 | %(7) | |
Net Investment Loss to Average Net Assets | | | (21.37 | )%(7) | |
(1) Commencement of Operations.
(2) Per share amount is based on average shares outstanding.
(3) Calculated based on the net asset value which does not reflect sales charges, if applicable, as of the last business day of the period.
(4) The Ratios of Expenses and Net Investment Income reflect the rebate of certain Fund expenses in connection with the investments in Morgan Stanley affiliates during the period. The effect of the rebate on the ratios is disclosed in the above table as "Ratio of Rebate from Morgan Stanley Affiliates to Average Net Assets."
(5) Amount is less than 0.005%.
(6) Not annualized.
(7) Annualized.
The accompanying notes are an integral part of the financial statements.
12
Morgan Stanley Institutional Fund, Inc.
Annual Report — December 31, 2018
Financial Highlights
Global Concentrated Real Estate Portfolio
| | | Class C | |
| Selected Per Share Data and Ratios | | Period from
June 18, 2018(1) to
December 31, 2018 | |
Net Asset Value, Beginning of Period | | $ | 10.00 | | |
Income (Loss) from Investment Operations: | |
Net Investment Income(2) | | | 0.17 | | |
Net Realized and Unrealized Loss | | | (1.15 | ) | |
Total from Investment Operations | | | (0.98 | ) | |
Distributions from and/or in Excess of: | |
Net Investment Income | | | (0.23 | ) | |
Paid-in-capital | | | (0.14 | ) | |
Total Distributions | | | (0.37 | ) | |
Net Asset Value, End of Period | | $ | 8.65 | | |
Total Return(3) | | | (9.94 | )%(6) | |
Ratios and Supplemental Data: | |
Net Assets, End of Period (Thousands) | | $ | 9 | | |
Ratio of Expenses to Average Net Assets(8) | | | 2.05 | %(4)(7) | |
Ratio of Net Investment Income to Average Net Assets(8) | | | 3.30 | %(4)(7) | |
Ratio of Rebate from Morgan Stanley Affiliates to Average Net Assets | | | 0.00 | %(5)(7) | |
Portfolio Turnover Rate | | | 19 | %(6) | |
(8) Supplemental Information on the Ratios to Average Net Assets: | |
Ratios Before Expense Limitation: | |
Expenses to Average Net Assets | | | 27.50 | %(7) | |
Net Investment Loss to Average Net Assets | | | (22.15 | )%(7) | |
(1) Commencement of Operations.
(2) Per share amount is based on average shares outstanding.
(3) Calculated based on the net asset value which does not reflect sales charges, if applicable, as of the last business day of the period.
(4) The Ratios of Expenses and Net Investment Income reflect the rebate of certain Fund expenses in connection with the investments in Morgan Stanley affiliates during the period. The effect of the rebate on the ratios is disclosed in the above table as "Ratio of Rebate from Morgan Stanley Affiliates to Average Net Assets."
(5) Amount is less than 0.005%.
(6) Not annualized.
(7) Annualized.
The accompanying notes are an integral part of the financial statements.
13
Morgan Stanley Institutional Fund, Inc.
Annual Report — December 31, 2018
Financial Highlights
Global Concentrated Real Estate Portfolio
| | | Class IS | |
| Selected Per Share Data and Ratios | | Period from
June 18, 2018(1) to
December 31, 2018 | |
Net Asset Value, Beginning of Period | | $ | 10.00 | | |
Income (Loss) from Investment Operations: | |
Net Investment Income(2) | | | 0.23 | | |
Net Realized and Unrealized Loss | | | (1.16 | ) | |
Total from Investment Operations | | | (0.93 | ) | |
Distributions from and/or in Excess of: | |
Net Investment Income | | | (0.29 | ) | |
Paid-in-capital | | | (0.14 | ) | |
Total Distributions | | | (0.43 | ) | |
Net Asset Value, End of Period | | $ | 8.64 | | |
Total Return(3) | | | (9.47 | )%(6) | |
Ratios and Supplemental Data: | |
Net Assets, End of Period (Thousands) | | $ | 9 | | |
Ratio of Expenses to Average Net Assets(8) | | | 0.90 | %(4)(7) | |
Ratio of Net Investment Income to Average Net Assets(8) | | | 4.45 | %(4)(7) | |
Ratio of Rebate from Morgan Stanley Affiliates to Average Net Assets | | | 0.00 | %(5)(7) | |
Portfolio Turnover Rate | | | 19 | %(6) | |
(8) Supplemental Information on the Ratios to Average Net Assets: | |
Ratios Before Expense Limitation: | |
Expenses to Average Net Assets | | | 26.46 | %(7) | |
Net Investment Loss to Average Net Assets | | | (21.11 | )%(7) | |
(1) Commencement of Operations.
(2) Per share amount is based on average shares outstanding.
(3) Calculated based on the net asset value as of the last business day of the period.
(4) The Ratios of Expenses and Net Investment Income reflect the rebate of certain Fund expenses in connection with the investments in Morgan Stanley affiliates during the period. The effect of the rebate on the ratios is disclosed in the above table as "Ratio of Rebate from Morgan Stanley Affiliates to Average Net Assets."
(5) Amount is less than 0.005%.
(6) Not annualized.
(7) Annualized.
The accompanying notes are an integral part of the financial statements.
14
Morgan Stanley Institutional Fund, Inc.
Annual Report — December 31, 2018
Notes to Financial Statements
Morgan Stanley Institutional Fund, Inc. (the "Company") is registered under the Investment Company Act of 1940, as amended (the "Act"), as an open-end management investment company. The Company is comprised of thirty separate, active, diversified and non-diversified funds (individually referred to as a "Fund", collectively as the "Funds"). The Company applies investment company accounting and reporting guidance.
The accompanying financial statements relate to the Global Concentrated Real Estate Portfolio. The Fund seeks to provide current income and long-term capital appreciation.
The Fund commenced operations on June 18, 2018 and offers four classes of shares — Class I, Class A, Class C and Class IS.
A. Significant Accounting Policies: The following significant accounting policies are in conformity with U.S. generally accepted accounting principles ("GAAP"). Such policies are consistently followed by the Company in the preparation of its financial statements. GAAP may require management to make estimates and assumptions that affect the reported amounts and disclosures in the financial statements. Actual results may differ from those estimates.
In August 2018, the Financial Accounting Standards Board ("FASB") issued Accounting Standards Update ("ASU") 2018-13, Fair Value Measurement (Topic 820) — Disclosures Framework — Changes to Disclosure Requirements of Fair Value Measurement ("ASU 2018-13") which introduces new fair value disclosure requirements as well as eliminates and modifies certain existing fair value disclosure requirements. ASU 2018-13 would be effective for fiscal years beginning after December 15, 2019 and for interim periods within those fiscal years; however, management has elected to early adopt ASU 2018-13 effective with the current reporting period as permitted by the standard. The impact of the Fund's adoption was limited to changes in the Fund's financial statement disclosures regarding fair value, primarily those disclosures related to transfers between levels of the fair value hierarchy and disclosure of the range and weighted average used to develop significant unobservable inputs for Level 3 fair value measurements, when applicable.
1. Security Valuation: (1) An equity portfolio security listed or traded on an exchange is valued at its latest reported sales price (or at the exchange official closing price if such exchange reports an official closing price), and if there were no sales on a given day and if there is no official exchange closing price for that day, the security is valued at the mean between the last reported bid and asked prices if
such bid and asked prices are available on the relevant exchanges. Listed equity securities not traded on the valuation date with no reported bid and asked prices available on the exchange are valued at the mean between the current bid and asked prices obtained from one or more reputable brokers or dealers. In cases where a security is traded on more than one exchange, the security is valued on the exchange designated as the primary market; (2) all other equity portfolio securities for which over-the-counter ("OTC") market quotations are readily available are valued at the latest reported sales price (or at the market official closing price if such market reports an official closing price), and if there was no trading in the security on a given day and if there is no official closing price from relevant markets for that day, the security is valued at the mean between the last reported bid and asked prices if such bid and asked prices are available on the relevant markets. An unlisted equity security that does not trade on the valuation date and for which bid and asked prices from the relevant markets are unavailable is valued at the mean between the current bid and asked prices obtained from one or more reputable brokers or dealers; (3) certain portfolio securities may be valued by an outside pricing service/vendor approved by the Company's Board of Directors (the "Directors"). The pricing service/vendor may employ a pricing model that takes into account, among other things, bids, yield spreads and/or other market data and specific security characteristics. Alternatively, if a valuation is not available from an outside pricing service/vendor, and the security trades on an exchange, the security may be valued at its latest reported sale price (or at the exchange official closing price if such exchange reports an official closing price), prior to the time when assets are valued. If there are no sales on a given day and if there is no official exchange closing price for that day, the security is valued at the mean between the last reported bid and asked prices if such bid and asked prices are available in the relevant exchanges; (4) when market quotations are not readily available, including circumstances under which Morgan Stanley Investment Management Inc. (the "Adviser") or Morgan Stanley Investment Management Limited ("MSIM Limited") and Morgan Stanley Investment Management Company ("MSIM Company") (together, the "Sub-Advisers"), each a wholly-owned subsidiary of Morgan Stanley, determine that the closing price, last sale price or the mean between the last reported bid and asked prices are not reflective of a security's market value, portfolio securities are valued at
15
Morgan Stanley Institutional Fund, Inc.
Annual Report — December 31, 2018
Notes to Financial Statements (cont'd)
their fair value as determined in good faith under procedures established by and under the general supervision of the Directors. Occasionally, developments affecting the closing prices of securities and other assets may occur between the times at which valuations of such securities are determined (that is, close of the foreign market on which the securities trade) and the close of business of the New York Stock Exchange ("NYSE"). If developments occur during such periods that are expected to materially affect the value of such securities, such valuations may be adjusted to reflect the estimated fair value of such securities as of the close of the NYSE, as determined in good faith by the Directors or by the Adviser using a pricing service and/or procedures approved by the Directors; (5) quotations of foreign portfolio securities, other assets and liabilities and forward contracts stated in foreign currency are translated into U.S. dollar equivalents at the prevailing market rates prior to the close of the NYSE; and (6) investments in mutual funds, including the Morgan Stanley Institutional Liquidity Funds, are valued at the net asset value ("NAV") as of the close of each business day.
The Directors have responsibility for determining in good faith the fair value of the investments, and the Directors may appoint others, such as the Company's Adviser or a valuation committee, to assist the Directors in determining fair value and to make the actual calculations pursuant to the fair valuation methodologies previously approved by the Directors. Under procedures approved by the Directors, the Company's Adviser has formed a Valuation Committee whose members are approved by the Directors. The Valuation Committee provides administration and oversight of the Company's valuation policies and procedures, which are reviewed at least annually by the Directors. These procedures allow the Company to utilize independent pricing services, quotations from securities and financial instrument dealers and other market sources to determine fair value.
The Fund invests a significant portion of its assets in securities of real estate investment trusts ("REITs"). The market's perception of prospective declines in private real estate values and other financial assets may result in increased volatility of market prices that can negatively impact the valuation of certain issuers held by the Fund.
2. Fair Value Measurement: FASB Accounting Standards CodificationTM ("ASC") 820, "Fair Value Measurement" ("ASC 820"), defines fair value as the value that the
Fund would receive to sell an investment or pay to transfer a liability in a timely transaction with an independent buyer in the principal market, or in the absence of a principal market, the most advantageous market for the investment or liability. ASC 820 establishes a three-tier hierarchy to distinguish between (1) inputs that reflect the assumptions market participants would use in valuing an asset or liability developed based on market data obtained from sources independent of the reporting entity (observable inputs) and (2) inputs that reflect the reporting entity's own assumptions about the assumptions market participants would use in valuing an asset or liability developed based on the best information available in the circumstances (unobservable inputs) and to establish classification of fair value measurements for disclosure purposes. Various inputs are used in determining the value of the Fund's investments. The inputs are summarized in the three broad levels listed below:
• Level 1 – unadjusted quoted prices in active markets for identical investments
• Level 2 – other significant observable inputs (including quoted prices for similar investments, interest rates, prepayment speeds, credit risk, etc.)
• Level 3 – significant unobservable inputs including the Fund's own assumptions in determining the fair value of investments. Factors considered in making this determination may include, but are not limited to, information obtained by contacting the issuer, analysts, or the appropriate stock exchange (for exchange-traded securities), analysis of the issuer's financial statements or other available documents and, if necessary, available information concerning other securities in similar circumstances
The inputs or methodology used for valuing securities are not necessarily an indication of the risk associated with investing in those securities and the determination of the significance of a particular input to the fair value measurement in its entirety requires judgment and considers factors specific to each security.
16
Morgan Stanley Institutional Fund, Inc.
Annual Report — December 31, 2018
Notes to Financial Statements (cont'd)
The following is a summary of the inputs used to value the Fund's investments as of December 31, 2018:
Investment Type | | Level 1
Unadjusted
quoted
prices
(000) | | Level 2
Other
significant
observable
inputs
(000) | | Level 3
Significant
unobservable
inputs
(000) | | Total
(000) | |
Assets: | |
Common Stocks | |
Diversified | | $ | 228 | | | $ | 1,223 | | | $ | — | | | $ | 1,451 | | |
Health Care | | | 19 | | | | — | | | | — | | | | 19 | | |
Industrial | | | 30 | | | | 1 | | | | — | | | | 31 | | |
Lodging/Resorts | | | 175 | | | | 118 | | | | — | | | | 293 | | |
Office | | | 586 | | | | 485 | | | | — | | | | 1,071 | | |
Residential | | | 276 | | | | 33 | | | | — | | | | 309 | | |
Retail | | | 675 | | | | 422 | | | | — | | | | 1,097 | | |
Self Storage | | | 34 | | | | — | | | | — | | | | 34 | | |
Total Common Stocks | | | 2,023 | | | | 2,282 | | | | — | | | | 4,305 | | |
Short-Term Investment | |
Investment Company | | | 10 | | | | — | | | | — | | | | 10 | | |
Total Assets | | $ | 2,033 | | | $ | 2,282 | | | $ | — | | | $ | 4,315 | | |
Transfers between investment levels may occur as the markets fluctuate and/or the availability of data used in an investment's valuation changes.
3. Foreign Currency Translation and Foreign Investments: The books and records of the Fund are maintained in U.S. dollars. Foreign currency amounts are translated into U.S. dollars as follows:
– investments, other assets and liabilities at the prevailing rate of exchange on the valuation date;
– investment transactions and investment income at the prevailing rates of exchange on the dates of such transactions.
Although the net assets of the Fund are presented at the foreign exchange rates and market values at the close of the period, the Fund does not isolate that portion of the results of operations arising as a result of changes in the foreign exchange rates from the fluctuations arising from changes in the market prices of securities held at period end. Similarly, the Fund does not isolate the effect of changes in foreign exchange rates from the fluctuations arising from changes in the market prices of securities sold during the period. Accordingly, realized and unrealized foreign currency gains (losses) on investments in securities are included in the reported net realized and unrealized gains (losses) on investment transactions and balances. However, pursuant to U.S. federal income tax regulations, gains and losses from certain foreign currency transactions and the foreign
currency portion of gains and losses realized on sales and maturities of foreign denominated debt securities are treated as ordinary income for U.S. federal income tax purposes.
Net realized gains (losses) on foreign currency transactions represent net foreign exchange gains (losses) from foreign currency forward exchange contracts, disposition of foreign currencies, currency gains (losses) realized between the trade and settlement dates on securities transactions, and the difference between the amount of investment income and foreign withholding taxes recorded on the Fund's books and the U.S. dollar equivalent amounts actually received or paid. Net unrealized currency gains (losses) from valuing foreign currency denominated assets and liabilities at period end exchange rates are reflected as a component of unrealized appreciation (depreciation) in the Statement of Assets and Liabilities. The change in unrealized currency gains (losses) on foreign currency translations for the period is reflected in the Statement of Operations.
Foreign security and currency transactions may involve certain considerations and risks not typically associated with those of U.S. dollar denominated transactions as a result of, among other factors, fluctuations of exchange rates in relation to the U.S. dollar, the possibility of lower levels of governmental supervision and regulation of foreign securities markets and the possibility of political or economic instability.
Governmental approval for foreign investments may be required in advance of making an investment under certain circumstances in some countries, and the extent of foreign investments in domestic companies may be subject to limitation in other countries. Foreign ownership limitations also may be imposed by the charters of individual companies to prevent, among other concerns, violations of foreign investment limitations. As a result, an additional class of shares (identified as "Foreign" in the Portfolio of Investments) may be created and offered for investment. The "local" and "foreign shares" market values may differ. In the absence of trading of the foreign shares in such markets, the Fund values the foreign shares at the closing exchange price of the local shares.
4. Indemnifications: The Company enters into contracts that contain a variety of indemnifications. The Company's maximum exposure under these arrangements is
17
Morgan Stanley Institutional Fund, Inc.
Annual Report — December 31, 2018
Notes to Financial Statements (cont'd)
unknown. However, the Company has not had prior claims or losses pursuant to these contracts and expects the risk of loss to be remote.
5. Dividends and Distributions to Shareholders: Dividends and distributions to shareholders are recorded on the ex-dividend date. Dividends from net investment income, if any, are declared and paid annually. Net realized capital gains, if any, are distributed at least annually.
6. Security Transactions, Income and Expenses: Security transactions are accounted for on the trade date (date the order to buy or sell is executed). Realized gains and losses on the sale of investment securities are determined on the specific identified cost method. Dividend income and other distributions are recorded on the ex-dividend date (except for certain foreign dividends which may be recorded as soon as the Fund is informed of such dividends) net of applicable withholding taxes. Non-cash dividends received in the form of stock, if any, are recognized on the ex-dividend date and recorded as non-cash dividend income at fair value. Interest income is recognized on the accrual basis except where collection is in doubt. Discounts are accreted and premiums are amortized over the life of the respective securities. Most expenses of the Company can be directly attributed to a particular Fund. Expenses which cannot be directly attributed are apportioned among the Funds based upon relative net assets or other appropriate methods. Income, expenses (other than class specific expenses — distribution and shareholder services, transfer agency and sub transfer agency fees) and realized and unrealized gains or losses are allocated to each class of shares based upon their relative net assets.
The Fund owns shares of REITs which report information on the source of their distributions annually in the following calendar year. A portion of distributions received from REITs during the year is estimated to be a return of capital and is recorded as a reduction of their cost.
B. Advisory/Sub-Advisory Fees: The Adviser, a wholly-owned subsidiary of Morgan Stanley, provides the Fund with advisory services under the terms of an Investment Advisory Agreement, paid quarterly, at the annual rate based on the daily net assets as follows:
First $2
billion | | Over $2
billion | |
| | 0.75 | % | | | 0.70 | % | |
For the period ended December 31, 2018, the advisory fee rate (net of waiver/rebate) was equivalent to an annual effective rate of 0.00% of the Fund's average daily net assets.
The Adviser has agreed to reduce its advisory fee and/or reimburse the Fund so that total annual portfolio operating expenses, excluding certain investment related expenses, taxes, interest and other extraordinary expenses (including litigation), will not exceed 0.95% for Class I shares, 1.30% for Class A shares, 2.05% for Class C shares and 0.90% for Class IS shares. The fee waivers and/or expense reimbursements will continue for at least one year from the date of the Fund's prospectus or until such time that the Directors act to discontinue all or a portion of such waivers or reimbursements when they deem such action is appropriate. For the period ended December 31, 2018, approximately $20,000 of advisory fees were waived and approximately $184,000 of other expenses were reimbursed by the Adviser pursuant to this arrangement.
The Adviser has entered into Sub-Advisory Agreements with the Sub-Advisers, each a wholly-owned subsidiary of Morgan Stanley. The Sub-Advisers provide the Fund with advisory services subject to the overall supervision of the Adviser and the Company's Officers and Directors. The Adviser pays the Sub-Advisers on a monthly basis a portion of the net advisory fees the Adviser receives from the Fund.
C. Administration Fees: The Adviser also serves as Administrator to the Company and provides administrative services pursuant to an Administration Agreement for an annual fee, accrued daily and paid monthly, of 0.08% of the Fund's average daily net assets.
Under a Sub-Administration Agreement between the Administrator and State Street Bank and Trust Company ("State Street"), State Street provides certain administrative services to the Company. For such services, the Administrator pays State Street a portion of the fee the Administrator receives from the Fund.
D. Distribution and Shareholder Services Fees: Morgan Stanley Distribution, Inc. ("MSDI" or the "Distributor"), a wholly-owned subsidiary of the Adviser and an indirect subsidiary of Morgan Stanley, serves as the Company's Distributor of Fund shares pursuant to a Distribution Agreement. The Company has adopted a Shareholder Services Plan with respect to Class A shares pursuant to Rule 12b-1 under the Act. Under the Shareholder Services Plan, the Fund pays the Distributor a shareholder services fee, accrued daily and paid
18
Morgan Stanley Institutional Fund, Inc.
Annual Report — December 31, 2018
Notes to Financial Statements (cont'd)
monthly, at an annual rate of 0.25% of the Fund's average daily net assets attributable to Class A shares.
The Company has adopted a Distribution and Shareholder Services Plan with respect to Class C shares pursuant to Rule 12b-1 under the Act. Under the Distribution and Shareholder Services Plan, the Fund pays the Distributor a distribution fee, accrued daily and paid monthly, at an annual rate of 0.75% and a shareholder services fee, accrued daily and paid monthly, at an annual rate of 0.25% of the Fund's average daily net assets attributable to Class C shares.
The distribution and shareholder services fees are used to support the expenses associated with servicing and maintaining accounts. The Distributor may compensate other parties for providing shareholder support services to investors who purchase Class A and Class C shares.
E. Dividend Disbursing and Transfer Agent: The Company's dividend disbursing and transfer agent is DST Asset Manager Solutions, Inc. ("DST"). Pursuant to a Transfer Agency Agreement, the Company pays DST a fee based on the number of classes, accounts and transactions relating to the Funds of the Company.
F. Custodian Fees: State Street (the "Custodian") also serves as Custodian for the Company in accordance with a Custodian Agreement. The Custodian holds cash, securities and other assets of the Company as required by the Act. Custody fees are payable monthly based on assets held in custody, investment purchases and sales activity and account maintenance fees, plus reimbursement for certain out-of-pocket expenses.
G. Security Transactions and Transactions with Affiliates: For the period ended December 31, 2018, purchases and sales of investment securities for the Fund, other than long-term U.S. Government securities and short-term investments, were approximately $5,812,000 and $935,000, respectively. There were no purchases and sales of long-term U.S. Government securities for the period ended December 31, 2018.
The Fund invests in the Institutional Class of the Morgan Stanley Institutional Liquidity Funds — Treasury Portfolio (the "Liquidity Funds"), an open-end management investment company managed by the Adviser. Advisory fees paid by the Fund are reduced by an amount equal to its pro-rata share of the advisory and administration fees paid by the Fund due to its investment in the Liquidity Funds. For the period ended December 31, 2018, advisory fees paid were reduced by less than $500 relating to the Fund's investment in the Liquidity Funds.
A summary of the Fund's transactions in shares of the affiliated investments during the period ended December 31, 2018 is as follows:
Affiliated
Investment
Company | | Value
June 18, 2018
(000) | | Purchases
at Cost
(000) | | Proceeds
from Sales
(000) | | Dividend
Income
(000) | |
Liquidity Funds | | $ | — | | | $ | 5,304 | | | $ | 5,294 | | | $ | 1 | | |
Affiliated
Investment
Company (cont'd) | | Realized
Gain (Loss)
(000) | | Change in
Unrealized
Appreciation
(Depreciation)
(000) | | Value
December 31,
2018
(000) | |
Liquidity Funds | | $ | — | | | $ | — | | | $ | 10 | | |
The Fund is permitted to purchase and sell securities ("cross-trade") from and to other Morgan Stanley Funds as well as other funds and client accounts for which the Adviser or an affiliate of the Adviser serves as investment adviser, pursuant to procedures approved by the Directors in compliance with Rule 17a-7 under the Act (the "Rule"). Each cross-trade is executed at the current market price in compliance with provisions of the Rule. For the period ended December 31, 2018, the Fund did not engage in any cross-trade transactions.
The Fund has an unfunded Deferred Compensation Plan (the "Compensation Plan"), which allows each independent Director to defer payment of all, or a portion, of the fees he or she receives for serving on the Board of Directors. Each eligible Director generally may elect to have the deferred amounts credited with a return equal to the total return on one or more of the Morgan Stanley funds that are offered as investment options under the Compensation Plan. Appreciation/depreciation and distributions received from these investments are recorded with an offsetting increase/decrease in the deferred compensation obligation and do not affect the NAV of the Fund.
H. Federal Income Taxes: It is the Fund's intention to continue to qualify as a regulated investment company and distribute all of its taxable and tax-exempt income. Accordingly, no provision for federal income taxes is required in the financial statements.
The Fund may be subject to taxes imposed by countries in which it invests. Such taxes are generally based on income and/or capital gains earned or repatriated. Taxes are accrued based on net investment income, net realized gains and net unrealized appreciation as such income and/or gains are earned. Taxes may also be based on transactions in foreign currency and are accrued based on the value of investments denominated in such currency.
FASB ASC 740-10, "Income Taxes — Overall", sets forth a minimum threshold for financial statement recognition of the
19
Morgan Stanley Institutional Fund, Inc.
Annual Report — December 31, 2018
Notes to Financial Statements (cont'd)
benefit of a tax position taken or expected to be taken in a tax return. Management has concluded there are no significant uncertain tax positions that would require recognition in the financial statements. If applicable, the Fund recognizes interest accrued related to unrecognized tax benefits in "Interest Expense" and penalties in "Other Expenses" in the Statement of Operations. The Fund files tax returns with the U.S. Internal Revenue Service, New York and various states. The tax year ended December 31, 2018 remains subject to examination by taxing authorities.
The tax character of distributions paid may differ from the character of distributions shown for GAAP purposes due to short-term capital gains being treated as ordinary income for tax purposes. The tax character of distributions paid during fiscal year 2018 was as follows:
| | 2018
Distributions
Paid From: | |
| | Ordinary
Income
(000) | | Paid-in-
Capital
(000) | |
| | | | | $ | 141 | | | $ | 71 | | |
The amount and character of income and gains to be distributed are determined in accordance with income tax regulations which may differ from GAAP. These book/tax differences are either considered temporary or permanent in nature.
Temporary differences are attributable to differing book and tax treatments for the timing of the recognition of gains (losses) on certain investment transactions and the timing of the deductibility of certain expenses.
Permanent differences, primarily due to a nondeductible expense, resulted in the following reclassifications among the components of net assets at December 31, 2018:
Total
Accumulated
Loss
(000) | | Paid-in
Capital
(000) | |
| $ | — | @ | | $ | (— | @) | |
@ Amount is less than $500.
At December 31, 2018, the Fund had no distributable earnings on a tax basis.
At December 31, 2018, the Fund had available for federal income tax purposes unused short-term capital losses of approximately $12,000 that do not have an expiration date.
To the extent that capital loss carryforwards are used to offset any future capital gains realized, no capital gains tax liability will be incurred by the Fund for gains realized and not distributed. To the extent that capital gains are offset, such gains will not be distributed to the shareholders.
I. Credit Facility: The Company and other Morgan Stanley funds participated in a $150,000,000 committed, unsecured revolving line of credit facility (the "Facility") with State Street. This Facility is to be used for temporary emergency purposes or funding of shareholder redemption requests. The interest rate on borrowings is based on the federal funds rate or 1 month LIBOR rate plus a spread. The Facility also has a commitment fee of 0.25% per annum based on the unused portion of the Facility. During the period ended December 31, 2018, the Fund did not have any borrowings under the Facility.
J. Other: At December 31, 2018, the Fund did not have record owners of 10% or greater.
20
Morgan Stanley Institutional Fund, Inc.
Annual Report — December 31, 2018
Report of Independent Registered Public Accounting Firm
To the Shareholders and Board of Directors of
Morgan Stanley Institutional Fund, Inc. —
Global Concentrated Real Estate Portfolio
Opinion on the Financial Statements
We have audited the accompanying statement of assets and liabilities of Global Concentrated Real Estate Portfolio (the "Fund") (one of the funds constituting the Morgan Stanley Institutional Fund, Inc. (the "Company")), including the portfolio of investments, as of December 31, 2018, and the related statements of operations, changes in net assets and the financial highlights for the period from June 18, 2018 (commencement of operations) through December 31, 2018 and the related notes (collectively referred to as the "financial statements"). In our opinion, the financial statements present fairly, in all material respects, the financial position of Global Concentrated Real Estate Portfolio (one of the funds constituting Morgan Stanley Institutional Fund, Inc.) at December 31, 2018, the results of its operations, the changes in its net assets and its financial highlights for the period from June 18, 2018 (commencement of operations) through December 31, 2018, in conformity with U.S. generally accepted accounting principles.
Basis for Opinion
These financial statements are the responsibility of the Company's management. Our responsibility is to express an opinion on the Fund's financial statements based on our audit. We are a public accounting firm registered with the Public Company Accounting Oversight Board (United States) ("PCAOB") and are required to be independent with respect to the Company in accordance with the U.S. federal securities law and the applicable rules and regulations of the Securities and Exchange Commission and the PCAOB.
We conducted our audit in accordance with the standards of the PCAOB. Those standards require that we plan and perform the audit to obtain reasonable assurance about whether the financial statements are free of material misstatement, whether due to error or fraud. The Company is not required to have, nor were we engaged to perform, an audit of the Company's internal control over financial reporting. As part of our audit, we are required to obtain an understanding of internal control over financial reporting, but not for the purpose of expressing an opinion on the effectiveness of the Company's internal control over financial reporting. Accordingly, we express no such opinion.
Our audit included performing procedures to assess the risks of material misstatement of the financial statements, whether due to error or fraud, and performing procedures that respond to those risks. Such procedures included examining, on a test basis, evidence regarding the amounts and disclosures in the financial statements. Our procedures included confirmation of securities owned as of December 31, 2018 by correspondence with the custodian and others or by other appropriate auditing procedures where replies from others were not received. Our audit also included evaluating the accounting principles used and significant estimates made by management, as well as evaluating the overall presentation of the financial statements. We believe that our audit provides a reasonable basis for our opinion.

We have served as the auditor of one or more Morgan Stanley investment companies since 2000.
Boston, Massachusetts
February 26, 2019
21
Morgan Stanley Institutional Fund, Inc.
Annual Report — December 31, 2018
Federal Tax Notice (unaudited)
For federal income tax purposes, the following information is furnished with respect to the Fund's earnings for its taxable year ended December 31, 2018. When distributed, certain earnings may be subject to a maximum tax rate of 15% as provided for by the Jobs and Growth Tax Relief Reconciliation Act of 2003. The Fund designated up to a maximum of approximately $17,000 as taxable at this lower rate.
The Fund intends to pass through foreign tax credits of approximately $2,000 and has derived net income from sources within foreign countries amounting to approximately $43,000.
In January, the Fund provides tax information to shareholders for the preceding calendar year.
22
Morgan Stanley Institutional Fund, Inc.
Annual Report — December 31, 2018
Privacy Notice (unaudited)
MORGAN STANLEY INVESTMENT MANAGEMENT INC.
AN IMPORTANT NOTICE CONCERNING OUR U.S. PRIVACY POLICY
We are required by federal law to provide you with a copy of our privacy policy annually. This policy applies to current and former individual investors in funds managed or sponsored by Morgan Stanley Investment Management Inc. ("MSIM") as well as current and former individual clients of MSIM. This policy is not applicable to partnerships, corporations, trusts or other non-individual clients or investors. Please note that we may amend this policy at any time, and will inform you of any changes as required by law.
WE RESPECT YOUR PRIVACY
We appreciate that you have provided us with your personal financial information. We strive to maintain the privacy of such information while we help you achieve your financial objectives. This Notice describes what non-public personal information we collect about you, why we collect it, when we may share it with others and how certain others may use it. It discusses the steps you may take to limit our sharing of certain information about you to affiliated companies in the Morgan Stanley family of companies ("other Morgan Stanley companies"). It also discloses how you may limit use of certain shared information for marketing purposes by other Morgan Stanley branded companies. Throughout this policy, we refer to the non-public information that personally identifies you or your accounts as "personal information.''
1. WHAT PERSONAL INFORMATION DO WE COLLECT ABOUT YOU?
We obtain personal information from applications and other forms you submit to us, from your dealings with us, from consumer reporting agencies, from our Web sites and from third parties and other sources.
For example:
• We may collect information such as your name, address, e-mail address, telephone/fax numbers, assets, income and investment objectives through subscription documents, applications and other forms you submit to us.
• We may obtain information about account balances, your use of account(s) and the types of products and services you prefer to receive from us through your dealings and transactions with us and other sources.
• We may obtain information about your creditworthiness and credit history from consumer reporting agencies.
• We may collect background information from and through third-party vendors to verify representations you have made and to comply with various regulatory requirements.
• If you interact with us through our public and private Web sites, we may collect information that you provide directly through online communications (such as an e-mail address). We may also collect information about your Internet service provider, your domain name, your computer's operating system and Web browser, your use of our Web sites and your product and service preferences, through the use of "cookies." Please consult the Terms of Use of these sites for more details.
2. WHEN DO WE DISCLOSE PERSONAL INFORMATION WE COLLECT ABOUT YOU?
We may disclose personal information we collect about you to other Morgan Stanley companies and to non-affiliated third parties.
a. Information We Disclose to Other Morgan Stanley Companies.
We may disclose personal information to other Morgan Stanley companies for a variety of reasons, including to manage your account(s) effectively, to service and process your transactions, to let you know about products and services offered by us and other Morgan Stanley companies, to manage our business, and as otherwise required or permitted by law. Offers for products and services from other Morgan Stanley companies are developed under conditions designed to safeguard your personal information.
23
Morgan Stanley Institutional Fund, Inc.
Annual Report — December 31, 2018
Privacy Notice (unaudited) (cont'd)
b. Information We Disclose to Non-affiliated Third Parties.
We do not disclose personal information that we collect about you to non-affiliated third parties except to those who provide marketing services on our behalf, to financial institutions with whom we have joint marketing agreements, and as otherwise required or permitted by law. For example, we may disclose personal information to non-affiliated third parties for servicing and processing transactions, to offer our own products and services, to protect against fraud, for institutional risk control, to respond to judicial process or to perform services on our behalf. When we share personal information with a non-affiliated third party, they are required to limit their use of personal information to the particular purpose for which it was shared and they are not allowed to share personal information with others except to fulfill that limited purpose or as may be permitted or required by law.
3. HOW DO WE PROTECT THE SECURITY AND CONFIDENTIALITY OF PERSONAL INFORMATION WE COLLECT ABOUT YOU?
We maintain physical, electronic and procedural security measures to help safeguard the personal information we collect about you. We have internal policies governing the proper handling of client information. Third parties that provide support or marketing services on our behalf may also receive personal information, and we require them to adhere to confidentiality standards with respect to such information.
4. HOW CAN YOU LIMIT THE SHARING OF CERTAIN TYPES OF PERSONAL INFORMATION WITH OTHER MORGAN STANLEY COMPANIES?
We offer you choices as to whether we share with other Morgan Stanley companies the personal information that was collected to determine your eligibility for products and services you request ("eligibility information"). Eligibility information does not include your identification information or personal information pertaining to our transactions or experiences with you. Please note that, even if you direct us not to share eligibility information with other Morgan Stanley companies ("opt-out"), we may still share personal information, including eligibility information, with those companies in circumstances excluded from the opt-out under applicable law, such as to process transactions or to service your account.
5. HOW CAN YOU LIMIT THE USE OF CERTAIN TYPES OF PERSONAL INFORMATION BY OTHER MORGAN STANLEY COMPANIES FOR MARKETING?
By following the opt-out instructions in Section 6 below, you may limit other Morgan Stanley branded companies from marketing their products or services to you based on personal information we disclose to them. This information may include, for example, your income and account history with us. Please note that, even if you choose to limit Other Morgan Stanley Companies from using personal information about you that we may share with them for marketing their products and services to you, Other Morgan Stanley Companies may use your personal information that they obtain from us to market to you in circumstances permitted by law, such as if the Other Morgan Stanley Company has its own relationship with you.
6. HOW CAN YOU SEND US AN OPT-OUT INSTRUCTION?
If you wish to limit our sharing of eligibility information about you with other Morgan Stanley companies or other Morgan Stanley companies' use of personal information for marketing purposes, as described in this notice, you may do so by:
• Calling us at (800) 548-7786
Monday–Friday between 8a.m. and 6p.m.(EST)
• Writing to us at the following address:
DST Asset Manager Solutions, Inc.
c/o Privacy Coordinator
P.O. Box 219804
Kansas City, Missouri 64121
24
Morgan Stanley Institutional Fund, Inc.
Annual Report — December 31, 2018
Privacy Notice (unaudited) (cont'd)
Your written request should include your name, address, telephone number and account number(s) to which the opt-out applies and whether you are opting out with respect to sharing of eligibility information (Section 4 above), or if information used for Marketing (Section 5 above) or both. Written opt-out requests should not be sent with any other correspondence. In order to process your request, we require that the request be provided by you directly and not through a third party.
Your opt-out preference will remain in effect with respect to this policy (as it may be amended) until you notify us otherwise. If you have a joint account, your direction for us not to share this information with other Morgan Stanley companies and for those other Morgan Stanley companies not to use your personal information for marketing will be applied to all account holders on that account. Please understand that if you limit our sharing or our affiliated companies' use of personal information, you and any joint account holder(s) may not receive information about Morgan Stanley products and services, including products or services that could help you manage your financial resources and achieve your investment objectives.
7. WHAT IF AN AFFILIATED COMPANY BECOMES A NON-AFFILIATED THIRD PARTY?
If, at any time in the future, an affiliated company becomes a non-affiliated third party, further disclosures of personal information made to the former affiliated company will be limited to those described in Section 2(b) above relating to non-affiliated third parties. If you elected under Section 6 to limit disclosures we make to affiliated companies, or use of personal information by affiliated companies, your election will not apply to use by any former affiliated company of your personal information in their possession once it becomes a non-affiliated third party.
SPECIAL NOTICE TO RESIDENTS OF VERMONT
The following section supplements our policy with respect to our individual clients who have a Vermont address and supersedes anything to the contrary in the above policy with respect to those clients only.
The state of Vermont requires financial institutions to obtain your consent prior to sharing personal information that they collect about you with affiliated companies and non-affiliated third parties other than in certain limited circumstances. Except as permitted by law, we will not share personal information we collect about you with non-affiliated third parties or other Morgan Stanley companies unless you provide us with your written consent to share such information ("opt-in").
If you wish to receive offers for investment products and services offered by or through other Morgan Stanley companies, please notify us in writing at the following address:
DST Asset Manager Solutions, Inc.
c/o Privacy Coordinator
P.O. Box 219804
Kansas City, Missouri 64121
Your authorization should include your name, address, telephone number and account number(s) to which the opt-in applies and should not be sent with any other correspondence. In order to process your authorization, we require that the authorization be provided by you directly and not through a third party.
SPECIAL NOTICE TO RESIDENTS OF CALIFORNIA
The following section supplements our policy with respect to our individual clients who have a California address and supersedes anything to the contrary in the above policy with respect to those clients only.
In response to a California law, if your account has a California home address, your personal information will not be disclosed to non-affiliated third parties except as permitted by applicable California law, and we will limit sharing such information with our affiliates to comply with California privacy laws that apply to us.
25
Morgan Stanley Institutional Fund, Inc.
Annual Report — December 31, 2018
Director and Officer Information (unaudited)
Independent Directors:
Name, Age and Address of
Independent Director | | Position(s)
Held with
Registrant | | Length of Time
Served* | | Principal Occupation(s) During Past 5 Years
and Other Relevant Professional Experience | | Number of
Portfolios in
Fund Complex
Overseen by
Independent
Director** | | Other Directorships
Held by Independent
Director*** | |
Frank L. Bowman (74)
c/o Perkins Coie LLP
Counsel to the Independent
Directors
30 Rockefeller Plaza
New York, NY 10112 | | Director | | Since
August
2006 | | President, Strategic Decisions, LLC (consulting) (since February 2009); Director or Trustee of various Morgan Stanley Funds (since August 2006); Chairperson of the Compliance and Insurance Committee (since October 2015); formerly, Chairperson of the Insurance Sub-Committee of the Compliance and Insurance Committee (2007-2015); served as President and Chief Executive Officer of the Nuclear Energy Institute (policy organization) (February 2005-November 2008); retired as Admiral, U.S. Navy after serving over 38 years on active duty including 8 years as Director of the Naval Nuclear Propulsion Program in the Department of the Navy and the U.S. Department of Energy (1996-2004); served as Chief of Naval Personnel (July 1994-September 1996) and on the Joint Staff as Director of Political Military Affairs (June 1992-July 1994); knighted as Honorary Knight Commander of the Most Excellent Order of the British Empire; awarded the Officier de l'Orde National du Mérite by the French Government; elected to the National Academy of Engineering (2009). | | | 82 | | | Director of BP p.l.c.; Director of Naval and Nuclear Technologies LLP; Director Emeritus of the Armed Services YMCA; Member of the National Security Advisory Council of the Center for U.S. Global Engagement and a member of the CNA Military Advisory Board; Trustee of Fairhaven United Methodist Church; Member of the Board of Advisors of the Dolphin Scholarship Foundation; and Director of other various non-profit organizations. | |
Kathleen A. Dennis (65)
c/o Perkins Coie LLP
Counsel to the Independent Directors
30 Rockefeller Plaza
New York, NY 10112 | | Director | | Since
August
2006 | | President, Cedarwood Associates (mutual fund and investment management consulting) (since July 2006); Chairperson of the Liquidity and Alternatives Sub-Committee of the Investment Committee (since October 2006) and Director or Trustee of various Morgan Stanley Funds (since August 2006); formerly, Senior Managing Director of Victory Capital Management (1993-2006). | | | 82 | | | Director of various non-profit organizations. | |
Nancy C. Everett (63)
c/o Perkins Coie LLP
Counsel to the Independent Directors
30 Rockefeller Plaza
New York, NY 10112 | | Director | | Since
January
2015 | | Chief Executive Officer, Virginia Commonwealth University Investment Company (since November 2015); Owner, OBIR, LLC (institutional investment management consulting) (since June 2014); formerly, Managing Director, BlackRock Inc. (February 2011-December 2013); and Chief Executive Officer, General Motors Asset Management (a/k/a Promark Global Advisors, Inc.) (June 2005-May 2010). | | | 83 | | | Formerly, Member of Virginia Commonwealth University School of Business Foundation (2005-2016); Member of Virginia Commonwealth University Board of Visitors (2013-2015); Member of Committee on Directors for Emerging Markets Growth Fund, Inc. (2007-2010); Chairperson of Performance Equity Management, LLC (2006-2010); and Chairperson, GMAM Absolute Return Strategies Fund, LLC (2006-2010). | |
26
Morgan Stanley Institutional Fund, Inc.
Annual Report — December 31, 2018
Director and Officer Information (unaudited) (cont'd)
Independent Directors: (cont'd)
Name, Age and Address of
Independent Director | | Position(s)
Held with
Registrant | | Length of Time
Served* | | Principal Occupation(s) During Past 5 Years
and Other Relevant Professional Experience | | Number of
Portfolios in
Fund Complex
Overseen by
Independent
Director** | | Other Directorships
Held by Independent
Director*** | |
Jakki L. Haussler (61)
c/o Perkins Coie LLP
Counsel to the Independent Directors
30 Rockefeller Plaza
New York, NY 10112 | | Director | | Since
January
2015 | | Chairman and Chief Executive Officer, Opus Capital Group (since January 1996); formerly, Director, Capvest Venture Fund, LP (May 2000-December 2011); Partner, Adena Ventures, LP (July 1999-December 2010); Director, The Victory Funds (February 2005-July 2008). | | | 83 | | | Director of Service Corporation International and Member, Audit Committee and Investment Committee; Director of Cincinnati Bell Inc. and Member, Audit Committee and Governance and Nominating Committee; Chairman of Northern Kentucky University Member Investment Committee; Member of Chase College of Law Transactional Law Practice Center Board of Advisors; Director of Best Transport; Director of Chase College of Law Board of Visitors; formerly, Member, University of Cincinnati Foundation Investment Committee; Member, Miami University Board of Visitors (2008-2011); Trustee of Victory Funds (2005-2008) and Chairman, Investment Committee (2007-2008) and Member, Service Provider Committee (2005-2008). | |
Dr. Manuel H. Johnson (69)
c/o Johnson Smick
International, Inc.
220 I Street, NE — Suite 200
Washington, D.C. 20002 | | Director | | Since
July
1991 | | Senior Partner, Johnson Smick International, Inc. (consulting firm); Chairperson of the Investment Committee (since October 2006) and Director or Trustee of various Morgan Stanley Funds (since July 1991); Co-Chairman and a founder of the Group of Seven Council (G7C) (international economic commission); formerly, Chairperson of the Audit Committee (July 1991-September 2006), Vice Chairman of the Board of Governors of the Federal Reserve System and Assistant Secretary of the U.S. Treasury. | | | 82 | | | Director of NVR, Inc. (home construction). | |
Joseph J. Kearns (76)
c/o Perkins Coie LLP
Counsel to the Independent Directors
30 Rockefeller Plaza
New York, NY 10112 | | Director | | Since
August
1994 | | Senior Adviser, Kearns & Associates LLC (investment consulting); Chairperson of the Audit Committee (since October 2006) and Director or Trustee of various Morgan Stanley Funds (since August 1994); formerly, Deputy Chairperson of the Audit Committee (July 2003-September 2006) and Chairperson of the Audit Committee of various Morgan Stanley Funds (since August 1994); CFO of the J. Paul Getty Trust. | | | 83 | | | Prior to August 10, 2016, Director of Electro Rent Corporation (equipment leasing); Prior to December 31, 2013, Director of The Ford Family Foundation. | |
27
Morgan Stanley Institutional Fund, Inc.
Annual Report — December 31, 2018
Director and Officer Information (unaudited) (cont'd)
Independent Directors: (cont'd)
Name, Age and Address of
Independent Director | | Position(s)
Held with
Registrant | | Length of Time
Served* | | Principal Occupation(s) During Past 5 Years
and Other Relevant Professional Experience | | Number of
Portfolios in
Fund Complex
Overseen by
Independent
Director** | | Other Directorships
Held by Independent
Director*** | |
Michael F. Klein (60)
c/o Perkins Coie LLP
Counsel to the Independent Directors
30 Rockefeller Plaza
New York, NY 10112 | | Director | | Since
August
2006 | | Managing Director, Aetos Alternatives Management, LP (since March 2000); Co-President, Aetos Alternatives Management, LP (since January 2004) and Co-Chief Executive Officer of Aetos Alternatives Management, LP (since August 2013); Chairperson of the Fixed Income Sub-Committee of the Investment Committee (since October 2006) and Director or Trustee of various Morgan Stanley Funds (since August 2006); formerly, Managing Director, Morgan Stanley & Co. Inc. and Morgan Stanley Dean Witter Investment Management and President, various Morgan Stanley Funds (June 1998-March 2000); Principal, Morgan Stanley & Co. Inc. and Morgan Stanley Dean Witter Investment Management (August 1997-December 1999). | | | 82 | | | Director of certain investment funds managed or sponsored by Aetos Alternatives Management, LP; Director of Sanitized AG and Sanitized Marketing AG (specialty chemicals). | |
Patricia Maleski (58)
c/o Perkins Coie LLP
Counsel to the Independent Directors
30 Rockefeller Plaza
New York, NY 10112 | | Director | | Since
January
2017 | | Managing Director, JPMorgan Asset Management (2004-2016); Oversight and Control Head of Fiduciary and Conflicts of Interest Program (2015-2016); Chief Control Officer-Global Asset Management (2013-2015); President, JPMorgan Funds (2010-2013); Chief Administrative Officer (2004-2013); various other positions including Treasurer and Board Liaison (since 2001). | | | 83 | | | None. | |
Michael E. Nugent (82)
522 Fifth Avenue
New York, NY 10036 | | Chair of the Board and Director | | Chair of the Boards since July 2006 and Director since July 1991 | | Chair of the Boards of various Morgan Stanley Funds (since July 2006); Chairperson of the Closed-End Fund Committee (since June 2012) Governance Committee (since January 2019) and Director or Trustee of various Morgan Stanley Funds (since July 1991); formerly, Chairperson of the Insurance Committee (until July 2006); General Partner, Triumph Capital, L.P. (private investment partnership) (1988-2013). | | | 82 | | | None. | |
W. Allen Reed (71)
c/o Perkins Coie LLP
Counsel to the Independent Directors
30 Rockefeller Plaza
New York, NY 10112 | | Director | | Since
August
2006 | | Chairperson of the Equity Sub-Committee of the Investment Committee (since October 2006) and Director or Trustee of various Morgan Stanley Funds (since August 2006); formerly, President and CEO of General Motors Asset Management; Chairman and Chief Executive Officer of the GM Trust Bank and Corporate Vice President of General Motors Corporation (August 1994-December 2005). | | | 82 | | | Director of Legg Mason, Inc.; formerly, Director of the Auburn University Foundation (2010-2015). | |
Fergus Reid (86)****
c/o Joe Pietryka, Inc.
85 Charles Colman Blvd.
Pawling, NY 12564 | | Director | | Since
June
1992 | | Chairman, Joe Pietryka, Inc.; Chairperson of the Governance Committee and Director or Trustee of various Morgan Stanley Funds (since June 1992). | | | 83 | | | Formerly, Trustee and Director of certain investment companies in the JP Morgan Fund Complex managed by JP Morgan Investment Management Inc. (1987-2012). | |
* This is the earliest date the Director began serving the Morgan Stanley Funds. Each Director serves an indefinite term, until his or her successor is elected.
** The Fund Complex includes (as of December 31, 2018) all open-end and closed-end funds (including all of their portfolios) advised by Morgan Stanley Investment Management Inc. (the "Adviser") and any funds that have an adviser that is an affiliated person of the Adviser (including, but not limited to, Morgan Stanley AIP GP LP).
*** This includes any directorships at public companies and registered investment companies held by the Director at any time during the past five years.
**** Effective date of retirement is December 31, 2018.
28
Morgan Stanley Institutional Fund, Inc.
Annual Report — December 31, 2018
Director and Officer Information (unaudited) (cont'd)
Executive Officers:
Name, Age and Address of Executive Officer | | Position(s) Held
with
Registrant | | Length of Time
Served* | | Principal Occupation(s) During Past 5 Years | |
John H. Gernon (55)
522 Fifth Avenue
New York, NY 10036 | | President and Principal Executive Officer | | Since
September
2013 | | President and Principal Executive Officer of the Equity and Fixed Income Funds and the Morgan Stanley AIP Funds (since September 2013) and the Liquidity Funds and various money market funds (since May 2014) in the Fund Complex; Managing Director of the Adviser; Head of Product (since 2006). | |
Timothy J. Knierim (59)
522 Fifth Avenue
New York, NY 10036 | | Chief Compliance Officer | | Since
December
2016 | | Managing Director of the Adviser and various entities affiliated with the Adviser; Chief Compliance Officer of various Morgan Stanley Funds and the Adviser (since December 2016) and Chief Compliance Officer of Morgan Stanley AIP GP LP (since 2014). Formerly, Managing Director and Deputy Chief Compliance Officer of the Adviser (2014-2016); and formerly, Chief Compliance Officer of Prudential Investment Management, Inc. (2007-2014). | |
Francis J. Smith (53)
522 Fifth Avenue
New York, NY 10036 | | Treasurer and Principal Financial Officer | | Treasurer since July 2003 and Principal Financial Officer since September 2002 | | Managing Director of the Adviser and various entities affiliated with the Adviser; Treasurer (since July 2003) and Principal Financial Officer of various Morgan Stanley Funds (since September 2002). | |
Mary E. Mullin (51)
522 Fifth Avenue
New York, NY 10036 | | Secretary | | Since
June
1999 | | Managing Director of the Adviser; Secretary of various Morgan Stanley Funds (since June 1999). | |
Michael J. Key (39)
522 Fifth Avenue
New York, NY 10036 | | Vice President | | Since
June
2017 | | Vice President of the Equity and Fixed Income Funds, Liquidity Funds, various money market funds and the Morgan Stanley AIP Funds in the Fund Complex (since June 2017); Executive Director of the Adviser; Head of Product Development for Equity and Fixed Income Funds (since August 2013). | |
* This is the earliest date the officer began serving the Morgan Stanley Funds. Each officer serves a one-year term, until his or her successor is elected and qualifies.
29
Morgan Stanley Institutional Fund, Inc.
Annual Report — December 31, 2018
Adviser and Administrator
Morgan Stanley Investment Management Inc.
522 Fifth Avenue
New York, New York 10036
Sub-Advisers
Morgan Stanley Investment Management Limited
25 Cabot Square, Canary Wharf
London, E14 4QA, England
Morgan Stanley Investment Management Company
23 Church Street
16-01 Capital Square, Singapore 049481
Distributor
Morgan Stanley Distribution, Inc.
522 Fifth Avenue
New York, New York 10036
Dividend Disbursing and Transfer Agent
DST Asset Manager Solutions, Inc.
2000 Crown Colony Drive
Quincy, Massachusetts 02169
Custodian
State Street Bank and Trust Company
One Lincoln Street
Boston, Massachusetts 02111
Legal Counsel
Dechert LLP
1095 Avenue of the Americas
New York, New York 10036
Counsel to the Independent Directors
Perkins Coie LLP
30 Rockefeller Plaza
New York, New York 10112
Independent Registered Public Accounting Firm
Ernst & Young LLP
200 Clarendon Street
Boston, Massachusetts 02116
Reporting to Shareholders
Each Morgan Stanley fund provides a complete schedule of portfolio holdings in its semi-annual and the annual reports within 60 days of the end of the fund's second and fourth fiscal quarters. The semi-annual and annual reports are filed electronically with the Securities and Exchange Commission ("SEC") on Form N-CSRS and Form N-CSR, respectively. Morgan Stanley also delivers the semi-annual and annual reports to fund shareholders and makes these reports available on its public website, www.morganstanley.com/im. Each Morgan Stanley fund also files a complete schedule of portfolio holdings with the SEC for the fund's first and third fiscal quarters on Form N-Q. Morgan Stanley does not deliver the reports for the first and third fiscal quarters to shareholders, nor are the reports posted to the Morgan Stanley public website. You may, however, obtain the Form N-Q filings (as well as the Form N-CSR and N-CSRS filings) by accessing the SEC's website, www.sec.gov. You can also request copies of these materials, upon payment of a duplicating fee, by electronic request at the SEC's email address (publicinfo@sec.gov).
Proxy Voting Policies and Procedures and Proxy Voting Record
You may obtain a copy of the Company's Proxy Voting Policy and Procedures and information regarding how the Company voted proxies relating to portfolio securities during the most recent twelve-month period ended June 30, without charge, upon request, by calling toll free 1 (800) 548-7786 or by visiting our website at www.morganstanley.com/im/shareholderreports. This information is also available on the SEC's website at www.sec.gov.
This report is authorized for distribution only when preceded or accompanied by a prospectus or summary prospectus of the applicable Fund of Morgan Stanley Institutional Fund, Inc., which describes in detail the Fund's investment policies, risks, fees and expenses. Please read the prospectus carefully before you invest or send money. For additional information, including information regarding the investments comprising the Fund, please visit our website at www.morganstanley.com/im/shareholderreports or call toll free 1 (800) 548-7786.
30
Printed in U.S.A.
This Report has been prepared for shareholders and may be distributed to others only if preceded or accompanied by a current prospectus.
Morgan Stanley Investment Management Inc.
522 Fifth Avenue
New York, New York 10036
© 2019 Morgan Stanley. Morgan Stanley Distribution, Inc.

IFIGCPTANN
2404137 EXP. 02.29.20

Morgan Stanley Institutional Fund, Inc.
Global Counterpoint Portfolio
Annual Report
December 31, 2018
Beginning on January 1, 2021, as permitted by regulations adopted by the Securities and Exchange Commission ("SEC"), paper copies of the Fund's Annual and Semi-Annual Reports to Shareholders ("Shareholder Reports") will no longer be sent by mail, unless you specifically request paper copies of the Shareholder Reports from the Fund or from your financial intermediary, such as a broker-dealer or a bank. Instead, the Shareholder Reports will be made available on the Fund's website, https://www.morganstanley.com/im/shareholderreports and you will be notified by mail each time a Shareholder Report is posted and provided with a website link to access the Shareholder Report. If you already elected to receive Shareholder Reports electronically, you will not be affected by this change and you need not take any action. You may elect to receive Shareholder Reports and other communications from the Fund electronically anytime by contacting your financial intermediary or, if you are a direct investor, please follow the instructions on the envelope.
Beginning on January 1, 2019, you may elect to receive all future Shareholder Reports in paper free of charge. If you invest through a financial intermediary, you can contact your financial intermediary to request that you continue to receive paper copies of your Shareholder Reports. If you invest directly with the Fund, please follow the instructions on the envelope to let the Fund know you wish to continue receiving paper copies of your Shareholder Reports. Your election to receive Shareholder Reports in paper will apply to all funds held in your account if you invest through your financial intermediary or all funds held with the fund complex if you invest directly with a fund.

Morgan Stanley Institutional Fund, Inc.
Annual Report — December 31, 2018
Shareholders' Letter | | | 2 | | |
Expense Example | | | 3 | | |
Investment Overview | | | 4 | | |
Portfolio of Investments | | | 6 | | |
Statement of Assets and Liabilities | | | 10 | | |
Statement of Operations | | | 11 | | |
Statement of Changes in Net Assets | | | 12 | | |
Financial Highlights | | | 13 | | |
Notes to Financial Statements | | | 17 | | |
Report of Independent Registered Public Accounting Firm | | | 26 | | |
Federal Tax Notice | | | 27 | | |
Privacy Notice | | | 28 | | |
Director and Officer Information | | | 31 | | |
This report is authorized for distribution only when preceded or accompanied by a prospectus or summary prospectus of the applicable Fund of Morgan Stanley Institutional Fund, Inc. To receive a prospectus and/or statement of additional information (SAI), which contains more complete information such as investment objectives, charges, expenses, policies for voting proxies, risk considerations and describes in detail each of the Fund's investment policies to the prospective investor, please call toll free 1 (800) 548-7786. Please read the prospectuses carefully before you invest or send money.
Additionally, you can access information about the Fund, including performance, characteristics and investment team commentary, through Morgan Stanley Investment Management's website: www.morganstanley.com/im/shareholderreports.
Market forecasts provided in this report may not necessarily come to pass. There is no guarantee that any sectors mentioned will continue to perform as discussed herein or that securities in such sectors will be held by the Fund in the future. There is no assurance that a fund will achieve its investment objective. Funds are subject to market risk, which is the possibility that market values of securities owned by the Fund will decline and, therefore, the value of the Fund's shares may be less than what you paid for them. Accordingly, you can lose money investing in this Fund. Please see the prospectus for more complete information on investment risks.
1
Morgan Stanley Institutional Fund, Inc.
Annual Report — December 31, 2018
Shareholders' Letter (unaudited)
Dear Shareholders,
We are pleased to provide this Annual report, in which you will learn how your investment in Global Counterpoint Portfolio (the "Fund") performed during the period beginning June 29, 2018 (when the Fund commenced operations) and ended December 31, 2018.
Morgan Stanley Investment Management is a client-centric, investor-led organization. Our global presence, intellectual capital, and breadth of products and services enable us to partner with investors to meet the evolving challenges of today's financial markets. We aim to deliver superior investment service and to empower our clients to make the informed decisions that help them reach their investment goals.
As always, we thank you for selecting Morgan Stanley Investment Management, and look forward to working with you in the months and years ahead.
Sincerely,

John H. Gernon
President and Principal Executive Officer
January 2019
2
Morgan Stanley Institutional Fund, Inc.
Annual Report — December 31, 2018
Expense Example (unaudited)
Global Counterpoint Portfolio
As a shareholder of the Fund, you incur two types of costs: (1) transactional costs; and (2) ongoing costs, which may include advisory fees, administration fees, distribution and shareholder services fees and other Fund expenses. This example is intended to help you understand your ongoing costs (in dollars) of investing in the Fund and to compare these costs with the ongoing costs of investing in other mutual funds.
This example is based on an investment of $1,000 invested at the beginning of the six-month period ended December 31, 2018 and held for the entire six-month period.
Actual Expenses
The table below provides information about actual account values and actual expenses. You may use the information in this table, together with the amount you invested, to estimate the expenses that you paid over the period. Simply divide your account value by $1,000 (for example, an $8,600 account value divided by $1,000 = 8.6), then multiply the result by the number in the table under the heading entitled "Actual Expenses Paid During Period" to estimate the expenses you paid on your account during this period.
Hypothetical Example for Comparison Purposes
The table below provides information about hypothetical account values and hypothetical expenses based on the Fund's actual expense ratio and an assumed rate of return of 5% per year before expenses, which is not the Fund's actual return. The hypothetical account values and expenses may not be used to estimate the actual ending account balance or expenses you paid for the period. You may use this information to compare the ongoing costs of investing in the Fund and other funds. To do so, compare this 5% hypothetical example with the 5% hypothetical examples that appear in the shareholder reports of the other funds.
Please note that the expenses shown in the table are meant to highlight your ongoing costs only and do not reflect any transactional costs, such as sales charges (loads). Therefore, the information for each class in the table is useful in comparing ongoing costs only, and will not help you determine the relative total costs of owning different funds. In addition, if these transactional costs were included, your costs would have been higher.
| | | Beginning
Account
Value
7/1/18 | | Actual Ending
Account
Value
12/31/18 | | Hypothetical
Ending Account
Value | | Actual
Expenses
Paid
During
Period* | | Hypothetical
Expenses Paid
During Period* | | Net
Expense
Ratio
During
Period** | |
Global Counterpoint Portfolio Class I | | $ | 1,000.00 | | | $ | 856.40 | | | $ | 1,020.01 | | | $ | 4.82 | | | $ | 5.24 | | | | 1.03 | % | |
Global Counterpoint Portfolio Class A | | | 1,000.00 | | | | 855.60 | | | | 1,018.20 | | | | 6.50 | | | | 7.07 | | | | 1.39 | | |
Global Counterpoint Portfolio Class C | | | 1,000.00 | | | | 852.00 | | | | 1,014.42 | | | | 9.99 | | | | 10.87 | | | | 2.14 | | |
Global Counterpoint Portfolio Class IS | | | 1,000.00 | | | | 856.60 | | | | 1,020.21 | | | | 4.63 | | | | 5.04 | | | | 0.99 | | |
* Expenses are calculated using each Fund Class' annualized net expense ratio (as disclosed), multiplied by the average account value over the period and multiplied by 184/365 (to reflect the most recent one-half year period).
** Annualized.
3
Morgan Stanley Institutional Fund, Inc.
Annual Report — December 31, 2018
Investment Overview (unaudited)
Global Counterpoint Portfolio
The Fund seeks long-term capital appreciation.
Performance
For the since inception period from June 29, 2018 through December 31, 2018, the Fund's Class I shares had a total return based on net asset value and reinvestment of distributions per share of –14.36%, net of fees. The Fund's Class I shares underperformed the Fund's benchmark, the MSCI All Country World Net Index (the "Index"), which returned –9.02%.
Factors Affecting Performance
• As of the end of the reporting period, the Fund had less than one year of performance history. Such a short time frame would not provide a meaningful performance analysis as short-term returns may not be indicative of the Fund's long-term performance potential.
Management Strategies
• We seek high-quality established and emerging companies located throughout the world whose market value can increase significantly for underlying fundamental reasons. We focus on each business's long-term prospects rather than short-term events, with our stock selection informed by rigorous fundamental analysis. The portfolio managers will collaborate to opportunistically allocate and rebalance the Fund assets across underlying investment strategies.
4
Morgan Stanley Institutional Fund, Inc.
Annual Report — December 31, 2018
Investment Overview (unaudited) (cont'd)
Global Counterpoint Portfolio

* Minimum Investment for Class I shares
** Commenced Operations on June 29, 2018.
In accordance with SEC regulations, the Fund's performance shown assumes that all recurring fees (including management fees) were deducted and all dividends and distributions were reinvested. The performance of Class A, C and IS shares will vary from the performance of Class I shares and will be negatively impacted by additional fees assessed to those classes (if applicable).
Performance Compared to the MSCI All Country World Net Index(1) and the Lipper Global
Multi-Cap Growth Funds Index(2)
| | | Period Ended December 31, 2018
Total Returns(3) | |
| | | One
Year | | Five
Years | | Ten
Years | | Since
Inception(5) | |
Fund — Class I Shares
w/o sales charges(4) | | | — | | | | — | | | | — | | | | –14.36 | % | |
Fund — Class A Shares
w/o sales charges(4) | | | — | | | | — | | | | — | | | | –14.44 | | |
Fund — Class A Shares with
maximum 5.25% sales charges(4) | | | — | | | | — | | | | — | | | | –18.90 | | |
Fund — Class C Shares
w/o sales charges(4) | | | — | | | | — | | | | — | | | | –14.80 | | |
Fund — Class C Shares with
maximum 1.00% deferred
sales charges(4) | | | — | | | | — | | | | — | | | | –15.65 | | |
Fund — Class IS Shares
w/o sales charges(4) | | | — | | | | — | | | | — | | | | –14.34 | | |
MSCI All Country World Net Index | | | — | | | | — | | | | — | | | | –9.02 | | |
Lipper Global Multi-Cap
Growth Funds Index | | | — | | | | — | | | | — | | | | –11.50 | | |
Performance data quoted represents past performance, which is no guarantee of future results, and current performance may be lower or higher than the figures shown. Performance assumes that all dividends and distributions, if any, were reinvested. For the most recent month-end performance figures, please visit www.morganstanley.com/im/shareholderreports. Investment return and principal value will fluctuate so that Fund shares, when redeemed, may be worth more or less than their original cost. Returns for periods less than one year are not annualized. Total returns do not reflect the deduction of taxes that a shareholder would pay on Fund distributions or the redemption of Fund shares. Performance of share classes will vary due to difference in sales charges and expenses.
(1) The MSCI All Country World Net Index is a free float-adjusted market capitalization weighted index designed to measure the equity market performance of developed and emerging markets. The term "free float" represents the portion of shares outstanding that are deemed to be available for purchase in the public equity markets by investors. The performance of the Index is listed in US dollars and assumes reinvestment of net dividends. Net total return indices reinvest dividends after the deduction of withholding taxes, using (for international indices) a tax rate applicable to non-resident institutional investors who do not benefit from double taxation treaties. The Index is unmanaged and its returns do not include any sales charges or fees. Such costs would lower performance. It is not possible to invest directly in an index.
(2) The Lipper Global Multi-Cap Growth Funds Index is an equally weighted performance index of the largest qualifying funds (based on net assets) in the Lipper Global Multi-Cap Growth Funds classification. The Index, which is adjusted for capital gains distributions and income dividends, is unmanaged and should not be considered an investment. There are currently 30 funds represented in this Index. As of the date of this report, the Fund is in the Lipper Global Multi-Cap Growth Funds classification."
(3) Total returns for the Fund reflect fees waived and expenses reimbursed, if applicable, by Morgan Stanley Investment Management Inc. (the "Adviser"). Without such waivers and reimbursements, total returns would have been lower.
(4) Commenced operations on June 29, 2018.
(5) For comparative purposes, average annual since inception returns listed for the Indexes refer to the inception date of the Fund, not the inception of the Index.
5
Morgan Stanley Institutional Fund, Inc.
Annual Report — December 31, 2018
Portfolio of Investments
Global Counterpoint Portfolio
| | | Shares | | Value
(000) | |
Common Stocks (97.4%) | |
Argentina (0.3%) | |
Globant SA (a) | | | 319 | | | $ | 18 | | |
Australia (0.5%) | |
Bellamy's Australia Ltd. (a) | | | 338 | | | | 2 | | |
Brookfield Infrastructure Partners LP | | | 600 | | | | 20 | | |
Cochlear Ltd. | | | 74 | | | | 9 | | |
| | | | 31 | | |
Belgium (0.4%) | |
Anheuser-Busch InBev SA N.V. | | | 350 | | | | 23 | | |
Brazil (0.4%) | |
B3 SA - Brasil Bolsa Balcao | | | 1,510 | | | | 10 | | |
Magazine Luiza SA | | | 228 | | | | 11 | | |
Smiles Fidelidade SA | | | 299 | | | | 3 | | |
| | | | 24 | | |
Canada (3.4%) | |
Brookfield Asset Management, Inc., Class A | | | 401 | | | | 15 | | |
Canadian National Railway Co. | | | 86 | | | | 6 | | |
Canadian National Railway Co. | | | 1,076 | | | | 80 | | |
Colliers International Group, Inc. | | | 87 | | | | 5 | | |
Constellation Software, Inc. | | | 91 | | | | 58 | | |
Shopify, Inc., Class A (a) | | | 213 | | | | 30 | | |
| | | | 194 | | |
China (8.0%) | |
Alibaba Group Holding Ltd. ADR (a) | | | 196 | | | | 27 | | |
China Resources Beer Holdings Co., Ltd. (b) | | | 10,000 | | | | 35 | | |
Ctrip.com International Ltd. ADR (a) | | | 1,006 | | | | 27 | | |
Foshan Haitian Flavouring & Food Co., Ltd., Class A | | | 6,700 | | | | 67 | | |
Haidilao International Holding Ltd. (a)(c) | | | 6,000 | | | | 13 | | |
Hangzhou Tigermed Consulting Co. Ltd., Class A | | | 800 | | | | 5 | | |
Huazhu Group Ltd. ADR | | | 842 | | | | 24 | | |
Inner Mongolia Yili Industrial Group Co., Ltd., Class A | | | 3,000 | | | | 10 | | |
Jiangsu Hengrui Medicine Co., Ltd., Class A | | | 1,600 | | | | 12 | | |
Jiangsu Yanghe Brewery Joint-Stock Co., Ltd., Class A | | | 2,600 | | | | 36 | | |
Kweichow Moutai Co., Ltd., Class A | | | 200 | | | | 17 | | |
NIO, Inc. ADR (a) | | | 823 | | | | 5 | | |
Shenzhou International Group Holdings Ltd. (b) | | | 2,000 | | | | 23 | | |
Suofeiya Home Collection Co., Ltd., Class A | | | 1,700 | | | | 4 | | |
TAL Education Group ADR (a) | | | 4,808 | | | | 128 | | |
Tencent Holdings Ltd. (b) | | | 700 | | | | 28 | | |
| | | | 461 | | |
Denmark (1.9%) | |
Chr Hansen Holding A/S | | | 265 | | | | 24 | | |
DSV A/S | | | 1,311 | | | | 86 | | |
| | | | 110 | | |
France (5.6%) | |
Christian Dior SE | | | 211 | | | | 80 | | |
Danone SA | | | 126 | | | | 9 | | |
Getlink SE | | | 2,134 | | | | 29 | | |
Hermes International | | | 233 | | | | 129 | | |
LVMH Moet Hennessy Louis Vuitton SE | | | 75 | | | | 22 | | |
| | | Shares | | Value
(000) | |
Pernod Ricard SA | | | 170 | | | $ | 28 | | |
Remy Cointreau SA | | | 131 | | | | 15 | | |
Ubisoft Entertainment SA (a) | | | 139 | | | | 11 | | |
| | | | 323 | | |
Germany (0.4%) | |
Adidas AG | | | 21 | | | | 4 | | |
Deutsche Boerse AG | | | 19 | | | | 2 | | |
GRENKE AG | | | 24 | | | | 2 | | |
Nemetschek SE | | | 16 | | | | 2 | | |
Rational AG | | | 11 | | | | 6 | | |
Zalando SE (a) | | | 333 | | | | 9 | | |
| | | | 25 | | |
Hong Kong (1.3%) | |
AIA Group Ltd. | | | 3,800 | | | | 31 | | |
Haidilao International Holding Ltd. (a)(c) | | | 11,000 | | | | 24 | | |
Meituan Dianping, Class B (a) | | | 3,100 | | | | 18 | | |
| | | | 73 | | |
India (4.3%) | |
HDFC Bank Ltd. ADR | | | 2,364 | | | | 245 | | |
Israel (0.1%) | |
Wix.com Ltd. (a) | | | 48 | | | | 4 | | |
Italy (2.0%) | |
Brunello Cucinelli SpA | | | 434 | | | | 15 | | |
Moncler SpA | | | 2,975 | | | | 99 | | |
| | | | 114 | | |
Japan (1.5%) | |
Calbee, Inc. | | | 1,300 | | | | 41 | | |
Nihon M&A Center, Inc. | | | 600 | | | | 12 | | |
Pigeon Corp. | | | 700 | | | | 30 | | |
Yume No Machi Souzou Iinkai Co. Ltd. | | | 200 | | | | 2 | | |
| | | | 85 | | |
Korea, Republic of (0.7%) | |
NAVER Corp. | | | 367 | | | | 40 | | |
Mexico (0.6%) | |
Grupo Aeroportuario del Sureste SAB de CV, Class B | | | 2,210 | | | | 33 | | |
Netherlands (0.2%) | |
Adyen N.V. (a) | | | 18 | | | | 10 | | |
New Zealand (0.4%) | |
Ryman Healthcare Ltd. | | | 651 | | | | 5 | | |
Xero Ltd. (a) | | | 714 | | | | 21 | | |
| | | | 26 | | |
Philippines (0.1%) | |
Jollibee Foods Corp. | | | 1,390 | | | | 8 | | |
South Africa (0.1%) | |
Naspers Ltd., Class N | | | 17 | | | | 3 | | |
PSG Group Ltd. | | | 118 | | | | 2 | | |
| | | | 5 | | |
Spain (0.4%) | |
Aena SME SA | | | 166 | | | | 26 | | |
The accompanying notes are an integral part of the financial statements.
6
Morgan Stanley Institutional Fund, Inc.
Annual Report — December 31, 2018
Portfolio of Investments (cont'd)
Global Counterpoint Portfolio
| | | Shares | | Value
(000) | |
Sweden (0.5%) | |
AddLife AB, Class B | | | 84 | | | $ | 2 | | |
Cellavision AB | | | 92 | | | | 2 | | |
Vitrolife AB | | | 1,502 | | | | 25 | | |
Vostok New Ventures Ltd. (a) | | | 181 | | | | 1 | | |
| | | | 30 | | |
Switzerland (1.2%) | |
Geberit AG (Registered) | | | 71 | | | | 28 | | |
Kuehne & Nagel International AG (Registered) | | | 108 | | | | 14 | | |
Schindler Holding AG | | | 126 | | | | 25 | | |
| | | | 67 | | |
Taiwan (0.8%) | |
Nien Made Enterprise Co., Ltd. | | | 1,000 | | | | 7 | | |
Taiwan Semiconductor Manufacturing Co., Ltd. | | | 3,000 | | | | 22 | | |
Taiwan Semiconductor Manufacturing Co., Ltd. ADR | | | 426 | | | | 16 | | |
| | | | 45 | | |
Turkey (0.0%) | |
Ulker Biskuvi Sanayi AS | | | 615 | | | | 2 | | |
United Kingdom (5.0%) | |
ASA International Group PLC (a) | | | 697 | | | | 4 | | |
Ashtead Group PLC | | | 69 | | | | 1 | | |
Atlassian Corp., PLC, Class A (a) | | | 66 | | | | 6 | | |
BBA Aviation PLC | | | 8,460 | | | | 24 | | |
Diageo PLC | | | 965 | | | | 34 | | |
Fevertree Drinks PLC | | | 1,345 | | | | 37 | | |
Halma PLC | | | 100 | | | | 2 | | |
Just Eat PLC (a) | | | 729 | | | | 6 | | |
Melrose Industries PLC | | | 1,634 | | | | 3 | | |
Metro Bank PLC (a) | | | 655 | | | | 14 | | |
Reckitt Benckiser Group PLC | | | 788 | | | | 60 | | |
Rentokil Initial PLC | | | 12,580 | | | | 54 | | |
Rightmove PLC | | | 7,059 | | | | 39 | | |
Victoria PLC (a) | | | 964 | | | | 6 | | |
| | | | 290 | | |
United States (57.3%) | |
Activision Blizzard, Inc. | | | 286 | | | | 13 | | |
Adobe, Inc. (a) | | | 277 | | | | 63 | | |
Agios Pharmaceuticals, Inc. (a) | | | 14 | | | | 1 | | |
Align Technology, Inc. (a) | | | 4 | | | | 1 | | |
Alnylam Pharmaceuticals, Inc. (a) | | | 87 | | | | 6 | | |
Alphabet, Inc., Class C (a) | | | 59 | | | | 61 | | |
Amazon.com, Inc. (a) | | | 173 | | | | 260 | | |
Angi Homeservices, Inc., Class A (a) | | | 1,174 | | | | 19 | | |
ANSYS, Inc. (a) | | | 10 | | | | 1 | | |
AO Smith Corp. | | | 14 | | | | 1 | | |
Appfolio, Inc., Class A (a) | | | 81 | | | | 5 | | |
athenahealth, Inc. (a) | | | 505 | | | | 67 | | |
Autodesk, Inc. (a) | | | 36 | | | | 5 | | |
Avalara, Inc. (a) | | | 161 | | | | 5 | | |
Bellicum Pharmaceuticals, Inc. (a) | | | 97 | | | | — | @ | |
Bluebird Bio, Inc. (a) | | | 13 | | | | 1 | | |
Booking Holdings, Inc. (a) | | | 52 | | | | 90 | | |
| | | Shares | | Value
(000) | |
Broadridge Financial Solutions, Inc. | | | 21 | | | $ | 2 | | |
BWX Technologies, Inc. | | | 358 | | | | 14 | | |
Carvana Co. (a) | | | 377 | | | | 12 | | |
CBIZ, Inc. (a) | | | 76 | | | | 1 | | |
CEVA, Inc. (a) | | | 191 | | | | 4 | | |
Chegg, Inc. (a) | | | 158 | | | | 4 | | |
Cimpress N.V. (a) | | | 21 | | | | 2 | | |
Cintas Corp. | | | 94 | | | | 16 | | |
Copart, Inc. (a) | | | 824 | | | | 39 | | |
Coupa Software, Inc. (a) | | | 1,165 | | | | 73 | | |
Danaher Corp. | | | 47 | | | | 5 | | |
DexCom, Inc. (a) | | | 407 | | | | 49 | | |
Eagle Materials, Inc. | | | 214 | | | | 13 | | |
Ecolab, Inc. | | | 228 | | | | 34 | | |
Editas Medicine, Inc. (a) | | | 147 | | | | 3 | | |
Elanco Animal Health, Inc. (a) | | | 1,202 | | | | 38 | | |
Elastic N.V. (a) | | | 375 | | | | 27 | | |
Ellie Mae, Inc. (a) | | | 70 | | | | 4 | | |
EPAM Systems, Inc. (a) | | | 701 | | | | 81 | | |
Etsy, Inc. (a) | | | 170 | | | | 8 | | |
Eventbrite, Inc., Class A (a) | | | 106 | | | | 3 | | |
Exact Sciences Corp. (a) | | | 48 | | | | 3 | | |
Facebook, Inc., Class A (a) | | | 516 | | | | 68 | | |
Farfetch Ltd., Class A (a) | | | 2,099 | | | | 37 | | |
Fortive Corp. | | | 65 | | | | 4 | | |
GrubHub, Inc. (a) | | | 503 | | | | 39 | | |
GTT Communications, Inc. (a) | | | 522 | | | | 12 | | |
Guardant Health, Inc. (a) | | | 670 | | | | 25 | | |
Guidewire Software, Inc. (a) | | | 58 | | | | 5 | | |
HealthEquity, Inc. (a) | | | 1,066 | | | | 64 | | |
HEICO Corp. | | | 90 | | | | 7 | | |
HEICO Corp., Class A | | | 451 | | | | 28 | | |
Hershey Co. (The) | | | 143 | | | | 15 | | |
IAC/InterActiveCorp (a) | | | 161 | | | | 29 | | |
Illumina, Inc. (a) | | | 171 | | | | 51 | | |
Inspire Medical Systems, Inc. (a) | | | 177 | | | | 7 | | |
Installed Building Products, Inc. (a) | | | 52 | | | | 2 | | |
Intellia Therapeutics, Inc. (a) | | | 168 | | | | 2 | | |
Intersect ENT, Inc. (a) | | | 105 | | | | 3 | | |
Intrexon Corp. (a) | | | 219 | | | | 1 | | |
Intuit, Inc. | | | 34 | | | | 7 | | |
Intuitive Surgical, Inc. (a) | | | 193 | | | | 92 | | |
Invitae Corp. (a) | | | 66 | | | | 1 | | |
LendingTree, Inc. (a) | | | 35 | | | | 8 | | |
Linde PLC | | | 207 | | | | 32 | | |
LivaNova PLC (a) | | | 120 | | | | 11 | | |
LiveRamp Holdings, Inc. (a) | | | 305 | | | | 12 | | |
MakeMyTrip Ltd. (a) | | | 610 | | | | 15 | | |
Martin Marietta Materials, Inc. | | | 302 | | | | 52 | | |
Mastercard, Inc., Class A | | | 341 | | | | 64 | | |
Match Group, Inc. | | | 126 | | | | 5 | | |
MercadoLibre, Inc. | | | 249 | | | | 73 | | |
Moderna, Inc. (a) | | | 174 | | | | 3 | | |
The accompanying notes are an integral part of the financial statements.
7
Morgan Stanley Institutional Fund, Inc.
Annual Report — December 31, 2018
Portfolio of Investments (cont'd)
Global Counterpoint Portfolio
| | | Shares | | Value
(000) | |
United States (cont'd) | |
Mohawk Industries, Inc. (a) | | | 121 | | | $ | 14 | | |
MongoDB, Inc. (a) | | | 898 | | | | 75 | | |
MSCI, Inc. | | | 292 | | | | 43 | | |
NanoString Technologies, Inc. (a) | | | 222 | | | | 3 | | |
Nektar Therapeutics (a) | | | 27 | | | | 1 | | |
Netflix, Inc. (a) | | | 18 | | | | 5 | | |
NVIDIA Corp. | | | 12 | | | | 2 | | |
Okta, Inc. (a) | | | 596 | | | | 38 | | |
Overstock.com, Inc. (a) | | | 862 | | | | 12 | | |
Penumbra, Inc. (a) | | | 235 | | | | 29 | | |
Quotient Ltd. (a) | | | 247 | | | | 2 | | |
Redfin Corp. (a) | | | 271 | | | | 4 | | |
Rollins, Inc. | | | 978 | | | | 35 | | |
S&P Global, Inc. | | | 224 | | �� | | 38 | | |
Sabre Corp. | | | 71 | | | | 2 | | |
salesforce.com, Inc. (a) | | | 734 | | | | 101 | | |
Service Corp. International/US | | | 389 | | | | 16 | | |
ServiceNow, Inc. (a) | | | 593 | | | | 106 | | |
Shake Shack, Inc., Class A (a) | | | 88 | | | | 4 | | |
Sherwin-Williams Co. (The) | | | 37 | | | | 15 | | |
Smartsheet, Inc., Class A (a) | | | 187 | | | | 5 | | |
Splunk, Inc. (a) | | | 46 | | | | 5 | | |
Spotify Technology SA (a) | | | 350 | | | | 40 | | |
Square, Inc., Class A (a) | | | 232 | | | | 13 | | |
SS&C Technologies Holdings, Inc. | | | 81 | | | | 4 | | |
Stamps.com, Inc. (a) | | | 82 | | | | 13 | | |
Starbucks Corp. | | | 1,326 | | | | 85 | | |
SVMK, Inc. (a) | | | 267 | | | | 3 | | |
Take-Two Interactive Software, Inc. (a) | | | 81 | | | | 8 | | |
TripAdvisor, Inc. (a) | | | 78 | | | | 4 | | |
Trupanion, Inc. (a) | | | 175 | | | | 4 | | |
Twilio, Inc., Class A (a) | | | 363 | | | | 32 | | |
Twitter, Inc. (a) | | | 3,358 | | | | 97 | | |
Tyler Technologies, Inc. (a) | | | 19 | | | | 4 | | |
Ubiquiti Networks, Inc. | | | 8 | | | | 1 | | |
Ultimate Software Group, Inc. (The) (a) | | | 18 | | | | 4 | | |
Union Pacific Corp. | | | 639 | | | | 88 | | |
United Technologies Corp. | | | 238 | | | | 25 | | |
UnitedHealth Group, Inc. | | | 253 | | | | 63 | | |
Upwork, Inc. (a) | | | 285 | | | | 5 | | |
Veeva Systems, Inc., Class A (a) | | | 884 | | | | 79 | | |
Visa, Inc., Class A | | | 325 | | | | 43 | | |
Vulcan Materials Co. | | | 291 | | | | 29 | | |
WageWorks, Inc. (a) | | | 245 | | | | 7 | | |
| | | Shares | | Value
(000) | |
Walt Disney Co. (The) | | | 381 | | | $ | 42 | | |
Waste Management, Inc. | | | 358 | | | | 32 | | |
Watsco, Inc. | | | 203 | | | | 28 | | |
Wayfair, Inc., Class A (a) | | | 46 | | | | 4 | | |
Workday, Inc., Class A (a) | | | 655 | | | | 105 | | |
Workiva, Inc. (a) | | | 134 | | | | 5 | | |
XPO Logistics, Inc. (a) | | | 54 | | | | 3 | | |
Yelp, Inc. (a) | | | 241 | | | | 8 | | |
Zendesk, Inc. (a) | | | 89 | | | | 5 | | |
Zillow Group, Inc., Class A (a) | | | 259 | | | | 8 | | |
Zillow Group, Inc., Class C (a) | | | 184 | | | | 6 | | |
Zoetis, Inc. | | | 443 | | | | 38 | | |
| | | | 3,298 | | |
Total Common Stocks (Cost $6,143) | | | 5,610 | | |
Short-Term Investment (3.7%) | |
Investment Company (3.7%) | |
Morgan Stanley Institutional Liquidity
Funds — Treasury Securities Portfolio —
Institutional Class (See Note G)
(Cost $212) | | | 212,250 | | | | 212 | | |
Total Investments Excluding Purchased
Options (101.1%) (Cost $6,355) | | | 5,822 | | |
Total Purchased Options Outstanding (0.1%)
(Cost $13) | | | 5 | | |
Total Investments (101.2%) (Cost $6,368) (d)(e) | | | 5,827 | | |
Liabilities in Excess of Other Assets (–1.2%) | | | (70 | ) | |
Net Assets (100.0%) | | $ | 5,757 | | |
Country assignments and aggregations are based generally on third party vendor classifications and information, and may be different from the assignments and aggregations under the policies set forth in the Fund's prospectus and/or statement of additional information relating to geographic classifications.
@ Amount is less than $500.
(a) Non-income producing security.
(b) Security trades on the Hong Kong exchange.
(c) 144A security — Certain conditions for public sale may exist. Unless otherwise noted, these securities are deemed to be liquid.
(d) The approximate fair value and percentage of net assets, $1,565,000 and 27.2%, respectively, represent the securities that have been fair valued under the fair valuation policy for international investments as described in Note A-1 within the Notes to the Financial Statements.
(e) At December 31, 2018, the aggregate cost for federal income tax purposes is approximately $6,473,000. The aggregate gross unrealized appreciation is approximately $120,000 and the aggregate gross unrealized depreciation is approximately $766,000, resulting in net unrealized depreciation of approximately $646,000.
ADR American Depositary Receipt.
The accompanying notes are an integral part of the financial statements.
8
Morgan Stanley Institutional Fund, Inc.
Annual Report — December 31, 2018
Portfolio of Investments (cont'd)
Global Counterpoint Portfolio
Call Options Purchased:
The Fund had the following call options purchased open at December 31,2018:
Counterparty | | Description | | Strike
Price | | Expiration
Date | | Number of
Contracts | | Notional
Amount
(000) | | Value
(000) | | Premiums
Paid
(000) | | Unrealized
Depreciation
(000) | |
Royal Bank of Scotland | | USD/CNH | | CNH | 8.03 | | | Oct-19 | | | 1,157,619 | | | | 1,158 | | | $ | 2 | | | $ | 6 | | | $ | (4 | ) | |
Royal Bank of Scotland | | USD/CNH | | CNH | 7.57 | | | Jul-19 | | | 1,647,300 | | | | 1,647 | | | | 3 | | | | 7 | | | | (4 | ) | |
| | | | | | | | | | | | | $ | 5 | | | $ | 13 | | | $ | (8 | ) | |
CNH — Chinese Yuan Renminbi Offshore
USD — United States Dollar
Portfolio Composition
Classification | | Percentage of
Total Investments | |
Other* | | | 56.9 | % | |
Software | | | 11.3 | | |
Internet & Direct Marketing Retail | | | 11.0 | | |
Interactive Media & Services | | | 7.2 | | |
Information Technology Services | | | 7.2 | | |
Textiles, Apparel & Luxury Goods | | | 6.4 | | |
Total Investments | | | 100.0 | % | |
* Industries and/or investment types representing less than 5% of total investments.
The accompanying notes are an integral part of the financial statements.
9
Morgan Stanley Institutional Fund, Inc.
Annual Report — December 31, 2018
Global Counterpoint Portfolio
Statement of Assets and Liabilities | | December 31, 2018
(000) | |
Assets: | |
Investments in Securities of Unaffiliated Issuers, at Value (Cost $6,156) | | $ | 5,615 | | |
Investment in Security of Affiliated Issuer, at Value (Cost $212) | | | 212 | | |
Total Investments in Securities, at Value (Cost $6,368) | | | 5,827 | | |
Foreign Currency, at Value (Cost $4) | | | 4 | | |
Cash | | | — | @ | |
Due from Adviser | | | 94 | | |
Prepaid Offering Costs | | | 81 | | |
Receivable for Investments Sold | | | 61 | | |
Dividends Receivable | | | 1 | | |
Tax Reclaim Receivable | | | — | @ | |
Receivable from Affiliate | | | — | @ | |
Other Assets | | | 3 | | |
Total Assets | | | 6,071 | | |
Liabilities: | |
Payable for Offering Costs | | | 163 | | |
Payable for Investments Purchased | | | 67 | | |
Payable for Professional Fees | | | 65 | | |
Payable for Custodian Fees | | | 9 | | |
Payable for Transfer Agency Fees — Class I | | | 1 | | |
Payable for Transfer Agency Fees — Class A | | | 1 | | |
Payable for Transfer Agency Fees — Class C | | | 1 | | |
Payable for Transfer Agency Fees — Class IS | | | 1 | | |
Payable for Shareholder Services Fees — Class A | | | — | @ | |
Payable for Distribution and Shareholder Services Fees — Class C | | | — | @ | |
Payable for Administration Fees | | | — | @ | |
Other Liabilities | | | 6 | | |
Total Liabilities | | | 314 | | |
Net Assets | | $ | 5,757 | | |
Net Assets Consist of: | |
Paid-in-Capital | | $ | 6,749 | | |
| Total Accumulated Loss | | | (992 | ) | |
Net Assets | | $ | 5,757 | | |
CLASS I: | |
Net Assets | | $ | 5,733 | | |
| Shares Outstanding $0.001 par value shares of beneficial interest (unlimited shares authorized) (not in 000's) | | | 677,195 | | |
Net Asset Value, Offering and Redemption Price Per Share | | $ | 8.46 | | |
CLASS A: | |
Net Assets | | $ | 8 | | |
| Shares Outstanding $0.001 par value shares of beneficial interest (unlimited shares authorized) (not in 000's) | | | 1,000 | | |
Net Asset Value, Redemption Price Per Share | | $ | 8.47 | | |
Maximum Sales Load | | | 5.25 | % | |
Maximum Sales Charge | | $ | 0.47 | | |
Maximum Offering Price Per Share | | $ | 8.94 | | |
CLASS C: | |
Net Assets | | $ | 8 | | |
| Shares Outstanding $0.001 par value shares of beneficial interest (unlimited shares authorized) (not in 000's) | | | 1,000 | | |
Net Asset Value, Offering and Redemption Price Per Share | | $ | 8.47 | | |
CLASS IS: | |
Net Assets | | $ | 8 | | |
| Shares Outstanding $0.001 par value shares of beneficial interest (unlimited shares authorized) (not in 000's) | | | 1,000 | | |
Net Asset Value, Offering and Redemption Price Per Share | | $ | 8.46 | | |
@ Amount is less than $500.
The accompanying notes are an integral part of the financial statements.
10
Morgan Stanley Institutional Fund, Inc.
Annual Report — December 31, 2018
Global Counterpoint Portfolio
Statement of Operations | | Period from
June 29, 2018^ to
December 31, 2018
(000) | |
Investment Income: | |
Dividends from Securities of Unaffiliated Issuers (Net of $1 of Foreign Taxes Withheld) | | $ | 12 | | |
Non-Cash Dividends from Securities of Unaffiliated Issuers | | | 1 | | |
Dividends from Security of Affiliated Issuer (Note G) | | | 3 | | |
Total Investment Income | | | 16 | | |
Expenses: | |
Offering Costs | | | 85 | | |
Professional Fees | | | 79 | | |
Advisory Fees (Note B) | | | 27 | | |
Custodian Fees (Note F) | | | 18 | | |
Shareholder Reporting Fees | | | 10 | | |
Transfer Agency Fees — Class I (Note E) | | | 1 | | |
Transfer Agency Fees — Class A (Note E) | | | 1 | | |
Transfer Agency Fees — Class C (Note E) | | | 1 | | |
Transfer Agency Fees — Class IS (Note E) | | | 1 | | |
Pricing Fees | | | 4 | | |
Administration Fees (Note C) | | | 3 | | |
Shareholder Services Fees — Class A (Note D) | | | — | @ | |
Distribution and Shareholder Services Fees — Class C (Note D) | | | — | @ | |
Directors' Fees and Expenses | | | — | @ | |
Other Expenses | | | — | @ | |
Total Expenses | | | 230 | | |
Expenses Reimbursed by Adviser (Note B) | | | (165 | ) | |
Waiver of Advisory Fees (Note B) | | | (27 | ) | |
Reimbursement of Class Specific Expenses — Class A (Note B) | | | (1 | ) | |
Reimbursement of Class Specific Expenses — Class C (Note B) | | | (1 | ) | |
Reimbursement of Class Specific Expenses — Class IS (Note B) | | | (1 | ) | |
Rebate from Morgan Stanley Affiliate (Note G) | | | (— | @) | |
Net Expenses | | | 35 | | |
Net Investment Loss | | | (19 | ) | |
Realized Gain (Loss): | |
Investments Sold | | | (415 | ) | |
Foreign Currency Translation | | | 4 | | |
Net Realized Loss | | | (411 | ) | |
Change in Unrealized Appreciation (Depreciation): | |
Investments | | | (541 | ) | |
Foreign Currency Translation | | | (— | @) | |
Net Change in Unrealized Appreciation (Depreciation) | | | (541 | ) | |
Net Realized Loss and Change in Unrealized Appreciation (Depreciation) | | | (952 | ) | |
Net Decrease in Net Assets Resulting from Operations | | $ | (971 | ) | |
^ Commencement of Operations.
@ Amount is less than $500.
The accompanying notes are an integral part of the financial statements.
11
Morgan Stanley Institutional Fund, Inc.
Annual Report — December 31, 2018
Global Counterpoint Portfolio
Statement of Changes in Net Assets | | Period from
June 29, 2018^ to
December 31, 2018
(000) | |
Increase (Decrease) in Net Assets: | |
Operations: | |
Net Investment Loss | | $ | (19 | ) | |
Net Realized Loss | | | (411 | ) | |
Net Change in Unrealized Appreciation (Depreciation) | | | (541 | ) | |
Net Decrease in Net Assets Resulting from Operations | | | (971 | ) | |
Dividends and Distributions to Shareholders: | |
Class I | | | (21 | ) | |
Class A | | | (— | @) | |
Class C | | | (— | @) | |
Class IS | | | (— | @) | |
Paid-in-Capital: | |
Class I | | | (50 | ) | |
Class A | | | (— | @) | |
Class C | | | (— | @) | |
Class IS | | | (— | @) | |
Total Dividends and Distributions to Shareholders | | | (71 | ) | |
Capital Share Transactions:(1) | |
Class I: | |
Subscribed | | | 6,750 | | |
Distributions Reinvested | | | 19 | | |
Class A: | |
Subscribed | | | 10 | | |
Class C: | |
Subscribed | | | 10 | | |
Class IS: | |
Subscribed | | | 10 | | |
Net Increase in Net Assets Resulting from Capital Share Transactions | | | 6,799 | | |
Total Increase in Net Assets | | | 5,757 | | |
Net Assets: | |
Beginning of Period | | | — | | |
End of Period | | $ | 5,757 | | |
(1) Capital Share Transactions: | |
Class I: | |
Shares Subscribed | | | 675 | | |
Shares Issued on Distributions Reinvested | | | 2 | | |
Net Increase in Class I Shares Outstanding | | | 677 | | |
Class A: | |
Shares Subscribed | | | 1 | | |
Class C: | |
Shares Subscribed | | | 1 | | |
Class IS: | |
Shares Subscribed | | | 1 | | |
^ Commencement of Operations.
@ Amount is less than $500.
The accompanying notes are an integral part of the financial statements.
12
Morgan Stanley Institutional Fund, Inc.
Annual Report — December 31, 2018
Financial Highlights
Global Counterpoint Portfolio
| | | Class I | |
Selected Per Share Data and Ratios | | Period from
June 29, 2018(1) to
December 31, 2018 | |
Net Asset Value, Beginning of Period | | $ | 10.00 | | |
Loss from Investment Operations: | |
Net Investment Loss(2) | | | (0.03 | ) | |
Net Realized and Unrealized Loss | | | (1.41 | ) | |
Total from Investment Operations | | | (1.44 | ) | |
Distributions from and/or in Excess of: | |
Net Investment Income | | | (0.03 | ) | |
Paid-in-capital | | | (0.07 | ) | |
Total Distributions | | | (0.10 | ) | |
Net Asset Value, End of Period | | $ | 8.46 | | |
Total Return(3) | | | (14.36 | )%(5) | |
Ratios and Supplemental Data: | |
Net Assets, End of Period (Thousands) | | $ | 5,733 | | |
Ratio of Expenses to Average Net Assets(7) | | | 1.03 | %(4)(6) | |
Ratio of Net Investment Loss to Average Net Assets(7) | | | (0.54 | )%(4)(6) | |
Ratio of Rebate from Morgan Stanley Affiliates to Average Net Assets | | | 0.01 | %(6) | |
Portfolio Turnover Rate | | | 54 | %(5) | |
(7) Supplemental Information on the Ratios to Average Net Assets: | |
Ratios Before Expense Limitation: | |
Expenses to Average Net Assets | | | 6.83 | %(6) | |
Net Investment Loss to Average Net Assets | | | (6.34 | )%(6) | |
(1) Commencement of Operations.
(2) Per share amount is based on average shares outstanding.
(3) Calculated based on the net asset value as of the last business day of the period.
(4) The Ratios of Expenses and Net Investment Loss reflect the rebate of certain Fund expenses in connection with the investments in Morgan Stanley affiliates during the period. The effect of the rebate on the ratios is disclosed in the above table as "Ratio of Rebate from Morgan Stanley Affiliates to Average Net Assets."
(5) Not annualized.
(6) Annualized.
The accompanying notes are an integral part of the financial statements.
13
Morgan Stanley Institutional Fund, Inc.
Annual Report — December 31, 2018
Financial Highlights
Global Counterpoint Portfolio
| | | Class A | |
Selected Per Share Data and Ratios | | Period from
June 29, 2018(1) to
December 31, 2018 | |
Net Asset Value, Beginning of Period | | $ | 10.00 | | |
Loss from Investment Operations: | |
Net Investment Loss(2) | | | (0.04 | ) | |
Net Realized and Unrealized Loss | | | (1.40 | ) | |
Total from Investment Operations | | | (1.44 | ) | |
Distributions from and/or in Excess of: | |
Net Investment Income | | | (0.03 | ) | |
Paid-in-capital | | | (0.06 | ) | |
Total Distributions | | | (0.09 | ) | |
Net Asset Value, End of Period | | $ | 8.47 | | |
Total Return(3) | | | (14.44 | )%(5) | |
Ratios and Supplemental Data: | |
Net Assets, End of Period (Thousands) | | $ | 8 | | |
Ratio of Expenses to Average Net Assets(7) | | | 1.39 | %(4)(6) | |
Ratio of Net Investment Loss to Average Net Assets(7) | | | (0.91 | )%(4)(6) | |
Ratio of Rebate from Morgan Stanley Affiliates to Average Net Assets | | | 0.01 | %(6) | |
Portfolio Turnover Rate | | | 54 | %(5) | |
(7) Supplemental Information on the Ratios to Average Net Assets: | |
Ratios Before Expense Limitation: | |
Expenses to Average Net Assets | | | 26.82 | %(6) | |
Net Investment Loss to Average Net Assets | | | (26.34 | )%(6) | |
(1) Commencement of Operations.
(2) Per share amount is based on average shares outstanding.
(3) Calculated based on the net asset value which does not reflect sales charges, if applicable, as of the last business day of the period.
(4) The Ratios of Expenses and Net Investment Loss reflect the rebate of certain Fund expenses in connection with the investments in Morgan Stanley affiliates during the period. The effect of the rebate on the ratios is disclosed in the above table as "Ratio of Rebate from Morgan Stanley Affiliates to Average Net Assets."
(5) Not annualized.
(6) Annualized.
The accompanying notes are an integral part of the financial statements.
14
Morgan Stanley Institutional Fund, Inc.
Annual Report — December 31, 2018
Financial Highlights
Global Counterpoint Portfolio
| | | Class C | |
Selected Per Share Data and Ratios | | Period from
June 29, 2018(1) to
December 31, 2018 | |
Net Asset Value, Beginning of Period | | $ | 10.00 | | |
Loss from Investment Operations: | |
Net Investment Loss(2) | | | (0.08 | ) | |
Net Realized and Unrealized Loss | | | (1.40 | ) | |
Total from Investment Operations | | | (1.48 | ) | |
Distributions from and/or in Excess of: | |
Net Investment Income | | | (0.02 | ) | |
Paid-in-capital | | | (0.03 | ) | |
Total Distributions | | | (0.05 | ) | |
Net Asset Value, End of Period | | $ | 8.47 | | |
Total Return(3) | | | (14.80 | )%(5) | |
Ratios and Supplemental Data: | |
Net Assets, End of Period (Thousands) | | $ | 8 | | |
Ratio of Expenses to Average Net Assets(7) | | | 2.14 | %(4)(6) | |
Ratio of Net Investment Loss to Average Net Assets(7) | | | (1.66 | )%(4)(6) | |
Ratio of Rebate from Morgan Stanley Affiliates to Average Net Assets | | | 0.01 | %(6) | |
Portfolio Turnover Rate | | | 54 | %(5) | |
(7) Supplemental Information on the Ratios to Average Net Assets: | |
Ratios Before Expense Limitation: | |
Expenses to Average Net Assets | | | 27.44 | %(6) | |
Net Investment Loss to Average Net Assets | | | (26.96 | )%(6) | |
(1) Commencement of Operations.
(2) Per share amount is based on average shares outstanding.
(3) Calculated based on the net asset value which does not reflect sales charges, if applicable, as of the last business day of the period.
(4) The Ratios of Expenses and Net Investment Loss reflect the rebate of certain Fund expenses in connection with the investments in Morgan Stanley affiliates during the period. The effect of the rebate on the ratios is disclosed in the above table as "Ratio of Rebate from Morgan Stanley Affiliates to Average Net Assets."
(5) Not annualized.
(6) Annualized.
The accompanying notes are an integral part of the financial statements.
15
Morgan Stanley Institutional Fund, Inc.
Annual Report — December 31, 2018
Financial Highlights
Global Counterpoint Portfolio
| | | Class IS | |
Selected Per Share Data and Ratios | | Period from
June 29, 2018(1) to
December 31, 2018 | |
Net Asset Value, Beginning of Period | | $ | 10.00 | | |
Loss from Investment Operations: | |
Net Investment Loss(2) | | | (0.02 | ) | |
Net Realized and Unrealized Loss | | | (1.41 | ) | |
Total from Investment Operations | | | (1.43 | ) | |
Distributions from and/or in Excess of: | |
Net Investment Income | | | (0.03 | ) | |
Paid-in-capital | | | (0.08 | ) | |
Total Distributions | | | (0.11 | ) | |
Net Asset Value, End of Period | | $ | 8.46 | | |
Total Return(3) | | | (14.34 | )%(5) | |
Ratios and Supplemental Data: | |
Net Assets, End of Period (Thousands) | | $ | 8 | | |
Ratio of Expenses to Average Net Assets(7) | | | 0.99 | %(4)(6) | |
Ratio of Net Investment Loss to Average Net Assets(7) | | | (0.51 | )%(4)(6) | |
Ratio of Rebate from Morgan Stanley Affiliates to Average Net Assets | | | 0.01 | %(6) | |
Portfolio Turnover Rate | | | 54 | %(5) | |
(7) Supplemental Information on the Ratios to Average Net Assets: | |
Ratios Before Expense Limitation: | |
Expenses to Average Net Assets | | | 26.39 | %(6) | |
Net Investment Loss to Average Net Assets | | | (25.91 | )%(6) | |
(1) Commencement of Operations.
(2) Per share amount is based on average shares outstanding.
(3) Calculated based on the net asset value as of the last business day of the period.
(4) The Ratios of Expenses and Net Investment Loss reflect the rebate of certain Fund expenses in connection with the investments in Morgan Stanley affiliates during the period. The effect of the rebate on the ratios is disclosed in the above table as "Ratio of Rebate from Morgan Stanley Affiliates to Average Net Assets."
(5) Not annualized.
(6) Annualized.
The accompanying notes are an integral part of the financial statements.
16
Morgan Stanley Institutional Fund, Inc.
Annual Report — December 31, 2018
Notes to Financial Statements
Morgan Stanley Institutional Fund, Inc. (the "Company") is registered under the Investment Company Act of 1940, as amended (the "Act"), as an open-end management investment company. The Company is comprised of thirty separate, active, diversified and non-diversified funds (individually referred to as a "Fund", collectively as the "Funds"). The Company applies investment company accounting and reporting guidance.
The accompanying financial statements relate to the Global Counterpoint Portfolio. The Fund seeks long-term capital appreciation.
The Fund commenced operations on June 29, 2018 and offers four classes of shares — Class I, Class A, Class C and Class IS.
A. Significant Accounting Policies: The following significant accounting policies are in conformity with U.S. generally accepted accounting principles ("GAAP"). Such policies are consistently followed by the Company in the preparation of its financial statements. GAAP may require management to make estimates and assumptions that affect the reported amounts and disclosures in the financial statements. Actual results may differ from those estimates.
In August 2018, the Financial Accounting Standards Board ("FASB") issued Accounting Standards Update ("ASU") 2018-13, Fair Value Measurement (Topic 820) — Disclosures Framework — Changes to Disclosure Requirements of Fair Value Measurement ("ASU 2018-13") which introduces new fair value disclosure requirements as well as eliminates and modifies certain existing fair value disclosure requirements. ASU 2018-13 would be effective for fiscal years beginning after December 15, 2019 and for interim periods within those fiscal years; however, management has elected to early adopt ASU 2018-13 effective with the current reporting period as permitted by the standard. The impact of the Fund's adoption was limited to changes in the Fund's financial statement disclosures regarding fair value, primarily those disclosures related to transfers between levels of the fair value hierarchy and disclosure of the range and weighted average used to develop significant unobservable inputs for Level 3 fair value measurements, when applicable.
1. Security Valuation: (1) An equity portfolio security listed or traded on an exchange is valued at its latest reported sales price (or at the exchange official closing price if such exchange reports an official closing price), and if there were no sales on a given day and if there is no official exchange closing price for that day, the security is valued at the mean between the last reported bid and asked prices
if such bid and asked prices are available on the relevant exchanges. Listed equity securities not traded on the valuation date with no reported bid and asked prices available on the exchange are valued at the mean between the current bid and asked prices obtained from one or more reputable brokers or dealers. In cases where a security is traded on more than one exchange, the security is valued on the exchange designated as the primary market; (2) all other equity portfolio securities for which over-the-counter ("OTC") market quotations are readily available are valued at the latest reported sales price (or at the market official closing price if such market reports an official closing price), and if there was no trading in the security on a given day and if there is no official closing price from relevant markets for that day, the security is valued at the mean between the last reported bid and asked prices if such bid and asked prices are available on the relevant markets. An unlisted equity security that does not trade on the valuation date and for which bid and asked prices from the relevant markets are unavailable is valued at the mean between the current bid and asked prices obtained from one or more reputable brokers or dealers; (3) listed options are valued at the last reported sales price on the exchange on which they are listed (or at the exchange official closing price if such exchange reports an official closing price). If an official closing price or last reported sales price is unavailable, the listed option should be fair valued at the mean between its latest bid and ask prices. Unlisted options are valued at the mean between their latest bid and ask prices from a broker/dealer or valued by a pricing service/vendor; (4) certain portfolio securities may be valued by an outside pricing service/vendor approved by the Company's Board of Directors (the "Directors"). The pricing service/vendor may employ a pricing model that takes into account, among other things, bids, yield spreads and/or other market data and specific security characteristics. Alternatively, if a valuation is not available from an outside pricing service/vendor, and the security trades on an exchange, the security may be valued at its latest reported sale price (or at the exchange official closing price if such exchange reports an official closing price), prior to the time when assets are valued. If there are no sales on a given day and if there is no official exchange closing price for that day, the security is valued at the mean between the last reported bid and asked prices if such bid and asked prices are available in the relevant exchanges; (5) when market quotations are not readily available, including
17
Morgan Stanley Institutional Fund, Inc.
Annual Report — December 31, 2018
Notes to Financial Statements (cont'd)
circumstances under which Morgan Stanley Investment Management Inc. (the "Adviser") determines that the closing price, last sale price or the mean between the last reported bid and asked prices are not reflective of a security's market value, portfolio securities are valued at their fair value as determined in good faith under procedures established by and under the general supervision of the Directors. Occasionally, developments affecting the closing prices of securities and other assets may occur between the times at which valuations of such securities are determined (that is, close of the foreign market on which the securities trade) and the close of business of the New York Stock Exchange ("NYSE"). If developments occur during such periods that are expected to materially affect the value of such securities, such valuations may be adjusted to reflect the estimated fair value of such securities as of the close of the NYSE, as determined in good faith by the Directors or by the Adviser using a pricing service and/or procedures approved by the Directors; (6) quotations of foreign portfolio securities, other assets and liabilities and forward contracts stated in foreign currency are translated into U.S. dollar equivalents at the prevailing market rates prior to the close of the NYSE; and (7) investments in mutual funds, including the Morgan Stanley Institutional Liquidity Funds, are valued at the net asset value ("NAV") as of the close of each business day.
The Directors have responsibility for determining in good faith the fair value of the investments, and the Directors may appoint others, such as the Company's Adviser or a valuation committee, to assist the Directors in determining fair value and to make the actual calculations pursuant to the fair valuation methodologies previously approved by the Directors. Under procedures approved by the Directors, the Company's Adviser has formed a Valuation Committee whose members are approved by the Directors. The Valuation Committee provides administration and oversight of the Company's valuation policies and procedures, which are reviewed at least annually by the Directors. These procedures allow the Company to utilize independent pricing services, quotations from securities and financial instrument dealers and other market sources to determine fair value.
2. Fair Value Measurement: FASB Accounting Standards CodificationTM ("ASC") 820, "Fair Value Measurement" ("ASC 820"), defines fair value as the value that the Fund would receive to sell an investment or pay
to transfer a liability in a timely transaction with an independent buyer in the principal market, or in the absence of a principal market, the most advantageous market for the investment or liability. ASC 820 establishes a three-tier hierarchy to distinguish between (1) inputs that reflect the assumptions market participants would use in valuing an asset or liability developed based on market data obtained from sources independent of the reporting entity (observable inputs) and (2) inputs that reflect the reporting entity's own assumptions about the assumptions market participants would use in valuing an asset or liability developed based on the best information available in the circumstances (unobservable inputs) and to establish classification of fair value measurements for disclosure purposes. Various inputs are used in determining the value of the Fund's investments. The inputs are summarized in the three broad levels listed below:
• Level 1 – unadjusted quoted prices in active markets for identical investments
• Level 2 – other significant observable inputs (including quoted prices for similar investments, interest rates, prepayment speeds, credit risk, etc.)
• Level 3 – significant unobservable inputs including the Fund's own assumptions in determining the fair value of investments. Factors considered in making this determination may include, but are not limited to, information obtained by contacting the issuer, analysts, or the appropriate stock exchange (for exchange-traded securities), analysis of the issuer's financial statements or other available documents and, if necessary, available information concerning other securities in similar circumstances
The inputs or methodology used for valuing securities are not necessarily an indication of the risk associated with investing in those securities and the determination of the significance of a particular input to the fair value measurement in its entirety requires judgment and considers factors specific to each security.
18
Morgan Stanley Institutional Fund, Inc.
Annual Report — December 31, 2018
Notes to Financial Statements (cont'd)
The following is a summary of the inputs used to value the Fund's investments as of December 31, 2018:
Investment Type | | Level 1
Unadjusted
quoted
prices
(000) | | Level 2
Other
significant
observable
inputs
(000) | | Level 3
Significant
unobservable
inputs
(000) | | Total
(000) | |
Assets: | |
Common Stocks | |
Aerospace & Defense | | $ | 74 | | | $ | — | | | $ | — | | | $ | 74 | | |
Air Freight & Logistics | | | 3 | | | | — | | | | — | | | | 3 | | |
Automobiles | | | 5 | | | | — | | | | — | | | | 5 | | |
Banks | | | 245 | | | | 14 | | | | — | | | | 259 | | |
Beverages | | | — | | | | 225 | | | | — | | | | 225 | | |
Biotechnology | | | 21 | | | | 25 | | | | — | | | | 46 | | |
Building Products | | | 1 | | | | 28 | | | | — | | | | 29 | | |
Capital Markets | | | 96 | | | | 13 | | | | — | | | | 109 | | |
Chemicals | | | 81 | | | | 24 | | | | — | | | | 105 | | |
Commercial
Services & Supplies | | | 124 | | | | 54 | | | | — | | | | 178 | | |
Communications
Equipment | | | 1 | | | | — | | | | — | | | | 1 | | |
Construction
Materials | | | 94 | | | | — | | | | — | | | | 94 | | |
Consumer Finance | | | — | | | | 4 | | | | — | | | | 4 | | |
Diversified Consumer
Services | | | 148 | | | | — | | | | — | | | | 148 | | |
Diversified Financial
Services | | | — | | | | 4 | | | | — | | | | 4 | | |
Electrical Equipment | | | — | | | | 3 | | | | — | | | | 3 | | |
Electronic Equipment,
Instruments &
Components | | | — | | | | 2 | | | | — | | | | 2 | | |
Entertainment | | | 108 | | | | 11 | | | | — | | | | 119 | | |
Food Products | | | 15 | | | | 131 | | | | — | | | | 146 | | |
Health Care
Equipment &
Supplies | | | 189 | | | | 11 | | | | — | | | | 200 | | |
Health Care
Providers & Services | | | 152 | | | | 5 | | | | — | | | | 157 | | |
Health Care
Technology | | | 153 | | | | — | | | | — | | | | 153 | | |
Hotels, Restaurants &
Leisure | | | 113 | | | | 45 | | | | — | | | | 158 | | |
Household Durables | | | 16 | | | | 17 | | | | — | | | | 33 | | |
Household Products | | | — | | | | 90 | | | | — | | | | 90 | | |
Information
Technology Services | | | 408 | | | | 10 | | | | — | | | | 418 | | |
Insurance | | | 4 | | | | 31 | | | | — | | | | 35 | | |
Interactive Media &
Services | | | 308 | | | | 113 | | | | — | | | | 421 | | |
Internet & Direct
Marketing Retail | | | 605 | | | | 29 | | | | — | | | | 634 | | |
Life Sciences Tools &
Services | | | 54 | | | | 7 | | | | — | | | | 61 | | |
Machinery | | | 4 | | | | 31 | | | | — | | | | 35 | | |
Marine | | | — | | | | 14 | | | | — | | | | 14 | | |
Media | | | — | | | | 6 | | | | — | | | | 6 | | |
Multi-Line Retail | | | — | | | | 11 | | | | — | | | | 11 | | |
Multi-Utilities | | | 20 | | | | — | | | | — | | | | 20 | | |
Pharmaceuticals | | | 80 | | | | 12 | | | | — | | | | 92 | | |
Professional Services | | | 13 | | | | 12 | | | | — | | | | 25 | | |
Real Estate
Management &
Development | | | 9 | | | | — | | | | — | | | | 9 | | |
Investment Type | | Level 1
Unadjusted
quoted
prices
(000) | | Level 2
Other
significant
observable
inputs
(000) | | Level 3
Significant
unobservable
inputs
(000) | | Total
(000) | |
Common Stocks (cont'd) | |
Road & Rail | | $ | 174 | | | $ | 86 | | | $ | — | | | $ | 260 | | |
Semiconductors &
Semiconductor
Equipment | | | 22 | | | | 22 | | | | — | | | | 44 | | |
Software | | | 624 | | | | 23 | | | | — | | | | 647 | | |
Specialty Retail | | | 12 | | | | — | | | | — | | | | 12 | | |
Textiles, Apparel &
Luxury Goods | | | — | | | | 372 | | | | — | | | | 372 | | |
Thrifts & Mortgage
Finance | | | 8 | | | | — | | | | — | | | | 8 | | |
Trading Companies &
Distributors | | | 28 | | | | 1 | | | | — | | | | 29 | | |
Transportation
Infrastructure | | | 33 | | | | 79 | | | | — | | | | 112 | | |
Total Common Stocks | | | 4,045 | | | | 1,565 | | | | — | | | | 5,610 | | |
Call Options Purchased | | | — | | | | 5 | | | | — | | | | 5 | | |
Short-Term Investment | |
Investment Company | | | 212 | | | | — | | | | — | | | | 212 | | |
Total Assets | | $ | 4,257 | | | $ | 1,570 | | | $ | — | | | $ | 5,827 | | |
Transfers between investment levels may occur as the markets fluctuate and/or the availability of data used in an investment's valuation changes.
3. Foreign Currency Translation and Foreign Investments: The books and records of the Fund are maintained in U.S. dollars. Foreign currency amounts are translated into U.S. dollars as follows:
– investments, other assets and liabilities at the prevailing rate of exchange on the valuation date;
– investment transactions and investment income at the prevailing rates of exchange on the dates of such transactions.
Although the net assets of the Fund are presented at the foreign exchange rates and market values at the close of the period, the Fund does not isolate that portion of the results of operations arising as a result of changes in the foreign exchange rates from the fluctuations arising from changes in the market prices of securities held at period end. Similarly, the Fund does not isolate the effect of changes in foreign exchange rates from the fluctuations arising from changes in the market prices of securities sold during the period. Accordingly, realized and unrealized foreign currency gains (losses) on investments in securities are included in the reported net realized and unrealized gains (losses) on investment transactions and balances. However, pursuant to U.S.
19
Morgan Stanley Institutional Fund, Inc.
Annual Report — December 31, 2018
Notes to Financial Statements (cont'd)
federal income tax regulations, gains and losses from certain foreign currency transactions and the foreign currency portion of gains and losses realized on sales and maturities of foreign denominated debt securities are treated as ordinary income for U.S. federal income tax purposes.
Net realized gains (losses) on foreign currency transactions represent net foreign exchange gains (losses) from foreign currency forward exchange contracts, disposition of foreign currencies, currency gains (losses) realized between the trade and settlement dates on securities transactions, and the difference between the amount of investment income and foreign withholding taxes recorded on the Fund's books and the U.S. dollar equivalent amounts actually received or paid. Net unrealized currency gains (losses) from valuing foreign currency denominated assets and liabilities at period end exchange rates are reflected as a component of unrealized appreciation (depreciation) in the Statement of Assets and Liabilities. The change in unrealized currency gains (losses) on foreign currency translations for the period is reflected in the Statement of Operations.
Foreign security and currency transactions may involve certain considerations and risks not typically associated with those of U.S. dollar denominated transactions as a result of, among other factors, fluctuations of exchange rates in relation to the U.S. dollar, the possibility of lower levels of governmental supervision and regulation of foreign securities markets and the possibility of political or economic instability.
Governmental approval for foreign investments may be required in advance of making an investment under certain circumstances in some countries, and the extent of foreign investments in domestic companies may be subject to limitation in other countries. Foreign ownership limitations also may be imposed by the charters of individual companies to prevent, among other concerns, violations of foreign investment limitations. As a result, an additional class of shares (identified as "Foreign" in the Portfolio of Investments) may be created and offered for investment. The "local" and "foreign shares" market values may differ. In the absence of trading of the foreign shares in such markets, the Fund values the foreign shares at the closing exchange price of the local shares.
4. Derivatives: The Fund may, but is not required to, use derivative instruments for a variety of purposes, including hedging, risk management, portfolio management or to earn income. Derivatives are financial instruments whose value is based, in part, on the value of an underlying asset, interest rate, index or financial instrument. Prevailing interest rates and volatility levels, among other things, also affect the value of derivative instruments. A derivative instrument often has risks similar to its underlying asset and may have additional risks, including imperfect correlation between the value of the derivative and the underlying asset, risks of default by the counterparty to certain transactions, magnification of losses incurred due to changes in the market value of the securities, instruments, indices or interest rates to which the derivative instrument relates, risks that the transactions may not be liquid and risks arising from margin requirements. The use of derivatives involves risks that are different from, and possibly greater than, the risks associated with other portfolio investments. Derivatives may involve the use of highly specialized instruments that require investment techniques and risk analyses different from those associated with other portfolio investments. All of the Fund's holdings, including derivative instruments, are marked-to-market each day with the change in value reflected in unrealized appreciation (depreciation). Upon disposition, a realized gain or loss is recognized.
Certain derivative transactions may give rise to a form of leverage. Leverage magnifies the potential for gain and the risk of loss. Leverage associated with derivative transactions may cause the Fund to liquidate portfolio positions when it may not be advantageous to do so to satisfy its obligations or to meet earmarking or segregation requirements, pursuant to applicable Securities and Exchange Commission ("SEC") rules and regulations, or may cause the Fund to be more volatile than if the Fund had not been leveraged. Although the Adviser seeks to use derivatives to further the Fund's investment objectives, there is no assurance that the use of derivatives will achieve this result.
Following is a description of the derivative instruments and techniques that the Fund used during the period and their associated risks:
Options: With respect to options, the Fund is subject to equity risk, interest rate risk and foreign currency exchange risk in the normal course of pursuing its
20
Morgan Stanley Institutional Fund, Inc.
Annual Report — December 31, 2018
Notes to Financial Statements (cont'd)
investment objectives. If the Fund buys an option, it buys a legal contract giving it the right to buy or sell a specific amount of the underlying instrument or foreign currency, or futures contract on the underlying instrument or foreign currency, at an agreed-upon price during a period of time or on a specified date typically in exchange for a premium paid by the Fund. The Fund may purchase and/or sell put and call options. Purchasing call options tends to increase the Fund's exposure to the underlying (or similar) instrument. Purchasing put options tends to decrease the Fund's exposure to the underlying (or similar) instrument. When entering into purchased option contracts, the Fund bears the risk of interest or exchange rates or securities prices moving unexpectedly, in which case, the Fund may not achieve the anticipated benefits of the purchased option contracts; however the risk of loss is limited to the premium paid. Purchased options are reported as part of "Total Investments in Securities" in the Statement of Assets and Liabilities. Premiums paid for purchasing options which expired are treated as realized losses. If the Fund sells an option, it sells to another party the right to buy from or sell to the Fund a specific amount of the underlying instrument or foreign currency, or futures contract on the underlying instrument or foreign currency, at an agreed-upon price during a period of time or on a specified date typically in exchange for a premium received by the Fund. When options are purchased OTC, the Fund bears the risk that the counterparty that wrote the option will be unable or unwilling to perform its obligations under the option contract. Options may also be illiquid and the Fund may have difficulty closing out its position. A decision as to whether, when and how to use options involves the exercise of skill and judgment and even a well-conceived option transaction may be unsuccessful because of market behavior or unexpected events. The prices of options can be highly volatile and the use of options can lower total returns.
FASB ASC 815, "Derivatives and Hedging" ("ASC 815"), is intended to improve financial reporting about derivative instruments by requiring enhanced disclosures to enable investors to better understand how and why the Fund uses derivative instruments, how these derivative instruments are accounted for and their effects on the Fund's financial position and results of operations.
The following table sets forth the fair value of the Fund's derivative contracts by primary risk exposure as of December 31, 2018:
| | | Asset Derivatives
Statement of Assets and
Liabilities Location | | Primary Risk
Exposure | | Value
(000) | |
Purchased Options | | Investments, at Value
(Purchased Options) | |
Currency Risk | | $ | 5 | (a) | |
(a) Amounts are included in Investments in Securities in the Statement of Assets and Liabilities.
The following table sets forth by primary risk exposure the Fund's change in unrealized appreciation (depreciation) by type of derivative contract for the period ended December 31, 2018 in accordance with ASC 815:
Change in Unrealized Appreciation (Depreciation) | |
Primary Risk Exposure | | Derivative Type | | Value
(000) | |
Currency Risk | | Investments
(Purchased Options) | | $ | (8 | )(b) | |
(b) Amounts are included in Investments in the Statement of Operations.
At December 31, 2018, the Fund's derivative assets and liabilities are as follows:
Gross Amounts of Assets and Liabilities
Presented in the Statement of Assets and Liabilities | |
Derivatives | | Assets(c)
(000) | | Liabilities(c)
(000) | |
Purchased Options | | $ | 5 | (a) | | $ | — | | |
(a) Amounts are included in Investments in Securities in the Statement of Assets and Liabilities.
(c) Absent an event of default or early termination, OTC derivative assets and liabilities are presented gross and not offset in the Statement of Assets and Liabilities.
The Fund typically enters into International Swaps and Derivatives Association, Inc. Master Agreements ("ISDA Master Agreements") or similar master agreements (collectively, "Master Agreements") with its contract counterparties for certain OTC derivatives in order to, among other things, reduce its credit risk to counterparties. ISDA Master Agreements include provisions for general obligations, representations, collateral and events of default or termination. Under an ISDA Master Agreement, the Fund typically may offset with the counterparty certain OTC derivative financial instruments' payables and/or receivables with collateral held and/or posted and create one single net payment (close-out netting) in the event of default, termination and/or potential deterioration in the credit quality of the counterparty. Various Master Agreements govern the terms of certain transactions with counterparties, including
21
Morgan Stanley Institutional Fund, Inc.
Annual Report — December 31, 2018
Notes to Financial Statements (cont'd)
transactions such as swap, forward, repurchase and reverse repurchase agreements. These Master Agreements typically attempt to reduce the counterparty risk associated with such transactions by specifying credit protection mechanisms and providing standardization that improves legal certainty. Cross-termination provisions under Master Agreements typically provide that a default in connection with one transaction between the Fund and a counterparty gives the non-defaulting party the right to terminate any other transactions in place with the defaulting party to create one single net payment due to/due from the defaulting party and may be a feature in certain Master Agreements. In the event the Fund exercises its right to terminate a Master Agreement after a counterparty experiences a termination event as defined in the Master Agreement, the return of collateral with market value in excess of the Fund's net liability may be delayed or denied.
The following table presents derivative financial instruments that are subject to enforceable netting arrangements as of December 31, 2018:
Gross Amounts Not Offset in the Statement of Assets and Liabilities | |
Counterparty | | Gross Asset
Derivatives
Presented in
the Statement of
Assets and
Liabilities
(000) | | Financial
Instrument
(000) | | Collateral
Received
(000) | | Net Amount
(not less
than $0)
(000) | |
Royal Bank of Scotland | | $ | 5 | (a) | | $ | — | | | $ | — | | | $ | 5 | | |
(a) Amounts are included in Investments in Securities in the Statement of Assets and Liabilities.
For the period ended December 31, 2018, the approximate average monthly amount outstanding for each derivative type is as follows:
Purchased Options: | |
Average monthly notional amount | | | 2,226,000 | | |
5. Indemnifications: The Company enters into contracts that contain a variety of indemnifications. The Company's maximum exposure under these arrangements is unknown. However, the Company has not had prior claims or losses pursuant to these contracts and expects the risk of loss to be remote.
6. Dividends and Distributions to Shareholders: Dividends and distributions to shareholders are recorded on the ex-dividend date. Dividends from net investment
income, if any, are declared and paid annually. Net realized capital gains, if any, are distributed at least annually.
7. Security Transactions, Income and Expenses: Security transactions are accounted for on the trade date (date the order to buy or sell is executed). Realized gains and losses on the sale of investment securities are determined on the specific identified cost method. Dividend income and other distributions are recorded on the ex-dividend date (except for certain foreign dividends which may be recorded as soon as the Fund is informed of such dividends) net of applicable withholding taxes. Non-cash dividends received in the form of stock, if any, are recognized on the ex-dividend date and recorded as non-cash dividend income at fair value. Interest income is recognized on the accrual basis except where collection is in doubt. Discounts are accreted and premiums are amortized over the life of the respective securities. Most expenses of the Company can be directly attributed to a particular Fund. Expenses which cannot be directly attributed are apportioned among the Funds based upon relative net assets or other appropriate methods. Income, expenses (other than class specific expenses — distribution and shareholder services, transfer agency and sub transfer agency fees) and realized and unrealized gains or losses are allocated to each class of shares based upon their relative net assets.
B. Advisory Fees: The Adviser, a wholly-owned subsidiary of Morgan Stanley, provides the Fund with advisory services under the terms of an Investment Advisory Agreement, paid quarterly, at the annual rate based on the daily net assets as follows:
First $1
billion | | Over $1
billion | |
| | 0.80 | % | | | 0.75 | % | |
For the period ended December 31, 2018, the advisory fee rate (net of waiver/rebate) was equivalent to an annual effective rate of 0.00% of the Fund's average daily net assets.
The Adviser has agreed to reduce its advisory fee and/or reimburse the Fund so that total annual portfolio operating expenses, excluding certain investment related expenses, taxes, interest and other extraordinary expenses (including litigation), will not exceed 1.05% for Class I shares, 1.40% for Class A shares, 2.15% for Class C shares and 1.00% for Class IS shares. The fee waivers and/or expense reimbursements will continue for at least one year from the date of the Fund's prospectus or until such time as the Directors act to
22
Morgan Stanley Institutional Fund, Inc.
Annual Report — December 31, 2018
Notes to Financial Statements (cont'd)
discontinue all or a portion of such waivers and/or reimbursements when they deem such action is appropriate. For the period ended December 31, 2018, approximately $27,000 of advisory fees were waived and approximately $168,000 of other expenses were reimbursed by the Adviser pursuant to this arrangement.
C. Administration Fees: The Adviser also serves as Administrator to the Company and provides administrative services pursuant to an Administration Agreement for an annual fee, accrued daily and paid monthly, of 0.08% of the Fund's average daily net assets.
Under a Sub-Administration Agreement between the Administrator and State Street Bank and Trust Company ("State Street"), State Street provides certain administrative services to the Company. For such services, the Administrator pays State Street a portion of the fee the Administrator receives from the Fund.
D. Distribution and Shareholder Services Fees: Morgan Stanley Distribution, Inc. ("MSDI" or the "Distributor"), a wholly-owned subsidiary of the Adviser and an indirect subsidiary of Morgan Stanley, serves as the Company's Distributor of Fund shares pursuant to a Distribution Agreement. The Company has adopted a Shareholder Services Plan with respect to Class A shares pursuant to Rule 12b-1 under the Act. Under the Shareholder Services Plan, the Fund pays the Distributor a shareholder services fee, accrued daily and paid monthly, at an annual rate of 0.25% of the Fund's average daily net assets attributable to Class A shares.
The Company has adopted a Distribution and Shareholder Services Plan with respect to Class C shares pursuant to Rule 12b-1 under the Act. Under the Distribution and Shareholder Services Plan, the Fund pays the Distributor a distribution fee, accrued daily and paid monthly, at an annual rate of 0.75% and a shareholder services fee, accrued daily and paid monthly, at an annual rate of 0.25% of the Fund's average daily net assets attributable to Class C shares.
The distribution and shareholder services fees are used to support the expenses associated with servicing and maintaining accounts. The Distributor may compensate other parties for providing shareholder support services to investors who purchase Class A and Class C shares.
E. Dividend Disbursing and Transfer Agent: The Company's dividend disbursing and transfer agent is DST Asset Manager Solutions, Inc. ("DST"). Pursuant to a Transfer
Agency Agreement, the Company pays DST a fee based on the number of classes, accounts and transactions relating to the Funds of the Company.
F. Custodian Fees: State Street (the "Custodian") also serves as Custodian for the Company in accordance with a Custodian Agreement. The Custodian holds cash, securities and other assets of the Company as required by the Act. Custody fees are payable monthly based on assets held in custody, investment purchases and sales activity and account maintenance fees, plus reimbursement for certain out-of-pocket expenses.
G. Security Transactions and Transactions with Affiliates: For the period ended December 31, 2018, purchases and sales of investment securities for the Fund, other than long-term U.S. Government securities and short-term investments, were approximately $9,940,000 and $3,383,000, respectively. There were no purchases and sales of long-term U.S. Government securities for the period ended December 31, 2018.
The Fund invests in the Institutional Class of the Morgan Stanley Institutional Liquidity Funds — Treasury Securities Portfolio (the "Liquidity Funds"), an open-end management investment company managed by the Adviser. Advisory fees paid by the Fund are reduced by an amount equal to its pro-rata share of the advisory and administration fees paid by the Fund due to its investment in the Liquidity Funds. For the period ended December 31, 2018, advisory fees paid were reduced by less than $500 relating to the Fund's investment in the Liquidity Funds.
A summary of the Fund's transactions in shares of affiliated investments during the year ended December 31, 2018 is as follows:
Affiliated
Investment
Company | | Value
June 29,
2018
(000) | | Purchases
at Cost
(000) | | Proceeds
from Sales
(000) | | Dividend
Income
(000) | |
Liquidity Funds | | $ | — | | | $ | 7,480 | | | $ | 7,268 | | | $ | 3 | | |
Affiliated
Investment
Company (cont'd) | | Realized
Gain
(Loss)
(000) | | Change in
Unrealized
Appreciation
(Depreciation)
(000) | | Value
December 31,
2018
(000) | |
Liquidity Funds | | $ | — | | | $ | — | | | $ | 212 | | |
The Fund is permitted to purchase and sell securities ("cross-trade") from and to other Morgan Stanley Funds as well as other funds and client accounts for which the Adviser or an affiliate of the Adviser serves as investment adviser, pursuant to
23
Morgan Stanley Institutional Fund, Inc.
Annual Report — December 31, 2018
Notes to Financial Statements (cont'd)
procedures approved by the Directors in compliance with Rule 17a-7 under the Act (the "Rule"). Each cross-trade is executed at the current market price in compliance with provisions of the Rule. For the period ended December 31, 2018, the Fund did not engage in any cross-trade transactions.
The Fund has an unfunded Deferred Compensation Plan (the "Compensation Plan"), which allows each independent Director to defer payment of all, or a portion, of the fees he or she receives for serving on the Board of Directors. Each eligible Director generally may elect to have the deferred amounts credited with a return equal to the total return on one or more of the Morgan Stanley funds that are offered as investment options under the Compensation Plan. Appreciation/depreciation and distributions received from these investments are recorded with an offsetting increase/decrease in the deferred compensation obligation and do not affect the NAV of the Fund.
H. Federal Income Taxes: It is the Fund's intention to continue to qualify as a regulated investment company and distribute all of its taxable and tax-exempt income. Accordingly, no provision for federal income taxes is required in the financial statements.
The Fund may be subject to taxes imposed by countries in which it invests. Such taxes are generally based on income and/or capital gains earned or repatriated. Taxes are accrued based on net investment income, net realized gains and net unrealized appreciation as such income and/or gains are earned. Taxes may also be based on transactions in foreign currency and are accrued based on the value of investments denominated in such currency.
FASB ASC 740-10, "Income Taxes — Overall", sets forth a minimum threshold for financial statement recognition of the benefit of a tax position taken or expected to be taken in a tax return. Management has concluded there are no significant uncertain tax positions that would require recognition in the financial statements. If applicable, the Fund recognizes interest accrued related to unrecognized tax benefits in "Interest Expense" and penalties in "Other Expenses" in the Statement of Operations. The Fund files tax returns with the U.S. Internal Revenue Service, New York and various states. The tax year ended December 31, 2018 remains subject to examination by taxing authorities.
The tax character of distributions paid may differ from the character of distributions shown for GAAP purposes due to short-term capital gains being treated as ordinary income for
tax purposes. The tax character of distributions paid during fiscal year 2018 was as follows:
| | 2018 Distributions Paid From: | |
| | Ordinary
Income
(000) | | Paid-in-
Capital
(000) | |
| | | | | $ | 21 | | | $ | 50 | | |
The amount and character of income and gains to be distributed are determined in accordance with income tax regulations which may differ from GAAP. These book/tax differences are either considered temporary or permanent in nature.
Temporary differences are attributable to differing book and tax treatments for the timing of the recognition of gains (losses) on certain investment transactions and the timing of the deductibility of certain expenses.
Permanent differences, primarily due to a nondeductible expense, resulted in the following reclassifications among the components of net assets at December 31, 2018:
Total
Accumulated
Loss
(000) | | Paid-in
Capital
(000) | |
| $ | — | @ | | $ | (— | @) | |
At December 31, 2018, the Fund had no distributable earnings on a tax basis.
At December 31, 2018, the Fund had available for federal income tax purposes unused short-term capital losses of approximately $313,000 that do not have an expiration date.
To the extent that capital loss carryforwards are used to offset any future capital gains realized, no capital gains tax liability will be incurred by the Fund for gains realized and not distributed. To the extent that capital gains are offset, such gains will not be distributed to the shareholders.
Qualified late year losses are capital losses and specified ordinary losses, including currency losses, incurred after October 31 but within the taxable year that, if elected, are deemed to arise on the first day of the Fund's next taxable year. For the year ended December 31, 2018, the Fund intends to defer to January 1, 2019 for U.S. federal income tax purposes the following losses:
Qualified
Late Year
Ordinary
Losses (000) | | Post-October
Capital
Losses (000) | |
| $ | — | @ | | $ | — | | |
@ Amount is less than $500.
24
Morgan Stanley Institutional Fund, Inc.
Annual Report — December 31, 2018
Notes to Financial Statements (cont'd)
I. Credit Facility: The Company and other Morgan Stanley funds participated in a $150,000,000 committed, unsecured revolving line of credit facility (the "Facility") with State Street. This Facility is to be used for temporary emergency purposes or funding of shareholder redemption requests. The interest rate on borrowings is based on the federal funds rate or 1 month LIBOR rate plus a spread. The Facility also has a commitment fee of 0.25% per annum based on the unused portion of the Facility. During the period ended December 31, 2018, the Fund did not have any borrowings under the Facility.
J. Other: At December 31, 2018, the Fund did not have record owners of 10% or greater.
25
Morgan Stanley Institutional Fund, Inc.
Annual Report — December 31, 2018
Report of Independent Registered Public Accounting Firm
To the Shareholders and Board of Directors of
Morgan Stanley Institutional Fund, Inc. —
Global Counterpoint Portfolio
Opinion on the Financial Statements
We have audited the accompanying statement of assets and liabilities of Global Counterpoint Portfolio (the "Fund") (one of the funds constituting the Morgan Stanley Institutional Fund, Inc. (the "Company")), including the portfolio of investments, as of December 31, 2018, and the related statements of operations and changes in net assets and the financial highlights for the period from June 29, 2018 (commencement of operations) through December 31, 2018 and the related notes (collectively referred to as the "financial statements"). In our opinion, the financial statements present fairly, in all material respects, the financial position of Global Counterpoint Portfolio (one of the funds constituting Morgan Stanley Institutional Fund, Inc.) at December 31, 2018, the results of its operations and the changes in its net assets and its financial highlights for the period from June 29, 2018 (commencement of operations) through December 31, 2018, in conformity with U.S. generally accepted accounting principles.
Basis for Opinion
These financial statements are the responsibility of the Company's management. Our responsibility is to express an opinion on the Fund's financial statements based on our audit. We are a public accounting firm registered with the Public Company Accounting Oversight Board (United States) ("PCAOB") and are required to be independent with respect to the Company in accordance with the U.S. federal securities law and the applicable rules and regulations of the Securities and Exchange Commission and the PCAOB.
We conducted our audit in accordance with the standards of the PCAOB. Those standards require that we plan and perform the audit to obtain reasonable assurance about whether the financial statements are free of material misstatement, whether due to error or fraud. The Company is not required to have, nor were we engaged to perform, an audit of the Company's internal control over financial reporting. As part of our audit, we are required to obtain an understanding of internal control over financial reporting, but not for the purpose of expressing an opinion on the effectiveness of the Company's internal control over financial reporting. Accordingly, we express no such opinion.
Our audit included performing procedures to assess the risks of material misstatement of the financial statements, whether due to error or fraud, and performing procedures that respond to those risks. Such procedures included examining, on a test basis, evidence regarding the amounts and disclosures in the financial statements. Our procedures included confirmation of securities owned as of December 31, 2018 by correspondence with the custodian and others or by other appropriate auditing procedures where replies from others were not received. Our audit also included evaluating the accounting principles used and significant estimates made by management, as well as evaluating the overall presentation of the financial statements. We believe that our audit provides a reasonable basis for our opinion.

We have served as the auditor of one or more Morgan Stanley investment companies since 2000.
Boston, Massachusetts
February 26, 2019
26
Morgan Stanley Institutional Fund, Inc.
Annual Report — December 31, 2018
Federal Tax Notice (unaudited)
For federal income tax purposes, the following information is furnished with respect to the distributions paid by the Fund during its taxable year ended December 31, 2018. For corporate shareholders 9.52% of the dividends qualified for the dividends received deduction.
For federal income tax purposes, the following information is furnished with respect to the Fund's earnings for its taxable year ended December 31, 2018. When distributed, certain earnings may be subject to a maximum tax rate of 15% as provided for by the Jobs and Growth Tax Relief Reconciliation Act of 2003. The Fund designated up to a maximum of approximately $12,000 as taxable at this lower rate.
In January, the Fund provides tax information to shareholders for the preceding calendar year.
27
Morgan Stanley Institutional Fund, Inc.
Annual Report — December 31, 2018
Privacy Notice (unaudited)
MORGAN STANLEY INVESTMENT MANAGEMENT INC.
AN IMPORTANT NOTICE CONCERNING OUR U.S. PRIVACY POLICY
We are required by federal law to provide you with a copy of our privacy policy annually. This policy applies to current and former individual investors in funds managed or sponsored by Morgan Stanley Investment Management Inc. ("MSIM") as well as current and former individual clients of MSIM. This policy is not applicable to partnerships, corporations, trusts or other non-individual clients or investors. Please note that we may amend this policy at any time, and will inform you of any changes as required by law.
WE RESPECT YOUR PRIVACY
We appreciate that you have provided us with your personal financial information. We strive to maintain the privacy of such information while we help you achieve your financial objectives. This Notice describes what non-public personal information we collect about you, why we collect it, when we may share it with others and how certain others may use it. It discusses the steps you may take to limit our sharing of certain information about you to affiliated companies in the Morgan Stanley family of companies ("other Morgan Stanley companies"). It also discloses how you may limit use of certain shared information for marketing purposes by other Morgan Stanley branded companies. Throughout this policy, we refer to the non-public information that personally identifies you or your accounts as "personal information.''
1. WHAT PERSONAL INFORMATION DO WE COLLECT ABOUT YOU?
We obtain personal information from applications and other forms you submit to us, from your dealings with us, from consumer reporting agencies, from our Web sites and from third parties and other sources.
For example:
• We may collect information such as your name, address, e-mail address, telephone/fax numbers, assets, income and investment objectives through subscription documents, applications and other forms you submit to us.
• We may obtain information about account balances, your use of account(s) and the types of products and services you prefer to receive from us through your dealings and transactions with us and other sources.
• We may obtain information about your creditworthiness and credit history from consumer reporting agencies.
• We may collect background information from and through third-party vendors to verify representations you have made and to comply with various regulatory requirements.
• If you interact with us through our public and private Web sites, we may collect information that you provide directly through online communications (such as an e-mail address). We may also collect information about your Internet service provider, your domain name, your computer's operating system and Web browser, your use of our Web sites and your product and service preferences, through the use of "cookies." Please consult the Terms of Use of these sites for more details.
2. WHEN DO WE DISCLOSE PERSONAL INFORMATION WE COLLECT ABOUT YOU?
We may disclose personal information we collect about you to other Morgan Stanley companies and to non-affiliated third parties.
a. Information We Disclose to Other Morgan Stanley Companies.
We may disclose personal information to other Morgan Stanley companies for a variety of reasons, including to manage your account(s) effectively, to service and process your transactions, to let you know about products and services offered by us and other Morgan Stanley companies, to manage our business, and as otherwise required or permitted by law. Offers for products and services from other Morgan Stanley companies are developed under conditions designed to safeguard your personal information.
28
Morgan Stanley Institutional Fund, Inc.
Annual Report — December 31, 2018
Privacy Notice (unaudited) (cont'd)
b. Information We Disclose to Non-affiliated Third Parties.
We do not disclose personal information that we collect about you to non-affiliated third parties except to those who provide marketing services on our behalf, to financial institutions with whom we have joint marketing agreements, and as otherwise required or permitted by law. For example, we may disclose personal information to non-affiliated third parties for servicing and processing transactions, to offer our own products and services, to protect against fraud, for institutional risk control, to respond to judicial process or to perform services on our behalf. When we share personal information with a non-affiliated third party, they are required to limit their use of personal information to the particular purpose for which it was shared and they are not allowed to share personal information with others except to fulfill that limited purpose or as may be permitted or required by law.
3. HOW DO WE PROTECT THE SECURITY AND CONFIDENTIALITY OF PERSONAL INFORMATION WE COLLECT ABOUT YOU?
We maintain physical, electronic and procedural security measures to help safeguard the personal information we collect about you. We have internal policies governing the proper handling of client information. Third parties that provide support or marketing services on our behalf may also receive personal information, and we require them to adhere to confidentiality standards with respect to such information.
4. HOW CAN YOU LIMIT THE SHARING OF CERTAIN TYPES OF PERSONAL INFORMATION WITH OTHER MORGAN STANLEY COMPANIES?
We offer you choices as to whether we share with other Morgan Stanley companies the personal information that was collected to determine your eligibility for products and services you request ("eligibility information"). Eligibility information does not include your identification information or personal information pertaining to our transactions or experiences with you. Please note that, even if you direct us not to share eligibility information with other Morgan Stanley companies ("opt-out"), we may still share personal information, including eligibility information, with those companies in circumstances excluded from the opt-out under applicable law, such as to process transactions or to service your account.
5. HOW CAN YOU LIMIT THE USE OF CERTAIN TYPES OF PERSONAL INFORMATION BY OTHER MORGAN STANLEY COMPANIES FOR MARKETING?
By following the opt-out instructions in Section 6 below, you may limit other Morgan Stanley branded companies from marketing their products or services to you based on personal information we disclose to them. This information may include, for example, your income and account history with us. Please note that, even if you choose to limit Other Morgan Stanley Companies from using personal information about you that we may share with them for marketing their products and services to you, Other Morgan Stanley Companies may use your personal information that they obtain from us to market to you in circumstances permitted by law, such as if the Other Morgan Stanley Company has its own relationship with you.
6. HOW CAN YOU SEND US AN OPT-OUT INSTRUCTION?
If you wish to limit our sharing of eligibility information about you with other Morgan Stanley companies or other Morgan Stanley companies' use of personal information for marketing purposes, as described in this notice, you may do so by:
• Calling us at (800) 548-7786
Monday–Friday between 8a.m. and 6p.m.(EST)
• Writing to us at the following address:
DST Asset Manager Solutions, Inc.
c/o Privacy Coordinator
P.O. Box 219804
Kansas City, Missouri 64121
29
Morgan Stanley Institutional Fund, Inc.
Annual Report — December 31, 2018
Privacy Notice (unaudited) (cont'd)
Your written request should include your name, address, telephone number and account number(s) to which the opt-out applies and whether you are opting out with respect to sharing of eligibility information (Section 4 above), or if information used for Marketing (Section 5 above) or both. Written opt-out requests should not be sent with any other correspondence. In order to process your request, we require that the request be provided by you directly and not through a third party.
Your opt-out preference will remain in effect with respect to this policy (as it may be amended) until you notify us otherwise. If you have a joint account, your direction for us not to share this information with other Morgan Stanley companies and for those other Morgan Stanley companies not to use your personal information for marketing will be applied to all account holders on that account. Please understand that if you limit our sharing or our affiliated companies' use of personal information, you and any joint account holder(s) may not receive information about Morgan Stanley products and services, including products or services that could help you manage your financial resources and achieve your investment objectives.
7. WHAT IF AN AFFILIATED COMPANY BECOMES A NON-AFFILIATED THIRD PARTY?
If, at any time in the future, an affiliated company becomes a non-affiliated third party, further disclosures of personal information made to the former affiliated company will be limited to those described in Section 2(b) above relating to non-affiliated third parties. If you elected under Section 6 to limit disclosures we make to affiliated companies, or use of personal information by affiliated companies, your election will not apply to use by any former affiliated company of your personal information in their possession once it becomes a non-affiliated third party.
SPECIAL NOTICE TO RESIDENTS OF VERMONT
The following section supplements our policy with respect to our individual clients who have a Vermont address and supersedes anything to the contrary in the above policy with respect to those clients only.
The state of Vermont requires financial institutions to obtain your consent prior to sharing personal information that they collect about you with affiliated companies and non-affiliated third parties other than in certain limited circumstances. Except as permitted by law, we will not share personal information we collect about you with non-affiliated third parties or other Morgan Stanley companies unless you provide us with your written consent to share such information ("opt-in").
If you wish to receive offers for investment products and services offered by or through other Morgan Stanley companies, please notify us in writing at the following address:
DST Asset Manager Solutions, Inc.
c/o Privacy Coordinator
P.O. Box 219804
Kansas City, Missouri 64121
Your authorization should include your name, address, telephone number and account number(s) to which the opt-in applies and should not be sent with any other correspondence. In order to process your authorization, we require that the authorization be provided by you directly and not through a third party.
SPECIAL NOTICE TO RESIDENTS OF CALIFORNIA
The following section supplements our policy with respect to our individual clients who have a California address and supersedes anything to the contrary in the above policy with respect to those clients only.
In response to a California law, if your account has a California home address, your personal information will not be disclosed to non-affiliated third parties except as permitted by applicable California law, and we will limit sharing such information with our affiliates to comply with California privacy laws that apply to us.
30
Morgan Stanley Institutional Fund, Inc.
Annual Report — December 31, 2018
Director and Officer Information (unaudited)
Independent Directors:
Name, Age and Address of
Independent Director | | Position(s)
Held with
Registrant | | Length of Time
Served* | | Principal Occupation(s) During Past 5 Years
and Other Relevant Professional Experience | | Number of
Portfolios in
Fund Complex
Overseen by
Independent
Director** | | Other Directorships
Held by Independent
Director*** | |
Frank L. Bowman (74)
c/o Perkins Coie LLP
Counsel to the Independent
Directors
30 Rockefeller Plaza
New York, NY 10112 | | Director | | Since
August
2006 | | President, Strategic Decisions, LLC (consulting) (since February 2009); Director or Trustee of various Morgan Stanley Funds (since August 2006); Chairperson of the Compliance and Insurance Committee (since October 2015); formerly, Chairperson of the Insurance Sub-Committee of the Compliance and Insurance Committee (2007-2015); served as President and Chief Executive Officer of the Nuclear Energy Institute (policy organization) (February 2005-November 2008); retired as Admiral, U.S. Navy after serving over 38 years on active duty including 8 years as Director of the Naval Nuclear Propulsion Program in the Department of the Navy and the U.S. Department of Energy (1996-2004); served as Chief of Naval Personnel (July 1994-September 1996) and on the Joint Staff as Director of Political Military Affairs (June 1992-July 1994); knighted as Honorary Knight Commander of the Most Excellent Order of the British Empire; awarded the Officier de l'Orde National du Mérite by the French Government; elected to the National Academy of Engineering (2009). | | | 82 | | | Director of BP p.l.c.; Director of Naval and Nuclear Technologies LLP; Director Emeritus of the Armed Services YMCA; Member of the National Security Advisory Council of the Center for U.S. Global Engagement and a member of the CNA Military Advisory Board; Trustee of Fairhaven United Methodist Church; Member of the Board of Advisors of the Dolphin Scholarship Foundation; and Director of other various non-profit organizations. | |
Kathleen A. Dennis (65)
c/o Perkins Coie LLP
Counsel to the Independent Directors
30 Rockefeller Plaza
New York, NY 10112 | | Director | | Since
August
2006 | | President, Cedarwood Associates (mutual fund and investment management consulting) (since July 2006); Chairperson of the Liquidity and Alternatives Sub-Committee of the Investment Committee (since October 2006) and Director or Trustee of various Morgan Stanley Funds (since August 2006); formerly, Senior Managing Director of Victory Capital Management (1993-2006). | | | 82 | | | Director of various non-profit organizations. | |
Nancy C. Everett (63)
c/o Perkins Coie LLP
Counsel to the Independent Directors
30 Rockefeller Plaza
New York, NY 10112 | | Director | | Since
January
2015 | | Chief Executive Officer, Virginia Commonwealth University Investment Company (since November 2015); Owner, OBIR, LLC (institutional investment management consulting) (since June 2014); formerly, Managing Director, BlackRock Inc. (February 2011-December 2013); and Chief Executive Officer, General Motors Asset Management (a/k/a Promark Global Advisors, Inc.) (June 2005-May 2010). | | | 83 | | | Formerly, Member of Virginia Commonwealth University School of Business Foundation (2005-2016); Member of Virginia Commonwealth University Board of Visitors (2013-2015); Member of Committee on Directors for Emerging Markets Growth Fund, Inc. (2007-2010); Chairperson of Performance Equity Management, LLC (2006-2010); and Chairperson, GMAM Absolute Return Strategies Fund, LLC (2006-2010). | |
31
Morgan Stanley Institutional Fund, Inc.
Annual Report — December 31, 2018
Director and Officer Information (unaudited) (cont'd)
Independent Directors: (cont'd)
Name, Age and Address of
Independent Director | | Position(s)
Held with
Registrant | | Length of Time
Served* | | Principal Occupation(s) During Past 5 Years
and Other Relevant Professional Experience | | Number of
Portfolios in
Fund Complex
Overseen by
Independent
Director** | | Other Directorships
Held by Independent
Director*** | |
Jakki L. Haussler (61)
c/o Perkins Coie LLP
Counsel to the Independent Directors
30 Rockefeller Plaza
New York, NY 10112 | | Director | | Since
January
2015 | | Chairman and Chief Executive Officer, Opus Capital Group (since January 1996); formerly, Director, Capvest Venture Fund, LP (May 2000-December 2011); Partner, Adena Ventures, LP (July 1999-December 2010); Director, The Victory Funds (February 2005-July 2008). | | | 83 | | | Director of Service Corporation International and Member, Audit Committee and Investment Committee; Director of Cincinnati Bell Inc. and Member, Audit Committee and Governance and Nominating Committee; Chairman of Northern Kentucky University Member Investment Committee; Member of Chase College of Law Transactional Law Practice Center Board of Advisors; Director of Best Transport; Director of Chase College of Law Board of Visitors; formerly, Member, University of Cincinnati Foundation Investment Committee; Member, Miami University Board of Visitors (2008-2011); Trustee of Victory Funds (2005-2008) and Chairman, Investment Committee (2007-2008) and Member, Service Provider Committee (2005-2008). | |
Dr. Manuel H. Johnson (69)
c/o Johnson Smick
International, Inc.
220 I Street, NE — Suite 200
Washington, D.C. 20002 | | Director | | Since
July
1991 | | Senior Partner, Johnson Smick International, Inc. (consulting firm); Chairperson of the Investment Committee (since October 2006) and Director or Trustee of various Morgan Stanley Funds (since July 1991); Co-Chairman and a founder of the Group of Seven Council (G7C) (international economic commission); formerly, Chairperson of the Audit Committee (July 1991-September 2006), Vice Chairman of the Board of Governors of the Federal Reserve System and Assistant Secretary of the U.S. Treasury. | | | 82 | | | Director of NVR, Inc. (home construction). | |
Joseph J. Kearns (76)
c/o Perkins Coie LLP
Counsel to the Independent Directors
30 Rockefeller Plaza
New York, NY 10112 | | Director | | Since
August
1994 | | Senior Adviser, Kearns & Associates LLC (investment consulting); Chairperson of the Audit Committee (since October 2006) and Director or Trustee of various Morgan Stanley Funds (since August 1994); formerly, Deputy Chairperson of the Audit Committee (July 2003-September 2006) and Chairperson of the Audit Committee of various Morgan Stanley Funds (since August 1994); CFO of the J. Paul Getty Trust. | | | 83 | | | Prior to August 10, 2016, Director of Electro Rent Corporation (equipment leasing); Prior to December 31, 2013, Director of The Ford Family Foundation. | |
32
Morgan Stanley Institutional Fund, Inc.
Annual Report — December 31, 2018
Director and Officer Information (unaudited) (cont'd)
Independent Directors: (cont'd)
Name, Age and Address of
Independent Director | | Position(s)
Held with
Registrant | | Length of Time
Served* | | Principal Occupation(s) During Past 5 Years
and Other Relevant Professional Experience | | Number of
Portfolios in
Fund Complex
Overseen by
Independent
Director** | | Other Directorships
Held by Independent
Director*** | |
Michael F. Klein (60)
c/o Perkins Coie LLP
Counsel to the Independent Directors
30 Rockefeller Plaza
New York, NY 10112 | | Director | | Since
August
2006 | | Managing Director, Aetos Alternatives Management, LP (since March 2000); Co-President, Aetos Alternatives Management, LP (since January 2004) and Co-Chief Executive Officer of Aetos Alternatives Management, LP (since August 2013); Chairperson of the Fixed Income
Sub-Committee of the Investment Committee (since October 2006) and Director or Trustee of various Morgan Stanley Funds (since August 2006); formerly, Managing Director, Morgan Stanley & Co. Inc. and Morgan Stanley Dean Witter Investment Management and President, various Morgan Stanley Funds (June 1998-March 2000); Principal, Morgan Stanley & Co. Inc. and Morgan Stanley Dean Witter Investment Management (August 1997-December 1999). | | | 82 | | | Director of certain investment funds managed or sponsored by Aetos Alternatives Management, LP; Director of Sanitized AG and Sanitized Marketing AG (specialty chemicals). | |
Patricia Maleski (58)
c/o Perkins Coie LLP
Counsel to the Independent Directors
30 Rockefeller Plaza
New York, NY 10112 | | Director | | Since
January
2017 | | Managing Director, JPMorgan Asset Management (2004-2016); Oversight and Control Head of Fiduciary and Conflicts of Interest Program (2015-2016); Chief Control Officer-Global Asset Management (2013-2015); President, JPMorgan Funds (2010-2013); Chief Administrative Officer (2004-2013); various other positions including Treasurer and Board Liaison (since 2001). | | | 83 | | | None. | |
Michael E. Nugent (82)
522 Fifth Avenue
New York, NY 10036 | | Chair of the Board and Director | | Chair of the Boards since July 2006 and Director since July 1991 | | Chair of the Boards of various Morgan Stanley Funds (since July 2006); Chairperson of the Closed-End Fund Committee (since June 2012) Governance Committee (since January 2019) and Director or Trustee of various Morgan Stanley Funds (since July 1991); formerly, Chairperson of the Insurance Committee (until July 2006); General Partner, Triumph Capital, L.P. (private investment partnership) (1988-2013). | | | 82 | | | None. | |
W. Allen Reed (71)
c/o Perkins Coie LLP
Counsel to the Independent Directors
30 Rockefeller Plaza
New York, NY 10112 | | Director | | Since
August
2006 | | Chairperson of the Equity Sub-Committee of the Investment Committee (since October 2006) and Director or Trustee of various Morgan Stanley Funds (since August 2006); formerly, President and CEO of General Motors Asset Management; Chairman and Chief Executive Officer of the GM Trust Bank and Corporate Vice President of General Motors Corporation (August 1994-December 2005). | | | 82 | | | Director of Legg Mason, Inc.; formerly, Director of the Auburn University Foundation (2010-2015). | |
Fergus Reid (86)****
c/o Joe Pietryka, Inc.
85 Charles Colman Blvd.
Pawling, NY 12564 | | Director | | Since
June
1992 | | Chairman, Joe Pietryka, Inc.; Chairperson of the Governance Committee and Director or Trustee of various Morgan Stanley Funds (since June 1992). | | | 83 | | | Formerly, Trustee and Director of certain investment companies in the JP Morgan Fund Complex managed by JP Morgan Investment Management Inc. (1987-2012). | |
* This is the earliest date the Director began serving the Morgan Stanley Funds. Each Director serves an indefinite term, until his or her successor is elected.
** The Fund Complex includes (as of December 31, 2018) all open-end and closed-end funds (including all of their portfolios) advised by Morgan Stanley Investment Management Inc. (the "Adviser") and any funds that have an adviser that is an affiliated person of the Adviser (including, but not limited to, Morgan Stanley AIP GP LP).
*** This includes any directorships at public companies and registered investment companies held by the Director at any time during the past five years.
**** Effective date of retirement is December 31, 2018.
33
Morgan Stanley Institutional Fund, Inc.
Annual Report — December 31, 2018
Director and Officer Information (unaudited) (cont'd)
Executive Officers:
Name, Age and Address of Executive Officer | | Position(s) Held
with
Registrant | | Length of Time
Served* | | Principal Occupation(s) During Past 5 Years | |
John H. Gernon (55)
522 Fifth Avenue
New York, NY 10036 | | President and Principal Executive Officer | | Since
September
2013 | | President and Principal Executive Officer of the Equity and Fixed Income Funds and the Morgan Stanley AIP Funds (since September 2013) and the Liquidity Funds and various money market funds (since May 2014) in the Fund Complex; Managing Director of the Adviser; Head of Product (since 2006). | |
Timothy J. Knierim (59)
522 Fifth Avenue
New York, NY 10036 | | Chief Compliance Officer | | Since
December
2016 | | Managing Director of the Adviser and various entities affiliated with the Adviser; Chief Compliance Officer of various Morgan Stanley Funds and the Adviser (since December 2016) and Chief Compliance Officer of Morgan Stanley AIP GP LP (since 2014). Formerly, Managing Director and Deputy Chief Compliance Officer of the Adviser (2014-2016); and formerly, Chief Compliance Officer of Prudential Investment Management, Inc. (2007-2014). | |
Francis J. Smith (53)
522 Fifth Avenue
New York, NY 10036 | | Treasurer and Principal Financial Officer | | Treasurer since July 2003 and Principal Financial Officer since September 2002 | | Managing Director of the Adviser and various entities affiliated with the Adviser; Treasurer (since July 2003) and Principal Financial Officer of various Morgan Stanley Funds (since September 2002). | |
Mary E. Mullin (51)
522 Fifth Avenue
New York, NY 10036 | | Secretary | | Since
June
1999 | | Managing Director of the Adviser; Secretary of various Morgan Stanley Funds (since June 1999). | |
Michael J. Key (39)
522 Fifth Avenue
New York, NY 10036 | | Vice President | | Since
June
2017 | | Vice President of the Equity and Fixed Income Funds, Liquidity Funds, various money market funds and the Morgan Stanley AIP Funds in the Fund Complex (since June 2017); Executive Director of the Adviser; Head of Product Development for Equity and Fixed Income Funds (since August 2013). | |
* This is the earliest date the officer began serving the Morgan Stanley Funds. Each officer serves a one-year term, until his or her successor is elected and qualifies.
34
Morgan Stanley Institutional Fund, Inc.
Annual Report — December 31, 2018
Adviser and Administrator
Morgan Stanley Investment Management Inc.
522 Fifth Avenue
New York, New York 10036
Distributor
Morgan Stanley Distribution, Inc.
522 Fifth Avenue
New York, New York 10036
Dividend Disbursing and Transfer Agent
DST Asset Manager Solutions, Inc.
2000 Crown Colony Drive
Quincy, Massachusetts 02169
Custodian
State Street Bank and Trust Company
One Lincoln Street
Boston, Massachusetts 02111
Legal Counsel
Dechert LLP
1095 Avenue of the Americas
New York, New York 10036
Counsel to the Independent Directors
Perkins Coie LLP
30 Rockefeller Plaza
New York, New York 10112
Independent Registered Public Accounting Firm
Ernst & Young LLP
200 Clarendon Street
Boston, Massachusetts 02116
Reporting to Shareholders
Each Morgan Stanley fund provides a complete schedule of portfolio holdings in its semi-annual and the annual reports within 60 days of the end of the fund's second and fourth fiscal quarters. The semi-annual and annual reports are filed electronically with the Securities and Exchange Commission ("SEC") on Form N-CSRS and Form N-CSR, respectively. Morgan Stanley also delivers the semi-annual and annual reports to fund shareholders and makes these reports available on its public website, www.morganstanley.com/im/shareholderreports. Each Morgan Stanley fund also files a complete schedule of portfolio holdings with the SEC for the fund's first and third fiscal quarters on Form N-Q. Morgan Stanley does not deliver the reports for the first and third fiscal quarters to shareholders, nor are the reports posted to the Morgan Stanley public website. You may, however, obtain the Form N-Q filings (as well as the Form N-CSR and N-CSRS filings) by accessing the SEC's website, www.sec.gov. You can also request copies of these materials, upon payment of a duplicating fee, by electronic request at the SEC's email address (publicinfo@sec.gov).
Proxy Voting Policies and Procedures and Proxy Voting Record
You may obtain a copy of the Company's Proxy Voting Policy and Procedures and information regarding how the Company voted proxies relating to portfolio securities during the most recent twelve-month period ended June 30, without charge, upon request, by calling toll free 1 (800) 548-7786 or by visiting our website at www.morganstanley.com/im/shareholderreports. This information is also available on the SEC's website at www.sec.gov.
This report is authorized for distribution only when preceded or accompanied by a prospectus or summary prospectus of the applicable Fund of Morgan Stanley Institutional Fund, Inc., which describes in detail the Fund's investment policies, risks, fees and expenses. Please read the prospectus carefully before you invest or send money. For additional information, including information regarding the investments comprising the Fund, please visit our website at www.morganstanley.com/im/shareholderreports or call toll free 1 (800) 548-7786.
35
Printed in U.S.A.
This Report has been prepared for shareholders and may be distributed to others only if preceded or accompanied by a current prospectus.
Morgan Stanley Investment Management Inc.
522 Fifth Avenue
New York, New York 10036
© 2019 Morgan Stanley. Morgan Stanley Distribution, Inc.

IFIGCPTSNN
2404127 EXP. 02.29.20

Morgan Stanley Institutional Fund, Inc.
Global Core Portfolio
Annual Report
December 31, 2018
Beginning on January 1, 2021, as permitted by regulations adopted by the Securities and Exchange Commission ("SEC"), paper copies of the Fund's Annual and Semi-Annual Reports to Shareholders ("Shareholder Reports") will no longer be sent by mail, unless you specifically request paper copies of the Shareholder Reports from the Fund or from your financial intermediary, such as a broker-dealer or a bank. Instead, the Shareholder Reports will be made available on the Fund's website, https://www.morganstanley.com/im/shareholderreports and you will be notified by mail each time a Shareholder Report is posted and provided with a website link to access the Shareholder Report. If you already elected to receive Shareholder Reports electronically, you will not be affected by this change and you need not take any action. You may elect to receive Shareholder Reports and other communications from the Fund electronically anytime by contacting your financial intermediary or, if you are a direct investor, please follow the instructions on the envelope.
Beginning on January 1, 2019, you may elect to receive all future Shareholder Reports in paper free of charge. If you invest through a financial intermediary, you can contact your financial intermediary to request that you continue to receive paper copies of your Shareholder Reports. If you invest directly with the Fund, please follow the instructions on the envelope to let the Fund know you wish to continue receiving paper copies of your Shareholder Reports. Your election to receive Shareholder Reports in paper will apply to all funds held in your account if you invest through your financial intermediary or all funds held with the fund complex if you invest directly with a fund.

Morgan Stanley Institutional Fund, Inc.
Annual Report — December 31, 2018
Shareholders' Letter | | | 2 | | |
Expense Example | | | 3 | | |
Investment Overview | | | 4 | | |
Portfolio of Investments | | | 7 | | |
Statement of Assets and Liabilities | | | 8 | | |
Statement of Operations | | | 9 | | |
Statements of Changes in Net Assets | | | 10 | | |
Financial Highlights | | | 12 | | |
Notes to Financial Statements | | | 16 | | |
Report of Independent Registered Public Accounting Firm | | | 21 | | |
Federal Tax Notice | | | 22 | | |
Privacy Notice | | | 23 | | |
Director and Officer Information | | | 26 | | |
This report is authorized for distribution only when preceded or accompanied by a prospectus or summary prospectus of the applicable Fund of Morgan Stanley Institutional Fund, Inc. To receive a prospectus and/or statement of additional information (SAI), which contains more complete information such as investment objectives, charges, expenses, policies for voting proxies, risk considerations and describes in detail each of the Fund's investment policies to the prospective investor, please call toll free 1 (800) 548-7786. Please read the prospectuses carefully before you invest or send money.
Additionally, you can access information about the Fund, including performance, characteristics and investment team commentary, through Morgan Stanley Investment Management's website: www.morganstanley.com/im/shareholderreports.
Market forecasts provided in this report may not necessarily come to pass. There is no guarantee that any sectors mentioned will continue to perform as discussed herein or that securities in such sectors will be held by the Fund in the future. There is no assurance that a fund will achieve its investment objective. Funds are subject to market risk, which is the possibility that market values of securities owned by the Fund will decline and, therefore, the value of the Fund's shares may be less than what you paid for them. Accordingly, you can lose money investing in this Fund. Please see the prospectus for more complete information on investment risks.
1
Morgan Stanley Institutional Fund, Inc.
Annual Report — December 31, 2018
Shareholders' Letter (unaudited)
Dear Shareholders,
We are pleased to provide this Annual report, in which you will learn how your investment in Global Core Portfolio (the "Fund") performed during the latest twelve-month period.
Morgan Stanley Investment Management is a client-centric, investor-led organization. Our global presence, intellectual capital, and breadth of products and services enable us to partner with investors to meet the evolving challenges of today's financial markets. We aim to deliver superior investment service and to empower our clients to make the informed decisions that help them reach their investment goals.
As always, we thank you for selecting Morgan Stanley Investment Management, and look forward to working with you in the months and years ahead.
Sincerely,

John H. Gernon
President and Principal Executive Officer
January 2019
2
Morgan Stanley Institutional Fund, Inc.
Annual Report — December 31, 2018
Expense Example (unaudited)
Global Core Portfolio
As a shareholder of the Fund, you incur two types of costs: (1) transactional costs; and (2) ongoing costs, which may include advisory fees, administration fees, distribution and shareholder services fees and other Fund expenses. This example is intended to help you understand your ongoing costs (in dollars) of investing in the Fund and to compare these costs with the ongoing costs of investing in other mutual funds.
This example is based on an investment of $1,000 invested at the beginning of the six-month period ended December 31, 2018 and held for the entire six-month period.
Actual Expenses
The table below provides information about actual account values and actual expenses. You may use the information in this table, together with the amount you invested, to estimate the expenses that you paid over the period. Simply divide your account value by $1,000 (for example, an $8,600 account value divided by $1,000 = 8.6), then multiply the result by the number in the table under the heading entitled "Actual Expenses Paid During Period" to estimate the expenses you paid on your account during this period.
Hypothetical Example for Comparison Purposes
The table below provides information about hypothetical account values and hypothetical expenses based on the Fund's actual expense ratio and an assumed rate of return of 5% per year before expenses, which is not the Fund's actual return. The hypothetical account values and expenses may not be used to estimate the actual ending account balance or expenses you paid for the period. You may use this information to compare the ongoing costs of investing in the Fund and other funds. To do so, compare this 5% hypothetical example with the 5% hypothetical examples that appear in the shareholder reports of the other funds.
Please note that the expenses shown in the table are meant to highlight your ongoing costs only and do not reflect any transactional costs, such as sales charges (loads). Therefore, the information for each class in the table is useful in comparing ongoing costs only, and will not help you determine the relative total costs of owning different funds. In addition, if these transactional costs were included, your costs would have been higher.
| | | Beginning
Account
Value
7/1/18 | | Actual Ending
Account
Value
12/31/18 | | Hypothetical
Ending Account
Value | | Actual
Expenses
Paid
During
Period* | | Hypothetical
Expenses Paid
During Period* | | Net
Expense
Ratio
During
Period** | |
Global Core Portfolio Class I | | $ | 1,000.00 | | | $ | 867.60 | | | $ | 1,020.11 | | | $ | 4.75 | | | $ | 5.14 | | | | 1.01 | % | |
Global Core Portfolio Class A | | | 1,000.00 | | | | 866.50 | | | | 1,018.40 | | | | 6.35 | | | | 6.87 | | | | 1.35 | | |
Global Core Portfolio Class C | | | 1,000.00 | | | | 863.00 | | | | 1,014.62 | | | | 9.86 | | | | 10.66 | | | | 2.10 | | |
Global Core Portfolio Class IS | | | 1,000.00 | | | | 867.50 | | | | 1,020.42 | | | | 4.47 | | | | 4.84 | | | | 0.95 | | |
* Expenses are calculated using each Fund Class' annualized net expense ratio (as disclosed), multiplied by the average account value over the period and multiplied by 184/365 (to reflect the most recent one-half year period).
** Annualized.
3
Morgan Stanley Institutional Fund, Inc.
Annual Report — December 31, 2018
Investment Overview (unaudited)
Global Core Portfolio
The Fund seeks long-term capital appreciation.
Performance
For the fiscal year ended December 31, 2018, the Fund's Class I shares had a total return based on net asset value and reinvestment of distributions per share of –16.15%, net of fees. The Fund's Class I shares underperformed the Fund's benchmark, the MSCI World Net Index (the "Index"), which returned –8.71%.
Factors Affecting Performance
• Investors should be aware that the challenging performance year from both an absolute and relative basis in 2018 followed a quite favorable year for the markets in 2017.
• The volatility of relative performance of style and sectors has been extreme in 2018. Growth rocketed until late summer and then got crushed thereafter. Defensives were very out-of-favor while growth worked, and then they were the big winners thereafter. While from a strategic perspective, the team made many of the right calls about these extremes reverting, the speed of these swings was difficult to navigate from a portfolio implementation perspective, at least initially. Our models have an imbedded lag before adjusting factor weightings. This allows us to confirm persistence for a potential style rotation. The lag resulted in a gap in performance relative to the benchmark. However, though a painful year on both an absolute and relative basis, we are seeing signs as we enter 2019 that our models have begun to lock in what is working.
• Early in the year, through the first correction in February, Global Core outperformed the MSCI World Net Index benchmark. The portfolio was overweight growth stocks, but the market's subsequent recovery was led by an extremely narrow group of mega-cap growth stocks, mostly the "FAANGs" (Facebook, Apple, Amazon, Netflix and Google). In spite of some exposure to those names, we were underweight versus a broader universe of growth exposures. Although that was correct positioning from a risk perspective, the lack of mega-cap tech exposure negatively impacted performance.
• By late summer, our quantitative models were signaling that the conditions underlying the significant outperformance of this group of mega-cap tech stocks, specifically that they were expensive and crowded — a dangerous combination, were setting up for a painful unwind. We further reduced exposure to technology, and this was a correct decision, as mega-cap tech stocks sold off significantly in the fourth quarter.
• At the time when momentum growth stocks were expensive, both bond proxy stocks (high dividend-yielding) and value stocks were inexpensive and much unloved. The team made the decision to increase weightings in both areas.
• From a bond proxy perspective, the fact that this group was so inexpensive, while the momentum bucket was expensive, was a warning sign for a more defensive positioning to Global Core. There was too much euphoria for "hot" stocks. The team increased exposure to both consumer staples and defensive health care names. This was another accurate call, as the market started to correct and the bond proxy stocks began to outperform.
• While increasing consumer staples was a decision that positively contributed to performance, the choice to not add uber-defensive positions in either utilities or telecommunications detracted. Traditionally, we are not buyers of these sectors because we believe they generally do not produce long-term winning stocks, which we seek to own. But with utilities being the best performing sector over the fourth quarter, the decision was very costly from a short-term performance perspective.
• In addition, the overreaction of financials and energy to recessionary fears made these value areas look attractive and we added to them. But, increasing financials and energy negatively impacted performance in the reporting period. However, these areas have started to improve as recessionary fears have receded.
• On a geographic basis, following the woeful underperformance of non-U.S. markets relative to the U.S. leading up to 2018, the team believed non-U.S. markets could see some reversion to the mean in 2018 and potentially outperform the U.S. for the year. However, this did not pan out, as once again,
4
Morgan Stanley Institutional Fund, Inc.
Annual Report — December 31, 2018
Investment Overview (unaudited) (cont'd)
Global Core Portfolio
the non-U.S. developed markets underperformed the U.S., and the higher allocation outside the U.S. negatively impacted the Fund.
• Early in the year, the team believed that emerging markets and Chinese technology stocks in particular were becoming extremely popular and expensive relative to their histories. The team therefore reduced exposure to Asia technology. While that was the right call, the magnitude of the declines in this region still caused a drag on performance despite our reduced weighting.
• We began rebuilding the position by late summer, when the investment process highlighted the area as an opportunity again. This decision initially hurt performance, as Chinese technology stocks continued to decline, but the trend reversed late in the year, affirming the decision to increase the weighting. Given the historically low valuation levels these stocks achieved, we believe this positioning can potentially continue to work well into 2019, particularly if we see some trade resolution.
• The Fund began the year with a higher weighting in Europe, but later increased defensiveness here along with the same defensive repositioning in the U.S. That was a correct call, given the ongoing challenges in the European region, especially regarding Brexit. The Fund maintained a small value weighting, as the low valuation levels is quite attractive and we believe European equities have been more fully pricing in a "bad Brexit" outcome than any sort of more positive agreement.
• The Fund's consistent underweight to Japan in 2018 was a positive contributor to performance. Not only do we struggle quantitatively to find factors that have persistence, but we also struggle to find specific stocks that persistently outperform. This poses a longer-term risk, and the team remained negative on the region.
• Within stock selection, the largest detractors for the period were a U.S. financial services company, a U.K.-based airline and a U.K.-based tobacco company that were both weighed down by issues surrounding Brexit, a China-based gaming and internet company, and a Spanish bank with significant exposure to Latin America.
• The Fund benefited the most from stock positions technology, most notably a U.S.-based global payments and technology company, a U.S.-based leader in cloud infrastructure and digital workspace technology, and a U.S.-based global manufacturer and marketer of mobile communications and media solutions. Other top contributors to performance for the period were a U.K.-based global alcoholic beverage company and a U.S.-based medical products manufacturer specializing in the dental industry.
Management Strategies
• There have been no changes to our investment process during the period. Applied Equity Advisors' investment process is comprised of two parts: a Factor Timing Engine and a Stock Selection Engine. The first step, the Factor Timing Engine, takes into account not only what market factors or areas of the market are in leadership, but also how much momentum a particular factor has, whether that factor is cheap or expensive, and whether the timing is right to be tilted toward that factor. The timing decision comes down to the team's judgment and our combined decades of experience in factor investing. The Stock Selection Engine begins its work once the desired factor positioning is understood. With regard to the Factor Timing Engine, investing in a particular area of the market that shows cheap historical valuation levels may not appear to be advantageous at first, but if chosen correctly, sticking with that investment often proves to be successful over the longer term. The result is a highly active portfolio of fundamentally attractive stocks which the team believes could benefit from what we have identified to be quantitative investment styles likely to outperform in each region.
5
Morgan Stanley Institutional Fund, Inc.
Annual Report — December 31, 2018
Investment Overview (unaudited) (cont'd)
Global Core Portfolio
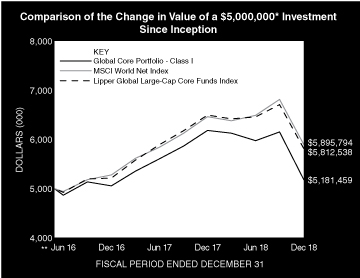
* Minimum Investment for Class I shares
** Commenced Operations on May 27, 2016.
In accordance with SEC regulations, the Fund's performance shown assumes that all recurring fees (including management fees) were deducted and all dividends and distributions were reinvested. The performance of Class A, C and IS shares will vary from the performance of Class I shares and will be negatively impacted by additional fees assessed to those classes (if applicable).
Performance Compared to the MSCI World Net Index(1) and the Lipper Global Large-Cap Core Funds Index(2)
| | | Period Ended December 31, 2018
Total Returns(3) | |
| | | | | Average Annual | |
| | | One
Year | | Five
Years | | Ten
Years | | Since
Inception(5) | |
Fund — Class I Shares
w/o sales charges(4) | | | –16.15 | % | | | — | | | | — | | | | 1.38 | % | |
Fund — Class A Shares
w/o sales charges(4) | | | –16.41 | | | | — | | | | — | | | | 1.02 | | |
Fund — Class A Shares with
maximum 5.25% sales charges(4) | | | –20.77 | | | | — | | | | — | | | | –1.04 | | |
Fund — Class C Shares
w/o sales charges(4) | | | –17.05 | | | | — | | | | — | | | | 0.27 | | |
Fund — Class C Shares with
maximum 1.00% deferred
sales charges(4) | | | –17.88 | | | | — | | | | — | | | | 0.27 | | |
Fund — Class IS Shares
w/o sales charges(4) | | | –16.10 | | | | — | | | | — | | | | 1.42 | | |
MSCI World Net Index | | | –8.71 | | | | — | | | | — | | | | 6.57 | | |
Lipper Global Large-Cap
Core Funds Index | | | –10.46 | | | | — | | | | — | | | | 5.98 | | |
Performance data quoted represents past performance, which is no guarantee of future results, and current performance may be lower or higher than the figures shown. Performance assumes that all dividends and distributions, if any, were reinvested. For the most recent month-end performance figures, please visit www.morganstanley.com/im/shareholderreports. Investment return and principal value will fluctuate so that Fund shares, when redeemed, may be worth more or less than their original cost. Total returns do not reflect the deduction of taxes that a shareholder would pay on Fund distributions or the redemption of Fund shares. Performance of share classes will vary due to difference in sales charges and expenses.
(1) The MSCI World Net Index is a free float-adjusted market capitalization weighted index designed to measure the equity market performance of developed markets. The term "free float" represents the portion of shares outstanding that are deemed to be available for purchase in the public equity markets by investors. The MSCI World Net Index currently consists of 23 developed market country indices. The performance of the Index is listed in US dollars and assumes reinvestment of net dividends. Net total return indices reinvest dividends after the deduction of withholding taxes, using (for international indices) a tax rate applicable to non-resident institutional investors who do not benefit from double taxation treaties. The Index is unmanaged and its returns do not include any sales charges or fees. Such costs would lower performance. It is not possible to invest directly in an index.
(2) The Lipper Global Large-Cap Core Funds Index is an equally weighted performance index of the largest qualifying funds (based on net assets) in the Lipper Global Large-Cap Core Funds classification. The Index, which is adjusted for capital gains distributions and income dividends, is unmanaged and should not be considered an investment. There are currently 10 funds represented in this Index. As of the date of this report, the Fund is in the Lipper Global Large-Cap Core Funds classification.
(3) Total returns for the Fund reflect fees waived and expenses reimbursed, if applicable, by Morgan Stanley Investment Management Inc. (the "Adviser"). Without such waivers and reimbursements, total returns would have been lower.
(4) Commenced operations on May 27, 2016.
(5) For comparative purposes, average annual since inception returns listed for the Indexes refer to the inception date of the Fund, not the inception of the Index.
6
Morgan Stanley Institutional Fund, Inc.
Annual Report — December 31, 2018
Portfolio of Investments
Global Core Portfolio
| | | Shares | | Value
(000) | |
Common Stocks (101.0%) | |
China (11.1%) | |
Alibaba Group Holding Ltd. ADR (a) | | | 2,759 | | | $ | 378 | | |
NetEase, Inc. ADR | | | 399 | | | | 94 | | |
TAL Education Group ADR (a) | | | 2,097 | | | | 56 | | |
Tencent Holdings Ltd. ADR | | | 13,046 | | | | 515 | | |
| | | | 1,043 | | |
France (3.2%) | |
LVMH Moet Hennessy Louis Vuitton SE | | | 1,019 | | | | 300 | | |
Ireland (3.4%) | |
Ryanair Holdings PLC ADR (a) | | | 4,517 | | | | 322 | | |
Japan (3.1%) | |
Nippon Telegraph & Telephone Corp. ADR | | | 7,053 | | | | 287 | | |
Netherlands (0.2%) | |
AerCap Holdings N.V. (a) | | | 561 | | | | 22 | | |
Panama (1.4%) | |
Copa Holdings SA, Class A | | | 1,704 | | | | 134 | | |
Spain (4.2%) | |
Banco Santander SA ADR | | | 86,919 | | | | 389 | | |
Switzerland (2.1%) | |
ABB Ltd. ADR | | | 2,601 | | | | 49 | | |
Logitech International SA (Registered) | | | 2,396 | | | | 75 | | |
UBS Group AG (Registered) (a) | | | 6,135 | | | | 76 | | |
| | | | 200 | | |
Taiwan (2.7%) | |
Taiwan Semiconductor Manufacturing Co., Ltd. ADR | | | 6,815 | | | | 252 | | |
United Kingdom (10.4%) | |
Diageo PLC ADR | | | 3,744 | | | | 531 | | |
Royal Dutch Shell PLC ADR | | | 7,658 | | | | 446 | | |
| | | | 977 | | |
United States (59.2%) | |
Alphabet, Inc., Class A (a) | | | 209 | | | | 218 | | |
Ameriprise Financial, Inc. | | | 1,712 | | | | 179 | | |
Amgen, Inc. | | | 211 | | | | 41 | | |
Apple, Inc. | | | 3,005 | | | | 474 | | |
Cigna Corp. (a) | | | 2,071 | | | | 393 | | |
Comcast Corp., Class A | | | 4,788 | | | | 163 | | |
Constellation Brands, Inc., Class A | | | 1,773 | | | | 285 | | |
CVS Health Corp. | | | 1,367 | | | | 90 | | |
Danaher Corp. | | | 2,889 | | | | 298 | | |
Diamondback Energy, Inc. | | | 1,008 | | | | 93 | | |
Emerson Electric Co. | | | 3,968 | | | | 237 | | |
Estee Lauder Cos., Inc. (The), Class A | | | 1,437 | | | | 187 | | |
Illinois Tool Works, Inc. | | | 1,675 | | | | 212 | | |
| | | Shares | | Value
(000) | |
JPMorgan Chase & Co. | | | 5,883 | | | $ | 574 | | |
Mastercard, Inc., Class A | | | 3,037 | | | | 573 | | |
McDonald's Corp. | | | 1,073 | | | | 191 | | |
Microsoft Corp. | | | 2,252 | | | | 229 | | |
Monster Beverage Corp. (a) | | | 948 | | | | 47 | | |
National Oilwell Varco, Inc. | | | 1,197 | | | | 31 | | |
Northern Trust Corp. | | | 4,380 | | | | 366 | | |
Northrop Grumman Corp. | | | 1,176 | | | | 288 | | |
Starbucks Corp. | | | 829 | | | | 53 | | |
Target Corp. | | | 827 | | | | 55 | | |
VMware, Inc., Class A | | | 1,971 | | | | 270 | | |
| | | | 5,547 | | |
Total Investments (101.0%) (Cost $8,979) (b)(c) | | | 9,473 | | |
Liabilities in Excess of Other Assets (–1.0%) | | | (94 | ) | |
Net Assets (100.0%) | | $ | 9,379 | | |
Country assignments and aggregations are based generally on third party vendor classifications and information, and may be different from the assignments and aggregations under the policies set forth in the Fund's prospectus and/or statement of additional information relating to geographic classifications.
(a) Non-income producing security.
(b) The approximate fair value and percentage of net assets, $300,000 and 3.2%, respectively, represent the securities that have been fair valued under the fair valuation policy for international investments as described in Note A-1 within the Notes to the Financial Statements.
(c) At December 31, 2018, the aggregate cost for federal income tax purposes is approximately $9,014,000. The aggregate gross unrealized appreciation is approximately $1,006,000 and the aggregate gross unrealized depreciation is approximately $547,000, resulting in net unrealized appreciation of approximately $459,000.
ADR American Depositary Receipt.
Portfolio Composition
Classification | | Percentage of
Total Investments | |
Other* | | | 37.5 | % | |
Banks | | | 10.2 | | |
Beverages | | | 9.1 | | |
Interactive Media & Services | | | 8.7 | | |
Capital Markets | | | 6.6 | | |
Information Technology Services | | | 6.0 | | |
Tech Hardware, Storage & Peripherals | | | 5.8 | | |
Oil, Gas & Consumable Fuels | | | 5.7 | | |
Software | | | 5.3 | | |
Health Care Providers & Services | | | 5.1 | | |
Total Investments | | | 100.0 | % | |
* Industries and/or investment types representing less than 5% of total investments.
The accompanying notes are an integral part of the financial statements.
7
Morgan Stanley Institutional Fund, Inc.
Annual Report — December 31, 2018
Statement of Assets and Liabilities | | December 31, 2018
(000) | |
Assets: | |
Investments in Securities of Unaffiliated Issuers, at Value (Cost $8,979) | | $ | 9,473 | | |
Cash | | | 18 | | |
Receivable for Investments Sold | | | 48 | | |
Due from Adviser | | | 41 | | |
Receivable for Fund Shares Sold | | | 9 | | |
Dividends Receivable | | | 5 | | |
Tax Reclaim Receivable | | | 1 | | |
Receivable from Affiliate | | | — | @ | |
Other Assets | | | 23 | | |
Total Assets | | | 9,618 | | |
Liabilities: | |
Payable for Fund Shares Redeemed | | | 164 | | |
Payable for Professional Fees | | | 60 | | |
Payable for Transfer Agency Fees — Class I | | | 1 | | |
Payable for Transfer Agency Fees — Class A | | | 1 | | |
Payable for Transfer Agency Fees — Class C | | | 1 | | |
Payable for Transfer Agency Fees — Class IS | | | — | @ | |
Payable for Shareholder Services Fees — Class A | | | — | @ | |
Payable for Distribution and Shareholder Services Fees — Class C | | | 1 | | |
Payable for Sub Transfer Agency Fees — Class I | | | 1 | | |
Payable for Sub Transfer Agency Fees — Class A | | | — | @ | |
Payable for Sub Transfer Agency Fees — Class C | | | — | @ | |
Payable for Custodian Fees | | | 1 | | |
Payable for Administration Fees | | | 1 | | |
Other Liabilities | | | 8 | | |
Total Liabilities | | | 239 | | |
Net Assets | | $ | 9,379 | | |
Net Assets Consist of: | |
Paid-in-Capital | | $ | 9,217 | | |
Total Distributable Earnings | | | 162 | | |
Net Assets | | $ | 9,379 | | |
CLASS I: | |
Net Assets | | $ | 6,738 | | |
| Shares Outstanding $0.001 par value shares of beneficial interest (unlimited shares authorized) (not in 000's) | | | 663,670 | | |
Net Asset Value, Offering and Redemption Price Per Share | | $ | 10.15 | | |
CLASS A: | |
Net Assets | | $ | 1,320 | | |
| Shares Outstanding $0.001 par value shares of beneficial interest (unlimited shares authorized) (not in 000's) | | | 130,080 | | |
Net Asset Value, Redemption Price Per Share | | $ | 10.15 | | |
Maximum Sales Load | | | 5.25 | % | |
Maximum Sales Charge | | $ | 0.56 | | |
Maximum Offering Price Per Share | | $ | 10.71 | | |
CLASS C: | |
Net Assets | | $ | 1,311 | | |
| Shares Outstanding $0.001 par value shares of beneficial interest (unlimited shares authorized) (not in 000's) | | | 130,850 | | |
Net Asset Value, Offering and Redemption Price Per Share | | $ | 10.02 | | |
CLASS IS: | |
Net Assets | | $ | 10 | | |
| Shares Outstanding $0.001 par value shares of beneficial interest (unlimited shares authorized) (not in 000's) | | | 1,000 | | |
Net Asset Value, Offering and Redemption Price Per Share | | $ | 10.15 | | |
@ Amount is less than $500.
The accompanying notes are an integral part of the financial statements.
8
Morgan Stanley Institutional Fund, Inc.
Annual Report — December 31, 2018
Statement of Operations | | Year Ended
December 31, 2018
(000) | |
Investment Income: | |
Dividends from Securities of Unaffiliated Issuers (Net of $14 of Foreign Taxes Withheld) | | $ | 252 | | |
Dividends from Security of Affiliated Issuer (Note G) | | | 2 | | |
Total Investment Income | | | 254 | | |
Expenses: | |
Professional Fees | | | 109 | | |
Advisory Fees (Note B) | | | 96 | | |
Registration Fees | | | 56 | | |
Shareholder Services Fees — Class A (Note D) | | | 5 | | |
Distribution and Shareholder Services Fees — Class C (Note D) | | | 14 | | |
Shareholder Reporting Fees | | | 16 | | |
Administration Fees (Note C) | | | 10 | | |
Transfer Agency Fees — Class I (Note E) | | | 2 | | |
Transfer Agency Fees — Class A (Note E) | | | 2 | | |
Transfer Agency Fees — Class C (Note E) | | | 2 | | |
Transfer Agency Fees — Class IS (Note E) | | | 2 | | |
Sub Transfer Agency Fees — Class I | | | 5 | | |
Sub Transfer Agency Fees — Class A | | | 1 | | |
Sub Transfer Agency Fees — Class C | | | 1 | | |
Custodian Fees (Note F) | | | 6 | | |
Directors' Fees and Expenses | | | 3 | | |
Pricing Fees | | | 3 | | |
Other Expenses | | | 18 | | |
Total Expenses | | | 351 | | |
Expenses Reimbursed by Adviser (Note B) | | | (98 | ) | |
Waiver of Advisory Fees (Note B) | | | (96 | ) | |
Reimbursement of Class Specific Expenses — Class I (Note B) | | | (2 | ) | |
Reimbursement of Class Specific Expenses — Class A (Note B) | | | (1 | ) | |
Reimbursement of Class Specific Expenses — Class C (Note B) | | | (1 | ) | |
Reimbursement of Class Specific Expenses — Class IS (Note B) | | | (2 | ) | |
Rebate from Morgan Stanley Affiliate (Note G) | | | (— | @) | |
Net Expenses | | | 151 | | |
Net Investment Income | | | 103 | | |
Realized Gain (Loss): | |
Investments Sold | | | 36 | | |
Foreign Currency Translation | | | (1 | ) | |
Net Realized Gain | | | 35 | | |
Change in Unrealized Appreciation (Depreciation): | |
Investments | | | (2,135 | ) | |
Net Realized Gain and Change in Unrealized Appreciation (Depreciation) | | | (2,100 | ) | |
Net Decrease in Net Assets Resulting from Operations | | $ | (1,997 | ) | |
@ Amount is less than $500.
The accompanying notes are an integral part of the financial statements.
9
Morgan Stanley Institutional Fund, Inc.
Annual Report — December 31, 2018
Statements of Changes in Net Assets | | Year Ended
December 31, 2018
(000) | | Year Ended
December 31, 2017
(000) | |
Increase (Decrease) in Net Assets: | |
Operations: | |
Net Investment Income | | $ | 103 | | | $ | 57 | | |
Net Realized Gain (Loss) | | | 35 | | | | (278 | ) | |
Net Change in Unrealized Appreciation (Depreciation) | | | (2,135 | ) | | | 2,493 | | |
Net Increase (Decrease) in Net Assets Resulting from Operations | | | (1,997 | ) | | | 2,272 | | |
Dividends and Distributions to Shareholders: | |
Class I | | | (54 | ) | | | (51 | )* | |
Class A | | | (4 | ) | | | (2 | )* | |
Class C | | | — | | | | (1 | )* | |
Class IS | | | — | @ | | | — | @* | |
Paid-in-Capital: | |
Class I | | | — | | | | (3 | ) | |
Class A | | | — | | | | (1 | ) | |
Class IS | | | — | | | | — | @ | |
Total Dividends and Distributions to Shareholders | | | (58 | ) | | | (58 | ) | |
Capital Share Transactions:(1) | |
Class I: | |
Subscribed | | | 743 | | | | 2,235 | | |
Distributions Reinvested | | | 15 | | | | 22 | | |
Redeemed | | | (2,928 | ) | | | (109 | ) | |
Class A: | |
Subscribed | | | 340 | | | | 652 | | |
Distributions Reinvested | | | 4 | | | | 3 | | |
Redeemed | | | (691 | ) | | | (233 | ) | |
Class C: | |
Subscribed | | | 422 | | | | 240 | | |
Distributions Reinvested | | | — | | | | 1 | | |
Redeemed | | | (89 | ) | | | (98 | ) | |
Net Increase (Decrease) in Net Assets Resulting from Capital Share Transactions | | | (2,184 | ) | | | 2,713 | | |
Total Increase (Decrease) in Net Assets | | | (4,239 | ) | | | 4,927 | | |
Net Assets: | |
Beginning of Period | | | 13,618 | | | | 8,691 | | |
End of Period | | $ | 9,379 | | | $ | 13,618 | † | |
The accompanying notes are an integral part of the financial statements.
10
Morgan Stanley Institutional Fund, Inc.
Annual Report — December 31, 2018
Statements of Changes in Net Assets (cont'd) | | Year Ended
December 31, 2018
(000) | | Year Ended
December 31, 2017
(000) | |
(1) Capital Share Transactions: | |
Class I: | |
Shares Subscribed | | $ | 60 | | | $ | 210 | | |
Shares Issued on Distributions Reinvested | | | 1 | | | | 2 | | |
Shares Redeemed | | | (250 | ) | | | (10 | ) | |
Net Increase (Decrease) in Class I Shares Outstanding | | | (189 | ) | | | 202 | | |
Class A: | |
Shares Subscribed | | | 29 | | | | 55 | | |
Shares Issued on Distributions Reinvested | | | — | @@ | | | — | @@ | |
Shares Redeemed | | | (60 | ) | | | (20 | ) | |
Net Increase (Decrease) in Class A Shares Outstanding | | | (31 | ) | | | 35 | | |
Class C: | |
Shares Subscribed | | | 36 | | | | 22 | | |
Shares Issued on Distributions Reinvested | | | — | | | | — | @@ | |
Shares Redeemed | | | (8 | ) | | | (9 | ) | |
Net Increase in Class C Shares Outstanding | | | 28 | | | | 13 | | |
The following information was previously reported in the December 31, 2017 financial statements. The distribution information for the year ended December 31, 2017 presented on the Statements of Changes in Net Assets is presented for comparative purposes to the December 31, 2018 financial statements, which conform to the SEC Final Rule on Disclosure Update and Simplification which was effective November 5, 2018.
* Distributions from and/or in Excess of Net Investment Income for the year ended December 31, 2017 were as follows:
Class I: | |
Net Investment Income | | $ | (51 | ) | |
Class A: | |
Net Investment Income | | $ | (2 | ) | |
Class C: | |
Net Investment Income | | $ | (1 | ) | |
Class IS: | |
Net Investment Income | | $ | (— | @) | |
† Distributions in Excess of Net Investment Income for the year ended December 31, 2017 was $(43).
@ Amount is less than $500.
@@ Amount is less than 500 shares.
The accompanying notes are an integral part of the financial statements.
11
Morgan Stanley Institutional Fund, Inc.
Annual Report — December 31, 2018
Financial Highlights
Global Core Portfolio
| | | Class I | |
| | | Year Ended December 31, | | Period from
May 27, 2016(1) to | |
Selected Per Share Data and Ratios | | 2018 | | 2017 | | December 31, 2016 | |
Net Asset Value, Beginning of Period | | $ | 12.20 | | | $ | 10.03 | | | $ | 10.00 | | |
Income (Loss) from Investment Operations: | |
Net Investment Income(2) | | | 0.12 | | | | 0.07 | | | | 0.05 | | |
Net Realized and Unrealized Gain (Loss) | | | (2.09 | ) | | | 2.16 | | | | 0.06 | | |
Total from Investment Operations | | | (1.97 | ) | | | 2.23 | | | | 0.11 | | |
Distributions from and/or in Excess of: | |
Net Investment Income | | | (0.08 | ) | | | (0.06 | ) | | | (0.08 | ) | |
Paid-in-Capital | | | — | | | | (0.00 | )(3) | | | — | | |
Total Distributions | | | (0.08 | ) | | | (0.06 | ) | | | (0.08 | ) | |
Net Asset Value, End of Period | | $ | 10.15 | | | $ | 12.20 | | | $ | 10.03 | | |
Total Return(4) | | | (16.15 | )% | | | 22.27 | % | | | 1.08 | %(7) | |
Ratios and Supplemental Data: | |
Net Assets, End of Period (Thousands) | | $ | 6,738 | | | $ | 10,398 | | | $ | 6,517 | | |
Ratio of Expenses to Average Net Assets(9) | | | 1.00 | %(5) | | | 0.97 | %(5) | | | 0.98 | %(5)(8) | |
Ratio of Net Investment Income to Average Net Assets(9) | | | 0.97 | %(5) | | | 0.64 | %(5) | | | 0.82 | %(5)(8) | |
Ratio of Rebate from Morgan Stanley Affiliates to Average Net Assets | | | 0.00 | %(6) | | | 0.00 | %(6) | | | 0.01 | %(8) | |
Portfolio Turnover Rate | | | 50 | % | | | 41 | % | | | 22 | %(7) | |
(9) Supplemental Information on the Ratios to Average Net Assets: | |
Ratios Before Expense Limitation: | |
Expenses to Average Net Assets | | | 2.53 | % | | | 2.89 | % | | | 3.73 | %(8) | |
Net Investment Loss to Average Net Assets | | | (0.56 | )% | | | (1.28 | )% | | | (1.93 | )%(8) | |
(1) Commencement of Operations.
(2) Per share amount is based on average shares outstanding.
(3) Amount is less than $0.005 per share.
(4) Calculated based on the net asset value as of the last business day of the period.
(5) The Ratios of Expenses and Net Investment Income reflect the rebate of certain Fund expenses in connection with the investments in Morgan Stanley affiliates during the period. The effect of the rebate on the ratios is disclosed in the above table as "Ratio of Rebate from Morgan Stanley Affiliates to Average Net Assets."
(6) Amount is less than 0.005%.
(7) Not annualized.
(8) Annualized.
The accompanying notes are an integral part of the financial statements.
12
Morgan Stanley Institutional Fund, Inc.
Annual Report — December 31, 2018
Financial Highlights
Global Core Portfolio
| | | Class A | |
| | | Year Ended December 31, | | Period from
May 27, 2016(1) to | |
Selected Per Share Data and Ratios | | 2018 | | 2017 | | December 31, 2016 | |
Net Asset Value, Beginning of Period | | $ | 12.18 | | | $ | 10.02 | | | $ | 10.00 | | |
Income (Loss) from Investment Operations: | |
Net Investment Income(2) | | | 0.07 | | | | 0.03 | | | | 0.02 | | |
Net Realized and Unrealized Gain (Loss) | | | (2.07 | ) | | | 2.15 | | | | 0.06 | | |
Total from Investment Operations | | | (2.00 | ) | | | 2.18 | | | | 0.08 | | |
Distributions from and/or in Excess of: | |
Net Investment Income | | | (0.03 | ) | | | (0.02 | ) | | | (0.06 | ) | |
Paid-in-Capital | | | — | | | | (0.00 | )(3) | | | — | | |
Total Distributions | | | (0.03 | ) | | | (0.02 | ) | | | (0.06 | ) | |
Net Asset Value, End of Period | | $ | 10.15 | | | $ | 12.18 | | | $ | 10.02 | | |
Total Return(4) | | | (16.41 | )% | | | 21.82 | % | | | 0.83 | %(7) | |
Ratios and Supplemental Data: | |
Net Assets, End of Period (Thousands) | | $ | 1,320 | | | $ | 1,962 | | | $ | 1,263 | | |
Ratio of Expenses to Average Net Assets(9) | | | 1.35 | %(5) | | | 1.35 | %(5) | | | 1.35 | %(5)(8) | |
Ratio of Net Investment Income to Average Net Assets(9) | | | 0.62 | %(5) | | | 0.25 | %(5) | | | 0.39 | %(5)(8) | |
Ratio of Rebate from Morgan Stanley Affiliates to Average Net Assets | | | 0.00 | %(6) | | | 0.00 | %(6) | | | 0.00 | %(6)(8) | |
Portfolio Turnover Rate | | | 50 | % | | | 41 | % | | | 22 | %(7) | |
(9) Supplemental Information on the Ratios to Average Net Assets: | |
Ratios Before Expense Limitation: | |
Expenses to Average Net Assets | | | 2.89 | % | | | 3.36 | % | | | 4.16 | %(8) | |
Net Investment Loss to Average Net Assets | | | (0.92 | )% | | | (1.76 | )% | | | (2.42 | )%(8) | |
(1) Commencement of Operations.
(2) Per share amount is based on average shares outstanding.
(3) Amount is less than $0.005 per share.
(4) Calculated based on the net asset value which does not reflect sales charges, if applicable, as of the last business day of the period.
(5) The Ratios of Expenses and Net Investment Income reflect the rebate of certain Fund expenses in connection with the investments in Morgan Stanley affiliates during the period. The effect of the rebate on the ratios is disclosed in the above table as "Ratio of Rebate from Morgan Stanley Affiliates to Average Net Assets."
(6) Amount is less than 0.005%.
(7) Not annualized.
(8) Annualized.
The accompanying notes are an integral part of the financial statements.
13
Morgan Stanley Institutional Fund, Inc.
Annual Report — December 31, 2018
Financial Highlights
Global Core Portfolio
| | | Class C | |
| | | Year Ended December 31, | | Period from
May 27, 2016(1) to | |
Selected Per Share Data and Ratios | | 2018 | | 2017 | | December 31, 2016 | |
Net Asset Value, Beginning of Period | | $ | 12.08 | | | $ | 10.00 | | | $ | 10.00 | | |
Income (Loss) from Investment Operations: | |
Net Investment Loss(2) | | | (0.01 | ) | | | (0.06 | ) | | | (0.02 | ) | |
Net Realized and Unrealized Gain (Loss) | | | (2.05 | ) | | | 2.15 | | | | 0.06 | | |
Total from Investment Operations | | | (2.06 | ) | | | 2.09 | | | | 0.04 | | |
Distributions from and/or in Excess of: | |
Net Investment Income | | | — | | | | (0.01 | ) | | | (0.04 | ) | |
Net Asset Value, End of Period | | $ | 10.02 | | | $ | 12.08 | | | $ | 10.00 | | |
Total Return(3) | | | (17.05 | )% | | | 20.92 | % | | | 0.41 | %(6) | |
Ratios and Supplemental Data: | |
Net Assets, End of Period (Thousands) | | $ | 1,311 | | | $ | 1,246 | | | $ | 901 | | |
Ratio of Expenses to Average Net Assets(8) | | | 2.10 | %(4) | | | 2.10 | %(4) | | | 2.10 | %(4)(7) | |
Ratio of Net Investment Loss to Average Net Assets(8) | | | (0.05 | )%(4) | | | (0.50 | )%(4) | | | (0.36 | )%(4)(7) | |
Ratio of Rebate from Morgan Stanley Affiliates to Average Net Assets | | | 0.00 | %(5) | | | 0.00 | %(5) | | | 0.00 | %(5)(7) | |
Portfolio Turnover Rate | | | 50 | % | | | 41 | % | | | 22 | %(6) | |
(8) Supplemental Information on the Ratios to Average Net Assets: | |
Ratios Before Expense Limitation: | |
Expenses to Average Net Assets | | | 3.65 | % | | | 4.19 | % | | | 5.02 | %(7) | |
Net Investment Loss to Average Net Assets | | | (1.60 | )% | | | (2.59 | )% | | | (3.28 | )%(7) | |
(1) Commencement of Operations.
(2) Per share amount is based on average shares outstanding.
(3) Calculated based on the net asset value which does not reflect sales charges, if applicable, as of the last business day of the period.
(4) The Ratios of Expenses and Net Investment Loss reflect the rebate of certain Fund expenses in connection with the investments in Morgan Stanley affiliates during the period. The effect of the rebate on the ratios is disclosed in the above table as "Ratio of Rebate from Morgan Stanley Affiliates to Average Net Assets."
(5) Amount is less than 0.005%.
(6) Not annualized.
(7) Annualized.
The accompanying notes are an integral part of the financial statements.
14
Morgan Stanley Institutional Fund, Inc.
Annual Report — December 31, 2018
Financial Highlights
Global Core Portfolio
| | | Class IS | |
| | | Year Ended December 31, | | Period from
May 27, 2016(1) to | |
Selected Per Share Data and Ratios | | 2018 | | 2017 | | December 31, 2016 | |
Net Asset Value, Beginning of Period | | $ | 12.20 | | | $ | 10.03 | | | $ | 10.00 | | |
Income (Loss) from Investment Operations: | |
Net Investment Income(2) | | | 0.13 | | | | 0.07 | | | | 0.05 | | |
Net Realized and Unrealized Gain (Loss) | | | (2.09 | ) | | | 2.17 | | | | 0.06 | | |
Total from Investment Operations | | | (1.96 | ) | | | 2.24 | | | | 0.11 | | |
Distributions from and/or in Excess of: | |
Net Investment Income | | | (0.09 | ) | | | (0.07 | ) | | | (0.08 | ) | |
Paid-in-Capital | | | — | | | | (0.00 | )(3) | | | — | | |
Total Distributions | | | (0.09 | ) | | | (0.07 | ) | | | (0.08 | ) | |
Net Asset Value, End of Period | | $ | 10.15 | | | $ | 12.20 | | | $ | 10.03 | | |
Total Return(4) | | | (16.10 | )% | | | 22.29 | % | | | 1.10 | %(7) | |
Ratios and Supplemental Data: | |
Net Assets, End of Period (Thousands) | | $ | 10 | | | $ | 12 | | | $ | 10 | | |
Ratio of Expenses to Average Net Assets(9) | | | 0.95 | %(5) | | | 0.95 | %(5) | | | 0.95 | %(5)(8) | |
Ratio of Net Investment Income to Average Net Assets(9) | | | 1.06 | %(5) | | | 0.66 | %(5) | | | 0.84 | %(5)(8) | |
Ratio of Rebate from Morgan Stanley Affiliates to Average Net Assets | | | 0.00 | %(6) | | | 0.00 | %(6) | | | 0.00 | %(6)(8) | |
Portfolio Turnover Rate | | | 50 | % | | | 41 | % | | | 22 | %(7) | |
(9) Supplemental Information on the Ratios to Average Net Assets: | |
Ratios Before Expense Limitation: | |
Expenses to Average Net Assets | | | 19.09 | % | | | 18.67 | % | | | 19.70 | %(8) | |
Net Investment Loss to Average Net Assets | | | (17.08 | )% | | | (17.06 | )% | | | (17.91 | )%(8) | |
(1) Commencement of Operations.
(2) Per share amount is based on average shares outstanding.
(3) Amount is less than $0.005 per share.
(4) Calculated based on the net asset value as of the last business day of the period.
(5) The Ratios of Expenses and Net Investment Income reflect the rebate of certain Fund expenses in connection with the investments in Morgan Stanley affiliates during the period. The effect of the rebate on the ratios is disclosed in the above table as "Ratio of Rebate from Morgan Stanley Affiliates to Average Net Assets."
(6) Amount is less than 0.005%.
(7) Not annualized.
(8) Annualized.
The accompanying notes are an integral part of the financial statements.
15
Morgan Stanley Institutional Fund, Inc.
Annual Report — December 31, 2018
Notes to Financial Statements
Morgan Stanley Institutional Fund, Inc. (the "Company") is registered under the Investment Company Act of 1940, as amended (the "Act"), as an open-end management investment company. The Company is comprised of thirty separate, active, diversified and non-diversified funds (individually referred to as a "Fund", collectively as the "Funds"). The Company applies investment company accounting and reporting guidance.
The accompanying financial statements relate to the Global Core Portfolio. The Fund seeks long-term capital appreciation.
The Fund offers four classes of shares — Class I, Class A, Class C and Class IS.
A. Significant Accounting Policies: The following significant accounting policies are in conformity with U.S. generally accepted accounting principles ("GAAP"). Such policies are consistently followed by the Company in the preparation of its financial statements. GAAP may require management to make estimates and assumptions that affect the reported amounts and disclosures in the financial statements. Actual results may differ from those estimates.
In August 2018, the Financial Accounting Standards Board ("FASB") issued Accounting Standards Update ("ASU") 2018-13, Fair Value Measurement (Topic 820) — Disclosures Framework — Changes to Disclosure Requirements of Fair Value Measurement ("ASU 2018-13") which introduces new fair value disclosure requirements as well as eliminates and modifies certain existing fair value disclosure requirements. ASU 2018-13 would be effective for fiscal years beginning after December 15, 2019 and for interim periods within those fiscal years; however, management has elected to early adopt ASU 2018-13 effective with the current reporting period as permitted by the standard. The impact of the Fund's adoption was limited to changes in the Fund's financial statement disclosures regarding fair value, primarily those disclosures related to transfers between levels of the fair value hierarchy and disclosure of the range and weighted average used to develop significant unobservable inputs for Level 3 fair value measurements, when applicable.
1. Security Valuation: (1) An equity portfolio security listed or traded on an exchange is valued at its latest reported sales price (or at the exchange official closing price if such exchange reports an official closing price), and if there were no sales on a given day and if there is no official exchange closing price for that day, the security is valued at the mean between the last reported bid and asked prices if such bid and asked prices are available on the relevant
exchanges. Listed equity securities not traded on the valuation date with no reported bid and asked prices available on the exchange are valued at the mean between the current bid and asked prices obtained from one or more reputable brokers or dealers. In cases where a security is traded on more than one exchange, the security is valued on the exchange designated as the primary market; (2) all other equity portfolio securities for which over-the-counter ("OTC") market quotations are readily available are valued at the latest reported sales price (or at the market official closing price if such market reports an official closing price), and if there was no trading in the security on a given day and if there is no official closing price from relevant markets for that day, the security is valued at the mean between the last reported bid and asked prices if such bid and asked prices are available on the relevant markets. An unlisted equity security that does not trade on the valuation date and for which bid and asked prices from the relevant markets are unavailable is valued at the mean between the current bid and asked prices obtained from one or more reputable brokers or dealers; (3) certain portfolio securities may be valued by an outside pricing service/vendor approved by the Company's Board of Directors (the "Directors"). The pricing service/vendor may employ a pricing model that takes into account, among other things, bids, yield spreads and/or other market data and specific security characteristics. Alternatively, if a valuation is not available from an outside pricing service/vendor, and the security trades on an exchange, the security may be valued at its latest reported sale price (or at the exchange official closing price if such exchange reports an official closing price), prior to the time when assets are valued. If there are no sales on a given day and if there is no official exchange closing price for that day, the security is valued at the mean between the last reported bid and asked prices if such bid and asked prices are available in the relevant exchanges; (4) when market quotations are not readily available, including circumstances under which Morgan Stanley Investment Management Inc. (the "Adviser") determines that the closing price, last sale price or the mean between the last reported bid and asked prices are not reflective of a security's market value, portfolio securities are valued at their fair value as determined in good faith under procedures established by and under the general supervision of the Directors. Occasionally, developments affecting the closing prices of securities and other assets may occur between the times at which valuations of
16
Morgan Stanley Institutional Fund, Inc.
Annual Report — December 31, 2018
Notes to Financial Statements (cont'd)
such securities are determined (that is, close of the foreign market on which the securities trade) and the close of business of the New York Stock Exchange ("NYSE"). If developments occur during such periods that are expected to materially affect the value of such securities, such valuations may be adjusted to reflect the estimated fair value of such securities as of the close of the NYSE, as determined in good faith by the Directors or by the Adviser using a pricing service and/or procedures approved by the Directors; and (5) investments in mutual funds, including the Morgan Stanley Institutional Liquidity Funds, are valued at the net asset value ("NAV") as of the close of each business day.
The Directors have responsibility for determining in good faith the fair value of the investments, and the Directors may appoint others, such as the Company's Adviser or a valuation committee, to assist the Directors in determining fair value and to make the actual calculations pursuant to the fair valuation methodologies previously approved by the Directors. Under procedures approved by the Directors, the Company's Adviser has formed a Valuation Committee whose members are approved by the Directors. The Valuation Committee provides administration and oversight of the Company's valuation policies and procedures, which are reviewed at least annually by the Directors. These procedures allow the Company to utilize independent pricing services, quotations from securities and financial instrument dealers and other market sources to determine fair value.
2. Fair Value Measurement: FASB Accounting Standards CodificationTM ("ASC") 820, "Fair Value Measurement" ("ASC 820"), defines fair value as the value that the Fund would receive to sell an investment or pay to transfer a liability in a timely transaction with an independent buyer in the principal market, or in the absence of a principal market, the most advantageous market for the investment or liability. ASC 820 establishes a three-tier hierarchy to distinguish between (1) inputs that reflect the assumptions market participants would use in valuing an asset or liability developed based on market data obtained from sources independent of the reporting entity (observable inputs) and (2) inputs that reflect the reporting entity's own assumptions about the assumptions market participants would use in valuing an asset or liability developed based on the best information available in the circumstances (unobservable inputs) and to establish
classification of fair value measurements for disclosure purposes. Various inputs are used in determining the value of the Fund's investments. The inputs are summarized in the three broad levels listed below:
• Level 1 – unadjusted quoted prices in active markets for identical investments
• Level 2 – other significant observable inputs (including quoted prices for similar investments, interest rates, prepayment speeds, credit risk, etc.)
• Level 3 – significant unobservable inputs including the Fund's own assumptions in determining the fair value of investments. Factors considered in making this determination may include, but are not limited to, information obtained by contacting the issuer, analysts, or the appropriate stock exchange (for exchange-traded securities), analysis of the issuer's financial statements or other available documents and, if necessary, available information concerning other securities in similar circumstances
The inputs or methodology used for valuing securities are not necessarily an indication of the risk associated with investing in those securities and the determination of the significance of a particular input to the fair value measurement in its entirety requires judgment and considers factors specific to each security.
The following is a summary of the inputs used to value the Fund's investments as of December 31, 2018:
Investment Type | | Level 1
Unadjusted
quoted
prices
(000) | | Level 2
Other
significant
observable
inputs
(000) | | Level 3
Significant
unobservable
inputs
(000) | | Total
(000) | |
Assets: | |
Common Stocks | |
Aerospace & Defense | | $ | 288 | | | $ | — | | | $ | — | | | $ | 288 | | |
Airlines | | | 456 | | | | — | | | | — | | | | 456 | | |
Banks | | | 963 | | | | — | | | | — | | | | 963 | | |
Beverages | | | 863 | | | | — | | | | — | | | | 863 | | |
Biotechnology | | | 41 | | | | — | | | | — | | | | 41 | | |
Capital Markets | | | 621 | | | | — | | | | — | | | | 621 | | |
Diversified Consumer
Services | | | 56 | | | | — | | | | — | | | | 56 | | |
Diversified
Telecommunication
Services | | | 287 | | | | — | | | | — | | | | 287 | | |
Electrical Equipment | | | 286 | | | | — | | | | — | | | | 286 | | |
Energy Equipment &
Services | | | 31 | | | | — | | | | — | | | | 31 | | |
17
Morgan Stanley Institutional Fund, Inc.
Annual Report — December 31, 2018
Notes to Financial Statements (cont'd)
Investment Type | | Level 1
Unadjusted
quoted
prices
(000) | | Level 2
Other
significant
observable
inputs
(000) | | Level 3
Significant
unobservable
inputs
(000) | | Total
(000) | |
Common Stocks (cont'd) | |
Health Care Equipment &
Supplies | | $ | 298 | | | $ | — | | | $ | — | | | $ | 298 | | |
Health Care Providers &
Services | | | 483 | | | | — | | | | — | | | | 483 | | |
Hotels, Restaurants &
Leisure | | | 244 | | | | — | | | | — | | | | 244 | | |
Information Technology
Services | | | 573 | | | | — | | | | — | | | | 573 | | |
Interactive Media &
Services | | | 827 | | | | — | | | | — | | | | 827 | | |
Internet & Direct Marketing
Retail | | | 378 | | | | — | | | | — | | | | 378 | | |
Machinery | | | 212 | | | | — | | | | — | | | | 212 | | |
Media | | | 163 | | | | — | | | | — | | | | 163 | | |
Multi-Line Retail | | | 55 | | | | — | | | | — | | | | 55 | | |
Oil, Gas & Consumable
Fuels | | | 539 | | | | — | | | | — | | | | 539 | | |
Personal Products | | | 187 | | | | — | | | | — | | | | 187 | | |
Semiconductors &
Semiconductor
Equipment | | | 252 | | | | — | | | | — | | | | 252 | | |
Software | | | 499 | | | | — | | | | — | | | | 499 | | |
Tech Hardware, Storage &
Peripherals | | | 549 | | | | — | | | | — | | | | 549 | | |
Textiles, Apparel & Luxury
Goods | | | — | | | | 300 | | | | — | | | | 300 | | |
Trading Companies &
Distributors | | | 22 | | | | — | | | | — | | | | 22 | | |
Total Common Stocks | | | 9,173 | | | | 300 | | | | — | | | | 9,473 | | |
Total Assets | | $ | 9,173 | | | $ | 300 | | | $ | — | | | $ | 9,473 | | |
Transfers between investment levels may occur as the markets fluctuate and/or the availability of data used in an investment's valuation changes.
3. Indemnifications: The Company enters into contracts that contain a variety of indemnifications. The Company's maximum exposure under these arrangements is unknown. However, the Company has not had prior claims or losses pursuant to these contracts and expects the risk of loss to be remote.
4. Dividends and Distributions to Shareholders: Dividends and distributions to shareholders are recorded on the ex-dividend date. Dividends from net investment income, if any, are declared and paid annually. Net realized capital gains, if any, are distributed at least annually.
5. Security Transactions, Income and Expenses: Security transactions are accounted for on the trade date (date the order to buy or sell is executed). Realized gains and losses on the sale of investment securities are determined on the specific identified cost method. Dividend
income and other distributions are recorded on the ex-dividend date (except for certain foreign dividends which may be recorded as soon as the Fund is informed of such dividends) net of applicable withholding taxes. Interest income is recognized on the accrual basis except where collection is in doubt. Discounts are accreted and premiums are amortized over the life of the respective securities. Most expenses of the Company can be directly attributed to a particular Fund. Expenses which cannot be directly attributed are apportioned among the Funds based upon relative net assets or other appropriate methods. Income, expenses (other than class specific expenses — distribution and shareholder services, transfer agency and sub transfer agency fees) and realized and unrealized gains or losses are allocated to each class of shares based upon their relative net assets.
B. Advisory Fees: The Adviser, a wholly-owned subsidiary of Morgan Stanley, provides the Fund with advisory services under the terms of an Investment Advisory Agreement, paid quarterly, at the annual rate based on the daily net assets as follows:
First $750
million | | Next $750
million | | Over $1.5
billion | |
| | 0.75 | % | | | 0.70 | % | | | 0.65 | % | |
For the year ended December 31, 2018, the advisory fee rate (net of waiver/rebate) was equivalent to an annual effective rate of 0.00% of the Fund's average daily net assets.
The Adviser has agreed to reduce its advisory fee and/or reimburse the Fund so that total annual portfolio operating expenses, excluding certain investment related expenses, taxes, interest and other extraordinary expenses (including litigation), will not exceed 1.00% for Class I shares, 1.35% for Class A shares, 2.10% for Class C shares and 0.95% for Class IS shares. The fee waivers and/or expense reimbursements will continue for at least one year from the date of the Fund's prospectus or until such time as the Directors act to discontinue all or a portion of such waivers and/or reimbursements when they deem such action is appropriate. For the year ended December 31, 2018, approximately $96,000 of advisory fees were waived and approximately $104,000 of other expenses were reimbursed by the Adviser pursuant to this arrangement.
C. Administration Fees: The Adviser also serves as Administrator to the Company and provides administrative services pursuant to an Administration Agreement for an annual fee, accrued daily and paid monthly, of 0.08% of the Fund's average daily net assets.
18
Morgan Stanley Institutional Fund, Inc.
Annual Report — December 31, 2018
Notes to Financial Statements (cont'd)
Under a Sub-Administration Agreement between the Administrator and State Street Bank and Trust Company ("State Street"), State Street provides certain administrative services to the Company. For such services, the Administrator pays State Street a portion of the fee the Administrator receives from the Fund.
D. Distribution and Shareholder Services Fees: Morgan Stanley Distribution, Inc. ("MSDI" or the "Distributor"), a wholly-owned subsidiary of the Adviser and an indirect subsidiary of Morgan Stanley, serves as the Company's Distributor of Fund shares pursuant to a Distribution Agreement. The Company has adopted a Shareholder Services Plan with respect to Class A shares pursuant to Rule 12b-1 under the Act. Under the Shareholder Services Plan, the Fund pays the Distributor a shareholder services fee, accrued daily and paid monthly, at an annual rate of 0.25% of the Fund's average daily net assets attributable to Class A shares.
The Company has adopted a Distribution and Shareholder Services Plan with respect to Class C shares pursuant to Rule 12b-1 under the Act. Under the Distribution and Shareholder Services Plan, the Fund pays the Distributor a distribution fee, accrued daily and paid monthly, at an annual rate of 0.75% and a shareholder services fee, accrued daily and paid monthly, at an annual rate of 0.25% of the Fund's average daily net assets attributable to Class C shares.
The distribution and shareholder services fees are used to support the expenses associated with servicing and maintaining accounts. The Distributor may compensate other parties for providing shareholder support services to investors who purchase Class A and Class C shares.
E. Dividend Disbursing and Transfer Agent: The Company's dividend disbursing and transfer agent is DST Asset Manager Solutions, Inc. ("DST"). Pursuant to a Transfer Agency Agreement, the Company pays DST a fee based on the number of classes, accounts and transactions relating to the Funds of the Company.
F. Custodian Fees: State Street (the "Custodian") also serves as Custodian for the Company in accordance with a Custodian Agreement. The Custodian holds cash, securities and other assets of the Company as required by the Act. Custody fees are payable monthly based on assets held in custody, investment purchases and sales activity and account maintenance fees, plus reimbursement for certain out-of-pocket expenses.
G. Security Transactions and Transactions with Affiliates: For the year ended December 31, 2018, purchases and sales of investment securities for the Fund, other than long-term U.S. Government securities and short-term investments were approximately $6,317,000 and $8,131,000, respectively. There were no purchases and sales of long-term U.S. Government securities for the year ended December 31, 2018.
The Fund invests in the Institutional Class of the Morgan Stanley Institutional Liquidity Funds — Treasury Securities Portfolio (the "Liquidity Funds"), an open-end management investment company managed by the Adviser. Advisory fees paid by the Fund are reduced by an amount equal to its pro-rata share of the advisory and administration fees paid by the Fund due to its investment in the Liquidity Funds. For the year ended December 31, 2018, advisory fees paid were reduced by less than $500 relating to the Fund's investment in the Liquidity Funds.
A summary of the Fund's transactions in shares of affiliated investments during the year ended December 31, 2018 is as follows:
Affiliated
Investment
Company | | Value
December 31,
2017
(000) | | Purchases
at Cost
(000) | | Proceeds
from Sales
(000) | | Dividend
Income
(000) | |
Liquidity Funds | | $ | 524 | | | $ | 2,011 | | | $ | 2,535 | | | $ | 2 | | |
Affiliated
Investment
Company (cont'd) | | Realized
Gain (Loss)
(000) | | Change in
Unrealized
Appreciation
(Depreciation)
(000) | | Value
December 31,
2018
(000) | |
Liquidity Funds | | $ | — | | | $ | — | | | $ | — | | |
The Fund is permitted to purchase and sell securities ("cross-trade") from and to other Morgan Stanley funds as well as other funds and client accounts for which the Adviser or an affiliate of the Adviser serves as investment adviser, pursuant to procedures approved by the Directors in compliance with Rule 17a-7 under the Act (the "Rule"). Each cross-trade is executed at the current market price in compliance with provisions of the Rule. For the year ended December 31, 2018, the Fund did not engage in any cross-trade transactions.
The Fund has an unfunded Deferred Compensation Plan (the "Compensation Plan"), which allows each independent Director to defer payment of all, or a portion, of the fees he or she receives for serving on the Board of Directors. Each eligible Director generally may elect to have the deferred amounts credited with a return equal to the total return on one or more of the Morgan Stanley funds that are offered as investment options under the Compensation Plan. Appreciation/depreciation and distributions received from these investments are recorded
19
Morgan Stanley Institutional Fund, Inc.
Annual Report — December 31, 2018
Notes to Financial Statements (cont'd)
with an offsetting increase/decrease in the deferred compensation obligation and do not affect the NAV of the Fund.
H. Federal Income Taxes: It is the Fund's intention to continue to qualify as a regulated investment company and distribute all of its taxable and tax-exempt income. Accordingly, no provision for federal income taxes is required in the financial statements.
The Fund may be subject to taxes imposed by countries in which it invests. Such taxes are generally based on income and/or capital gains earned or repatriated. Taxes are accrued based on net investment income, net realized gains and net unrealized appreciation as such income and/or gains are earned. Taxes may also be based on transactions in foreign currency and are accrued based on the value of investments denominated in such currency.
FASB ASC 740-10, "Income Taxes — Overall", sets forth a minimum threshold for financial statement recognition of the benefit of a tax position taken or expected to be taken in a tax return. Management has concluded there are no significant uncertain tax positions that would require recognition in the financial statements. If applicable, the Fund recognizes interest accrued related to unrecognized tax benefits in "Interest Expense" and penalties in "Other Expenses" in the Statement of Operations. The Fund files tax returns with the U.S. Internal Revenue Service, New York and various states. Generally, each of the tax years in the four-year period ended December 31, 2018 remains subject to examination by taxing authorities.
The tax character of distributions paid may differ from the character of distributions shown for GAAP purposes due to short-term capital gains being treated as ordinary income for tax purposes. The tax character of distributions paid during fiscal years 2018 and 2017 was as follows:
2018
Distributions
Paid From: | | 2017
Distributions
Paid From: | |
Ordinary
Income
(000) | | Long-Term
Capital Gain
(000) | | Ordinary
Income
(000) | | Paid-in-
Capital
(000) | |
| $ | 58 | | | $ | — | | | $ | 54 | | | $ | 4 | | |
The amount and character of income and gains to be distributed are determined in accordance with income tax regulations which may differ from GAAP. These book/tax differences are either considered temporary or permanent in nature.
Temporary differences are attributable to differing book and tax treatments for the timing of the recognition of gains
(losses) on certain investment transactions and the timing of the deductibility of certain expenses.
The Fund had no permanent differences causing reclassifications among the components of net assets for the year ended December 31, 2018.
At December 31, 2018, the components of distributable earnings for the Fund on a tax basis were as follows:
Undistributed
Ordinary
Income
(000) | | Undistributed
Long-Term
Capital Gain
(000) | |
| $ | 40 | | | $ | — | | |
At December 31, 2018, the Fund had available for federal income tax purposes unused short-term capital losses of approximately $298,000 that do not have an expiration date.
To the extent that capital loss carryforwards are used to offset any future capital gains realized, no capital gains tax liability will be incurred by the Fund for gains realized and not distributed. To the extent that capital gains are offset, such gains will not be distributed to the shareholders. During the year ended December 31, 2018, the Fund utilized capital loss carryforwards for U.S. federal income tax purposes of approximately $71,000.
I. Credit Facility: The Company and other Morgan Stanley funds participated in a $150,000,000 committed, unsecured revolving line of credit facility (the "Facility") with State Street. This Facility is to be used for temporary emergency purposes or funding of shareholder redemption requests. The interest rate on borrowings is based on the federal funds rate or 1 month LIBOR rate plus a spread. The Facility also has a commitment fee of 0.25% per annum based on the unused portion of the Facility. During the year ended December 31, 2018, the Fund did not have any borrowings under the Facility.
J. Other: At December 31, 2018, the Fund had record owners of 10% or greater. Investment activities of these shareholders could have a material impact on the Fund. The aggregate percentage of such owners was 44.5%.
20
Morgan Stanley Institutional Fund, Inc.
Annual Report — December 31, 2018
Report of Independent Registered Public Accounting Firm
To the Shareholders and Board of Directors of
Morgan Stanley Institutional Fund, Inc. —
Global Core Portfolio
Opinion on the Financial Statements
We have audited the accompanying statement of assets and liabilities of Global Core Portfolio (the "Fund") (one of the funds constituting the Morgan Stanley Institutional Fund, Inc. (the "Company")), including the portfolio of investments, as of December 31, 2018, and the related statement of operations for the year then ended, the statements of changes in net assets for each of the two years in the period then ended and the financial highlights for each of the two years in the period then ended and the period from May 27, 2016 (commencement of operations) through December 31, 2016 and the related notes (collectively referred to as the "financial statements"). In our opinion, the financial statements present fairly, in all material respects, the financial position of Global Core Portfolio (one of the funds constituting Morgan Stanley Institutional Fund, Inc.) at December 31, 2018, the results of its operations for the year then ended, the changes in its net assets for each of the two years in the period then ended, its financial highlights for each of the two years in the period then ended and the period from May 27, 2016 (commencement of operations) through December 31, 2016, in conformity with U.S. generally accepted accounting principles.
Basis for Opinion
These financial statements are the responsibility of the Company's management. Our responsibility is to express an opinion on the Fund's financial statements based on our audits. We are a public accounting firm registered with the Public Company Accounting Oversight Board (United States) ("PCAOB") and are required to be independent with respect to the Company in accordance with the U.S. federal securities law and the applicable rules and regulations of the Securities and Exchange Commission and the PCAOB.
We conducted our audits in accordance with the standards of the PCAOB. Those standards require that we plan and perform the audit to obtain reasonable assurance about whether the financial statements are free of material misstatement, whether due to error or fraud. The Company is not required to have, nor were we engaged to perform, an audit of the Company's internal control over financial reporting. As part of our audits, we are required to obtain an understanding of internal control over financial reporting, but not for the purpose of expressing an opinion on the effectiveness of the Company's internal control over financial reporting. Accordingly, we express no such opinion.
Our audits included performing procedures to assess the risks of material misstatement of the financial statements, whether due to error or fraud, and performing procedures that respond to those risks. Such procedures included examining, on a test basis, evidence regarding the amounts and disclosures in the financial statements. Our procedures included confirmation of securities owned as of December 31, 2018 by correspondence with the custodian and others or by other appropriate auditing procedures where replies from others were not received. Our audits also included evaluating the accounting principles used and significant estimates made by management, as well as evaluating the overall presentation of the financial statements. We believe that our audits provide a reasonable basis for our opinion.

We have served as the auditor of one or more Morgan Stanley investment companies since 2000.
Boston, Massachusetts
February 26, 2019
21
Morgan Stanley Institutional Fund, Inc.
Annual Report — December 31, 2018
Federal Tax Notice (unaudited)
For federal income tax purposes, the following information is furnished with respect to the distributions paid by the Fund during its taxable year ended December 31, 2018. For corporate shareholders 100% of the dividends qualified for the dividends received deduction.
For federal income tax purposes, the following information is furnished with respect to the Fund's earnings for its taxable year ended December 31, 2018. When distributed, certain earnings may be subject to a maximum tax rate of 15% as provided for by the Jobs and Growth Tax Relief Reconciliation Act of 2003. The Fund designated up to a maximum of approximately $58,000 as taxable at this lower rate.
In January, the Fund provides tax information to shareholders for the preceding calendar year.
22
Morgan Stanley Institutional Fund, Inc.
Annual Report — December 31, 2018
Privacy Notice (unaudited)
MORGAN STANLEY INVESTMENT MANAGEMENT INC.
AN IMPORTANT NOTICE CONCERNING OUR U.S. PRIVACY POLICY
We are required by federal law to provide you with a copy of our privacy policy annually. This policy applies to current and former individual investors in funds managed or sponsored by Morgan Stanley Investment Management Inc. ("MSIM") as well as current and former individual clients of MSIM. This policy is not applicable to partnerships, corporations, trusts or other non-individual clients or investors. Please note that we may amend this policy at any time, and will inform you of any changes as required by law.
WE RESPECT YOUR PRIVACY
We appreciate that you have provided us with your personal financial information. We strive to maintain the privacy of such information while we help you achieve your financial objectives. This Notice describes what non-public personal information we collect about you, why we collect it, when we may share it with others and how certain others may use it. It discusses the steps you may take to limit our sharing of certain information about you to affiliated companies in the Morgan Stanley family of companies ("other Morgan Stanley companies"). It also discloses how you may limit use of certain shared information for marketing purposes by other Morgan Stanley branded companies. Throughout this policy, we refer to the non-public information that personally identifies you or your accounts as "personal information.''
1. WHAT PERSONAL INFORMATION DO WE COLLECT ABOUT YOU?
We obtain personal information from applications and other forms you submit to us, from your dealings with us, from consumer reporting agencies, from our Web sites and from third parties and other sources.
For example:
• We may collect information such as your name, address, e-mail address, telephone/fax numbers, assets, income and investment objectives through subscription documents, applications and other forms you submit to us.
• We may obtain information about account balances, your use of account(s) and the types of products and services you prefer to receive from us through your dealings and transactions with us and other sources.
• We may obtain information about your creditworthiness and credit history from consumer reporting agencies.
• We may collect background information from and through third-party vendors to verify representations you have made and to comply with various regulatory requirements.
• If you interact with us through our public and private Web sites, we may collect information that you provide directly through online communications (such as an e-mail address). We may also collect information about your Internet service provider, your domain name, your computer's operating system and Web browser, your use of our Web sites and your product and service preferences, through the use of "cookies." Please consult the Terms of Use of these sites for more details.
2. WHEN DO WE DISCLOSE PERSONAL INFORMATION WE COLLECT ABOUT YOU?
We may disclose personal information we collect about you to other Morgan Stanley companies and to non-affiliated third parties.
a. Information We Disclose to Other Morgan Stanley Companies.
We may disclose personal information to other Morgan Stanley companies for a variety of reasons, including to manage your account(s) effectively, to service and process your transactions, to let you know about products and services offered by us and other Morgan Stanley companies, to manage our business, and as otherwise required or permitted by law. Offers for products and services from other Morgan Stanley companies are developed under conditions designed to safeguard your personal information.
23
Morgan Stanley Institutional Fund, Inc.
Annual Report — December 31, 2018
Privacy Notice (unaudited) (cont'd)
b. Information We Disclose to Non-affiliated Third Parties.
We do not disclose personal information that we collect about you to non-affiliated third parties except to those who provide marketing services on our behalf, to financial institutions with whom we have joint marketing agreements, and as otherwise required or permitted by law. For example, we may disclose personal information to non-affiliated third parties for servicing and processing transactions, to offer our own products and services, to protect against fraud, for institutional risk control, to respond to judicial process or to perform services on our behalf. When we share personal information with a non-affiliated third party, they are required to limit their use of personal information to the particular purpose for which it was shared and they are not allowed to share personal information with others except to fulfill that limited purpose or as may be permitted or required by law.
3. HOW DO WE PROTECT THE SECURITY AND CONFIDENTIALITY OF PERSONAL INFORMATION WE COLLECT ABOUT YOU?
We maintain physical, electronic and procedural security measures to help safeguard the personal information we collect about you. We have internal policies governing the proper handling of client information. Third parties that provide support or marketing services on our behalf may also receive personal information, and we require them to adhere to confidentiality standards with respect to such information.
4. HOW CAN YOU LIMIT THE SHARING OF CERTAIN TYPES OF PERSONAL INFORMATION WITH OTHER MORGAN STANLEY COMPANIES?
We offer you choices as to whether we share with other Morgan Stanley companies the personal information that was collected to determine your eligibility for products and services you request ("eligibility information"). Eligibility information does not include your identification information or personal information pertaining to our transactions or experiences with you. Please note that, even if you direct us not to share eligibility information with other Morgan Stanley companies ("opt-out"), we may still share personal information, including eligibility information, with those companies in circumstances excluded from the opt-out under applicable law, such as to process transactions or to service your account.
5. HOW CAN YOU LIMIT THE USE OF CERTAIN TYPES OF PERSONAL INFORMATION BY OTHER MORGAN STANLEY COMPANIES FOR MARKETING?
By following the opt-out instructions in Section 6 below, you may limit other Morgan Stanley branded companies from marketing their products or services to you based on personal information we disclose to them. This information may include, for example, your income and account history with us. Please note that, even if you choose to limit Other Morgan Stanley Companies from using personal information about you that we may share with them for marketing their products and services to you, Other Morgan Stanley Companies may use your personal information that they obtain from us to market to you in circumstances permitted by law, such as if the Other Morgan Stanley Company has its own relationship with you.
6. HOW CAN YOU SEND US AN OPT-OUT INSTRUCTION?
If you wish to limit our sharing of eligibility information about you with other Morgan Stanley companies or other Morgan Stanley companies' use of personal information for marketing purposes, as described in this notice, you may do so by:
• Calling us at (800) 548-7786
Monday–Friday between 8a.m. and 6p.m.(EST)
• Writing to us at the following address:
DST Asset Manager Solutions, Inc.
c/o Privacy Coordinator
P.O. Box 219804
Kansas City, Missouri 64121
24
Morgan Stanley Institutional Fund, Inc.
Annual Report — December 31, 2018
Privacy Notice (unaudited) (cont'd)
Your written request should include your name, address, telephone number and account number(s) to which the opt-out applies and whether you are opting out with respect to sharing of eligibility information (Section 4 above), or if information used for Marketing (Section 5 above) or both. Written opt-out requests should not be sent with any other correspondence. In order to process your request, we require that the request be provided by you directly and not through a third party.
Your opt-out preference will remain in effect with respect to this policy (as it may be amended) until you notify us otherwise. If you have a joint account, your direction for us not to share this information with other Morgan Stanley companies and for those other Morgan Stanley companies not to use your personal information for marketing will be applied to all account holders on that account. Please understand that if you limit our sharing or our affiliated companies' use of personal information, you and any joint account holder(s) may not receive information about Morgan Stanley products and services, including products or services that could help you manage your financial resources and achieve your investment objectives.
7. WHAT IF AN AFFILIATED COMPANY BECOMES A NON-AFFILIATED THIRD PARTY?
If, at any time in the future, an affiliated company becomes a non-affiliated third party, further disclosures of personal information made to the former affiliated company will be limited to those described in Section 2(b) above relating to non-affiliated third parties. If you elected under Section 6 to limit disclosures we make to affiliated companies, or use of personal information by affiliated companies, your election will not apply to use by any former affiliated company of your personal information in their possession once it becomes a non-affiliated third party.
SPECIAL NOTICE TO RESIDENTS OF VERMONT
The following section supplements our policy with respect to our individual clients who have a Vermont address and supersedes anything to the contrary in the above policy with respect to those clients only.
The state of Vermont requires financial institutions to obtain your consent prior to sharing personal information that they collect about you with affiliated companies and non-affiliated third parties other than in certain limited circumstances. Except as permitted by law, we will not share personal information we collect about you with non-affiliated third parties or other Morgan Stanley companies unless you provide us with your written consent to share such information ("opt-in").
If you wish to receive offers for investment products and services offered by or through other Morgan Stanley companies, please notify us in writing at the following address:
DST Asset Manager Solutions, Inc.
c/o Privacy Coordinator
P.O. Box 219804
Kansas City, Missouri 64121
Your authorization should include your name, address, telephone number and account number(s) to which the opt-in applies and should not be sent with any other correspondence. In order to process your authorization, we require that the authorization be provided by you directly and not through a third party.
SPECIAL NOTICE TO RESIDENTS OF CALIFORNIA
The following section supplements our policy with respect to our individual clients who have a California address and supersedes anything to the contrary in the above policy with respect to those clients only.
In response to a California law, if your account has a California home address, your personal information will not be disclosed to non-affiliated third parties except as permitted by applicable California law, and we will limit sharing such information with our affiliates to comply with California privacy laws that apply to us.
25
Morgan Stanley Institutional Fund, Inc.
Annual Report — December 31, 2018
Director and Officer Information (unaudited)
Independent Directors:
Name, Age and Address of
Independent Director | | Position(s)
Held with
Registrant | | Length of Time
Served* | | Principal Occupation(s) During Past 5 Years
and Other Relevant Professional Experience | | Number of
Portfolios in
Fund Complex
Overseen by
Independent
Director** | | Other Directorships
Held by Independent
Director*** | |
Frank L. Bowman (74)
c/o Perkins Coie LLP
Counsel to the Independent
Directors
30 Rockefeller Plaza
New York, NY 10112 | | Director | | Since
August
2006 | | President, Strategic Decisions, LLC (consulting) (since February 2009); Director or Trustee of various Morgan Stanley Funds (since August 2006); Chairperson of the Compliance and Insurance Committee (since October 2015); formerly, Chairperson of the Insurance Sub-Committee of the Compliance and Insurance Committee (2007-2015); served as President and Chief Executive Officer of the Nuclear Energy Institute (policy organization) (February 2005-November 2008); retired as Admiral, U.S. Navy after serving over 38 years on active duty including 8 years as Director of the Naval Nuclear Propulsion Program in the Department of the Navy and the U.S. Department of Energy (1996-2004); served as Chief of Naval Personnel (July 1994-September 1996) and on the Joint Staff as Director of Political Military Affairs (June 1992-July 1994); knighted as Honorary Knight Commander of the Most Excellent Order of the British Empire; awarded the Officier de l'Orde National du Mérite by the French Government; elected to the National Academy of Engineering (2009). | | | 82 | | | Director of BP p.l.c.; Director of Naval and Nuclear Technologies LLP; Director Emeritus of the Armed Services YMCA; Member of the National Security Advisory Council of the Center for U.S. Global Engagement and a member of the CNA Military Advisory Board; Trustee of Fairhaven United Methodist Church; Member of the Board of Advisors of the Dolphin Scholarship Foundation; and Director of other various non-profit organizations. | |
Kathleen A. Dennis (65)
c/o Perkins Coie LLP
Counsel to the Independent Directors
30 Rockefeller Plaza
New York, NY 10112 | | Director | | Since
August
2006 | | President, Cedarwood Associates (mutual fund and investment management consulting) (since July 2006); Chairperson of the Liquidity and Alternatives Sub-Committee of the Investment Committee (since October 2006) and Director or Trustee of various Morgan Stanley Funds (since August 2006); formerly, Senior Managing Director of Victory Capital Management (1993-2006). | | | 82 | | | Director of various non-profit organizations. | |
Nancy C. Everett (63)
c/o Perkins Coie LLP
Counsel to the Independent Directors
30 Rockefeller Plaza
New York, NY 10112 | | Director | | Since
January
2015 | | Chief Executive Officer, Virginia Commonwealth University Investment Company (since November 2015); Owner, OBIR, LLC (institutional investment management consulting) (since June 2014); formerly, Managing Director, BlackRock Inc. (February 2011-December 2013); and Chief Executive Officer, General Motors Asset Management (a/k/a Promark Global Advisors, Inc.) (June 2005-May 2010). | | | 83 | | | Formerly, Member of Virginia Commonwealth University School of Business Foundation (2005-2016); Member of Virginia Commonwealth University Board of Visitors (2013-2015); Member of Committee on Directors for Emerging Markets Growth Fund, Inc. (2007-2010); Chairperson of Performance Equity Management, LLC (2006-2010); and Chairperson, GMAM Absolute Return Strategies Fund, LLC (2006-2010). | |
26
Morgan Stanley Institutional Fund, Inc.
Annual Report — December 31, 2018
Director and Officer Information (unaudited) (cont'd)
Independent Directors: (cont'd)
Name, Age and Address of
Independent Director | | Position(s)
Held with
Registrant | | Length of Time
Served* | | Principal Occupation(s) During Past 5 Years
and Other Relevant Professional Experience | | Number of
Portfolios in
Fund Complex
Overseen by
Independent
Director** | | Other Directorships
Held by Independent
Director*** | |
Jakki L. Haussler (61)
c/o Perkins Coie LLP
Counsel to the Independent Directors
30 Rockefeller Plaza
New York, NY 10112 | | Director | | Since
January
2015 | | Chairman and Chief Executive Officer, Opus Capital Group (since January 1996); formerly, Director, Capvest Venture Fund, LP (May 2000-December 2011); Partner, Adena Ventures, LP (July 1999-December 2010); Director, The Victory Funds (February 2005-July 2008). | | | 83 | | | Director of Service Corporation International and Member, Audit Committee and Investment Committee; Director of Cincinnati Bell Inc. and Member, Audit Committee and Governance and Nominating Committee; Chairman of Northern Kentucky University Member Investment Committee; Member of Chase College of Law Transactional Law Practice Center Board of Advisors; Director of Best Transport; Director of Chase College of Law Board of Visitors; formerly, Member, University of Cincinnati Foundation Investment Committee; Member, Miami University Board of Visitors (2008-2011); Trustee of Victory Funds (2005-2008) and Chairman, Investment Committee (2007-2008) and Member, Service Provider Committee (2005-2008). | |
Dr. Manuel H. Johnson (69)
c/o Johnson Smick
International, Inc.
220 I Street, NE — Suite 200
Washington, D.C. 20002 | | Director | | Since
July
1991 | | Senior Partner, Johnson Smick International, Inc. (consulting firm); Chairperson of the Investment Committee (since October 2006) and Director or Trustee of various Morgan Stanley Funds (since July 1991); Co-Chairman and a founder of the Group of Seven Council (G7C) (international economic commission); formerly, Chairperson of the Audit Committee (July 1991-September 2006), Vice Chairman of the Board of Governors of the Federal Reserve System and Assistant Secretary of the U.S. Treasury. | | | 82 | | | Director of NVR, Inc. (home construction). | |
Joseph J. Kearns (76)
c/o Perkins Coie LLP
Counsel to the Independent Directors
30 Rockefeller Plaza
New York, NY 10112 | | Director | | Since
August
1994 | | Senior Adviser, Kearns & Associates LLC (investment consulting); Chairperson of the Audit Committee (since October 2006) and Director or Trustee of various Morgan Stanley Funds (since August 1994); formerly, Deputy Chairperson of the Audit Committee (July 2003-September 2006) and Chairperson of the Audit Committee of various Morgan Stanley Funds (since August 1994); CFO of the J. Paul Getty Trust. | | | 83 | | | Prior to August 10, 2016, Director of Electro Rent Corporation (equipment leasing); Prior to December 31, 2013, Director of The Ford Family Foundation. | |
27
Morgan Stanley Institutional Fund, Inc.
Annual Report — December 31, 2018
Director and Officer Information (unaudited) (cont'd)
Independent Directors: (cont'd)
Name, Age and Address of
Independent Director | | Position(s)
Held with
Registrant | | Length of Time
Served* | | Principal Occupation(s) During Past 5 Years
and Other Relevant Professional Experience | | Number of
Portfolios in
Fund Complex
Overseen by
Independent
Director** | | Other Directorships
Held by Independent
Director*** | |
Michael F. Klein (60)
c/o Perkins Coie LLP
Counsel to the Independent Directors
30 Rockefeller Plaza
New York, NY 10112 | | Director | | Since
August
2006 | | Managing Director, Aetos Alternatives Management, LP (since March 2000); Co-President, Aetos Alternatives Management, LP (since January 2004) and Co-Chief Executive Officer of Aetos Alternatives Management, LP (since August 2013); Chairperson of the Fixed Income Sub-Committee of the Investment Committee (since October 2006) and Director or Trustee of various Morgan Stanley Funds (since August 2006); formerly, Managing Director, Morgan Stanley & Co. Inc. and Morgan Stanley Dean Witter Investment Management and President, various Morgan Stanley Funds (June 1998-March 2000); Principal, Morgan Stanley & Co. Inc. and Morgan Stanley Dean Witter Investment Management (August 1997-December 1999). | | | 82 | | | Director of certain investment funds managed or sponsored by Aetos Alternatives Management, LP; Director of Sanitized AG and Sanitized Marketing AG (specialty chemicals). | |
Patricia Maleski (58)
c/o Perkins Coie LLP
Counsel to the Independent Directors
30 Rockefeller Plaza
New York, NY 10112 | | Director | | Since
January
2017 | | Managing Director, JPMorgan Asset Management (2004-2016); Oversight and Control Head of Fiduciary and Conflicts of Interest Program (2015-2016); Chief Control Officer-Global Asset Management (2013-2015); President, JPMorgan Funds (2010-2013); Chief Administrative Officer (2004-2013); various other positions including Treasurer and Board Liaison (since 2001). | | | 83 | | | None. | |
Michael E. Nugent (82)
522 Fifth Avenue
New York, NY 10036 | | Chair of the Board and Director | | Chair of the Boards since July 2006 and Director since July 1991 | | Chair of the Boards of various Morgan Stanley Funds (since July 2006); Chairperson of the Closed-End Fund Committee (since June 2012) Governance Committee (since January 2019) and Director or Trustee of various Morgan Stanley Funds (since July 1991); formerly, Chairperson of the Insurance Committee (until July 2006); General Partner, Triumph Capital, L.P. (private investment partnership) (1988-2013). | | | 82 | | | None. | |
W. Allen Reed (71)
c/o Perkins Coie LLP
Counsel to the Independent Directors
30 Rockefeller Plaza
New York, NY 10112 | | Director | | Since
August
2006 | | Chairperson of the Equity Sub-Committee of the Investment Committee (since October 2006) and Director or Trustee of various Morgan Stanley Funds (since August 2006); formerly, President and CEO of General Motors Asset Management; Chairman and Chief Executive Officer of the GM Trust Bank and Corporate Vice President of General Motors Corporation (August 1994-December 2005). | | | 82 | | | Director of Legg Mason, Inc.; formerly, Director of the Auburn University Foundation (2010-2015). | |
Fergus Reid (86)****
c/o Joe Pietryka, Inc.
85 Charles Colman Blvd.
Pawling, NY 12564 | | Director | | Since
June
1992 | | Chairman, Joe Pietryka, Inc.; Chairperson of the Governance Committee and Director or Trustee of various Morgan Stanley Funds (since June 1992). | | | 83 | | | Formerly, Trustee and Director of certain investment companies in the JP Morgan Fund Complex managed by JP Morgan Investment Management Inc. (1987-2012). | |
* This is the earliest date the Director began serving the Morgan Stanley Funds. Each Director serves an indefinite term, until his or her successor is elected.
** The Fund Complex includes (as of December 31, 2018) all open-end and closed-end funds (including all of their portfolios) advised by Morgan Stanley Investment Management Inc. (the "Adviser") and any funds that have an adviser that is an affiliated person of the Adviser (including, but not limited to, Morgan Stanley AIP GP LP).
*** This includes any directorships at public companies and registered investment companies held by the Director at any time during the past five years.
**** Effective date of retirement is December 31, 2018.
28
Morgan Stanley Institutional Fund, Inc.
Annual Report — December 31, 2018
Director and Officer Information (unaudited) (cont'd)
Executive Officers:
Name, Age and Address of Executive Officer | | Position(s) Held
with
Registrant | | Length of Time
Served* | | Principal Occupation(s) During Past 5 Years | |
John H. Gernon (55)
522 Fifth Avenue
New York, NY 10036 | | President and Principal Executive Officer | | Since
September
2013 | | President and Principal Executive Officer of the Equity and Fixed Income Funds and the Morgan Stanley AIP Funds (since September 2013) and the Liquidity Funds and various money market funds (since May 2014) in the Fund Complex; Managing Director of the Adviser; Head of Product (since 2006). | |
Timothy J. Knierim (59)
522 Fifth Avenue
New York, NY 10036 | | Chief Compliance Officer | | Since
December
2016 | | Managing Director of the Adviser and various entities affiliated with the Adviser; Chief Compliance Officer of various Morgan Stanley Funds and the Adviser (since December 2016) and Chief Compliance Officer of Morgan Stanley AIP GP LP (since 2014). Formerly, Managing Director and Deputy Chief Compliance Officer of the Adviser (2014-2016); and formerly, Chief Compliance Officer of Prudential Investment Management, Inc. (2007-2014). | |
Francis J. Smith (53)
522 Fifth Avenue
New York, NY 10036 | | Treasurer and Principal Financial Officer | | Treasurer since July 2003 and Principal Financial Officer since September 2002 | | Managing Director of the Adviser and various entities affiliated with the Adviser; Treasurer (since July 2003) and Principal Financial Officer of various Morgan Stanley Funds (since September 2002). | |
Mary E. Mullin (51)
522 Fifth Avenue
New York, NY 10036 | | Secretary | | Since
June
1999 | | Managing Director of the Adviser; Secretary of various Morgan Stanley Funds (since June 1999). | |
Michael J. Key (39)
522 Fifth Avenue
New York, NY 10036 | | Vice President | | Since
June
2017 | | Vice President of the Equity and Fixed Income Funds, Liquidity Funds, various money market funds and the Morgan Stanley AIP Funds in the Fund Complex (since June 2017); Executive Director of the Adviser; Head of Product Development for Equity and Fixed Income Funds (since August 2013). | |
* This is the earliest date the officer began serving the Morgan Stanley Funds. Each officer serves a one-year term, until his or her successor is elected and qualifies.
29
Morgan Stanley Institutional Fund, Inc.
Annual Report — December 31, 2018
Adviser and Administrator
Morgan Stanley Investment Management Inc.
522 Fifth Avenue
New York, New York 10036
Distributor
Morgan Stanley Distribution, Inc.
522 Fifth Avenue
New York, New York 10036
Dividend Disbursing and Transfer Agent
DST Asset Manager Solutions, Inc.
2000 Crown Colony Drive
Quincy, Massachusetts 02169
Custodian
State Street Bank and Trust Company
One Lincoln Street
Boston, Massachusetts 02111
Legal Counsel
Dechert LLP
1095 Avenue of the Americas
New York, New York 10036
Counsel to the Independent Directors
Perkins Coie LLP
30 Rockefeller Plaza
New York, New York 10112
Independent Registered Public Accounting Firm
Ernst & Young LLP
200 Clarendon Street
Boston, Massachusetts 02116
Reporting to Shareholders
Each Morgan Stanley fund provides a complete schedule of portfolio holdings in its semi-annual and the annual reports within 60 days of the end of the fund's second and fourth fiscal quarters. The semi-annual and annual reports are filed electronically with the Securities and Exchange Commission ("SEC") on Form N-CSRS and Form N-CSR, respectively. Morgan Stanley also delivers the semi-annual and annual reports to fund shareholders and makes these reports available on its public website, www.morganstanley.com/im/shareholderreports. Each Morgan Stanley fund also files a complete schedule of portfolio holdings with the SEC for the fund's first and third fiscal quarters on Form N-Q. Morgan Stanley does not deliver the reports for the first and third fiscal quarters to shareholders, nor are the reports posted to the Morgan Stanley public website. You may, however, obtain the Form N-Q filings (as well as the Form N-CSR and N-CSRS filings) by accessing the SEC's website, www.sec.gov. You can also request copies of these materials, upon payment of a duplicating fee, by electronic request at the SEC's email address (publicinfo@sec.gov).
Proxy Voting Policies and Procedures and Proxy Voting Record
You may obtain a copy of the Company's Proxy Voting Policy and Procedures and information regarding how the Company voted proxies relating to portfolio securities during the most recent twelve-month period ended June 30, without charge, upon request, by calling toll free 1 (800) 548-7786 or by visiting our website at www.morganstanley.com/im/shareholderreports. This information is also available on the SEC's website at www.sec.gov.
This report is authorized for distribution only when preceded or accompanied by a prospectus or summary prospectus of the applicable Fund of Morgan Stanley Institutional Fund, Inc., which describes in detail the Fund's investment policies, risks, fees and expenses. Please read the prospectus carefully before you invest or send money. For additional information, including information regarding the investments comprising the Fund, please visit our website at www.morganstanley.com/im/shareholderreports or call toll free 1 (800) 548-7786.
30
Printed in U.S.A.
This Report has been prepared for shareholders and may be distributed to others only if preceded or accompanied by a current prospectus.
Morgan Stanley Investment Management Inc.
522 Fifth Avenue
New York, New York 10036
© 2019 Morgan Stanley. Morgan Stanley Distribution, Inc.

IFIGCPANN
2403485 EXP. 02.29.20

Morgan Stanley Institutional Fund, Inc.
Global Endurance Portfolio
Annual Report
December 31, 2018
Beginning on January 1, 2021, as permitted by regulations adopted by the Securities and Exchange Commission ("SEC"), paper copies of the Fund's Annual and Semi-Annual Reports to Shareholders ("Shareholder Reports") will no longer be sent by mail, unless you specifically request paper copies of the Shareholder Reports from the Fund or from your financial intermediary, such as a broker-dealer or a bank. Instead, the Shareholder Reports will be made available on the Fund's website, https://www.morganstanley.com/im/shareholderreports and you will be notified by mail each time a Shareholder Report is posted and provided with a website link to access the Shareholder Report. If you already elected to receive Shareholder Reports electronically, you will not be affected by this change and you need not take any action. You may elect to receive Shareholder Reports and other communications from the Fund electronically anytime by contacting your financial intermediary or, if you are a direct investor, please follow the instructions on the envelope.
Beginning on January 1, 2019, you may elect to receive all future Shareholder Reports in paper free of charge. If you invest through a financial intermediary, you can contact your financial intermediary to request that you continue to receive paper copies of your Shareholder Reports. If you invest directly with the Fund, please follow the instructions on the envelope to let the Fund know you wish to continue receiving paper copies of your Shareholder Reports. Your election to receive Shareholder Reports in paper will apply to all funds held in your account if you invest through your financial intermediary or all funds held with the fund complex if you invest directly with a fund.

Morgan Stanley Institutional Fund, Inc.
Annual Report — December 31, 2018
Shareholders' Letter | | | 2 | | |
Expense Example | | | 3 | | |
Investment Overview | | | 4 | | |
Portfolio of Investments | | | 5 | | |
Statement of Assets and Liabilities | | | 6 | | |
Statement of Operations | | | 7 | | |
Statement of Changes in Net Assets | | | 8 | | |
Financial Highlights | | | 9 | | |
Notes to Financial Statements | | | 13 | | |
Report of Independent Registered Public Accounting Firm | | | 19 | | |
Investment Advisory Agreement Approval | | | 20 | | |
Privacy Notice | | | 22 | | |
Director and Officer Information | | | 25 | | |
This report is authorized for distribution only when preceded or accompanied by a prospectus or summary prospectus of the applicable Fund of Morgan Stanley Institutional Fund, Inc. To receive a prospectus and/or statement of additional information (SAI), which contains more complete information such as investment objectives, charges, expenses, policies for voting proxies, risk considerations and describes in detail each of the Fund's investment policies to the prospective investor, please call toll free 1 (800) 548-7786. Please read the prospectuses carefully before you invest or send money.
Additionally, you can access information about the Fund, including performance, characteristics and investment team commentary, through Morgan Stanley Investment Management's website: www.morganstanley.com/im/shareholderreports.
Market forecasts provided in this report may not necessarily come to pass. There is no guarantee that any sectors mentioned will continue to perform as discussed herein or that securities in such sectors will be held by the Fund in the future. There is no assurance that a fund will achieve its investment objective. Funds are subject to market risk, which is the possibility that market values of securities owned by the Fund will decline and, therefore, the value of the Fund's shares may be less than what you paid for them. Accordingly, you can lose money investing in this Fund. Please see the prospectus for more complete information on investment risks.
1
Morgan Stanley Institutional Fund, Inc.
Annual Report — December 31, 2018
Shareholders' Letter (unaudited)
Dear Shareholders,
We are pleased to provide this Annual report, in which you will learn how your investment in Global Endurance Portfolio (the "Fund") performed during the period ended December 31, 2018 (when the Fund commenced operations).
Morgan Stanley Investment Management is a client-centric, investor-led organization. Our global presence, intellectual capital, and breadth of products and services enable us to partner with investors to meet the evolving challenges of today's financial markets. We aim to deliver superior investment service and to empower our clients to make the informed decisions that help them reach their investment goals.
As always, we thank you for selecting Morgan Stanley Investment Management, and look forward to working with you in the months and years ahead.
Sincerely,

John H. Gernon
President and Principal Executive Officer
January 2019
2
Morgan Stanley Institutional Fund, Inc.
Annual Report — December 31, 2018
Expense Example (unaudited)
Global Endurance Portfolio
As a shareholder of the Fund, you incur two types of costs: (1) transactional costs; and (2) ongoing costs, which may include advisory fees, administration fees, distribution and shareholder services fees and other Fund expenses. This example is intended to help you understand your ongoing costs (in dollars) of investing in the Fund and to compare these costs with the ongoing costs of investing in other mutual funds.
This example is based on an investment of $1,000 invested at the beginning of the period and held for the entire period 12/31/18-12/31/18.
Actual Expenses
The table below provides information about actual account values and actual expenses. You may use the information in this table, together with the amount you invested, to estimate the expenses that you paid over the period. Simply divide your account value by $1,000 (for example, an $8,600 account value divided by $1,000 = 8.6), then multiply the result by the number in the table under the heading entitled "Actual Expenses Paid During Period" to estimate the expenses you paid on your account during this period.
Hypothetical Example for Comparison Purposes
The table below provides information about hypothetical account values and hypothetical expenses based on the Fund's actual expense ratio and an assumed rate of return of 5% per year before expenses, which is not the Fund's actual return. The hypothetical account values and expenses may not be used to estimate the actual ending account balance or expenses you paid for the period. You may use this information to compare the ongoing costs of investing in the Fund and other funds. To do so, compare this 5% hypothetical example with the 5% hypothetical examples that appear in the shareholder reports of the other funds.
Please note that the expenses shown in the table are meant to highlight your ongoing costs only and do not reflect any transactional costs, such as sales charges (loads). Therefore, the information for each class in the table is useful in comparing ongoing costs only, and will not help you determine the relative total costs of owning different funds. In addition, if these transactional costs were included, your costs would have been higher.
| | | Beginning
Account
Value
12/31/18 | | Actual Ending
Account
Value
12/31/18 | | Hypothetical
Ending Account
Value | | Actual
Expenses
Paid
During
Period* | | Hypothetical
Expenses Paid
During Period* | | Net
Expense
Ratio
During
Period** | |
Global Endurance Portfolio Class I^ | | $ | 1,000.00 | | | $ | 1,000.00 | | | $ | 1,000.11 | | | $ | 0.03 | | | $ | 0.03 | | | | 1.00 | % | |
Global Endurance Portfolio Class A^ | | | 1,000.00 | | | | 1,000.00 | | | | 1,000.10 | | | | 0.04 | | | | 0.04 | | | | 1.35 | | |
Global Endurance Portfolio Class C^ | | | 1,000.00 | | | | 1,000.00 | | | | 1,000.08 | | | | 0.06 | | | | 0.06 | | | | 2.10 | | |
Global Endurance Portfolio Class IS^ | | | 1,000.00 | | | | 1,000.00 | | | | 1,000.11 | | | | 0.03 | | | | 0.03 | | | | 0.95 | | |
* Expenses are calculated using each Fund Class' annualized net expense ratio (as disclosed), multiplied by the average account value over the period and multiplied by 1/365 (to reflect the actual days in the period).
** Annualized.
^ The Fund commenced operations on December 31, 2018.
3
Morgan Stanley Institutional Fund, Inc.
Annual Report — December 31, 2018
Investment Overview (unaudited)
Global Endurance Portfolio
The Fund seeks long-term capital appreciation.
Performance
The Fund's inception (December 31, 2018) was the same day as the close of the fiscal year on December 31, 2018.
As of the end of the reporting period, the Fund did not have any performance history.
Management Strategies
• We seek high-quality established and emerging companies primarily located throughout the world with durable competitive advantages, sustainable growth opportunities, valuable business models and strong management teams. We focus on long-term growth rather than short-term events, with our stock selection informed by rigorous fundamental analysis.
4
Morgan Stanley Institutional Fund, Inc.
Annual Report — December 31, 2018
Portfolio of Investments
Global Endurance Portfolio
| | | Shares | | Value
(000) | |
Common Stocks (89.7%) | |
Australia (1.2%) | |
Bellamy's Australia Ltd. (a) | | | 4,719 | | | $ | 24 | | |
Canada (13.3%) | |
Canadian National Railway Co. | | | 1,201 | | | | 89 | | |
Colliers International Group, Inc. | | | 1,215 | | | | 67 | | |
Constellation Software, Inc. | | | 181 | | | | 116 | | |
| | | | 272 | | |
France (2.5%) | |
Getlink SE | | | 1,857 | | | | 25 | | |
Ubisoft Entertainment SA (a) | | | 335 | | | | 27 | | |
| | | | 52 | | |
Germany (1.2%) | |
Linde PLC | | | 154 | | | | 24 | | |
New Zealand (3.2%) | |
Ryman Healthcare Ltd. | | | 9,089 | | | | 65 | | |
South Africa (1.3%) | |
PSG Group Ltd. | | | 1,647 | | | | 28 | | |
United Kingdom (13.2%) | |
ASA International Group PLC (a) | | | 9,731 | | | | 52 | | |
Ashtead Group PLC | | | 963 | | | | 20 | | |
Halma PLC | | | 1,396 | | | | 24 | | |
Melrose Industries PLC | | | 22,813 | | | | 47 | | |
Metro Bank PLC (a) | | | 2,136 | | | | 46 | | |
Victoria PLC (a) | | | 13,459 | | | | 81 | | |
| | | | 270 | | |
United States (53.8%) | |
Activision Blizzard, Inc. | | | 1,185 | | | | 55 | | |
Align Technology, Inc. (a) | | | 56 | | | | 12 | | |
ANSYS, Inc. (a) | | | 140 | | | | 20 | | |
Broadridge Financial Solutions, Inc. | | | 293 | | | | 28 | | |
Carvana Co. (a) | | | 1,578 | | | | 52 | | |
CBIZ, Inc. (a) | | | 1,061 | | | | 21 | | |
Cimpress N.V. (a) | | | 293 | | | | 30 | | |
Cintas Corp. | | | 126 | | | | 21 | | |
Copart, Inc. (a) | | | 1,620 | | | | 77 | | |
Ecolab, Inc. | | | 391 | | | | 58 | | |
GTT Communications, Inc. (a) | | | 3,239 | | | | 77 | | |
HEICO Corp. | | | 1,257 | | | | 97 | | |
Installed Building Products, Inc. (a) | | | 726 | | | | 25 | | |
Intuit, Inc. | | | 140 | | | | 28 | | |
Invitae Corp. (a) | | | 921 | | | | 10 | | |
LiveRamp Holdings, Inc. (a) | | | 726 | | | | 28 | | |
Rollins, Inc. | | | 1,689 | | | | 61 | | |
Sabre Corp. | | | 991 | | | | 21 | | |
Service Corp. International/US | | | 544 | | | | 22 | | |
SS&C Technologies Holdings, Inc. | | | 1,131 | | | | 51 | | |
| | | Shares | | Value
(000) | |
Take-Two Interactive Software, Inc. (a) | | | 489 | | | $ | 50 | | |
Tyler Technologies, Inc. (a) | | | 265 | | | | 49 | | |
Ubiquiti Networks, Inc. | | | 112 | | | | 11 | | |
UnitedHealth Group, Inc. | | | 524 | | | | 131 | | |
Waste Management, Inc. | | | 265 | | | | 24 | | |
XPO Logistics, Inc. (a) | | | 754 | | | | 43 | | |
| | | | 1,102 | | |
Total Investments (89.7%) (Cost $1,840) (b)(c) | | | 1,837 | | |
Other Assets in Excess of Liabilities (10.3%) | | | 210 | | |
Net Assets (100.0%) | | $ | 2,047 | | |
Country assignments and aggregations are based generally on third party vendor classifications and information, and may be different from the assignments and aggregations under the policies set forth in the Fund's prospectus and/or statement of additional information relating to geographic classifications.
(a) Non-income producing security.
(b) The approximate fair value and percentage of net assets, $439,000 and 21.4%, respectively, represent the securities that have been fair valued under the fair valuation policy for international investments as described in Note A-1 within the Notes to the Financial Statements.
(c) At December 31, 2018, the aggregate cost for federal income tax purposes is approximately $1,840,000. The aggregate gross unrealized appreciation is approximately $0 and the aggregate gross unrealized depreciation is approximately $3,000, resulting in net unrealized depreciation of approximately $3,000.
Portfolio Composition
Classification | | Percentage of
Total Investments | |
Other* | | | 36.7 | % | |
Software | | | 14.4 | | |
Commercial Services & Supplies | | | 11.6 | | |
Health Care Providers & Services | | | 10.6 | | |
Information Technology Services | | | 8.4 | | |
Entertainment | | | 7.2 | | |
Household Durables | | | 5.8 | | |
Aerospace & Defense | | | 5.3 | | |
Total Investments | | | 100.0 | % | |
* Industries and/or investment types representing less than 5% of total investments.
The accompanying notes are an integral part of the financial statements.
5
Morgan Stanley Institutional Fund, Inc.
Annual Report — December 31, 2018
Global Endurance Portfolio
Statement of Assets and Liabilities | | December 31, 2018
(000) | |
Assets: | |
Investments in Securities of Unaffiliated Issuers, at Value (Cost $1,840) | | $ | 1,837 | | |
Cash | | | 1,000 | | |
Receivable for Fund Shares Sold | | | 1,050 | | |
Prepaid Offering Costs | | | 175 | | |
Due from Adviser | | | 51 | | |
Total Assets | | | 4,113 | | |
Liabilities: | |
Payable for Investments Purchased | | | 1,840 | | |
Payable for Offering Costs | | | 176 | | |
Payable for Professional Fees | | | 46 | | |
Payable for Transfer Agency Fees — Class I | | | — | @ | |
Payable for Transfer Agency Fees — Class A | | | — | @ | |
Payable for Transfer Agency Fees — Class C | | | — | @ | |
Payable for Shareholder Services Fees — Class A | | | — | @ | |
Payable for Distribution and Shareholder Services Fees — Class C | | | — | @ | |
Payable for Custodian Fees | | | — | @ | |
Payable for Administration Fees | | | — | @ | |
Other Liabilities | | | 4 | | |
Total Liabilities | | | 2,066 | | |
Net Assets | | $ | 2,047 | | |
Net Assets Consist of: | |
Paid-in-Capital | | $ | 2,050 | | |
Total Accumulated Loss | | | (3 | ) | |
Net Assets | | $ | 2,047 | | |
CLASS I: | |
Net Assets | | $ | 2,017 | | |
| Shares Outstanding $0.001 par value shares of beneficial interest (unlimited shares authorized) (not in 000's) | | | 202,000 | | |
Net Asset Value, Offering and Redemption Price Per Share | | $ | 9.98 | | |
CLASS A: | |
Net Assets | | $ | 10 | | |
| Shares Outstanding $0.001 par value shares of beneficial interest (unlimited shares authorized) (not in 000's) | | | 1,000 | | |
Net Asset Value, Redemption Price Per Share | | $ | 9.98 | | |
Maximum Sales Load | | | 5.25 | % | |
Maximum Sales Charge | | $ | 0.55 | | |
Maximum Offering Price Per Share | | $ | 10.53 | | |
CLASS C: | |
Net Assets | | $ | 10 | | |
| Shares Outstanding $0.001 par value shares of beneficial interest (unlimited shares authorized) (not in 000's) | | | 1,000 | | |
Net Asset Value, Offering and Redemption Price Per Share | | $ | 9.98 | | |
CLASS IS: | |
Net Assets | | $ | 10 | | |
| Shares Outstanding $0.001 par value shares of beneficial interest (unlimited shares authorized) (not in 000's) | | | 1,000 | | |
Net Asset Value, Offering and Redemption Price Per Share | | $ | 9.98 | | |
@ Amount is less than $500.
The accompanying notes are an integral part of the financial statements.
6
Morgan Stanley Institutional Fund, Inc.
Annual Report — December 31, 2018
Global Endurance Portfolio
Statement of Operations | | Period Ended
December 31, 2018^
(000) | |
Expenses: | |
Professional Fees | | $ | 46 | | |
Shareholder Reporting Fees | | | 4 | | |
Transfer Agency Fees — Class I (Note E) | | | — | @ | |
Transfer Agency Fees — Class A (Note E) | | | — | @ | |
Transfer Agency Fees — Class C (Note E) | | | — | @ | |
Transfer Agency Fees — Class IS (Note E) | | | — | @ | |
Shareholder Services Fees — Class A (Note D) | | | — | @ | |
Distribution and Shareholder Services Fees — Class C (Note D) | | | — | @ | |
Advisory Fees (Note B) | | | — | @ | |
Custodian Fees (Note F) | | | — | @ | |
Administration Fees (Note C) | | | — | @ | |
Pricing Fees | | | — | @ | |
Offering Costs | | | 1 | | |
Other Expenses | | | — | @ | |
Total Expenses | | | 51 | | |
Waiver of Advisory Fees (Note B) | | | (— | @) | |
Expense Reimbursed by Adviser (Note B) | | | (51 | ) | |
Reimbursement of Class Specific Expenses — Class I (Note B) | | | (— | @) | |
Reimbursement of Class Specific Expenses — Class A (Note B) | | | (— | @) | |
Reimbursement of Class Specific Expenses — Class C (Note B) | | | (— | @) | |
Reimbursement of Class Specific Expenses — Class IS (Note B) | | | (— | @) | |
Net Expenses | | | — | @ | |
Net Investment Loss | | | (— | @) | |
Change in Unrealized Appreciation (Depreciation): | |
Investments | | | (3 | ) | |
Foreign Currency Translation | | | — | @ | |
Net Change in Unrealized Appreciation (Depreciation) | | | (3 | ) | |
Net Decrease in Net Assets Resulting from Operations | | $ | (3 | ) | |
^ Commencement of Operations.
@ Amount is less than $500.
The accompanying notes are an integral part of the financial statements.
7
Morgan Stanley Institutional Fund, Inc.
Annual Report — December 31, 2018
Global Endurance Portfolio
Statement of Changes in Net Assets | | Period Ended
December 31, 2018^
(000) | |
Increase (Decrease) in Net Assets: | |
Operations: | |
Net Investment Loss | | $ | (— | @) | |
Net Change in Unrealized Appreciation (Depreciation) | | | (3 | ) | |
Net Decrease in Net Assets Resulting from Operations | | | (3 | ) | |
Capital Share Transactions:(1) | |
Class I: | |
Subscribed | | | 2,020 | | |
Class A: | |
Subscribed | | | 10 | | |
Class C: | |
Subscribed | | | 10 | | |
Class IS: | |
Subscribed | | | 10 | | |
Net Increase in Net Assets Resulting from Capital Share Transactions | | | 2,050 | | |
Total Increase in Net Assets | | | 2,047 | | |
Net Assets: | |
Beginning of Period | | | — | | |
End of Period | | $ | 2,047 | | |
(1) Capital Share Transactions: | |
Class I: | |
Shares Subscribed | | | 202 | | |
Class A: | |
Shares Subscribed | | | 1 | | |
Class C: | |
Shares Subscribed | | | 1 | | |
Class IS: | |
Shares Subscribed | | | 1 | | |
^ Commencement of Operations.
@ Amount is less than $500.
The accompanying notes are an integral part of the financial statements.
8
Morgan Stanley Institutional Fund, Inc.
Annual Report — December 31, 2018
Financial Highlights
Global Endurance Portfolio
| | | Class I | |
Selected Per Share Data and Ratios | | Period Ended
December 31, 2018(1) | |
Net Asset Value, Beginning of Period | | $ | 10.00 | | |
Loss from Investment Operations: | |
Net Investment Loss(2) | | | (0.00 | )(3) | |
Net Realized and Unrealized Loss | | | (0.02 | ) | |
Total from Investment Operations | | | (0.02 | ) | |
Net Asset Value, End of Period | | $ | 9.98 | | |
Total Return(4) | | | 0.00 | %(5) | |
Ratios and Supplemental Data: | |
Net Assets, End of Period (Thousands) | | $ | 2,017 | | |
Ratio of Expenses to Average Net Assets(7) | | | 1.00 | %(6) | |
Ratio of Net Investment Loss to Average Net Assets(7) | | | (1.00 | )%(6) | |
Portfolio Turnover Rate | | | 0 | %(5) | |
(7) Supplemental Information on the Ratios to Average Net Assets: | |
Ratios Before Expense Limitation: | |
Expenses to Average Net Assets | | | 913.94 | %(6) | |
Net Investment Loss to Average Net Assets | | | (913.94 | )%(6) | |
(1) Commencement of Operations.
(2) Per share amount is based on average shares outstanding.
(3) Amount is less than $0.005 per share.
(4) Calculated based on the net asset value as of the last business day of the period.
(5) Not annualized.
(6) Annualized.
The accompanying notes are an integral part of the financial statements.
9
Morgan Stanley Institutional Fund, Inc.
Annual Report — December 31, 2018
Financial Highlights
Global Endurance Portfolio
| | | Class A | |
Selected Per Share Data and Ratios | | Period Ended
December 31, 2018(1) | |
Net Asset Value, Beginning of Period | | $ | 10.00 | | |
Loss from Investment Operations: | |
Net Investment Loss(2) | | | (0.00 | )(3) | |
Net Realized and Unrealized Loss | | | (0.02 | ) | |
Total from Investment Operations | | | (0.02 | ) | |
Net Asset Value, End of Period | | $ | 9.98 | | |
Total Return(4) | | | 0.00 | %(5) | |
Ratios and Supplemental Data: | |
Net Assets, End of Period (Thousands) | | $ | 10 | | |
Ratio of Expenses to Average Net Assets(7) | | | 1.35 | %(6) | |
Ratio of Net Investment Loss to Average Net Assets(7) | | | (1.35 | )%(6) | |
Portfolio Turnover Rate | | | 0 | %(5) | |
(7) Supplemental Information on the Ratios to Average Net Assets: | |
Ratios Before Expense Limitation: | |
Expenses to Average Net Assets | | | 927.90 | %(6) | |
Net Investment Loss to Average Net Assets | | | (927.90 | )%(6) | |
(1) Commencement of Operations.
(2) Per share amount is based on average shares outstanding.
(3) Amount is less than $0.005 per share.
(4) Calculated based on the net asset value which does not reflect sales charges, if applicable, as of the last business day of the period.
(5) Not annualized.
(6) Annualized.
The accompanying notes are an integral part of the financial statements.
10
Morgan Stanley Institutional Fund, Inc.
Annual Report — December 31, 2018
Financial Highlights
Global Endurance Portfolio
| | | Class C | |
Selected Per Share Data and Ratios | | Period Ended
December 31, 2018(1) | |
Net Asset Value, Beginning of Period | | $ | 10.00 | | |
Loss from Investment Operations: | |
Net Investment Loss(2) | | | (0.00 | )(3) | |
Net Realized and Unrealized Loss | | | (0.02 | ) | |
Total from Investment Operations | | | (0.02 | ) | |
Net Asset Value, End of Period | | $ | 9.98 | | |
Total Return(4) | | | 0.00 | %(5) | |
Ratios and Supplemental Data: | |
Net Assets, End of Period (Thousands) | | $ | 10 | | |
Ratio of Expenses to Average Net Assets(7) | | | 2.10 | %(6) | |
Ratio of Net Investment Loss to Average Net Assets(7) | | | (2.10 | )%(6) | |
Portfolio Turnover Rate | | | 0 | %(5) | |
(7) Supplemental Information on the Ratios to Average Net Assets: | |
Ratios Before Expense Limitation: | |
Expenses to Average Net Assets | | | 928.63 | %(6) | |
Net Investment Loss to Average Net Assets | | | (928.63 | )%(6) | |
(1) Commencement of Operations.
(2) Per share amount is based on average shares outstanding.
(3) Amount is less than $0.005 per share.
(4) Calculated based on the net asset value which does not reflect sales charges, if applicable, as of the last business day of the period.
(5) Not annualized.
(6) Annualized.
The accompanying notes are an integral part of the financial statements.
11
Morgan Stanley Institutional Fund, Inc.
Annual Report — December 31, 2018
Financial Highlights
Global Endurance Portfolio
| | | Class IS | |
Selected Per Share Data and Ratios | | Period Ended
December 31, 2018(1) | |
Net Asset Value, Beginning of Period | | $ | 10.00 | | |
Loss from Investment Operations: | |
Net Investment Loss(2) | | | (0.00 | )(3) | |
Net Realized and Unrealized Loss | | | (0.02 | ) | |
Total from Investment Operations | | | (0.02 | ) | |
Net Asset Value, End of Period | | $ | 9.98 | | |
Total Return(4) | | | 0.00 | %(5) | |
Ratios and Supplemental Data: | |
Net Assets, End of Period (Thousands) | | $ | 10 | | |
Ratio of Expenses to Average Net Assets(7) | | | 0.95 | %(6) | |
Ratio of Net Investment Income (Loss) to Average Net Assets(7) | | | (0.95 | )%(6) | |
Portfolio Turnover Rate | | | 0 | %(5) | |
(7) Supplemental Information on the Ratios to Average Net Assets: | |
Ratios Before Expense Limitation: | |
Expenses to Average Net Assets | | | 927.65 | %(6) | |
Net Investment Loss to Average Net Assets | | | (927.65 | )%(6) | |
(1) Commencement of Operations.
(2) Per share amount is based on average shares outstanding.
(3) Amount is less than $0.005 per share.
(4) Calculated based on the net asset value as of the last business day of the period.
(5) Not annualized.
(6) Annualized.
The accompanying notes are an integral part of the financial statements.
12
Morgan Stanley Institutional Fund, Inc.
Annual Report — December 31, 2018
Notes to Financial Statements
Morgan Stanley Institutional Fund, Inc. (the "Company") is registered under the Investment Company Act of 1940, as amended (the "Act"), as an open-end management investment company. The Company is comprised of thirty separate, active, diversified and non-diversified funds (individually referred to as a "Fund", collectively as the "Funds"). The Company applies investment company accounting and reporting guidance.
The accompanying financial statements relate to the Global Endurance Portfolio. The Fund seeks long-term capital appreciation.
The Fund commenced operations on December 31, 2018 and offers four classes of shares — Class I, Class A, Class C and Class IS.
A. Significant Accounting Policies: The following significant accounting policies are in conformity with U.S. generally accepted accounting principles ("GAAP"). Such policies are consistently followed by the Company in the preparation of its financial statements. GAAP may require management to make estimates and assumptions that affect the reported amounts and disclosures in the financial statements. Actual results may differ from those estimates.
In August 2018, the Financial Accounting Standards Board ("FASB") issued Accounting Standards Update ("ASU") 2018-13, Fair Value Measurement (Topic 820) — Disclosures Framework — Changes to Disclosure Requirements of Fair Value Measurement ("ASU 2018-13") which introduces new fair value disclosure requirements as well as eliminates and modifies certain existing fair value disclosure requirements. ASU 2018-13 would be effective for fiscal years beginning after December 15, 2019 and for interim periods within those fiscal years; however, management has elected to early adopt ASU 2018-13 effective with the current reporting period as permitted by the standard. The impact of the Fund's adoption was limited to changes in the Fund's financial statement disclosures regarding fair value, primarily those disclosures related to transfers between levels of the fair value hierarchy and disclosure of the range and weighted average used to develop significant unobservable inputs for Level 3 fair value measurements, when applicable.
1. Security Valuation: (1) An equity portfolio security listed or traded on an exchange is valued at its latest reported sales price (or at the exchange official closing price if such exchange reports an official closing price), and if
there were no sales on a given day and if there is no official exchange closing price for that day, the security is valued at the mean between the last reported bid and asked prices if such bid and asked prices are available on the relevant exchanges. Listed equity securities not traded on the valuation date with no reported bid and asked prices available on the exchange are valued at the mean between the current bid and asked prices obtained from one or more reputable brokers or dealers. In cases where a security is traded on more than one exchange, the security is valued on the exchange designated as the primary market; (2) all other equity portfolio securities for which over-the-counter ("OTC") market quotations are readily available are valued at the latest reported sales price (or at the market official closing price if such market reports an official closing price), and if there was no trading in the security on a given day and if there is no official closing price from relevant markets for that day, the security is valued at the mean between the last reported bid and asked prices if such bid and asked prices are available on the relevant markets. An unlisted equity security that does not trade on the valuation date and for which bid and asked prices from the relevant markets are unavailable is valued at the mean between the current bid and asked prices obtained from one or more reputable brokers or dealers; (3) certain portfolio securities may be valued by an outside pricing service/vendor approved by the Company's Board of Directors (the "Directors"). The pricing service/vendor may employ a pricing model that takes into account, among other things, bids, yield spreads and/or other market data and specific security characteristics. Alternatively, if a valuation is not available from an outside pricing service/vendor, and the security trades on an exchange, the security may be valued at its latest reported sale price (or at the exchange official closing price if such exchange reports an official closing price), prior to the time when assets are valued. If there are no sales on a given day and if there is no official exchange closing price for that day, the security is valued at the mean between the last reported bid and asked prices if such bid and asked prices are available in the relevant exchanges; (4) when market quotations are not readily available, including circumstances under which Morgan Stanley Investment Management Inc. (the "Adviser") determines that the closing price, last sale price or the mean between the last reported bid and asked prices
13
Morgan Stanley Institutional Fund, Inc.
Annual Report — December 31, 2018
Notes to Financial Statements (cont'd)
are not reflective of a security's market value, portfolio securities are valued at their fair value as determined in good faith under procedures established by and under the general supervision of the Directors. Occasionally, developments affecting the closing prices of securities and other assets may occur between the times at which valuations of such securities are determined (that is, close of the foreign market on which the securities trade) and the close of business of the New York Stock Exchange ("NYSE"). If developments occur during such periods that are expected to materially affect the value of such securities, such valuations may be adjusted to reflect the estimated fair value of such securities as of the close of the NYSE, as determined in good faith by the Directors or by the Adviser using a pricing service and/or procedures approved by the Directors; and (5) quotations of foreign portfolio securities, other assets and liabilities and forward contracts stated in foreign currency are translated into U.S. dollar equivalents at the prevailing market rates prior to the close of the NYSE.
The Directors have responsibility for determining in good faith the fair value of the investments, and the Directors may appoint others, such as the Company's Adviser or a valuation committee, to assist the Directors in determining fair value and to make the actual calculations pursuant to the fair valuation methodologies previously approved by the Directors. Under procedures approved by the Directors, the Company's Adviser has formed a Valuation Committee whose members are approved by the Directors. The Valuation Committee provides administration and oversight of the Company's valuation policies and procedures, which are reviewed at least annually by the Directors. These procedures allow the Company to utilize independent pricing services, quotations from securities and financial instrument dealers and other market sources to determine fair value.
2. Fair Value Measurement: FASB Accounting Standards CodificationTM ("ASC") 820, "Fair Value Measurement" ("ASC 820"), defines fair value as the value that the Fund would receive to sell an investment or pay to transfer a liability in a timely transaction with an independent
buyer in the principal market, or in the absence of a principal market, the most advantageous market for the investment or liability. ASC 820 establishes a three-tier hierarchy to distinguish between (1) inputs that reflect the assumptions market participants would use in valuing an asset or liability developed based on market data obtained from sources independent of the reporting entity (observable inputs) and (2) inputs that reflect the reporting entity's own assumptions about the assumptions market participants would use in valuing an asset or liability developed based on the best information available in the circumstances (unobservable inputs) and to establish classification of fair value measurements for disclosure purposes. Various inputs are used in determining the value of the Fund's investments. The inputs are summarized in the three broad levels listed below:
• Level 1 – unadjusted quoted prices in active markets for identical investments
• Level 2 – other significant observable inputs (including quoted prices for similar investments, interest rates, prepayment speeds, credit risk, etc.)
• Level 3 – significant unobservable inputs including the Fund's own assumptions in determining the fair value of investments. Factors considered in making this determination may include, but are not limited to, information obtained by contacting the issuer, analysts, or the appropriate stock exchange (for exchange-traded securities), analysis of the issuer's financial statements or other available documents and, if necessary, available information concerning other securities in similar circumstances
The inputs or methodology used for valuing securities are not necessarily an indication of the risk associated with investing in those securities and the determination of the significance of a particular input to the fair value measurement in its entirety requires judgment and considers factors specific to each security.
14
Morgan Stanley Institutional Fund, Inc.
Annual Report — December 31, 2018
Notes to Financial Statements (cont'd)
The following is a summary of the inputs used to value the Fund's investments as of December 31, 2018:
Investment Type | | Level 1
Unadjusted
quoted
prices
(000) | | Level 2
Other
significant
observable
inputs
(000) | | Level 3
Significant
unobservable
inputs
(000) | | Total
(000) | |
Assets: | |
Common Stocks | |
Aerospace & Defense | | $ | 97 | | | $ | — | | | $ | — | | | $ | 97 | | |
Air Freight & Logistics | | | 43 | | | | — | | | | — | | | | 43 | | |
Banks | | | — | | | | 46 | | | | — | | | | 46 | | |
Biotechnology | | | 10 | | | | — | | | | — | | | | 10 | | |
Chemicals | | | 82 | | | | — | | | | — | | | | 82 | | |
Commercial Services &
Supplies | | | 213 | | | | — | | | | — | | | | 213 | | |
Communications
Equipment | | | 11 | | | | — | | | | — | | | | 11 | | |
Consumer Finance | | | — | | | | 52 | | | | — | | | | 52 | | |
Diversified Consumer
Services | | | 22 | | | | — | | | | — | | | | 22 | | |
Diversified Financial
Services | | | — | | | | 28 | | | | — | | | | 28 | | |
Electrical Equipment | | | — | | | | 47 | | | | — | | | | 47 | | |
Electronic Equipment,
Instruments &
Components | | | — | | | | 24 | | | | — | | | | 24 | | |
Entertainment | | | 105 | | | | 27 | | | | — | | | | 132 | | |
Food Products | | | — | | | | 24 | | | | — | | | | 24 | | |
Health Care
Equipment &
Supplies | | | 12 | | | | — | | | | — | | | | 12 | | |
Health Care
Providers &
Services | | | 131 | | | | 65 | | | | — | | | | 196 | | |
Household Durables | | | 25 | | | | 81 | | | | — | | | | 106 | | |
Information Technology
Services | | | 154 | | | | — | | | | — | | | | 154 | | |
Professional Services | | | 21 | | | | — | | | | — | | | | 21 | | |
Real Estate
Management &
Development | | | 67 | | | | — | | | | — | | | | 67 | | |
Road & Rail | | | 89 | | | | — | | | | — | | | | 89 | | |
Software | | | 264 | | | | — | | | | — | | | | 264 | | |
Specialty Retail | | | 52 | | | | — | | | | — | | | | 52 | | |
Trading Companies &
Distributors | | | — | | | | 20 | | | | — | | | | 20 | | |
Transportation
Infrastructure | | | — | | | | 25 | | | | — | | | | 25 | | |
Total Common Stocks | | | 1,398 | | | | 439 | | | | — | | | | 1,837 | | |
Total Assets | | $ | 1,398 | | | $ | 439 | | | $ | — | | | $ | 1,837 | | |
Transfers between investment levels may occur as the markets fluctuate and/or the availability of data used in an investment's valuation changes.
3. Foreign Currency Translation and Foreign Investments: The books and records of the Fund are maintained in U.S. dollars. Foreign currency amounts are translated into U.S. dollars as follows:
– investments, other assets and liabilities at the prevailing rate of exchange on the valuation date;
– investment transactions and investment income at the prevailing rates of exchange on the dates of such transactions.
Although the net assets of the Fund are presented at the foreign exchange rates and market values at the close of the period, the Fund does not isolate that portion of the results of operations arising as a result of changes in the foreign exchange rates from the fluctuations arising from changes in the market prices of securities held at period end. Similarly, the Fund does not isolate the effect of changes in foreign exchange rates from the fluctuations arising from changes in the market prices of securities sold during the period. Accordingly, realized and unrealized foreign currency gains (losses) on investments in securities are included in the reported net realized and unrealized gains (losses) on investment transactions and balances. However, pursuant to U.S. federal income tax regulations, gains and losses from certain foreign currency transactions and the foreign currency portion of gains and losses realized on sales and maturities of foreign denominated debt securities are treated as ordinary income for U.S. federal income tax purposes.
Net realized gains (losses) on foreign currency transactions represent net foreign exchange gains (losses) from foreign currency forward exchange contracts, disposition of foreign currencies, currency gains (losses) realized between the trade and settlement dates on securities transactions, and the difference between the amount of investment income and foreign withholding taxes recorded on the Fund's books and the U.S. dollar equivalent amounts actually received or paid. Net unrealized currency gains (losses) from valuing foreign currency denominated assets and liabilities at period end exchange rates are reflected as a component of unrealized appreciation (depreciation) in the Statement of Assets and Liabilities. The change in unrealized currency gains (losses) on foreign currency translations for the period is reflected in the Statement of Operations.
15
Morgan Stanley Institutional Fund, Inc.
Annual Report — December 31, 2018
Notes to Financial Statements (cont'd)
Foreign security and currency transactions may involve certain considerations and risks not typically associated with those of U.S. dollar denominated transactions as a result of, among other factors, fluctuations of exchange rates in relation to the U.S. dollar, the possibility of lower levels of governmental supervision and regulation of foreign securities markets and the possibility of political or economic instability.
Governmental approval for foreign investments may be required in advance of making an investment under certain circumstances in some countries, and the extent of foreign investments in domestic companies may be subject to limitation in other countries. Foreign ownership limitations also may be imposed by the charters of individual companies to prevent, among other concerns, violations of foreign investment limitations. As a result, an additional class of shares (identified as "Foreign" in the Portfolio of Investments) may be created and offered for investment. The "local" and "foreign shares" market values may differ. In the absence of trading of the foreign shares in such markets, the Fund values the foreign shares at the closing exchange price of the local shares.
4. Indemnifications: The Company enters into contracts that contain a variety of indemnifications. The Company's maximum exposure under these arrangements is unknown. However, the Company has not had prior claims or losses pursuant to these contracts and expects the risk of loss to be remote.
5. Dividends and Distributions to Shareholders: Dividends and distributions to shareholders are recorded on the ex-dividend date. Dividends from net investment income, if any, are declared and paid annually. Net realized capital gains, if any, are distributed at least annually.
6. Security Transactions, Income and Expenses: Security transactions are accounted for on the trade date (date the order to buy or sell is executed). Realized gains and losses on the sale of investment securities are determined on the specific identified cost method. Dividend income and other distributions are recorded on the ex-dividend date (except for certain foreign dividends which may be recorded as soon as the Fund is informed of such dividends) net of applicable withholding taxes. Interest income is recognized on the accrual basis except where collection is in doubt. Discounts are accreted and premi-
ums are amortized over the life of the respective securities. Most expenses of the Company can be directly attributed to a particular Fund. Expenses which cannot be directly attributed are apportioned among the Funds based upon relative net assets or other appropriate methods. Income, expenses (other than class specific expenses — distribution and shareholder services, transfer agency and sub transfer agency fees) and realized and unrealized gains or losses are allocated to each class of shares based upon their relative net assets.
B. Advisory Fees: The Adviser, a wholly-owned subsidiary of Morgan Stanley, provides the Fund with advisory services under the terms of an Investment Advisory Agreement, paid quarterly, at the annual rate based on the daily net assets as follows:
First $1
billion | | Over $1
billion | |
| | 0.80 | % | | | 0.75 | % | |
For the period ended December 31, 2018, the advisory fee rate (net of waiver/rebate) was equivalent to an annual effective rate of 0.00% of the Fund's average daily net assets.
The Adviser has agreed to reduce its advisory fee and/or reimburse the Fund so that total annual portfolio operating expenses, excluding certain investment related expenses, taxes, interest and other extraordinary expenses (including litigation), will not exceed 1.00% for Class I shares, 1.35% for Class A shares, 2.10% for Class C shares and 0.95% for Class IS shares. The fee waivers and/or expense reimbursements will continue for at least one year from the date of the Fund's prospectus or until such time as the Directors act to discontinue all or a portion of such waivers and/or reimbursements when they deem such action is appropriate. For the period ended December 31, 2018, less than $500 of advisory fees were waived and approximately $51,000 of other expenses were reimbursed by the Adviser pursuant to this arrangement.
C. Administration Fees: The Adviser also serves as Administrator to the Company and provides administrative services pursuant to an Administration Agreement for an annual fee, accrued daily and paid monthly, of 0.08% of the Fund's average daily net assets.
Under a Sub-Administration Agreement between the Administrator and State Street Bank and Trust Company ("State Street"), State Street provides certain administrative services to the Company. For such services, the Administrator pays State Street a portion of the fee the Administrator receives from the Fund.
16
Morgan Stanley Institutional Fund, Inc.
Annual Report — December 31, 2018
Notes to Financial Statements (cont'd)
D. Distribution and Shareholder Services Fees: Morgan Stanley Distribution, Inc. ("MSDI" or the "Distributor"), a wholly-owned subsidiary of the Adviser and an indirect subsidiary of Morgan Stanley, serves as the Company's Distributor of Fund shares pursuant to a Distribution Agreement. The Company has adopted a Shareholder Services Plan with respect to Class A shares pursuant to Rule 12b-1 under the Act. Under the Shareholder Services Plan, the Fund pays the Distributor a shareholder services fee, accrued daily and paid monthly, at an annual rate of 0.25% of the Fund's average daily net assets attributable to Class A shares.
The Company has adopted a Distribution and Shareholder Services Plan with respect to Class C shares pursuant to Rule 12b-1 under the Act. Under the Distribution and Shareholder Services Plan, the Fund pays the Distributor a distribution fee, accrued daily and paid monthly, at an annual rate of 0.75% and a shareholder services fee, accrued daily and paid monthly, at an annual rate of 0.25% of the Fund's average daily net assets attributable to Class C shares.
The distribution and shareholder services fees are used to support the expenses associated with servicing and maintaining accounts. The Distributor may compensate other parties for providing shareholder support services to investors who purchase Class A and Class C shares.
E. Dividend Disbursing and Transfer Agent: The Company's dividend disbursing and transfer agent is DST Asset Manager Solutions, Inc. ("DST"). Pursuant to a Transfer Agency Agreement, the Company pays DST a fee based on the number of classes, accounts and transactions relating to the Funds of the Company.
F. Custodian Fees: State Street (the "Custodian") also serves as Custodian for the Company in accordance with a Custodian Agreement. The Custodian holds cash, securities and other assets of the Company as required by the Act. Custody fees are payable monthly based on assets held in custody, investment purchases and sales activity and account maintenance fees, plus reimbursement for certain out-of-pocket expenses.
G. Security Transactions and Transactions with Affiliates: For the period ended December 31, 2018, purchases and sales of investment securities for the Fund, other than long-term U.S. Government securities and short-term investments was approximately $1,840,000 and $0, respectively. There were no purchases and sales of long-term U.S. Government securities for the period ended December 31, 2018. For
the period ended December 31, 2018, the Fund did not have any transactions in affiliated investments.
The Fund is permitted to purchase and sell securities ("cross-trade") from and to other Morgan Stanley funds as well as other funds and client accounts for which the Adviser or an affiliate of the Adviser serves as investment adviser, pursuant to procedures approved by the Directors in compliance with Rule 17a-7 under the Act (the "Rule"). Each cross-trade is executed at the current market price in compliance with provisions of the Rule. For the period ended December 31, 2018, the Fund did not engage in any cross-trade transactions.
The Fund has an unfunded Deferred Compensation Plan (the "Compensation Plan"), which allows each independent Director to defer payment of all, or a portion, of the fees he or she receives for serving on the Board of Directors. Each eligible Director generally may elect to have the deferred amounts credited with a return equal to the total return on one or more of the Morgan Stanley funds that are offered as investment options under the Compensation Plan. Appreciation/depreciation and distributions received from these investments are recorded with an offsetting increase/decrease in the deferred compensation obligation and do not affect the NAV of the Fund.
H. Federal Income Taxes: It is the Fund's intention to continue to qualify as a regulated investment company and distribute all of its taxable and tax-exempt income. Accordingly, no provision for federal income taxes is required in the financial statements.
The Fund may be subject to taxes imposed by countries in which it invests. Such taxes are generally based on income and/or capital gains earned or repatriated. Taxes are accrued based on net investment income, net realized gains and net unrealized appreciation as such income and/or gains are earned. Taxes may also be based on transactions in foreign currency and are accrued based on the value of investments denominated in such currency.
FASB ASC 740-10, "Income Taxes — Overall", sets forth a minimum threshold for financial statement recognition of the benefit of a tax position taken or expected to be taken in a tax return. Management has concluded there are no significant uncertain tax positions that would require recognition in the financial statements. If applicable, the Fund recognizes interest accrued related to unrecognized tax benefits in "Interest Expense" and penalties in "Other Expenses" in the Statement of Operations. The Fund files tax returns with the U.S. Internal
17
Morgan Stanley Institutional Fund, Inc.
Annual Report — December 31, 2018
Notes to Financial Statements (cont'd)
Revenue Service, New York and various states. The tax year ended December 31, 2018 remains subject to examination by taxing authorities.
The tax character of distributions paid may differ from the character of distributions shown for GAAP purposes due to short-term capital gains being treated as ordinary income for tax purposes. There were no distributions paid during fiscal year 2018.
The amount and character of income and gains to be distributed are determined in accordance with income tax regulations which may differ from GAAP. These book/tax differences are either considered temporary or permanent in nature.
Temporary differences are attributable to differing book and tax treatments for the timing of the recognition of gains (losses) on certain investment transactions and the timing of the deductibility of certain expenses.
Permanent differences, primarily due to a net operating loss, resulted in the following reclassifications among the components of net assets at December 31, 2018:
Total
Accumulated
Loss
(000) | | Paid-in
Capital
(000) | |
| $ | — | @ | | $ | (— | @) | |
@ Amount is less than $500
At December 31, 2018, the Fund had no distributable earnings on a tax basis.
I. Credit Facility: The Company and other Morgan Stanley funds participated in a $150,000,000 committed, unsecured revolving line of credit facility (the "Facility") with State Street. This Facility is to be used for temporary emergency purposes or funding of shareholder redemption requests. The interest rate on borrowings is based on the federal funds rate or 1 month LIBOR rate plus a spread. The Facility also has a commitment fee of 0.25% per annum based on the unused portion of the Facility. During the period ended December 31, 2018, the Fund did not have any borrowings under the Facility.
J. Other: At December 31, 2018, the Fund had record owners of 10% or greater. Investment activities of these shareholders could have a material impact on the Fund. The aggregate percentage of such owners was 100.0%.
18
Morgan Stanley Institutional Fund, Inc.
Annual Report — December 31, 2018
Report of Independent Registered Public Accounting Firm
To the Shareholders and Board of Directors of
Morgan Stanley Institutional Fund, Inc. —
Global Endurance Portfolio
Opinion on the Financial Statements
We have audited the accompanying statement of assets and liabilities of Global Endurance Portfolio (the "Fund") (one of the funds constituting the Morgan Stanley Institutional Fund, Inc. (the "Company")), including the portfolio of investments, as of December 31, 2018, and the related statements of operations and changes in net assets and the financial highlights for the period from December 31, 2018 (commencement of operations) through December 31, 2018 and the related notes (collectively referred to as the "financial statements"). In our opinion, the financial statements present fairly, in all material respects, the financial position of Global Endurance Portfolio (one of the funds constituting Morgan Stanley Institutional Fund, Inc.) at December 31, 2018, the results of its operations for the year then ended, the changes in its net assets and its financial highlights for the period from December 31, 2018 (commencement of operations) through December 31, 2018, in conformity with U.S. generally accepted accounting principles.
Basis for Opinion
These financial statements are the responsibility of the Company's management. Our responsibility is to express an opinion on the Fund's financial statements based on our audit. We are a public accounting firm registered with the Public Company Accounting Oversight Board (United States) ("PCAOB") and are required to be independent with respect to the Company in accordance with the U.S. federal securities law and the applicable rules and regulations of the Securities and Exchange Commission and the PCAOB.
We conducted our audit in accordance with the standards of the PCAOB. Those standards require that we plan and perform the audit to obtain reasonable assurance about whether the financial statements are free of material misstatement, whether due to error or fraud. The Company is not required to have, nor were we engaged to perform, an audit of the Company's internal control over financial reporting. As part of our audit, we are required to obtain an understanding of internal control over financial reporting, but not for the purpose of expressing an opinion on the effectiveness of the Company's internal control over financial reporting. Accordingly, we express no such opinion.
Our audit included performing procedures to assess the risks of material misstatement of the financial statements, whether due to error or fraud, and performing procedures that respond to those risks. Such procedures included examining, on a test basis, evidence regarding the amounts and disclosures in the financial statements. Our procedures included confirmation of securities owned as of December 31, 2018 by correspondence with the custodian and others or by other appropriate auditing procedures where replies from others were not received. Our audit also included evaluating the accounting principles used and significant estimates made by management, as well as evaluating the overall presentation of the financial statements. We believe that our audit provides a reasonable basis for our opinion.

We have served as the auditor of one or more Morgan Stanley investment companies since 2000.
Boston, Massachusetts
February 26, 2019
19
Morgan Stanley Institutional Fund, Inc.
Annual Report — December 31, 2018
Investment Advisory Agreement Approval (unaudited)
The Board considered the following factors at the time of approval of the contracts which occurred prior to commencement of operations.
Nature, Extent and Quality of Services
The Board reviewed and considered the nature and extent of the investment advisory services to be provided by the Adviser under the advisory agreement, including portfolio management, investment research and equity and fixed income securities trading. The Board also reviewed and considered the nature and extent of the non-advisory, administrative services to be provided by the Administrator under the administration agreement, including accounting, operations, clerical, bookkeeping, compliance, business management and planning, legal services and the provision of supplies, office space and utilities at the Adviser's expense. The Board also considered the Adviser's investment in personnel and infrastructure that benefits the Fund. (The Adviser and Administrator together are referred to as the "Adviser," and the advisory and administration agreements together are referred to as the "Management Agreement.") The Board also considered that the Adviser serves a variety of other investment advisory clients and has experience overseeing service providers.
The Board reviewed and considered the qualifications of the portfolio managers, the senior administrative managers and other key personnel of the Adviser who will provide the advisory and administrative services to the Fund. The Board determined that the Adviser's portfolio managers and key personnel are well qualified by education and/or training and experience to perform the services in an efficient and professional manner. The Board concluded that the nature and extent of the advisory and administrative services to be provided were necessary and appropriate for the conduct of the business and investment activities of the Fund and supported its decision to approve the Management Agreement.
Performance, Fees and Expenses of the Fund
The Board considered that the Adviser plans to arrange for a public offering of shares of the Fund to raise assets for investment and that the offering had not yet begun and concluded that, since the Fund currently had no assets to invest (other than seed capital required under the Investment Company Act) and had no track record of performance, this was not a factor it needed to address at the present time.
The Board reviewed the advisory and administrative fee rates (the "management fee rates") proposed to be paid by the Fund under the Management Agreement relative to comparable funds advised by the Adviser, when applicable, and compared to their peers as determined by the Adviser, and reviewed the anticipated total expense ratio of the Fund. The Board considered that the Fund requires the Adviser to develop processes, invest in additional resources and incur additional risks to successfully manage the Fund and concluded that the proposed management fee rate and anticipated total expense ratio would be competitive with its peer group averages.
Economies of Scale
The Board considered the growth prospects of the Fund and the structure of the proposed management fee schedule, which includes breakpoints. The Board considered that the Fund's potential growth was uncertain and concluded that it would be premature to consider economies of scale as a factor in approving the Management Agreement at the present time.
Profitability of the Adviser and Affiliates
Since the Fund had not begun operations and had not paid any fees to the Adviser, the Board concluded that this was not a factor that needed to be considered at the present time.
Other Benefits of the Relationship
The Board considered other direct and indirect benefits to the Adviser and/or its affiliates to be derived from their relationship with the Fund and other funds advised by the Adviser. These benefits may include, among other things, fees for trading, distribution and/or shareholder servicing and for transaction processing and reporting platforms used by securities lending agents, and research received by the Adviser generated from commission dollars spent on funds' portfolio trading. Since the Fund had not begun operations and had not paid any fees to the Adviser, the Board concluded that these benefits were not a factor that needed to be considered at the present time.
20
Morgan Stanley Institutional Fund, Inc.
Annual Report — December 31, 2018
Investment Advisory Agreement Approval (unaudited) (cont'd)
Resources of the Adviser and Historical Relationship Between the Fund and the Adviser
The Board considered whether the Adviser is financially sound and has the resources necessary to perform its obligations under the Management Agreement. The Board also reviewed and considered the organizational structure of the Adviser, the policies and procedures formulated and adopted by the Adviser for managing the Fund's operations and the Board's confidence in the competence and integrity of the senior managers and key personnel of the Adviser. The Board concluded that the Adviser has the financial resources necessary to fulfill its obligations under the Management Agreement and that it is beneficial for the Fund to enter into this relationship with the Adviser.
Other Factors and Current Trends
The Board considered the controls and procedures adopted and implemented by the Adviser and monitored by the Fund's Chief Compliance Officer and concluded that the conduct of business by the Adviser indicates a good faith effort on its part to adhere to high ethical standards in the conduct of the Fund's business.
General Conclusion
After considering and weighing all of the above factors, with various written materials and verbal information presented by the Adviser, the Board concluded that it would be in the best interest of the Fund and its future shareholders to approve the Management Agreement, which will remain in effect for two years and thereafter must be approved annually by the Board of the Fund if it is to continue in effect. In reaching this conclusion the Board did not give particular weight to any single piece of information or factor referenced above. It is possible that individual Board members may have weighed these factors, and the information presented, differently in reaching their individual decisions to approve the Management Agreement.
21
Morgan Stanley Institutional Fund, Inc.
Annual Report — December 31, 2018
Privacy Notice (unaudited)
MORGAN STANLEY INVESTMENT MANAGEMENT INC.
AN IMPORTANT NOTICE CONCERNING OUR U.S. PRIVACY POLICY
We are required by federal law to provide you with a copy of our privacy policy annually. This policy applies to current and former individual investors in funds managed or sponsored by Morgan Stanley Investment Management Inc. ("MSIM") as well as current and former individual clients of MSIM. This policy is not applicable to partnerships, corporations, trusts or other non-individual clients or investors. Please note that we may amend this policy at any time, and will inform you of any changes as required by law.
WE RESPECT YOUR PRIVACY
We appreciate that you have provided us with your personal financial information. We strive to maintain the privacy of such information while we help you achieve your financial objectives. This Notice describes what non-public personal information we collect about you, why we collect it, when we may share it with others and how certain others may use it. It discusses the steps you may take to limit our sharing of certain information about you to affiliated companies in the Morgan Stanley family of companies ("other Morgan Stanley companies"). It also discloses how you may limit use of certain shared information for marketing purposes by other Morgan Stanley branded companies. Throughout this policy, we refer to the non-public information that personally identifies you or your accounts as "personal information."
1. WHAT PERSONAL INFORMATION DO WE COLLECT ABOUT YOU?
We obtain personal information from applications and other forms you submit to us, from your dealings with us, from consumer reporting agencies, from our Web sites and from third parties and other sources.
For example:
• We may collect information such as your name, address, e-mail address, telephone/fax numbers, assets, income and investment objectives through subscription documents, applications and other forms you submit to us.
• We may obtain information about account balances, your use of account(s) and the types of products and services you prefer to receive from us through your dealings and transactions with us and other sources.
• We may obtain information about your creditworthiness and credit history from consumer reporting agencies.
• We may collect background information from and through third-party vendors to verify representations you have made and to comply with various regulatory requirements.
• If you interact with us through our public and private Web sites, we may collect information that you provide directly through online communications (such as an e-mail address). We may also collect information about your Internet service provider, your domain name, your computer's operating system and Web browser, your use of our Web sites and your product and service preferences, through the use of "cookies." Please consult the Terms of Use of these sites for more details.
2. WHEN DO WE DISCLOSE PERSONAL INFORMATION WE COLLECT ABOUT YOU?
We may disclose personal information we collect about you to other Morgan Stanley companies and to non-affiliated third parties.
a. Information We Disclose to Other Morgan Stanley Companies.
We may disclose personal information to other Morgan Stanley companies for a variety of reasons, including to manage your account(s) effectively, to service and process your transactions, to let you know about products and services offered by us and other Morgan Stanley companies, to manage our business, and as otherwise required or permitted by law. Offers for products and services from other Morgan Stanley companies are developed under conditions designed to safeguard your personal information.
22
Morgan Stanley Institutional Fund, Inc.
Annual Report — December 31, 2018
Privacy Notice (unaudited) (cont'd)
b. Information We Disclose to Non-affiliated Third Parties.
We do not disclose personal information that we collect about you to non-affiliated third parties except to those who provide marketing services on our behalf, to financial institutions with whom we have joint marketing agreements, and as otherwise required or permitted by law. For example, we may disclose personal information to non-affiliated third parties for servicing and processing transactions, to offer our own products and services, to protect against fraud, for institutional risk control, to respond to judicial process or to perform services on our behalf. When we share personal information with a non-affiliated third party, they are required to limit their use of personal information to the particular purpose for which it was shared and they are not allowed to share personal information with others except to fulfill that limited purpose or as may be permitted or required by law.
3. HOW DO WE PROTECT THE SECURITY AND CONFIDENTIALITY OF PERSONAL INFORMATION WE COLLECT ABOUT YOU?
We maintain physical, electronic and procedural security measures to help safeguard the personal information we collect about you. We have internal policies governing the proper handling of client information. Third parties that provide support or marketing services on our behalf may also receive personal information, and we require them to adhere to confidentiality standards with respect to such information.
4. HOW CAN YOU LIMIT THE SHARING OF CERTAIN TYPES OF PERSONAL INFORMATION WITH OTHER MORGAN STANLEY COMPANIES?
We offer you choices as to whether we share with other Morgan Stanley companies the personal information that was collected to determine your eligibility for products and services you request ("eligibility information"). Eligibility information does not include your identification information or personal information pertaining to our transactions or experiences with you. Please note that, even if you direct us not to share eligibility information with other Morgan Stanley companies ("opt-out"), we may still share personal information, including eligibility information, with those companies in circumstances excluded from the opt-out under applicable law, such as to process transactions or to service your account.
5. HOW CAN YOU LIMIT THE USE OF CERTAIN TYPES OF PERSONAL INFORMATION BY OTHER MORGAN STANLEY COMPANIES FOR MARKETING?
By following the opt-out instructions in Section 6 below, you may limit other Morgan Stanley branded companies from marketing their products or services to you based on personal information we disclose to them. This information may include, for example, your income and account history with us. Please note that, even if you choose to limit Other Morgan Stanley Companies from using personal information about you that we may share with them for marketing their products and services to you, Other Morgan Stanley Companies may use your personal information that they obtain from us to market to you in circumstances permitted by law, such as if the Other Morgan Stanley Company has its own relationship with you.
6. HOW CAN YOU SEND US AN OPT-OUT INSTRUCTION?
If you wish to limit our sharing of eligibility information about you with other Morgan Stanley companies or other Morgan Stanley companies' use of personal information for marketing purposes, as described in this notice, you may do so by:
• Calling us at (800) 548-7786
Monday–Friday between 8a.m. and 6p.m.(EST)
• Writing to us at the following address:
DST Asset Manager Solutions, Inc.
c/o Privacy Coordinator
P.O. Box 219804
Kansas City, Missouri 64121
23
Morgan Stanley Institutional Fund, Inc.
Annual Report — December 31, 2018
Privacy Notice (unaudited) (cont'd)
Your written request should include your name, address, telephone number and account number(s) to which the opt-out applies and whether you are opting out with respect to sharing of eligibility information (Section 4 above), or if information used for Marketing (Section 5 above) or both. Written opt-out requests should not be sent with any other correspondence. In order to process your request, we require that the request be provided by you directly and not through a third party.
Your opt-out preference will remain in effect with respect to this policy (as it may be amended) until you notify us otherwise. If you have a joint account, your direction for us not to share this information with other Morgan Stanley companies and for those other Morgan Stanley companies not to use your personal information for marketing will be applied to all account holders on that account. Please understand that if you limit our sharing or our affiliated companies' use of personal information, you and any joint account holder(s) may not receive information about Morgan Stanley products and services, including products or services that could help you manage your financial resources and achieve your investment objectives.
7. WHAT IF AN AFFILIATED COMPANY BECOMES A NON-AFFILIATED THIRD PARTY?
If, at any time in the future, an affiliated company becomes a non-affiliated third party, further disclosures of personal information made to the former affiliated company will be limited to those described in Section 2(b) above relating to non-affiliated third parties. If you elected under Section 6 to limit disclosures we make to affiliated companies, or use of personal information by affiliated companies, your election will not apply to use by any former affiliated company of your personal information in their possession once it becomes a non-affiliated third party.
SPECIAL NOTICE TO RESIDENTS OF VERMONT
The following section supplements our policy with respect to our individual clients who have a Vermont address and supersedes anything to the contrary in the above policy with respect to those clients only.
The state of Vermont requires financial institutions to obtain your consent prior to sharing personal information that they collect about you with affiliated companies and non-affiliated third parties other than in certain limited circumstances. Except as permitted by law, we will not share personal information we collect about you with non-affiliated third parties or other Morgan Stanley companies unless you provide us with your written consent to share such information ("opt-in").
If you wish to receive offers for investment products and services offered by or through other Morgan Stanley companies, please notify us in writing at the following address:
DST Asset Manager Solutions, Inc.
c/o Privacy Coordinator
P.O. Box 219804
Kansas City, Missouri 64121
Your authorization should include your name, address, telephone number and account number(s) to which the opt-in applies and should not be sent with any other correspondence. In order to process your authorization, we require that the authorization be provided by you directly and not through a third party.
SPECIAL NOTICE TO RESIDENTS OF CALIFORNIA
The following section supplements our policy with respect to our individual clients who have a California address and supersedes anything to the contrary in the above policy with respect to those clients only.
In response to a California law, if your account has a California home address, your personal information will not be disclosed to non-affiliated third parties except as permitted by applicable California law, and we will limit sharing such information with our affiliates to comply with California privacy laws that apply to us.
24
Morgan Stanley Institutional Fund, Inc.
Annual Report — December 31, 2018
Director and Officer Information (unaudited)
Independent Directors:
Name, Age and Address of
Independent Director | | Position(s)
Held with
Registrant | | Length of Time
Served* | | Principal Occupation(s) During Past 5 Years
and Other Relevant Professional Experience | | Number of
Portfolios in
Fund Complex
Overseen by
Independent
Director** | | Other Directorships
Held by Independent
Director*** | |
Frank L. Bowman (74)
c/o Perkins Coie LLP
Counsel to the Independent
Directors
30 Rockefeller Plaza
New York, NY 10112 | | Director | | Since
August
2006 | | President, Strategic Decisions, LLC (consulting) (since February 2009); Director or Trustee of various Morgan Stanley Funds (since August 2006); Chairperson of the Compliance and Insurance Committee (since October 2015); formerly, Chairperson of the Insurance Sub-Committee of the Compliance and Insurance Committee (2007-2015); served as President and Chief Executive Officer of the Nuclear Energy Institute (policy organization) (February 2005-November 2008); retired as Admiral, U.S. Navy after serving over 38 years on active duty including 8 years as Director of the Naval Nuclear Propulsion Program in the Department of the Navy and the U.S. Department of Energy (1996-2004); served as Chief of Naval Personnel (July 1994-September 1996) and on the Joint Staff as Director of Political Military Affairs (June 1992-July 1994); knighted as Honorary Knight Commander of the Most Excellent Order of the British Empire; awarded the Officier de l'Orde National du Mérite by the French Government; elected to the National Academy of Engineering (2009). | | | 82 | | | Director of BP p.l.c.; Director of Naval and Nuclear Technologies LLP; Director Emeritus of the Armed Services YMCA; Member of the National Security Advisory Council of the Center for U.S. Global Engagement and a member of the CNA Military Advisory Board; Trustee of Fairhaven United Methodist Church; Member of the Board of Advisors of the Dolphin Scholarship Foundation; and Director of other various non-profit organizations. | |
Kathleen A. Dennis (65)
c/o Perkins Coie LLP
Counsel to the Independent Directors
30 Rockefeller Plaza
New York, NY 10112 | | Director | | Since
August
2006 | | President, Cedarwood Associates (mutual fund and investment management consulting) (since July 2006); Chairperson of the Liquidity and Alternatives Sub-Committee of the Investment Committee (since October 2006) and Director or Trustee of various Morgan Stanley Funds (since August 2006); formerly, Senior Managing Director of Victory Capital Management (1993-2006). | | | 82 | | | Director of various non-profit organizations. | |
Nancy C. Everett (63)
c/o Perkins Coie LLP
Counsel to the Independent Directors
30 Rockefeller Plaza
New York, NY 10112 | | Director | | Since
January
2015 | | Chief Executive Officer, Virginia Commonwealth University Investment Company (since November 2015); Owner, OBIR, LLC (institutional investment management consulting) (since June 2014); formerly, Managing Director, BlackRock Inc. (February 2011-December 2013); and Chief Executive Officer, General Motors Asset Management (a/k/a Promark Global Advisors, Inc.) (June 2005-May 2010). | | | 83 | | | Formerly, Member of Virginia Commonwealth University School of Business Foundation (2005-2016); Member of Virginia Commonwealth University Board of Visitors (2013-2015); Member of Committee on Directors for Emerging Markets Growth Fund, Inc. (2007-2010); Chairperson of Performance Equity Management, LLC (2006-2010); and Chairperson, GMAM Absolute Return Strategies Fund, LLC (2006-2010). | |
25
Morgan Stanley Institutional Fund, Inc.
Annual Report — December 31, 2018
Director and Officer Information (unaudited) (cont'd)
Independent Directors: (cont'd)
Name, Age and Address of
Independent Director | | Position(s)
Held with
Registrant | | Length of Time
Served* | | Principal Occupation(s) During Past 5 Years
and Other Relevant Professional Experience | | Number of
Portfolios in
Fund Complex
Overseen by
Independent
Director** | | Other Directorships
Held by Independent
Director*** | |
Jakki L. Haussler (61)
c/o Perkins Coie LLP
Counsel to the Independent Directors
30 Rockefeller Plaza
New York, NY 10112 | | Director | | Since
January
2015 | | Chairman and Chief Executive Officer, Opus Capital Group (since January 1996); formerly, Director, Capvest Venture Fund, LP (May 2000-December 2011); Partner, Adena Ventures, LP (July 1999-December 2010); Director, The Victory Funds (February 2005-July 2008). | | | 83 | | | Director of Service Corporation International and Member, Audit Committee and Investment Committee; Director of Cincinnati Bell Inc. and Member, Audit Committee and Governance and Nominating Committee; Chairman of Northern Kentucky University Member Investment Committee; Member of Chase College of Law Transactional Law Practice Center Board of Advisors; Director of Best Transport; Director of Chase College of Law Board of Visitors; formerly, Member, University of Cincinnati Foundation Investment Committee; Member, Miami University Board of Visitors (2008-2011); Trustee of Victory Funds (2005-2008) and Chairman, Investment Committee (2007-2008) and Member, Service Provider Committee (2005-2008). | |
Dr. Manuel H. Johnson (69)
c/o Johnson Smick
International, Inc.
220 I Street, NE — Suite 200
Washington, D.C. 20002 | | Director | | Since
July
1991 | | Senior Partner, Johnson Smick International, Inc. (consulting firm); Chairperson of the Investment Committee (since October 2006) and Director or Trustee of various Morgan Stanley Funds (since July 1991); Co-Chairman and a founder of the Group of Seven Council (G7C) (international economic commission); formerly, Chairperson of the Audit Committee (July 1991-September 2006), Vice Chairman of the Board of Governors of the Federal Reserve System and Assistant Secretary of the U.S. Treasury. | | | 82 | | | Director of NVR, Inc. (home construction). | |
Joseph J. Kearns (76)
c/o Perkins Coie LLP
Counsel to the Independent Directors
30 Rockefeller Plaza
New York, NY 10112 | | Director | | Since
August
1994 | | Senior Adviser, Kearns & Associates LLC (investment consulting); Chairperson of the Audit Committee (since October 2006) and Director or Trustee of various Morgan Stanley Funds (since August 1994); formerly, Deputy Chairperson of the Audit Committee (July 2003-September 2006) and Chairperson of the Audit Committee of various Morgan Stanley Funds (since August 1994); CFO of the J. Paul Getty Trust. | | | 83 | | | Prior to August 10, 2016, Director of Electro Rent Corporation (equipment leasing); Prior to December 31, 2013, Director of The Ford Family Foundation. | |
26
Morgan Stanley Institutional Fund, Inc.
Annual Report — December 31, 2018
Director and Officer Information (unaudited) (cont'd)
Independent Directors: (cont'd)
Name, Age and Address of
Independent Director | | Position(s)
Held with
Registrant | | Length of Time
Served* | | Principal Occupation(s) During Past 5 Years
and Other Relevant Professional Experience | | Number of
Portfolios in
Fund Complex
Overseen by
Independent
Director** | | Other Directorships
Held by Independent
Director*** | |
Michael F. Klein (60)
c/o Perkins Coie LLP
Counsel to the Independent Directors
30 Rockefeller Plaza
New York, NY 10112 | | Director | | Since
August
2006 | | Managing Director, Aetos Alternatives Management, LP (since March 2000); Co-President, Aetos Alternatives Management, LP (since January 2004) and Co-Chief Executive Officer of Aetos Alternatives Management, LP (since August 2013); Chairperson of the Fixed Income Sub-Committee of the Investment Committee (since October 2006) and Director or Trustee of various Morgan Stanley Funds (since August 2006); formerly, Managing Director, Morgan Stanley & Co. Inc. and Morgan Stanley Dean Witter Investment Management and President, various Morgan Stanley Funds (June 1998-March 2000); Principal, Morgan Stanley & Co. Inc. and Morgan Stanley Dean Witter Investment Management (August 1997-December 1999). | | | 82 | | | Director of certain investment funds managed or sponsored by Aetos Alternatives Management, LP; Director of Sanitized AG and Sanitized Marketing AG (specialty chemicals). | |
Patricia Maleski (58)
c/o Perkins Coie LLP
Counsel to the Independent Directors
30 Rockefeller Plaza
New York, NY 10112 | | Director | | Since
January
2017 | | Managing Director, JPMorgan Asset Management (2004-2016); Oversight and Control Head of Fiduciary and Conflicts of Interest Program (2015-2016); Chief Control Officer-Global Asset Management (2013-2015); President, JPMorgan Funds (2010-2013); Chief Administrative Officer (2004-2013); various other positions including Treasurer and Board Liaison (since 2001). | | | 83 | | | None. | |
Michael E. Nugent (82)
522 Fifth Avenue
New York, NY 10036 | | Chair of the Board and Director | | Chair of the Boards since July 2006 and Director since July 1991 | | Chair of the Boards of various Morgan Stanley Funds (since July 2006); Chairperson of the Closed-End Fund Committee (since June 2012) Governance Committee (since January 2019) and Director or Trustee of various Morgan Stanley Funds (since July 1991); formerly, Chairperson of the Insurance Committee (until July 2006); General Partner, Triumph Capital, L.P. (private investment partnership) (1988-2013). | | | 82 | | | None. | |
W. Allen Reed (71)
c/o Perkins Coie LLP
Counsel to the Independent Directors
30 Rockefeller Plaza
New York, NY 10112 | | Director | | Since
August
2006 | | Chairperson of the Equity Sub-Committee of the Investment Committee (since October 2006) and Director or Trustee of various Morgan Stanley Funds (since August 2006); formerly, President and CEO of General Motors Asset Management; Chairman and Chief Executive Officer of the GM Trust Bank and Corporate Vice President of General Motors Corporation (August 1994-December 2005). | | | 82 | | | Director of Legg Mason, Inc.; formerly, Director of the Auburn University Foundation (2010-2015). | |
Fergus Reid (86)****
c/o Joe Pietryka, Inc.
85 Charles Colman Blvd.
Pawling, NY 12564 | | Director | | Since
June
1992 | | Chairman, Joe Pietryka, Inc.; Chairperson of the Governance Committee and Director or Trustee of various Morgan Stanley Funds (since June 1992). | | | 83 | | | Formerly, Trustee and Director of certain investment companies in the JP Morgan Fund Complex managed by JP Morgan Investment Management Inc. (1987-2012). | |
* This is the earliest date the Director began serving the Morgan Stanley Funds. Each Director serves an indefinite term, until his or her successor is elected.
** The Fund Complex includes (as of December 31, 2018) all open-end and closed-end funds (including all of their portfolios) advised by Morgan Stanley Investment Management Inc. (the "Adviser") and any funds that have an adviser that is an affiliated person of the Adviser (including, but not limited to, Morgan Stanley AIP GP LP).
*** This includes any directorships at public companies and registered investment companies held by the Director at any time during the past five years.
**** Effective date of retirement is December 31, 2018.
27
Morgan Stanley Institutional Fund, Inc.
Annual Report — December 31, 2018
Director and Officer Information (unaudited) (cont'd)
Executive Officers:
Name, Age and Address of Executive Officer | | Position(s) Held
with
Registrant | | Length of Time
Served* | | Principal Occupation(s) During Past 5 Years | |
John H. Gernon (55)
522 Fifth Avenue
New York, NY 10036 | | President and Principal Executive Officer | | Since
September
2013 | | President and Principal Executive Officer of the Equity and Fixed Income Funds and the Morgan Stanley AIP Funds (since September 2013) and the Liquidity Funds and various money market funds (since May 2014) in the Fund Complex; Managing Director of the Adviser; Head of Product (since 2006). | |
Timothy J. Knierim (59)
522 Fifth Avenue
New York, NY 10036 | | Chief Compliance Officer | | Since
December
2016 | | Managing Director of the Adviser and various entities affiliated with the Adviser; Chief Compliance Officer of various Morgan Stanley Funds and the Adviser (since December 2016) and Chief Compliance Officer of Morgan Stanley AIP GP LP (since 2014). Formerly, Managing Director and Deputy Chief Compliance Officer of the Adviser (2014-2016); and formerly, Chief Compliance Officer of Prudential Investment Management, Inc. (2007-2014). | |
Francis J. Smith (53)
522 Fifth Avenue
New York, NY 10036 | | Treasurer and Principal Financial Officer | | Treasurer since July 2003 and Principal Financial Officer since September 2002 | | Managing Director of the Adviser and various entities affiliated with the Adviser; Treasurer (since July 2003) and Principal Financial Officer of various Morgan Stanley Funds (since September 2002). | |
Mary E. Mullin (51)
522 Fifth Avenue
New York, NY 10036 | | Secretary | | Since
June
1999 | | Managing Director of the Adviser; Secretary of various Morgan Stanley Funds (since June 1999). | |
Michael J. Key (39)
522 Fifth Avenue
New York, NY 10036 | | Vice President | | Since
June
2017 | | Vice President of the Equity and Fixed Income Funds, Liquidity Funds, various money market funds and the Morgan Stanley AIP Funds in the Fund Complex (since June 2017); Executive Director of the Adviser; Head of Product Development for Equity and Fixed Income Funds (since August 2013). | |
* This is the earliest date the officer began serving the Morgan Stanley Funds. Each officer serves a one-year term, until his or her successor is elected and qualifies.
28
Morgan Stanley Institutional Fund, Inc.
Annual Report — December 31, 2018
Adviser and Administrator
Morgan Stanley Investment Management Inc.
522 Fifth Avenue
New York, New York 10036
Distributor
Morgan Stanley Distribution, Inc.
522 Fifth Avenue
New York, New York 10036
Dividend Disbursing and Transfer Agent
DST Asset Manager Solutions, Inc.
2000 Crown Colony Drive
Quincy, Massachusetts 02169
Custodian
State Street Bank and Trust Company
One Lincoln Street
Boston, Massachusetts 02111
Legal Counsel
Dechert LLP
1095 Avenue of the Americas
New York, New York 10036
Counsel to the Independent Directors
Perkins Coie LLP
30 Rockefeller Plaza
New York, New York 10112
Independent Registered Public Accounting Firm
Ernst & Young LLP
200 Clarendon Street
Boston, Massachusetts 02116
Reporting to Shareholders
Each Morgan Stanley fund provides a complete schedule of portfolio holdings in its semi-annual and the annual reports within 60 days of the end of the fund's second and fourth fiscal quarters. The semi-annual and annual reports are filed electronically with the Securities and Exchange Commission ("SEC") on Form N-CSRS and Form N-CSR, respectively. Morgan Stanley also delivers the semi-annual and annual reports to fund shareholders and makes these reports available on its public website, www.morganstanley.com/im/shareholderreports. Each Morgan Stanley fund also files a complete schedule of portfolio holdings with the SEC for the fund's first and third fiscal quarters on Form N-Q. Morgan Stanley does not deliver the reports for the first and third fiscal quarters to shareholders, nor are the reports posted to the Morgan Stanley public website. You may, however, obtain the Form N-Q filings (as well as the Form N-CSR and N-CSRS filings) by accessing the SEC's website, www.sec.gov. You can also request copies of these materials, upon payment of a duplicating fee, by electronic request at the SEC's email address (publicinfo@sec.gov).
Proxy Voting Policies and Procedures and Proxy Voting Record
You may obtain a copy of the Company's Proxy Voting Policy and Procedures and information regarding how the Company voted proxies relating to portfolio securities during the most recent twelve-month period ended June 30, without charge, upon request, by calling toll free 1 (800) 548-7786 or by visiting our website at www.morganstanley.com/im/shareholderreports. This information is also available on the SEC's website at www.sec.gov.
This report is authorized for distribution only when preceded or accompanied by a prospectus or summary prospectus of the applicable Fund of Morgan Stanley Institutional Fund, Inc., which describes in detail the Fund's investment policies, risks, fees and expenses. Please read the prospectus carefully before you invest or send money. For additional information, including information regarding the investments comprising the Fund, please visit our website at www.morganstanley.com/im/shareholderreports or call toll free 1 (800) 548-7786.
29
Printed in U.S.A.
This Report has been prepared for shareholders and may be distributed to others only if preceded or accompanied by a current prospectus.
Morgan Stanley Investment Management Inc.
522 Fifth Avenue
New York, New York 10036
© 2019 Morgan Stanley. Morgan Stanley Distribution, Inc.

GLBLENDANN
2404159 EXP. 02.29.20

Morgan Stanley Institutional Fund, Inc.
Global Franchise Portfolio
Annual Report
December 31, 2018
Beginning on January 1, 2021, as permitted by regulations adopted by the Securities and Exchange Commission ("SEC"), paper copies of the Fund's Annual and Semi-Annual Reports to Shareholders ("Shareholder Reports") will no longer be sent by mail, unless you specifically request paper copies of the Shareholder Reports from the Fund or from your financial intermediary, such as a broker-dealer or a bank. Instead, the Shareholder Reports will be made available on the Fund's website, https://www.morganstanley.com/im/shareholderreports and you will be notified by mail each time a Shareholder Report is posted and provided with a website link to access the Shareholder Report. If you already elected to receive Shareholder Reports electronically, you will not be affected by this change and you need not take any action. You may elect to receive Shareholder Reports and other communications from the Fund electronically anytime by contacting your financial intermediary or, if you are a direct investor, please follow the instructions on the envelope.
Beginning on January 1, 2019, you may elect to receive all future Shareholder Reports in paper free of charge. If you invest through a financial intermediary, you can contact your financial intermediary to request that you continue to receive paper copies of your Shareholder Reports. If you invest directly with the Fund, please follow the instructions on the envelope to let the Fund know you wish to continue receiving paper copies of your Shareholder Reports. Your election to receive Shareholder Reports in paper will apply to all funds held in your account if you invest through your financial intermediary or all funds held with the fund complex if you invest directly with a fund.

Morgan Stanley Institutional Fund, Inc.
Annual Report — December 31, 2018
Shareholders' Letter | | | 2 | | |
Expense Example | | | 3 | | |
Investment Overview | | | 4 | | |
Portfolio of Investments | | | 8 | | |
Statement of Assets and Liabilities | | | 9 | | |
Statement of Operations | | | 11 | | |
Statements of Changes in Net Assets | | | 12 | | |
Financial Highlights | | | 14 | | |
Notes to Financial Statements | | | 19 | | |
Report of Independent Registered Public Accounting Firm | | | 25 | | |
Federal Tax Notice | | | 26 | | |
Privacy Notice | | | 27 | | |
Director and Officer Information | | | 30 | | |
This report is authorized for distribution only when preceded or accompanied by a prospectus or summary prospectus of the applicable Fund of Morgan Stanley Institutional Fund, Inc. To receive a prospectus and/or statement of additional information (SAI), which contains more complete information such as investment objectives, charges, expenses, policies for voting proxies, risk considerations and describes in detail each of the Fund's investment policies to the prospective investor, please call toll free 1 (800) 548-7786. Please read the prospectuses carefully before you invest or send money.
Additionally, you can access information about the Fund, including performance, characteristics and investment team commentary, through Morgan Stanley Investment Management's website: www.morganstanley.com/im/shareholderreports.
Market forecasts provided in this report may not necessarily come to pass. There is no guarantee that any sectors mentioned will continue to perform as discussed herein or that securities in such sectors will be held by the Fund in the future. There is no assurance that a fund will achieve its investment objective. Funds are subject to market risk, which is the possibility that market values of securities owned by the Fund will decline and, therefore, the value of the Fund's shares may be less than what you paid for them. Accordingly, you can lose money investing in this Fund. Please see the prospectus for more complete information on investment risks.
1
Morgan Stanley Institutional Fund, Inc.
Annual Report — December 31, 2018
Shareholders' Letter (unaudited)
Dear Shareholders,
We are pleased to provide this Annual report, in which you will learn how your investment in Global Franchise Portfolio (the "Fund") performed during the latest twelve-month period.
Morgan Stanley Investment Management is a client-centric, investor-led organization. Our global presence, intellectual capital, and breadth of products and services enable us to partner with investors to meet the evolving challenges of today's financial markets. We aim to deliver superior investment service and to empower our clients to make the informed decisions that help them reach their investment goals.
As always, we thank you for selecting Morgan Stanley Investment Management, and look forward to working with you in the months and years ahead.
Sincerely,

John H. Gernon
President and Principal Executive Officer
January 2019
2
Morgan Stanley Institutional Fund, Inc.
Annual Report — December 31, 2018
Expense Example (unaudited)
Global Franchise Portfolio
As a shareholder of the Fund, you incur two types of costs: (1) transactional costs; and (2) ongoing costs, which may include advisory fees, administration fees, distribution and shareholder services fees and other Fund expenses. This example is intended to help you understand your ongoing costs (in dollars) of investing in the Fund and to compare these costs with the ongoing costs of investing in other mutual funds.
This example is based on an investment of $1,000 invested at the beginning of the six-month period ended December 31, 2018 and held for the entire six-month period.
Actual Expenses
The table below provides information about actual account values and actual expenses. You may use the information in this table, together with the amount you invested, to estimate the expenses that you paid over the period. Simply divide your account value by $1,000 (for example, an $8,600 account value divided by $1,000 = 8.6), then multiply the result by the number in the table under the heading entitled "Actual Expenses Paid During Period" to estimate the expenses you paid on your account during this period.
Hypothetical Example for Comparison Purposes
The table below provides information about hypothetical account values and hypothetical expenses based on the Fund's actual expense ratio and an assumed rate of return of 5% per year before expenses, which is not the Fund's actual return. The hypothetical account values and expenses may not be used to estimate the actual ending account balance or expenses you paid for the period. You may use this information to compare the ongoing costs of investing in the Fund and other funds. To do so, compare this 5% hypothetical example with the 5% hypothetical examples that appear in the shareholder reports of the other funds.
Please note that the expenses shown in the table are meant to highlight your ongoing costs only and do not reflect any transactional costs, such as sales charges (loads). Therefore, the information for each class in the table is useful in comparing ongoing costs only, and will not help you determine the relative total costs of owning different funds. In addition, if these transactional costs were included, your costs would have been higher.
| | | Beginning
Account
Value
7/1/18 | | Actual Ending
Account
Value
12/31/18 | | Hypothetical
Ending Account
Value | | Actual
Expenses
Paid
During
Period* | | Hypothetical
Expenses Paid
During Period* | | Net
Expense
Ratio
During
Period** | |
Global Franchise Portfolio Class I | | $ | 1,000.00 | | | $ | 952.60 | | | $ | 1,020.52 | | | $ | 4.58 | | | $ | 4.74 | | | | 0.93 | % | |
Global Franchise Portfolio Class A | | | 1,000.00 | | | | 951.60 | | | | 1,019.06 | | | | 6.00 | | | | 6.21 | | | | 1.22 | | |
Global Franchise Portfolio Class L | | | 1,000.00 | | | | 948.50 | | | | 1,016.43 | | | | 8.55 | | | | 8.84 | | | | 1.74 | | |
Global Franchise Portfolio Class C | | | 1,000.00 | | | | 947.90 | | | | 1,015.32 | | | | 9.62 | | | | 9.96 | | | | 1.96 | | |
Global Franchise Portfolio Class IS | | | 1,000.00 | | | | 953.10 | | | | 1,020.67 | | | | 4.43 | | | | 4.58 | | | | 0.90 | | |
* Expenses are calculated using each Fund Class' annualized net expense ratio (as disclosed), multiplied by the average account value over the period and multiplied by 184/365 (to reflect the most recent one-half year period).
** Annualized.
3
Morgan Stanley Institutional Fund, Inc.
Annual Report — December 31, 2018
Investment Overview (unaudited)
Global Franchise Portfolio
The Fund seeks long-term capital appreciation.
Performance
For the fiscal year ended December 31, 2018, the Fund's Class I shares had a total return based on net asset value and reinvestment of distributions per share of –1.50%, net of fees. The Fund's Class I shares outperformed the Fund's benchmark, the MSCI World Index (the "Index"), which returned –8.71%.
Factors Affecting Performance
• The markets had been reasonably constructive for the first three quarters of the year, with the MSCI World Index returning around 5% up to the end of September. The final quarter saw a sharp fall, where defensive sectors were the relative winners for 2018 as a whole, with health care and utilities actually up 3%, though consumer staples (–9%) lagged the market a touch, not helped by tobacco (–35%). Information technology ended down only 2% for the year, despite its torrid fourth quarter, while the cyclical materials, financials, energy and industrials all struggled, falling 14% to 17%. The USA was the clear geographic outperformer, down 4%, while much of Europe lagged, most notably Germany (–22%).
• For the year, sector allocation was positive, as the gain from the overweight in information technology and the underweight in financials more than made up for the drag from the overweight in consumer staples. However, the main driver of the significant outperformance was stock selection, due to outperformance across all the portfolio's main sectors except consumer staples, most notably communication services, information technology and health care. Over the year, the largest absolute contributors(i) were Twenty First Century Fox, Microsoft and Zoetis. The largest detractors were British American Tobacco, Philip Morris International and Reckitt Benckiser.
Management Strategies
• The good news about equities is that there are only two ways to lose money — falling earnings or falling multiples. A year ago, it was the multiples that worried us most. After the markets' bull run in 2017, the MSCI World Index passed 17x the next 12 months earnings,(ii) implying that markets were pricing in the improbable upside scenario of
synchronized growth everywhere... and threatening considerable downside if things did not go quite according to plan. By contrast, 2019 starts with the MSCI World Index on 13.4x forward consensus estimates, 14% lower than the 20-year average price-earnings (P/E) ratio of 15.5x and 20% below a year ago.(ii) As a result our primary fears have moved from multiples to earnings.
• Our generic fear about forward earnings estimates remain — the fact that they are guesses about lies. The guesses are because the sell-side is persistently over-optimistic, by an average of 8% one-year forward, slightly higher than the 7% earnings growth expected for the MSCI World Index in 2019.(iii) The lies are down to the gaping gap between the 'adjusted' earnings used to power consensus numbers (and management pay) and the actual number calculated using accepted accounting standards at the bottom of the profit & loss statement. Over the last three years, $600 billion has disappeared between the adjusted and actual earnings totals in the U.S. alone, overstating earnings there by an average of 21%.(iii) Our more specific anxiety is fed by the fact that it is only on the leveraged earnings metric that markets look cheap. Looking at the forward enterprise multiple rather than P/E, the discount to the historic average disappears, and the market is on a slightly higher multiple (9.2x versus 9.0x) than it was in 2003, when the P/E ratio was at a lofty 17.6x.(iv) Lower corporate taxes have helped, but so has the sharp increase in leverage. Looking at enterprise value-to-sales ratios, the MSCI World Index is 1.8x, still 16% above its 20-year average.(ii) The combination of an expensive market on sales with a 'cheap' market on earnings reflects the really high profitability at present, particularly in the U.S., where all the drivers look fairly maxed out in favor of profits at present, be it fat margins, low tax rates, high leverage or low interest rates.
• We have no greater insight than anyone else on whether the expected earnings growth for 2019 will be delivered, or even exceeded, but we do have opinions (as usual) on the key variables to watch.
(i) The information contained in this overview regarding specific securities is for informational purposes only and should not be construed as a recommendation to purchase or sell the securities mentioned.
(ii) Source: FactSet. Data as of December 31, 2018.
(iii) Source: FactSet, Morgan Stanley Investment Management. Data as of December 31, 2018.
(iv) Source: FactSet. Data as of December 31, 2018. Enterprise multiple is a measure of valuing a company that includes its debt, by dividing its enterprise value by its earnings before interest, taxes, depreciation and amortization.
4
Morgan Stanley Institutional Fund, Inc.
Annual Report — December 31, 2018
Investment Overview (unaudited) (cont'd)
Global Franchise Portfolio
The current China slowdown is an earnings risk, particularly for cyclical companies, and the extent (and success) of the gathering reflation is crucial. Even if the reflation does happen, and is successful, earnings could be soft in the first part of the year until it takes effect. As mentioned above, U.S. margins are very high, and while elements of this look structural, given the emergence of lucrative platform businesses and the way the country's political system has systematically advantaged capital against labor and consumers over the last four decades, tight labor markets and tariff impacts may cause margin issues for those without pricing power.
• Leaving aside the tail-risks, such as negative trade relations, utter paralysis of the U.S. government, Mid-East conflict or a collapse of the euro, one thing that would definitely cause a margin squeeze would be a significant slowdown in the U.S., or a further slowdown in Europe. The U.S. recovery is now very long in the tooth, and while recoveries do not just die of old age, the change at the U.S. Federal Reserve (the Fed) may be an extra cause for concern. It is still early days, but Jay Powell seems more interested in the state of the real economy than the exact level of the equity markets or the fate of anyone outside the U.S. who chooses to hitch their currencies to the U.S. dollar — i.e., emerging markets. He may therefore continue to tighten via a combination of interest rates and unwinding quantitative easing until he sees weakness in the U.S. economy. He will back off at that point, but this may be too late for markets.
• 2018 has ended with the combined balance sheets of the four major central banks — the Fed, the People's Bank of China, the European Central Bank and the Bank of Japan — finally shrinking after the massive build post the Global Financial Crisis. This means that the world is now in a liquidity squeeze, combining (depending on the geographic bloc) shrinking central bank balance sheets and tightening interest rates. It is precisely the opposite combination which drove up asset prices (and consequent levering up) since the nadir of 2009.
• Our concern is that the combination of potentially falling earnings and a liquidity squeeze could be a truly toxic one for asset prices. We mentioned that
we were unclear whether earnings estimates would be met this year, but we are clear that the world is an asymmetric place, with earnings downsides in bad times far higher than the upsides in good times. This is often forgotten, as is the fact that the asymmetry is magnified by leverage — and there is more leverage than ever, particularly in the U.S. corporate debt market. Corporate America as a whole is not inexpert at levering itself up at the wrong time, most spectacularly, just before the Global Financial Crisis last time round. Given the scale of corporate leverage now and — more particularly — the component of high yield or near-high yield (or as we prefer to call it, given that the interest rates are not that high, junk or near-junk), Corporate America has to be right that earnings will hold up.
• We worry in particular about the outlook for near-junk, i.e. BBB-rated debt. This has been at the epicenter of the build-up of corporate debt, ballooning from $0.7 trillion in October 2008 to the current roughly $3 trillion.(iii) Moreover, the component of near junk (BBB) and actual junk (BB, B and CCC and below) has increased from 46% of the U.S. corporate bond market in October 2008 to 58% currently, so the quality of the overall corporate bond market has clearly deteriorated.(iii) If U.S. earnings do fall significantly, then there could be significant downgrades from BBB to junk. We do not think the currently quiescent so-called high yield market is pricing in such an outcome. In that event, the equity market is sure to hear about it — big problems in the credit market invariably mean big problems in the equity market, especially as they would have a common cause: falling earnings and too much debt.
• In this uncertain and acutely asymmetric world, we would continue to advocate owning compounders. The combination of recurring revenue and pricing power should protect revenues and margins respectively in a downturn, preserving earnings. They are also likely to be insulated from any financial distress if the corporate bond markets have a seizure, given the lower operational and financial leverage. The soft markets of the fourth quarter have deflated the portfolio's multiples a little, with the estimated 2019 free cash flow yield now over 5%, reducing the absolute downside risk.(v)
(iii) Source: FactSet, Morgan Stanley Investment Management. Data as of December 31, 2018.
(v) Source: Morgan Stanley Investment Management. Data as of December 31, 2018.
5
Morgan Stanley Institutional Fund, Inc.
Annual Report — December 31, 2018
Investment Overview (unaudited) (cont'd)
Global Franchise Portfolio
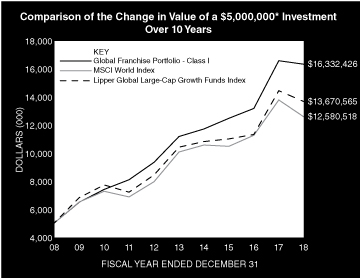
* Minimum Investment for Class I shares
In accordance with SEC regulations, the Fund's performance shown assumes that all recurring fees (including management fees) were deducted and all dividends and distributions were reinvested. The performance of Class A, L, C and IS shares will vary from the performance of Class I shares based upon their different inception dates and will be negatively impacted by additional fees assessed to those classes (if applicable).
Performance Compared to the MSCI World Index(1) and the Lipper Global Large-Cap Growth Funds Index(2)
| | | Period Ended December 31, 2018
Total Returns(3) | |
| | | | | Average Annual | |
| | | One
Year | | Five
Years | | Ten
Years | | Since
Inception(8) | |
Fund — Class I Shares
w/o sales charges(4) | | | –1.50 | % | | | 7.89 | % | | | 12.57 | % | | | 10.73 | % | |
Fund — Class A Shares
w/o sales charges(4) | | | –1.77 | | | | 7.60 | | | | 12.26 | | | | 10.44 | | |
Fund — Class A Shares with
maximum 5.25% sales charges(4) | | | –6.93 | | | | 6.45 | | | | 11.66 | | | | 10.09 | | |
Fund — Class L Shares
w/o sales charges(5) | | | –2.29 | | | | 7.08 | | | | — | | | | 8.22 | | |
Fund — Class C Shares
w/o sales charges(7) | | | –2.51 | | | | — | | | | — | | | | 9.31 | | |
Fund — Class C Shares with
maximum 1.00% deferred
sales charges(7) | | | –3.44 | | | | — | | | | — | | | | 9.31 | | |
Fund — Class IS Shares
w/o sales charges(6) | | | –1.45 | | | | — | | | | — | | | | 8.00 | | |
MSCI World Index | | | –8.71 | | | | 4.56 | | | | 9.67 | | | | 5.89 | | |
Lipper Global Large-Cap
Growth Funds Index | | | –5.34 | | | | 5.60 | | | | 10.58 | | | | 5.76 | | |
Performance data quoted represents past performance, which is no guarantee of future results, and current performance may be lower or higher than the figures shown. Performance assumes that all dividends and distributions, if any, were reinvested. For the most recent month-end performance figures, please visit www.morganstanley.com/im/shareholderreports. Investment return and principal value will fluctuate so that Fund shares, when redeemed, may be worth more or less than their original cost. Total returns do not reflect the deduction of taxes that a shareholder would pay on Fund distributions or the redemption of Fund shares. Performance of share classes will vary due to difference in sales charges and expenses.
(1) The MSCI World Index is a free float-adjusted market capitalization weighted index that is designed to measure the global equity market performance of developed markets. The term "free float" represents the portion of shares outstanding that are deemed to be available for purchase in the public equity markets by investors. The MSCI World Index currently consists of 23 developed market country indices. The performance of the Index is listed in U.S. dollars and assumes reinvestment of net dividends. Net total return indices reinvest dividends after the deduction of withholding taxes, using (for international indices) a tax rate applicable to non-resident institutional investors who do not benefit from double taxation treaties. The Index is unmanaged and its returns do not include any sales charges or fees. Such costs would lower performance. It is not possible to invest directly in an index.
(2) The Lipper Global Large-Cap Growth Funds Index is an equally weighted performance index of the largest qualifying funds (based on net assets) in the Lipper Global Large-Cap Growth Funds classification. The Index, which is adjusted for capital gains distributions and income dividends, is unmanaged and should not be considered an investment. There are currently 10 funds represented in this Index. As of the date of this report, the Fund is in the Lipper Global Large-Cap Growth Funds classification.
6
Morgan Stanley Institutional Fund, Inc.
Annual Report — December 31, 2018
Investment Overview (unaudited) (cont'd)
Global Franchise Portfolio
(3) Total returns for the Fund reflect fees waived and expenses reimbursed, if applicable, by Morgan Stanley Investment Management Inc. (the "Adviser"). Without such waivers and reimbursements, total returns would have been lower.
(4) Commenced operations on November 28, 2001.
(5) Commenced offering on April 27, 2012.
(6) Commenced offering on May 29, 2015.
(7) Commenced offering on September 30, 2015.
(8) For comparative purposes, average annual since inception returns listed for the Indexes refer to the inception date of Class I of the Fund, not the inception of the Index.
7
Morgan Stanley Institutional Fund, Inc.
Annual Report — December 31, 2018
Portfolio of Investments
Global Franchise Portfolio
| | | Shares | | Value
(000) | |
Common Stocks (97.3%) | |
France (6.8%) | |
L'Oreal SA | | | 194,204 | | | $ | 44,580 | | |
Pernod Ricard SA | | | 276,759 | | | | 45,443 | | |
| | | | 90,023 | | |
Germany (4.2%) | |
SAP SE | | | 561,557 | | | | 55,937 | | |
Italy (1.1%) | |
Davide Campari-Milano SpA | | | 1,786,334 | | | | 15,119 | | |
Netherlands (3.5%) | |
Heineken N.V. | | | 530,697 | | | | 46,774 | | |
United Kingdom (22.4%) | |
British American Tobacco PLC | | | 1,228,872 | | | | 39,188 | | |
Experian PLC | | | 1,277,594 | | | | 31,052 | | |
Reckitt Benckiser Group PLC | | | 1,458,026 | | | | 111,344 | | |
RELX PLC | | | 1,662,860 | | | | 34,153 | | |
RELX PLC (a) | | | 639,330 | | | | 13,161 | | |
Unilever PLC | | | 1,342,309 | | | | 70,253 | | |
| | | | 299,151 | | |
United States (59.3%) | |
Abbott Laboratories | | | 627,617 | | | | 45,396 | | |
Accenture PLC, Class A | | | 400,423 | | | | 56,464 | | |
Altria Group, Inc. | | | 454,103 | | | | 22,428 | | |
Automatic Data Processing, Inc. | | | 334,400 | | | | 43,846 | | |
Baxter International, Inc. | | | 761,801 | | | | 50,142 | | |
Becton Dickinson & Co. | | | 57,015 | | | | 12,847 | | |
Church & Dwight Co., Inc. | | | 211,160 | | | | 13,886 | | |
Clorox Co. (The) | | | 83,445 | | | | 12,862 | | |
Coca-Cola Co. (The) | | | 1,085,309 | | | | 51,389 | | |
Danaher Corp. | | | 421,704 | | | | 43,486 | | |
Factset Research Systems, Inc. | | | 91,057 | | | | 18,223 | | |
Fidelity National Information Services, Inc. | | | 279,073 | | | | 28,619 | | |
Microsoft Corp. | | | 938,667 | | | | 95,340 | | |
Moody's Corp. | | | 106,803 | | | | 14,957 | | |
NIKE, Inc., Class B | | | 352,971 | | | | 26,169 | | |
Philip Morris International, Inc. | | | 762,475 | | | | 50,903 | | |
Twenty-First Century Fox, Inc., Class A | | | 1,105,579 | | | | 53,200 | | |
Twenty-First Century Fox, Inc., Class B | | | 920,657 | | | | 43,989 | | |
Visa, Inc., Class A | | | 486,655 | | | | 64,209 | | |
Zoetis, Inc. | | | 516,397 | | | | 44,173 | | |
| | | | 792,528 | | |
Total Common Stocks (Cost $1,130,806) | | | 1,299,532 | | |
| | | Shares | | Value
(000) | |
Short-Term Investment (4.7%) | |
Investment Company (4.7%) | |
Morgan Stanley Institutional Liquidity
Funds — Treasury Securities Portfolio —
Institutional Class (See Note G)
(Cost $63,220) | | | 63,219,602 | | | $ | 63,220 | | |
Total Investments (102.0%) (Cost $1,194,026) (b)(c) | | | 1,362,752 | | |
Liabilities in Excess of Other Assets (–2.0%) | | | (26,793 | ) | |
Net Assets (100.0%) | | $ | 1,335,959 | | |
Country assignments and aggregations are based generally on third party vendor classifications and information, and may be different from the assignments and aggregations under the policies set forth in the Fund's prospectus and/or statement of additional information relating to geographic classifications.
(a) Non-income producing security.
(b) The approximate fair value and percentage of net assets, $507,004,000 and 38.0%, respectively, represent the securities that have been fair valued under the fair valuation policy for international investments as described in Note A-1 within the Notes to the Financial Statements.
(c) At December 31, 2018, the aggregate cost for federal income tax purposes is approximately $1,197,767,000. The aggregate gross unrealized appreciation is approximately $228,651,000 and the aggregate gross unrealized depreciation is approximately $63,666,000, resulting in net unrealized appreciation of approximately $164,985,000.
Portfolio Composition
Classification | | Percentage of
Total Investments | |
Information Technology Services | | | 14.2 | % | |
Other* | | | 12.2 | | |
Beverages | | | 11.7 | | |
Health Care Equipment & Supplies | | | 11.1 | | |
Software | | | 11.1 | | |
Household Products | | | 10.1 | | |
Personal Products | | | 8.4 | | |
Tobacco | | | 8.3 | | |
Media | | | 7.1 | | |
Professional Services | | | 5.8 | | |
Total Investments | | | 100.0 | % | |
* Industries and/or investment types representing less than 5% of total investments.
The accompanying notes are an integral part of the financial statements.
8
Morgan Stanley Institutional Fund, Inc.
Annual Report — December 31, 2018
Global Franchise Portfolio
Statement of Assets and Liabilities | | December 31, 2018
(000) | |
Assets: | |
Investments in Securities of Unaffiliated Issuers, at Value (Cost $1,130,806) | | $ | 1,299,532 | | |
Investment in Security of Affiliated Issuer, at Value (Cost $63,220) | | | 63,220 | | |
Total Investments in Securities, at Value (Cost $1,194,026) | | | 1,362,752 | | |
Receivable for Fund Shares Sold | | | 15,115 | | |
Dividends Receivable | | | 2,422 | | |
Tax Reclaim Receivable | | | 551 | | |
Receivable from Affiliate | | | 70 | | |
Receivable for Investments Sold | | | 5 | | |
Other Assets | | | 105 | | |
Total Assets | | | 1,381,020 | | |
Liabilities: | |
Payable for Investments Purchased | | | 28,935 | | |
Payable for Fund Shares Redeemed | | | 13,178 | | |
Payable for Advisory Fees | | | 2,470 | | |
Payable for Sub Transfer Agency Fees — Class I | | | 114 | | |
Payable for Sub Transfer Agency Fees — Class A | | | 19 | | |
Payable for Sub Transfer Agency Fees — Class L | | | 1 | | |
Payable for Sub Transfer Agency Fees — Class C | | | 1 | | |
Payable for Administration Fees | | | 89 | | |
Payable for Shareholder Services Fees — Class A | | | 32 | | |
Payable for Distribution and Shareholder Services Fees — Class L | | | 5 | | |
Payable for Distribution and Shareholder Services Fees — Class C | | | 46 | | |
Payable for Professional Fees | | | 52 | | |
Payable for Custodian Fees | | | 16 | | |
Payable for Directors' Fees and Expenses | | | 16 | | |
Payable for Transfer Agency Fees — Class I | | | 8 | | |
Payable for Transfer Agency Fees — Class A | | | 2 | | |
Payable for Transfer Agency Fees — Class L | | | 1 | | |
Payable for Transfer Agency Fees — Class C | | | 2 | | |
Payable for Transfer Agency Fees — Class IS | | | 1 | | |
Bank Overdraft | | | 1 | | |
Other Liabilities | | | 72 | | |
Total Liabilities | | | 45,061 | | |
Net Assets | | $ | 1,335,959 | | |
Net Assets Consist of: | |
Paid-in-Capital | | $ | 1,168,495 | | |
Total Distributable Earnings | | | 167,464 | | |
Net Assets | | $ | 1,335,959 | | |
The accompanying notes are an integral part of the financial statements.
9
Morgan Stanley Institutional Fund, Inc.
Annual Report — December 31, 2018
Global Franchise Portfolio
Statement of Assets and Liabilities (cont'd) | | December 31, 2018
(000) | |
CLASS I: | |
Net Assets | | $ | 918,409 | | |
| Shares Outstanding $0.001 par value shares of beneficial interest (unlimited shares authorized) (not in 000's) | | | 39,870,672 | | |
Net Asset Value, Offering and Redemption Price Per Share | | $ | 23.03 | | |
CLASS A: | |
Net Assets | | $ | 150,936 | | |
| Shares Outstanding $0.001 par value shares of beneficial interest (unlimited shares authorized) (not in 000's) | | | 6,700,425 | | |
Net Asset Value, Redemption Price Per Share | | $ | 22.53 | | |
Maximum Sales Load | | | 5.25 | % | |
Maximum Sales Charge | | $ | 1.25 | | |
Maximum Offering Price Per Share | | $ | 23.78 | | |
CLASS L: | |
Net Assets | | $ | 7,312 | | |
| Shares Outstanding $0.001 par value shares of beneficial interest (unlimited shares authorized) (not in 000's) | | | 324,786 | | |
Net Asset Value, Offering and Redemption Price Per Share | | $ | 22.51 | | |
CLASS C: | |
Net Assets | | $ | 55,271 | | |
| Shares Outstanding $0.001 par value shares of beneficial interest (unlimited shares authorized) (not in 000's) | | | 2,497,478 | | |
Net Asset Value, Offering and Redemption Price Per Share | | $ | 22.13 | | |
CLASS IS: | |
Net Assets | | $ | 204,031 | | |
| Shares Outstanding $0.001 par value shares of beneficial interest (unlimited shares authorized) (not in 000's) | | | 8,858,339 | | |
Net Asset Value, Offering and Redemption Price Per Share | | $ | 23.03 | | |
The accompanying notes are an integral part of the financial statements.
10
Morgan Stanley Institutional Fund, Inc.
Annual Report — December 31, 2018
Global Franchise Portfolio
Statement of Operations | | Year Ended
December 31, 2018
(000) | |
Investment Income: | |
Dividends from Securities of Unaffiliated Issuers (Net of $552 of Foreign Taxes Withheld) | | $ | 24,918 | | |
Dividends from Security of Affiliated Issuer (Note G) | | | 482 | | |
Total Investment Income | | | 25,400 | | |
Expenses: | |
Advisory Fees (Note B) | | | 9,239 | | |
Administration Fees (Note C) | | | 970 | | |
Shareholder Services Fees — Class A (Note D) | | | 370 | | |
Distribution and Shareholder Services Fees — Class L (Note D) | | | 59 | | |
Distribution and Shareholder Services Fees — Class C (Note D) | | | 508 | | |
Sub Transfer Agency Fees — Class I | | | 501 | | |
Sub Transfer Agency Fees — Class A | | | 144 | | |
Sub Transfer Agency Fees — Class L | | | 6 | | |
Sub Transfer Agency Fees — Class C | | | 38 | | |
Professional Fees | | | 117 | | |
Registration Fees | | | 110 | | |
Shareholder Reporting Fees | | | 53 | | |
Custodian Fees (Note F) | | | 42 | | |
Transfer Agency Fees — Class I (Note E) | | | 24 | | |
Transfer Agency Fees — Class A (Note E) | | | 4 | | |
Transfer Agency Fees — Class L (Note E) | | | 2 | | |
Transfer Agency Fees — Class C (Note E) | | | 5 | | |
Transfer Agency Fees — Class IS (Note E) | | | 3 | | |
Directors' Fees and Expenses | | | 32 | | |
Other Expenses | | | 56 | | |
Total Expenses | | | 12,283 | | |
Rebate from Morgan Stanley Affiliate (Note G) | | | (55 | ) | |
Net Expenses | | | 12,228 | | |
Net Investment Income | | | 13,172 | | |
Realized Gain (Loss): | |
Investments Sold | | | 53,682 | | |
Foreign Currency Translation | | | (445 | ) | |
Net Realized Gain | | | 53,237 | | |
Change in Unrealized Appreciation (Depreciation): | |
Investments | | | (97,004 | ) | |
Foreign Currency Translation | | | (24 | ) | |
Net Change in Unrealized Appreciation (Depreciation) | | | (97,028 | ) | |
Net Realized Gain and Change in Unrealized Appreciation (Depreciation) | | | (43,791 | ) | |
Net Decrease in Net Assets Resulting from Operations | | $ | (30,619 | ) | |
The accompanying notes are an integral part of the financial statements.
11
Morgan Stanley Institutional Fund, Inc.
Annual Report — December 31, 2018
Global Franchise Portfolio
Statements of Changes in Net Assets | | Year Ended
December 31, 2018
(000) | | Year Ended
December 31, 2017
(000) | |
Increase (Decrease) in Net Assets: | |
Operations: | |
Net Investment Income | | $ | 13,172 | | | $ | 10,005 | | |
Net Realized Gain | | | 53,237 | | | | 45,637 | | |
Net Change in Unrealized Appreciation (Depreciation) | | | (97,028 | ) | | | 149,068 | | |
Net Increase (Decrease) in Net Assets Resulting from Operations | | | (30,619 | ) | | | 204,710 | | |
Dividends and Distributions to Shareholders: | |
Class I | | | (46,526 | ) | | | (33,922 | )* | |
Class A | | | (7,892 | ) | | | (6,429 | )* | |
Class L | | | (359 | ) | | | (316 | )* | |
Class C | | | (2,499 | ) | | | (1,831 | )* | |
Class IS | | | (11,432 | ) | | | (4,030 | )* | |
Total Dividends and Distributions to Shareholders | | | (68,708 | ) | | | (46,528 | ) | |
Capital Share Transactions:(1) | |
Class I: | |
Subscribed | | | 408,679 | | | | 189,194 | | |
Distributions Reinvested | | | 45,332 | | | | 33,421 | | |
Redeemed | | | (223,714 | ) | | | (196,533 | ) | |
Class A: | |
Subscribed | | | 40,032 | | | | 47,508 | | |
Distributions Reinvested | | | 7,833 | | | | 6,389 | | |
Redeemed | | | (32,392 | ) | | | (32,934 | ) | |
Class L: | |
Exchanged | | | 199 | | | | 239 | | |
Distributions Reinvested | | | 358 | | | | 316 | | |
Redeemed | | | (728 | ) | | | (1,440 | ) | |
Class C: | |
Subscribed | | | 19,817 | | | | 17,089 | | |
Distributions Reinvested | | | 2,481 | | | | 1,831 | | |
Redeemed | | | (10,618 | ) | | | (7,145 | ) | |
Class IS: | |
Subscribed | | | 125,041 | | | | 63,818 | | |
Distributions Reinvested | | | 11,432 | | | | 4,030 | | |
Redeemed | | | (4,502 | ) | | | (8 | ) | |
Net Increase in Net Assets Resulting from Capital Share Transactions | | | 389,250 | | | | 125,775 | | |
Total Increase in Net Assets | | | 289,923 | | | | 283,957 | | |
Net Assets: | |
Beginning of Period | | | 1,046,036 | | | | 762,079 | | |
End of Period | | $ | 1,335,959 | | | $ | 1,046,036 | † | |
The accompanying notes are an integral part of the financial statements.
12
Morgan Stanley Institutional Fund, Inc.
Annual Report — December 31, 2018
Global Franchise Portfolio
Statements of Changes in Net Assets (cont'd) | | Year Ended
December 31, 2018
(000) | | Year Ended
December 31, 2017
(000) | |
(1) Capital Share Transactions: | |
Class I: | |
Shares Subscribed | | | 16,522 | | | | 8,054 | | |
Shares Issued on Distributions Reinvested | | | 1,916 | | | | 1,349 | | |
Shares Redeemed | | | (9,029 | ) | | | (8,191 | ) | |
Net Increase in Class I Shares Outstanding | | | 9,409 | | | | 1,212 | | |
Class A: | |
Shares Subscribed | | | 1,634 | | | | 2,055 | | |
Shares Issued on Distributions Reinvested | | | 338 | | | | 263 | | |
Shares Redeemed | | | (1,333 | ) | | | (1,431 | ) | |
Net Increase in Class A Shares Outstanding | | | 639 | | | | 887 | | |
Class L: | |
Shares Exchanged | | | 9 | | | | 11 | | |
Shares Issued on Distributions Reinvested | | | 15 | | | | 13 | | |
Shares Redeemed | | | (30 | ) | | | (63 | ) | |
Net Decrease in Class L Shares Outstanding | | | (6 | ) | | | (39 | ) | |
Class C: | |
Shares Subscribed | | | 830 | | | | 750 | | |
Shares Issued on Distributions Reinvested | | | 109 | | | | 77 | | |
Shares Redeemed | | | (445 | ) | | | (315 | ) | |
Net Increase in Class C Shares Outstanding | | | 494 | | | | 512 | | |
Class IS: | |
Shares Subscribed | | | 4,898 | | | | 2,557 | | |
Shares Issued on Distributions Reinvested | | | 483 | | | | 163 | | |
Shares Redeemed | | | (183 | ) | | | (— | @@) | |
Net Increase in Class IS Shares Outstanding | | | 5,198 | | | | 2,720 | | |
@@ Amount is less than 500 shares.
The following information was previously reported in the December 31, 2017 financial statements. The distribution information for the year ended December 31, 2017
presented on the Statements of Changes in Net Assets is presented for comparative purposes to the December 31, 2018 financial statements, which conform to the
SEC Final Rule on Disclosure Update and Simplification which was effective November 5, 2018.
* Distributions from and/or in Excess of Net Investment Income and Net Realized Gain for the year ended December 31, 2017 were as follows:
Class I: | |
Net Investment Income | | $ | (6,924 | ) | |
Net Realized Gain | | $ | (26,998 | ) | |
Class A: | |
Net Investment Income | | $ | (1,097 | ) | |
Net Realized Gain | | $ | (5,332 | ) | |
Class L: | |
Net Investment Income | | $ | (19 | ) | |
Net Realized Gain | | $ | (297 | ) | |
Class C: | |
Net Investment Income | | $ | (70 | ) | |
Net Realized Gain | | $ | (1,761 | ) | |
Class IS: | |
Net Investment Income | | $ | (890 | ) | |
Net Realized Gain | | $ | (3,140 | ) | |
† Accumulated Undistributed Net Investment Income for the year ended December 31, 2017 was $903.
The accompanying notes are an integral part of the financial statements.
13
Morgan Stanley Institutional Fund, Inc.
Annual Report — December 31, 2018
Financial Highlights
Global Franchise Portfolio
| | | Class I | |
| | | Year Ended December 31, | |
Selected Per Share Data and Ratios | | 2018 | | 2017 | | 2016(1) | | 2015 | | 2014 | |
Net Asset Value, Beginning of Period | | $ | 24.72 | | | $ | 20.56 | | | $ | 20.33 | | | $ | 20.27 | | | $ | 20.77 | | |
Income (Loss) from Investment Operations: | |
Net Investment Income(2) | | | 0.29 | | | | 0.27 | | | | 0.30 | | | | 0.31 | | | | 0.41 | | |
Net Realized and Unrealized Gain (Loss) | | | (0.63 | ) | | | 5.05 | | | | 0.84 | | | | 1.02 | | | | 0.57 | | |
Total from Investment Operations | | | (0.34 | ) | | | 5.32 | | | | 1.14 | | | | 1.33 | | | | 0.98 | | |
Distributions from and/or in Excess of: | |
Net Investment Income | | | (0.27 | ) | | | (0.24 | ) | | | (0.28 | ) | | | (0.35 | ) | | | (0.37 | ) | |
Net Realized Gain | | | (1.08 | ) | | | (0.92 | ) | | | (0.63 | ) | | | (0.92 | ) | | | (1.11 | ) | |
Total Distributions | | | (1.35 | ) | | | (1.16 | ) | | | (0.91 | ) | | | (1.27 | ) | | | (1.48 | ) | |
Net Asset Value, End of Period | | $ | 23.03 | | | $ | 24.72 | | | $ | 20.56 | | | $ | 20.33 | | | $ | 20.27 | | |
Total Return(3) | | | (1.50 | )% | | | 25.85 | % | | | 5.64 | % | | | 6.50 | % | | | 4.82 | % | |
Ratios and Supplemental Data: | |
Net Assets, End of Period (Thousands) | | $ | 918,409 | | | $ | 753,107 | | | $ | 601,340 | | | $ | 505,321 | | | $ | 515,012 | | |
Ratio of Expenses to Average Net Assets(6) | | | 0.94 | %(4) | | | 0.98 | %(4) | | | 0.97 | %(4) | | | 0.98 | %(4) | | | 0.97 | %(4) | |
Ratio of Net Investment Income to Average Net Assets(6) | | | 1.14 | %(4) | | | 1.17 | %(4) | | | 1.40 | %(4) | | | 1.46 | %(4) | | | 1.94 | %(4) | |
Ratio of Rebate from Morgan Stanley Affiliates to Average Net Assets | | | 0.00 | %(5) | | | 0.00 | %(5) | | | 0.00 | %(5) | | | 0.00 | %(5) | | | 0.00 | %(5) | |
Portfolio Turnover Rate | | | 27 | % | | | 28 | % | | | 30 | % | | | 37 | % | | | 33 | % | |
(6) Supplemental Information on the Ratios to Average Net Assets: | |
Ratios Before Expense Limitation: | |
Expenses to Average Net Assets | | | N/A | | | | N/A | | | | 0.98 | % | | | 0.99 | % | | | N/A | | |
Net Investment Income to Average Net Assets | | | N/A | | | | N/A | | | | 1.39 | % | | | 1.45 | % | | | N/A | | |
(1) Reflects prior period Custodian out-of-pocket expenses that were reimbursed in September 2016. The amount of the reimbursement was immaterial on a per share basis and did not impact the total return of Class I shares. The Ratio of Expenses to Average Net Assets would have been 0.01% higher and the Ratio of Net Investment Income to Average Net Assets would have been 0.01% lower had the Custodian not reimbursed the Fund.
(2) Per share amount is based on average shares outstanding.
(3) Calculated based on the net asset value as of the last business day of the period.
(4) The Ratios of Expenses and Net Investment Income reflect the rebate of certain Fund expenses in connection with the investments in Morgan Stanley affiliates during the period. The effect of the rebate on the ratios is disclosed in the above table as "Ratio of Rebate from Morgan Stanley Affiliates to Average Net Assets."
(5) Amount is less than 0.005%.
The accompanying notes are an integral part of the financial statements.
14
Morgan Stanley Institutional Fund, Inc.
Annual Report — December 31, 2018
Financial Highlights
Global Franchise Portfolio
| | | Class A | |
| | | Year Ended December 31, | |
Selected Per Share Data and Ratios | | 2018 | | 2017 | | 2016(1) | | 2015 | | 2014 | |
Net Asset Value, Beginning of Period | | $ | 24.21 | | | $ | 20.16 | | | $ | 19.96 | | | $ | 19.92 | | | $ | 20.44 | | |
Income (Loss) from Investment Operations: | |
Net Investment Income(2) | | | 0.21 | | | | 0.22 | | | | 0.23 | | | | 0.24 | | | | 0.34 | | |
Net Realized and Unrealized Gain (Loss) | | | (0.61 | ) | | | 4.94 | | | | 0.83 | | | | 1.02 | | | | 0.55 | | |
Total from Investment Operations | | | (0.40 | ) | | | 5.16 | | | | 1.06 | | | | 1.26 | | | | 0.89 | | |
Distributions from and/or in Excess of: | |
Net Investment Income | | | (0.20 | ) | | | (0.19 | ) | | | (0.23 | ) | | | (0.30 | ) | | | (0.30 | ) | |
Net Realized Gain | | | (1.08 | ) | | | (0.92 | ) | | | (0.63 | ) | | | (0.92 | ) | | | (1.11 | ) | |
Total Distributions | | | (1.28 | ) | | | (1.11 | ) | | | (0.86 | ) | | | (1.22 | ) | | | (1.41 | ) | |
Net Asset Value, End of Period | | $ | 22.53 | | | $ | 24.21 | | | $ | 20.16 | | | $ | 19.96 | | | $ | 19.92 | | |
Total Return(3) | | | (1.77 | )% | | | 25.58 | % | | | 5.36 | % | | | 6.25 | % | | | 4.45 | % | |
Ratios and Supplemental Data: | |
Net Assets, End of Period (Thousands) | | $ | 150,936 | | | $ | 146,722 | | | $ | 104,306 | | | $ | 75,297 | | | $ | 64,515 | | |
Ratio of Expenses to Average Net Assets(6) | | | 1.23 | %(4) | | | 1.21 | %(4) | | | 1.22 | %(4) | | | 1.25 | %(4) | | | 1.27 | %(4) | |
Ratio of Net Investment Income to Average Net Assets(6) | | | 0.84 | %(4) | | | 0.94 | %(4) | | | 1.13 | %(4) | | | 1.15 | %(4) | | | 1.64 | %(4) | |
Ratio of Rebate from Morgan Stanley Affiliates to Average Net Assets | | | 0.00 | %(5) | | | 0.00 | %(5) | | | 0.00 | %(5) | | | 0.00 | %(5) | | | 0.00 | %(5) | |
Portfolio Turnover Rate | | | 27 | % | | | 28 | % | | | 30 | % | | | 37 | % | | | 33 | % | |
(6) Supplemental Information on the Ratios to Average Net Assets: | |
Ratios Before Expense Limitation: | |
Expenses to Average Net Assets | | | N/A | | | | N/A | | | | 1.23 | % | | | 1.25 | % | | | N/A | | |
Net Investment Income to Average Net Assets | | | N/A | | | | N/A | | | | 1.12 | % | | | 1.15 | % | | | N/A | | |
(1) Reflects prior period Custodian out-of-pocket expenses that were reimbursed in September 2016. The amount of the reimbursement was immaterial on a per share basis and did not impact the total return of Class A shares. The Ratio of Expenses to Average Net Assets would have been 0.01% higher and the Ratio of Net Investment Income to Average Net Assets would have been 0.01% lower had the Custodian not reimbursed the Fund.
(2) Per share amount is based on average shares outstanding.
(3) Calculated based on the net asset value which does not reflect sales charges, if applicable, as of the last business day of the period.
(4) The Ratios of Expenses and Net Investment Income reflect the rebate of certain Fund expenses in connection with the investments in Morgan Stanley affiliates during the period. The effect of the rebate on the ratios is disclosed in the above table as "Ratio of Rebate from Morgan Stanley Affiliates to Average Net Assets."
(5) Amount is less than 0.005%.
The accompanying notes are an integral part of the financial statements.
15
Morgan Stanley Institutional Fund, Inc.
Annual Report — December 31, 2018
Financial Highlights
Global Franchise Portfolio
| | | Class L | |
| | | Year Ended December 31, | |
Selected Per Share Data and Ratios | | 2018 | | 2017 | | 2016(1) | | 2015 | | 2014 | |
Net Asset Value, Beginning of Period | | $ | 24.18 | | | $ | 20.13 | | | $ | 19.91 | | | $ | 19.87 | | | $ | 20.39 | | |
Income (Loss) from Investment Operations: | |
Net Investment Income(2) | | | 0.09 | | | | 0.10 | | | | 0.13 | | | | 0.15 | | | | 0.25 | | |
Net Realized and Unrealized Gain (Loss) | | | (0.62 | ) | | | 4.93 | | | | 0.82 | | | | 1.00 | | | | 0.55 | | |
Total from Investment Operations | | | (0.53 | ) | | | 5.03 | | | | 0.95 | | | | 1.15 | | | | 0.80 | | |
Distributions from and/or in Excess of: | |
Net Investment Income | | | (0.06 | ) | | | (0.06 | ) | | | (0.10 | ) | | | (0.19 | ) | | | (0.21 | ) | |
Net Realized Gain | | | (1.08 | ) | | | (0.92 | ) | | | (0.63 | ) | | | (0.92 | ) | | | (1.11 | ) | |
Total Distributions | | | (1.14 | ) | | | (0.98 | ) | | | (0.73 | ) | | | (1.11 | ) | | | (1.32 | ) | |
Net Asset Value, End of Period | | $ | 22.51 | | | $ | 24.18 | | | $ | 20.13 | | | $ | 19.91 | | | $ | 19.87 | | |
Total Return(3) | | | (2.29 | )% | | | 24.98 | % | | | 4.82 | % | | | 5.72 | % | | | 4.00 | % | |
Ratios and Supplemental Data: | |
Net Assets, End of Period (Thousands) | | $ | 7,312 | | | $ | 7,993 | | | $ | 7,449 | | | $ | 8,898 | | | $ | 9,315 | | |
Ratio of Expenses to Average Net Assets(6) | | | 1.73 | %(4) | | | 1.70 | %(4) | | | 1.71 | %(4) | | | 1.72 | %(4) | | | 1.72 | %(4) | |
Ratio of Net Investment Income to Average Net Assets(6) | | | 0.36 | %(4) | | | 0.44 | %(4) | | | 0.65 | %(4) | | | 0.72 | %(4) | | | 1.19 | %(4) | |
Ratio of Rebate from Morgan Stanley Affiliates to Average Net Assets | | | 0.00 | %(5) | | | 0.00 | %(5) | | | 0.00 | %(5) | | | 0.00 | %(5) | | | 0.00 | %(5) | |
Portfolio Turnover Rate | | | 27 | % | | | 28 | % | | | 30 | % | | | 37 | % | | | 33 | % | |
(6) Supplemental Information on the Ratios to Average Net Assets: | |
Ratios Before Expense Limitation: | |
Expenses to Average Net Assets | | | N/A | | | | N/A | | | | 1.72 | % | | | 1.73 | % | | | N/A | | |
Net Investment Income to Average Net Assets | | | N/A | | | | N/A | | | | 0.64 | % | | | 0.71 | % | | | N/A | | |
(1) Reflects prior period Custodian out-of-pocket expenses that were reimbursed in September 2016. The amount of the reimbursement was immaterial on a per share basis and did not impact the total return of Class L shares. The Ratio of Expenses to Average Net Assets would have been 0.01% higher and the Ratio of Net Investment Income to Average Net Assets would have been 0.01% lower had the Custodian not reimbursed the Fund.
(2) Per share amount is based on average shares outstanding.
(3) Calculated based on the net asset value as of the last business day of the period.
(4) The Ratios of Expenses and Net Investment Income reflect the rebate of certain Fund expenses in connection with the investments in Morgan Stanley affiliates during the period. The effect of the rebate on the ratios is disclosed in the above table as "Ratio of Rebate from Morgan Stanley Affiliates to Average Net Assets."
(5) Amount is less than 0.005%.
The accompanying notes are an integral part of the financial statements.
16
Morgan Stanley Institutional Fund, Inc.
Annual Report — December 31, 2018
Financial Highlights
Global Franchise Portfolio
| | | Class C | |
| | | Year Ended December 31, | | Period from
September 30, 2015(2) to | |
Selected Per Share Data and Ratios | | 2018 | | 2017 | | 2016(1) | | December 31, 2015 | |
Net Asset Value, Beginning of Period | | $ | 23.82 | | | $ | 19.88 | | | $ | 19.75 | | | $ | 19.79 | | |
Income (Loss) from Investment Operations: | |
Net Investment Income(3) | | | 0.03 | | | | 0.04 | | | | 0.06 | | | | 0.01 | | |
Net Realized and Unrealized Gain (Loss) | | | (0.60 | ) | | | 4.86 | | | | 0.84 | | | | 1.02 | | |
Total from Investment Operations | | | (0.57 | ) | | | 4.90 | | | | 0.90 | | | | 1.03 | | |
Distributions from and/or in Excess of: | |
Net Investment Income | | | (0.04 | ) | | | (0.04 | ) | | | (0.14 | ) | | | (0.28 | ) | |
Net Realized Gain | | | (1.08 | ) | | | (0.92 | ) | | | (0.63 | ) | | | (0.79 | ) | |
Total Distributions | | | (1.12 | ) | | | (0.96 | ) | | | (0.77 | ) | | | (1.07 | ) | |
Net Asset Value, End of Period | | $ | 22.13 | | | $ | 23.82 | | | $ | 19.88 | | | $ | 19.75 | | |
Total Return(4) | | | (2.51 | )% | | | 24.63 | % | | | 4.58 | % | | | 5.11 | %(7) | |
Ratios and Supplemental Data: | |
Net Assets, End of Period (Thousands) | | $ | 55,271 | | | $ | 47,726 | | | $ | 29,650 | | | $ | 5,765 | | |
Ratio of Expenses to Average Net Assets(9) | | | 1.96 | %(5) | | | 1.98 | %(5) | | | 1.99 | %(5) | | | 2.03 | %(5)(8) | |
Ratio of Net Investment Income to Average Net Assets(9) | | | 0.12 | %(5) | | | 0.16 | %(5) | | | 0.29 | %(5) | | | 0.11 | %(5)(8) | |
Ratio of Rebate from Morgan Stanley Affiliates to Average Net Assets | | | 0.00 | %(6) | | | 0.00 | %(6) | | | 0.00 | %(6) | | | 0.00 | %(6)(8) | |
Portfolio Turnover Rate | | | 27 | % | | | 28 | % | | | 30 | % | | | 37 | % | |
(9) Supplemental Information on the Ratios to Average Net Assets: | |
Ratios Before Expense Limitation: | |
Expenses to Average Net Assets | | | N/A | | | | N/A | | | | 2.00 | % | | | N/A | | |
Net Investment Income to Average Net Assets | | | N/A | | | | N/A | | | | 0.28 | % | | | N/A | | |
(1) Reflects prior period Custodian out-of-pocket expenses that were reimbursed in September 2016. The amount of the reimbursement was immaterial on a per share basis and did not impact the total return of Class C shares. The Ratio of Expenses to Average Net Assets would have been 0.01% higher and the Ratio of Net Investment Income to Average Net Assets would have been 0.01% lower had the Custodian not reimbursed the Fund.
(2) Commencement of Offering.
(3) Per share amount is based on average shares outstanding.
(4) Calculated based on the net asset value which does not reflect sales charges, if applicable, as of the last business day of the period.
(5) The Ratios of Expenses and Net Investment Income reflect the rebate of certain Fund expenses in connection with the investments in Morgan Stanley affiliates during the period. The effect of the rebate on the ratios is disclosed in the above table as "Ratio of Rebate from Morgan Stanley Affiliates to Average Net Assets."
(6) Amount is less than 0.005%.
(7) Not annualized.
(8) Annualized.
The accompanying notes are an integral part of the financial statements.
17
Morgan Stanley Institutional Fund, Inc.
Annual Report — December 31, 2018
Financial Highlights
Global Franchise Portfolio
| | | Class IS | |
| | | Year Ended December 31, | | Period from
May 29, 2015(2) to | |
Selected Per Share Data and Ratios | | 2018 | | 2017 | | 2016(1) | | December 31, 2015 | |
Net Asset Value, Beginning of Period | | $ | 24.72 | | | $ | 20.55 | | | $ | 20.33 | | | $ | 21.49 | | |
Income (Loss) from Investment Operations: | |
Net Investment Income(3) | | | 0.32 | | | | 0.29 | | | | 0.21 | | | | 0.12 | | |
Net Realized and Unrealized Gain (Loss) | | | (0.65 | ) | | | 5.05 | | | | 0.93 | | | | 0.00 | (4) | |
Total from Investment Operations | | | (0.33 | ) | | | 5.34 | | | | 1.14 | | | | 0.12 | | |
Distributions from and/or in Excess of: | |
Net Investment Income | | | (0.28 | ) | | | (0.25 | ) | | | (0.29 | ) | | | (0.36 | ) | |
Net Realized Gain | | | (1.08 | ) | | | (0.92 | ) | | | (0.63 | ) | | | (0.92 | ) | |
Total Distributions | | | (1.36 | ) | | | (1.17 | ) | | | (0.92 | ) | | | (1.28 | ) | |
Net Asset Value, End of Period | | $ | 23.03 | | | $ | 24.72 | | | $ | 20.55 | | | $ | 20.33 | | |
Total Return(5) | | | (1.45 | )% | | | 26.00 | % | | | 5.70 | % | | | 0.45 | %(8) | |
Ratios and Supplemental Data: | |
Net Assets, End of Period (Thousands) | | $ | 204,031 | | | $ | 90,488 | | | $ | 19,334 | | | $ | 9 | | |
Ratio of Expenses to Average Net Assets(10) | | | 0.88 | %(6) | | | 0.91 | %(6) | | | 0.92 | %(6) | | | 0.94 | %(6)(9) | |
Ratio of Net Investment Income to Average Net Assets(10) | | | 1.30 | %(6) | | | 1.23 | %(6) | | | 0.99 | %(6) | | | 0.95 | %(6)(9) | |
Ratio of Rebate from Morgan Stanley Affiliates to Average Net Assets | | | 0.00 | %(7) | | | 0.00 | %(7) | | | 0.00 | %(7) | | | 0.00 | %(7)(9) | |
Portfolio Turnover Rate | | | 27 | % | | | 28 | % | | | 30 | % | | | 37 | % | |
(10) Supplemental Information on the Ratios to Average Net Assets: | |
Ratios Before Expense Limitation: | |
Expenses to Average Net Assets | | | N/A | | | | N/A | | | | 0.94 | % | | | 16.54 | %(9) | |
Net Investment Income (Loss) to Average Net Assets | | | N/A | | | | N/A | | | | 0.97 | % | | | (14.65 | )%(9) | |
(1) Reflects prior period Custodian out-of-pocket expenses that were reimbursed in September 2016. The amount of the reimbursement was immaterial on a per share basis and did not impact the total return of Class IS shares. The Ratio of Expenses to Average Net Assets would have been 0.01% higher and the Ratio of Net Investment Income to Average Net Assets would have been 0.01% lower had the Custodian not reimbursed the Fund.
(2) Commencement of Offering.
(3) Per share amount is based on average shares outstanding.
(4) Amount is less than $0.005 per share.
(5) Calculated based on the net asset value as of the last business day of the period.
(6) The Ratios of Expenses and Net Investment Income reflect the rebate of certain Fund expenses in connection with the investments in Morgan Stanley affiliates during the period. The effect of the rebate on the ratios is disclosed in the above table as "Ratio of Rebate from Morgan Stanley Affiliates to Average Net Assets."
(7) Amount is less than 0.005%.
(8) Not annualized.
(9) Annualized.
The accompanying notes are an integral part of the financial statements.
18
Morgan Stanley Institutional Fund, Inc.
Annual Report — December 31, 2018
Notes to Financial Statements
Morgan Stanley Institutional Fund, Inc. (the "Company") is registered under the Investment Company Act of 1940, as amended (the "Act"), as an open-end management investment company. The Company is comprised of thirty separate, active, diversified and non-diversified funds (individually referred to as a "Fund", collectively as the "Funds"). The Company applies investment company accounting and reporting guidance.
The accompanying financial statements relate to the Global Franchise Portfolio. The Fund seeks long-term capital appreciation.
The Fund offers five classes of shares — Class I, Class A, Class L, Class C and Class IS. On April 30, 2015, the Fund suspended offering of Class L shares. Existing Class L shareholders may invest through reinvestment of dividends and distributions.
A. Significant Accounting Policies: The following significant accounting policies are in conformity with U.S. generally accepted accounting principles ("GAAP"). Such policies are consistently followed by the Company in the preparation of its financial statements. GAAP may require management to make estimates and assumptions that affect the reported amounts and disclosures in the financial statements. Actual results may differ from those estimates.
In August 2018, the Financial Accounting Standards Board ("FASB") issued Accounting Standards Update ("ASU") 2018-13, Fair Value Measurement (Topic 820) — Disclosures Framework — Changes to Disclosure Requirements of Fair Value Measurement ("ASU 2018-13") which introduces new fair value disclosure requirements as well as eliminates and modifies certain existing fair value disclosure requirements. ASU 2018-13 would be effective for fiscal years beginning after December 15, 2019 and for interim periods within those fiscal years; however, management has elected to early adopt ASU 2018-13 effective with the current reporting period as permitted by the standard. The impact of the Fund's adoption was limited to changes in the Fund's financial statement disclosures regarding fair value, primarily those disclosures related to transfers between levels of the fair value hierarchy and disclosure of the range and weighted average used to develop significant unobservable inputs for Level 3 fair value measurements, when applicable.
1. Security Valuation: (1) An equity portfolio security listed or traded on an exchange is valued at its latest reported sales price (or at the exchange official closing price if such exchange reports an official closing price),
and if there were no sales on a given day and if there is no official exchange closing price for that day, the security is valued at the mean between the last reported bid and asked prices if such bid and asked prices are available on the relevant exchanges. Listed equity securities not traded on the valuation date with no reported bid and asked prices available on the exchange are valued at the mean between the current bid and asked prices obtained from one or more reputable brokers or dealers. In cases where a security is traded on more than one exchange, the security is valued on the exchange designated as the primary market; (2) all other equity portfolio securities for which over-the-counter ("OTC") market quotations are readily available are valued at the latest reported sales price (or at the market official closing price if such market reports an official closing price), and if there was no trading in the security on a given day and if there is no official closing price from relevant markets for that day, the security is valued at the mean between the last reported bid and asked prices if such bid and asked prices are available on the relevant markets. An unlisted equity security that does not trade on the valuation date and for which bid and asked prices from the relevant markets are unavailable is valued at the mean between the current bid and asked prices obtained from one or more reputable brokers or dealers; (3) certain portfolio securities may be valued by an outside pricing service/vendor approved by the Company's Board of Directors (the "Directors"). The pricing service/vendor may employ a pricing model that takes into account, among other things, bids, yield spreads and/or other market data and specific security characteristics. Alternatively, if a valuation is not available from an outside pricing service/vendor, and the security trades on an exchange, the security may be valued at its latest reported sale price (or at the exchange official closing price if such exchange reports an official closing price), prior to the time when assets are valued. If there are no sales on a given day and if there is no official exchange closing price for that day, the security is valued at the mean between the last reported bid and asked prices if such bid and asked prices are available in the relevant exchanges; (4) when market quotations are not readily available, including circumstances under which Morgan Stanley Investment Management Inc. (the "Adviser") or Morgan Stanley Investment Management Limited ("MSIM Limited") (the "Sub-Adviser"), each a wholly-owned subsidiary of Morgan Stanley, determines that the closing price, last sale price or the mean between
19
Morgan Stanley Institutional Fund, Inc.
Annual Report — December 31, 2018
Notes to Financial Statements (cont'd)
the last reported bid and asked prices are not reflective of a security's market value, portfolio securities are valued at their fair value as determined in good faith under procedures established by and under the general supervision of the Directors. Occasionally, developments affecting the closing prices of securities and other assets may occur between the times at which valuations of such securities are determined (that is, close of the foreign market on which the securities trade) and the close of business of the New York Stock Exchange ("NYSE"). If developments occur during such periods that are expected to materially affect the value of such securities, such valuations may be adjusted to reflect the estimated fair value of such securities as of the close of the NYSE, as determined in good faith by the Directors or by the Adviser using a pricing service and/or procedures approved by the Directors; (5) quotations of foreign portfolio securities, other assets and liabilities and forward contracts stated in foreign currency are translated into U.S. dollar equivalents at the prevailing market rates prior to the close of the NYSE; and (6) investments in mutual funds, including the Morgan Stanley Institutional Liquidity Funds, are valued at the net asset value ("NAV") as of the close of each business day.
The Directors have responsibility for determining in good faith the fair value of the investments, and the Directors may appoint others, such as the Company's Adviser or a valuation committee, to assist the Directors in determining fair value and to make the actual calculations pursuant to the fair valuation methodologies previously approved by the Directors. Under procedures approved by the Directors, the Company's Adviser has formed a Valuation Committee whose members are approved by the Directors. The Valuation Committee provides administration and oversight of the Company's valuation policies and procedures, which are reviewed at least annually by the Directors. These procedures allow the Company to utilize independent pricing services, quotations from securities and financial instrument dealers and other market sources to determine fair value.
2. Fair Value Measurement: FASB Accounting Standards CodificationTM ("ASC") 820, "Fair Value Measurement" ("ASC 820"), defines fair value as the value that the Fund would receive to sell an investment or pay to transfer a liability in a timely transaction with an
independent buyer in the principal market, or in the absence of a principal market, the most advantageous market for the investment or liability. ASC 820 establishes a three-tier hierarchy to distinguish between (1) inputs that reflect the assumptions market participants would use in valuing an asset or liability developed based on market data obtained from sources independent of the reporting entity (observable inputs) and (2) inputs that reflect the reporting entity's own assumptions about the assumptions market participants would use in valuing an asset or liability developed based on the best information available in the circumstances (unobservable inputs) and to establish classification of fair value measurements for disclosure purposes. Various inputs are used in determining the value of the Fund's investments. The inputs are summarized in the three broad levels listed below:
• Level 1 – unadjusted quoted prices in active markets for identical investments
• Level 2 – other significant observable inputs (including quoted prices for similar investments, interest rates, prepayment speeds, credit risk, etc.)
• Level 3 – significant unobservable inputs including the Fund's own assumptions in determining the fair value of investments. Factors considered in making this determination may include, but are not limited to, information obtained by contacting the issuer, analysts, or the appropriate stock exchange (for exchange-traded securities), analysis of the issuer's financial statements or other available documents and, if necessary, available information concerning other securities in similar circumstances
The inputs or methodology used for valuing securities are not necessarily an indication of the risk associated with investing in those securities and the determination of the significance of a particular input to the fair value measurement in its entirety requires judgment and considers factors specific to each security.
20
Morgan Stanley Institutional Fund, Inc.
Annual Report — December 31, 2018
Notes to Financial Statements (cont'd)
The following is a summary of the inputs used to value the Fund's investments as of December 31, 2018:
Investment Type | | Level 1
Unadjusted
quoted
prices
(000) | | Level 2
Other
significant
observable
inputs
(000) | | Level 3
Significant
unobservable
inputs
(000) | | Total
(000) | |
Assets: | |
Common Stocks | |
Beverages | | $ | 51,389 | | | $ | 107,336 | | | $ | — | | | $ | 158,725 | | |
Capital Markets | | | 33,180 | | | | — | | | | — | | | | 33,180 | | |
Health Care Equipment &
Supplies | | | 151,871 | | | | — | | | | — | | | | 151,871 | | |
Household Products | | | 26,748 | | | | 111,344 | | | | — | | | | 138,092 | | |
Information Technology
Services | | | 193,138 | | | | — | | | | — | | | | 193,138 | | |
Media | | | 97,189 | | | | — | | | | — | | | | 97,189 | | |
Personal Products | | | — | | | | 114,833 | | | | — | | | | 114,833 | | |
Pharmaceuticals | | | 44,173 | | | | — | | | | — | | | | 44,173 | | |
Professional Services | | | — | | | | 78,366 | | | | — | | | | 78,366 | | |
Software | | | 95,340 | | | | 55,937 | | | | — | | | | 151,277 | | |
Textiles, Apparel &
Luxury Goods | | | 26,169 | | | | — | | | | — | | | | 26,169 | | |
Tobacco | | | 73,331 | | | | 39,188 | | | | — | | | | 112,519 | | |
Total Common Stocks | | | 792,528 | | | | 507,004 | | | | — | | | | 1,299,532 | | |
Short-Term Investment | |
Investment Company | | | 63,220 | | | | — | | | | — | | | | 63,220 | | |
Total Assets | | $ | 855,748 | | | $ | 507,004 | | | $ | — | | | $ | 1,362,752 | | |
Transfers between investment levels may occur as the markets fluctuate and/or the availability of data used in an investment's valuation changes.
3. Foreign Currency Translation and Foreign Investments: The books and records of the Fund are maintained in U.S. dollars. Foreign currency amounts are translated into U.S. dollars as follows:
– investments, other assets and liabilities at the prevailing rate of exchange on the valuation date;
– investment transactions and investment income at the prevailing rates of exchange on the dates of such transactions.
Although the net assets of the Fund are presented at the foreign exchange rates and market values at the close of the period, the Fund does not isolate that portion of the results of operations arising as a result of changes in the foreign exchange rates from the fluctuations arising from changes in the market prices of securities held at period end. Similarly, the Fund does not isolate the effect of changes in foreign exchange rates from the fluctuations arising from changes in the market prices of securities sold during the period. Accordingly, realized and unrealized foreign currency gains (losses) on investments in
securities are included in the reported net realized and unrealized gains (losses) on investment transactions and balances. However, pursuant to U.S. federal income tax regulations, gains and losses from certain foreign currency transactions and the foreign currency portion of gains and losses realized on sales and maturities of foreign denominated debt securities are treated as ordinary income for U.S. federal income tax purposes.
Net realized gains (losses) on foreign currency transactions represent net foreign exchange gains (losses) from foreign currency forward exchange contracts, disposition of foreign currencies, currency gains (losses) realized between the trade and settlement dates on securities transactions, and the difference between the amount of investment income and foreign withholding taxes recorded on the Fund's books and the U.S. dollar equivalent amounts actually received or paid. Net unrealized currency gains (losses) from valuing foreign currency denominated assets and liabilities at period end exchange rates are reflected as a component of unrealized appreciation (depreciation) in the Statement of Assets and Liabilities. The change in unrealized currency gains (losses) on foreign currency translations for the period is reflected in the Statement of Operations.
Foreign security and currency transactions may involve certain considerations and risks not typically associated with those of U.S. dollar denominated transactions as a result of, among other factors, fluctuations of exchange rates in relation to the U.S. dollar, the possibility of lower levels of governmental supervision and regulation of foreign securities markets and the possibility of political or economic instability.
Governmental approval for foreign investments may be required in advance of making an investment under certain circumstances in some countries, and the extent of foreign investments in domestic companies may be subject to limitation in other countries. Foreign ownership limitations also may be imposed by the charters of individual companies to prevent, among other concerns, violations of foreign investment limitations. As a result, an additional class of shares (identified as "Foreign" in the Portfolio of Investments) may be created and offered for investment. The "local" and "foreign shares" market values may differ. In the absence of trading of the foreign shares in such markets, the Fund values the foreign shares at the closing exchange price of the local shares.
21
Morgan Stanley Institutional Fund, Inc.
Annual Report — December 31, 2018
Notes to Financial Statements (cont'd)
4. Indemnifications: The Company enters into contracts that contain a variety of indemnifications. The Company's maximum exposure under these arrangements is unknown. However, the Company has not had prior claims or losses pursuant to these contracts and expects the risk of loss to be remote.
5. Dividends and Distributions to Shareholders: Dividends and distributions to shareholders are recorded on the ex-dividend date. Dividends from net investment income, if any, are declared and paid annually. Net realized capital gains, if any, are distributed at least annually.
6. Security Transactions, Income and Expenses: Security transactions are accounted for on the trade date (date the order to buy or sell is executed). Realized gains and losses on the sale of investment securities are determined on the specific identified cost method. Dividend income and other distributions are recorded on the ex-dividend date (except for certain foreign dividends which may be recorded as soon as the Fund is informed of such dividends) net of applicable withholding taxes. Interest income is recognized on the accrual basis except where collection is in doubt. Discounts are accreted and premiums are amortized over the life of the respective securities. Most expenses of the Company can be directly attributed to a particular Fund. Expenses which cannot be directly attributed are apportioned among the Funds based upon relative net assets or other appropriate methods. Income, expenses (other than class specific expenses — distribution and shareholder services, transfer agency and sub transfer agency fees) and realized and unrealized gains or losses are allocated to each class of shares based upon their relative net assets.
B. Advisory/Sub-Advisory Fees: The Adviser, a wholly-owned subsidiary of Morgan Stanley, provides the Fund with advisory services under the terms of an Investment Advisory Agreement, paid quarterly, at the annual rate based on the daily net assets as follows:
First $500
million | | Next $500
million | | Over $1
billion | |
| | 0.80 | % | | | 0.75 | % | | | 0.70 | % | |
For the year ended December 31, 2018, the advisory fee rate (net of rebate) was equivalent to an annual effective rate of 0.76% of the Fund's average daily net assets.
The Adviser has agreed to reduce its advisory fee and/or reimburse the Fund so that total annual portfolio operating
expenses, excluding certain investment related expenses, taxes, interest and other extraordinary expenses (including litigation), will not exceed 1.00% for Class I shares, 1.35% for Class A shares, 1.85% for Class L shares, 2.10% for Class C shares and 0.95% for Class IS shares. The fee waivers and/or expense reimbursements will continue for at least one year from the date of the Fund's prospectus or until such time as the Directors act to discontinue all or a portion of such waivers and/or reimbursements when they deem such action is appropriate. This arrangement had no effect for the year ended December 31, 2018.
The Adviser has entered into a Sub-Advisory Agreement with the Sub-Adviser, a wholly-owned subsidiary of Morgan Stanley. The Sub-Adviser provides the Fund with advisory services subject to the overall supervision of the Adviser and the Fund's Officers and Directors. The Adviser pays the Sub-Adviser on a monthly basis a portion of the net advisory fees the Adviser receives from the Fund.
C. Administration Fees: The Adviser also serves as Administrator to the Company and provides administrative services pursuant to an Administration Agreement for an annual fee, accrued daily and paid monthly, of 0.08% of the Fund's average daily net assets.
Under a Sub-Administration Agreement between the Administrator and State Street Bank and Trust Company ("State Street"), State Street provides certain administrative services to the Company. For such services, the Administrator pays State Street a portion of the fee the Administrator receives from the Fund.
D. Distribution and Shareholder Services Fees: Morgan Stanley Distribution, Inc. ("MSDI" or the "Distributor"), a wholly-owned subsidiary of the Adviser and an indirect subsidiary of Morgan Stanley, serves as the Company's Distributor of Fund shares pursuant to a Distribution Agreement. The Company has adopted a Shareholder Services Plan with respect to Class A shares pursuant to Rule 12b-1 under the Act. Under the Shareholder Services Plan, the Fund pays the Distributor a shareholder services fee, accrued daily and paid monthly, at an annual rate of 0.25% of the Fund's average daily net assets attributable to Class A shares.
The Company has adopted a Distribution and Shareholder Services Plan with respect to Class L shares pursuant to Rule 12b-1 under the Act. Under the Distribution and Shareholder Services Plan, the Fund pays the Distributor a distribution fee, accrued daily and paid monthly, at an annual rate of 0.50% and a shareholder services fee, accrued daily and paid
22
Morgan Stanley Institutional Fund, Inc.
Annual Report — December 31, 2018
Notes to Financial Statements (cont'd)
monthly, at an annual rate of 0.25% of the Fund's average daily net assets attributable to Class L shares.
The Company has adopted a Distribution and Shareholder Services Plan with respect to Class C shares pursuant to Rule 12b-1 under the Act. Under the Distribution and Shareholder Services Plan, the Fund pays the Distributor a distribution fee, accrued daily and paid monthly, at an annual rate of 0.75% and a shareholder services fee, accrued daily and paid monthly, at an annual rate of 0.25% of the Fund's average daily net assets attributable to Class C shares.
The distribution and shareholder services fees are used to support the expenses associated with servicing and maintaining accounts. The Distributor may compensate other parties for providing shareholder support services to investors who purchase Class A, Class L and Class C shares.
E. Dividend Disbursing and Transfer Agent: The Company's dividend disbursing and transfer agent is DST Asset Manager Solutions, Inc. ("DST"). Pursuant to a Transfer Agency Agreement, the Company pays DST a fee based on the number of classes, accounts and transactions relating to the Funds of the Company.
F. Custodian Fees: State Street (the "Custodian") also serves as Custodian for the Company in accordance with a Custodian Agreement. The Custodian holds cash, securities and other assets of the Company as required by the Act. Custody fees are payable monthly based on assets held in custody, investment purchases and sales activity and account maintenance fees, plus reimbursement for certain out-of-pocket expenses.
G. Security Transactions and Transactions with Affiliates: For the year ended December 31, 2018, purchases and sales of investment securities for the Fund, other than long-term U.S. Government securities and short-term investments were approximately $640,078,000 and $317,588,000, respectively. There were no purchases and sales of long-term U.S. Government securities for the year ended December 31, 2018.
The Fund invests in the Institutional Class of the Morgan Stanley Institutional Liquidity Funds — Treasury Securities Portfolio (the "Liquidity Funds"), an open-end management investment company managed by the Adviser. Advisory fees paid by the Fund are reduced by an amount equal to its pro-rata share of the advisory and administration fees paid by the Fund due to its investment in the Liquidity Funds. For the year ended December 31, 2018, advisory fees paid were
reduced by approximately $55,000 relating to the Fund's investment in the Liquidity Funds.
A summary of the Fund's transactions in shares of affiliated investments during the year ended December 31, 2018 is as follows:
Affiliated
Investment
Company | | Value
December 31,
2017
(000) | | Purchases
at Cost
(000) | | Proceeds
from Sales
(000) | | Dividend
Income
(000) | |
Liquidity Funds | | $ | 25,156 | | | $ | 414,272 | | | $ | 376,208 | | | $ | 482 | | |
Affiliated
Investment
Company (cont'd) | | Realized
Gain (Loss)
(000) | | Change in
Unrealized
Appreciation
(Depreciation)
(000) | | Value
December 31,
2018
(000) | |
Liquidity Funds | | $ | — | | | $ | — | | | $ | 63,220 | | |
The Fund is permitted to purchase and sell securities ("cross-trade") from and to other Morgan Stanley funds as well as other funds and client accounts for which the Adviser or an affiliate of the Adviser serves as investment adviser, pursuant to procedures approved by the Directors in compliance with Rule 17a-7 under the Act (the "Rule"). Each cross-trade is executed at the current market price in compliance with provisions of the Rule. For the year ended December 31, 2018, the Fund did not engage in any cross-trade transactions.
The Fund has an unfunded Deferred Compensation Plan (the "Compensation Plan"), which allows each independent Director to defer payment of all, or a portion, of the fees he or she receives for serving on the Board of Directors. Each eligible Director generally may elect to have the deferred amounts credited with a return equal to the total return on one or more of the Morgan Stanley funds that are offered as investment options under the Compensation Plan. Appreciation/depreciation and distributions received from these investments are recorded with an offsetting increase/decrease in the deferred compensation obligation and do not affect the NAV of the Fund.
H. Federal Income Taxes: It is the Fund's intention to continue to qualify as a regulated investment company and distribute all of its taxable and tax-exempt income. Accordingly, no provision for Federal income taxes is required in the financial statements.
The Fund may be subject to taxes imposed by countries in which it invests. Such taxes are generally based on income and/or capital gains earned or repatriated. Taxes are accrued based on net investment income, net realized gains and net unrealized appreciation as such income and/or gains are earned. Taxes may also be based on transactions in foreign
23
Morgan Stanley Institutional Fund, Inc.
Annual Report — December 31, 2018
Notes to Financial Statements (cont'd)
currency and are accrued based on the value of investments denominated in such currency.
FASB ASC 740-10, "Income Taxes — Overall", sets forth a minimum threshold for financial statement recognition of the benefit of a tax position taken or expected to be taken in a tax return. Management has concluded there are no significant uncertain tax positions that would require recognition in the financial statements. If applicable, the Fund recognizes interest accrued related to unrecognized tax benefits in "Interest Expense" and penalties in "Other Expenses" in the Statement of Operations. The Fund files tax returns with the U.S. Internal Revenue Service, New York and various states. Generally, each of the tax years in the four-year period ended December 31, 2018 remains subject to examination by taxing authorities.
The tax character of distributions paid may differ from the character of distributions for GAAP purposes due to short-term capital gains being treated as ordinary income for tax purposes. The tax character of distributions paid during fiscal 2018 and 2017 was as follows:
2018
Distributions
Paid From: | | 2017
Distributions
Paid From: | |
Ordinary
Income
(000) | | Long-Term
Capital Gain
(000) | | Ordinary
Income
(000) | | Long-Term
Capital Gain
(000) | |
| $ | 12,935 | | | $ | 55,773 | | | $ | 11,212 | | | $ | 35,316 | | |
The amount and character of income and gains to be distributed are determined in accordance with income tax regulations which may differ from GAAP. These book/tax differences are either considered temporary or permanent in nature.
Temporary differences are primarily due to differing book and tax treatments in the timing of the recognition of gains (losses) on certain investment transactions and the timing of the deductibility of certain expenses.
Permanent differences, primarily due to equalization debits and a nondeductible expense, resulted in the following reclassifications among the components of net assets at December 31, 2018:
Total
Distributable
Earnings
(000) | | Paid-in-
Capital
(000) | |
| $ | (5,354 | ) | | $ | 5,354 | | |
At December 31, 2018, the components of distributable earnings for the Fund on a tax basis were as follows:
Undistributed
Ordinary
Income
(000) | | Undistributed
Long-Term
Capital Gain
(000) | |
| $ | 745 | | | $ | 1,772 | | |
I. Credit Facility: The Company and other Morgan Stanley funds participated in a $150,000,000 committed, unsecured revolving line of credit facility (the "Facility") with State Street. This Facility is to be used for temporary emergency purposes or funding of shareholder redemption requests. The interest rate on borrowings is based on the federal funds rate or 1 month LIBOR rate plus a spread. The Facility also has a commitment fee of 0.25% per annum based on the unused portion of the Facility. During the year ended December 31, 2018, the Fund did not have any borrowings under the Facility.
J. Other: At December 31, 2018, the Fund had record owners of 10% or greater. Investment activities of these shareholders could have a material impact on the Fund. The aggregate percentage of such owners was 20.1%.
24
Morgan Stanley Institutional Fund, Inc.
Annual Report — December 31, 2018
Report of Independent Registered Public Accounting Firm
To the Shareholders and Board of Directors of
Morgan Stanley Institutional Fund, Inc. —
Global Franchise Portfolio
Opinion on the Financial Statements
We have audited the accompanying statement of assets and liabilities of Global Franchise Portfolio (the "Fund") (one of the funds constituting the Morgan Stanley Institutional Fund, Inc. (the "Company")), including the portfolio of investments, as of December 31, 2018, and the related statement of operations for the year then ended, the statements of changes in net assets for each of the two years in the period then ended, the financial highlights for each of the five years in the period then ended and the related notes (collectively referred to as the "financial statements"). In our opinion, the financial statements present fairly, in all material respects, the financial position of Global Franchise Portfolio (one of the funds constituting Morgan Stanley Institutional Fund, Inc.) at December 31, 2018, the results of its operations for the year then ended, the changes in its net assets for each of the two years in the period then ended and its financial highlights for each of the five years in the period then ended, in conformity with U.S. generally accepted accounting principles.
Basis for Opinion
These financial statements are the responsibility of the Company's management. Our responsibility is to express an opinion on the Fund's financial statements based on our audits. We are a public accounting firm registered with the Public Company Accounting Oversight Board (United States) ("PCAOB") and are required to be independent with respect to the Company in accordance with the U.S. federal securities law and the applicable rules and regulations of the Securities and Exchange Commission and the PCAOB.
We conducted our audits in accordance with the standards of the PCAOB. Those standards require that we plan and perform the audit to obtain reasonable assurance about whether the financial statements are free of material misstatement, whether due to error or fraud. The Company is not required to have, nor were we engaged to perform, an audit of the Company's internal control over financial reporting. As part of our audits, we are required to obtain an understanding of internal control over financial reporting, but not for the purpose of expressing an opinion on the effectiveness of the Company's internal control over financial reporting. Accordingly, we express no such opinion.
Our audits included performing procedures to assess the risks of material misstatement of the financial statements, whether due to error or fraud, and performing procedures that respond to those risks. Such procedures included examining, on a test basis, evidence regarding the amounts and disclosures in the financial statements. Our procedures included confirmation of securities owned as of December 31, 2018 by correspondence with the custodian and others or by other appropriate auditing procedures where replies from others were not received. Our audits also included evaluating the accounting principles used and significant estimates made by management, as well as evaluating the overall presentation of the financial statements. We believe that our audits provide a reasonable basis for our opinion.

We have served as the auditor of one or more Morgan Stanley investment companies since 2000.
Boston, Massachusetts
February 26, 2019
25
Morgan Stanley Institutional Fund, Inc.
Annual Report — December 31, 2018
Federal Tax Notice (unaudited)
For federal income tax purposes, the following information is furnished with respect to the distributions paid by the Fund during its taxable year ended December 31, 2018. For corporate shareholders, 88.2% of the dividends qualified for the dividends received deduction.
The Fund designated and paid approximately $55,773,000 as a long-term capital gain distribution.
For federal income tax purposes, the following information is furnished with respect to the Fund's earnings for its taxable year ended December 31, 2018. When distributed, certain earnings may be subject to a maximum tax rate of 15% as provided for the Jobs and Growth Tax Relief Reconciliation Act of 2003. The Fund designated up to a maximum of approximately $12,935,000 as taxable at this lower rate.
In January, the Fund provides tax information to shareholders for the preceding calendar year.
26
Morgan Stanley Institutional Fund, Inc.
Annual Report — December 31, 2018
Privacy Notice (unaudited)
MORGAN STANLEY INVESTMENT MANAGEMENT INC.
AN IMPORTANT NOTICE CONCERNING OUR U.S. PRIVACY POLICY
We are required by federal law to provide you with a copy of our privacy policy annually. This policy applies to current and former individual investors in funds managed or sponsored by Morgan Stanley Investment Management Inc. ("MSIM") as well as current and former individual clients of MSIM. This policy is not applicable to partnerships, corporations, trusts or other non-individual clients or investors. Please note that we may amend this policy at any time, and will inform you of any changes as required by law.
WE RESPECT YOUR PRIVACY
We appreciate that you have provided us with your personal financial information. We strive to maintain the privacy of such information while we help you achieve your financial objectives. This Notice describes what non-public personal information we collect about you, why we collect it, when we may share it with others and how certain others may use it. It discusses the steps you may take to limit our sharing of certain information about you to affiliated companies in the Morgan Stanley family of companies ("other Morgan Stanley companies"). It also discloses how you may limit use of certain shared information for marketing purposes by other Morgan Stanley branded companies. Throughout this policy, we refer to the non-public information that personally identifies you or your accounts as "personal information."
1. WHAT PERSONAL INFORMATION DO WE COLLECT ABOUT YOU?
We obtain personal information from applications and other forms you submit to us, from your dealings with us, from consumer reporting agencies, from our Web sites and from third parties and other sources.
For example:
• We may collect information such as your name, address, e-mail address, telephone/fax numbers, assets, income and investment objectives through subscription documents, applications and other forms you submit to us.
• We may obtain information about account balances, your use of account(s) and the types of products and services you prefer to receive from us through your dealings and transactions with us and other sources.
• We may obtain information about your creditworthiness and credit history from consumer reporting agencies.
• We may collect background information from and through third-party vendors to verify representations you have made and to comply with various regulatory requirements.
• If you interact with us through our public and private Web sites, we may collect information that you provide directly through online communications (such as an e-mail address). We may also collect information about your Internet service provider, your domain name, your computer's operating system and Web browser, your use of our Web sites and your product and service preferences, through the use of "cookies." Please consult the Terms of Use of these sites for more details.
2. WHEN DO WE DISCLOSE PERSONAL INFORMATION WE COLLECT ABOUT YOU?
We may disclose personal information we collect about you to other Morgan Stanley companies and to non-affiliated third parties.
a. Information We Disclose to Other Morgan Stanley Companies.
We may disclose personal information to other Morgan Stanley companies for a variety of reasons, including to manage your account(s) effectively, to service and process your transactions, to let you know about products and services offered by us and other Morgan Stanley companies, to manage our business, and as otherwise required or permitted by law. Offers for products and services from other Morgan Stanley companies are developed under conditions designed to safeguard your personal information.
27
Morgan Stanley Institutional Fund, Inc.
Annual Report — December 31, 2018
Privacy Notice (unaudited) (cont'd)
b. Information We Disclose to Non-affiliated Third Parties.
We do not disclose personal information that we collect about you to non-affiliated third parties except to those who provide marketing services on our behalf, to financial institutions with whom we have joint marketing agreements, and as otherwise required or permitted by law. For example, we may disclose personal information to non-affiliated third parties for servicing and processing transactions, to offer our own products and services, to protect against fraud, for institutional risk control, to respond to judicial process or to perform services on our behalf. When we share personal information with a non-affiliated third party, they are required to limit their use of personal information to the particular purpose for which it was shared and they are not allowed to share personal information with others except to fulfill that limited purpose or as may be permitted or required by law.
3. HOW DO WE PROTECT THE SECURITY AND CONFIDENTIALITY OF PERSONAL INFORMATION WE COLLECT ABOUT YOU?
We maintain physical, electronic and procedural security measures to help safeguard the personal information we collect about you. We have internal policies governing the proper handling of client information. Third parties that provide support or marketing services on our behalf may also receive personal information, and we require them to adhere to confidentiality standards with respect to such information.
4. HOW CAN YOU LIMIT THE SHARING OF CERTAIN TYPES OF PERSONAL INFORMATION WITH OTHER MORGAN STANLEY COMPANIES?
We offer you choices as to whether we share with other Morgan Stanley companies the personal information that was collected to determine your eligibility for products and services you request ("eligibility information"). Eligibility information does not include your identification information or personal information pertaining to our transactions or experiences with you. Please note that, even if you direct us not to share eligibility information with other Morgan Stanley companies ("opt-out"), we may still share personal information, including eligibility information, with those companies in circumstances excluded from the opt-out under applicable law, such as to process transactions or to service your account.
5. HOW CAN YOU LIMIT THE USE OF CERTAIN TYPES OF PERSONAL INFORMATION BY OTHER MORGAN STANLEY COMPANIES FOR MARKETING?
By following the opt-out instructions in Section 6 below, you may limit other Morgan Stanley branded companies from marketing their products or services to you based on personal information we disclose to them. This information may include, for example, your income and account history with us. Please note that, even if you choose to limit Other Morgan Stanley Companies from using personal information about you that we may share with them for marketing their products and services to you, Other Morgan Stanley Companies may use your personal information that they obtain from us to market to you in circumstances permitted by law, such as if the Other Morgan Stanley Company has its own relationship with you.
6. HOW CAN YOU SEND US AN OPT-OUT INSTRUCTION?
If you wish to limit our sharing of eligibility information about you with other Morgan Stanley companies or other Morgan Stanley companies' use of personal information for marketing purposes, as described in this notice, you may do so by:
• Calling us at (800) 548-7786
Monday–Friday between 8a.m. and 6p.m.(EST)
• Writing to us at the following address:
DST Asset Manager Solutions, Inc.
c/o Privacy Coordinator
P.O. Box 219804
Kansas City, Missouri 64121
28
Morgan Stanley Institutional Fund, Inc.
Annual Report — December 31, 2018
Privacy Notice (unaudited) (cont'd)
Your written request should include your name, address, telephone number and account number(s) to which the opt-out applies and whether you are opting out with respect to sharing of eligibility information (Section 4 above), or if information used for Marketing (Section 5 above) or both. Written opt-out requests should not be sent with any other correspondence. In order to process your request, we require that the request be provided by you directly and not through a third party.
Your opt-out preference will remain in effect with respect to this policy (as it may be amended) until you notify us otherwise. If you have a joint account, your direction for us not to share this information with other Morgan Stanley companies and for those other Morgan Stanley companies not to use your personal information for marketing will be applied to all account holders on that account. Please understand that if you limit our sharing or our affiliated companies' use of personal information, you and any joint account holder(s) may not receive information about Morgan Stanley products and services, including products or services that could help you manage your financial resources and achieve your investment objectives.
7. WHAT IF AN AFFILIATED COMPANY BECOMES A NON-AFFILIATED THIRD PARTY?
If, at any time in the future, an affiliated company becomes a non-affiliated third party, further disclosures of personal information made to the former affiliated company will be limited to those described in Section 2(b) above relating to non-affiliated third parties. If you elected under Section 6 to limit disclosures we make to affiliated companies, or use of personal information by affiliated companies, your election will not apply to use by any former affiliated company of your personal information in their possession once it becomes a non-affiliated third party.
SPECIAL NOTICE TO RESIDENTS OF VERMONT
The following section supplements our policy with respect to our individual clients who have a Vermont address and supersedes anything to the contrary in the above policy with respect to those clients only.
The state of Vermont requires financial institutions to obtain your consent prior to sharing personal information that they collect about you with affiliated companies and non-affiliated third parties other than in certain limited circumstances. Except as permitted by law, we will not share personal information we collect about you with non-affiliated third parties or other Morgan Stanley companies unless you provide us with your written consent to share such information ("opt-in").
If you wish to receive offers for investment products and services offered by or through other Morgan Stanley companies, please notify us in writing at the following address:
DST Asset Manager Solutions, Inc.
c/o Privacy Coordinator
P.O. Box 219804
Kansas City, Missouri 64121
Your authorization should include your name, address, telephone number and account number(s) to which the opt-in applies and should not be sent with any other correspondence. In order to process your authorization, we require that the authorization be provided by you directly and not through a third party.
SPECIAL NOTICE TO RESIDENTS OF CALIFORNIA
The following section supplements our policy with respect to our individual clients who have a California address and supersedes anything to the contrary in the above policy with respect to those clients only.
In response to a California law, if your account has a California home address, your personal information will not be disclosed to non-affiliated third parties except as permitted by applicable California law, and we will limit sharing such information with our affiliates to comply with California privacy laws that apply to us.
29
Morgan Stanley Institutional Fund, Inc.
Annual Report — December 31, 2018
Director and Officer Information (unaudited)
Independent Directors:
Name, Age and Address of
Independent Director | | Position(s)
Held with
Registrant | | Length of Time
Served* | | Principal Occupation(s) During Past 5 Years
and Other Relevant Professional Experience | | Number of
Portfolios in
Fund Complex
Overseen by
Independent
Director** | | Other Directorships
Held by Independent
Director*** | |
Frank L. Bowman (74)
c/o Perkins Coie LLP
Counsel to the Independent
Directors
30 Rockefeller Plaza
New York, NY 10112 | | Director | | Since
August
2006 | | President, Strategic Decisions, LLC (consulting) (since February 2009); Director or Trustee of various Morgan Stanley Funds (since August 2006); Chairperson of the Compliance and Insurance Committee (since October 2015); formerly, Chairperson of the Insurance Sub-Committee of the Compliance and Insurance Committee (2007-2015); served as President and Chief Executive Officer of the Nuclear Energy Institute (policy organization) (February 2005-November 2008); retired as Admiral, U.S. Navy after serving over 38 years on active duty including 8 years as Director of the Naval Nuclear Propulsion Program in the Department of the Navy and the U.S. Department of Energy (1996-2004); served as Chief of Naval Personnel (July 1994-September 1996) and on the Joint Staff as Director of Political Military Affairs (June 1992-July 1994); knighted as Honorary Knight Commander of the Most Excellent Order of the British Empire; awarded the Officier de l'Orde National du Mérite by the French Government; elected to the National Academy of Engineering (2009). | | | 82 | | | Director of BP p.l.c.; Director of Naval and Nuclear Technologies LLP; Director Emeritus of the Armed Services YMCA; Member of the National Security Advisory Council of the Center for U.S. Global Engagement and a member of the CNA Military Advisory Board; Trustee of Fairhaven United Methodist Church; Member of the Board of Advisors of the Dolphin Scholarship Foundation; and Director of other various non-profit organizations. | |
Kathleen A. Dennis (65)
c/o Perkins Coie LLP
Counsel to the Independent Directors
30 Rockefeller Plaza
New York, NY 10112 | | Director | | Since
August
2006 | | President, Cedarwood Associates (mutual fund and investment management consulting) (since July 2006); Chairperson of the Liquidity and Alternatives Sub-Committee of the Investment Committee (since October 2006) and Director or Trustee of various Morgan Stanley Funds (since August 2006); formerly, Senior Managing Director of Victory Capital Management (1993-2006). | | | 82 | | | Director of various non-profit organizations. | |
Nancy C. Everett (63)
c/o Perkins Coie LLP
Counsel to the Independent Directors
30 Rockefeller Plaza
New York, NY 10112 | | Director | | Since
January
2015 | | Chief Executive Officer, Virginia Commonwealth University Investment Company (since November 2015); Owner, OBIR, LLC (institutional investment management consulting) (since June 2014); formerly, Managing Director, BlackRock Inc. (February 2011-December 2013); and Chief Executive Officer, General Motors Asset Management (a/k/a Promark Global Advisors, Inc.) (June 2005-May 2010). | | | 83 | | | Formerly, Member of Virginia Commonwealth University School of Business Foundation (2005-2016); Member of Virginia Commonwealth University Board of Visitors (2013-2015); Member of Committee on Directors for Emerging Markets Growth Fund, Inc. (2007-2010); Chairperson of Performance Equity Management, LLC (2006-2010); and Chairperson, GMAM Absolute Return Strategies Fund, LLC (2006-2010). | |
30
Morgan Stanley Institutional Fund, Inc.
Annual Report — December 31, 2018
Director and Officer Information (unaudited) (cont'd)
Independent Directors: (cont'd)
Name, Age and Address of
Independent Director | | Position(s)
Held with
Registrant | | Length of Time
Served* | | Principal Occupation(s) During Past 5 Years
and Other Relevant Professional Experience | | Number of
Portfolios in
Fund Complex
Overseen by
Independent
Director** | | Other Directorships
Held by Independent
Director*** | |
Jakki L. Haussler (61)
c/o Perkins Coie LLP
Counsel to the Independent Directors
30 Rockefeller Plaza
New York, NY 10112 | | Director | | Since
January
2015 | | Chairman and Chief Executive Officer, Opus Capital Group (since January 1996); formerly, Director, Capvest Venture Fund, LP (May 2000-December 2011); Partner, Adena Ventures, LP (July 1999-December 2010); Director, The Victory Funds (February 2005-July 2008). | | | 83 | | | Director of Service Corporation International and Member, Audit Committee and Investment Committee; Director of Cincinnati Bell Inc. and Member, Audit Committee and Governance and Nominating Committee; Chairman of Northern Kentucky University Member Investment Committee; Member of Chase College of Law Transactional Law Practice Center Board of Advisors; Director of Best Transport; Director of Chase College of Law Board of Visitors; formerly, Member, University of Cincinnati Foundation Investment Committee; Member, Miami University Board of Visitors (2008-2011); Trustee of Victory Funds (2005-2008) and Chairman, Investment Committee (2007-2008) and Member, Service Provider Committee (2005-2008). | |
Dr. Manuel H. Johnson (69)
c/o Johnson Smick
International, Inc.
220 I Street, NE — Suite 200
Washington, D.C. 20002 | | Director | | Since
July
1991 | | Senior Partner, Johnson Smick International, Inc. (consulting firm); Chairperson of the Investment Committee (since October 2006) and Director or Trustee of various Morgan Stanley Funds (since July 1991); Co-Chairman and a founder of the Group of Seven Council (G7C) (international economic commission); formerly, Chairperson of the Audit Committee (July 1991-September 2006), Vice Chairman of the Board of Governors of the Federal Reserve System and Assistant Secretary of the U.S. Treasury. | | | 82 | | | Director of NVR, Inc. (home construction). | |
Joseph J. Kearns (76)
c/o Perkins Coie LLP
Counsel to the Independent Directors
30 Rockefeller Plaza
New York, NY 10112 | | Director | | Since
August
1994 | | Senior Adviser, Kearns & Associates LLC (investment consulting); Chairperson of the Audit Committee (since October 2006) and Director or Trustee of various Morgan Stanley Funds (since August 1994); formerly, Deputy Chairperson of the Audit Committee (July 2003-September 2006) and Chairperson of the Audit Committee of various Morgan Stanley Funds (since August 1994); CFO of the J. Paul Getty Trust. | | | 83 | | | Prior to August 10, 2016, Director of Electro Rent Corporation (equipment leasing); Prior to December 31, 2013, Director of The Ford Family Foundation. | |
31
Morgan Stanley Institutional Fund, Inc.
Annual Report — December 31, 2018
Director and Officer Information (unaudited) (cont'd)
Independent Directors: (cont'd)
Name, Age and Address of
Independent Director | | Position(s)
Held with
Registrant | | Length of Time
Served* | | Principal Occupation(s) During Past 5 Years
and Other Relevant Professional Experience | | Number of
Portfolios in
Fund Complex
Overseen by
Independent
Director** | | Other Directorships
Held by Independent
Director*** | |
Michael F. Klein (60)
c/o Perkins Coie LLP
Counsel to the Independent Directors
30 Rockefeller Plaza
New York, NY 10112 | | Director | | Since
August
2006 | | Managing Director, Aetos Alternatives Management, LP (since March 2000); Co-President, Aetos Alternatives Management, LP (since January 2004) and Co-Chief Executive Officer of Aetos Alternatives Management, LP (since August 2013); Chairperson of the Fixed Income Sub-Committee of the Investment Committee (since October 2006) and Director or Trustee of various Morgan Stanley Funds (since August 2006); formerly, Managing Director, Morgan Stanley & Co. Inc. and Morgan Stanley Dean Witter Investment Management and President, various Morgan Stanley Funds (June 1998-March 2000); Principal, Morgan Stanley & Co. Inc. and Morgan Stanley Dean Witter Investment Management (August 1997-December 1999). | | | 82 | | | Director of certain investment funds managed or sponsored by Aetos Alternatives Management, LP; Director of Sanitized AG and Sanitized Marketing AG (specialty chemicals). | |
Patricia Maleski (58)
c/o Perkins Coie LLP
Counsel to the Independent Directors
30 Rockefeller Plaza
New York, NY 10112 | | Director | | Since
January
2017 | | Managing Director, JPMorgan Asset Management (2004-2016); Oversight and Control Head of Fiduciary and Conflicts of Interest Program (2015-2016); Chief Control Officer-Global Asset Management (2013-2015); President, JPMorgan Funds (2010-2013); Chief Administrative Officer (2004-2013); various other positions including Treasurer and Board Liaison (since 2001). | | | 83 | | | None. | |
Michael E. Nugent (82)
522 Fifth Avenue
New York, NY 10036 | | Chair of the Board and Director | | Chair of the Boards since July 2006 and Director since July 1991 | | Chair of the Boards of various Morgan Stanley Funds (since July 2006); Chairperson of the Closed-End Fund Committee (since June 2012) Governance Committee (since January 2019) and Director or Trustee of various Morgan Stanley Funds (since July 1991); formerly, Chairperson of the Insurance Committee (until July 2006); General Partner, Triumph Capital, L.P. (private investment partnership) (1988-2013). | | | 82 | | | None. | |
W. Allen Reed (71)
c/o Perkins Coie LLP
Counsel to the Independent Directors
30 Rockefeller Plaza
New York, NY 10112 | | Director | | Since
August
2006 | | Chairperson of the Equity Sub-Committee of the Investment Committee (since October 2006) and Director or Trustee of various Morgan Stanley Funds (since August 2006); formerly, President and CEO of General Motors Asset Management; Chairman and Chief Executive Officer of the GM Trust Bank and Corporate Vice President of General Motors Corporation (August 1994-December 2005). | | | 82 | | | Director of Legg Mason, Inc.; formerly, Director of the Auburn University Foundation (2010-2015). | |
Fergus Reid (86)****
c/o Joe Pietryka, Inc.
85 Charles Colman Blvd.
Pawling, NY 12564 | | Director | | Since
June
1992 | | Chairman, Joe Pietryka, Inc.; Chairperson of the Governance Committee and Director or Trustee of various Morgan Stanley Funds (since June 1992). | | | 83 | | | Formerly, Trustee and Director of certain investment companies in the JP Morgan Fund Complex managed by JP Morgan Investment Management Inc. (1987-2012). | |
* This is the earliest date the Director began serving the Morgan Stanley Funds. Each Director serves an indefinite term, until his or her successor is elected.
** The Fund Complex includes (as of December 31, 2018) all open-end and closed-end funds (including all of their portfolios) advised by Morgan Stanley Investment Management Inc. (the "Adviser") and any funds that have an adviser that is an affiliated person of the Adviser (including, but not limited to, Morgan Stanley AIP GP LP).
*** This includes any directorships at public companies and registered investment companies held by the Director at any time during the past five years.
**** Effective date of retirement is December 31, 2018.
32
Morgan Stanley Institutional Fund, Inc.
Annual Report — December 31, 2018
Director and Officer Information (unaudited) (cont'd)
Executive Officers:
Name, Age and Address of Executive Officer | | Position(s) Held
with
Registrant | | Length of Time
Served* | | Principal Occupation(s) During Past 5 Years | |
John H. Gernon (55)
522 Fifth Avenue
New York, NY 10036 | | President and Principal Executive Officer | | Since
September
2013 | | President and Principal Executive Officer of the Equity and Fixed Income Funds and the Morgan Stanley AIP Funds (since September 2013) and the Liquidity Funds and various money market funds (since May 2014) in the Fund Complex; Managing Director of the Adviser; Head of Product (since 2006). | |
Timothy J. Knierim (59)
522 Fifth Avenue
New York, NY 10036 | | Chief Compliance Officer | | Since
December
2016 | | Managing Director of the Adviser and various entities affiliated with the Adviser; Chief Compliance Officer of various Morgan Stanley Funds and the Adviser (since December 2016) and Chief Compliance Officer of Morgan Stanley AIP GP LP (since 2014). Formerly, Managing Director and Deputy Chief Compliance Officer of the Adviser (2014-2016); and formerly, Chief Compliance Officer of Prudential Investment Management, Inc. (2007-2014). | |
Francis J. Smith (53)
522 Fifth Avenue
New York, NY 10036 | | Treasurer and Principal Financial Officer | | Treasurer since July 2003 and Principal Financial Officer since September 2002 | | Managing Director of the Adviser and various entities affiliated with the Adviser; Treasurer (since July 2003) and Principal Financial Officer of various Morgan Stanley Funds (since September 2002). | |
Mary E. Mullin (51)
522 Fifth Avenue
New York, NY 10036 | | Secretary | | Since
June
1999 | | Managing Director of the Adviser; Secretary of various Morgan Stanley Funds (since June 1999). | |
Michael J. Key (39)
522 Fifth Avenue
New York, NY 10036 | | Vice President | | Since
June
2017 | | Vice President of the Equity and Fixed Income Funds, Liquidity Funds, various money market funds and the Morgan Stanley AIP Funds in the Fund Complex (since June 2017); Executive Director of the Adviser; Head of Product Development for Equity and Fixed Income Funds (since August 2013). | |
* This is the earliest date the officer began serving the Morgan Stanley Funds. Each officer serves a one-year term, until his or her successor is elected and qualifies.
33
Morgan Stanley Institutional Fund, Inc.
Annual Report — December 31, 2018
Adviser and Administrator
Morgan Stanley Investment Management Inc.
522 Fifth Avenue
New York, New York 10036
Sub-Adviser
Morgan Stanley Investment Management Limited
25 Cabot Square, Canary Wharf
London, E14 4QA, England
Distributor
Morgan Stanley Distribution, Inc.
522 Fifth Avenue
New York, New York 10036
Dividend Disbursing and Transfer Agent
DST Asset Manager Solutions, Inc.
2000 Crown Colony Drive
Quincy, Massachusetts 02169
Custodian
State Street Bank and Trust Company
One Lincoln Street
Boston, Massachusetts 02111
Legal Counsel
Dechert LLP
1095 Avenue of the Americas
New York, New York 10036
Counsel to the Independent Directors
Perkins Coie LLP
30 Rockefeller Plaza
New York, New York 10112
Independent Registered Public Accounting Firm
Ernst & Young LLP
200 Clarendon Street
Boston, Massachusetts 02116
Reporting to Shareholders
Each Morgan Stanley fund provides a complete schedule of portfolio holdings in its semi-annual and the annual reports within 60 days of the end of the fund's second and fourth fiscal quarters. The semi-annual and annual reports are filed electronically with the Securities and Exchange Commission ("SEC") on Form N-CSRS and Form N-CSR, respectively. Morgan Stanley also delivers the semi-annual and annual reports to fund shareholders and makes these reports available on its public website, www.morganstanley.com/im/shareholderreports. Each Morgan Stanley fund also files a complete schedule of portfolio holdings with the SEC for the fund's first and third fiscal quarters on Form N-Q. Morgan Stanley does not deliver the reports for the first and third fiscal quarters to shareholders, nor are the reports posted to the Morgan Stanley public website. You may, however, obtain the Form N-Q filings (as well as the Form N-CSR and N-CSRS filings) by accessing the SEC's website, www.sec.gov. You can also request copies of these materials, upon payment of a duplicating fee, by electronic request at the SEC's email address (publicinfo@sec.gov).
Proxy Voting Policies and Procedures and Proxy Voting Record
You may obtain a copy of the Company's Proxy Voting Policy and Procedures and information regarding how the Company voted proxies relating to portfolio securities during the most recent twelve-month period ended June 30, without charge, upon request, by calling toll free 1 (800) 548-7786 or by visiting our website at www.morganstanley.com/im/shareholderreports. This information is also available on the SEC's website at www.sec.gov.
This report is authorized for distribution only when preceded or accompanied by a prospectus or summary prospectus of the applicable Fund of Morgan Stanley Institutional Fund, Inc., which describes in detail the Fund's investment policies, risks, fees and expenses. Please read the prospectus carefully before you invest or send money. For additional information, including information regarding the investments comprising the Fund, please visit our website at www.morganstanley.com/im/shareholderreports or call toll free 1 (800) 548-7786.
34
Printed in U.S.A.
This Report has been prepared for shareholders and may be distributed to others only if preceded or accompanied by a current prospectus.
Morgan Stanley Investment Management Inc.
522 Fifth Avenue
New York, New York 10036
© 2019 Morgan Stanley. Morgan Stanley Distribution, Inc.

IFIGFANN
2398695 EXP. 02.29.20

Morgan Stanley Institutional Fund, Inc.
Global Infrastructure Portfolio
Annual Report
December 31, 2018
Beginning on January 1, 2021, as permitted by regulations adopted by the Securities and Exchange Commission ("SEC"), paper copies of the Fund's Annual and Semi-Annual Reports to Shareholders ("Shareholder Reports") will no longer be sent by mail, unless you specifically request paper copies of the Shareholder Reports from the Fund or from your financial intermediary, such as a broker-dealer or a bank. Instead, the Shareholder Reports will be made available on the Fund's website, https://www.morganstanley.com/im/shareholderreports and you will be notified by mail each time a Shareholder Report is posted and provided with a website link to access the Shareholder Report. If you already elected to receive Shareholder Reports electronically, you will not be affected by this change and you need not take any action. You may elect to receive Shareholder Reports and other communications from the Fund electronically anytime by contacting your financial intermediary or, if you are a direct investor, please follow the instructions on the envelope.
Beginning on January 1, 2019, you may elect to receive all future Shareholder Reports in paper free of charge. If you invest through a financial intermediary, you can contact your financial intermediary to request that you continue to receive paper copies of your Shareholder Reports. If you invest directly with the Fund, please follow the instructions on the envelope to let the Fund know you wish to continue receiving paper copies of your Shareholder Reports. Your election to receive Shareholder Reports in paper will apply to all funds held in your account if you invest through your financial intermediary or all funds held with the fund complex if you invest directly with a fund.

Morgan Stanley Institutional Fund, Inc.
Annual Report — December 31, 2018
Shareholders' Letter | | | 2 | | |
Expense Example | | | 3 | | |
Investment Overview | | | 4 | | |
Portfolio of Investments | | | 7 | | |
Statement of Assets and Liabilities | | | 9 | | |
Statement of Operations | | | 11 | | |
Statements of Changes in Net Assets | | | 12 | | |
Financial Highlights | | | 14 | | |
Notes to Financial Statements | | | 20 | | |
Report of Independent Registered Public Accounting Firm | | | 27 | | |
Federal Tax Notice | | | 28 | | |
Privacy Notice | | | 29 | | |
Director and Officer Information | | | 32 | | |
This report is authorized for distribution only when preceded or accompanied by a prospectus or summary prospectus of the applicable Fund of Morgan Stanley Institutional Fund, Inc. To receive a prospectus and/or statement of additional information (SAI), which contains more complete information such as investment objectives, charges, expenses, policies for voting proxies, risk considerations and describes in detail each of the Fund's investment policies to the prospective investor, please call toll free 1 (800) 548-7786. Please read the prospectuses carefully before you invest or send money.
Additionally, you can access information about the Fund, including performance, characteristics and investment team commentary, through Morgan Stanley Investment Management's website: www.morganstanley.com/im/shareholderreports.
Market forecasts provided in this report may not necessarily come to pass. There is no guarantee that any sectors mentioned will continue to perform as discussed herein or that securities in such sectors will be held by the Fund in the future. There is no assurance that a fund will achieve its investment objective. Funds are subject to market risk, which is the possibility that market values of securities owned by the Fund will decline and, therefore, the value of the Fund's shares may be less than what you paid for them. Accordingly, you can lose money investing in this Fund. Please see the prospectus for more complete information on investment risks.
1
Morgan Stanley Institutional Fund, Inc.
Annual Report — December 31, 2018
Shareholders' Letter (unaudited)
Dear Shareholders,
We are pleased to provide this Annual report, in which you will learn how your investment in Global Infrastructure Portfolio (the "Fund") performed during the latest twelve-month period.
Morgan Stanley Investment Management is a client-centric, investor-led organization. Our global presence, intellectual capital, and breadth of products and services enable us to partner with investors to meet the evolving challenges of today's financial markets. We aim to deliver superior investment service and to empower our clients to make the informed decisions that help them reach their investment goals.
As always, we thank you for selecting Morgan Stanley Investment Management, and look forward to working with you in the months and years ahead.
Sincerely,

John H. Gernon
President and Principal Executive Officer
January 2019
2
Morgan Stanley Institutional Fund, Inc.
Annual Report — December 31, 2018
Expense Example (unaudited)
Global Infrastructure Portfolio
As a shareholder of the Fund, you incur two types of costs: (1) transactional costs; and (2) ongoing costs, which may include advisory fees, administration fees, distribution and shareholder services fees and other Fund expenses. This example is intended to help you understand your ongoing costs (in dollars) of investing in the Fund and to compare these costs with the ongoing costs of investing in other mutual funds.
This example is based on an investment of $1,000 invested at the beginning of the six-month period ended December 31, 2018 and held for the entire six-month period.
Actual Expenses
The table below provides information about actual account values and actual expenses. You may use the information in this table, together with the amount you invested, to estimate the expenses that you paid over the period. Simply divide your account value by $1,000 (for example, an $8,600 account value divided by $1,000 = 8.6), then multiply the result by the number in the table under the heading entitled "Actual Expenses Paid During Period" to estimate the expenses you paid on your account during this period.
Hypothetical Example for Comparison Purposes
The table below provides information about hypothetical account values and hypothetical expenses based on the Fund's actual expense ratio and an assumed rate of return of 5% per year before expenses, which is not the Fund's actual return. The hypothetical account values and expenses may not be used to estimate the actual ending account balance or expenses you paid for the period. You may use this information to compare the ongoing costs of investing in the Fund and other funds. To do so, compare this 5% hypothetical example with the 5% hypothetical examples that appear in the shareholder reports of the other funds.
Please note that the expenses shown in the table are meant to highlight your ongoing costs only and do not reflect any transactional costs, such as sales charges (loads). Therefore, the information for each class in the table is useful in comparing ongoing costs only, and will not help you determine the relative total costs of owning different funds. In addition, if these transactional costs were included, your costs would have been higher.
| | | Beginning
Account
Value
7/1/18 | | Actual Ending
Account
Value
12/31/18 | | Hypothetical
Ending Account
Value | | Actual
Expenses
Paid
During
Period* | | Hypothetical
Expenses Paid
During Period* | | Net
Expense
Ratio
During
Period** | |
Global Infrastructure Portfolio Class I | | $ | 1,000.00 | | | $ | 940.40 | | | $ | 1,020.32 | | | $ | 4.74 | | | $ | 4.94 | | | | 0.97 | % | |
Global Infrastructure Portfolio Class A | | | 1,000.00 | | | | 939.00 | | | | 1,019.11 | | | | 5.91 | | | | 6.16 | | | | 1.21 | | |
Global Infrastructure Portfolio Class L | | | 1,000.00 | | | | 936.50 | | | | 1,016.28 | | | | 8.64 | | | | 9.00 | | | | 1.77 | | |
Global Infrastructure Portfolio Class C | | | 1,000.00 | | | | 934.60 | | | | 1,014.77 | | | | 10.09 | | | | 10.51 | | | | 2.07 | | |
Global Infrastructure Portfolio Class IS | | | 1,000.00 | | | | 940.70 | | | | 1,020.47 | | | | 4.60 | | | | 4.79 | | | | 0.94 | | |
Global Infrastructure Portfolio Class IR | | | 1,000.00 | | | | 940.00 | | | | 1,020.47 | | | | 4.60 | | | | 4.79 | | | | 0.94 | | |
* Expenses are calculated using each Fund Class' annualized net expense ratio (as disclosed), multiplied by the average account value over the period and multiplied by 184/365 (to reflect the most recent one-half year period).
** Annualized.
3
Morgan Stanley Institutional Fund, Inc.
Annual Report — December 31, 2018
Investment Overview (unaudited)
Global Infrastructure Portfolio
The Fund seeks to provide both capital appreciation and income.
Performance
For the fiscal year ended December 31, 2018, the Fund's Class I shares had a total return based on net asset value and reinvestment of distributions per share of –8.02%, net of fees. The Fund's Class I shares underperformed the Fund's benchmark, the Dow Jones Brookfield Global Infrastructure IndexSM (the "Index"), which returned –7.87%, and outperformed the Standard & Poor's Global BMI Index ("S&P Global BMI Index"), a proxy for global equities, which returned –9.67%.
Factors Affecting Performance
• Infrastructure shares decreased 7.87% in the year ending December 31, 2018, as measured by the Index. From a sector perspective, gas distribution utilities, communications and water outperformed the Index, while ports, pipeline companies, toll roads, airports, electricity transmission & distribution, gas midstream and diversified underperformed the Index. European regulated utilities' performance was relatively in line with the Index. Subsector performance exhibited a wide dispersion of returns on the year, and it should be noted that in several sectors, outperformance/underperformance was significant.
• After lagging global equity markets for the first three quarters of the year, global infrastructure securities demonstrated their relative resilience during the equity market downturn experienced in the fourth quarter of 2018. Therefore, despite posting negative absolute returns for the full year, it is notable that global infrastructure securities managed to outperform the broader global equity markets on the year. Still, infrastructure securities were not wholly immune from general financial market concerns, which included rising U.S. Federal Reserve rates, indications of economic slowdown in the eurozone and China, ongoing geopolitical concerns in the U.K. and Italy, and trade conflict between the U.S. and China.
• For the full year 2018, the Fund narrowly underperformed the Index. The Fund benefited from bottom-up stock selection, which was offset by top-down considerations. From a bottom-up
perspective, the Fund benefited from favorable stock in the toll roads, diversified, communications and gas midstream sectors, partially offset by adverse stock selection in the electricity transmission & distribution and European regulated utilities sectors. From a top-down perspective, the Fund benefited from overweights to renewables and railroads, along with an underweight to electricity transmission & distribution, but this was more than offset by underweights to gas distribution utilities and communications, as well as an overweight to toll roads.
Management Strategies
• We remain committed to our core investment philosophy as an infrastructure value investor. As value-oriented, bottom-up driven investors, our investment perspective is that over the medium and long term, the key factor in determining the performance of infrastructure securities will be underlying infrastructure asset values. Given the large and growing private infrastructure market, we believe that there are limits as to the level of premium or discount at which the public sector should trade relative to its underlying private infrastructure value. These limits can be viewed as the point at which the arbitrage opportunity between owning infrastructure in the private versus public markets becomes compelling. In aiming to achieve core infrastructure exposure in a cost effective manner, we invest in equity securities of publicly listed infrastructure companies we believe offer the best value relative to their underlying infrastructure value and Net Asset Value growth prospects.
• Our research currently leads us to an overweighting in the Fund to a group of companies in the toll roads, electricity transmission & distribution, diversified and European regulated utilities sectors, and an underweighting to companies in the gas distribution utilities, communications, gas midstream, pipeline companies, water, ports and airports sectors. Finally, we continue to retain an out-of-benchmark position in renewables.
• In terms of outlook for 2019, we enter the year more constructive on the asset class, given the magnitude of declines in 2018. While we acknowledge there are wide ranges in valuations
4
Morgan Stanley Institutional Fund, Inc.
Annual Report — December 31, 2018
Investment Overview (unaudited) (cont'd)
Global Infrastructure Portfolio
within individual subsectors and the asset class is not universally cheap, we believe there are many instances where the market has overreacted to recent top-down or company-specific developments. In particular, energy infrastructure and certain areas of transportation are notable given the very healthy fundamental environment. Also, renewable assets in the listed equity space continue to trade at steep discounts relative to where assets trade in the private markets, as evidenced by the robust private-market transaction activity (renewables remained greater than half the private market infrastructure transactions in 2018 according to Prequin). In 2019, we view the prospects for healthy cash flow and dividend growth for the asset class overall as sound.
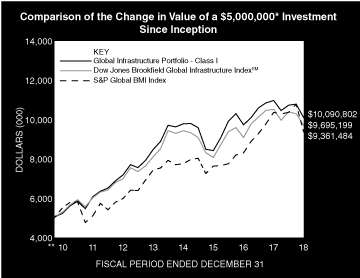
* Minimum Investment for Class I shares
** Commenced Operations on September 20, 2010.
In accordance with SEC regulations, the Fund's performance shown assumes that all recurring fees (including management fees) were deducted and all dividends and distributions were reinvested. The performance of Class A, L, C, IS and IR shares will vary from the performance of Class I shares based upon their different inception dates and will be negatively impacted by additional fees assessed to those classes (if applicable).
5
Morgan Stanley Institutional Fund, Inc.
Annual Report — December 31, 2018
Investment Overview (unaudited) (cont'd)
Global Infrastructure Portfolio
Performance Compared to the Dow Jones Brookfield Global Infrastructure IndexSM(1), the S&P Global BMI Index(2) and the Lipper Global Infrastructure Funds Index(3)
| | | Period Ended December 31, 2018
Total Returns(4) | |
| | | | | Average Annual | |
| | | One
Year | | Five
Years | | Ten
Years | | Since
Inception(9) | |
Fund — Class I Shares
w/o sales charges(5) | | | –8.02 | % | | | 3.54 | % | | | — | | | | 8.85 | % | |
Fund — Class A Shares
w/o sales charges(5) | | | –8.22 | | | | 3.27 | | | | — | | | | 8.57 | | |
Fund — Class A Shares with
maximum 5.25% sales charges(5) | | | –13.04 | | | | 2.16 | | | | — | | | | 7.87 | | |
Fund — Class L Shares
w/o sales charges(5) | | | –8.73 | | | | 2.68 | | | | — | | | | 7.98 | | |
Fund — Class C Shares
w/o sales charges(7) | | | –9.02 | | | | — | | | | — | | | | –1.25 | | |
Fund — Class C Shares with
maximum 1.00% deferred
sales charges(7) | | | –9.86 | | | | — | | | | — | | | | –1.25 | | |
Fund — Class IS Shares
w/o sales charges(6) | | | –7.92 | | | | 3.56 | | | | — | | | | 5.16 | | |
Fund — Class IR Shares
w/o sales charges(8) | | | — | | | | — | | | | — | | | | –4.54 | | |
Dow Jones Brookfield Global
Infrastructure IndexSM | | | –7.87 | | | | 3.63 | | | | — | | | | 8.33 | | |
S&P Global BMI Index | | | –9.67 | | | | 4.72 | | | | — | | | | 7.87 | | |
Lipper Global Infrastructure
Funds Index | | | –7.19 | | | | 4.42 | | | | — | | | | N/A | | |
Performance data quoted represents past performance, which is no guarantee of future results, and current performance may be lower or higher than the figures shown. Performance assumes that all dividends and distributions, if any, were reinvested. For the most recent month-end performance figures, please visit www.morganstanley.com/im/shareholderreports. Investment return and principal value will fluctuate so that Fund shares, when redeemed, may be worth more or less than their original cost. Returns for periods less than one year are not annualized. Total returns do not reflect the deduction of taxes that a shareholder would pay on Fund distributions or the redemption of Fund shares. Performance of share classes will vary due to difference in sales charges and expenses.
(1) The Dow Jones Brookfield Global Infrastructure IndexSM is a float-adjusted market capitalization weighted index that measures the stock performance of companies that exhibit strong infrastructure characteristics. The Index intends to measure all sectors of the infrastructure market. The Index is unmanaged and its returns do not include any sales charges or fees. Such costs would lower performance. It is not possible to invest directly in an index.
(2) The Standard & Poor's Global BMI Index (S&P Global BMI Index) is a broad market index designed to capture exposure to equities in all countries in the world that meet minimum size and liquidity requirements. As of the date of this Report, there are approximately 11,000 index members representing developed and emerging market countries. The Index is unmanaged and its returns do not include any sales charges or fees. Such costs would lower performance. It is not possible to invest directly in an index.
(3) The Lipper Global Infrastructure Funds Index is an equally weighted performance index of the largest qualifying funds (based on net assets) in the Lipper Global Infrastructure Funds classification. The Index, which is adjusted for capital gains distributions and income dividends, is unmanaged and should not be considered an investment. There are currently 10 funds represented in this Index. As of the date of this report, the Fund is in the Lipper Global Infrastructure Funds classification.The history of this Index began in October 2011. Therefore, there is no "Since Inception" return data available and the Index is not shown on the graph.
(4) Total returns for the Fund reflect fees waived and expenses reimbursed, if applicable, by Morgan Stanley Investment Management Inc. (the "Adviser"). Without such waivers and reimbursements, total returns would have been lower.
(5) Commenced operations on September 20, 2010.
(6) Commenced offering on September 13, 2013.
(7) Commenced offering on April 30, 2015.
(8) Commenced offering on June 15, 2018.
(9) For comparative purposes, average annual since inception returns listed for the Indexes refer to the inception date of Class I of the Fund, not the inception of the Index.
6
Morgan Stanley Institutional Fund, Inc.
Annual Report — December 31, 2018
Portfolio of Investments
Global Infrastructure Portfolio
| | | Shares | | Value
(000) | |
Common Stocks (100.0%) | |
Australia (7.1%) | |
APA Group | | | 310,772 | | | $ | 1,861 | | |
Atlas Arteria Ltd. | | | 724,855 | | | | 3,196 | | |
Spark Infrastructure Group | | | 1,417,866 | | | | 2,208 | | |
Sydney Airport | | | 1,007,235 | | | | 4,774 | | |
Transurban Group | | | 1,208,855 | | | | 9,924 | | |
| | | | 21,963 | | |
Brazil (0.3%) | |
Energisa SA (Units) (a) | | | 103,700 | | | | 995 | | |
Canada (15.2%) | |
Enbridge, Inc. | | | 607,255 | | | | 18,865 | | |
Hydro One Ltd. (b) | | | 805,036 | | | | 11,941 | | |
Pembina Pipeline Corp. (b) | | | 216,798 | | | | 6,433 | | |
TransCanada Corp. (b) | | | 275,138 | | | | 9,825 | | |
| | | | 47,064 | | |
China (0.8%) | |
ENN Energy Holdings Ltd. (c) | | | 271,000 | | | | 2,389 | | |
France (6.6%) | |
Aeroports de Paris | | | 12,430 | | | | 2,350 | | |
Getlink SE | | | 450,050 | | | | 6,040 | | |
Vinci SA | | | 144,370 | | | | 11,864 | | |
| | | | 20,254 | | |
Germany (0.2%) | |
Fraport AG Frankfurt Airport Services Worldwide | | | 9,600 | | | | 686 | | |
Hong Kong (0.3%) | |
China Everbright International Ltd. | | | 1,164,000 | | | | 1,036 | | |
India (1.1%) | |
Azure Power Global Ltd. (d) | | | 376,892 | | | | 3,411 | | |
Italy (2.2%) | |
Atlantia SpA | | | 131,542 | | | | 2,724 | | |
Infrastrutture Wireless Italiane SpA | | | 25,370 | | | | 173 | | |
Italgas SpA | | | 274,808 | | | | 1,571 | | |
Snam SpA | | | 542,730 | | | | 2,376 | | |
| | | | 6,844 | | |
Mexico (7.4%) | |
Promotora y Operadora de Infraestructura
SAB de CV | | | 2,383,491 | | | | 22,782 | | |
Netherlands (1.4%) | |
Koninklijke Vopak N.V. | | | 94,270 | | | | 4,271 | | |
New Zealand (0.7%) | |
Auckland International Airport Ltd. | | | 482,055 | | | | 2,314 | | |
Spain (9.9%) | |
Aena SME SA | | | 15,180 | | | | 2,354 | | |
Atlantica Yield PLC | | | 1,167,551 | | | | 22,884 | | |
Ferrovial SA | | | 204,451 | | | | 4,123 | | |
Red Electrica Corp., SA | | | 54,130 | | | | 1,206 | | |
| | | | 30,567 | | |
| | | Shares | | Value
(000) | |
Switzerland (0.3%) | |
Flughafen Zurich AG (Registered) | | | 5,730 | | | $ | 946 | | |
United Kingdom (12.4%) | |
John Laing Group PLC | | | 2,563,541 | | | | 10,813 | | |
National Grid PLC | | | 1,380,771 | | | | 13,353 | | |
Pennon Group PLC | | | 266,661 | | | | 2,351 | | |
Severn Trent PLC | | | 137,906 | | | | 3,186 | | |
United Utilities Group PLC | | | 906,998 | | | | 8,493 | | |
| | | | 38,196 | | |
United States (34.1%) | |
American Tower Corp. REIT | | | 137,900 | | | | 21,815 | | |
American Water Works Co., Inc. | | | 60,970 | | | | 5,534 | | |
Atmos Energy Corp. | | | 64,406 | | | | 5,972 | | |
Cheniere Energy, Inc. (d) | | | 88,830 | | | | 5,258 | | |
Consolidated Edison, Inc. | | | 81,780 | | | | 6,253 | | |
Crown Castle International Corp. REIT | | | 120,452 | | | | 13,085 | | |
Edison International | | | 114,257 | | | | 6,486 | | |
Eversource Energy | | | 97,461 | | | | 6,339 | | |
Kinder Morgan, Inc. | | | 668,690 | | | | 10,284 | | |
NiSource, Inc. | | | 113,678 | | | | 2,882 | | |
PG&E Corp. (d) | | | 183,686 | | | | 4,363 | | |
Sempra Energy (b) | | | 91,506 | | | | 9,900 | | |
Targa Resources Corp. | | | 40,770 | | | | 1,468 | | |
Williams Cos., Inc. (The) | | | 259,833 | | | | 5,729 | | |
| | | | 105,368 | | |
Total Common Stocks (Cost $293,912) | | | 309,086 | | |
Short-Term Investments (2.4%) | |
Securities held as Collateral on Loaned Securities (2.2%) | |
Investment Company (1.8%) | |
Morgan Stanley Institutional Liquidity
Funds — Treasury Securities Portfolio —
Institutional Class (See Note G) | | | 5,336,746 | | | | 5,337 | | |
| | | Face
Amount
(000) | | | |
Repurchase Agreements (0.4%) | |
Barclays Capital, Inc., (2.90%,
dated 12/31/18, due 1/2/19; proceeds $403;
fully collateralized by a U.S. Government
obligation; 2.50% due 5/15/24;
valued at $411) | | $ | 403 | | | | 403 | | |
HSBC Securities USA, Inc., (2.95%,
dated 12/31/18, due 1/2/19; proceeds $817;
fully collateralized by U.S. Government
obligations; 0.00% - 2.75%
due 1/31/19 - 2/15/42; valued at $833) | | | 817 | | | | 817 | | |
| | | | 1,220 | | |
Total Securities held as Collateral on Loaned
Securities (Cost $6,557) | | | 6,557 | | |
The accompanying notes are an integral part of the financial statements.
7
Morgan Stanley Institutional Fund, Inc.
Annual Report — December 31, 2018
Portfolio of Investments (cont'd)
Global Infrastructure Portfolio
| | | Shares | | Value
(000) | |
Investment Company (0.2%) | |
Morgan Stanley Institutional Liquidity
Funds — Treasury Portfolio —
Institutional Class (See Note G)
(Cost $708) | | | 707,740 | | | $ | 708 | | |
Total Short-Term Investments (Cost $7,265) | | | 7,265 | | |
Total Investments (102.4%) (Cost $301,177)
Including $23,614 of Securities Loaned (e)(f) | | | 316,351 | | |
Liabilities in Excess of Other Assets (–2.4%) | | | (7,265 | ) | |
Net Assets (100.0%) | | $ | 309,086 | | |
Country assignments and aggregations are based generally on third party vendor classifications and information, and may be different from the assignments and aggregations under the policies set forth in the Fund's prospectus and/or statement of additional information relating to geographic classifications.
(a) Consists of one or more classes of securities traded together as a unit; stocks with attached warrants.
(b) All or a portion of this security was on loan at December 31, 2018.
(c) Security trades on the Hong Kong exchange.
(d) Non-income producing security.
(e) The approximate fair value and percentage of net assets, $107,577,000 and 34.8%, respectively, represent the securities that have been fair valued under the fair valuation policy for international investments as described in Note A-1 within the Notes to the Financial Statements.
(f) At December 31, 2018, the aggregate cost for federal income tax purposes is approximately $310,163,000. The aggregate gross unrealized appreciation is approximately $25,448,000 and the aggregate gross unrealized depreciation is approximately $19,261,000, resulting in net unrealized appreciation of approximately $6,187,000.
REIT Real Estate Investment Trust.
Portfolio Composition*
Classification | | Percentage of
Total Investments | |
Oil & Gas Storage & Transportation | | | 28.8 | % | |
Electricity Transmission & Distribution | | | 17.2 | | |
Toll Roads | | | 14.4 | | |
Communications | | | 11.3 | | |
Diversified | | | 8.6 | | |
Renewables | | | 8.5 | | |
Water | | | 6.6 | | |
Other** | | | 4.6 | | |
Total Investments | | | 100.0 | % | |
* Percentages indicated are based upon total investments(excluding securities held as Collateral on Loaned Securities) as of December 31, 2018
** Industries and/or investment types representing less than 5% of total investments.
The accompanying notes are an integral part of the financial statements.
8
Morgan Stanley Institutional Fund, Inc.
Annual Report — December 31, 2018
Global Infrastructure Portfolio
Statement of Assets and Liabilities | | December 31, 2018
(000) | |
Assets: | |
Investments in Securities of Unaffiliated Issuers, at Value(1) (Cost $295,132) | | $ | 310,306 | | |
Investment in Security of Affiliated Issuer, at Value (Cost $6,045) | | | 6,045 | | |
Total Investments in Securities, at Value (Cost $301,177) | | | 316,351 | | |
Foreign Currency, at Value (Cost $20) | | | 20 | | |
Cash from Securities Lending | | | 40 | | |
Dividends Receivable | | | 1,291 | | |
Receivable for Investments Sold | | | 622 | | |
Receivable for Fund Shares Sold | | | 547 | | |
Tax Reclaim Receivable | | | 40 | | |
Receivable from Affiliate | | | 2 | | |
Receivable from Securities Lending Income | | | 2 | | |
Other Assets | | | 66 | | |
Total Assets | | | 318,981 | | |
Liabilities: | |
Collateral on Securities Loaned, at Value | | | 6,597 | | |
Payable for Fund Shares Redeemed | | | 2,456 | | |
Payable for Advisory Fees | | | 543 | | |
Payable for Professional Fees | | | 58 | | |
Payable for Shareholder Services Fees — Class A | | | 47 | | |
Payable for Distribution and Shareholder Services Fees — Class L | | | 3 | | |
Payable for Distribution and Shareholder Services Fees — Class C | | | 2 | | |
Payable for Sub Transfer Agency Fees — Class I | | | 15 | | |
Payable for Sub Transfer Agency Fees — Class A | | | 30 | | |
Payable for Sub Transfer Agency Fees — Class L | | | 1 | | |
Payable for Sub Transfer Agency Fees — Class C | | | — | @ | |
Payable for Directors' Fees and Expenses | | | 46 | | |
Payable for Transfer Agency Fees — Class I | | | 2 | | |
Payable for Transfer Agency Fees — Class A | | | 21 | | |
Payable for Transfer Agency Fees — Class L | | | 1 | | |
Payable for Transfer Agency Fees — Class C | | | 1 | | |
Payable for Transfer Agency Fees — Class IS | | | 1 | | |
Payable for Transfer Agency Fees — Class IR | | | — | @ | |
Payable for Administration Fees | | | 22 | | |
Payable for Custodian Fees | | | 16 | | |
Other Liabilities | | | 33 | | |
Total Liabilities | | | 9,895 | | |
Net Assets | | $ | 309,086 | | |
Net Assets Consist of: | |
Paid-in-Capital | | $ | 302,962 | | |
Total Distributable Earnings | | | 6,124 | | |
Net Assets | | $ | 309,086 | | |
The accompanying notes are an integral part of the financial statements.
9
Morgan Stanley Institutional Fund, Inc.
Annual Report — December 31, 2018
Global Infrastructure Portfolio
Statement of Assets and Liabilities (cont'd) | | December 31, 2018
(000) | |
CLASS I: | |
Net Assets | | $ | 65,311 | | |
| Shares Outstanding $0.001 par value shares of beneficial interest (unlimited shares authorized) (not in 000's) | | | 5,271,783 | | |
Net Asset Value, Offering and Redemption Price Per Share | | $ | 12.39 | | |
CLASS A: | |
Net Assets | | $ | 212,919 | | |
| Shares Outstanding $0.001 par value shares of beneficial interest (unlimited shares authorized) (not in 000's) | | | 17,226,754 | | |
Net Asset Value, Redemption Price Per Share | | $ | 12.36 | | |
Maximum Sales Load | | | 5.25 | % | |
Maximum Sales Charge | | $ | 0.68 | | |
Maximum Offering Price Per Share | | $ | 13.04 | | |
CLASS L: | |
Net Assets | | $ | 3,805 | | |
| Shares Outstanding $0.001 par value shares of beneficial interest (unlimited shares authorized) (not in 000's) | | | 308,714 | | |
Net Asset Value, Offering and Redemption Price Per Share | | $ | 12.33 | | |
CLASS C: | |
Net Assets | | $ | 2,580 | | |
| Shares Outstanding $0.001 par value shares of beneficial interest (unlimited shares authorized) (not in 000's) | | | 212,014 | | |
Net Asset Value, Offering and Redemption Price Per Share | | $ | 12.17 | | |
CLASS IS: | |
Net Assets | | $ | 24,462 | | |
| Shares Outstanding $0.001 par value shares of beneficial interest (unlimited shares authorized) (not in 000's) | | | 1,975,151 | | |
Net Asset Value, Offering and Redemption Price Per Share | | $ | 12.38 | | |
CLASS IR: | |
Net Assets | | $ | 9 | | |
| Shares Outstanding $0.001 par value shares of beneficial interest (unlimited shares authorized) (not in 000's) | | | 709 | | |
Net Asset Value, Offering and Redemption Price Per Share | | $ | 12.38 | | |
(1) Including:
Securities on Loan, at Value: | | $ | 23,614 | | |
@ Amount is less than $500.
The accompanying notes are an integral part of the financial statements.
10
Morgan Stanley Institutional Fund, Inc.
Annual Report — December 31, 2018
Global Infrastructure Portfolio
Statement of Operations | | Year Ended
December 31, 2018
(000) | |
Investment Income: | |
Dividends from Securities of Unaffiliated Issuers (Net of $713 of Foreign Taxes Withheld) | | $ | 10,428 | | |
Non-Cash Dividends from Securities of Unaffiliated Issuers | | | 788 | | |
Dividends from Security of Affiliated Issuer (Note G) | | | 146 | | |
Income from Securities Loaned — Net | | | 71 | | |
Total Investment Income | | | 11,433 | | |
Expenses: | |
Advisory Fees (Note B) | | | 3,037 | | |
Shareholder Services Fees — Class A (Note D) | | | 622 | | |
Distribution and Shareholder Services Fees — Class L (Note D) | | | 36 | | |
Distribution and Shareholder Services Fees — Class C (Note D) | | | 34 | | |
Administration Fees (Note C) | | | 286 | | |
Sub Transfer Agency Fees — Class I | | | 100 | | |
Sub Transfer Agency Fees — Class A | | | 152 | | |
Sub Transfer Agency Fees — Class L | | | 1 | | |
Sub Transfer Agency Fees — Class C | | | 3 | | |
Professional Fees | | | 120 | | |
Registration Fees | | | 80 | | |
Custodian Fees (Note F) | | | 76 | | |
Transfer Agency Fees — Class I (Note E) | | | 6 | | |
Transfer Agency Fees — Class A (Note E) | | | 59 | | |
Transfer Agency Fees — Class L (Note E) | | | 3 | | |
Transfer Agency Fees — Class C (Note E) | | | 3 | | |
Transfer Agency Fees — Class IS (Note E) | | | 3 | | |
Transfer Agency Fees — Class IR (Note E) | | | 1 | | |
Shareholder Reporting Fees | | | 52 | | |
Directors' Fees and Expenses | | | 13 | | |
Pricing Fees | | | 1 | | |
Other Expenses | | | 26 | | |
Total Expenses | | | 4,714 | | |
Waiver of Advisory Fees (Note B) | | | (334 | ) | |
Reimbursement of Class Specific Expenses — Class I (Note B) | | | (81 | ) | |
Reimbursement of Class Specific Expenses — Class A (Note B) | | | (160 | ) | |
Reimbursement of Class Specific Expenses — Class C (Note B) | | | (1 | ) | |
Reimbursement of Class Specific Expenses — Class IS (Note B) | | | (3 | ) | |
Reimbursement of Class Specific Expenses — Class IR (Note B) | | | (1 | ) | |
Rebate from Morgan Stanley Affiliate (Note G) | | | (16 | ) | |
Net Expenses | | | 4,118 | | |
Net Investment Income | | | 7,315 | | |
Realized Gain (Loss): | |
Investments Sold | | | 12,445 | | |
Foreign Currency Translation | | | (196 | ) | |
Net Realized Gain | | | 12,249 | | |
Change in Unrealized Appreciation (Depreciation): | |
Investments | | | (49,193 | ) | |
Foreign Currency Translation | | | (9 | ) | |
Net Change in Unrealized Appreciation (Depreciation) | | | (49,202 | ) | |
Net Realized Gain and Change in Unrealized Appreciation (Depreciation) | | | (36,953 | ) | |
Net Decrease in Net Assets Resulting from Operations | | $ | (29,638 | ) | |
The accompanying notes are an integral part of the financial statements.
11
Morgan Stanley Institutional Fund, Inc.
Annual Report — December 31, 2018
Global Infrastructure Portfolio
Statements of Changes in Net Assets | | Year Ended
December 31, 2018
(000) | | Year Ended
December 31, 2017
(000) | |
Increase (Decrease) in Net Assets: | |
Operations: | |
Net Investment Income | | $ | 7,315 | | | $ | 10,408 | | |
Net Realized Gain | | | 12,249 | | | | 21,813 | | |
Net Change in Unrealized Appreciation (Depreciation) | | | (49,202 | ) | | | 12,787 | | |
Net Increase (Decrease) in Net Assets Resulting from Operations | | | (29,638 | ) | | | 45,008 | | |
Dividends and Distributions to Shareholders: | |
Class I | | | (5,882 | ) | | | (6,991 | )* | |
Class A | | | (17,909 | ) | | | (20,429 | )* | |
Class L | | | (302 | ) | | | (381 | )* | |
Class C | | | (197 | ) | | | (241 | )* | |
Class IS | | | (2,024 | ) | | | (707 | )* | |
Class IR | | | (1 | ) | | | — | | |
Total Dividends and Distributions to Shareholders | | | (26,315 | ) | | | (28,749 | ) | |
Capital Share Transactions:(1) | |
Class I: | |
Subscribed | | | 19,564 | | | | 39,687 | | |
Distributions Reinvested | | | 5,871 | | | | 6,963 | | |
Redeemed | | | (42,709 | ) | | | (12,446 | ) | |
Class A: | |
Subscribed | | | 5,187 | | | | 22,639 | | |
Distributions Reinvested | | | 17,545 | | | | 20,024 | | |
Redeemed | | | (49,956 | ) | | | (52,854 | ) | |
Class L: | |
Exchanged | | | 11 | | | | 34 | | |
Distributions Reinvested | | | 295 | | | | 370 | | |
Redeemed | | | (1,420 | ) | | | (555 | ) | |
Class C: | |
Subscribed | | | 692 | | | | 2,738 | | |
Distributions Reinvested | | | 197 | | | | 241 | | |
Redeemed | | | (1,417 | ) | | | (212 | ) | |
Class IS: | |
Subscribed | | | 19,545 | | | | 5,501 | | |
Distributions Reinvested | | | 2,023 | | | | 707 | | |
Redeemed | | | (3,149 | ) | | | (2,860 | ) | |
Class IR: | |
Subscribed | | | 10 | (a) | | | — | | |
Net Increase (Decrease) in Net Assets Resulting from Capital Share Transactions | | | (27,711 | ) | | | 29,977 | | |
Total Increase (Decrease) in Net Assets | | | (83,664 | ) | | | 46,236 | | |
Net Assets: | |
Beginning of Period | | | 392,750 | | | | 346,514 | | |
End of Period | | $ | 309,086 | | | $ | 392,750 | † | |
The accompanying notes are an integral part of the financial statements.
12
Morgan Stanley Institutional Fund, Inc.
Annual Report — December 31, 2018
Global Infrastructure Portfolio
Statements of Changes in Net Assets (cont'd) | | Year Ended
December 31, 2018
(000) | | Year Ended
December 31, 2017
(000) | |
(1) Capital Share Transactions: | |
Class I: | |
Shares Subscribed | | | 1,382 | | | | 2,670 | | |
Shares Issued on Distributions Reinvested | | | 453 | | | | 474 | | |
Shares Redeemed | | �� | (3,068 | ) | | | (832 | ) | |
Net Increase (Decrease) in Class I Shares Outstanding | | | (1,233 | ) | | | 2,312 | | |
Class A: | |
Shares Subscribed | | | 382 | | | | 1,547 | | |
Shares Issued on Distributions Reinvested | | | 1,357 | | | | 1,368 | | |
Shares Redeemed | | | (3,604 | ) | | | (3,517 | ) | |
Net Decrease in Class A Shares Outstanding | | | (1,865 | ) | | | (602 | ) | |
Class L: | |
Shares Exchanged | | | 1 | | | | 2 | | |
Shares Issued on Distributions Reinvested | | | 23 | | | | 25 | | |
Shares Redeemed | | | (103 | ) | | | (37 | ) | |
Net Decrease in Class L Shares Outstanding | | | (79 | ) | | | (10 | ) | |
Class C: | |
Shares Subscribed | | | 49 | | | | 192 | | |
Shares Issued on Distributions Reinvested | | | 15 | | | | 17 | | |
Shares Redeemed | | | (103 | ) | | | (15 | ) | |
Net Increase (Decrease) in Class C Shares Outstanding | | | (39 | ) | | | 194 | | |
Class IS: | |
Shares Subscribed | | | 1,391 | | | | 368 | | |
Shares Issued on Distributions Reinvested | | | 157 | | | | 48 | | |
Shares Redeemed | | | (223 | ) | | | (188 | ) | |
Net Increase in Class IS Shares Outstanding | | | 1,325 | | | | 228 | | |
Class IR: | |
Shares Subscribed | | | 1 | (a) | | | — | | |
(a) For the period June 15, 2018 through December 31, 2018.
The following information was previously reported in the December 31, 2017 financial statements. The distribution information for the year ended December 31, 2017 presented on the Statements of Changes in Net Assets is presented for comparative purposes to the December 31, 2018 financial statements, which conform to the SEC Final Rule on Disclosure Update and Simplification which was effective November 5, 2018.
* Dividends and Distributions to Shareholders for the year ended December 31, 2017 were as follows:
Class I: | |
Net Investment Income | | $ | (2,582 | ) | |
Net Realized Gain | | $ | (4,409 | ) | |
Class A: | |
Net Investment Income | | $ | (6,976 | ) | |
Net Realized Gain | | $ | (13,453 | ) | |
Class L: | |
Net Investment Income | | $ | (110 | ) | |
Net Realized Gain | | $ | (271 | ) | |
Class C: | |
Net Investment Income | | $ | (69 | ) | |
Net Realized Gain | | $ | (172 | ) | |
Class IS: | |
Net Investment Income | | $ | (263 | ) | |
Net Realized Gain | | $ | (444 | ) | |
† Distributions in Excess of Net Investment Income for the year ended December 31, 2017 was $(72).
The accompanying notes are an integral part of the financial statements.
13
Morgan Stanley Institutional Fund, Inc.
Annual Report — December 31, 2018
Financial Highlights
Global Infrastructure Portfolio
| | | Class I | |
| | | Year Ended December 31, | |
Selected Per Share Data and Ratios | | 2018 | | 2017 | | 2016(1) | | 2015 | | 2014 | |
Net Asset Value, Beginning of Period | | $ | 14.64 | | | $ | 14.02 | | | $ | 12.59 | | | $ | 15.41 | | | $ | 14.26 | | |
Income (Loss) from Investment Operations: | |
Net Investment Income(2) | | | 0.31 | | | | 0.44 | | | | 0.40 | | | | 0.40 | | | | 0.28 | | |
Net Realized and Unrealized Gain (Loss) | | | (1.45 | ) | | | 1.33 | | | | 1.55 | | | | (2.54 | ) | | | 1.87 | | |
Total from Investment Operations | | | (1.14 | ) | | | 1.77 | | | | 1.95 | | | | (2.14 | ) | | | 2.15 | | |
Distributions from and/or in Excess of: | |
Net Investment Income | | | (0.37 | ) | | | (0.42 | ) | | | (0.37 | ) | | | (0.35 | ) | | | (0.22 | ) | |
Net Realized Gain | | | (0.74 | ) | | | (0.73 | ) | | | (0.15 | ) | | | (0.32 | ) | | | (0.78 | ) | |
Paid-in-Capital | | | — | | | | — | | | | — | | | | (0.01 | ) | | | — | | |
Total Distributions | | | (1.11 | ) | | | (1.15 | ) | | | (0.52 | ) | | | (0.68 | ) | | | (1.00 | ) | |
Net Asset Value, End of Period | | $ | 12.39 | | | $ | 14.64 | | | $ | 14.02 | | | $ | 12.59 | | | $ | 15.41 | | |
Total Return(3) | | | (8.02 | )% | | | 12.70 | % | | | 15.55 | % | | | (13.90 | )% | | | 15.38 | % | |
Ratios and Supplemental Data: | |
Net Assets, End of Period (Thousands) | | $ | 65,311 | | | $ | 95,219 | | | $ | 58,794 | | | $ | 47,878 | | | $ | 40,477 | | |
Ratio of Expenses to Average Net Assets(8) | | | 0.97 | %(4) | | | 0.91 | %(4)(5) | | | 0.85 | %(4) | | | 0.88 | %(4)(6) | | | 1.08 | %(4) | |
Ratio of Net Investment Income to Average Net Assets(8) | | | 2.21 | %(4) | | | 2.93 | %(4) | | | 2.85 | %(4) | | | 2.70 | %(4) | | | 1.82 | %(4) | |
Ratio of Rebate from Morgan Stanley Affiliates to Average Net Assets | | | 0.00 | %(7) | | | 0.01 | % | | | 0.01 | % | | | 0.00 | %(7) | | | 0.00 | %(7) | |
Portfolio Turnover Rate | | | 43 | % | | | 45 | % | | | 48 | % | | | 48 | % | | | 40 | % | |
(8) Supplemental Information on the Ratios to Average Net Assets: | |
Ratios Before Expense Limitation: | |
Expenses to Average Net Assets | | | 1.16 | % | | | 1.08 | % | | | 1.04 | % | | | 1.10 | % | | | 1.42 | % | |
Net Investment Income to Average Net Assets | | | 2.02 | % | | | 2.76 | % | | | 2.66 | % | | | 2.48 | % | | | 1.48 | % | |
(1) Reflects prior period Custodian out-of-pocket expenses that were reimbursed in September 2016. The amount of the reimbursement was immaterial on a per share basis and did not impact the total return of Class I shares. The Ratio of Expenses to Average Net Assets and the Ratio of Net Investment Income to Average Net Assets would be unchanged as the reimbursement of Custodian fees was offset against expense waivers/reimbursements with no impact to net expenses or net investment income.
(2) Per share amount is based on average shares outstanding.
(3) Calculated based on the net asset value as of the last business day of the period.
(4) The Ratios of Expenses and Net Investment Income reflect the rebate of certain Fund expenses in connection with the investments in Morgan Stanley affiliates during the period. The effect of the rebate on the ratios is disclosed in the above table as "Ratio of Rebate from Morgan Stanley Affiliates to Average Net Assets."
(5) Effective July 1, 2017, the Adviser has agreed to limit the ratio of expenses to average net assets to the maximum ratio of 0.97% for Class I shares. Prior to July 1, 2017, the maximum ratio was 0.87% for Class I shares.
(6) Effective March 30, 2015, the Adviser has agreed to limit the ratio of expenses to average net assets to the maximum ratio of 0.87% for Class I shares. Prior to March 30, 2015, the maximum ratio was 1.15% for Class I shares.
(7) Amount is less than 0.005%.
The accompanying notes are an integral part of the financial statements.
14
Morgan Stanley Institutional Fund, Inc.
Annual Report — December 31, 2018
Financial Highlights
Global Infrastructure Portfolio
| | | Class A | |
| | | Year Ended December 31, | |
Selected Per Share Data and Ratios | | 2018 | | 2017 | | 2016(1) | | 2015 | | 2014 | |
Net Asset Value, Beginning of Period | | $ | 14.60 | | | $ | 13.99 | | | $ | 12.56 | | | $ | 15.38 | | | $ | 14.25 | | |
Income (Loss) from Investment Operations: | |
Net Investment Income(2) | | | 0.28 | | | | 0.39 | | | | 0.36 | | | | 0.39 | | | | 0.24 | | |
Net Realized and Unrealized Gain (Loss) | | | (1.45 | ) | | | 1.33 | | | | 1.55 | | | | (2.56 | ) | | | 1.86 | | |
Total from Investment Operations | | | (1.17 | ) | | | 1.72 | | | | 1.91 | | | | (2.17 | ) | | | 2.10 | | |
Distributions from and/or in Excess of: | |
Net Investment Income | | | (0.33 | ) | | | (0.38 | ) | | | (0.33 | ) | | | (0.32 | ) | | | (0.19 | ) | |
Net Realized Gain | | | (0.74 | ) | | | (0.73 | ) | | | (0.15 | ) | | | (0.32 | ) | | | (0.78 | ) | |
Paid-in-Capital | | | — | | | | — | | | | — | | | | (0.01 | ) | | | — | | |
Total Distributions | | | (1.07 | ) | | | (1.11 | ) | | | (0.48 | ) | | | (0.65 | ) | | | (0.97 | ) | |
Net Asset Value, End of Period | | $ | 12.36 | | | $ | 14.60 | | | $ | 13.99 | | | $ | 12.56 | | | $ | 15.38 | | |
Total Return(3) | | | (8.22 | )% | | | 12.37 | % | | | 15.29 | % | | | (14.08 | )% | | | 14.94 | % | |
Ratios and Supplemental Data: | |
Net Assets, End of Period (Thousands) | | $ | 212,919 | | | $ | 278,780 | | | $ | 275,481 | | | $ | 263,702 | | | $ | 20,815 | | |
Ratio of Expenses to Average Net Assets(8) | | | 1.21 | %(4) | | | 1.15 | %(4)(5) | | | 1.10 | %(4) | | | 1.12 | %(4)(6) | | | 1.42 | %(4) | |
Ratio of Net Investment Income to Average Net Assets(8) | | | 2.00 | %(4) | | | 2.63 | %(4) | | | 2.60 | %(4) | | | 2.67 | %(4) | | | 1.53 | %(4) | |
Ratio of Rebate from Morgan Stanley Affiliates to Average Net Assets | | | 0.00 | %(7) | | | 0.01 | % | | | 0.01 | % | | | 0.00 | %(7) | | | 0.00 | %(7) | |
Portfolio Turnover Rate | | | 43 | % | | | 45 | % | | | 48 | % | | | 48 | % | | | 40 | % | |
(8) Supplemental Information on the Ratios to Average Net Assets: | |
Ratios Before Expense Limitation: | |
Expenses to Average Net Assets | | | 1.37 | % | | | 1.38 | % | | | 1.37 | % | | | 1.35 | % | | | 1.76 | % | |
Net Investment Income to Average Net Assets | | | 1.84 | % | | | 2.40 | % | | | 2.33 | % | | | 2.44 | % | | | 1.19 | % | |
(1) Reflects prior period Custodian out-of-pocket expenses that were reimbursed in September 2016. The amount of the reimbursement was immaterial on a per share basis and did not impact the total return of Class A shares. The Ratio of Expenses to Average Net Assets and the Ratio of Net Investment Income to Average Net Assets would be unchanged as the reimbursement of Custodian fees was offset against expense waivers/reimbursements with no impact to net expenses or net investment income.
(2) Per share amount is based on average shares outstanding.
(3) Calculated based on the net asset value which does not reflect sales charges, if applicable, as of the last business day of the period.
(4) The Ratios of Expenses and Net Investment Income reflect the rebate of certain Fund expenses in connection with the investments in Morgan Stanley affiliates during the period. The effect of the rebate on the ratios is disclosed in the above table as "Ratio of Rebate from Morgan Stanley Affiliates to Average Net Assets."
(5) Effective July 1, 2017, the Adviser has agreed to limit the ratio of expenses to average net assets to the maximum ratio of 1.21% for Class A shares. Prior to July 1, 2017, the maximum ratio was 1.11% for Class A shares.
(6) Effective March 30, 2015, the Adviser has agreed to limit the ratio of expenses to average net assets to the maximum ratio of 1.11% for Class A shares. Prior to March 30, 2015, the maximum ratio was 1.50% for Class A shares.
(7) Amount is less than 0.005%.
The accompanying notes are an integral part of the financial statements.
15
Morgan Stanley Institutional Fund, Inc.
Annual Report — December 31, 2018
Financial Highlights
Global Infrastructure Portfolio
| | | Class L | |
| | | Year Ended December 31, | |
Selected Per Share Data and Ratios | | 2018 | | 2017 | | 2016(1) | | 2015 | | 2014 | |
Net Asset Value, Beginning of Period | | $ | 14.55 | | | $ | 13.94 | | | $ | 12.52 | | | $ | 15.34 | | | $ | 14.22 | | |
Income (Loss) from Investment Operations: | |
Net Investment Income(2) | | | 0.20 | | | | 0.31 | | | | 0.28 | | | | 0.30 | | | | 0.14 | | |
Net Realized and Unrealized Gain (Loss) | | | (1.44 | ) | | | 1.33 | | | | 1.54 | | | | (2.55 | ) | | | 1.87 | | |
Total from Investment Operations | | | (1.24 | ) | | | 1.64 | | | | 1.82 | | | | (2.25 | ) | | | 2.01 | | |
Distributions from and/or in Excess of: | |
Net Investment Income | | | (0.24 | ) | | | (0.30 | ) | | | (0.25 | ) | | | (0.24 | ) | | | (0.11 | ) | |
Net Realized Gain | | | (0.74 | ) | | | (0.73 | ) | | | (0.15 | ) | | | (0.32 | ) | | | (0.78 | ) | |
Paid-in-Capital | | | — | | | | — | | | | — | | | | (0.01 | ) | | | — | | |
Total Distributions | | | (0.98 | ) | | | (1.03 | ) | | | (0.40 | ) | | | (0.57 | ) | | | (0.89 | ) | |
Net Asset Value, End of Period | | $ | 12.33 | | | $ | 14.55 | | | $ | 13.94 | | | $ | 12.52 | | | $ | 15.34 | | |
Total Return(3) | | | (8.73 | )% | | | 11.80 | % | | | 14.57 | % | | | (14.64 | )% | | | 14.35 | % | |
Ratios and Supplemental Data: | |
Net Assets, End of Period (Thousands) | | $ | 3,805 | | | $ | 5,634 | | | $ | 5,534 | | | $ | 5,529 | | | $ | 1,115 | | |
Ratio of Expenses to Average Net Assets(8) | | | 1.78 | %(4) | | | 1.72 | %(4)(5) | | | 1.67 | %(4) | | | 1.69 | %(4)(6) | | | 2.00 | %(4) | |
Ratio of Net Investment Income to Average Net Assets(8) | | | 1.41 | %(4) | | | 2.06 | %(4) | | | 2.03 | %(4) | | | 2.06 | %(4) | | | 0.91 | %(4) | |
Ratio of Rebate from Morgan Stanley Affiliates to Average Net Assets | | | 0.00 | %(7) | | | 0.01 | % | | | 0.01 | % | | | 0.00 | %(7) | | | 0.00 | %(7) | |
Portfolio Turnover Rate | | | 43 | % | | | 45 | % | | | 48 | % | | | 48 | % | | | 40 | % | |
(8) Supplemental Information on the Ratios to Average Net Assets: | |
Ratios Before Expense Limitation: | |
Expenses to Average Net Assets | | | 1.87 | % | | | 1.95 | % | | | 1.95 | % | | | 1.95 | % | | | 2.41 | % | |
Net Investment Income to Average Net Assets | | | 1.32 | % | | | 1.83 | % | | | 1.75 | % | | | 1.80 | % | | | 0.50 | % | |
(1) Reflects prior period Custodian out-of-pocket expenses that were reimbursed in September 2016. The amount of the reimbursement was immaterial on a per share basis and did not impact the total return of Class L shares. The Ratio of Expenses to Average Net Assets and the Ratio of Net Investment Income to Average Net Assets would be unchanged as the reimbursement of Custodian fees was offset against expense waivers/reimbursements with no impact to net expenses or net investment income.
(2) Per share amount is based on average shares outstanding.
(3) Calculated based on the net asset value as of the last business day of the period.
(4) The Ratios of Expenses and Net Investment Income reflect the rebate of certain Fund expenses in connection with the investments in Morgan Stanley affiliates during the period. The effect of the rebate on the ratios is disclosed in the above table as "Ratio of Rebate from Morgan Stanley Affiliates to Average Net Assets."
(5) Effective July 1, 2017, the Adviser has agreed to limit the ratio of expenses to average net assets to the maximum ratio of 1.78% for Class L shares. Prior to July 1, 2017, the maximum ratio was 1.68% for Class L shares.
(6) Effective March 30, 2015, the Adviser has agreed to limit the ratio of expenses to average net assets to the maximum ratio of 1.68% for Class L shares. Prior to March 30, 2015, the maximum ratio was 2.00% for Class L shares.
(7) Amount is less than 0.005%.
The accompanying notes are an integral part of the financial statements.
16
Morgan Stanley Institutional Fund, Inc.
Annual Report — December 31, 2018
Financial Highlights
Global Infrastructure Portfolio
| | | Class C | |
| | | Year Ended December 31, | | Period from
April 30, 2015(2) to | |
Selected Per Share Data and Ratios | | 2018 | | 2017 | | 2016(1) | | December 31, 2015 | |
Net Asset Value, Beginning of Period | | $ | 14.36 | | | $ | 13.81 | | | $ | 12.47 | | | $ | 15.87 | | |
Income (Loss) from Investment Operations: | |
Net Investment Income(3) | | | 0.16 | | | | 0.29 | | | | 0.26 | | | | 0.17 | | |
Net Realized and Unrealized Gain (Loss) | | | (1.42 | ) | | | 1.28 | | | | 1.52 | | | | (2.97 | ) | |
Total from Investment Operations | | | (1.26 | ) | | | 1.57 | | | | 1.78 | | | | (2.80 | ) | |
Distributions from and/or in Excess of: | |
Net Investment Income | | | (0.19 | ) | | | (0.29 | ) | | | (0.29 | ) | | | (0.27 | ) | |
Net Realized Gain | | | (0.74 | ) | | | (0.73 | ) | | | (0.15 | ) | | | (0.32 | ) | |
Paid-in-Capital | | | — | | | | — | | | | — | | | | (0.01 | ) | |
Total Distributions | | | (0.93 | ) | | | (1.02 | ) | | | (0.44 | ) | | | (0.60 | ) | |
Net Asset Value, End of Period | | $ | 12.17 | | | $ | 14.36 | | | $ | 13.81 | | | $ | 12.47 | | |
Total Return(4) | | | (9.02 | )% | | | 11.42 | % | | | 14.35 | % | | | (17.62 | )%(8) | |
Ratios and Supplemental Data: | |
Net Assets, End of Period (Thousands) | | $ | 2,580 | | | $ | 3,601 | | | $ | 784 | | | $ | 516 | | |
Ratio of Expenses to Average Net Assets(10) | | | 2.07 | %(5) | | | 2.02 | %(5)(6) | | | 1.96 | %(5) | | | 1.97 | %(5)(9) | |
Ratio of Net Investment Income to Average Net Assets(10) | | | 1.14 | %(5) | | | 1.96 | %(5) | | | 1.90 | %(5) | | | 1.81 | %(5)(9) | |
Ratio of Rebate from Morgan Stanley Affiliates to Average Net Assets | | | 0.00 | %(7) | | | 0.01 | % | | | 0.01 | % | | | 0.00 | %(7)(9) | |
Portfolio Turnover Rate | | | 43 | % | | | 45 | % | | | 48 | % | | | 48 | % | |
(10) Supplemental Information on the Ratios to Average Net Assets: | |
Ratios Before Expense Limitation: | |
Expenses to Average Net Assets | | | 2.20 | % | | | 2.23 | % | | | 2.69 | % | | | 2.34 | %(9) | |
Net Investment Income to Average Net Assets | | | 1.01 | % | | | 1.75 | % | | | 1.17 | % | | | 1.44 | %(9) | |
(1) Reflects prior period Custodian out-of-pocket expenses that were reimbursed in September 2016. The amount of the reimbursement was immaterial on a per share basis and did not impact the total return of Class C shares. The Ratio of Expenses to Average Net Assets and the Ratio of Net Investment Income to Average Net Assets would be unchanged as the reimbursement of Custodian fees was offset against expense waivers/reimbursements with no impact to net expenses or net investment income.
(2) Commencement of Offering.
(3) Per share amount is based on average shares outstanding.
(4) Calculated based on the net asset value which does not reflect sales charges, if applicable, as of the last business day of the period.
(5) The Ratios of Expenses and Net Investment Income reflect the rebate of certain Fund expenses in connection with the investments in Morgan Stanley affiliates during the period. The effect of the rebate on the ratios is disclosed in the above table as "Ratio of Rebate from Morgan Stanley Affiliates to Average Net Assets."
(6) Effective July 1, 2017, the Adviser has agreed to limit the ratio of expenses to average net assets to the maximum ratio of 2.07% for Class C shares. Prior to July 1, 2017, the maximum ratio was 1.97% for Class C shares.
(7) Amount is less than 0.005%.
(8) Not annualized.
(9) Annualized.
The accompanying notes are an integral part of the financial statements.
17
Morgan Stanley Institutional Fund, Inc.
Annual Report — December 31, 2018
Financial Highlights
Global Infrastructure Portfolio
| | | Class IS | |
| | | Year Ended December 31, | |
Selected Per Share Data and Ratios | | 2018 | | 2017 | | 2016(1) | | 2015 | | 2014 | |
Net Asset Value, Beginning of Period | | $ | 14.63 | | | $ | 14.02 | | | $ | 12.58 | | | $ | 15.41 | | | $ | 14.26 | | |
Income (Loss) from Investment Operations: | |
Net Investment Income(2) | | | 0.32 | | | | 0.45 | | | | 0.43 | | | | 0.53 | | | | 0.28 | | |
Net Realized and Unrealized Gain (Loss) | | | (1.46 | ) | | | 1.32 | | | | 1.53 | | | | (2.68 | ) | | | 1.87 | | |
Total from Investment Operations | | | (1.14 | ) | | | 1.77 | | | | 1.96 | | | | (2.15 | ) | | | 2.15 | | |
Distributions from and/or in Excess of: | |
Net Investment Income | | | (0.37 | ) | | | (0.43 | ) | | | (0.37 | ) | | | (0.35 | ) | | | (0.22 | ) | |
Net Realized Gain | | | (0.74 | ) | | | (0.73 | ) | | | (0.15 | ) | | | (0.32 | ) | | | (0.78 | ) | |
Paid-in-Capital | | | — | | | | — | | | | — | | | | (0.01 | ) | | | — | | |
Total Distributions | | | (1.11 | ) | | | (1.16 | ) | | | (0.52 | ) | | | (0.68 | ) | | | (1.00 | ) | |
Net Asset Value, End of Period | | $ | 12.38 | | | $ | 14.63 | | | $ | 14.02 | | | $ | 12.58 | | | $ | 15.41 | | |
Total Return(3) | | | (7.92 | )% | | | 12.65 | % | | | 15.66 | % | | | (13.96 | )% | | | 15.38 | % | |
Ratios and Supplemental Data: | |
Net Assets, End of Period (Thousands) | | $ | 24,462 | | | $ | 9,516 | | | $ | 5,921 | | | $ | 2,167 | | | $ | 11 | | |
Ratio of Expenses to Average Net Assets(8) | | | 0.94 | %(4) | | | 0.89 | %(4)(5) | | | 0.83 | %(4) | | | 0.84 | %(4)(6) | | | 1.08 | %(4) | |
Ratio of Net Investment Income to Average Net Assets(8) | | | 2.26 | %(4) | | | 2.95 | %(4) | | | 3.02 | %(4) | | | 3.91 | %(4) | | | 1.79 | %(4) | |
Ratio of Rebate from Morgan Stanley Affiliates to Average Net Assets | | | 0.00 | %(7) | | | 0.01 | % | | | 0.01 | % | | | 0.00 | %(7) | | | 0.00 | %(7) | |
Portfolio Turnover Rate | | | 43 | % | | | 45 | % | | | 48 | % | | | 48 | % | | | 40 | % | |
(8) Supplemental Information on the Ratios to Average Net Assets: | |
Ratios Before Expense Limitation: | |
Expenses to Average Net Assets | | | 1.05 | % | | | 1.06 | % | | | 1.08 | % | | | 1.41 | % | | | 18.56 | % | |
Net Investment Income (Loss) to Average Net Assets | | | 2.15 | % | | | 2.78 | % | | | 2.77 | % | | | 3.33 | % | | | (15.69 | )% | |
(1) Reflects prior period Custodian out-of-pocket expenses that were reimbursed in September 2016. The amount of the reimbursement was immaterial on a per share basis and did not impact the total return of Class IS shares. The Ratio of Expenses to Average Net Assets and the Ratio of Net Investment Income to Average Net Assets would be unchanged as the reimbursement of Custodian fees was offset against expense waivers/reimbursements with no impact to net expenses or net investment income.
(2) Per share amount is based on average shares outstanding.
(3) Calculated based on the net asset value as of the last business day of the period.
(4) The Ratios of Expenses and Net Investment Income reflect the rebate of certain Fund expenses in connection with the investments in Morgan Stanley affiliates during the period. The effect of the rebate on the ratios is disclosed in the above table as "Ratio of Rebate from Morgan Stanley Affiliates to Average Net Assets."
(5) Effective July 1, 2017, the Adviser has agreed to limit the ratio of expenses to average net assets to the maximum ratio of 0.94% for Class IS shares. Prior to July 1, 2017, the maximum ratio was 0.84% for Class IS shares.
(6) Effective March 30, 2015, the Adviser has agreed to limit the ratio of expenses to average net assets to the maximum ratio of 0.84% for Class IS shares. Prior to March 30, 2015, the maximum ratio was 1.08% for Class IS shares.
(7) Amount is less than 0.005%.
The accompanying notes are an integral part of the financial statements.
18
Morgan Stanley Institutional Fund, Inc.
Annual Report — December 31, 2018
Financial Highlights
Global Infrastructure Portfolio
| | | Class IR | |
Selected Per Share Data and Ratios | | Period from
June 15, 2018(1) to
December 31, 2018 | |
Net Asset Value, Beginning of Period | | $ | 14.10 | | |
Income (Loss) from Investment Operations: | |
Net Investment Income(2) | | | 0.20 | | |
Net Realized and Unrealized Loss | | | (0.81 | ) | |
Total from Investment Operations | | | (0.61 | ) | |
Distributions from and/or in Excess of: | |
Net Investment Income | | | (0.37 | ) | |
Net Realized Gain | | | (0.74 | ) | |
Total Distributions | | | (1.11 | ) | |
Net Asset Value, End of Period | | $ | 12.38 | | |
Total Return(3) | | | (4.54 | )%(6) | |
Ratios and Supplemental Data: | |
Net Assets, End of Period (Thousands) | | $ | 9 | | |
Ratio of Expenses to Average Net Assets(8) | | | 0.94 | %(4)(7) | |
Ratio of Net Investment Income to Average Net Assets(8) | | | 2.67 | %(4)(7) | |
Ratio of Rebate from Morgan Stanley Affiliates to Average Net Assets | | | 0.00 | %(5)(7) | |
Portfolio Turnover Rate | | | 43 | % | |
(8) Supplemental Information on the Ratios to Average Net Assets: | |
Ratios Before Expense Limitation: | |
Expenses to Average Net Assets | | | 18.47 | %(7) | |
Net Investment Loss to Average Net Assets | | | (14.86 | )%(7) | |
(1) Commencement of Offering.
(2) Per share amount is based on average shares outstanding.
(3) Calculated based on the net asset value as of the last business day of the period.
(4) The Ratios of Expenses and Net Investment Income reflect the rebate of certain Fund expenses in connection with the investments in Morgan Stanley affiliates during the period. The effect of the rebate on the ratios is disclosed in the above table as "Ratio of Rebate from Morgan Stanley Affiliates to Average Net Assets."
(5) Amount is less than 0.005%.
(6) Not annualized.
(7) Annualized.
The accompanying notes are an integral part of the financial statements.
19
Morgan Stanley Institutional Fund, Inc.
Annual Report — December 31, 2018
Notes to Financial Statements
Morgan Stanley Institutional Fund, Inc. (the "Company") is registered under the Investment Company Act of 1940, as amended (the "Act"), as an open-end management investment company. The Company is comprised of thirty separate, active, diversified and non-diversified funds (individually referred to as a "Fund", collectively as the "Funds"). The Company applies investment company accounting and reporting guidance.
The accompanying financial statements relate to the Global Infrastructure Portfolio. The Fund seeks to provide both capital appreciation and income.
The Fund offers six classes of shares — Class I, Class A, Class L, Class C, Class IS and Class IR. On April 30, 2015, the Fund suspended offering of Class L shares. Existing Class L shareholders may invest through reinvestment of dividends and distributions. On June 15, 2018, the Fund commenced offering Class IR shares.
A. Significant Accounting Policies: The following significant accounting policies are in conformity with U.S. generally accepted accounting principles ("GAAP"). Such policies are consistently followed by the Company in the preparation of its financial statements. GAAP may require management to make estimates and assumptions that affect the reported amounts and disclosures in the financial statements. Actual results may differ from those estimates.
In August 2018, the Financial Accounting Standards Board ("FASB") issued Accounting Standards Update ("ASU") 2018-13, Fair Value Measurement (Topic 820) — Disclosures Framework — Changes to Disclosure Requirements of Fair Value Measurement ("ASU 2018-13") which introduces new fair value disclosure requirements as well as eliminates and modifies certain existing fair value disclosure requirements. ASU 2018-13 would be effective for fiscal years beginning after December 15, 2019 and for interim periods within those fiscal years; however, management has elected to early adopt ASU 2018-13 effective with the current reporting period as permitted by the standard. The impact of the Fund's adoption was limited to changes in the Fund's financial statement disclosures regarding fair value, primarily those disclosures related to transfers between levels of the fair value hierarchy and disclosure of the range and weighted average used to develop significant unobservable inputs for Level 3 fair value measurements, when applicable.
1. Security Valuation: (1) An equity portfolio security listed or traded on an exchange is valued at its latest reported sales price (or at the exchange official closing price if such exchange reports an official closing price),
and if there were no sales on a given day and if there is no official exchange closing price for that day, the security is valued at the mean between the last reported bid and asked prices if such bid and asked prices are available on the relevant exchanges. Listed equity securities not traded on the valuation date with no reported bid and asked prices available on the exchange are valued at the mean between the current bid and asked prices obtained from one or more reputable brokers or dealers. In cases where a security is traded on more than one exchange, the security is valued on the exchange designated as the primary market; (2) all other equity portfolio securities for which over-the-counter ("OTC") market quotations are readily available are valued at the latest reported sales price (or at the market official closing price if such market reports an official closing price), and if there was no trading in the security on a given day and if there is no official closing price from relevant markets for that day, the security is valued at the mean between the last reported bid and asked prices if such bid and asked prices are available on the relevant markets. An unlisted equity security that does not trade on the valuation date and for which bid and asked prices from the relevant markets are unavailable is valued at the mean between the current bid and asked prices obtained from one or more reputable brokers or dealers; (3) certain portfolio securities may be valued by an outside pricing service/vendor approved by the Company's Board of Directors (the "Directors"). The pricing service/vendor may employ a pricing model that takes into account, among other things, bids, yield spreads and/or other market data and specific security characteristics. Alternatively, if a valuation is not available from an outside pricing service/vendor, and the security trades on an exchange, the security may be valued at its latest reported sale price (or at the exchange official closing price if such exchange reports an official closing price), prior to the time when assets are valued. If there are no sales on a given day and if there is no official exchange closing price for that day, the security is valued at the mean between the last reported bid and asked prices if such bid and asked prices are available in the relevant exchanges; (4) when market quotations are not readily available, including circumstances under which Morgan Stanley Investment Management Inc. (the "Adviser") or Morgan Stanley Investment Management Limited ("MSIM Limited") and Morgan Stanley Investment Management Company ("MSIM Company") (together, the "Sub-Advisers"), each
20
Morgan Stanley Institutional Fund, Inc.
Annual Report — December 31, 2018
Notes to Financial Statements (cont'd)
a wholly-owned subsidiary of Morgan Stanley, determine that the closing price, last sale price or the mean between the last reported bid and asked prices are not reflective of a security's market value, portfolio securities are valued at their fair value as determined in good faith under procedures established by and under the general supervision of the Directors. Occasionally, developments affecting the closing prices of securities and other assets may occur between the times at which valuations of such securities are determined (that is, close of the foreign market on which the securities trade) and the close of business of the New York Stock Exchange ("NYSE"). If developments occur during such periods that are expected to materially affect the value of such securities, such valuations may be adjusted to reflect the estimated fair value of such securities as of the close of the NYSE, as determined in good faith by the Directors or by the Adviser using a pricing service and/or procedures approved by the Directors; (5) quotations of foreign portfolio securities, other assets and liabilities and forward contracts stated in foreign currency are translated into U.S. dollar equivalents at the prevailing market rates prior to the close of the NYSE; and (6) investments in mutual funds, including the Morgan Stanley Institutional Liquidity Funds, are valued at the net asset value ("NAV") as of the close of each business day.
The Directors have responsibility for determining in good faith the fair value of the investments, and the Directors may appoint others, such as the Company's Adviser or a valuation committee, to assist the Directors in determining fair value and to make the actual calculations pursuant to the fair valuation methodologies previously approved by the Directors. Under procedures approved by the Directors, the Company's Adviser has formed a Valuation Committee whose members are approved by the Directors. The Valuation Committee provides administration and oversight of the Company's valuation policies and procedures, which are reviewed at least annually by the Directors. These procedures allow the Company to utilize independent pricing services, quotations from securities and financial instrument dealers and other market sources to determine fair value.
2. Fair Value Measurement: FASB Accounting Standards CodificationTM ("ASC") 820, "Fair Value Measurement" ("ASC 820"), defines fair value as the value that
the Fund would receive to sell an investment or pay to transfer a liability in a timely transaction with an independent buyer in the principal market, or in the absence of a principal market, the most advantageous market for the investment or liability. ASC 820 establishes a three-tier hierarchy to distinguish between (1) inputs that reflect the assumptions market participants would use in valuing an asset or liability developed based on market data obtained from sources independent of the reporting entity (observable inputs) and (2) inputs that reflect the reporting entity's own assumptions about the assumptions market participants would use in valuing an asset or liability developed based on the best information available in the circumstances (unobservable inputs) and to establish classification of fair value measurements for disclosure purposes. Various inputs are used in determining the value of the Fund's investments. The inputs are summarized in the three broad levels listed below:
• Level 1 – unadjusted quoted prices in active markets for identical investments
• Level 2 – other significant observable inputs (including quoted prices for similar investments, interest rates, prepayment speeds, credit risk, etc.)
• Level 3 – significant unobservable inputs including the Fund's own assumptions in determining the fair value of investments. Factors considered in making this determination may include, but are not limited to, information obtained by contacting the issuer, analysts, or the appropriate stock exchange (for exchange-traded securities), analysis of the issuer's financial statements or other available documents and, if necessary, available information concerning other securities in similar circumstances
The inputs or methodology used for valuing securities are not necessarily an indication of the risk associated with investing in those securities and the determination of the significance of a particular input to the fair value measurement in its entirety requires judgment and considers factors specific to each security.
21
Morgan Stanley Institutional Fund, Inc.
Annual Report — December 31, 2018
Notes to Financial Statements (cont'd)
The following is a summary of the inputs used to value the Fund's investments as of December 31, 2018:
Investment Type | | Level 1
Unadjusted
quoted
prices
(000) | | Level 2
Other
significant
observable
inputs
(000) | | Level 3
Significant
unobservable
inputs
(000) | | Total
(000) | |
Assets: | |
Common Stocks | |
Airports | | $ | — | | | $ | 13,424 | | | $ | — | | | $ | 13,424 | | |
Communications | | | 34,900 | | | | 173 | | | | — | | | | 35,073 | | |
Diversified | | | — | | | | 26,800 | | | | — | | | | 26,800 | | |
Electricity Transmission &
Distribution | | | 35,382 | | | | 17,762 | | | | — | | | | 53,144 | | |
Oil & Gas Storage &
Transportation | | | 76,616 | | | | 12,468 | | | | — | | | | 89,084 | | |
Renewables | | | 26,295 | | | | — | | | | — | | | | 26,295 | | |
Toll Roads | | | 22,782 | | | | 21,884 | | | | — | | | | 44,666 | | |
Water | | | 5,534 | | | | 15,066 | | | | — | | | | 20,600 | | |
Total Common Stocks | | | 201,509 | | | | 107,577 | | | | — | | | | 309,086 | | |
Short-Term Investments | |
Investment Company | | | 6,045 | | | | — | | | | — | | | | 6,045 | | |
Repurchase Agreements | | | — | | | | 1,220 | | | | — | | | | 1,220 | | |
Total Short-Term
Investments | | | 6,045 | | | | 1,220 | | | | — | | | | 7,265 | | |
Total Assets | | $ | 207,554 | | | $ | 108,797 | | | $ | — | | | $ | 316,351 | | |
Transfers between investment levels may occur as the markets fluctuate and/or the availability of data used in an investment's valuation changes.
3. Repurchase Agreements: The Fund may enter into repurchase agreements under which the Fund lends cash and takes possession of securities with an agreement that the counterparty will repurchase such securities. In connection with transactions in repurchase agreements, a bank as custodian for the Fund takes possession of the underlying securities which are held as collateral, with a market value at least equal to the amount of the repurchase transaction, including principal and accrued interest. To the extent that any repurchase transaction exceeds one business day, the value of the collateral is marked-to-market on a daily basis to determine that the value of the collateral does not decrease below the repurchase price plus accrued interest as earned. If such a decrease occurs, additional collateral will be requested and, when received, will be added to the account to maintain full collateralization. In the event of default on the obligation to repurchase, the Fund has the right to liquidate the collateral and apply the proceeds in satisfaction of the obligation. In the event of default or bankruptcy by the counterparty to the agreement,
realization of the collateral proceeds may be subject to cost and delays. The Fund, along with other affiliated investment companies, may utilize a joint trading account for the purpose of entering into repurchase agreements.
4. Foreign Currency Translation and Foreign Investments: The books and records of the Fund are maintained in U.S. dollars. Foreign currency amounts are translated into U.S. dollars as follows:
– investments, other assets and liabilities at the prevailing rate of exchange on the valuation date;
– investment transactions and investment income at the prevailing rates of exchange on the dates of such transactions.
Although the net assets of the Fund are presented at the foreign exchange rates and market values at the close of the period, the Fund does not isolate that portion of the results of operations arising as a result of changes in the foreign exchange rates from the fluctuations arising from changes in the market prices of securities held at period end. Similarly, the Fund does not isolate the effect of changes in foreign exchange rates from the fluctuations arising from changes in the market prices of securities sold during the period. Accordingly, realized and unrealized foreign currency gains (losses) on investments in securities are included in the reported net realized and unrealized gains (losses) on investment transactions and balances. However, pursuant to U.S. federal income tax regulations, gains and losses from certain foreign currency transactions and the foreign currency portion of gains and losses realized on sales and maturities of foreign denominated debt securities are treated as ordinary income for U.S. federal income tax purposes.
Net realized gains (losses) on foreign currency transactions represent net foreign exchange gains (losses) from foreign currency forward exchange contracts, disposition of foreign currencies, currency gains (losses) realized between the trade and settlement dates on securities transactions, and the difference between the amount of investment income and foreign withholding taxes recorded on the Fund's books and the U.S. dollar equivalent amounts actually received or paid. Net unrealized currency gains (losses) from valuing foreign currency denominated assets and liabilities at period end exchange
22
Morgan Stanley Institutional Fund, Inc.
Annual Report — December 31, 2018
Notes to Financial Statements (cont'd)
rates are reflected as a component of unrealized appreciation (depreciation) in the Statement of Assets and Liabilities. The change in unrealized currency gains (losses) on foreign currency translations for the period is reflected in the Statement of Operations.
Foreign security and currency transactions may involve certain considerations and risks not typically associated with those of U.S. dollar denominated transactions as a result of, among other factors, fluctuations of exchange rates in relation to the U.S. dollar, the possibility of lower levels of governmental supervision and regulation of foreign securities markets and the possibility of political or economic instability.
Governmental approval for foreign investments may be required in advance of making an investment under certain circumstances in some countries, and the extent of foreign investments in domestic companies may be subject to limitation in other countries. Foreign ownership limitations also may be imposed by the charters of individual companies to prevent, among other concerns, violations of foreign investment limitations. As a result, an additional class of shares (identified as "Foreign" in the Portfolio of Investments) may be created and offered for investment. The "local" and "foreign shares" market values may differ. In the absence of trading of the foreign shares in such markets, the Fund values the foreign shares at the closing exchange price of the local shares.
5. Securities Lending: The Fund lends securities to qualified financial institutions, such as broker-dealers, to earn additional income. Any increase or decrease in the fair value of the securities loaned that might occur and any interest earned or dividends declared on those securities during the term of the loan would remain in the Fund. The Fund would receive cash or securities as collateral in an amount equal to or exceeding 100% of the current fair value of the loaned securities. The collateral is marked-to-market daily by State Street Bank and Trust Company ("State Street"), the securities lending agent, to ensure that a minimum of 100% collateral coverage is maintained.
Based on pre-established guidelines, the securities lending agent invests any cash collateral that is received in an
affiliated money market portfolio and repurchase agreements. Securities lending income is generated from the earnings on the invested collateral and borrowing fees, less any rebates owed to the borrowers and compensation to the lending agent, and is recorded as "Income from Securities Loaned — Net" in the Fund's Statement of Operations. Risks in securities lending transactions are that a borrower may not provide additional collateral when required or return the securities when due, and that the value of the short-term investments will be less than the amount of cash collateral plus any rebate that is required to be returned to the borrower.
The Fund has the right under the securities lending agreement to recover the securities from the borrower on demand.
The following table presents financial instruments that are subject to enforceable netting arrangements as of December 31, 2018:
Gross Amounts Not Offset in the Statement of Assets and Liabilities | |
Gross Asset
Amounts
Presented in
the Statement
of Assets and
Liabilities
(000) | | Financial
Instrument
(000) | | Collateral
Received
(000) | | Net Amount
(not less
than $0)
(000) | |
| $ | 23,614 | (a) | | $ | — | | | $ | (23,614 | )(b)(c) | | $ | 0 | | |
(a) Represents market value of loaned securities at year end.
(b) The Fund received cash collateral of approximately $6,597,000, of which approximately $6,557,000 was subsequently invested in Repurchase Agreements and Morgan Stanley Institutional Liquidity Funds as reported in the Portfolio of Investments. As of December 31, 2018, there was uninvested cash of approximately $40,000, which is not reflected in the Portfolio of Investments. In addition, the Fund received non-cash collateral of approximately $17,809,000 in the form of U.S. Government obligations, which the Fund cannot sell or repledge, and accordingly are not reflected in the Portfolio of Investments.
(c) The actual collateral received is greater than the amount shown here due to overcollateralization.
FASB ASC 860, "Transfers & Servicing: Repurchase-to-Maturity Transactions, Repurchase Financings, and Disclosures", is intended to provide increased transparency about the types of collateral pledged in securities lending transactions and other similar transactions that are accounted for as secured borrowing.
The following table displays a breakdown of transactions accounted for as secured borrowings, the gross
23
Morgan Stanley Institutional Fund, Inc.
Annual Report — December 31, 2018
Notes to Financial Statements (cont'd)
obligations by class of collateral pledged and the remaining contractual maturity of those transactions as of December 31, 2018:
Remaining Contractual Maturity of the Agreements | |
| | | Overnight and
Continuous
(000) | | <30 days
(000) | | Between
30 &
90 days
(000) | | >90 days
(000) | | Total
(000) | |
Securities Lending
Transactions | |
Common Stocks | | $ | 6,597 | | | $ | — | | | $ | — | | | $ | — | | | $ | 6,597 | | |
Total Borrowings | | $ | 6,597 | | | $ | — | | | $ | — | | | $ | — | | | $ | 6,597 | | |
Gross amount of
recognized liabilities
for securities lending
transactions | | | | | | | | | | $ | 6,597 | | |
6. Indemnifications: The Company enters into contracts that contain a variety of indemnifications. The Company's maximum exposure under these arrangements is unknown. However, the Company has not had prior claims or losses pursuant to these contracts and expects the risk of loss to be remote.
7. Dividends and Distributions to Shareholders: Dividends and distributions to shareholders are recorded on the ex-dividend date. Dividends from net investment income, if any, are declared and paid annually. Net realized capital gains, if any, are distributed at least annually.
8. Security Transactions, Income and Expenses: Security transactions are accounted for on the trade date (date the order to buy or sell is executed). Realized gains and losses on the sale of investment securities are determined on the specific identified cost method. Dividend income and other distributions are recorded on the ex-dividend date (except for certain foreign dividends which may be recorded as soon as the Fund is informed of such dividends) net of applicable withholding taxes. Non-cash dividends received in the form of stock, if any, are recognized on the ex-dividend date and recorded as non-cash dividend income at fair value. Interest income is recognized on the accrual basis except where collection is in doubt. Discounts are accreted and premiums are amortized over the life of the respective securities. Most expenses of the Company can be directly attributed to a particular Fund. Expenses which cannot be directly attributed are apportioned among the Funds based upon relative net assets or other appropriate methods. Income, expenses (other than class specific expenses — distribution and shareholder services, transfer agency and sub transfer agency fees) and
realized and unrealized gains or losses are allocated to each class of shares based upon their relative net assets.
The Fund owns shares of real estate investment trusts ("REITs") which report information on the source of their distributions annually in the following calendar year. A portion of distributions received from REITs during the year is estimated to be a return of capital and is recorded as a reduction of their cost.
B. Advisory/Sub-Advisory Fees: The Adviser, a wholly-owned subsidiary of Morgan Stanley, provides the Fund with advisory services under the terms of an Investment Advisory Agreement, paid quarterly, at an annual rate of 0.85% of the average daily net assets of the Fund.
The Adviser has agreed to reduce its advisory fee and/or reimburse the Fund so that total annual portfolio operating expenses, excluding certain investment related expenses, taxes, interest and other extraordinary expenses (including litigation), will not exceed 0.97% for Class I shares, 1.21% for Class A shares, 1.78% for Class L shares, 2.07% for Class C shares, 0.94% for Class IS shares and 0.94% for Class IR shares. The fee waivers and/or expense reimbursements will continue for at least one year from the date of the Fund's prospectus or until such time as the Directors act to discontinue all or a portion of such waivers and/or reimbursements when they deem such action is appropriate. For the year ended December 31, 2018, approximately $334,000 of advisory fees were waived and approximately $246,000 of other expenses were reimbursed by the Adviser pursuant to this arrangement.
The Adviser has entered into Sub-Advisory Agreements with the Sub-Advisers, each a wholly-owned subsidiary of Morgan Stanley. The Sub-Advisers provide the Fund with advisory services subject to the overall supervision of the Adviser and the Company's Officers and Directors. The Adviser pays the Sub-Advisers on a monthly basis a portion of the net advisory fees the Adviser receives from the Fund.
C. Administration Fees: The Adviser also serves as Administrator to the Company and provides administrative services pursuant to an Administration Agreement for an annual fee, accrued daily and paid monthly, of 0.08% of the Fund's average daily net assets.
Under a Sub-Administration Agreement between the Administrator and State Street, State Street provides certain administrative services to the Company. For such services, the Administrator pays State Street a portion of the fee the Administrator receives from the Fund.
24
Morgan Stanley Institutional Fund, Inc.
Annual Report — December 31, 2018
Notes to Financial Statements (cont'd)
D. Distribution and Shareholder Services Fees: Morgan Stanley Distribution, Inc. ("MSDI" or the "Distributor"), a wholly-owned subsidiary of the Adviser and an indirect subsidiary of Morgan Stanley, serves as the Company's Distributor of Fund shares pursuant to a Distribution Agreement. The Company has adopted a Shareholder Services Plan with respect to Class A shares pursuant to Rule 12b-1 under the Act. Under the Shareholder Services Plan, the Fund pays the Distributor a shareholder services fee, accrued daily and paid monthly, at an annual rate of 0.25% of the Fund's average daily net assets attributable to Class A shares.
The Company has adopted a Distribution and Shareholder Services Plan with respect to Class L shares pursuant to Rule 12b-1 under the Act. Under the Distribution and Shareholder Services Plan, the Fund pays the Distributor a distribution fee, accrued daily and paid monthly, at an annual rate of 0.50% and a shareholder services fee, accrued daily and paid monthly, at an annual rate of 0.25% of the Fund's average daily net assets attributable to Class L shares.
The Company has adopted a Distribution and Shareholder Services Plan with respect to Class C shares pursuant to Rule 12b-1 under the Act. Under the Distribution and Shareholder Services Plan, the Fund pays the Distributor a distribution fee, accrued daily and paid monthly, at an annual rate of 0.75% and a shareholder services fee, accrued daily and paid monthly, at an annual rate of 0.25% of the Fund's average daily net assets attributable to Class C shares.
The distribution and shareholder services fees are used to support the expenses associated with servicing and maintaining accounts. The Distributor may compensate other parties for providing shareholder support services to investors who purchase Class A, Class L and Class C shares.
E. Dividend Disbursing and Transfer Agent: The Company's dividend disbursing and transfer agent is DST Asset Manager Solutions, Inc. ("DST"). Pursuant to a Transfer Agency Agreement, the Company pays DST a fee based on the number of classes, accounts and transactions relating to the Funds of the Company.
F. Custodian Fees: State Street (the "Custodian") also serves as Custodian for the Company in accordance with a Custodian Agreement. The Custodian holds cash, securities and other assets of the Company as required by the Act. Custody fees are payable monthly based on assets held in custody, investment purchases and sales activity and account maintenance fees, plus reimbursement for certain out-of-pocket expenses.
G. Security Transactions and Transactions with Affiliates: For the year ended December 31, 2018, purchases and sales of investment securities for the Fund, other than long-term U.S. Government securities and short-term investments were approximately $150,636,000 and $189,073,000, respectively. There were no purchases and sales of long-term U.S. Government securities for the year ended December 31, 2018.
The Fund invests in the Institutional Class of the Morgan Stanley Institutional Liquidity Funds (the "Liquidity Funds"), an open-end management investment company managed by the Adviser, both directly and as a portion of the securities held as collateral on loaned securities. Advisory fees paid by the Fund are reduced by an amount equal to its pro-rata share of the advisory and administration fees paid by the Fund due to its investment in the Liquidity Funds. For the year ended December 31, 2018, advisory fees paid were reduced by approximately $16,000 relating to the Fund's investment in the Liquidity Funds.
A summary of the Fund's transactions in shares of affiliated investments during the year ended December 31, 2018 is as follows:
Affiliated
Investment
Company | | Value
December 31,
2017
(000) | | Purchases
at Cost
(000) | | Proceeds
from Sales
(000) | | Dividend
Income
(000) | |
Liquidity Funds | | $ | 21,085 | | | $ | 119,617 | | | $ | 134,657 | | | $ | 146 | | |
Affiliated
Investment
Company (cont'd) | | Realized
Gain (Loss)
(000) | | Change in
Unrealized
Appreciation
(Depreciation)
(000) | | Value
December 31,
2018
(000) | |
Liquidity Funds | | $ | — | | | $ | — | | | $ | 6,045 | | |
The Fund is permitted to purchase and sell securities ("cross-trade") from and to other Morgan Stanley funds as well as other funds and client accounts for which the Adviser or an affiliate of the Adviser serves as investment adviser, pursuant to procedures approved by the Directors in compliance with Rule 17a-7 under the Act (the "Rule"). Each cross-trade is executed at the current market price in compliance with provisions of the Rule. For the year ended December 31, 2018, the Fund did not engage in any cross-trade transactions.
The Fund has an unfunded Deferred Compensation Plan (the "Compensation Plan"), which allows each independent Director to defer payment of all, or a portion, of the fees he or she receives for serving on the Board of Directors. Each eligible Director generally may elect to have the deferred amounts credited with a return equal to the total return on one or more of the Morgan Stanley funds that are offered as investment options
25
Morgan Stanley Institutional Fund, Inc.
Annual Report — December 31, 2018
Notes to Financial Statements (cont'd)
under the Compensation Plan. Appreciation/depreciation and distributions received from these investments are recorded with an offsetting increase/decrease in the deferred compensation obligation and do not affect the NAV of the Fund.
H. Federal Income Taxes: It is the Fund's intention to continue to qualify as a regulated investment company and distribute all of its taxable and tax-exempt income. Accordingly, no provision for Federal income taxes is required in the financial statements.
The Fund may be subject to taxes imposed by countries in which it invests. Such taxes are generally based on income and/or capital gains earned or repatriated. Taxes are accrued based on net investment income, net realized gains and net unrealized appreciation as such income and/or gains are earned. Taxes may also be based on transactions in foreign currency and are accrued based on the value of investments denominated in such currency.
FASB ASC 740-10, "Income Taxes — Overall", sets forth a minimum threshold for financial statement recognition of the benefit of a tax position taken or expected to be taken in a tax return. Management has concluded there are no significant uncertain tax positions that would require recognition in the financial statements. If applicable, the Fund recognizes interest accrued related to unrecognized tax benefits in "Interest Expense" and penalties in "Other Expenses" in the Statement of Operations. The Fund files tax returns with the U.S. Internal Revenue Service, New York and various states. Generally, each of the tax years in the four-year period ended December 31, 2018 remains subject to examination by taxing authorities.
The tax character of distributions paid may differ from the character of distributions for GAAP purposes due to short-term capital gains being treated as ordinary income for tax purposes. The tax character of distributions paid during fiscal years 2018 and 2017 was as follows:
2018
Distributions
Paid From: | | 2017
Distributions
Paid From: | |
Ordinary
Income
(000) | | Long-Term
Capital Gain
(000) | | Ordinary
Income
(000) | | Long-Term
Capital Gain
(000) | |
| $ | 7,366 | | | $ | 18,949 | | | $ | 11,453 | | | $ | 17,296 | | |
The amount and character of income and gains to be distributed are determined in accordance with income tax regulations
which may differ from GAAP. These book/tax differences are either considered temporary or permanent in nature.
Temporary differences are primarily due to differing book and tax treatments in the timing of the recognition of gains (losses) on certain investment transactions and the timing of the deductibility of certain expenses.
Permanent differences, primarily due to equalization debits, resulted in the following reclassifications among the components of net assets at December 31, 2018:
Total
Distributable
Earnings
(000) | | Paid-in-
Capital
(000) | |
| $ | (1,636 | ) | | $ | 1,636 | | |
At December 31, 2018, the Fund had no distributable earnings on a tax basis.
I. Credit Facility: The Company and other Morgan Stanley funds participated in a $150,000,000 committed, unsecured revolving line of credit facility (the "Facility") with State Street. This Facility is to be used for temporary emergency purposes or funding of shareholder redemption requests. The interest rate on borrowings is based on the federal funds rate or 1 month LIBOR rate plus a spread. The Facility also has a commitment fee of 0.25% per annum based on the unused portion of the Facility. During the year ended December 31, 2018, the Fund did not have any borrowings under the Facility.
J. Other: At December 31, 2018, the Fund had record owners of 10% or greater. Investment activities of these shareholders could have a material impact on the Fund. The aggregate percentage of such owners was 48.1%.
26
Morgan Stanley Institutional Fund, Inc.
Annual Report — December 31, 2018
Report of Independent Registered Public Accounting Firm
To the Shareholders and Board of Directors of
Morgan Stanley Institutional Fund, Inc. —
Global Infrastructure Portfolio
Opinion on the Financial Statements
We have audited the accompanying statement of assets and liabilities of Global Infrastructure Portfolio (the "Fund") (one of the funds constituting the Morgan Stanley Institutional Fund, Inc. (the "Company")), including the portfolio of investments, as of December 31, 2018, and the related statement of operations for the year then ended, the statements of changes in net assets for each of the two years in the period then ended, the financial highlights for each of the five years in the period then ended and the related notes (collectively referred to as the "financial statements"). In our opinion, the financial statements present fairly, in all material respects, the financial position of Global Infrastructure Portfolio (one of the funds constituting Morgan Stanley Institutional Fund, Inc.) at December 31, 2018, the results of its operations for the year then ended, the changes in its net assets for each of the two years in the period then ended and its financial highlights for each of the five years in the period then ended, in conformity with U.S. generally accepted accounting principles.
Basis for Opinion
These financial statements are the responsibility of the Company's management. Our responsibility is to express an opinion on the Fund's financial statements based on our audits. We are a public accounting firm registered with the Public Company Accounting Oversight Board (United States) ("PCAOB") and are required to be independent with respect to the Company in accordance with the U.S. federal securities law and the applicable rules and regulations of the Securities and Exchange Commission and the PCAOB.
We conducted our audits in accordance with the standards of the PCAOB. Those standards require that we plan and perform the audit to obtain reasonable assurance about whether the financial statements are free of material misstatement, whether due to error or fraud. The Company is not required to have, nor were we engaged to perform, an audit of the Company's internal control over financial reporting. As part of our audits, we are required to obtain an understanding of internal control over financial reporting, but not for the purpose of expressing an opinion on the effectiveness of the Company's internal control over financial reporting. Accordingly, we express no such opinion.
Our audits included performing procedures to assess the risks of material misstatement of the financial statements, whether due to error or fraud, and performing procedures that respond to those risks. Such procedures included examining, on a test basis, evidence regarding the amounts and disclosures in the financial statements. Our procedures included confirmation of securities owned as of December 31, 2018 by correspondence with the custodian and others or by other appropriate auditing procedures where replies from others were not received. Our audits also included evaluating the accounting principles used and significant estimates made by management, as well as evaluating the overall presentation of the financial statements. We believe that our audits provide a reasonable basis for our opinion.

We have served as the auditor of one or more Morgan Stanley investment companies since 2000.
Boston, Massachusetts
February 26, 2019
27
Morgan Stanley Institutional Fund, Inc.
Annual Report — December 31, 2018
Federal Tax Notice (unaudited)
For federal income tax purposes, the following information is furnished with respect to the distributions paid by the Fund during its taxable year ended December 31, 2018. For corporate shareholders 25.7% of the dividends qualified for the dividends received deduction.
The Fund designated and paid approximately $18,949,000 as a long-term capital gain distribution.
For federal income tax purposes, the following information is furnished with respect to the Fund's earnings for its taxable year ended December 31, 2018. When distributed, certain earnings may be subject to a maximum tax rate of 15% as provided for by the Jobs and Growth Tax Relief Reconciliation Act of 2003. The Fund designated up to a maximum of approximately $8,814,000 as taxable at this lower rate.
The Fund intends to pass through foreign tax credits of approximately $355,000 and has derived net income from sources within foreign countries amounting to approximately $10,400,000.
In January, the Fund provides tax information to shareholders for the preceding calendar year.
28
Morgan Stanley Institutional Fund, Inc.
Annual Report — December 31, 2018
Privacy Notice (unaudited)
MORGAN STANLEY INVESTMENT MANAGEMENT INC.
AN IMPORTANT NOTICE CONCERNING OUR U.S. PRIVACY POLICY
We are required by federal law to provide you with a copy of our privacy policy annually. This policy applies to current and former individual investors in funds managed or sponsored by Morgan Stanley Investment Management Inc. ("MSIM") as well as current and former individual clients of MSIM. This policy is not applicable to partnerships, corporations, trusts or other non-individual clients or investors. Please note that we may amend this policy at any time, and will inform you of any changes as required by law.
WE RESPECT YOUR PRIVACY
We appreciate that you have provided us with your personal financial information. We strive to maintain the privacy of such information while we help you achieve your financial objectives. This Notice describes what non-public personal information we collect about you, why we collect it, when we may share it with others and how certain others may use it. It discusses the steps you may take to limit our sharing of certain information about you to affiliated companies in the Morgan Stanley family of companies ("other Morgan Stanley companies"). It also discloses how you may limit use of certain shared information for marketing purposes by other Morgan Stanley branded companies. Throughout this policy, we refer to the non-public information that personally identifies you or your accounts as "personal information.''
1. WHAT PERSONAL INFORMATION DO WE COLLECT ABOUT YOU?
We obtain personal information from applications and other forms you submit to us, from your dealings with us, from consumer reporting agencies, from our Web sites and from third parties and other sources.
For example:
• We may collect information such as your name, address, e-mail address, telephone/fax numbers, assets, income and investment objectives through subscription documents, applications and other forms you submit to us.
• We may obtain information about account balances, your use of account(s) and the types of products and services you prefer to receive from us through your dealings and transactions with us and other sources.
• We may obtain information about your creditworthiness and credit history from consumer reporting agencies.
• We may collect background information from and through third-party vendors to verify representations you have made and to comply with various regulatory requirements.
• If you interact with us through our public and private Web sites, we may collect information that you provide directly through online communications (such as an e-mail address). We may also collect information about your Internet service provider, your domain name, your computer's operating system and Web browser, your use of our Web sites and your product and service preferences, through the use of "cookies." Please consult the Terms of Use of these sites for more details.
2. WHEN DO WE DISCLOSE PERSONAL INFORMATION WE COLLECT ABOUT YOU?
We may disclose personal information we collect about you to other Morgan Stanley companies and to non-affiliated third parties.
a. Information We Disclose to Other Morgan Stanley Companies.
We may disclose personal information to other Morgan Stanley companies for a variety of reasons, including to manage your account(s) effectively, to service and process your transactions, to let you know about products and services offered by us and other Morgan Stanley companies, to manage our business, and as otherwise required or permitted by law. Offers for products and services from other Morgan Stanley companies are developed under conditions designed to safeguard your personal information.
29
Morgan Stanley Institutional Fund, Inc.
Annual Report — December 31, 2018
Privacy Notice (unaudited) (cont'd)
b. Information We Disclose to Non-affiliated Third Parties.
We do not disclose personal information that we collect about you to non-affiliated third parties except to those who provide marketing services on our behalf, to financial institutions with whom we have joint marketing agreements, and as otherwise required or permitted by law. For example, we may disclose personal information to non-affiliated third parties for servicing and processing transactions, to offer our own products and services, to protect against fraud, for institutional risk control, to respond to judicial process or to perform services on our behalf. When we share personal information with a non-affiliated third party, they are required to limit their use of personal information to the particular purpose for which it was shared and they are not allowed to share personal information with others except to fulfill that limited purpose or as may be permitted or required by law.
3. HOW DO WE PROTECT THE SECURITY AND CONFIDENTIALITY OF PERSONAL INFORMATION WE COLLECT ABOUT YOU?
We maintain physical, electronic and procedural security measures to help safeguard the personal information we collect about you. We have internal policies governing the proper handling of client information. Third parties that provide support or marketing services on our behalf may also receive personal information, and we require them to adhere to confidentiality standards with respect to such information.
4. HOW CAN YOU LIMIT THE SHARING OF CERTAIN TYPES OF PERSONAL INFORMATION WITH OTHER MORGAN STANLEY COMPANIES?
We offer you choices as to whether we share with other Morgan Stanley companies the personal information that was collected to determine your eligibility for products and services you request ("eligibility information"). Eligibility information does not include your identification information or personal information pertaining to our transactions or experiences with you. Please note that, even if you direct us not to share eligibility information with other Morgan Stanley companies ("opt-out"), we may still share personal information, including eligibility information, with those companies in circumstances excluded from the opt-out under applicable law, such as to process transactions or to service your account.
5. HOW CAN YOU LIMIT THE USE OF CERTAIN TYPES OF PERSONAL INFORMATION BY OTHER MORGAN STANLEY COMPANIES FOR MARKETING?
By following the opt-out instructions in Section 6 below, you may limit other Morgan Stanley branded companies from marketing their products or services to you based on personal information we disclose to them. This information may include, for example, your income and account history with us. Please note that, even if you choose to limit Other Morgan Stanley Companies from using personal information about you that we may share with them for marketing their products and services to you, Other Morgan Stanley Companies may use your personal information that they obtain from us to market to you in circumstances permitted by law, such as if the Other Morgan Stanley Company has its own relationship with you.
6. HOW CAN YOU SEND US AN OPT-OUT INSTRUCTION?
If you wish to limit our sharing of eligibility information about you with other Morgan Stanley companies or other Morgan Stanley companies' use of personal information for marketing purposes, as described in this notice, you may do so by:
• Calling us at (800) 548-7786
Monday–Friday between 8a.m. and 6p.m. (EST)
• Writing to us at the following address:
DST Asset Manager Solutions, Inc.
c/o Privacy Coordinator
P.O. Box 219804
Kansas City, Missouri 64121
30
Morgan Stanley Institutional Fund, Inc.
Annual Report — December 31, 2018
Privacy Notice (unaudited) (cont'd)
Your written request should include your name, address, telephone number and account number(s) to which the opt-out applies and whether you are opting out with respect to sharing of eligibility information (Section 4 above), or if information used for Marketing (Section 5 above) or both. Written opt-out requests should not be sent with any other correspondence. In order to process your request, we require that the request be provided by you directly and not through a third party.
Your opt-out preference will remain in effect with respect to this policy (as it may be amended) until you notify us otherwise. If you have a joint account, your direction for us not to share this information with other Morgan Stanley companies and for those other Morgan Stanley companies not to use your personal information for marketing will be applied to all account holders on that account. Please understand that if you limit our sharing or our affiliated companies' use of personal information, you and any joint account holder(s) may not receive information about Morgan Stanley products and services, including products or services that could help you manage your financial resources and achieve your investment objectives.
7. WHAT IF AN AFFILIATED COMPANY BECOMES A NON-AFFILIATED THIRD PARTY?
If, at any time in the future, an affiliated company becomes a non-affiliated third party, further disclosures of personal information made to the former affiliated company will be limited to those described in Section 2(b) above relating to non-affiliated third parties. If you elected under Section 6 to limit disclosures we make to affiliated companies, or use of personal information by affiliated companies, your election will not apply to use by any former affiliated company of your personal information in their possession once it becomes a non-affiliated third party.
SPECIAL NOTICE TO RESIDENTS OF VERMONT
The following section supplements our policy with respect to our individual clients who have a Vermont address and supersedes anything to the contrary in the above policy with respect to those clients only.
The state of Vermont requires financial institutions to obtain your consent prior to sharing personal information that they collect about you with affiliated companies and non-affiliated third parties other than in certain limited circumstances. Except as permitted by law, we will not share personal information we collect about you with non-affiliated third parties or other Morgan Stanley companies unless you provide us with your written consent to share such information ("opt-in").
If you wish to receive offers for investment products and services offered by or through other Morgan Stanley companies, please notify us in writing at the following address:
DST Asset Manager Solutions, Inc.
c/o Privacy Coordinator
P.O. Box 219804
Kansas City, Missouri 64121
Your authorization should include your name, address, telephone number and account number(s) to which the opt-in applies and should not be sent with any other correspondence. In order to process your authorization, we require that the authorization be provided by you directly and not through a third party.
SPECIAL NOTICE TO RESIDENTS OF CALIFORNIA
The following section supplements our policy with respect to our individual clients who have a California address and supersedes anything to the contrary in the above policy with respect to those clients only.
In response to a California law, if your account has a California home address, your personal information will not be disclosed to non-affiliated third parties except as permitted by applicable California law, and we will limit sharing such information with our affiliates to comply with California privacy laws that apply to us.
31
Morgan Stanley Institutional Fund, Inc.
Annual Report — December 31, 2018
Director and Officer Information (unaudited)
Independent Directors:
Name, Age and Address of
Independent Director | | Position(s)
Held with
Registrant | | Length of Time
Served* | | Principal Occupation(s) During Past 5 Years
and Other Relevant Professional Experience | | Number of
Portfolios in
Fund Complex
Overseen by
Independent
Director** | | Other Directorships
Held by Independent
Director*** | |
Frank L. Bowman (74)
c/o Perkins Coie LLP
Counsel to the Independent
Directors
30 Rockefeller Plaza
New York, NY 10112 | | Director | | Since
August
2006 | | President, Strategic Decisions, LLC (consulting) (since February 2009); Director or Trustee of various Morgan Stanley Funds (since August 2006); Chairperson of the Compliance and Insurance Committee (since October 2015); formerly, Chairperson of the Insurance Sub-Committee of the Compliance and Insurance Committee (2007-2015); served as President and Chief Executive Officer of the Nuclear Energy Institute (policy organization) (February 2005-November 2008); retired as Admiral, U.S. Navy after serving over 38 years on active duty including 8 years as Director of the Naval Nuclear Propulsion Program in the Department of the Navy and the U.S. Department of Energy (1996-2004); served as Chief of Naval Personnel (July 1994-September 1996) and on the Joint Staff as Director of Political Military Affairs (June 1992-July 1994); knighted as Honorary Knight Commander of the Most Excellent Order of the British Empire; awarded the Officier de l'Orde National du Mérite by the French Government; elected to the National Academy of Engineering (2009). | | | 82 | | | Director of BP p.l.c.; Director of Naval and Nuclear Technologies LLP; Director Emeritus of the Armed Services YMCA; Member of the National Security Advisory Council of the Center for U.S. Global Engagement and a member of the CNA Military Advisory Board; Trustee of Fairhaven United Methodist Church; Member of the Board of Advisors of the Dolphin Scholarship Foundation; and Director of other various non-profit organizations. | |
Kathleen A. Dennis (65)
c/o Perkins Coie LLP
Counsel to the Independent Directors
30 Rockefeller Plaza
New York, NY 10112 | | Director | | Since
August
2006 | | President, Cedarwood Associates (mutual fund and investment management consulting) (since July 2006); Chairperson of the Liquidity and Alternatives Sub-Committee of the Investment Committee (since October 2006) and Director or Trustee of various Morgan Stanley Funds (since August 2006); formerly, Senior Managing Director of Victory Capital Management (1993-2006). | | | 82 | | | Director of various non-profit organizations. | |
Nancy C. Everett (63)
c/o Perkins Coie LLP
Counsel to the Independent Directors
30 Rockefeller Plaza
New York, NY 10112 | | Director | | Since
January
2015 | | Chief Executive Officer, Virginia Commonwealth University Investment Company (since November 2015); Owner, OBIR, LLC (institutional investment management consulting) (since June 2014); formerly, Managing Director, BlackRock Inc. (February 2011-December 2013); and Chief Executive Officer, General Motors Asset Management (a/k/a Promark Global Advisors, Inc.) (June 2005-May 2010). | | | 83 | | | Formerly, Member of Virginia Commonwealth University School of Business Foundation (2005-2016); Member of Virginia Commonwealth University Board of Visitors (2013-2015); Member of Committee on Directors for Emerging Markets Growth Fund, Inc. (2007-2010); Chairperson of Performance Equity Management, LLC (2006-2010); and Chairperson, GMAM Absolute Return Strategies Fund, LLC (2006-2010). | |
32
Morgan Stanley Institutional Fund, Inc.
Annual Report — December 31, 2018
Director and Officer Information (unaudited) (cont'd)
Independent Directors: (cont'd)
Name, Age and Address of
Independent Director | | Position(s)
Held with
Registrant | | Length of Time
Served* | | Principal Occupation(s) During Past 5 Years
and Other Relevant Professional Experience | | Number of
Portfolios in
Fund Complex
Overseen by
Independent
Director** | | Other Directorships
Held by Independent
Director*** | |
Jakki L. Haussler (61)
c/o Perkins Coie LLP
Counsel to the Independent Directors
30 Rockefeller Plaza
New York, NY 10112 | | Director | | Since
January
2015 | | Chairman and Chief Executive Officer, Opus Capital Group (since January 1996); formerly, Director, Capvest Venture Fund, LP (May 2000-December 2011); Partner, Adena Ventures, LP (July 1999-December 2010); Director, The Victory Funds (February 2005-July 2008). | | | 83 | | | Director of Service Corporation International and Member, Audit Committee and Investment Committee; Director of Cincinnati Bell Inc. and Member, Audit Committee and Governance and Nominating Committee; Chairman of Northern Kentucky University Member Investment Committee; Member of Chase College of Law Transactional Law Practice Center Board of Advisors; Director of Best Transport; Director of Chase College of Law Board of Visitors; formerly, Member, University of Cincinnati Foundation Investment Committee; Member, Miami University Board of Visitors (2008-2011); Trustee of Victory Funds (2005-2008) and Chairman, Investment Committee (2007-2008) and Member, Service Provider Committee (2005-2008). | |
Dr. Manuel H. Johnson (69)
c/o Johnson Smick
International, Inc.
220 I Street, NE — Suite 200
Washington, D.C. 20002 | | Director | | Since
July
1991 | | Senior Partner, Johnson Smick International, Inc. (consulting firm); Chairperson of the Investment Committee (since October 2006) and Director or Trustee of various Morgan Stanley Funds (since July 1991); Co-Chairman and a founder of the Group of Seven Council (G7C) (international economic commission); formerly, Chairperson of the Audit Committee (July 1991-September 2006), Vice Chairman of the Board of Governors of the Federal Reserve System and Assistant Secretary of the U.S. Treasury. | | | 82 | | | Director of NVR, Inc. (home construction). | |
Joseph J. Kearns (76)
c/o Perkins Coie LLP
Counsel to the Independent Directors
30 Rockefeller Plaza
New York, NY 10112 | | Director | | Since
August
1994 | | Senior Adviser, Kearns & Associates LLC (investment consulting); Chairperson of the Audit Committee (since October 2006) and Director or Trustee of various Morgan Stanley Funds (since August 1994); formerly, Deputy Chairperson of the Audit Committee (July 2003-September 2006) and Chairperson of the Audit Committee of various Morgan Stanley Funds (since August 1994); CFO of the J. Paul Getty Trust. | | | 83 | | | Prior to August 10, 2016, Director of Electro Rent Corporation (equipment leasing); Prior to December 31, 2013, Director of The Ford Family Foundation. | |
33
Morgan Stanley Institutional Fund, Inc.
Annual Report — December 31, 2018
Director and Officer Information (unaudited) (cont'd)
Independent Directors: (cont'd)
Name, Age and Address of
Independent Director | | Position(s)
Held with
Registrant | | Length of Time
Served* | | Principal Occupation(s) During Past 5 Years
and Other Relevant Professional Experience | | Number of
Portfolios in
Fund Complex
Overseen by
Independent
Director** | | Other Directorships
Held by Independent
Director*** | |
Michael F. Klein (60)
c/o Perkins Coie LLP
Counsel to the Independent Directors
30 Rockefeller Plaza
New York, NY 10112 | | Director | | Since
August
2006 | | Managing Director, Aetos Alternatives Management, LP (since March 2000); Co-President, Aetos Alternatives Management, LP (since January 2004) and Co-Chief Executive Officer of Aetos Alternatives Management, LP (since August 2013); Chairperson of the Fixed Income Sub-Committee of the Investment Committee (since October 2006) and Director or Trustee of various Morgan Stanley Funds (since August 2006); formerly, Managing Director, Morgan Stanley & Co. Inc. and Morgan Stanley Dean Witter Investment Management and President, various Morgan Stanley Funds (June 1998-March 2000); Principal, Morgan Stanley & Co. Inc. and Morgan Stanley Dean Witter Investment Management (August 1997-December 1999). | | | 82 | | | Director of certain investment funds managed or sponsored by Aetos Alternatives Management, LP; Director of Sanitized AG and Sanitized Marketing AG (specialty chemicals). | |
Patricia Maleski (58)
c/o Perkins Coie LLP
Counsel to the Independent Directors
30 Rockefeller Plaza
New York, NY 10112 | | Director | | Since
January
2017 | | Managing Director, JPMorgan Asset Management (2004-2016); Oversight and Control Head of Fiduciary and Conflicts of Interest Program (2015-2016); Chief Control Officer-Global Asset Management (2013-2015); President, JPMorgan Funds (2010-2013); Chief Administrative Officer (2004-2013); various other positions including Treasurer and Board Liaison (since 2001). | | | 83 | | | None. | |
Michael E. Nugent (82)
522 Fifth Avenue
New York, NY 10036 | | Chair of the Board and Director | | Chair of the Boards since July 2006 and Director since July 1991 | | Chair of the Boards of various Morgan Stanley Funds (since July 2006); Chairperson of the Closed-End Fund Committee (since June 2012) Governance Committee (since January 2019) and Director or Trustee of various Morgan Stanley Funds (since July 1991); formerly, Chairperson of the Insurance Committee (until July 2006); General Partner, Triumph Capital, L.P. (private investment partnership) (1988-2013). | | | 82 | | | None. | |
W. Allen Reed (71)
c/o Perkins Coie LLP
Counsel to the Independent Directors
30 Rockefeller Plaza
New York, NY 10112 | | Director | | Since
August
2006 | | Chairperson of the Equity Sub-Committee of the Investment Committee (since October 2006) and Director or Trustee of various Morgan Stanley Funds (since August 2006); formerly, President and CEO of General Motors Asset Management; Chairman and Chief Executive Officer of the GM Trust Bank and Corporate Vice President of General Motors Corporation (August 1994-December 2005). | | | 82 | | | Director of Legg Mason, Inc.; formerly, Director of the Auburn University Foundation (2010-2015). | |
Fergus Reid (86)****
c/o Joe Pietryka, Inc.
85 Charles Colman Blvd.
Pawling, NY 12564 | | Director | | Since
June
1992 | | Chairman, Joe Pietryka, Inc.; Chairperson of the Governance Committee and Director or Trustee of various Morgan Stanley Funds (since June 1992). | | | 83 | | | Formerly, Trustee and Director of certain investment companies in the JP Morgan Fund Complex managed by JP Morgan Investment Management Inc. (1987-2012). | |
* This is the earliest date the Director began serving the Morgan Stanley Funds. Each Director serves an indefinite term, until his or her successor is elected.
** The Fund Complex includes (as of December 31, 2018) all open-end and closed-end funds (including all of their portfolios) advised by Morgan Stanley Investment Management Inc. (the "Adviser") and any funds that have an adviser that is an affiliated person of the Adviser (including, but not limited to, Morgan Stanley AIP GP LP).
*** This includes any directorships at public companies and registered investment companies held by the Director at any time during the past five years.
**** Effective date of retirement is December 31, 2018.
34
Morgan Stanley Institutional Fund, Inc.
Annual Report — December 31, 2018
Director and Officer Information (unaudited) (cont'd)
Executive Officers:
Name, Age and Address of Executive Officer | | Position(s) Held
with
Registrant | | Length of Time
Served* | | Principal Occupation(s) During Past 5 Years | |
John H. Gernon (55)
522 Fifth Avenue
New York, NY 10036 | | President and Principal Executive Officer | | Since
September
2013 | | President and Principal Executive Officer of the Equity and Fixed Income Funds and the Morgan Stanley AIP Funds (since September 2013) and the Liquidity Funds and various money market funds (since May 2014) in the Fund Complex; Managing Director of the Adviser; Head of Product (since 2006). | |
Timothy J. Knierim (59)
522 Fifth Avenue
New York, NY 10036 | | Chief Compliance Officer | | Since
December
2016 | | Managing Director of the Adviser and various entities affiliated with the Adviser; Chief Compliance Officer of various Morgan Stanley Funds and the Adviser (since December 2016) and Chief Compliance Officer of Morgan Stanley AIP GP LP (since 2014). Formerly, Managing Director and Deputy Chief Compliance Officer of the Adviser (2014-2016); and formerly, Chief Compliance Officer of Prudential Investment Management, Inc. (2007-2014). | |
Francis J. Smith (53)
522 Fifth Avenue
New York, NY 10036 | | Treasurer and Principal Financial Officer | | Treasurer since July 2003 and Principal Financial Officer since September 2002 | | Managing Director of the Adviser and various entities affiliated with the Adviser; Treasurer (since July 2003) and Principal Financial Officer of various Morgan Stanley Funds (since September 2002). | |
Mary E. Mullin (51)
522 Fifth Avenue
New York, NY 10036 | | Secretary | | Since
June
1999 | | Managing Director of the Adviser; Secretary of various Morgan Stanley Funds (since June 1999). | |
Michael J. Key (39)
522 Fifth Avenue
New York, NY 10036 | | Vice President | | Since
June
2017 | | Vice President of the Equity and Fixed Income Funds, Liquidity Funds, various money market funds and the Morgan Stanley AIP Funds in the Fund Complex (since June 2017); Executive Director of the Adviser; Head of Product Development for Equity and Fixed Income Funds (since August 2013). | |
* This is the earliest date the officer began serving the Morgan Stanley Funds. Each officer serves a one-year term, until his or her successor is elected and qualifies.
35
Morgan Stanley Institutional Fund, Inc.
Annual Report — December 31, 2018
Adviser and Administrator
Morgan Stanley Investment Management Inc.
522 Fifth Avenue
New York, New York 10036
Sub-Advisers
Morgan Stanley Investment Management Limited
25 Cabot Square, Canary Wharf
London, E14 4QA, England
Morgan Stanley Investment Management Company
23 Church Street
16-01 Capital Square, Singapore 049481
Distributor
Morgan Stanley Distribution, Inc.
522 Fifth Avenue
New York, New York 10036
Dividend Disbursing and Transfer Agent
DST Asset Manager Solutions, Inc.
2000 Crown Colony Drive
Quincy, Massachusetts 02169
Custodian
State Street Bank and Trust Company
One Lincoln Street
Boston, Massachusetts 02111
Legal Counsel
Dechert LLP
1095 Avenue of the Americas
New York, New York 10036
Counsel to the Independent Directors
Perkins Coie LLP
30 Rockefeller Plaza
New York, New York 10112
Independent Registered Public Accounting Firm
Ernst & Young LLP
200 Clarendon Street
Boston, Massachusetts 02116
Reporting to Shareholders
Each Morgan Stanley fund provides a complete schedule of portfolio holdings in its semi-annual and the annual reports within 60 days of the end of the fund's second and fourth fiscal quarters. The semi-annual and annual reports are filed electronically with the Securities and Exchange Commission ("SEC") on Form N-CSRS and Form N-CSR, respectively. Morgan Stanley also delivers the semi-annual and annual reports to fund shareholders and makes these reports available on its public website, www.morganstanley.com/im/shareholderreports. Each Morgan Stanley fund also files a complete schedule of portfolio holdings with the SEC for the fund's first and third fiscal quarters on Form N-Q. Morgan Stanley does not deliver the reports for the first and third fiscal quarters to shareholders, nor are the reports posted to the Morgan Stanley public website. You may, however, obtain the Form N-Q filings (as well as the Form N-CSR and N-CSRS filings) by accessing the SEC's website, www.sec.gov. You can also request copies of these materials, upon payment of a duplicating fee, by electronic request at the SEC's email address (publicinfo@sec.gov).
Proxy Voting Policies and Procedures and Proxy Voting Record
You may obtain a copy of the Company's Proxy Voting Policy and Procedures and information regarding how the Company voted proxies relating to portfolio securities during the most recent twelve-month period ended June 30, without charge, upon request, by calling toll free 1 (800) 548-7786 or by visiting our website at www.morganstanley.com/im/shareholderreports. This information is also available on the SEC's website at www.sec.gov.
This report is authorized for distribution only when preceded or accompanied by a prospectus or summary prospectus of the applicable Fund of Morgan Stanley Institutional Fund, Inc., which describes in detail the Fund's investment policies, risks, fees and expenses. Please read the prospectus carefully before you invest or send money. For additional information, including information regarding the investments comprising the Fund, please visit our website at www.morganstanley.com/im/shareholderreports or call toll free 1 (800) 548-7786.
36
Printed in U.S.A.
This Report has been prepared for shareholders and may be distributed to others only if preceded or accompanied by a current prospectus.
Morgan Stanley Investment Management Inc.
522 Fifth Avenue
New York, New York 10036
© 2019 Morgan Stanley. Morgan Stanley Distribution, Inc.

IFISGIANN
2404094 EXP. 02.29.20

Morgan Stanley Institutional Fund, Inc.
Global Opportunity Portfolio
Annual Report
December 31, 2018
Beginning on January 1, 2021, as permitted by regulations adopted by the Securities and Exchange Commission ("SEC"), paper copies of the Fund's Annual and Semi-Annual Reports to Shareholders ("Shareholder Reports") will no longer be sent by mail, unless you specifically request paper copies of the Shareholder Reports from the Fund or from your financial intermediary, such as a broker-dealer or a bank. Instead, the Shareholder Reports will be made available on the Fund's website, https://www.morganstanley.com/im/shareholderreports and you will be notified by mail each time a Shareholder Report is posted and provided with a website link to access the Shareholder Report. If you already elected to receive Shareholder Reports electronically, you will not be affected by this change and you need not take any action. You may elect to receive Shareholder Reports and other communications from the Fund electronically anytime by contacting your financial intermediary or, if you are a direct investor, please follow the instructions on the envelope.
Beginning on January 1, 2019, you may elect to receive all future Shareholder Reports in paper free of charge. If you invest through a financial intermediary, you can contact your financial intermediary to request that you continue to receive paper copies of your Shareholder Reports. If you invest directly with the Fund, please follow the instructions on the envelope to let the Fund know you wish to continue receiving paper copies of your Shareholder Reports. Your election to receive Shareholder Reports in paper will apply to all funds held in your account if you invest through your financial intermediary or all funds held with the fund complex if you invest directly with a fund.

Morgan Stanley Institutional Fund, Inc.
Annual Report — December 31, 2018
Shareholders' Letter | | | 2 | | |
Expense Example | | | 3 | | |
Investment Overview | | | 4 | | |
Portfolio of Investments | | | 7 | | |
Statement of Assets and Liabilities | | | 9 | | |
Statement of Operations | | | 11 | | |
Statements of Changes in Net Assets | | | 12 | | |
Financial Highlights | | | 14 | | |
Notes to Financial Statements | | | 20 | | |
Report of Independent Registered Public Accounting Firm | | | 30 | | |
Federal Tax Notice | | | 31 | | |
Privacy Notice | | | 32 | | |
Director and Officer Information | | | 35 | | |
This report is authorized for distribution only when preceded or accompanied by a prospectus or summary prospectus of the applicable Fund of Morgan Stanley Institutional Fund, Inc. To receive a prospectus and/or statement of additional information (SAI), which contains more complete information such as investment objectives, charges, expenses, policies for voting proxies, risk considerations and describes in detail each of the Fund's investment policies to the prospective investor, please call toll free 1 (800) 548-7786. Please read the prospectuses carefully before you invest or send money.
Additionally, you can access information about the Fund, including performance, characteristics and investment team commentary, through Morgan Stanley Investment Management's website: www.morganstanley.com/im/shareholderreports.
Market forecasts provided in this report may not necessarily come to pass. There is no guarantee that any sectors mentioned will continue to perform as discussed herein or that securities in such sectors will be held by the Fund in the future. There is no assurance that a fund will achieve its investment objective. Funds are subject to market risk, which is the possibility that market values of securities owned by the Fund will decline and, therefore, the value of the Fund's shares may be less than what you paid for them. Accordingly, you can lose money investing in this Fund. Please see the prospectus for more complete information on investment risks.
1
Morgan Stanley Institutional Fund, Inc.
Annual Report — December 31, 2018
Shareholders' Letter (unaudited)
Dear Shareholders,
We are pleased to provide this Annual report, in which you will learn how your investment in Global Opportunity Portfolio (the "Fund") performed during the latest twelve-month period.
Morgan Stanley Investment Management is a client-centric, investor-led organization. Our global presence, intellectual capital, and breadth of products and services enable us to partner with investors to meet the evolving challenges of today's financial markets. We aim to deliver superior investment service and to empower our clients to make the informed decisions that help them reach their investment goals.
As always, we thank you for selecting Morgan Stanley Investment Management, and look forward to working with you in the months and years ahead.
Sincerely,

John H. Gernon
President and Principal Executive Officer
January 2019
2
Morgan Stanley Institutional Fund, Inc.
Annual Report — December 31, 2018
Expense Example (unaudited)
Global Opportunity Portfolio
As a shareholder of the Fund, you incur two types of costs: (1) transactional costs; and (2) ongoing costs, which may include advisory fees, administration fees, distribution and shareholder services fees and other Fund expenses. This example is intended to help you understand your ongoing costs (in dollars) of investing in the Fund and to compare these costs with the ongoing costs of investing in other mutual funds.
This example is based on an investment of $1,000 invested at the beginning of the six-month period ended December 31, 2018 and held for the entire six-month period.
Actual Expenses
The table below provides information about actual account values and actual expenses. You may use the information in this table, together with the amount you invested, to estimate the expenses that you paid over the period. Simply divide your account value by $1,000 (for example, an $8,600 account value divided by $1,000 = 8.6), then multiply the result by the number in the table under the heading entitled "Actual Expenses Paid During Period" to estimate the expenses you paid on your account during this period.
Hypothetical Example for Comparison Purposes
The table below provides information about hypothetical account values and hypothetical expenses based on the Fund's actual expense ratio and an assumed rate of return of 5% per year before expenses, which is not the Fund's actual return. The hypothetical account values and expenses may not be used to estimate the actual ending account balance or expenses you paid for the period. You may use this information to compare the ongoing costs of investing in the Fund and other funds. To do so, compare this 5% hypothetical example with the 5% hypothetical examples that appear in the shareholder reports of the other funds.
Please note that the expenses shown in the table are meant to highlight your ongoing costs only and do not reflect any transactional costs, such as sales charges (loads). Therefore, the information for each class in the table is useful in comparing ongoing costs only, and will not help you determine the relative total costs of owning different funds. In addition, if these transactional costs were included, your costs would have been higher.
| | | Beginning
Account
Value
7/1/18 | | Actual Ending
Account
Value
12/31/18 | | Hypothetical
Ending Account
Value | | Actual
Expenses
Paid
During
Period* | | Hypothetical
Expenses Paid
During Period* | | Net
Expense
Ratio
During
Period** | |
Global Opportunity Portfolio Class I | | $ | 1,000.00 | | | $ | 838.20 | | | $ | 1,020.37 | | | $ | 4.45 | | | $ | 4.89 | | | | 0.96 | % | |
Global Opportunity Portfolio Class A | | | 1,000.00 | | | | 837.00 | | | | 1,018.70 | | | | 5.97 | | | | 6.56 | | | | 1.29 | | |
Global Opportunity Portfolio Class L | | | 1,000.00 | | | | 836.90 | | | | 1,018.45 | | | | 6.20 | | | | 6.82 | | | | 1.34 | | |
Global Opportunity Portfolio Class C | | | 1,000.00 | | | | 834.10 | | | | 1,015.27 | | | | 9.11 | | | | 10.01 | | | | 1.97 | | |
Global Opportunity Portfolio Class IS | | | 1,000.00 | | | | 837.40 | | | | 1,020.57 | | | | 4.26 | | | | 4.69 | | | | 0.92 | | |
Global Opportunity Portfolio Class IR | | | 1,000.00 | | | | 838.90 | | | | 1,020.77 | | | | 4.08 | | | | 4.48 | | | | 0.88 | | |
* Expenses are calculated using each Fund Class' annualized net expense ratio (as disclosed), multiplied by the average account value over the period and multiplied by 184/365 (to reflect the most recent one-half year period).
** Annualized.
3
Morgan Stanley Institutional Fund, Inc.
Annual Report — December 31, 2018
Investment Overview (unaudited)
Global Opportunity Portfolio
The Fund seeks long-term capital appreciation.
Performance
For the fiscal year ended December 31, 2018, the Fund's Class I shares had a total return based on net asset value and reinvestment of distributions per share of –5.66%, net of fees. The Fund's Class I shares outperformed the Fund's benchmark, the MSCI All Country World Net Index (the "Index"), which returned –9.41%.
Factors Affecting Performance
• Global growth concerns weighed heavily on global equities in the 12-month period. Economic indicators were signaling slowdowns across China, Europe and the U.K., and Japan while at the same time financial conditions were tightening and geopolitical risks increased, particularly regarding trade protectionism. The U.S. economy was an outlier, as growth accelerated on tailwinds from tax cuts and deregulation. But by the end of the year, U.S. companies downgraded their earnings forecasts as the benefits of fiscal stimulus were expected to recede and business sentiment deteriorated due to the U.S.-China trade relations. With global growth fading and the outcome of trade disputes, Brexit and other issues still largely unpredictable, investors grew anxious about the duration of the Federal Reserve's monetary tightening and the European Central Bank's decision to begin withdrawing its stimulus. Pricing these risks was challenging, which led to increased equity volatility through the year.
• Global equity markets declined 9.41% for the 12-month period ended December 31, 2018, as measured by the Index. Against this backdrop, our team remained focused on assessing company prospects over a longer-term period of three to five years, and owning a portfolio of high quality companies with diverse business drivers not tied to a particular market environment.
• The team manages concentrated portfolios that are highly differentiated from the benchmark, with securities weighted on our assessment of the quality of the company and our conviction. Our
longer-term focus results in lower turnover than many of our peers. The value added or detracted in any period of time will typically result from stock selection, given our philosophy and process.
• For the 12-month period, the Fund outperformed the Index due to favorable stock selection and sector allocation.
• The Fund's outperformance was primarily driven by our stock selection in consumer discretionary and information technology, along with an underweight in financials.
• Detracting from relative performance was our stock selection in communication services and underweights in health care and utilities. The Fund had no utilities holding at the end of the reporting period.
Management Strategies
• There were no changes to our bottom-up investment process during the period. The team seeks high quality companies, which we define primarily as those with sustainable competitive advantages. Our team continues to focus on bottom-up stock selection and the long-term outlook for companies owned in the Fund; accordingly, we have had very limited turnover in the Fund to date, as our ongoing work reaffirms our assessment of quality and competitive advantage in the names we own.
• At the close of the period ended December 31, 2018, consumer discretionary represented the largest sector weight in the Fund, followed by information technology, communication services and consumer staples. The team's bottom-up investment process resulted in sector overweight positions in consumer discretionary, information technology, consumer staples and communication services and underweight positions in financials, health care, energy, industrials, real estate, utilities and materials. The Fund had no energy, real estate and utilities holding at the end of the reporting period.
4
Morgan Stanley Institutional Fund, Inc.
Annual Report — December 31, 2018
Investment Overview (unaudited) (cont'd)
Global Opportunity Portfolio
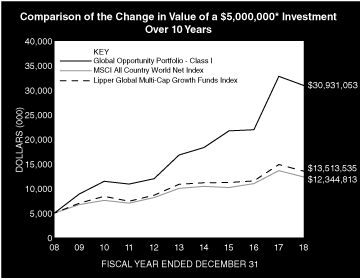
* Minimum Investment for Class I shares
In accordance with SEC regulations, the Fund's performance shown assumes that all recurring fees (including management fees) were deducted and all dividends and distributions were reinvested. The performance of Class A, L, C, IS and IR shares will vary from the performance of Class I shares based upon their different inception dates and will be negatively impacted by additional fees assessed to those classes (if applicable).
Performance Compared to the MSCI All Country World Net Index(1) and the Lipper Global Multi-Cap Growth Funds Index(2)
| | | Period Ended December 31, 2018
Total Returns(3) | |
| | | | | Average Annual | |
| | | One
Year | | Five
Years | | Ten
Years | | Since
Inception(8) | |
Fund — Class I Shares
w/o sales charges(4) | | | –5.66 | % | | | 12.98 | % | | | 19.99 | % | | | 11.40 | % | |
Fund — Class A Shares
w/o sales charges(4) | | | –5.96 | | | | 12.58 | | | | — | | | | 15.75 | | |
Fund — Class A Shares with
maximum 5.25% sales charges(4) | | | –10.88 | | | | 11.37 | | | | — | | | | 15.03 | | |
Fund — Class L Shares
w/o sales charges(4) | | | –6.04 | | | | 12.49 | | | | 19.52 | | | | 10.99 | | |
Fund — Class C Shares
w/o sales charges(6) | | | –6.61 | | | | — | | | | — | | | | 10.66 | | |
Fund — Class C Shares with
maximum 1.00% deferred
sales charges(6) | | | –7.53 | | | | — | | | | — | | | | 10.66 | | |
Fund — Class IS Shares
w/o sales charges(5) | | | –5.78 | | | | 12.99 | | | | — | | | | 15.84 | | |
Fund — Class IR Shares
w/o sales charges(7) | | | — | | | | — | | | | — | | | | –18.63 | | |
MSCI All Country World Net Index | | | –9.41 | | | | 4.26 | | | | 9.46 | | | | 3.69 | | |
Lipper Global Multi-Cap
Growth Funds Index | | | –9.15 | | | | 4.48 | | | | 10.45 | | | | 4.42 | | |
Performance data quoted represents past performance, which is no guarantee of future results, and current performance may be lower or higher than the figures shown. Performance assumes that all dividends and distributions, if any, were reinvested. For the most recent month-end performance figures, please visit www.morganstanley.com/im/shareholderreports. Investment return and principal value will fluctuate so that Fund shares, when redeemed, may be worth more or less than their original cost. Returns for periods less than one year are not annualized. Total returns do not reflect the deduction of taxes that a shareholder would pay on Fund distributions or the redemption of Fund shares. Performance of share classes will vary due to difference in sales charges and expenses.
(1) The MSCI All Country World Net Index is a free float-adjusted market capitalization weighted index designed to measure the equity market performance of developed and emerging markets. The term "free float" represents the portion of shares outstanding that are deemed to be available for purchase in the public equity markets by investors. The performance of the Index is listed in U.S. dollars and assumes reinvestment of net dividends. Net total return indices reinvest dividends after the deduction of withholding taxes, using (for international indices) a tax rate applicable to non-resident institutional investors who do not benefit from double taxation treaties. The Index is unmanaged and its returns do not include any sales charges or fees. Such costs would lower performance. It is not possible to invest directly in an index.
(2) The Lipper Global Multi-Cap Growth Funds Index is an equally weighted performance index of the largest qualifying funds (based on net assets) in the Lipper Global Multi-Cap Growth Funds classification. The Index, which is adjusted for capital gains distributions and income dividends, is unmanaged and should not be considered an investment. There are currently 30 funds represented in this Index. As of the date of this report, the Fund is in the Lipper Global Multi-Cap Growth Funds classification.
5
Morgan Stanley Institutional Fund, Inc.
Annual Report — December 31, 2018
Investment Overview (unaudited) (cont'd)
Global Opportunity Portfolio
(3) Total returns for the Fund reflect fees waived and expenses reimbursed, if applicable, by Morgan Stanley Investment Management Inc. (the "Adviser"). Without such waivers and reimbursements, total returns would have been lower.
(4) On May 21, 2010 Class C and Class I shares of Van Kampen Global Growth Fund (the "Predecessor Fund") were reorganized into Class L and Class I shares of Morgan Stanley Global Growth Portfolio (the "Fund"), respectively. Class L and Class I shares' returns of the Fund will differ from the Predecessor Fund as they have different expenses. Performance shown for the Fund's Class I and Class L shares reflects the performance of the shares of the Predecessor Fund for periods prior to May 21, 2010. The Class C and I shares of the Predecessor Fund commenced operations on May 30, 2008. Class P shares, which were renamed Class A shares effective September 9, 2013, commenced operations on May 21, 2010. In October 2010, the Morgan Stanley Global Growth Portfolio changed its name to the Morgan Stanley Global Opportunity Portfolio.
(5) Commenced offering on September 13, 2013.
(6) Commenced offering on April 30, 2015.
(7) Commenced offering on June 15, 2018.
(8) For comparative purposes, average annual since inception returns listed for the Indexes refer to the inception date of Class I of the Fund, not the inception of the Index.
6
Morgan Stanley Institutional Fund, Inc.
Annual Report — December 31, 2018
Portfolio of Investments
Global Opportunity Portfolio
| | | Shares | | Value
(000) | |
Common Stocks (96.2%) | |
Argentina (0.9%) | |
Globant SA (a) | | | 382,833 | | | $ | 21,561 | | |
Belgium (0.5%) | |
Anheuser-Busch InBev SA N.V. | | | 180,527 | | | | 11,948 | | |
China (10.5%) | |
China Resources Beer Holdings Co., Ltd. (b) | | | 6,689,333 | | | | 23,179 | | |
Ctrip.com International Ltd. ADR (a) | | | 842,612 | | | | 22,801 | | |
Foshan Haitian Flavouring & Food Co., Ltd.,
Class A | | | 4,004,376 | | | | 40,081 | | |
Haidilao International Holding Ltd. (a) | | | 4,358,000 | | | | 9,225 | | |
Jiangsu Yanghe Brewery Joint-Stock Co., Ltd.,
Class A | | | 1,878,960 | | | | 25,895 | | |
TAL Education Group ADR (a) | | | 4,802,972 | | | | 128,143 | | |
| | | | 249,324 | | |
Denmark (4.4%) | |
DSV A/S | | | 1,578,525 | | | | 104,087 | | |
France (3.5%) | |
Hermes International | | | 149,345 | | | | 82,595 | | |
Hong Kong (1.0%) | |
Haidilao International Holding Ltd. (a)(c) | | | 3,757,000 | | | | 8,242 | | |
Meituan Dianping, Class B (a) | | | 2,992,000 | | | | 16,829 | | |
| | | | 25,071 | | |
India (5.2%) | |
HDFC Bank Ltd. | | | 4,043,904 | | | | 123,040 | | |
Italy (3.6%) | |
Moncler SpA | | | 2,581,824 | | | | 86,274 | | |
Japan (4.7%) | |
Calbee, Inc. | | | 1,521,800 | | | | 47,558 | | |
Keyence Corp. | | | 94,700 | | | | 47,727 | | |
Nihon M&A Center, Inc. | | | 792,600 | | | | 15,780 | | |
| | | | 111,065 | | |
Korea, Republic of (0.9%) | |
NAVER Corp. | | | 209,064 | | | | 22,779 | | |
Switzerland (1.1%) | |
Chocoladefabriken Lindt & Spruengli AG
(Registered) | | | 351 | | | | 26,160 | | |
United Kingdom (4.4%) | |
Fevertree Drinks PLC | | | 1,384,896 | | | | 38,548 | | |
Reckitt Benckiser Group PLC | | | 852,488 | | | | 65,101 | | |
| | | | 103,649 | | |
United States (55.5%) | |
Adobe, Inc. (a) | | | 434,892 | | | | 98,390 | | |
Agilon Health Topco, Inc. (acquisition cost —
$11,376; acquired 11/7/18) (a)(d)(e)(f) | | | 30,083 | | | | 11,394 | | |
Alphabet, Inc., Class C (a) | | | 107,879 | | | | 111,721 | | |
Amazon.com, Inc. (a) | | | 119,298 | | | | 179,182 | | |
AO Smith Corp. | | | 38,541 | | | | 1,646 | | |
Booking Holdings, Inc. (a) | | | 66,421 | | | | 114,405 | | |
EPAM Systems, Inc. (a) | | | 658,988 | | | | 76,449 | | |
Facebook, Inc., Class A (a) | | | 976,435 | | | | 128,001 | | |
GrubHub, Inc. (a) | | | 335,478 | | | | 25,768 | | |
Martin Marietta Materials, Inc. | | | 315,880 | | | | 54,290 | | |
| | | Shares | | Value
(000) | |
Mastercard, Inc., Class A | | | 889,233 | | | $ | 167,754 | | |
salesforce.com, Inc. (a) | | | 450,479 | | | | 61,702 | | |
ServiceNow, Inc. (a) | | | 214,814 | | | | 38,248 | | |
Stamps.com, Inc. (a) | | | 155,835 | | | | 24,254 | | |
Starbucks Corp. | | | 563,709 | | | | 36,303 | | |
Visa, Inc., Class A | | | 878,396 | | | | 115,896 | | |
Vulcan Materials Co. | | | 517,626 | | | | 51,141 | | |
Zillow Group, Inc., Class A (a) | | | 590,384 | | | | 18,556 | | |
Zillow Group, Inc., Class C (a) | | | 177,787 | | | | 5,614 | | |
| | | | 1,320,714 | | |
Total Common Stocks (Cost $1,977,751) | | | 2,288,267 | | |
Preferred Stocks (0.7%) | |
United States (0.7%) | |
Airbnb, Inc. Series D (a)(d)(e)(f)
(acquisition cost — $1,594;
acquired 4/16/14) | | | 39,153 | | | | 4,728 | | |
Magic Leap Series C (a)(d)(e)(f)
(acquisition cost — $3,175;
acquired 12/22/15) | | | 137,829 | | | | 3,721 | | |
Uber Technologies Series G (a)(d)(e)(f)
(acquisition cost — $8,232;
acquired 12/3/15) | | | 168,793 | | | | 7,786 | | |
Total Preferred Stocks (Cost $13,001) | | | 16,235 | | |
Short-Term Investment (5.1%) | |
Investment Company (5.1%) | |
Morgan Stanley Institutional Liquidity
Funds — Treasury Securities Portfolio —
Institutional Class (See Note G)
(Cost $122,351) | | | 122,351,183 | | | | 122,351 | | |
Total Investments Excluding Purchased
Options (102.0%) (Cost $2,113,103) | | | 2,426,853 | | |
Total Purchased Options Outstanding (0.1%)
(Cost $7,519) | | | 1,518 | | |
Total Investments (102.1%)
(Cost $2,120,622) (g)(h) | | | 2,428,371 | | |
Liabilities in Excess of Other Assets (–2.1%) | | | (50,672 | ) | |
Net Assets (100.0%) | | $ | 2,377,699 | | |
Country assignments and aggregations are based generally on third party vendor classifications and information, and may be different from the assignments and aggregations under the policies set forth in the Fund's prospectus and/or statement of additional information relating to geographic classifications.
(a) Non-income producing security.
(b) Security trades on the Hong Kong exchange.
(c) 144A security — Certain conditions for public sale may exist. Unless otherwise noted, these securities are deemed to be liquid.
(d) Security has been deemed illiquid at December 31, 2018.
(e) Security cannot be offered for public resale without first being registered under the Securities Act of 1933 and related rules ("restricted security"). Acquisition date represents the day on which an enforceable right to acquire such security is obtained and is presented along with related cost in the security description. The Fund has registration rights for certain restricted securities. Any costs related to such registration are borne by the issuer. The aggregate value of restricted securities (excluding 144A holdings) at December 31, 2018 amounts to approximately $27,629,000 and represents 1.2% of net assets.
The accompanying notes are an integral part of the financial statements.
7
Morgan Stanley Institutional Fund, Inc.
Annual Report — December 31, 2018
Portfolio of Investments (cont'd)
Global Opportunity Portfolio
(f) At December 31, 2018, the Fund held fair valued securities valued at approximately $27,629,000, representing 1.2% of net assets. These securities have been fair valued as determined in good faith under procedures established by and under the general supervision of the Company's Directors.
(g) The approximate fair value and percentage of net assets, $662,782,000 and 27.9%, respectively, represent the securities that have been fair valued under the fair valuation policy for international investments as described in Note A-1 within the Notes to the Financial Statements.
(h) At December 31, 2018, the aggregate cost for federal income tax purposes is approximately $2,125,853,000. The aggregate gross unrealized appreciation is approximately $419,248,000 and the aggregate gross unrealized depreciation is approximately $116,700,000, resulting in net unrealized appreciation of approximately $302,548,000.
ADR American Depositary Receipt.
Call Options Purchased:
The Fund had the following call options purchased open at December 31, 2018:
Counterparty | | Description | | Strike
Price | | Expiration
Date | | Number of
Contracts | | Notional
Amount
(000) | | Value
(000) | | Premiums
Paid
(000) | | Unrealized
Depreciation
(000) | |
Royal Bank of Scotland | | USD/CNH | | CNH | 7.16 | | | Jan-19 | | | 459,248,289 | | | | 459,248 | | | $ | 47 | | | $ | 1,993 | | | $ | (1,946 | ) | |
Royal Bank of Scotland | | USD/CNH | | CNH | 7.78 | | | Jul-19 | | | 583,418,790 | | | | 583,419 | | | | 632 | | | | 2,843 | | | | (2,211 | ) | |
Royal Bank of Scotland | | USD/CNH | | CNH | 8.00 | | | Oct-19 | | | 456,373,516 | | | | 456,374 | | | | 839 | | | | 2,683 | | | | (1,844 | ) | |
| | | | | | | | | | | | | $ | 1,518 | | | $ | 7,519 | | | $ | (6,001 | ) | |
CNH — Chinese Yuan Renminbi Offshore
USD — United States Dollar
Portfolio Composition
Classification | | Percentage of
Total Investments | |
Other* | | | 25.6 | % | |
Internet & Direct Marketing Retail | | | 16.3 | | |
Information Technology Services | | | 14.8 | | |
Interactive Media & Services | | | 11.8 | | |
Software | | | 9.1 | | |
Textiles, Apparel & Luxury Goods | | | 7.0 | | |
Diversified Consumer Services | | | 5.3 | | |
Banks | | | 5.1 | | |
Short-Term Investments | | | 5.0 | | |
Total Investments | | | 100.0 | % | |
* Industries and/or investment types representing less than 5% of total investments.
The accompanying notes are an integral part of the financial statements.
8
Morgan Stanley Institutional Fund, Inc.
Annual Report — December 31, 2018
Global Opportunity Portfolio
Statement of Assets and Liabilities | | December 31, 2018
(000) | |
Assets: | |
Investments in Securities of Unaffiliated Issuers, at Value (Cost $1,998,271) | | $ | 2,306,020 | | |
Investment in Security of Affiliated Issuer, at Value (Cost $122,351) | | | 122,351 | | |
Total Investments in Securities, at Value (Cost $2,120,622) | | | 2,428,371 | | |
Foreign Currency, at Value (Cost $3) | | | 3 | | |
Receivable for Investments Sold | | | 38,183 | | |
Receivable for Fund Shares Sold | | | 13,688 | | |
Receivable from Affiliate | | | 313 | | |
Tax Reclaim Receivable | | | 258 | | |
Other Assets | | | 214 | | |
Total Assets | | | 2,481,030 | | |
Liabilities: | |
Payable for Investments Purchased | | | 81,204 | | |
Payable for Fund Shares Redeemed | | | 14,123 | | |
Payable for Advisory Fees | | | 4,767 | | |
Due to Broker | | | 1,679 | | |
Deferred Capital Gain Country Tax | | | 377 | | |
Payable for Shareholder Services Fees — Class A | | | 175 | | |
Payable for Distribution and Shareholder Services Fees — Class L | | | 9 | | |
Payable for Distribution and Shareholder Services Fees — Class C | | | 142 | | |
Payable for Sub Transfer Agency Fees — Class I | | | 127 | | |
Payable for Sub Transfer Agency Fees — Class A | | | 130 | | |
Payable for Sub Transfer Agency Fees — Class L | | | 2 | | |
Payable for Sub Transfer Agency Fees — Class C | | | 18 | | |
Payable for Administration Fees | | | 169 | | |
Payable for Transfer Agency Fees — Class I | | | 8 | | |
Payable for Transfer Agency Fees — Class A | | | 118 | | |
Payable for Transfer Agency Fees — Class L | | | 19 | | |
Payable for Transfer Agency Fees — Class C | | | 5 | | |
Payable for Transfer Agency Fees — Class IS | | | 1 | | |
Payable for Transfer Agency Fees — Class IR | | | 4 | | |
Payable for Professional Fees | | | 70 | | |
Payable for Custodian Fees | | | 62 | | |
Bank Overdraft | | | 1 | | |
Other Liabilities | | | 121 | | |
Total Liabilities | | | 103,331 | | |
Net Assets | | $ | 2,377,699 | | |
Net Assets Consist of: | |
Paid-in-Capital | | $ | 2,103,516 | | |
| Total Distributable Earnings | | | 274,183 | | |
Net Assets | | $ | 2,377,699 | | |
The accompanying notes are an integral part of the financial statements.
9
Morgan Stanley Institutional Fund, Inc.
Annual Report — December 31, 2018
Global Opportunity Portfolio
Statement of Assets and Liabilities (cont'd) | | December 31, 2018
(000) | |
CLASS I: | |
Net Assets | | $ | 1,337,133 | | |
| Shares Outstanding $0.001 par value shares of beneficial interest (unlimited shares authorized) (not in 000's) | | | 62,181,981 | | |
Net Asset Value, Offering and Redemption Price Per Share | | $ | 21.50 | | |
CLASS A: | |
Net Assets | | $ | 790,571 | | |
| Shares Outstanding $0.001 par value shares of beneficial interest (unlimited shares authorized) (not in 000's) | | | 37,991,223 | | |
Net Asset Value, Redemption Price Per Share | | $ | 20.81 | | |
Maximum Sales Load | | | 5.25 | % | |
Maximum Sales Charge | | $ | 1.15 | | |
Maximum Offering Price Per Share | | $ | 21.96 | | |
CLASS L: | |
Net Assets | | $ | 33,913 | | |
| Shares Outstanding $0.001 par value shares of beneficial interest (unlimited shares authorized) (not in 000's) | | | 1,651,042 | | |
Net Asset Value, Offering and Redemption Price Per Share | | $ | 20.54 | | |
CLASS C: | |
Net Assets | | $ | 159,642 | | |
| Shares Outstanding $0.001 par value shares of beneficial interest (unlimited shares authorized) (not in 000's) | | | 7,954,062 | | |
Net Asset Value, Offering and Redemption Price Per Share | | $ | 20.07 | | |
CLASS IS: | |
Net Assets | | $ | 2,156 | | |
| Shares Outstanding $0.001 par value shares of beneficial interest (unlimited shares authorized) (not in 000's) | | | 100,104 | | |
Net Asset Value, Offering and Redemption Price Per Share | | $ | 21.53 | | |
CLASS IR: | |
Net Assets | | $ | 54,284 | | |
| Shares Outstanding $0.001 par value shares of beneficial interest (unlimited shares authorized) (not in 000's) | | | 2,517,723 | | |
Net Asset Value, Offering and Redemption Price Per Share | | $ | 21.56 | | |
The accompanying notes are an integral part of the financial statements.
10
Morgan Stanley Institutional Fund, Inc.
Annual Report — December 31, 2018
Global Opportunity Portfolio
Statement of Operations | | Year Ended
December 31, 2018
(000) | |
Investment Income: | |
Dividends from Securities of Unaffiliated Issuers (Net of $784 of Foreign Taxes Withheld) | | $ | 11,237 | | |
Non-Cash Dividends from Securities of Unaffiliated Issuers | | | 2,678 | | |
Dividends from Security of Affiliated Issuer (Note G) | | | 2,586 | | |
Total Investment Income | | | 16,501 | | |
Expenses: | |
Advisory Fees (Note B) | | | 18,940 | | |
Shareholder Services Fees — Class A (Note D) | | | 2,413 | | |
Distribution and Shareholder Services Fees — Class L (Note D) | | | 305 | | |
Distribution and Shareholder Services Fees — Class C (Note D) | | | 1,622 | | |
Sub Transfer Agency Fees — Class I | | | 1,084 | | |
Sub Transfer Agency Fees — Class A | | | 1,130 | | |
Sub Transfer Agency Fees — Class L | | | 17 | | |
Sub Transfer Agency Fees — Class C | | | 129 | | |
Administration Fees (Note C) | | | 2,036 | | |
Transfer Agency Fees — Class I (Note E) | | | 23 | | |
Transfer Agency Fees — Class A (Note E) | | | 322 | | |
Transfer Agency Fees — Class L (Note E) | | | 48 | | |
Transfer Agency Fees — Class C (Note E) | | | 15 | | |
Transfer Agency Fees — Class IS (Note E) | | | 3 | | |
Transfer Agency Fees — Class IR (Note E) | | | 4 | | |
Custodian Fees (Note F) | | | 321 | | |
Registration Fees | | | 286 | | |
Shareholder Reporting Fees | | | 239 | | |
Professional Fees | | | 146 | | |
Directors' Fees and Expenses | | | 63 | | |
Pricing Fees | | | 1 | | |
Other Expenses | | | 71 | | |
Total Expenses | | | 29,218 | | |
Rebate from Morgan Stanley Affiliate (Note G) | | | (297 | ) | |
Distribution Fees — Class L Shares Waived (Note D) | | | (183 | ) | |
Net Expenses | | | 28,738 | | |
Net Investment Loss | | | (12,237 | ) | |
Realized Loss: | |
Investments Sold | | | (26,323 | ) | |
Foreign Currency Translation | | | (633 | ) | |
Net Realized Loss | | | (26,956 | ) | |
Change in Unrealized Appreciation (Depreciation): | |
Investments (Net Decrease in Deferred Capital Gain Country Tax of $333) | | | (199,503 | ) | |
Foreign Currency Translation | | | 27 | | |
Net Change in Unrealized Appreciation (Depreciation) | | | (199,476 | ) | |
Net Realized Loss and Change in Unrealized Appreciation (Depreciation) | | | (226,432 | ) | |
Net Decrease in Net Assets Resulting from Operations | | $ | (238,669 | ) | |
The accompanying notes are an integral part of the financial statements.
11
Morgan Stanley Institutional Fund, Inc.
Annual Report — December 31, 2018
Global Opportunity Portfolio
Statements of Changes in Net Assets | | Year Ended
December 31, 2018
(000) | | Year Ended
December 31, 2017
(000) | |
Increase (Decrease) in Net Assets: | |
Operations: | |
Net Investment Loss | | $ | (12,237 | ) | | $ | (6,135 | ) | |
Net Realized Gain (Loss) | | | (26,956 | ) | | | 35,434 | | |
Net Change in Unrealized Appreciation (Depreciation) | | | (199,476 | ) | | | 391,699 | | |
Net Increase (Decrease) in Net Assets Resulting from Operations | | | (238,669 | ) | | | 420,998 | | |
Dividends and Distributions to Shareholders: | |
Class I | | | (9,846 | ) | | | (3,395 | )* | |
Class A | | | (7,319 | ) | | | (3,023 | )* | |
Class L | | | (294 | ) | | | (161 | )* | |
Class C | | | (1,269 | ) | | | (415 | )* | |
Class IS | | | (438 | ) | | | (6 | )* | |
Class IR | | | (— | @) | | | — | | |
Total Dividends and Distributions to Shareholders | | | (19,166 | ) | | | (7,000 | ) | |
Capital Share Transactions:(1) | |
Class I: | |
Subscribed | | | 1,221,941 | | | | 586,150 | | |
Distributions Reinvested | | | 9,644 | | | | 3,383 | | |
Redeemed | | | (639,457 | ) | | | (134,747 | ) | |
Class A: | |
Subscribed | | | 467,352 | | | | 403,560 | | |
Distributions Reinvested | | | 7,236 | | | | 2,983 | | |
Redeemed | | | (393,036 | ) | | | (156,944 | ) | |
Class L: | |
Exchanged | | | 247 | | | | 7 | | |
Distributions Reinvested | | | 275 | | | | 150 | | |
Redeemed | | | (4,377 | ) | | | (4,146 | ) | |
Class C: | |
Subscribed | | | 107,428 | | | | 59,352 | | |
Distributions Reinvested | | | 1,268 | | | | 415 | | |
Redeemed | | | (33,797 | ) | | | (10,104 | ) | |
Class IS: | |
Subscribed | | | 65,885 | | | | 1,433 | | |
Distributions Reinvested | | | 438 | | | | 6 | | |
Redeemed | | | (66,763 | ) | | | (26 | ) | |
Class IR: | |
Subscribed | | | 66,544 | (a) | | | — | | |
Net Increase in Net Assets Resulting from Capital Share Transactions | | | 810,828 | | | | 751,472 | | |
Total Increase in Net Assets | | | 552,993 | | | | 1,165,470 | | |
Net Assets: | |
Beginning of Period | | | 1,824,706 | | | | 659,236 | | |
End of Period | | $ | 2,377,699 | | | $ | 1,824,706 | † | |
The accompanying notes are an integral part of the financial statements.
12
Morgan Stanley Institutional Fund, Inc.
Annual Report — December 31, 2018
Global Opportunity Portfolio
Statements of Changes in Net Assets (cont'd) | | Year Ended
December 31, 2018
(000) | | Year Ended
December 31, 2017
(000) | |
(1) Capital Share Transactions: | |
Class I: | |
Shares Subscribed | | | 49,756 | | | | 29,176 | | |
Shares Issued on Distributions Reinvested | | | 373 | | | | 148 | | |
Shares Redeemed | | | (27,089 | ) | | | (6,742 | ) | |
Net Increase in Class I Shares Outstanding | | | 23,040 | | | | 22,582 | | |
Class A: | |
Shares Subscribed | | | 19,389 | | | | 20,282 | | |
Shares Issued on Distributions Reinvested | | | 289 | | | | 135 | | |
Shares Redeemed | | | (16,730 | ) | | | (8,024 | ) | |
Net Increase in Class A Shares Outstanding | | | 2,948 | | | | 12,393 | | |
Class L: | |
Shares Exchanged | | | 10 | | | | — | @@ | |
Shares Issued on Distributions Reinvested | | | 11 | | | | 7 | | |
Shares Redeemed | | | (187 | ) | | | (220 | ) | |
Net Decrease in Class L Shares Outstanding | | | (166 | ) | | | (213 | ) | |
Class C: | |
Shares Subscribed | | | 4,605 | | | | 3,047 | | |
Shares Issued on Distributions Reinvested | | | 52 | | | | 19 | | |
Shares Redeemed | | | (1,526 | ) | | | (545 | ) | |
Net Increase in Class C Shares Outstanding | | | 3,131 | | | | 2,521 | | |
Class IS: | |
Shares Subscribed | | | 2,537 | | | | 71 | | |
Shares Issued on Distributions Reinvested | | | 17 | | | | — | @@ | |
Shares Redeemed | | | (2,526 | ) | | | (1 | ) | |
Net Increase in Class IS Shares Outstanding | | | 28 | | | | 70 | | |
Class IR: | |
Shares Subscribed | | | 2,518 | (a) | | | — | | |
(a) For the period June 15, 2018 through December 31, 2018.
@ Amount is less than $500.
@@ Amount is less than 500 shares.
The following information was previously reported in the December 31, 2017 financial statements. The distribution information for the year ended December 31, 2017 presented on the Statements of Changes in Net Assets is presented for comparative purposes to the December 31, 2018 financial statements, which conform to the SEC Final Rule on Disclosure Update and Simplification which was effective November 5, 2018.
* Dividends and Distributions to Shareholders for the year ended December 31, 2017 were as follows:
Class I: | |
Net Realized Gain | | $ | (3,395 | ) | |
Class A: | |
Net Realized Gain | | $ | (3,023 | ) | |
Class L: | |
Net Realized Gain | | $ | (161 | ) | |
Class C: | |
Net Realized Gain | | $ | (415 | ) | |
Class IS: | |
Net Realized Gain | | $ | (6 | ) | |
† Accumulated Net Investment Loss for the year ended December 31, 2017 was $(38).
The accompanying notes are an integral part of the financial statements.
13
Morgan Stanley Institutional Fund, Inc.
Annual Report — December 31, 2018
Financial Highlights
Global Opportunity Portfolio
| | | Class I | |
| | | Year Ended December 31, | |
Selected Per Share Data and Ratios | | 2018 | | 2017 | | 2016(1) | | 2015 | | 2014 | |
Net Asset Value, Beginning of Period | | $ | 22.94 | | | $ | 15.41 | | | $ | 16.36 | | | $ | 13.98 | | | $ | 13.65 | | |
Income (Loss) from Investment Operations: | |
Net Investment Loss(2) | | | (0.07 | ) | | | (0.06 | ) | | | (0.05 | ) | | | (0.05 | ) | | | (0.06 | ) | |
Net Realized and Unrealized Gain (Loss) | | | (1.20 | ) | | | 7.68 | | | | 0.18 | | | | 2.64 | | | | 1.26 | | |
Total from Investment Operations | | | (1.27 | ) | | | 7.62 | | | | 0.13 | | | | 2.59 | | | | 1.20 | | |
Distributions from and/or in Excess of: | |
Net Realized Gain | | | (0.17 | ) | | | (0.09 | ) | | | (1.08 | ) | | | (0.21 | ) | | | (0.87 | ) | |
Net Asset Value, End of Period | | $ | 21.50 | | | $ | 22.94 | | | $ | 15.41 | | | $ | 16.36 | | | $ | 13.98 | | |
Total Return(3) | | | (5.66 | )% | | | 49.44 | % | | | 1.05 | % | | | 18.50 | % | | | 9.04 | % | |
Ratios and Supplemental Data: | |
Net Assets, End of Period (Thousands) | | $ | 1,337,133 | | | $ | 898,008 | | | $ | 255,187 | | | $ | 238,920 | | | $ | 11,037 | | |
Ratio of Expenses to Average Net Assets(7) | | | 0.94 | %(4)(6) | | | 0.79 | %(4) | | | 0.80 | %(4) | | | 0.98 | %(4)(5) | | | 1.17 | %(4) | |
Ratio of Net Investment Loss to Average Net Assets(7) | | | (0.30 | )%(4) | | | (0.31 | )%(4) | | | (0.34 | )%(4) | | | (0.33 | )%(4) | | | (0.42 | )%(4) | |
Ratio of Rebate from Morgan Stanley Affiliates to Average Net Assets | | | 0.01 | % | | | 0.01 | % | | | 0.01 | % | | | 0.01 | % | | | 0.01 | % | |
Portfolio Turnover Rate | | | 28 | % | | | 30 | % | | | 37 | % | | | 115 | % | | | 29 | % | |
(7) Supplemental Information on the Ratios to Average Net Assets: | |
Ratios Before Expense Limitation: | |
Expenses to Average Net Assets | | | N/A | | | | 0.99 | % | | | 1.07 | % | | | 1.20 | % | | | 2.47 | % | |
Net Investment Loss to Average Net Assets | | | N/A | | | | (0.51 | )% | | | (0.61 | )% | | | (0.55 | )% | | | (1.72 | )% | |
(1) Reflects prior period Custodian out-of-pocket expenses that were reimbursed in September 2016. The amount of the reimbursement was immaterial on a per share basis and did not impact the total return of Class I shares. The Ratio of Expenses to Average Net Assets and the Ratio of Net Investment Loss to Average Net Assets would be unchanged as the reimbursement of Custodian fees was offset against expense waivers/reimbursements with no impact to net expenses or net investment loss.
(2) Per share amount is based on average shares outstanding.
(3) Calculated based on the net asset value as of the last business day of the period.
(4) The Ratios of Expenses and Net Investment Loss reflect the rebate of certain Fund expenses in connection with the investments in Morgan Stanley affiliates during the period. The effect of the rebate on the ratios is disclosed in the above table as "Ratio of Rebate from Morgan Stanley Affiliates to Average Net Assets."
(5) Effective December 7, 2015, the Adviser has agreed to limit the ratio of expenses to average net assets to the maximum ratio of 0.81% for Class I shares. Prior to December 7, 2015, the maximum ratio was 1.10% for Class I shares. Prior to January 23, 2015, the maximum ratio was 1.25% for Class I shares.
(6) Effective January 1, 2018, the Adviser has agreed to limit the ratio of expenses to average net assets to the maximum ratio of 1.00% for Class I shares. Prior to January 1, 2018, the maximum ratio was 0.81% for Class I shares.
The accompanying notes are an integral part of the financial statements.
14
Morgan Stanley Institutional Fund, Inc.
Annual Report — December 31, 2018
Financial Highlights
Global Opportunity Portfolio
| | | Class A | |
| | | Year Ended December 31, | |
Selected Per Share Data and Ratios | | 2018 | | 2017 | | 2016(1) | | 2015 | | 2014 | |
Net Asset Value, Beginning of Period | | $ | 22.28 | | | $ | 15.01 | | | $ | 16.03 | | | $ | 13.75 | | | $ | 13.48 | | |
Income (Loss) from Investment Operations: | |
Net Investment Loss(2) | | | (0.14 | ) | | | (0.12 | ) | | | (0.11 | ) | | | (0.10 | ) | | | (0.11 | ) | |
Net Realized and Unrealized Gain (Loss) | | | (1.16 | ) | | | 7.48 | | | | 0.17 | | | | 2.59 | | | | 1.25 | | |
Total from Investment Operations | | | (1.30 | ) | | | 7.36 | | | | 0.06 | | | | 2.49 | | | | 1.14 | | |
Distributions from and/or in Excess of: | |
Net Realized Gain | | | (0.17 | ) | | | (0.09 | ) | | | (1.08 | ) | | | (0.21 | ) | | | (0.87 | ) | |
Net Asset Value, End of Period | | $ | 20.81 | | | $ | 22.28 | | | $ | 15.01 | | | $ | 16.03 | | | $ | 13.75 | | |
Total Return(3) | | | (5.96 | )% | | | 49.03 | % | | | 0.62 | % | | | 18.16 | % | | | 8.55 | % | |
Ratios and Supplemental Data: | |
Net Assets, End of Period (Thousands) | | $ | 790,571 | | | $ | 780,705 | | | $ | 340,092 | | | $ | 347,683 | | | $ | 12,952 | | |
Ratio of Expenses to Average Net Assets(7) | | | 1.26 | %(4)(6) | | | 1.12 | %(4) | | | 1.17 | %(4) | | | 1.25 | %(4)(5) | | | 1.56 | %(4) | |
Ratio of Net Investment Loss to Average Net Assets(7) | | | (0.59 | )%(4) | | | (0.63 | )%(4) | | | (0.70 | )%(4) | | | (0.64 | )%(4) | | | (0.82 | )%(4) | |
Ratio of Rebate from Morgan Stanley Affiliates to Average Net Assets | | | 0.01 | % | | | 0.01 | % | | | 0.01 | % | | | 0.01 | % | | | 0.01 | % | |
Portfolio Turnover Rate | | | 28 | % | | | 30 | % | | | 37 | % | | | 115 | % | | | 29 | % | |
(7) Supplemental Information on the Ratios to Average Net Assets: | |
Ratios Before Expense Limitation: | |
Expenses to Average Net Assets | | | N/A | | | | 1.32 | % | | | 1.41 | % | | | 1.50 | % | | | 2.86 | % | |
Net Investment Loss to Average Net Assets | | | N/A | | | | (0.83 | )% | | | (0.94 | )% | | | (0.89 | )% | | | (2.12 | )% | |
(1) Reflects prior period Custodian out-of-pocket expenses that were reimbursed in September 2016. The amount of the reimbursement was immaterial on a per share basis and did not impact the total return of Class A shares. The Ratio of Expenses to Average Net Assets and the Ratio of Net Investment Loss to Average Net Assets would be unchanged as the reimbursement of Custodian fees was offset against expense waivers/reimbursements with no impact to net expenses or net investment loss.
(2) Per share amount is based on average shares outstanding.
(3) Calculated based on the net asset value which does not reflect sales charges, if applicable, as of the last business day of the period.
(4) The Ratios of Expenses and Net Investment Loss reflect the rebate of certain Fund expenses in connection with the investments in Morgan Stanley affiliates during the period. The effect of the rebate on the ratios is disclosed in the above table as "Ratio of Rebate from Morgan Stanley Affiliates to Average Net Assets."
(5) Effective December 7, 2015, the Adviser has agreed to limit the ratio of expenses to average net assets to the maximum ratio of 1.23% for Class A shares. Prior to December 7, 2015, the maximum ratio was 1.45% for Class A share. Prior to January 23, 2015, the maximum ratio was 1.60% for class A shares.
(6) Effective January 1, 2018, the Adviser has agreed to limit the ratio of expenses to average net assets to the maximum ratio of 1.35% for Class A shares. Prior to January 1, 2018, the maximum ratio was 1.23% for Class A shares.
The accompanying notes are an integral part of the financial statements.
15
Morgan Stanley Institutional Fund, Inc.
Annual Report — December 31, 2018
Financial Highlights
Global Opportunity Portfolio
| | | Class L | |
| | | Year Ended December 31, | |
Selected Per Share Data and Ratios | | 2018 | | 2017 | | 2016(1) | | 2015 | | 2014 | |
Net Asset Value, Beginning of Period | | $ | 22.01 | | | $ | 14.84 | | | $ | 15.87 | | | $ | 13.62 | | | $ | 13.38 | | |
Income (Loss) from Investment Operations: | |
Net Investment Loss(2) | | | (0.15 | ) | | | (0.13 | ) | | | (0.12 | ) | | | (0.11 | ) | | | (0.12 | ) | |
Net Realized and Unrealized Gain (Loss) | | | (1.15 | ) | | | 7.39 | | | | 0.17 | | | | 2.57 | | | | 1.23 | | |
Total from Investment Operations | | | (1.30 | ) | | | 7.26 | | | | 0.05 | | | | 2.46 | | | | 1.11 | | |
Distributions from and/or in Excess of: | |
Net Realized Gain | | | (0.17 | ) | | | (0.09 | ) | | | (1.08 | ) | | | (0.21 | ) | | | (0.87 | ) | |
Net Asset Value, End of Period | | $ | 20.54 | | | $ | 22.01 | | | $ | 14.84 | | | $ | 15.87 | | | $ | 13.62 | | |
Total Return(3) | | | (6.04 | )% | | | 48.91 | % | | | 0.56 | % | | | 18.03 | % | | | 8.46 | % | |
Ratios and Supplemental Data: | |
Net Assets, End of Period (Thousands) | | $ | 33,913 | | | $ | 39,979 | | | $ | 30,133 | | | $ | 34,628 | | | $ | 1,091 | | |
Ratio of Expenses to Average Net Assets(7) | | | 1.32 | %(4)(6) | | | 1.20 | %(4) | | | 1.25 | %(4) | | | 1.30 | %(4)(5) | | | 1.64 | %(4) | |
Ratio of Net Investment Loss to Average Net Assets(7) | | | (0.65 | )%(4) | | | (0.67 | )%(4) | | | (0.79 | )%(4) | | | (0.70 | )%(4) | | | (0.87 | )%(4) | |
Ratio of Rebate from Morgan Stanley Affiliates to Average Net Assets | | | 0.01 | % | | | 0.01 | % | | | 0.01 | % | | | 0.01 | % | | | 0.01 | % | |
Portfolio Turnover Rate | | | 28 | % | | | 30 | % | | | 37 | % | | | 115 | % | | | 29 | % | |
(7) Supplemental Information on the Ratios to Average Net Assets: | |
Ratios Before Expense Limitation: | |
Expenses to Average Net Assets | | | 1.78 | % | | | 1.86 | % | | | 1.93 | % | | | 2.03 | % | | | 3.52 | % | |
Net Investment Loss to Average Net Assets | | | (1.11 | )% | | | (1.33 | )% | | | (1.47 | )% | | | (1.43 | )% | | | (2.75 | )% | |
(1) Reflects prior period Custodian out-of-pocket expenses that were reimbursed in September 2016. The amount of the reimbursement was immaterial on a per share basis and did not impact the total return of Class L shares. The Ratio of Expenses to Average Net Assets and the Ratio of Net Investment Loss to Average Net Assets would be unchanged as the reimbursement of Custodian fees was offset against expense waivers/reimbursements with no impact to net expenses or net investment loss.
(2) Per share amount is based on average shares outstanding.
(3) Calculated based on the net asset value as of the last business day of the period.
(4) The Ratios of Expenses and Net Investment Loss reflect the rebate of certain Fund expenses in connection with the investments in Morgan Stanley affiliates during the period. The effect of the rebate on the ratios is disclosed in the above table as "Ratio of Rebate from Morgan Stanley Affiliates to Average Net Assets."
(5) Effective January 23, 2015, the Adviser has agreed to limit the ratio of expenses to average net assets to the maximum ratio of 1.50% for Class L shares. Prior to January 23, 2015, the maximum ratio was 1.65% for Class L shares.
(6) Effective January 1, 2018, the Adviser has agreed to limit the ratio of expenses to average net assets to the maximum ratio of 1.40% for Class L shares. Prior to January 1, 2018, the maximum ratio was 1.50% for Class L shares.
The accompanying notes are an integral part of the financial statements.
16
Morgan Stanley Institutional Fund, Inc.
Annual Report — December 31, 2018
Financial Highlights
Global Opportunity Portfolio
| | | Class C | |
| | | Year Ended December 31, | | Period from
April 30, 2015(2) to | |
Selected Per Share Data and Ratios | | 2018 | | 2017 | | 2016(1) | | December 31, 2015 | |
Net Asset Value, Beginning of Period | | $ | 21.64 | | | $ | 14.69 | | | $ | 15.80 | | | $ | 15.25 | | |
Income (Loss) from Investment Operations: | |
Net Investment Loss(3) | | | (0.30 | ) | | | (0.26 | ) | | | (0.21 | ) | | | (0.15 | ) | |
Net Realized and Unrealized Gain | | | (1.10 | ) | | | 7.30 | | | | 0.18 | | | | 0.91 | | |
Total from Investment Operations | | | (1.40 | ) | | | 7.04 | | | | (0.03 | ) | | | 0.76 | | |
Distributions from and/or in Excess of: | |
Net Realized Gain | | | (0.17 | ) | | | (0.09 | ) | | | (1.08 | ) | | | (0.21 | ) | |
Net Asset Value, End of Period | | $ | 20.07 | | | $ | 21.64 | | | $ | 14.69 | | | $ | 15.80 | | |
Total Return(4) | | | (6.61 | )% | | | 47.92 | % | | | 0.05 | % | | | 4.95 | %(7) | |
Ratios and Supplemental Data: | |
Net Assets, End of Period (Thousands) | | $ | 159,642 | | | $ | 104,364 | | | $ | 33,801 | | | $ | 20,475 | | |
Ratio of Expenses to Average Net Assets(9) | | | 1.95 | %(5)(6) | | | 1.81 | %(5) | | | 1.84 | %(5) | | | 2.03 | %(5)(8) | |
Ratio of Net Investment Loss to Average Net Assets(9) | | | (1.30 | )%(5) | | | (1.33 | )%(5) | | | (1.38 | )%(5) | | | (1.40 | )%(5)(8) | |
Ratio of Rebate from Morgan Stanley Affiliates to Average Net Assets | | | 0.01 | % | | | 0.01 | % | | | 0.01 | % | | | 0.01 | %(8) | |
Portfolio Turnover Rate | | | 28 | % | | | 30 | % | | | 37 | % | | | 115 | % | |
(9) Supplemental Information on the Ratios to Average Net Assets: | |
Ratios Before Expense Limitation: | |
Expenses to Average Net Assets | | | N/A | | | | 2.01 | % | | | 2.08 | % | | | 2.22 | %(8) | |
Net Investment Loss to Average Net Assets | | | N/A | | | | (1.53 | )% | | | (1.62 | )% | | | (1.59 | )%(8) | |
(1) Reflects prior period Custodian out-of-pocket expenses that were reimbursed in September 2016. The amount of the reimbursement was immaterial on a per share basis and did not impact the total return of Class C shares. The Ratio of Expenses to Average Net Assets and the Ratio of Net Investment Loss to Average Net Assets would be unchanged as the reimbursement of Custodian fees was offset against expense waivers/reimbursements with no impact to net expenses or net investment loss.
(2) Commencement of Offering.
(3) Per share amount is based on average shares outstanding.
(4) Calculated based on the net asset value which does not reflect sales charges, if applicable, as of the last business day of the period.
(5) The Ratios of Expenses and Net Investment Loss reflect the rebate of certain Fund expenses in connection with the investments in Morgan Stanley affiliates during the period. The effect of the rebate on the ratios is disclosed in the above table as "Ratio of Rebate from Morgan Stanley Affiliates to Average Net Assets."
(6) Effective January 1, 2018, the Adviser has agreed to limit the ratio of expenses to average net assets to the maximum ratio of 2.10% for Class C shares. Prior to January 1, 2018, the maximum ratio was 2.20% for Class C shares.
(7) Not annualized.
(8) Annualized.
The accompanying notes are an integral part of the financial statements.
17
Morgan Stanley Institutional Fund, Inc.
Annual Report — December 31, 2018
Financial Highlights
Global Opportunity Portfolio
| | | Class IS | |
| | | Year Ended December 31, | |
Selected Per Share Data and Ratios | | 2018 | | 2017 | | 2016(1) | | 2015 | | 2014 | |
Net Asset Value, Beginning of Period | | $ | 23.00 | | | $ | 15.44 | | | $ | 16.38 | | | $ | 13.99 | | | $ | 13.65 | | |
Income (Loss) from Investment Operations: | |
Net Investment Loss(2) | | | (0.00 | )(3) | | | (0.05 | ) | | | (0.06 | ) | | | (0.05 | ) | | | (0.06 | ) | |
Net Realized and Unrealized Gain (Loss) | | | (1.30 | ) | | | 7.70 | | | | 0.20 | | | | 2.65 | | | | 1.27 | | |
Total from Investment Operations | | | (1.30 | ) | | | 7.65 | | | | 0.14 | | | | 2.60 | | | | 1.21 | | |
Distributions from and/or in Excess of: | |
Net Realized Gain | | | (0.17 | ) | | | (0.09 | ) | | | (1.08 | ) | | | (0.21 | ) | | | (0.87 | ) | |
Net Asset Value, End of Period | | $ | 21.53 | | | $ | 23.00 | | | $ | 15.44 | | | $ | 16.38 | | | $ | 13.99 | | |
Total Return(4) | | | (5.78 | )% | | | 49.54 | % | | | 1.11 | % | | | 18.64 | % | | | 8.96 | % | |
Ratios and Supplemental Data: | |
Net Assets, End of Period (Thousands) | | $ | 2,156 | | | $ | 1,650 | | | $ | 23 | | | $ | 804 | | | $ | 11 | | |
Ratio of Expenses to Average Net Assets(8) | | | 0.88 | %(5)(7) | | | 0.71 | %(5) | | | 0.71 | %(5) | | | 0.77 | %(5)(6) | | | 1.17 | %(5) | |
Ratio of Net Investment Loss to Average Net Assets(8) | | | (0.02 | )%(5) | | | (0.23 | )%(5) | | | (0.41 | )%(5) | | | (0.28 | )%(5) | | | (0.42 | )%(5) | |
Ratio of Rebate from Morgan Stanley Affiliates to Average Net Assets | | | 0.01 | % | | | 0.01 | % | | | 0.01 | % | | | 0.01 | % | | | 0.01 | % | |
Portfolio Turnover Rate | | | 28 | % | | | 30 | % | | | 37 | % | | | 115 | % | | | 29 | % | |
(8) Supplemental Information on the Ratios to Average Net Assets: | |
Ratios Before Expense Limitation: | |
Expenses to Average Net Assets | | | N/A | | | | 1.24 | % | | | 3.82 | % | | | 3.56 | % | | | 19.50 | % | |
Net Investment Loss to Average Net Assets | | | N/A | | | | (0.76 | )% | | | (3.52 | )% | | | (3.07 | )% | | | (18.75 | )% | |
(1) Reflects prior period Custodian out-of-pocket expenses that were reimbursed in September 2016. The amount of the reimbursement was immaterial on a per share basis and did not impact the total return of Class IS shares. The Ratio of Expenses to Average Net Assets and the Ratio of Net Investment Loss to Average Net Assets would be unchanged as the reimbursement of Custodian fees was offset against expense waivers/reimbursements with no impact to net expenses or net investment loss.
(2) Per share amount is based on average shares outstanding.
(3) Amount is less than $0.005 per share.
(4) Calculated based on the net asset value as of the last business day of the period.
(5) The Ratios of Expenses and Net Investment Loss reflect the rebate of certain Fund expenses in connection with the investments in Morgan Stanley affiliates during the period. The effect of the rebate on the ratios is disclosed in the above table as "Ratio of Rebate from Morgan Stanley Affiliates to Average Net Assets."
(6) Effective December 7, 2015, the Adviser has agreed to limit the ratio of expenses to average net assets to the maximum ratio of 0.72% for Class IS shares. Prior to December 7, 2015, the maximum ratio was 1.03% for Class IS shares. Prior to January 23, 2015, the maximum ratio was 1.18% for Class IS shares.
(7) Effective January 1, 2018, the Adviser has agreed to limit the ratio of expenses to average net assets to the maximum ratio of 0.95% for Class IS shares. Prior to January 1, 2018, the maximum ratio was 0.72% for Class IS shares.
The accompanying notes are an integral part of the financial statements.
18
Morgan Stanley Institutional Fund, Inc.
Annual Report — December 31, 2018
Financial Highlights
Global Opportunity Portfolio
| | | Class IR | |
Selected Per Share Data and Ratios | | Period from
June 15, 2018(1) to
December 31, 2018 | |
Net Asset Value, Beginning of Period | | $ | 26.67 | | |
Loss from Investment Operations: | |
Net Investment Loss(2) | | | (0.06 | ) | |
Net Realized and Unrealized Loss | | | (4.88 | ) | |
Total from Investment Operations | | | (4.94 | ) | |
Distributions from and/or in Excess of: | |
Net Realized Gain | | | (0.17 | ) | |
Net Asset Value, End of Period | | $ | 21.56 | | |
Total Return(3) | | | (18.63 | )%(5) | |
Ratios and Supplemental Data: | |
Net Assets, End of Period, (Thousands) | | $ | 54,284 | | |
Ratio of Expenses to Average Net Assets | | | 0.88 | %(4)(6) | |
Ratio of Net Investment Loss to Average Net Assets | | | (0.46 | )%(4)(6) | |
Ratio of Rebate from Morgan Stanley Affiliates to Average Net Assets | | | 0.01 | %(6) | |
Portfolio Turnover Rate | | | 28 | % | |
(1) Commencement of Offering.
(2) Per share amount is based on average shares outstanding.
(3) Calculated based on the net asset value as of the last business day of the period.
(4) The Ratios of Expenses and Net Investment Loss reflect the rebate of certain Fund expenses in connection with the investments in Morgan Stanley affiliates during the period. The effect of the rebate on the ratios is disclosed in the above table as "Ratio of Rebate from Morgan Stanley Affiliates to Average Net Assets."
(5) Not annualized.
(6) Annualized.
The accompanying notes are an integral part of the financial statements.
19
Morgan Stanley Institutional Fund, Inc.
Annual Report — December 31, 2018
Notes to Financial Statements
Morgan Stanley Institutional Fund, Inc. (the "Company") is registered under the Investment Company Act of 1940, as amended (the "Act"), as an open-end management investment company. The Company is comprised of thirty separate, active, diversified and non-diversified funds (individually referred to as a "Fund", collectively as the "Funds"). The Company applies investment company accounting and reporting guidance.
The accompanying financial statements relate to the Global Opportunity Portfolio. The Fund seeks long-term capital appreciation.
The Fund offers six classes of shares — Class I, Class A, Class L, Class C, Class IS, and Class IR. On April 30, 2015, the Fund suspended offering of Class L shares. Existing Class L shareholders may invest through reinvestment of dividends and distributions. On June 15, 2018, the Fund commenced offering Class IR shares.
A. Significant Accounting Policies: The following significant accounting policies are in conformity with U.S. generally accepted accounting principles ("GAAP"). Such policies are consistently followed by the Company in the preparation of its financial statements. GAAP may require management to make estimates and assumptions that affect the reported amounts and disclosures in the financial statements. Actual results may differ from those estimates.
In August 2018, the Financial Accounting Standards Board ("FASB") issued Accounting Standards Update ("ASU") 2018-13, Fair Value Measurement (Topic 820) — Disclosures Framework — Changes to Disclosure Requirements of Fair Value Measurement ("ASU 2018-13") which introduces new fair value disclosure requirements as well as eliminates and modifies certain existing fair value disclosure requirements. ASU 2018-13 would be effective for fiscal years beginning after December 15, 2019 and for interim periods within those fiscal years; however, management has elected to early adopt ASU 2018-13 effective with the current reporting period as permitted by the standard. The impact of the Fund's adoption was limited to changes in the Fund's financial statement disclosures regarding fair value, primarily those disclosures related to transfers between levels of the fair value hierarchy and disclosure of the range and weighted average used to develop significant unobservable inputs for Level 3 fair value measurements, when applicable.
1. Security Valuation: (1) An equity portfolio security listed or traded on an exchange is valued at its latest reported sales price (or at the exchange official closing price if such exchange reports an official closing price), and if there were no sales on a given day and if there is no official exchange closing price for that day, the security is valued at the mean between the last reported bid and asked prices if such bid and asked prices are available on the relevant exchanges. Listed equity securities not traded on the valuation date with no reported bid and asked prices available on the exchange are valued at the mean between the current bid and asked prices obtained from one or more reputable brokers or dealers. In cases where a security is traded on more than one exchange, the security is valued on the exchange designated as the primary market; (2) all other equity portfolio securities for which over-the-counter ("OTC") market quotations are readily available are valued at the latest reported sales price (or at the market official closing price if such market reports an official closing price), and if there was no trading in the security on a given day and if there is no official closing price from relevant markets for that day, the security is valued at the mean between the last reported bid and asked prices if such bid and asked prices are available on the relevant markets. An unlisted equity security that does not trade on the valuation date and for which bid and asked prices from the relevant markets are unavailable is valued at the mean between the current bid and asked prices obtained from one or more reputable brokers or dealers; (3) certain portfolio securities may be valued by an outside pricing service/vendor approved by the Company's Board of Directors (the "Directors"). The pricing service/vendor may employ a pricing model that takes into account, among other things, bids, yield spreads and/or other market data and specific security characteristics. Alternatively, if a valuation is not available from an outside pricing service/vendor, and the security trades on an exchange, the security may be valued at its latest reported sale price (or at the exchange official closing price if such exchange reports an official closing price), prior to the time when assets are valued. If there are no sales on a given day and if there is no official exchange closing price for that day, the security is valued at the mean between the last reported bid and asked prices if such bid and asked prices are available in the relevant exchanges; (4) listed options are valued at the last reported sales price on the
20
Morgan Stanley Institutional Fund, Inc.
Annual Report — December 31, 2018
Notes to Financial Statements (cont'd)
exchange on which they are listed (or at the exchange official closing price if such exchange reports an official closing price). If an official closing price or last reported sales price is unavailable, the listed option should be fair valued at the mean between its latest bid and ask prices. Unlisted options are valued at the mean between their latest bid and ask prices from a broker/dealer or valued by a pricing service/vendor; (5) when market quotations are not readily available, including circumstances under which Morgan Stanley Investment Management Inc. (the "Adviser") determines that the closing price, last sale price or the mean between the last reported bid and asked prices are not reflective of a security's market value, portfolio securities are valued at their fair value as determined in good faith under procedures established by and under the general supervision of the Directors. Occasionally, developments affecting the closing prices of securities and other assets may occur between the times at which valuations of such securities are determined (that is, close of the foreign market on which the securities trade) and the close of business of the New York Stock Exchange ("NYSE"). If developments occur during such periods that are expected to materially affect the value of such securities, such valuations may be adjusted to reflect the estimated fair value of such securities as of the close of the NYSE, as determined in good faith by the Directors or by the Adviser using a pricing service and/or procedures approved by the Directors; (6) quotations of foreign portfolio securities, other assets and liabilities and forward contracts stated in foreign currency are translated into U.S. dollar equivalents at the prevailing market rates prior to the close of the NYSE; and (7) investments in mutual funds, including the Morgan Stanley Institutional Liquidity Funds, are valued at the net asset value ("NAV") as of the close of each business day.
The Directors have responsibility for determining in good faith the fair value of the investments, and the Directors may appoint others, such as the Company's Adviser or a valuation committee, to assist the Directors in determining fair value and to make the actual calculations pursuant to the fair valuation methodologies previously approved by the Directors. Under procedures approved by the Directors, the Company's Adviser has formed a Valuation Committee whose members are approved by the Directors. The Valuation Committee provides administration and oversight of the Company's
valuation policies and procedures, which are reviewed at least annually by the Directors. These procedures allow the Company to utilize independent pricing services, quotations from securities and financial instrument dealers and other market sources to determine fair value.
2. Fair Value Measurement: FASB Accounting Standards CodificationTM ("ASC") 820, "Fair Value Measurement" ("ASC 820"), defines fair value as the value that the Fund would receive to sell an investment or pay to transfer a liability in a timely transaction with an independent buyer in the principal market, or in the absence of a principal market, the most advantageous market for the investment or liability. ASC 820 establishes a three-tier hierarchy to distinguish between (1) inputs that reflect the assumptions market participants would use in valuing an asset or liability developed based on market data obtained from sources independent of the reporting entity (observable inputs) and (2) inputs that reflect the reporting entity's own assumptions about the assumptions market participants would use in valuing an asset or liability developed based on the best information available in the circumstances (unobservable inputs) and to establish classification of fair value measurements for disclosure purposes. Various inputs are used in determining the value of the Fund's investments. The inputs are summarized in the three broad levels listed below:
• Level 1 – unadjusted quoted prices in active markets for identical investments
• Level 2 – other significant observable inputs (including quoted prices for similar investments, interest rates, prepayment speeds, credit risk, etc.)
• Level 3 – significant unobservable inputs including the Fund's own assumptions in determining the fair value of investments. Factors considered in making this determination may include, but are not limited to, information obtained by contacting the issuer, analysts, or the appropriate stock exchange (for exchange-traded securities), analysis of the issuer's financial statements or other available documents and, if necessary, available information concerning other securities in similar circumstances
21
Morgan Stanley Institutional Fund, Inc.
Annual Report — December 31, 2018
Notes to Financial Statements (cont'd)
The inputs or methodology used for valuing securities are not necessarily an indication of the risk associated with investing in those securities and the determination of the significance of a particular input to the fair value measurement in its entirety requires judgment and considers factors specific to each security.
The following is a summary of the inputs used to value the Fund's investments as of December 31, 2018:
Investment Type | | Level 1
Unadjusted
quoted
prices
(000) | | Level 2
Other
significant
observable
inputs
(000) | | Level 3
Significant
unobservable
inputs
(000) | | Total
(000) | |
Assets: | |
Common Stocks | |
Banks | | $ | — | | | $ | 123,040 | | | $ | — | | | $ | 123,040 | | |
Beverages | | | — | | | | 99,570 | | | | — | | | | 99,570 | | |
Building Products | | | 1,646 | | | | — | | | | — | | | | 1,646 | | |
Construction Materials | | | 105,431 | | | | — | | | | — | | | | 105,431 | | |
Diversified Consumer
Services | | | 128,143 | | | | — | | | | — | | | | 128,143 | | |
Electronic Equipment,
Instruments &
Components | | | — | | | | 47,727 | | | | — | | | | 47,727 | | |
Food Products | | | — | | | | 113,799 | | | | — | | | | 113,799 | | |
Health Care
Technology | | | — | | | | — | | | | 11,394 | | | | 11,394 | | |
Hotels, Restaurants &
Leisure | | | 36,303 | | | | 17,467 | | | | — | | | | 53,770 | | |
Household Products | | | — | | | | 65,101 | | | | — | | | | 65,101 | | |
Information
Technology
Services | | | 360,099 | | | | — | | | | — | | | | 360,099 | | |
Interactive Media &
Services | | | 263,892 | | | | 22,779 | | | | — | | | | 286,671 | | |
Internet & Direct
Marketing Retail | | | 366,410 | | | | 16,829 | | | | — | | | | 383,239 | | |
Professional Services | | | — | | | | 15,780 | | | | — | | | | 15,780 | | |
Road & Rail | | | — | | | | 104,087 | | | | — | | | | 104,087 | | |
Software | | | 219,901 | | | | — | | | | — | | | | 219,901 | | |
Textiles, Apparel &
Luxury Goods | | | — | | | | 168,869 | | | | — | | | | 168,869 | | |
Total Common Stocks | | | 1,481,825 | | | | 795,048 | | | | 11,394 | | | | 2,288,267 | | |
Investment Type | | Level 1
Unadjusted
quoted
prices
(000) | | Level 2
Other
significant
observable
inputs
(000) | | Level 3
Significant
unobservable
inputs
(000) | | Total
(000) | |
Preferred Stocks | |
Electronic Equipment,
Instruments &
Components | | $ | — | | | $ | — | | | $ | 3,721 | | | $ | 3,721 | | |
Internet & Direct
Marketing Retail | | | — | | | | — | | | | 12,514 | | | | 12,514 | | |
Total Preferred
Stocks | | | — | | | | — | | | | 16,235 | | | | 16,235 | | |
Call Options
Purchased | | | — | | | | 1,518 | | | | — | | | | 1,518 | | |
Short-Term
Investment | |
Investment Company | | | 122,351 | | | | — | | | | — | | | | 122,351 | | |
Total Assets | | $ | 1,604,176 | | | $ | 796,566 | | | $ | 27,629 | | | $ | 2,428,371 | | |
Transfers between investment levels may occur as the markets fluctuate and/or the availability of data used in an investment's valuation changes.
Following is a reconciliation of investments in which significant unobservable inputs (Level 3) were used in determining fair value:
| | | Common
Stock
(000) | | Preferred
Stocks
(000) | |
Beginning Balance | | $ | — | | | $ | 13,798 | | |
Purchases | | | 11,376 | | | | — | | |
Sales | | | — | | | | — | | |
Amortization of discount | | | — | | | | — | | |
Transfers in | | | — | | | | — | | |
Transfers out | | | — | | | | — | | |
Corporate actions | | | — | | | | — | | |
Change in unrealized appreciation
(depreciation) | | | 18 | | | | 2,437 | | |
Realized gains (losses) | | | — | | | | — | | |
Ending Balance | | $ | 11,394 | | | $ | 16,235 | | |
Net change in unrealized appreciation
(depreciation) from investments
still held as of December 31, 2018 | | $ | 18 | | | $ | 2,437 | | |
22
Morgan Stanley Institutional Fund, Inc.
Annual Report — December 31, 2018
Notes to Financial Statements (cont'd)
The following table presents additional information about valuation techniques and inputs used for investments that are measured at fair value and categorized within Level 3 as of December 31, 2018. Various valuation techniques were used in the valuation of certain investments and weighted based on the level of significance. The Fund calculated the weighted averages of the unobservable inputs relative to each investment's fair value as of December 31, 2018.
| | | Fair Value at
December 31, 2018
(000) | | Valuation
Technique | | Unobservable
Input | | Amount or Range/
Weighted Average | | Impact to
Valuation from an
Increase in Input†† | |
Common Stock | | $ | 11,394 | | | Market Transaction
Method | | Precedent Transaction | | $ | 378.16 | | | Increase | |
| | | | | Discounted Cash Flow | | Weighted Average
Cost of Capital | | | 16.50 | % | | Decrease | |
| | | | | | | Perpetual Growth Rate | | | 3.50 | % | | Increase | |
| | | | | Market Comparable
Companies | | Enterprise Value/
Revenue | | | 1.3 | x | | Increase | |
| | | | | | | Discount for Lack of
Marketability | | | 15.00 | % | | Decrease | |
Preferred Stocks | | $ | 16,235 | | | Market Transaction
Method | | Precedent Transaction | | $ | 27.00–$48.77/$41.73 | | | Increase | |
| | | | | Discounted Cash Flow | | Weighted Average
Cost of Capital | | | 14.0%–27.0%/17.52% | | | Decrease | |
| | | | | | | Perpetual Growth Rate | | | 3.0%–4.0%/3.50% | | | Increase | |
| | | | | Market Comparable
Companies | | Enterprise Value/
Revenue | | | 1.1x–10.5x/5.43x | | | Increase | |
| | | | | | | Discount for Lack of
Marketability | | | 9.0%–20.0%/13.27% | | | Decrease | |
†† Represents the expected directional change in the fair value of the Level 3 investments that would result from an increase in the corresponding input. A decrease to the unobservable input would have the opposite effect. Significant changes in these inputs could result in significantly higher or lower fair value measurements.
3. Foreign Currency Translation and Foreign Investments: The books and records of the Fund are maintained in U.S. dollars. Foreign currency amounts are translated into U.S. dollars as follows:
– investments, other assets and liabilities at the prevailing rate of exchange on the valuation date;
– investment transactions and investment income at the prevailing rates of exchange on the dates of such transactions.
Although the net assets of the Fund are presented at the foreign exchange rates and market values at the close of the period, the Fund does not isolate that portion of the results of operations arising as a result of changes in the foreign exchange rates from the fluctuations arising from changes in the market prices of securities held at period end. Similarly, the Fund does not isolate the effect of changes in foreign exchange rates from the fluctuations arising from changes in the market prices of securities sold during the period. Accordingly, realized and unrealized foreign currency gains (losses) on investments in securities are included in the reported net realized and unrealized gains (losses) on investment
transactions and balances. However, pursuant to U.S. federal income tax regulations, gains and losses from certain foreign currency transactions and the foreign currency portion of gains and losses realized on sales and maturities of foreign denominated debt securities are treated as ordinary income for U.S. federal income tax purposes.
Net realized gains (losses) on foreign currency transactions represent net foreign exchange gains (losses) from foreign currency forward exchange contracts, disposition of foreign currencies, currency gains (losses) realized between the trade and settlement dates on securities transactions, and the difference between the amount of investment income and foreign withholding taxes recorded on the Fund's books and the U.S. dollar equivalent amounts actually received or paid. Net unrealized currency gains (losses) from valuing foreign currency denominated assets and liabilities at period end exchange rates are reflected as a component of unrealized appreciation (depreciation) in the Statement of Assets and Liabilities. The change in unrealized currency gains (losses) on foreign currency translations for the period is reflected in the Statement of Operations.
23
Morgan Stanley Institutional Fund, Inc.
Annual Report — December 31, 2018
Notes to Financial Statements (cont'd)
Foreign security and currency transactions may involve certain considerations and risks not typically associated with those of U.S. dollar denominated transactions as a result of, among other factors, fluctuations of exchange rates in relation to the U.S. dollar, the possibility of lower levels of governmental supervision and regulation of foreign securities markets and the possibility of political or economic instability.
Governmental approval for foreign investments may be required in advance of making an investment under certain circumstances in some countries, and the extent of foreign investments in domestic companies may be subject to limitation in other countries. Foreign ownership limitations also may be imposed by the charters of individual companies to prevent, among other concerns, violations of foreign investment limitations. As a result, an additional class of shares (identified as "Foreign" in the Portfolio of Investments) may be created and offered for investment. The "local" and "foreign shares" market values may differ. In the absence of trading of the foreign shares in such markets, the Fund values the foreign shares at the closing exchange price of the local shares.
4. Derivatives: The Fund may, but is not required to, use derivative instruments for a variety of purposes, including hedging, risk management, portfolio management or to earn income. Derivatives are financial instruments whose value is based, in part, on the value of an underlying asset, interest rate, index or financial instrument. Prevailing interest rates and volatility levels, among other things, also affect the value of derivative instruments. A derivative instrument often has risks similar to its underlying asset and may have additional risks, including imperfect correlation between the value of the derivative and the underlying asset, risks of default by the counterparty to certain transactions, magnification of losses incurred due to changes in the market value of the securities, instruments, indices or interest rates to which the derivative instrument relates, risks that the transactions may not be liquid and risks arising from margin requirements. The use of derivatives involves risks that are different from, and possibly greater than, the risks associated with other portfolio investments. Derivatives may involve the use of highly specialized instruments that require investment techniques and risk analyses different from those associated with other portfolio investments. All of the Fund's holdings, including derivative instruments, are marked-to-market each day
with the change in value reflected in unrealized appreciation (depreciation). Upon disposition, a realized gain or loss is recognized.
Certain derivative transactions may give rise to a form of leverage. Leverage magnifies the potential for gain and the risk of loss. Leverage associated with derivative transactions may cause the Fund to liquidate portfolio positions when it may not be advantageous to do so to satisfy its obligations or to meet earmarking or segregation requirements, pursuant to applicable Securities and Exchange Commission ("SEC") rules and regulations, or may cause the Fund to be more volatile than if the Fund had not been leveraged. Although the Adviser seeks to use derivatives to further the Fund's investment objectives, there is no assurance that the use of derivatives will achieve this result.
Following is a description of the derivative instruments and techniques that the Fund used during the period and their associated risks:
Options: With respect to options, the Fund is subject to equity risk, interest rate risk and foreign currency exchange risk in the normal course of pursuing its investment objectives. If the Fund buys an option, it buys a legal contract giving it the right to buy or sell a specific amount of the underlying instrument or foreign currency, or futures contract on the underlying instrument or foreign currency, at an agreed-upon price during a period of time or on a specified date typically in exchange for a premium paid by the Fund. The Fund may purchase and/or sell put and call options. Purchasing call options tends to increase the Fund's exposure to the underlying (or similar) instrument. Purchasing put options tends to decrease the Fund's exposure to the underlying (or similar) instrument. When entering into purchased option contracts, the Fund bears the risk of interest or exchange rates or securities prices moving unexpectedly, in which case, the Fund may not achieve the anticipated benefits of the purchased option contracts; however the risk of loss is limited to the premium paid. Purchased options are reported as part of "Total Investments in Securities" in the Statement of Assets and Liabilities. Premiums paid for purchasing options which expired are treated as realized losses. If the Fund sells an option, it sells to another party the right to buy from or sell to the Fund a specific amount of the underlying instrument or foreign currency, or futures contract
24
Morgan Stanley Institutional Fund, Inc.
Annual Report — December 31, 2018
Notes to Financial Statements (cont'd)
on the underlying instrument or foreign currency, at an agreed-upon price during a period of time or on a specified date typically in exchange for a premium received by the Fund. When options are purchased OTC, the Fund bears the risk that the counterparty that wrote the option will be unable or unwilling to perform its obligations under the option contract. Options may also be illiquid and the Fund may have difficulty closing out its position. A decision as to whether, when and how to use options involves the exercise of skill and judgment and even a well-conceived option transaction may be unsuccessful because of market behavior or unexpected events. The prices of options can be highly volatile and the use of options can lower total returns.
FASB ASC 815, "Derivatives and Hedging" ("ASC 815"), is intended to improve financial reporting about derivative instruments by requiring enhanced disclosures to enable investors to better understand how and why the Fund uses derivative instruments, how these derivative instruments are accounted for and their effects on the Fund's financial position and results of operations.
The following table sets forth the fair value of the Fund's derivative contracts by primary risk exposure as of December 31, 2018:
| | | Asset Derivatives
Statement of Assets and
Liabilities Location | | Primary Risk
Exposure | | Value
(000) | |
Purchased Options
| | Investments, at Value
(Purchased Options) | | Currency Risk | | $ | 1,518 | (a) | |
(a) Amounts are included in Investments in Securities in the Statement of Assets and Liabilities.
The following tables set forth by primary risk exposure the Fund's realized gains (losses) and change in unrealized appreciation (depreciation) by type of derivative contract for the year ended December 31, 2018 in accordance with ASC 815:
Realized Gain (Loss) | |
Primary Risk Exposure | | Derivative Type | | Value
(000) | |
Currency Risk | | Investments
(Purchased Options) | | $ | (2,988 | )(b) | |
(b) Amounts are included in Investments Sold in the Statement of Operations.
Change in Unrealized Appreciation (Depreciation) | |
Primary Risk Exposure | | Derivative Type | | Value
(000) | |
Currency Risk | | Investments
(Purchased Options) | | $ | (3,483 | )(c) | |
(c) Amounts are included in Investments in the Statement of Operations.
At December 31, 2018, the Fund's derivative assets and liabilities are as follows:
Gross Amounts of Assets and Liabilities
Presented in the Statement of Assets and Liabilities | |
Derivatives | | Assets(d)
(000) | | Liabilities(d)
(000) | |
Purchased Options | | $ | 1,518 | (a) | | $ | — | | |
(a) Amounts are included in Investments in Securities in the Statement of Assets and Liabilities.
(d) Absent an event of default or early termination, OTC derivative assets and liabilities are presented gross and not offset in the Statement of Assets and Liabilities.
The Fund typically enters into International Swaps and Derivatives Association, Inc. Master Agreements ("ISDA Master Agreements") or similar master agreements (collectively, "Master Agreements") with its contract counterparties for certain OTC derivatives in order to, among other things, reduce its credit risk to counterparties. ISDA Master Agreements include provisions for general obligations, representations, collateral and events of default or termination. Under an ISDA Master Agreement, the Fund typically may offset with the counterparty certain OTC derivative financial instruments' payables and/or receivables with collateral held and/or posted and create one single net payment (close-out netting) in the event of default, termination and/or potential deterioration in the credit quality of the counterparty. Various Master Agreements govern the terms of certain transactions with counterparties, including transactions such as swap, forward, repurchase and reverse repurchase agreements. These Master Agreements typically attempt to reduce the counterparty risk associated with such transactions by specifying credit protection mechanisms and providing standardization that improves legal certainty. Cross-termination provisions under Master Agreements typically provide that a default in connection with one transaction between the Fund and a counterparty gives the non-defaulting party the right to terminate any other transactions in place with the defaulting party to create one single net payment due to/due from the defaulting party and may be a feature in certain Master Agreements. In the event the Fund exercises its right to terminate a Master Agreement after a counterparty experiences a termination event as defined in the Master Agreement, the return of collateral with market value in excess of the Fund's net liability may be delayed or denied.
25
Morgan Stanley Institutional Fund, Inc.
Annual Report — December 31, 2018
Notes to Financial Statements (cont'd)
The following table presents derivative financial instruments that are subject to enforceable netting arrangements as of December 31, 2018:
Gross Amounts Not Offset in the Statement of Assets and Liabilities | |
Counterparty | | Gross Asset
Derivatives
Presented in
the Statement
of Assets and
Liabilities
(000) | | Financial
Instrument
(000) | | Collateral
Received(e)
(000) | | Net Amount
(not less
than $0)
(000) | |
Royal Bank of Scotland | | $ | 1,518 | (a) | | $ | — | | | $ | (1,518 | ) | | $ | 0 | | |
(a) Amounts are included in Investments in Securities in the Statement of Assets and Liabilities.
(e) In some instances, the actual collateral received may be more than the amount shown here due to overcollateralization.
For the year ended December 31, 2018, the approximate average monthly amount outstanding for each derivative type is as follows:
Purchased Options: | |
Average monthly notional amount | | | 1,341,750,000 | | |
5. Structured Investments: The Fund invested a portion of its assets in structured investments. A structured investment is a derivative security designed to offer a return linked to a particular underlying security, currency, commodity or market. Structured investments may come in various forms including notes (such as exchange-traded notes), warrants and options to purchase securities. The Fund will typically use structured investments to gain exposure to a permitted underlying security, currency, commodity or market when direct access to a market is limited or inefficient from a tax or cost standpoint. There can be no assurance that structured investments will trade at the same price or have the same value as the underlying security, currency, commodity or market. Investments in structured investments involve risks including issuer risk, counterparty risk and market risk. Holders of structured investments bear risks of the underlying investment and are subject to issuer or counterparty risk because the Fund is relying on the creditworthiness of such issuer or counterparty and has no rights with respect to the underlying investment. Certain structured investments may be thinly traded or have a limited trading market and may have the effect of increasing the Fund's illiquidity to the extent that the Fund, at a particular time, may be unable to find qualified buyers for these securities.
6. Restricted Securities: The Fund invests in unregistered or otherwise restricted securities. The term "restricted securities" refers to securities that are unregistered or are held by control persons of the issuer and securities that are subject to contractual restrictions on their resale. As a result, restricted securities may be more difficult to value and the Fund may have difficulty disposing of such assets either in a timely manner or for a reasonable price. In order to dispose of an unregistered security, the Fund, where it has contractual rights to do so, may have to cause such security to be registered. A considerable period may elapse between the time the decision is made to sell the security and the time the security is registered so that the Fund can sell it. Contractual restrictions on the resale of securities vary in length and scope and are generally the result of a negotiation between the issuer and the acquirer of the securities. The Fund would, in either case, bear market risks during that period. Restricted securities are identified in the Portfolio of Investments.
7. Indemnifications: The Company enters into contracts that contain a variety of indemnifications. The Company's maximum exposure under these arrangements is unknown. However, the Company has not had prior claims or losses pursuant to these contracts and expects the risk of loss to be remote.
8. Dividends and Distributions to Shareholders: Dividend income and distributions to shareholders are recorded on the ex-dividend date. Dividends from net investment income, if any, are declared and paid annually. Net realized capital gains, if any, are distributed at least annually.
9. Security Transactions, Income and Expenses: Security transactions are accounted for on the trade date (date the order to buy or sell is executed). Realized gains and losses on the sale of investment securities are determined on the specific identified cost method. Dividend income and other distributions are recorded on the ex-dividend date (except for certain foreign dividends which may be recorded as soon as the Fund is informed of such dividends) net of applicable withholding taxes. Non-cash dividends received in the form of stock, if any, are recognized on the ex-dividend date and recorded as non-cash dividend income at fair value. Interest income is recognized on the accrual basis except where collection is in doubt. Discounts are accreted and premiums are
26
Morgan Stanley Institutional Fund, Inc.
Annual Report — December 31, 2018
Notes to Financial Statements (cont'd)
amortized over the life of the respective securities. Most expenses of the Company can be directly attributed to a particular Fund. Expenses which cannot be directly attributed are apportioned among the Funds based upon relative net assets or other appropriate methods. Income, expenses (other than class specific expenses — distribution and shareholder services, transfer agency and sub transfer agency fees) and realized and unrealized gains or losses are allocated to each class of shares based upon their relative net assets.
B. Advisory Fees: The Adviser, a wholly-owned subsidiary of Morgan Stanley, provides the Fund with advisory services under the terms of an Investment Advisory Agreement, paid quarterly, at the annual rate based on the daily net assets as follows:
First $750
million | | Next $750
million | | Over $1.5
billion | |
| | 0.80 | % | | | 0.75 | % | | | 0.70 | % | |
For the year ended December 31, 2018, the advisory fee rate (net of rebate) was equivalent to an annual effective rate of 0.73% of the Fund's average daily net assets.
The Adviser has agreed to reduce its advisory fee and/or reimburse the Fund so that total annual portfolio operating expenses, excluding certain investment related expenses, taxes, interest and other extraordinary expenses (including litigation), will not exceed 1.00% for Class I shares, 1.35% for Class A shares, 1.40% for Class L shares, 2.10% for Class C shares, 0.95% for Class IS shares and 0.95% for Class IR shares. The fee waivers and/or expense reimbursements will continue for at least one year from the date of the Fund's prospectus or until such time as the Directors act to discontinue all or a portion of such waivers and/or reimbursements when they deem such action is appropriate. This arrangement had no effect for the year ended December 31, 2018.
C. Administration Fees: The Adviser also serves as Administrator to the Company and provides administrative services pursuant to an Administration Agreement for an annual fee, accrued daily and paid monthly, of 0.08% of the Fund's average daily net assets.
Under a Sub-Administration Agreement between the Administrator and State Street Bank and Trust Company ("State Street"), State Street provides certain administrative services to the Company. For such services, the Administrator pays State Street a portion of the fee the Administrator receives from the Fund.
D. Distribution and Shareholder Services Fees: Morgan Stanley Distribution, Inc. ("MSDI" or the "Distributor"), a wholly-owned subsidiary of the Adviser and an indirect subsidiary of Morgan Stanley, serves as the Company's Distributor of Fund shares pursuant to a Distribution Agreement. The Company has adopted a Shareholder Services Plan with respect to Class A shares pursuant to Rule 12b-1 under the Act. Under the Shareholder Services Plan, the Fund pays the Distributor a shareholder services fee, accrued daily and paid monthly, at an annual rate of 0.25% of the Fund's average daily net assets attributable to Class A shares.
The Company has adopted a Distribution and Shareholder Services Plan with respect to Class L shares pursuant to Rule 12b-1 under the Act. Under the Distribution and Shareholder Services Plan, the Fund pays the Distributor a distribution fee, accrued daily and paid monthly, at an annual rate of 0.50% and a shareholder services fee, accrued daily and paid monthly, at an annual rate of 0.25% of the Fund's average daily net assets attributable to Class L shares. The Distributor has agreed to waive for at least one year from the date of the Fund's prospectus, the 12b-1 fees on Class L shares of the Fund to the extent it exceeds 0.30% of the average daily net assets of such shares on an annualized basis. For the year ended December 31, 2018, this waiver amounted to approximately $183,000.
The Company has adopted a Distribution and Shareholder Services Plan with respect to Class C shares pursuant to Rule 12b-1 under the Act. Under the Distribution and Shareholder Services Plan, the Fund pays the Distributor a distribution fee, accrued daily and paid monthly, at an annual rate of 0.75% and a shareholder services fee, accrued daily and paid monthly, at an annual rate of 0.25% of the Fund 's average daily net assets attributable to Class C shares.
The distribution and shareholder services fees are used to support the expenses associated with servicing and maintaining accounts. The Distributor may compensate other parties for providing shareholder support services to investors who purchase Class A, Class L and Class C shares.
E. Dividend Disbursing and Transfer Agent: The Company's dividend disbursing and transfer agent is DST Asset Manager Solutions, Inc. ("DST"). Pursuant to a Transfer Agency Agreement, the Company pays DST a fee based on the number of classes, accounts and transactions relating to the Funds of the Company.
27
Morgan Stanley Institutional Fund, Inc.
Annual Report — December 31, 2018
Notes to Financial Statements (cont'd)
F. Custodian Fees: State Street (the "Custodian") also serves as Custodian for the Company in accordance with a Custodian Agreement. The Custodian holds cash, securities and other assets of the Company as required by the Act. Custody fees are payable monthly based on assets held in custody, investment purchases and sales activity and account maintenance fees, plus reimbursement for certain out-of-pocket expenses.
G. Security Transactions and Transactions with Affiliates: For the year ended December 31, 2018, purchases and sales of investment securities for the Fund, other than long-term U.S. Government securities and short-term investments were approximately $1,537,063,000 and $666,791,000, respectively. There were no purchases and sales of long-term U.S. Government securities for the year ended December 31, 2018.
The Fund invests in the Institutional Class of the Morgan Stanley Institutional Liquidity Funds — Treasury Securities Portfolio (the "Liquidity Funds"), an open-end management investment company managed by the Adviser. Advisory fees paid by the Fund are reduced by an amount equal to its pro-rata share of the advisory and administration fees paid by the Liquidity Funds. For the year ended December 31, 2018, advisory fees paid were reduced by approximately $297,000 relating to the Fund's investment in the Liquidity Funds.
A summary of the Fund's transactions in shares of affiliated investments during the year ended December 31, 2018 is as follows:
Affiliated
Investment
Company | | Value
December 31,
2017
(000) | | Purchases
at Cost
(000) | | Proceeds
from Sales
(000) | | Dividend
Income
(000) | |
Liquidity Funds | | $ | 174,925 | | | $ | 1,020,313 | | | $ | 1,072,887 | | | $ | 2,586 | | |
Affiliated
Investment
Company (cont'd) | | Realized
Gain (Loss)
(000) | | Change in
Unrealized
Appreciation
(Depreciation)
(000) | | Value
December 31,
2018
(000) | |
Liquidity Funds | | $ | — | | | $ | — | | | $ | 122,351 | | |
During the year ended December 31, 2018, the Fund incurred approximately $1,000 in brokerage commissions with Morgan Stanley & Co. LLC, an affiliate of the Adviser/Administrator and Distributor, for portfolio transactions executed on behalf of the Fund.
The Fund is permitted to purchase and sell securities ("cross-trade") from and to other Morgan Stanley funds as well as other funds and client accounts for which the Adviser or an affiliate of the Adviser serves as investment adviser, pursuant to
procedures approved by the Directors in compliance with Rule 17a-7 under the Act (the "Rule"). Each cross-trade is executed at the current market price in compliance with provisions of the Rule. For the year ended December 31, 2018, the Fund did not engage in any cross-trade transactions.
The Fund has an unfunded Deferred Compensation Plan (the "Compensation Plan"), which allows each independent Director to defer payment of all, or a portion, of the fees he or she receives for serving on the Board of Directors. Each eligible Director generally may elect to have the deferred amounts credited with a return equal to the total return on one or more of the Morgan Stanley funds that are offered as investment options under the Compensation Plan. Appreciation/depreciation and distributions received from these investments are recorded with an offsetting increase/decrease in the deferred compensation obligation and do not affect the NAV of the Fund.
H. Federal Income Taxes: It is the Fund's intention to continue to qualify as a regulated investment company and distribute all of its taxable and tax-exempt income. Accordingly, no provision for federal income taxes is required in the financial statements.
The Fund may be subject to taxes imposed by countries in which it invests. Such taxes are generally based on income and/or capital gains earned or repatriated. Taxes are accrued based on net investment income, net realized gains and net unrealized appreciation as such income and/or gains are earned. Taxes may also be based on transactions in foreign currency and are accrued based on the value of investments denominated in such currency.
FASB ASC 740-10, "Income Taxes — Overall", sets forth a minimum threshold for financial statement recognition of the benefit of a tax position taken or expected to be taken in a tax return. Management has concluded there are no significant uncertain tax positions that would require recognition in the financial statements. If applicable, the Fund recognizes interest accrued related to unrecognized tax benefits in "Interest Expense" and penalties in "Other Expenses" in the Statement of Operations. The Fund files tax returns with the U.S. Internal Revenue Service, New York and various states. Generally, each of the tax years in the four-year period ended December 31, 2018 remains subject to examination by taxing authorities.
The tax character of distributions paid may differ from the character of distributions shown for GAAP purposes due to
28
Morgan Stanley Institutional Fund, Inc.
Annual Report — December 31, 2018
Notes to Financial Statements (cont'd)
short-term capital gains being treated as ordinary income for tax purposes. The tax character of distributions paid during fiscal years 2018 and 2017 was as follows:
2018
Distributions
Paid From: | | 2017
Distributions
Paid From: | |
Ordinary
Income
(000) | | Long-Term
Capital Gain
(000) | | Ordinary
Income
(000) | | Long-Term
Capital Gain
(000) | |
| $ | 12,718 | | | $ | 6,448 | | | $ | 7,000 | | | $ | — | | |
The amount and character of income and gains to be distributed are determined in accordance with income tax regulations which may differ from GAAP. These book/tax differences are either considered temporary or permanent in nature.
Temporary differences are attributable to differing book and tax treatments for the timing of the recognition of gains (losses) on certain investment transactions and the timing of the deductibility of certain expenses.
Permanent differences, primarily due to a net operating loss, resulted in the following reclassifications among the components of net assets at December 31, 2018:
Total
Distributable
Earnings
(000) | | Paid-in
Capital
(000) | |
| $ | 7,549 | | | $ | (7,549 | ) | |
At December 31, 2018, the Fund had no distributable earnings on a tax basis.
At December 31, 2018, the Fund had available for federal income tax purposes unused short-term capital losses of approximately $23,405,000 that do not have an expiration date.
To the extent that capital loss carryforwards are used to offset any future capital gains realized, no capital gains tax liability will be incurred by the Fund for gains realized and not distributed. To the extent that capital gains are offset, such gains will not be distributed to the shareholders.
Qualified late year losses are capital losses and specified ordinary losses, including currency losses, incurred after October 31 but within the taxable year that, if elected, are deemed to arise on the first day of the Fund's next taxable year.
For the year ended December 31, 2018, the Fund intends to defer to January 1, 2019 for U.S. federal income tax purposes the following losses:
Qualified
Late Year
Ordinary
Losses
(000) | | Post-October
Capital
Losses
(000) | |
| $ | 4,524 | | | $ | — | | |
I. Credit Facility: The Company and other Morgan Stanley funds participated in a $150,000,000 committed, unsecured revolving line of credit facility (the "Facility") with State Street. This Facility is to be used for temporary emergency purposes or funding of shareholder redemption requests. The interest rate on borrowings is based on the federal funds rate or 1 month LIBOR rate plus a spread. The Facility also has a commitment fee of 0.25% per annum based on the unused portion of the Facility. During the year ended December 31, 2018, the Fund did not have any borrowings under the Facility.
J. Other: At December 31, 2018, the Fund had record owners of 10% or greater. Investment activities of these shareholders could have a material impact on the Fund. The aggregate percentage of such owners was 29.4%.
29
Morgan Stanley Institutional Fund, Inc.
Annual Report — December 31, 2018
Report of Independent Registered Public Accounting Firm
To the Shareholders and Board of Directors of
Morgan Stanley Institutional Fund, Inc. —
Global Opportunity Portfolio
Opinion on the Financial Statements
We have audited the accompanying statement of assets and liabilities of Global Opportunity Portfolio (the "Fund") (one of the funds constituting the Morgan Stanley Institutional Fund, Inc. (the "Company")), including the portfolio of investments, as of December 31, 2018, and the related statement of operations for the year then ended, the statements of changes in net assets for each of the two years in the period then ended, the financial highlights for each of the five years in the period then ended and the related notes (collectively referred to as the "financial statements"). In our opinion, the financial statements present fairly, in all material respects, the financial position of Global Opportunity Portfolio (one of the funds constituting Morgan Stanley Institutional Fund, Inc.) at December 31, 2018, the results of its operations for the year then ended, the changes in its net assets for each of the two years in the period then ended and its financial highlights for each of the five years in the period then ended, in conformity with U.S. generally accepted accounting principles.
Basis for Opinion
These financial statements are the responsibility of the Company's management. Our responsibility is to express an opinion on the Fund's financial statements based on our audits. We are a public accounting firm registered with the Public Company Accounting Oversight Board (United States) ("PCAOB") and are required to be independent with respect to the Company in accordance with the U.S. federal securities law and the applicable rules and regulations of the Securities and Exchange Commission and the PCAOB.
We conducted our audits in accordance with the standards of the PCAOB. Those standards require that we plan and perform the audit to obtain reasonable assurance about whether the financial statements are free of material misstatement, whether due to error or fraud. The Company is not required to have, nor were we engaged to perform, an audit of the Company's internal control over financial reporting. As part of our audits, we are required to obtain an understanding of internal control over financial reporting, but not for the purpose of expressing an opinion on the effectiveness of the Company's internal control over financial reporting. Accordingly, we express no such opinion.
Our audits included performing procedures to assess the risks of material misstatement of the financial statements, whether due to error or fraud, and performing procedures that respond to those risks. Such procedures included examining, on a test basis, evidence regarding the amounts and disclosures in the financial statements. Our procedures included confirmation of securities owned as of December 31, 2018 by correspondence with the custodian and others or by other appropriate auditing procedures where replies from others were not received. Our audits also included evaluating the accounting principles used and significant estimates made by management, as well as evaluating the overall presentation of the financial statements. We believe that our audits provide a reasonable basis for our opinion.

We have served as the auditor of one or more Morgan Stanley investment companies since 2000.
Boston, Massachusetts
February 26, 2019
30
Morgan Stanley Institutional Fund, Inc.
Annual Report — December 31, 2018
Federal Tax Notice (unaudited)
For federal income tax purposes, the following information is furnished with respect to the distributions paid by the Fund during its taxable year ended December 31, 2018. For corporate shareholders, 5.12% of the dividends qualified for the dividends received deduction.
The Fund designated and paid approximately $6,448,000 as a long-term capital gain distribution.
For federal income tax purposes, the following information is furnished with respect to the Fund's earnings for its taxable year ended December 31, 2018. When distributed, certain earnings may be subject to a maximum tax rate of 15% as provided for by the Jobs and Growth Tax Relief Reconciliation Act of 2003. The Fund designated up to a maximum of approximately $78,000 as taxable at this lower rate.
In January, the Fund provides tax information to shareholders for the preceding calendar year.
31
Morgan Stanley Institutional Fund, Inc.
Annual Report — December 31, 2018
Privacy Notice (unaudited)
MORGAN STANLEY INVESTMENT MANAGEMENT INC.
AN IMPORTANT NOTICE CONCERNING OUR U.S. PRIVACY POLICY
We are required by federal law to provide you with a copy of our privacy policy annually. This policy applies to current and former individual investors in funds managed or sponsored by Morgan Stanley Investment Management Inc. ("MSIM") as well as current and former individual clients of MSIM. This policy is not applicable to partnerships, corporations, trusts or other non-individual clients or investors. Please note that we may amend this policy at any time, and will inform you of any changes as required by law.
WE RESPECT YOUR PRIVACY
We appreciate that you have provided us with your personal financial information. We strive to maintain the privacy of such information while we help you achieve your financial objectives. This Notice describes what non-public personal information we collect about you, why we collect it, when we may share it with others and how certain others may use it. It discusses the steps you may take to limit our sharing of certain information about you to affiliated companies in the Morgan Stanley family of companies ("other Morgan Stanley companies"). It also discloses how you may limit use of certain shared information for marketing purposes by other Morgan Stanley branded companies. Throughout this policy, we refer to the non-public information that personally identifies you or your accounts as "personal information."
1. WHAT PERSONAL INFORMATION DO WE COLLECT ABOUT YOU?
We obtain personal information from applications and other forms you submit to us, from your dealings with us, from consumer reporting agencies, from our Web sites and from third parties and other sources.
For example:
• We may collect information such as your name, address, e-mail address, telephone/fax numbers, assets, income and investment objectives through subscription documents, applications and other forms you submit to us.
• We may obtain information about account balances, your use of account(s) and the types of products and services you prefer to receive from us through your dealings and transactions with us and other sources.
• We may obtain information about your creditworthiness and credit history from consumer reporting agencies.
• We may collect background information from and through third-party vendors to verify representations you have made and to comply with various regulatory requirements.
• If you interact with us through our public and private Web sites, we may collect information that you provide directly through online communications (such as an e-mail address). We may also collect information about your Internet service provider, your domain name, your computer's operating system and Web browser, your use of our Web sites and your product and service preferences, through the use of "cookies." Please consult the Terms of Use of these sites for more details.
2. WHEN DO WE DISCLOSE PERSONAL INFORMATION WE COLLECT ABOUT YOU?
We may disclose personal information we collect about you to other Morgan Stanley companies and to non-affiliated third parties.
a. Information We Disclose to Other Morgan Stanley Companies.
We may disclose personal information to other Morgan Stanley companies for a variety of reasons, including to manage your account(s) effectively, to service and process your transactions, to let you know about products and services offered by us and other Morgan Stanley companies, to manage our business, and as otherwise required or permitted by law. Offers for products and services from other Morgan Stanley companies are developed under conditions designed to safeguard your personal information.
32
Morgan Stanley Institutional Fund, Inc.
Annual Report — December 31, 2018
Privacy Notice (unaudited) (cont'd)
b. Information We Disclose to Non-affiliated Third Parties.
We do not disclose personal information that we collect about you to non-affiliated third parties except to those who provide marketing services on our behalf, to financial institutions with whom we have joint marketing agreements, and as otherwise required or permitted by law. For example, we may disclose personal information to non-affiliated third parties for servicing and processing transactions, to offer our own products and services, to protect against fraud, for institutional risk control, to respond to judicial process or to perform services on our behalf. When we share personal information with a non-affiliated third party, they are required to limit their use of personal information to the particular purpose for which it was shared and they are not allowed to share personal information with others except to fulfill that limited purpose or as may be permitted or required by law.
3. HOW DO WE PROTECT THE SECURITY AND CONFIDENTIALITY OF PERSONAL INFORMATION WE COLLECT ABOUT YOU?
We maintain physical, electronic and procedural security measures to help safeguard the personal information we collect about you. We have internal policies governing the proper handling of client information. Third parties that provide support or marketing services on our behalf may also receive personal information, and we require them to adhere to confidentiality standards with respect to such information.
4. HOW CAN YOU LIMIT THE SHARING OF CERTAIN TYPES OF PERSONAL INFORMATION WITH OTHER MORGAN STANLEY COMPANIES?
We offer you choices as to whether we share with other Morgan Stanley companies the personal information that was collected to determine your eligibility for products and services you request ("eligibility information"). Eligibility information does not include your identification information or personal information pertaining to our transactions or experiences with you. Please note that, even if you direct us not to share eligibility information with other Morgan Stanley companies ("opt-out"), we may still share personal information, including eligibility information, with those companies in circumstances excluded from the opt-out under applicable law, such as to process transactions or to service your account.
5. HOW CAN YOU LIMIT THE USE OF CERTAIN TYPES OF PERSONAL INFORMATION BY OTHER MORGAN STANLEY COMPANIES FOR MARKETING?
By following the opt-out instructions in Section 6 below, you may limit other Morgan Stanley branded companies from marketing their products or services to you based on personal information we disclose to them. This information may include, for example, your income and account history with us. Please note that, even if you choose to limit Other Morgan Stanley Companies from using personal information about you that we may share with them for marketing their products and services to you, Other Morgan Stanley Companies may use your personal information that they obtain from us to market to you in circumstances permitted by law, such as if the Other Morgan Stanley Company has its own relationship with you.
6. HOW CAN YOU SEND US AN OPT-OUT INSTRUCTION?
If you wish to limit our sharing of eligibility information about you with other Morgan Stanley companies or other Morgan Stanley companies' use of personal information for marketing purposes, as described in this notice, you may do so by:
• Calling us at (800) 548-7786
Monday–Friday between 8a.m. and 6p.m.(EST)
• Writing to us at the following address:
DST Asset Manager Solutions, Inc.
c/o Privacy Coordinator
P.O. Box 219804
Kansas City, Missouri 64121
33
Morgan Stanley Institutional Fund, Inc.
Annual Report — December 31, 2018
Privacy Notice (unaudited) (cont'd)
Your written request should include your name, address, telephone number and account number(s) to which the opt-out applies and whether you are opting out with respect to sharing of eligibility information (Section 4 above), or if information used for Marketing (Section 5 above) or both. Written opt-out requests should not be sent with any other correspondence. In order to process your request, we require that the request be provided by you directly and not through a third party.
Your opt-out preference will remain in effect with respect to this policy (as it may be amended) until you notify us otherwise. If you have a joint account, your direction for us not to share this information with other Morgan Stanley companies and for those other Morgan Stanley companies not to use your personal information for marketing will be applied to all account holders on that account. Please understand that if you limit our sharing or our affiliated companies' use of personal information, you and any joint account holder(s) may not receive information about Morgan Stanley products and services, including products or services that could help you manage your financial resources and achieve your investment objectives.
7. WHAT IF AN AFFILIATED COMPANY BECOMES A NON-AFFILIATED THIRD PARTY?
If, at any time in the future, an affiliated company becomes a non-affiliated third party, further disclosures of personal information made to the former affiliated company will be limited to those described in Section 2(b) above relating to non-affiliated third parties. If you elected under Section 6 to limit disclosures we make to affiliated companies, or use of personal information by affiliated companies, your election will not apply to use by any former affiliated company of your personal information in their possession once it becomes a non-affiliated third party.
SPECIAL NOTICE TO RESIDENTS OF VERMONT
The following section supplements our policy with respect to our individual clients who have a Vermont address and supersedes anything to the contrary in the above policy with respect to those clients only.
The state of Vermont requires financial institutions to obtain your consent prior to sharing personal information that they collect about you with affiliated companies and non-affiliated third parties other than in certain limited circumstances. Except as permitted by law, we will not share personal information we collect about you with non-affiliated third parties or other Morgan Stanley companies unless you provide us with your written consent to share such information ("opt-in").
If you wish to receive offers for investment products and services offered by or through other Morgan Stanley companies, please notify us in writing at the following address:
DST Asset Manager Solutions, Inc.
c/o Privacy Coordinator
P.O. Box 219804
Kansas City, Missouri 64121
Your authorization should include your name, address, telephone number and account number(s) to which the opt-in applies and should not be sent with any other correspondence. In order to process your authorization, we require that the authorization be provided by you directly and not through a third party.
SPECIAL NOTICE TO RESIDENTS OF CALIFORNIA
The following section supplements our policy with respect to our individual clients who have a California address and supersedes anything to the contrary in the above policy with respect to those clients only.
In response to a California law, if your account has a California home address, your personal information will not be disclosed to non-affiliated third parties except as permitted by applicable California law, and we will limit sharing such information with our affiliates to comply with California privacy laws that apply to us.
34
Morgan Stanley Institutional Fund, Inc.
Annual Report — December 31, 2018
Director and Officer Information (unaudited)
Independent Directors:
Name, Age and Address of
Independent Director | | Position(s)
Held with
Registrant | | Length of Time
Served* | | Principal Occupation(s) During Past 5 Years
and Other Relevant Professional Experience | | Number of
Portfolios in
Fund Complex
Overseen by
Independent
Director** | | Other Directorships
Held by Independent
Director*** | |
Frank L. Bowman (74)
c/o Perkins Coie LLP
Counsel to the Independent
Directors
30 Rockefeller Plaza
New York, NY 10112 | | Director | | Since
August
2006 | | President, Strategic Decisions, LLC (consulting) (since February 2009); Director or Trustee of various Morgan Stanley Funds (since August 2006); Chairperson of the Compliance and Insurance Committee (since October 2015); formerly, Chairperson of the Insurance Sub-Committee of the Compliance and Insurance Committee (2007-2015); served as President and Chief Executive Officer of the Nuclear Energy Institute (policy organization) (February 2005-November 2008); retired as Admiral, U.S. Navy after serving over 38 years on active duty including 8 years as Director of the Naval Nuclear Propulsion Program in the Department of the Navy and the U.S. Department of Energy (1996-2004); served as Chief of Naval Personnel (July 1994-September 1996) and on the Joint Staff as Director of Political Military Affairs (June 1992-July 1994); knighted as Honorary Knight Commander of the Most Excellent Order of the British Empire; awarded the Officier de l'Orde National du Mérite by the French Government; elected to the National Academy of Engineering (2009). | | | 82 | | | Director of BP p.l.c.; Director of Naval and Nuclear Technologies LLP; Director Emeritus of the Armed Services YMCA; Member of the National Security Advisory Council of the Center for U.S. Global Engagement and a member of the CNA Military Advisory Board; Trustee of Fairhaven United Methodist Church; Member of the Board of Advisors of the Dolphin Scholarship Foundation; and Director of other various non-profit organizations. | |
Kathleen A. Dennis (65)
c/o Perkins Coie LLP
Counsel to the Independent Directors
30 Rockefeller Plaza
New York, NY 10112 | | Director | | Since
August
2006 | | President, Cedarwood Associates (mutual fund and investment management consulting) (since July 2006); Chairperson of the Liquidity and Alternatives Sub-Committee of the Investment Committee (since October 2006) and Director or Trustee of various Morgan Stanley Funds (since August 2006); formerly, Senior Managing Director of Victory Capital Management (1993-2006). | | | 82 | | | Director of various non-profit organizations. | |
Nancy C. Everett (63)
c/o Perkins Coie LLP
Counsel to the Independent Directors
30 Rockefeller Plaza
New York, NY 10112 | | Director | | Since
January
2015 | | Chief Executive Officer, Virginia Commonwealth University Investment Company (since November 2015); Owner, OBIR, LLC (institutional investment management consulting) (since June 2014); formerly, Managing Director, BlackRock Inc. (February 2011-December 2013); and Chief Executive Officer, General Motors Asset Management (a/k/a Promark Global Advisors, Inc.) (June 2005-May 2010). | | | 83 | | | Formerly, Member of Virginia Commonwealth University School of Business Foundation (2005-2016); Member of Virginia Commonwealth University Board of Visitors (2013-2015); Member of Committee on Directors for Emerging Markets Growth Fund, Inc. (2007-2010); Chairperson of Performance Equity Management, LLC (2006-2010); and Chairperson, GMAM Absolute Return Strategies Fund, LLC (2006-2010). | |
35
Morgan Stanley Institutional Fund, Inc.
Annual Report — December 31, 2018
Director and Officer Information (unaudited) (cont'd)
Independent Directors: (cont'd)
Name, Age and Address of
Independent Director | | Position(s)
Held with
Registrant | | Length of Time
Served* | | Principal Occupation(s) During Past 5 Years
and Other Relevant Professional Experience | | Number of
Portfolios in
Fund Complex
Overseen by
Independent
Director** | | Other Directorships
Held by Independent
Director*** | |
Jakki L. Haussler (61)
c/o Perkins Coie LLP
Counsel to the Independent Directors
30 Rockefeller Plaza
New York, NY 10112 | | Director | | Since
January
2015 | | Chairman and Chief Executive Officer, Opus Capital Group (since January 1996); formerly, Director, Capvest Venture Fund, LP (May 2000-December 2011); Partner, Adena Ventures, LP (July 1999-December 2010); Director, The Victory Funds (February 2005-July 2008). | | | 83 | | | Director of Service Corporation International and Member, Audit Committee and Investment Committee; Director of Cincinnati Bell Inc. and Member, Audit Committee and Governance and Nominating Committee; Chairman of Northern Kentucky University Member Investment Committee; Member of Chase College of Law Transactional Law Practice Center Board of Advisors; Director of Best Transport; Director of Chase College of Law Board of Visitors; formerly, Member, University of Cincinnati Foundation Investment Committee; Member, Miami University Board of Visitors (2008-2011); Trustee of Victory Funds (2005-2008) and Chairman, Investment Committee (2007-2008) and Member, Service Provider Committee (2005-2008). | |
Dr. Manuel H. Johnson (69)
c/o Johnson Smick
International, Inc.
220 I Street, NE — Suite 200
Washington, D.C. 20002 | | Director | | Since
July
1991 | | Senior Partner, Johnson Smick International, Inc. (consulting firm); Chairperson of the Investment Committee (since October 2006) and Director or Trustee of various Morgan Stanley Funds (since July 1991); Co-Chairman and a founder of the Group of Seven Council (G7C) (international economic commission); formerly, Chairperson of the Audit Committee (July 1991-September 2006), Vice Chairman of the Board of Governors of the Federal Reserve System and Assistant Secretary of the U.S. Treasury. | | | 82 | | | Director of NVR, Inc. (home construction). | |
Joseph J. Kearns (76)
c/o Perkins Coie LLP
Counsel to the Independent
Directors
30 Rockefeller Plaza
New York, NY 10112 | | Director | | Since
August
1994 | | Senior Adviser, Kearns & Associates LLC (investment consulting); Chairperson of the Audit Committee (since October 2006) and Director or Trustee of various Morgan Stanley Funds (since August 1994); formerly, Deputy Chairperson of the Audit Committee (July 2003-September 2006) and Chairperson of the Audit Committee of various Morgan Stanley Funds (since August 1994); CFO of the J. Paul Getty Trust. | | | 83 | | | Prior to August 10, 2016, Director of Electro Rent Corporation (equipment leasing); Prior to December 31, 2013, Director of The Ford Family Foundation. | |
36
Morgan Stanley Institutional Fund, Inc.
Annual Report — December 31, 2018
Director and Officer Information (unaudited) (cont'd)
Independent Directors: (cont'd)
Name, Age and Address of
Independent Director | | Position(s)
Held with
Registrant | | Length of Time
Served* | | Principal Occupation(s) During Past 5 Years
and Other Relevant Professional Experience | | Number of
Portfolios in
Fund Complex
Overseen by
Independent
Director** | | Other Directorships
Held by Independent
Director*** | |
Michael F. Klein (60)
c/o Perkins Coie LLP
Counsel to the Independent Directors
30 Rockefeller Plaza
New York, NY 10112 | | Director | | Since
August
2006 | | Managing Director, Aetos Alternatives Management, LP (since March 2000); Co-President, Aetos Alternatives Management, LP (since January 2004) and Co-Chief Executive Officer of Aetos Alternatives Management, LP (since August 2013); Chairperson of the Fixed Income Sub-Committee of the Investment Committee (since October 2006) and Director or Trustee of various Morgan Stanley Funds (since August 2006); formerly, Managing Director, Morgan Stanley & Co. Inc. and Morgan Stanley Dean Witter Investment Management and President, various Morgan Stanley Funds (June 1998-March 2000); Principal, Morgan Stanley & Co. Inc. and Morgan Stanley Dean Witter Investment Management (August 1997-December 1999). | | | 82 | | | Director of certain investment funds managed or sponsored by Aetos Alternatives Management, LP; Director of Sanitized AG and Sanitized Marketing AG (specialty chemicals). | |
Patricia Maleski (58)
c/o Perkins Coie LLP
Counsel to the Independent Directors
30 Rockefeller Plaza
New York, NY 10112 | | Director | | Since
January
2017 | | Managing Director, JPMorgan Asset Management (2004-2016); Oversight and Control Head of Fiduciary and Conflicts of Interest Program (2015-2016); Chief Control Officer-Global Asset Management (2013-2015); President, JPMorgan Funds (2010-2013); Chief Administrative Officer (2004-2013); various other positions including Treasurer and Board Liaison (since 2001). | | | 83 | | | None. | |
Michael E. Nugent (82)
522 Fifth Avenue
New York, NY 10036 | | Chair of the Board and Director | | Chair of the Boards since July 2006 and Director since July 1991 | | Chair of the Boards of various Morgan Stanley Funds (since July 2006); Chairperson of the Closed-End Fund Committee (since June 2012) Governance Committee (since January 2019) and Director or Trustee of various Morgan Stanley Funds (since July 1991); formerly, Chairperson of the Insurance Committee (until July 2006); General Partner, Triumph Capital, L.P. (private investment partnership) (1988-2013). | | | 82 | | | None. | |
W. Allen Reed (71)
c/o Perkins Coie LLP
Counsel to the Independent Directors
30 Rockefeller Plaza
New York, NY 10112 | | Director | | Since
August
2006 | | Chairperson of the Equity Sub-Committee of the Investment Committee (since October 2006) and Director or Trustee of various Morgan Stanley Funds (since August 2006); formerly, President and CEO of General Motors Asset Management; Chairman and Chief Executive Officer of the GM Trust Bank and Corporate Vice President of General Motors Corporation (August 1994-December 2005). | | | 82 | | | Director of Legg Mason, Inc.; formerly, Director of the Auburn University Foundation (2010-2015). | |
Fergus Reid (86)****
c/o Joe Pietryka, Inc.
85 Charles Colman Blvd.
Pawling, NY 12564 | | Director | | Since
June
1992 | | Chairman, Joe Pietryka, Inc.; Chairperson of the Governance Committee and Director or Trustee of various Morgan Stanley Funds (since June 1992). | | | 83 | | | Formerly, Trustee and Director of certain investment companies in the JP Morgan Fund Complex managed by JP Morgan Investment Management Inc. (1987-2012). | |
* This is the earliest date the Director began serving the Morgan Stanley Funds. Each Director serves an indefinite term, until his or her successor is elected.
** The Fund Complex includes (as of December 31, 2018) all open-end and closed-end funds (including all of their portfolios) advised by Morgan Stanley Investment Management Inc. (the "Adviser") and any funds that have an adviser that is an affiliated person of the Adviser (including, but not limited to, Morgan Stanley AIP GP LP).
*** This includes any directorships at public companies and registered investment companies held by the Director at any time during the past five years.
**** Effective date of retirement is December 31, 2018.
37
Morgan Stanley Institutional Fund, Inc.
Annual Report — December 31, 2018
Director and Officer Information (unaudited) (cont'd)
Executive Officers:
Name, Age and Address of Executive Officer | | Position(s) Held
with
Registrant | | Length of Time
Served* | | Principal Occupation(s) During Past 5 Years | |
John H. Gernon (55)
522 Fifth Avenue
New York, NY 10036 | | President and Principal Executive Officer | | Since
September
2013 | | President and Principal Executive Officer of the Equity and Fixed Income Funds and the Morgan Stanley AIP Funds (since September 2013) and the Liquidity Funds and various money market funds (since May 2014) in the Fund Complex; Managing Director of the Adviser; Head of Product (since 2006). | |
Timothy J. Knierim (59)
522 Fifth Avenue
New York, NY 10036 | | Chief Compliance Officer | | Since
December
2016 | | Managing Director of the Adviser and various entities affiliated with the Adviser; Chief Compliance Officer of various Morgan Stanley Funds and the Adviser (since December 2016) and Chief Compliance Officer of Morgan Stanley AIP GP LP (since 2014). Formerly, Managing Director and Deputy Chief Compliance Officer of the Adviser (2014-2016); and formerly, Chief Compliance Officer of Prudential Investment Management, Inc. (2007-2014). | |
Francis J. Smith (53)
522 Fifth Avenue
New York, NY 10036 | | Treasurer and Principal Financial Officer | | Treasurer since July 2003 and Principal Financial Officer since September 2002 | | Managing Director of the Adviser and various entities affiliated with the Adviser; Treasurer (since July 2003) and Principal Financial Officer of various Morgan Stanley Funds (since September 2002). | |
Mary E. Mullin (51)
522 Fifth Avenue
New York, NY 10036 | | Secretary | | Since
June
1999 | | Managing Director of the Adviser; Secretary of various Morgan Stanley Funds (since June 1999). | |
Michael J. Key (39)
522 Fifth Avenue
New York, NY 10036 | | Vice President | | Since
June
2017 | | Vice President of the Equity and Fixed Income Funds, Liquidity Funds, various money market funds and the Morgan Stanley AIP Funds in the Fund Complex (since June 2017); Executive Director of the Adviser; Head of Product Development for Equity and Fixed Income Funds (since August 2013). | |
* This is the earliest date the officer began serving the Morgan Stanley Funds. Each officer serves a one-year term, until his or her successor is elected and qualifies.
38
Morgan Stanley Institutional Fund, Inc.
Annual Report — December 31, 2018
Adviser and Administrator
Morgan Stanley Investment Management Inc.
522 Fifth Avenue
New York, New York 10036
Distributor
Morgan Stanley Distribution, Inc.
522 Fifth Avenue
New York, New York 10036
Dividend Disbursing and Transfer Agent
DST Asset Manager Solutions, Inc.
2000 Crown Colony Drive
Quincy, Massachusetts 02169
Custodian
State Street Bank and Trust Company
One Lincoln Street
Boston, Massachusetts 02111
Legal Counsel
Dechert LLP
1095 Avenue of the Americas
New York, New York 10036
Counsel to the Independent Directors
Perkins Coie LLP
30 Rockefeller Plaza
New York, New York 10112
Independent Registered Public Accounting Firm
Ernst & Young LLP
200 Clarendon Street
Boston, Massachusetts 02116
Reporting to Shareholders
Each Morgan Stanley fund provides a complete schedule of portfolio holdings in its semi-annual and the annual reports within 60 days of the end of the fund's second and fourth fiscal quarters. The semi-annual and annual reports are filed electronically with the Securities and Exchange Commission ("SEC") on Form N-CSRS and Form N-CSR, respectively. Morgan Stanley also delivers the semi-annual and annual reports to fund shareholders and makes these reports available on its public website, www.morganstanley.com/im/shareholderreports. Each Morgan Stanley fund also files a complete schedule of portfolio holdings with the SEC for the fund's first and third fiscal quarters on Form N-Q. Morgan Stanley does not deliver the reports for the first and third fiscal quarters to shareholders, nor are the reports posted to the Morgan Stanley public website. You may, however, obtain the Form N-Q filings (as well as the Form N-CSR and N-CSRS filings) by accessing the SEC's website, www.sec.gov. You can also request copies of these materials, upon payment of a duplicating fee, by electronic request at the SEC's email address (publicinfo@sec.gov).
Proxy Voting Policies and Procedures and Proxy Voting Record
You may obtain a copy of the Company's Proxy Voting Policy and Procedures and information regarding how the Company voted proxies relating to portfolio securities during the most recent twelve-month period ended June 30, without charge, upon request, by calling toll free 1 (800) 548-7786 or by visiting our website at www.morganstanley.com/im/shareholderreports. This information is also available on the SEC's website at www.sec.gov.
This report is authorized for distribution only when preceded or accompanied by a prospectus or summary prospectus of the applicable Fund of Morgan Stanley Institutional Fund, Inc., which describes in detail the Fund's investment policies, risks, fees and expenses. Please read the prospectus carefully before you invest or send money. For additional information, including information regarding the investments comprising the Fund, please visit our website at www.morganstanley.com/im/shareholderreports or call toll free 1 (800) 548-7786.
39
Printed in U.S.A.
This Report has been prepared for shareholders and may be distributed to others only if preceded or accompanied by a current prospectus.
Morgan Stanley Investment Management Inc.
522 Fifth Avenue
New York, New York 10036
© 2019 Morgan Stanley. Morgan Stanley Distribution, Inc.

IFIGOANN
2403631 EXP. 02.29.20

Morgan Stanley Institutional Fund, Inc.
Global Real Estate Portfolio
Annual Report
December 31, 2018
Beginning on January 1, 2021, as permitted by regulations adopted by the Securities and Exchange Commission ("SEC"), paper copies of the Fund's Annual and Semi-Annual Reports to Shareholders ("Shareholder Reports") will no longer be sent by mail, unless you specifically request paper copies of the Shareholder Reports from the Fund or from your financial intermediary, such as a broker-dealer or a bank. Instead, the Shareholder Reports will be made available on the Fund's website, https://www.morganstanley.com/im/shareholderreports and you will be notified by mail each time a Shareholder Report is posted and provided with a website link to access the Shareholder Report. If you already elected to receive Shareholder Reports electronically, you will not be affected by this change and you need not take any action. You may elect to receive Shareholder Reports and other communications from the Fund electronically anytime by contacting your financial intermediary or, if you are a direct investor, please follow the instructions on the envelope.
Beginning on January 1, 2019, you may elect to receive all future Shareholder Reports in paper free of charge. If you invest through a financial intermediary, you can contact your financial intermediary to request that you continue to receive paper copies of your Shareholder Reports. If you invest directly with the Fund, please follow the instructions on the envelope to let the Fund know you wish to continue receiving paper copies of your Shareholder Reports. Your election to receive Shareholder Reports in paper will apply to all funds held in your account if you invest through your financial intermediary or all funds held with the fund complex if you invest directly with a fund.

Morgan Stanley Institutional Fund, Inc.
Annual Report — December 31, 2018
Shareholders' Letter | | | 2 | | |
Expense Example | | | 3 | | |
Investment Overview | | | 4 | | |
Portfolio of Investments | | | 8 | | |
Statement of Assets and Liabilities | | | 11 | | |
Statement of Operations | | | 13 | | |
Statements of Changes in Net Assets | | | 14 | | |
Financial Highlights | | | 16 | | |
Notes to Financial Statements | | | 22 | | |
Report of Independent Registered Public Accounting Firm | | | 29 | | |
Federal Tax Notice | | | 30 | | |
Privacy Notice | | | 31 | | |
Director and Officer Information | | | 34 | | |
This report is authorized for distribution only when preceded or accompanied by a prospectus or summary prospectus of the applicable Fund of Morgan Stanley Institutional Fund, Inc. To receive a prospectus and/or statement of additional information (SAI), which contains more complete information such as investment objectives, charges, expenses, policies for voting proxies, risk considerations and describes in detail each of the Fund's investment policies to the prospective investor, please call toll free 1 (800) 548-7786. Please read the prospectuses carefully before you invest or send money.
Additionally, you can access information about the Fund, including performance, characteristics and investment team commentary, through Morgan Stanley Investment Management's website: www.morganstanley.com/im/shareholderreports.
Market forecasts provided in this report may not necessarily come to pass. There is no guarantee that any sectors mentioned will continue to perform as discussed herein or that securities in such sectors will be held by the Fund in the future. There is no assurance that a fund will achieve its investment objective. Funds are subject to market risk, which is the possibility that market values of securities owned by the Fund will decline and, therefore, the value of the Fund's shares may be less than what you paid for them. Accordingly, you can lose money investing in this Fund. Please see the prospectus for more complete information on investment risks.
1
Morgan Stanley Institutional Fund, Inc.
Annual Report — December 31, 2018
Shareholders' Letter (unaudited)
Dear Shareholders,
We are pleased to provide this Annual report, in which you will learn how your investment in Global Real Estate Portfolio (the "Fund") performed during the latest twelve-month period.
Morgan Stanley Investment Management is a client-centric, investor-led organization. Our global presence, intellectual capital, and breadth of products and services enable us to partner with investors to meet the evolving challenges of today's financial markets. We aim to deliver superior investment service and to empower our clients to make the informed decisions that help them reach their investment goals.
As always, we thank you for selecting Morgan Stanley Investment Management, and look forward to working with you in the months and years ahead.
Sincerely,

John H. Gernon
President and Principal Executive Officer
January 2019
2
Morgan Stanley Institutional Fund, Inc.
Annual Report — December 31, 2018
Expense Example (unaudited)
Global Real Estate Portfolio
As a shareholder of the Fund, you incur two types of costs: (1) transactional costs; and (2) ongoing costs, which may include advisory fees, administration fees, distribution and shareholder services fees and other Fund expenses. This example is intended to help you understand your ongoing costs (in dollars) of investing in the Fund and to compare these costs with the ongoing costs of investing in other mutual funds.
This example is based on an investment of $1,000 invested at the beginning of the six-month period ended December 31, 2018 and held for the entire six-month period.
Actual Expenses
The table below provides information about actual account values and actual expenses. You may use the information in this table, together with the amount you invested, to estimate the expenses that you paid over the period. Simply divide your account value by $1,000 (for example, an $8,600 account value divided by $1,000 = 8.6), then multiply the result by the number in the table under the heading entitled "Actual Expenses Paid During Period" to estimate the expenses you paid on your account during this period.
Hypothetical Example for Comparison Purposes
The table below provides information about hypothetical account values and hypothetical expenses based on the Fund's actual expense ratio and an assumed rate of return of 5% per year before expenses, which is not the Fund's actual return. The hypothetical account values and expenses may not be used to estimate the actual ending account balance or expenses you paid for the period. You may use this information to compare the ongoing costs of investing in the Fund and other funds. To do so, compare this 5% hypothetical example with the 5% hypothetical examples that appear in the shareholder reports of the other funds.
Please note that the expenses shown in the table are meant to highlight your ongoing costs only and do not reflect any transactional costs, such as sales charges (loads). Therefore, the information for each class in the table is useful in comparing ongoing costs only, and will not help you determine the relative total costs of owning different funds. In addition, if these transactional costs were included, your costs would have been higher.
| | | Beginning
Account
Value
7/1/18 | | Actual Ending
Account
Value
12/31/18 | | Hypothetical
Ending Account
Value | | Actual
Expenses
Paid
During
Period* | | Hypothetical
Expenses Paid
During Period* | | Net
Expense
Ratio
During
Period** | |
Global Real Estate Portfolio Class I | | $ | 1,000.00 | | | $ | 917.50 | | | $ | 1,020.11 | | | $ | 4.88 | | | $ | 5.14 | | | | 1.01 | % | |
Global Real Estate Portfolio Class A | | | 1,000.00 | | | | 917.20 | | | | 1,018.35 | | | | 6.57 | | | | 6.92 | | | | 1.36 | | |
Global Real Estate Portfolio Class L | | | 1,000.00 | | | | 914.30 | | | | 1,015.83 | | | | 8.97 | | | | 9.45 | | | | 1.86 | | |
Global Real Estate Portfolio Class C | | | 1,000.00 | | | | 913.20 | | | | 1,014.57 | | | | 10.18 | | | | 10.71 | | | | 2.11 | | |
Global Real Estate Portfolio Class IS | | | 1,000.00 | | | | 918.40 | | | | 1,020.52 | | | | 4.50 | | | | 4.74 | | | | 0.93 | | |
Global Real Estate Portfolio Class IR | | | 1,000.00 | | | | 918.50 | | | | 1,020.47 | | | | 4.55 | | | | 4.79 | | | | 0.94 | | |
* Expenses are calculated using each Fund Class' annualized net expense ratio (as disclosed), multiplied by the average account value over the period and multiplied by 184/365 (to reflect the most recent one-half year period).
** Annualized.
3
Morgan Stanley Institutional Fund, Inc.
Annual Report — December 31, 2018
Investment Overview (unaudited)
Global Real Estate Portfolio
The Fund seeks to provide current income and capital appreciation.
Performance
For the fiscal year ended December 31, 2018, the Fund's Class I shares had a total return based on net asset value and reinvestment of distributions per share of –7.92%, net of fees. The Fund's Class I shares underperformed against the Fund's benchmark, the FTSE EPRA Nareit Developed Real Estate Index — Net Total Return to U.S. Investors (the "Index"), which returned –5.05%, and outperformed the MSCI World Net Index, which returned –8.71%.
Factors Affecting Performance
• The broader equity market declined for the 12-month period and appears to be pricing in an economic slowdown scenario. In the fourth quarter, a host of macro concerns appeared to result in a broad-based sell-off, which also negatively impacted listed real estate share prices. Within real estate, market segments viewed as more defensive generally outperformed.
• The global real estate securities market declined 5.0% during the 12-month period ending December 31, 2018, as measured by the Index.
• Property stocks in Asia, measured by the FTSE EPRA Nareit Developed Asia Index, declined 1.5%. In Hong Kong, concerns about the trade regulations, interest rates and economic weakness continue to weigh on investor sentiment. In Japan, the currency experienced strength and the Japan REITs (J-REITs) posted the largest gains on a global basis due to their defensive characteristics.
• Property stocks in the U.S., measured by the FTSE EPRA Nareit U.S. Index, declined 3.9%. There was significant negative sentiment and share price weakness towards key market segments, resulting in very wide discounts to net asset values (NAVs), which included NYC office, high-quality retail and central business district (CBD) office and hotels, while market segments trading at premiums due to their perceived defensive characteristics (e.g., health care and net lease assets) experienced share price gains for the period.
• Property stocks in Europe, measured by the FTSE EPRA Nareit Developed EMEA Index, declined
12.1% and lagged Asia and the U.S. Share prices of Continental retail companies experienced significant declines due to concerns over retailer challenges. In the U.K., uncertainty over Brexit persisted and became more acute in the fourth quarter, but leasing activity and investment transactions for London office remain active and have demonstrated resilience in underlying asset values.
• Listed real estate security returns should mirror private real estate performance. There are concerns that values may have peaked or are even poised to decline after significant appreciation. However, based on significant transactional evidence, pricing has generally remained stable for high-quality assets for the last two years, which has resulted in a significant disparity in real estate valuations between the public markets and private markets following share price declines over the period.
• Overall, share prices have largely been driven by macro themes, central bank policies and investor preference for market segments with more defensive characteristics, as opposed to valuations and fundamentals. This has resulted in pockets of the global listed property market trading at premium valuations relative to their peers due to their perceived defensive characteristics (e.g., U.S. net lease and health care REITs, German residential stocks, J-REITs and Australian REITs). Despite transactional evidence continuing to demonstrate strength in asset values, there was significant negative investor sentiment towards key market segments resulting in very wide discounts to NAVs, which included NYC office, Hong Kong commercial property companies, U.S. and Continental Europe high-quality retail, the U.K. Majors and London office specialists, and U.S. CBD office and hotels. Given the Fund's value-oriented investment style, the Fund was underweight many of the segments viewed as defensive and trading at relative premium valuations. As those segments outperformed over the period, this underweighting was a key detractor from relative performance.
• From a regional perspective, performance within the Asian regional portfolio contributed to relative performance, while the North American and European portfolios detracted. Top-down regional
4
Morgan Stanley Institutional Fund, Inc.
Annual Report — December 31, 2018
Investment Overview (unaudited) (cont'd)
Global Real Estate Portfolio
allocation and cash held in the Fund modestly contributed to relative performance.
• In Asia, the Fund benefited from stock selection in Hong Kong and the underweight to Singapore; this was partially offset by the overweight to Hong Kong and the underweight to Japan. In Europe, the Fund benefited from the underweight to U.K. retail securities and stock selection within and the overweight to Spain; but this was more than offset by the overweight to Continental retail, the overweight to and stock selection within the U.K. Majors, and the underweight to German residential. In the U.S., the Fund benefited from stock selection in the U.S. diversified sector; but this was more than offset by the overweight to and stock selection within the U.S. primary CBD office sector, which is facing significant negative investor sentiment, as well as the underweight to and stock selection within the U.S. health care sector and the underweight to U.S. net lease assets — both are sectors that are viewed as defensive by investors.
Management Strategies
• The global portfolio is comprised of three regional portfolios with a global allocation which weights each of the three major regions (North America, Europe and Asia) relative to the Index based on our view of the relative attractiveness of each region in terms of underlying real estate fundamentals and public market valuations. Moreover, each of the regional portfolios reflects our core investment philosophy as a real estate value investor, which results in the ownership of stocks that we believe provide the best valuation relative to their underlying real estate values, while maintaining portfolio diversification. Our company-specific research leads us to specific preferences for sub-segments within each of the property sectors and countries. For the period ended December 31, 2018, the Fund was modestly overweight the Asian listed property sector, relatively neutral to the North American listed property sector and modestly underweight the European listed property sector. We would note that regional bets are currently relatively muted due to a lack of large valuation disparities among the regions and due to macro uncertainties which may impact regional share prices far more than underlying fundamentals and valuations, and we have instead focused on the
enormous disparities in valuations among market segments within each of the major regions. We see the most attractive expected return prospects from companies concentrated in U.S. CBD office (especially NYC office), the Hong Kong commercial property companies, U.S. and Continental high-quality retail, the U.K. Majors and London office specialists, U.S. hotels and select opportunities to invest in other core assets at attractive discounted valuations in a number of other global markets.
• In Hong Kong, there is continued strength in valuations for commercial assets as evidenced by elevated transaction volumes. The Hong Kong office market features low vacancy levels and continued rental growth, while there has been a recent slowdown in strong growth of retail sales in Hong Kong. The Hong Kong real estate operating companies (REOCs) continue to represent a significant overweight in the global portfolio, as the stocks offer highly attractive value with the widest overall discrepancy between public and private valuations among public listed global property markets despite healthy operating fundamentals, solid recurring cash flow growth and continued strength in asset values in the private markets, as well as improving corporate governance and capital management. The discounted valuations are further accentuated as the Hong Kong REOCs maintain very modest leverage levels. These NAV discounts could eventually narrow for companies that are willing to recycle assets on the balance sheet to realize their latent gains and engage in corporate restructuring to improve transparency and capital management, and potentially eliminate any holding company discounts, as well as any improvement in recent negative sentiment. In Japan, the investment market remains active but there is some caution due to all-time low capitalization rates and continued policy uncertainty. There is a significant disparity in valuations with the Japan REOCs trading at discounts to NAVs and the J-REITs trading at premiums to NAVs. The J-REITs generally own lower-quality assets as compared to the J-REOCs, but J-REIT share prices have been bolstered by investors' search for yield, the Bank of Japan's commitment to monetary easing and the asset purchase program, and the perception of REITs as a bond proxy. The Fund is underweight Japan
5
Morgan Stanley Institutional Fund, Inc.
Annual Report — December 31, 2018
Investment Overview (unaudited) (cont'd)
Global Real Estate Portfolio
overall, driven primarily by the large underweight to the J-REITs. In Australia, key office markets are experiencing improved rental growth, while operating fundamentals in the Australian retail sector remain lackluster relative to historical levels. The Australian REIT sector ended the period trading at a premium to NAVs and remains far less attractive relative to the Hong Kong REOCs within Asia.
• In the U.K., the Brexit vote created expectations for declines in NAVs, but office market transaction and leasing activity to date have indicated far more modest declines than initially expected. Although uncertainty over Brexit persists (and became more acute in the fourth quarter of 2018), there remains continued investor interest in London assets, especially from foreign investors showing a willingness to pay prices that reflect values at or above pre-Brexit levels, although the value of U.K. retail assets are weakening. Overall, property stocks in the U.K. ended the period trading at a 21% discount to NAVs.(i) There is attractive value in the large-cap U.K. Majors, which trade at a 35% discount to NAVs,(i) and London office specialists, which trade at a 25% discount.(i) These discounts are well in excess of expected asset value declines and reflect a disparity in value versus Other U.K. stocks. On the Continent, valuations are being supported by stable property fundamentals. Property stocks on the Continent ended the period trading at a 15% discount to NAVs(i) overall, although there is a meaningful disparity in valuations, with the Continental retail stocks trading at a 35% discount to NAVs(i) following accelerated share price weakness on concerns over retail challenges despite stable operating results by the companies. Within Europe, we remain overweight the U.K. Majors and London office specialists and Continental retail, and underweight Germany and other segments in the U.K.
• In the U.S., the REIT market ended the period trading at a 5% discount to NAVs,(i) with various segments trading at meaningful discounts. There is an enormous disparity in relative valuations among the various REIT sectors. We see the most attractive value in the owners of NYC office assets. We also
see attractive value in high-quality retail, CBD office, hotel and apartment stocks. These companies provide exposure to high-quality core assets at significant discounted valuations. Our company-specific research leads us to an overweighting in the Fund to a group of companies that are focused in the ownership of NYC office assets as well as high-quality retail, CBD office, hotel, and apartment assets and a number of out of favor companies, and an underweighting to companies concentrated in the ownership of net lease and health care assets. The Fund is underweight Canada given less attractive relative valuations.
(i) Morgan Stanley Investment Management, as of December 31, 2018

* Minimum Investment for Class I shares
In accordance with SEC regulations, the Fund's performance shown assumes that all recurring fees (including management fees) were deducted and all dividends and distributions were reinvested. The performance of Class A, L, C, IS and IR shares will vary from the performance of Class I shares based upon their different inception dates and will be negatively impacted by additional fees assessed to those classes (if applicable).
6
Morgan Stanley Institutional Fund, Inc.
Annual Report — December 31, 2018
Investment Overview (unaudited) (cont'd)
Global Real Estate Portfolio
Performance Compared to the FTSE EPRA Nareit Developed Real Estate Index — Net Total Return to U.S. Investors(1), the MSCI World Net Index(2) and the Lipper Global Real Estate Funds Average(3)
| | | Period Ended December 31, 2018
Total Returns(4) | |
| | | | | Average Annual | |
| | | One
Year | | Five
Years | | Ten
Years | | Since
Inception(10) | |
Fund — Class I Shares
w/o sales charges(5) | | | –7.92 | % | | | 3.38 | % | | | 9.32 | % | | | 3.05 | % | |
Fund — Class A Shares
w/o sales charges(5) | | | –8.19 | | | | 3.10 | | | | 9.03 | | | | 2.77 | | |
Fund — Class A Shares with
maximum 5.25% sales charges(5) | | | –13.05 | | | | 1.99 | | | | 8.45 | | | | 2.32 | | |
Fund — Class L Shares
w/o sales charges(6) | | | –8.74 | | | | 2.58 | | | | 8.48 | | | | 2.51 | | |
Fund — Class C Shares
w/o sales charges(8) | | | –8.93 | | | | — | | | | — | | | | –1.00 | | |
Fund — Class C Shares with
maximum 1.00% deferred
sales charges(8) | | | –9.75 | | | | — | | | | — | | | | –1.00 | | |
Fund — Class IS Shares
w/o sales charges(7) | | | –7.83 | | | | 3.48 | | | | — | | | | 3.49 | | |
Fund — Class IR Shares
w/o sales charges(9) | | | — | | | | — | | | | — | | | | –7.49 | | |
FTSE EPRA Nareit Developed
Real Estate Index — Net
Total Return to U.S. Investors | | | –5.05 | | | | 4.99 | | | | 10.21 | | | | 3.32 | | |
MSCI World Net Index | | | –8.71 | | | | 4.56 | | | | 9.67 | | | | 4.80 | | |
Lipper Global Real Estate
Funds Average | | | –6.30 | | | | 4.10 | | | | 9.21 | | | | 2.43 | | |
Performance data quoted represents past performance, which is no guarantee of future results, and current performance may be lower or higher than the figures shown. Performance assumes that all dividends and distributions, if any, were reinvested. For the most recent month-end performance figures, please visit www.morganstanley.com/im/shareholderreports. Investment return and principal value will fluctuate so that Fund shares, when redeemed, may be worth more or less than their original cost. Returns for periods less than one year are not annualized. Total returns do not reflect the deduction of taxes that a shareholder would pay on Fund distributions or the redemption of Fund shares. Performance of share classes will vary due to difference in sales charges and expenses.
(1) The FTSE EPRA Nareit Developed Real Estate Index — Net Total Return to U.S. Investors is a market capitalization weighted index designed to reflect the stock performance of companies engaged in the North American, European and Asian real estate markets. The performance of the Index is listed in U.S. dollars and assumes reinvestment of net dividends. "Net Total Return to U.S. investors" reflects a reduction in total returns after taking into account the withholding tax on dividends by certain foreign countries represented in the Index for periods after 1/31/05 (gross returns used prior to 1/31/05). The Index is unmanaged and its returns do not include any sales charges or fees. Such costs would lower performance. It is not possible to invest directly in an index.
(2) The MSCI World Net Index is a free float-adjusted market capitalization weighted index that is designed to measure the global equity market performance of developed markets. The term "free float" represents the portion of shares outstanding that are deemed to be available for purchase in the public equity markets by investors. The MSCI World Net Index currently consists of 23 developed market country indices. The performance of the Index is listed in U.S. dollars and assumes reinvestment of net dividends. Net total return indices reinvest dividends after the deduction of withholding taxes, using (for international indices) a tax rate applicable to non-resident institutional investors who do not benefit from double taxation treaties. The Index is unmanaged and its returns do not include any sales charges or fees. Such costs would lower performance. It is not possible to invest directly in an index.
(3) The Lipper Global Real Estate Funds Average tracks the performance of all funds in the Lipper Global Real Estate Funds classification. The Average, which is adjusted for capital gains distributions and income dividends, is unmanaged and should not be considered an investment. As of the date of this report, the Fund was in the Lipper Global Real Estate Funds classification.
(4) Total returns for the Fund reflect fees waived and expenses reimbursed, if applicable, by Morgan Stanley Investment Management Inc. (the "Adviser"). Without such waivers and reimbursements, total returns would have been lower.
(5) Commenced operations on August 30, 2006.
(6) Commenced offering on June 16, 2008.
(7) Commenced offering September 13, 2013.
(8) Commenced offering on April 30, 2015.
(9) Commenced offering on June 15, 2018.
(10) For comparative purposes, average annual since inception returns listed for the Indexes refer to the inception date of Class I of the Fund, not the inception of the Index.
7
Morgan Stanley Institutional Fund, Inc.
Annual Report — December 31, 2018
Portfolio of Investments
Global Real Estate Portfolio
| | | Shares | | Value
(000) | |
Common Stocks (99.6%) | |
Australia (3.8%) | |
Dexus REIT | | | 651,182 | | | $ | 4,870 | | |
Goodman Group REIT | | | 692,131 | | | | 5,181 | | |
GPT Group (The) REIT | | | 1,005,010 | | | | 3,780 | | |
Mirvac Group REIT | | | 1,693,237 | | | | 2,671 | | |
Scentre Group REIT | | | 3,198,567 | | | | 8,785 | | |
Stockland REIT | | | 1,417,176 | | | | 3,516 | | |
Vicinity Centres REIT | | | 2,806,145 | | | | 5,138 | | |
| | | | 33,941 | | |
Austria (0.1%) | |
Atrium European Real Estate Ltd. (a) | | | 355,335 | | | | 1,314 | | |
Canada (1.9%) | |
Boardwalk REIT | | | 5,811 | | | | 161 | | |
Crombie Real Estate Investment Trust REIT | | | 135,141 | | | | 1,240 | | |
Extendicare, Inc. | | | 67,326 | | | | 313 | | |
First Capital Realty, Inc. | | | 430,302 | | | | 5,942 | | |
H&R Real Estate Investment Trust REIT | | | 99,903 | | | | 1,511 | | |
RioCan Real Estate Investment Trust REIT | | | 380,953 | | | | 6,641 | | |
SmartCentres Real Estate Investment Trust REIT | | | 35,614 | | | | 804 | | |
| | | | 16,612 | | |
China (1.0%) | |
China Overseas Land & Investment Ltd. (b) | | | 750,000 | | | | 2,581 | | |
China Resources Land Ltd. (b) | | | 156,000 | | | | 596 | | |
Country Garden Holdings Co., Ltd. (b) | | | 2,481,000 | | | | 2,989 | | |
Guangzhou R&F Properties Co., Ltd.
H Shares (b) | | | 952,400 | | | | 1,426 | | |
Longfor Group Holdings Ltd. (b) | | | 389,000 | | | | 1,165 | | |
| | | | 8,757 | | |
Finland (0.2%) | |
Citycon Oyj | | | 215,843 | | | | 399 | | |
Kojamo Oyj (a) | | | 175,174 | | | | 1,627 | | |
| | | | 2,026 | | |
France (5.4%) | |
Carmila SA REIT | | | 35,315 | | | | 653 | | |
Covivio REIT | | | 23,891 | | | | 2,300 | | |
Gecina SA REIT | | | 52,847 | | | | 6,822 | | |
ICADE REIT | | | 34,919 | | | | 2,655 | | |
Klepierre SA REIT | | | 556,855 | | | | 17,144 | | |
Mercialys SA REIT | | | 204,233 | | | | 2,796 | | |
Unibail-Rodamco-Westfield REIT | | | 101,451 | | | | 15,671 | | |
| | | | 48,041 | | |
Germany (2.5%) | |
ADO Properties SA | | | 34,877 | | | | 1,823 | | |
Alstria Office AG REIT | | | 159,507 | | | | 2,230 | | |
Deutsche Wohnen SE | | | 119,312 | | | | 5,469 | | |
LEG Immobilien AG | | | 15,570 | | | | 1,626 | | |
Vonovia SE | | | 240,586 | | | | 10,919 | | |
| | | | 22,067 | | |
| | | Shares | | Value
(000) | |
Hong Kong (11.5%) | |
Champion REIT | | | 3,830,000 | | | $ | 2,620 | | |
CK Asset Holdings Ltd. | | | 1,012,500 | | | | 7,363 | | |
Henderson Land Development Co., Ltd. | | | 443,238 | | | | 2,197 | | |
Hongkong Land Holdings Ltd. | | | 2,613,800 | | | | 16,477 | | |
Hysan Development Co., Ltd. | | | 1,243,014 | | | | 5,894 | | |
Link REIT | | | 1,897,275 | | | | 19,107 | | |
New World Development Co., Ltd. | | | 4,148,758 | | | | 5,450 | | |
Sino Land Co., Ltd. | | | 2,091,048 | | | | 3,558 | | |
Sun Hung Kai Properties Ltd. | | | 1,433,367 | | | | 20,324 | | |
Swire Properties Ltd. | | | 2,767,300 | | | | 9,670 | | |
Wharf Holdings Ltd. (The) | | | 1,169,763 | | | | 3,035 | | |
Wharf Real Estate Investment Co., Ltd. | | | 1,170,075 | | | | 6,955 | | |
| | | | 102,650 | | |
Ireland (0.5%) | |
Green REIT PLC | | | 1,971,678 | | | | 3,045 | | |
Hibernia REIT PLC | | | 1,158,235 | | | | 1,656 | | |
| | | | 4,701 | | |
Japan (10.0%) | |
Activia Properties, Inc. REIT | | | 480 | | | | 1,945 | | |
Advance Residence Investment Corp. REIT | | | 1,036 | | | | 2,863 | | |
Frontier Real Estate Investment Corp. REIT | | | 200 | | | | 794 | | |
GLP J-REIT | | | 3,177 | | | | 3,245 | | |
Hulic Co., Ltd. | | | 311,800 | | | | 2,790 | | |
Hulic REIT, Inc. | | | 397 | | | | 616 | | |
Invincible Investment Corp. REIT | | | 2,340 | | | | 966 | | |
Japan Hotel REIT Investment Corp. | | | 2,415 | | | | 1,727 | | |
Japan Real Estate Investment Corp. REIT | | | 1,089 | | | | 6,116 | | |
Japan Retail Fund Investment Corp. REIT | | | 2,314 | | | | 4,633 | | |
Kenedix Office Investment Corp. REIT | | | 219 | | | | 1,398 | | |
Mitsubishi Estate Co., Ltd. | | | 964,700 | | | | 15,118 | | |
Mitsui Fudosan Co., Ltd. | | | 673,500 | | | | 14,923 | | |
Mori Trust Sogo Reit, Inc. | | | 929 | | | | 1,351 | | |
Nippon Building Fund, Inc. REIT | | | 1,381 | | | | 8,697 | | |
Nippon Prologis, Inc. REIT | | | 1,279 | | | | 2,700 | | |
Nomura Real Estate Holdings, Inc. | | | 9,400 | | | | 172 | | |
Nomura Real Estate Master Fund, Inc. REIT | | | 3,498 | | | | 4,603 | | |
Orix, Inc. J-REIT | | | 637 | | | | 1,059 | | |
Premier Investment Corp. REIT | | | 1,192 | | | | 1,356 | | |
Sumitomo Realty & Development Co., Ltd. | | | 226,400 | | | | 8,269 | | |
Tokyo Tatemono Co., Ltd. | | | 24,400 | | | | 252 | | |
United Urban Investment Corp. REIT | | | 2,681 | | | | 4,157 | | |
| | | | 89,750 | | |
Malta (0.0%) | |
BGP Holdings PLC (a)(c)(d) | | | 12,867,024 | | | | 15 | | |
Netherlands (0.5%) | |
Eurocommercial Properties N.V. CVA REIT | | | 124,565 | | | | 3,850 | | |
NSI NV REIT | | | 10,529 | | | | 412 | | |
| | | | 4,262 | | |
The accompanying notes are an integral part of the financial statements.
8
Morgan Stanley Institutional Fund, Inc.
Annual Report — December 31, 2018
Portfolio of Investments (cont'd)
Global Real Estate Portfolio
| | | Shares | | Value
(000) | |
Norway (0.4%) | |
Entra ASA | | | 233,631 | | | $ | 3,103 | | |
Norwegian Property ASA | | | 415,440 | | | | 509 | | |
| | | | 3,612 | | |
Singapore (0.9%) | |
APAC Realty Ltd. | | | 829,300 | | | | 271 | | |
Ascendas Real Estate Investment Trust REIT | | | 553,600 | | | | 1,041 | | |
CapitaLand Commercial Trust REIT | | | 1,516,495 | | | | 1,943 | | |
CapitaLand Mall Trust REIT | | | 971,800 | | | | 1,608 | | |
City Developments Ltd. | | | 67,500 | | | | 401 | | |
Mapletree Logistics Trust REIT | | | 612,500 | | | | 565 | | |
Suntec Real Estate Investment Trust REIT | | | 383,000 | | | | 499 | | |
UOL Group Ltd. | | | 308,676 | | | | 1,397 | | |
| | | | 7,725 | | |
Spain (0.9%) | |
Inmobiliaria Colonial Socimi SA REIT | | | 221,607 | | | | 2,060 | | |
Merlin Properties Socimi SA REIT | | | 492,682 | | | | 6,087 | | |
| | | | 8,147 | | |
Sweden (0.8%) | |
Atrium Ljungberg AB, Class B | | | 89,746 | | | | 1,541 | | |
Castellum AB | | | 79,336 | | | | 1,460 | | |
Hufvudstaden AB, Class A | | | 193,297 | | | | 2,991 | | |
Kungsleden AB | | | 161,891 | | | | 1,150 | | |
| | | | 7,142 | | |
Switzerland (0.3%) | |
PSP Swiss Property AG (Registered) | | | 27,282 | | | | 2,686 | | |
United Kingdom (5.3%) | |
British Land Co., PLC (The) REIT | | | 1,788,396 | | | | 12,152 | | |
Derwent London PLC REIT | | | 152,668 | | | | 5,541 | | |
Grainger PLC | | | 513,212 | | | | 1,372 | | |
Great Portland Estates PLC REIT | | | 597,151 | | | | 5,004 | | |
Hammerson PLC REIT | | | 369,800 | | | | 1,549 | | |
Intu Properties PLC REIT | | | 505,222 | | | | 730 | | |
Land Securities Group PLC REIT | | | 1,256,609 | | | | 12,882 | | |
LXB Retail Properties PLC (a) | | | 3,172,353 | | | | 458 | | |
Segro PLC REIT | | | 262,980 | | | | 1,972 | | |
Shaftesbury PLC REIT | | | 50,308 | | | | 532 | | |
St. Modwen Properties PLC | | | 388,981 | | | | 1,960 | | |
Urban & Civic PLC | | | 816,343 | | | | 2,720 | | |
Workspace Group PLC REIT | | | 74,617 | | | | 753 | | |
| | | | 47,625 | | |
United States (53.6%) | |
Alexandria Real Estate Equities, Inc. REIT | | | 50,495 | | | | 5,819 | | |
American Campus Communities, Inc. REIT | | | 117,160 | | | | 4,849 | | |
American Homes 4 Rent, Class A REIT | | | 446,172 | | | | 8,856 | | |
Apartment Investment & Management Co.,
Class A REIT | | | 83,380 | | | | 3,659 | | |
AvalonBay Communities, Inc. REIT | | | 152,022 | | | | 26,459 | | |
Boston Properties, Inc. REIT | | | 248,472 | | | | 27,966 | | |
Brandywine Realty Trust REIT | | | 217,698 | | | | 2,802 | | |
Brixmor Property Group, Inc. REIT | | | 904,184 | | | | 13,282 | | |
Camden Property Trust REIT | | | 106,095 | | | | 9,342 | | |
| | | Shares | | Value
(000) | |
Chesapeake Lodging Trust REIT | | | 222,418 | | | $ | 5,416 | | |
Columbia Property Trust, Inc. REIT | | | 347,247 | | | | 6,719 | | |
Corporate Office Properties Trust REIT | | | 109,679 | | | | 2,307 | | |
Cousins Properties, Inc. REIT | | | 279,878 | | | | 2,211 | | |
CubeSmart REIT | | | 263,806 | | | | 7,569 | | |
DiamondRock Hospitality Co. REIT | | | 438,714 | | | | 3,983 | | |
Digital Realty Trust, Inc. REIT | | | 74,157 | | | | 7,901 | | |
Duke Realty Corp. REIT | | | 103,650 | | | | 2,685 | | |
Empire State Realty Trust, Inc., Class A REIT | | | 122,890 | | | | 1,749 | | |
Equity Residential REIT | | | 236,559 | | | | 15,615 | | |
Essex Property Trust, Inc. REIT | | | 29,802 | | | | 7,308 | | |
Exeter Industrial Value Fund, LP (a)(c)(d)(e) | | | 1,860,000 | | | | 130 | | |
Extra Space Storage, Inc. REIT | | | 51,305 | | | | 4,642 | | |
Gaming and Leisure Properties, Inc. REIT | | | 138,750 | | | | 4,483 | | |
HCP, Inc. REIT | | | 91,824 | | | | 2,565 | | |
Healthcare Realty Trust, Inc. REIT | | | 455,270 | | | | 12,948 | | |
Healthcare Trust of America, Inc., Class A REIT | | | 152,659 | | | | 3,864 | | |
Host Hotels & Resorts, Inc. REIT | | | 1,348,816 | | | | 22,485 | | |
Hudson Pacific Properties, Inc. REIT | | | 196,886 | | | | 5,721 | | |
Invitation Homes, Inc. REIT | | | 415,927 | | | | 8,352 | | |
JBG SMITH Properties REIT | | | 106,949 | | | | 3,723 | | |
Kilroy Realty Corp. REIT | | | 53,507 | | | | 3,364 | | |
Kimco Realty Corp. REIT | | | 137,949 | | | | 2,021 | | |
Lexington Realty Trust REIT | | | 201,240 | | | | 1,652 | | |
Life Storage, Inc. REIT | | | 19,654 | | | | 1,828 | | |
Macerich Co. (The) REIT | | | 450,335 | | | | 19,490 | | |
Mack-Cali Realty Corp. REIT | | | 339,954 | | | | 6,660 | | |
Mid-America Apartment Communities, Inc. REIT | | | 63,776 | | | | 6,103 | | |
Paramount Group, Inc. REIT | | | 895,807 | | | | 11,251 | | |
ProLogis, Inc. REIT | | | 467,803 | | | | 27,469 | | |
Public Storage REIT | | | 49,750 | | | | 10,070 | | |
QTS Realty Trust, Inc., Class A REIT | | | 114,569 | | | | 4,245 | | |
Regency Centers Corp. REIT | | | 257,012 | | | | 15,081 | | |
RLJ Lodging Trust REIT | | | 757,202 | | | | 12,418 | | |
Simon Property Group, Inc. REIT | | | 326,236 | | | | 54,804 | | |
SL Green Realty Corp. REIT | | | 395,760 | | | | 31,297 | | |
Sunstone Hotel Investors, Inc. REIT | | | 244,250 | | | | 3,178 | | |
Tier REIT, Inc. REIT | | | 118,163 | | | | 2,438 | | |
UDR, Inc. REIT | | | 104,495 | | | | 4,140 | | |
Ventas, Inc. REIT | | | 75,125 | | | | 4,402 | | |
Vornado Realty Trust REIT | | | 269,512 | | | | 16,718 | | |
Welltower, Inc. REIT | | | 70,005 | | | | 4,859 | | |
| | | | 478,898 | | |
Total Investments (99.6%) (Cost $789,915) (f)(g) | | | 889,971 | | |
Other Assets in Excess of Liabilities (0.4%) | | | 3,798 | | |
Net Assets (100.0%) | | $ | 893,769 | | |
Country assignments and aggregations are based generally on third party vendor classifications and information, and may be different from the assignments and aggregations under the policies set forth in the Fund's prospectus and/or statement of additional information relating to geographic classifications.
The accompanying notes are an integral part of the financial statements.
9
Morgan Stanley Institutional Fund, Inc.
Annual Report — December 31, 2018
Portfolio of Investments (cont'd)
Global Real Estate Portfolio
(a) Non-income producing security.
(b) Security trades on the Hong Kong exchange.
(c) At December 31, 2018, the Fund held fair valued securities valued at approximately $145,000, representing less than 0.05% of net assets. These securities have been fair valued as determined in good faith under procedures established by and under the general supervision of the Company's Directors.
(d) Security has been deemed illiquid at December 31, 2018.
(e) Restricted security valued at fair value and not registered under the Securities Act of 1933. Exeter Industrial Value Fund, LP was acquired between 11/07 — 4/11 and has a current cost basis of $0. At December 31, 2018, this security had an aggregate market value of approximately $130,000, representing less than 0.05% of net assets.
(f) The approximate fair value and percentage of net assets, $394,446,000 and 44.1%, respectively, represent the securities that have been fair valued under the fair valuation policy for international investments as described in Note A-1 within the Notes to the Financial Statements.
(g) At December 31, 2018, the aggregate cost for federal income tax purposes is approximately $830,653,000. The aggregate gross unrealized appreciation is approximately $112,664,000 and the aggregate gross unrealized depreciation is approximately $53,346,000, resulting in net unrealized appreciation of approximately $59,318,000.
CVA Certificaten Van Aandelen.
REIT Real Estate Investment Trust.
Portfolio Composition
Classification | | Percentage of
Total Investments | |
Diversified | | | 26.4 | % | |
Retail | | | 22.9 | | |
Office | | | 19.6 | | |
Residential | | | 14.3 | | |
Other* | | | 11.3 | | |
Lodging/Resorts | | | 5.5 | | |
Total Investments | | | 100.0 | % | |
* Industries and/or investment types representing less than 5% of total investments.
The accompanying notes are an integral part of the financial statements.
10
Morgan Stanley Institutional Fund, Inc.
Annual Report — December 31, 2018
Global Real Estate Portfolio
Statement of Assets and Liabilities | | December 31, 2018
(000) | |
Assets: | |
Investments in Securities of Unaffiliated Issuers, at Value (Cost $789,915) | | $ | 889,971 | | |
Foreign Currency, at Value (Cost $671) | | | 665 | | |
Receivable for Investments Sold | | | 5,654 | | |
Dividends Receivable | | | 3,770 | | |
Receivable for Fund Shares Sold | | | 593 | | |
Tax Reclaim Receivable | | | 428 | | |
Receivable from Affiliate | | | 5 | | |
Other Assets | | | 108 | | |
Total Assets | | | 901,194 | | |
Liabilities: | |
Payable for Fund Shares Redeemed | | | 3,670 | | |
Payable for Advisory Fees | | | 1,886 | | |
Payable for Investments Purchased | | | 982 | | |
Bank Overdraft | | | 515 | | |
Payable for Sub Transfer Agency Fees — Class I | | | 97 | | |
Payable for Sub Transfer Agency Fees — Class A | | | 1 | | |
Payable for Sub Transfer Agency Fees — Class L | | | — | @ | |
Payable for Administration Fees | | | 64 | | |
Payable for Professional Fees | | | 59 | | |
Payable for Custodian Fees | | | 48 | | |
Payable for Transfer Agency Fees — Class I | | | 7 | | |
Payable for Transfer Agency Fees — Class A | | | 6 | | |
Payable for Transfer Agency Fees — Class L | | | 1 | | |
Payable for Transfer Agency Fees — Class C | | | 1 | | |
Payable for Transfer Agency Fees — Class IS | | | 5 | | |
Payable for Transfer Agency Fees — Class IR | | | — | @ | |
Payable for Shareholder Services Fees — Class A | | | 3 | | |
Payable for Distribution and Shareholder Services Fees — Class L | | | 1 | | |
Payable for Distribution and Shareholder Services Fees — Class C | | | — | @ | |
Other Liabilities | | | 79 | | |
Total Liabilities | | | 7,425 | | |
Net Assets | | $ | 893,769 | | |
Net Assets Consist of: | |
Paid-in-Capital | | $ | 822,813 | | |
Total Distributable Earnings | | | 70,956 | | |
Net Assets | | $ | 893,769 | | |
The accompanying notes are an integral part of the financial statements.
11
Morgan Stanley Institutional Fund, Inc.
Annual Report — December 31, 2018
Global Real Estate Portfolio
Statement of Assets and Liabilities (cont'd) | | December 31, 2018
(000) | |
CLASS I: | |
Net Assets | | $ | 361,680 | | |
| Shares Outstanding $0.001 par value shares of beneficial interest (unlimited shares authorized) (not in 000's) | | | 39,345,517 | | |
Net Asset Value, Offering and Redemption Price Per Share | | $ | 9.19 | | |
CLASS A: | |
Net Assets | | $ | 12,775 | | |
| Shares Outstanding $0.001 par value shares of beneficial interest (unlimited shares authorized) (not in 000's) | | | 1,393,850 | | |
Net Asset Value, Redemption Price Per Share | | $ | 9.17 | | |
Maximum Sales Load | | | 5.25 | % | |
Maximum Sales Charge | | $ | 0.51 | | |
Maximum Offering Price Per Share | | $ | 9.68 | | |
CLASS L: | |
Net Assets | | $ | 1,220 | | |
| Shares Outstanding $0.001 par value shares of beneficial interest (unlimited shares authorized) (not in 000's) | | | 134,253 | | |
Net Asset Value, Offering and Redemption Price Per Share | | $ | 9.09 | | |
CLASS C: | |
Net Assets | | $ | 428 | | |
| Shares Outstanding $0.001 par value shares of beneficial interest (unlimited shares authorized) (not in 000's) | | | 48,010 | | |
Net Asset Value, Offering and Redemption Price Per Share | | $ | 8.92 | | |
CLASS IS: | |
Net Assets | | $ | 517,658 | | |
| Shares Outstanding $0.001 par value shares of beneficial interest (unlimited shares authorized) (not in 000's) | | | 56,317,518 | | |
Net Asset Value, Offering and Redemption Price Per Share | | $ | 9.19 | | |
CLASS IR: | |
Net Assets | | $ | 8 | | |
| Shares Outstanding $0.001 par value shares of beneficial interest (unlimited shares authorized) (not in 000's) | | | 902 | | |
Net Asset Value, Offering and Redemption Price Per Share | | $ | 9.19 | | |
@ Amount is less than $500.
The accompanying notes are an integral part of the financial statements.
12
Morgan Stanley Institutional Fund, Inc.
Annual Report — December 31, 2018
Global Real Estate Portfolio
Statement of Operations | | Year Ended
December 31, 2018
(000) | |
Investment Income: | |
Dividends from Securities of Unaffiliated Issuers (Net of $1,799 of Foreign Taxes Withheld) | | $ | 44,156 | | |
Dividends from Security of Affiliated Issuer (Note G) | | | 119 | | |
Total Investment Income | | | 44,275 | | |
Expenses: | |
Advisory Fees (Note B) | | | 10,350 | | |
Administration Fees (Note C) | | | 999 | | |
Sub Transfer Agency Fees — Class I | | | 727 | | |
Sub Transfer Agency Fees — Class A | | | 14 | | |
Sub Transfer Agency Fees — Class L | | | 1 | | |
Sub Transfer Agency Fees — Class C | | | — | @ | |
Professional Fees | | | 122 | | |
Custodian Fees (Note F) | | | 105 | | |
Registration Fees | | | 100 | | |
Shareholder Reporting Fees | | | 74 | | |
Transfer Agency Fees — Class I (Note E) | | | 18 | | |
Transfer Agency Fees — Class A (Note E) | | | 16 | | |
Transfer Agency Fees — Class L (Note E) | | | 2 | | |
Transfer Agency Fees — Class C (Note E) | | | 2 | | |
Transfer Agency Fees — Class IS (Note E) | | | 14 | | |
Transfer Agency Fees — Class IR (Note E) | | | 1 | | |
Shareholder Services Fees — Class A (Note D) | | | 38 | | |
Distribution and Shareholder Services Fees — Class L (Note D) | | | 7 | | |
Distribution and Shareholder Services Fees — Class C (Note D) | | | 5 | | |
Directors' Fees and Expenses | | | 37 | | |
Pricing Fees | | | 9 | | |
Other Expenses | | | 44 | | |
Expenses Before Non Operating Expenses | | | 12,685 | | |
Bank Overdraft Expense | | | 40 | | |
Total Expenses | | | 12,725 | | |
Reimbursement of Class Specific Expenses — Class I (Note B) | | | (355 | ) | |
Reimbursement of Class Specific Expenses — Class A (Note B) | | | (3 | ) | |
Reimbursement of Class Specific Expenses — Class L (Note B) | | | (1 | ) | |
Reimbursement of Class Specific Expenses — Class C (Note B) | | | (2 | ) | |
Reimbursement of Class Specific Expenses — Class IR (Note B) | | | (1 | ) | |
Rebate from Morgan Stanley Affiliate (Note G) | | | (15 | ) | |
Net Expenses | | | 12,348 | | |
Net Investment Income | | | 31,927 | | |
Realized Gain (Loss): | |
Investments Sold | | | 98,082 | | |
Foreign Currency Translation | | | (208 | ) | |
Net Realized Gain | | | 97,874 | | |
Change in Unrealized Appreciation (Depreciation): | |
Investments | | | (211,671 | ) | |
Foreign Currency Translation | | | (121 | ) | |
Net Change in Unrealized Appreciation (Depreciation) | | | (211,792 | ) | |
Net Realized Gain and Change in Unrealized Appreciation (Depreciation) | | | (113,918 | ) | |
Net Decrease in Net Assets Resulting from Operations | | $ | (81,991 | ) | |
@ Amount is less than $500.
The accompanying notes are an integral part of the financial statements.
13
Morgan Stanley Institutional Fund, Inc.
Annual Report — December 31, 2018
Global Real Estate Portfolio
Statements of Changes in Net Assets | | Year Ended
December 31, 2018
(000) | | Year Ended
December 31, 2017
(000) | |
Increase (Decrease) in Net Assets: | |
Operations: | |
Net Investment Income | | $ | 31,927 | | | $ | 34,217 | | |
Net Realized Gain | | | 97,874 | | | | 97,631 | | |
Net Change in Unrealized Appreciation (Depreciation) | | | (211,792 | ) | | | 13,074 | | |
Net Increase (Decrease) in Net Assets Resulting from Operations | | | (81,991 | ) | | | 144,922 | | |
Dividends and Distributions to Shareholders: | |
Class I | | | (43,049 | ) | | | (30,863 | )* | |
Class A | | | (1,425 | ) | | | (1,040 | )* | |
Class L | | | (74 | ) | | | (68 | )* | |
Class C | | | (44 | ) | | | (16 | )* | |
Class IS | | | (59,675 | ) | | | (60,500 | )* | |
Class IR | | | (1 | ) | | | — | | |
Total Dividends and Distributions to Shareholders | | | (104,268 | ) | | | (92,487 | ) | |
Capital Share Transactions:(1) | |
Class I: | |
Subscribed | | | 88,211 | | | | 238,648 | | |
Distributions Reinvested | | | 32,086 | | | | 23,199 | | |
Redeemed | | | (235,198 | ) | | | (191,961 | ) | |
Class A: | |
Subscribed | | | 1,604 | | | | 6,572 | | |
Distributions Reinvested | | | 1,415 | | | | 1,029 | | |
Redeemed | | | (5,260 | ) | | | (84,462 | ) | |
Class L: | |
Exchanged | | | 518 | | | | 2 | | |
Distributions Reinvested | | | 74 | | | | 67 | | |
Redeemed | | | (567 | ) | | | (256 | ) | |
Class C: | |
Subscribed | | | 200 | | | | 13 | | |
Distributions Reinvested | | | 43 | | | | 16 | | |
Redeemed | | | (53 | ) | | | (18 | ) | |
Class IS: | |
Subscribed | | | 106,012 | | | | 162,578 | | |
Distributions Reinvested | | | 57,230 | | | | 56,577 | | |
Redeemed | | | (588,634 | ) | | | (463,908 | ) | |
Class IR: | |
Subscribed | | | 10 | (a) | | | — | | |
Net Decrease in Net Assets Resulting from Capital Share Transactions | | | (542,309 | ) | | | (251,904 | ) | |
Total Decrease in Net Assets | | | (728,568 | ) | | | (199,469 | ) | |
Net Assets: | |
Beginning of Period | | | 1,622,337 | | | | 1,821,806 | | |
End of Period | | $ | 893,769 | | | $ | 1,622,337 | † | |
The accompanying notes are an integral part of the financial statements.
14
Morgan Stanley Institutional Fund, Inc.
Annual Report — December 31, 2018
Global Real Estate Portfolio
Statements of Changes in Net Assets (cont'd) | | Year Ended
December 31, 2018
(000) | | Year Ended
December 31, 2017
(000) | |
(1) Capital Share Transactions: | |
Class I: | |
Shares Subscribed | | | 8,284 | | | | 21,034 | | |
Shares Issued on Distributions Reinvested | | | 3,281 | | | | 2,077 | | |
Shares Redeemed | | | (21,915 | ) | | | (17,249 | ) | |
Net Increase (Decrease) in Class I Shares Outstanding | | | (10,350 | ) | | | 5,862 | | |
Class A: | |
Shares Subscribed | | | 149 | | | | 593 | | |
Shares Issued on Distributions Reinvested | | | 145 | | | | 92 | | |
Shares Redeemed | | | (495 | ) | | | (7,750 | ) | |
Net Decrease in Class A Shares Outstanding | | | (201 | ) | | | (7,065 | ) | |
Class L: | |
Shares Exchanged | | | 57 | | | | — | @@ | |
Shares Issued on Distributions Reinvested | | | 8 | | | | 6 | | |
Shares Redeemed | | | (53 | ) | | | (23 | ) | |
Net Increase (Decrease) in Class L Shares Outstanding | | | 12 | | | | (17 | ) | |
Class C: | |
Shares Subscribed | | | 18 | | | | 1 | | |
Shares Issued on Distributions Reinvested | | | 5 | | | | 2 | | |
Shares Redeemed | | | (5 | ) | | | (2 | ) | |
Net Increase in Class C Shares Outstanding | | | 18 | | | | 1 | | |
Class IS: | |
Shares Subscribed | | | 9,846 | | | | 14,534 | | |
Shares Issued on Distributions Reinvested | | | 5,868 | | | | 5,065 | | |
Shares Redeemed | | | (53,663 | ) | | | (41,989 | ) | |
Net Decrease in Class IS Shares Outstanding | | | (37,949 | ) | | | (22,390 | ) | |
Class IR: | |
Shares Subscribed | | | 1 | (a) | | | — | | |
(a) For the period June 15, 2018 through December 31, 2018.
@@ Amount is less than 500 shares.
The following information was previously reported in the December 31, 2017 financial statements. The distribution information for the year ended December 31, 2017 presented on the Statements of Changes in Net Assets is presented for comparative purposes to the December 31, 2018 financial statements, which conform to the SEC Final Rule on Disclosure Update and Simplification which was effective November 5, 2018.
* Dividends and Distributions to Shareholders for the year ended December 31, 2017 were as follows:
Class I: | |
Net Investment Income | | $ | (6,871 | ) | |
Net Realized Gain | | $ | (23,992 | ) | |
Class A: | |
Net Investment Income | | $ | (157 | ) | |
Net Realized Gain | | $ | (883 | ) | |
Class L: | |
Net Investment Income | | $ | (6 | ) | |
Net Realized Gain | | $ | (62 | ) | |
Class C: | |
Net Investment Income | | $ | (1 | ) | |
Net Realized Gain | | $ | (15 | ) | |
Class IS: | |
Net Investment Income | | $ | (13,965 | ) | |
Net Realized Gain | | $ | (46,535 | ) | |
† Distributions in Excess of Net Investment Income for the year ended December 31, 2017 was $(4,412).
The accompanying notes are an integral part of the financial statements.
15
Morgan Stanley Institutional Fund, Inc.
Annual Report — December 31, 2018
Financial Highlights
Global Real Estate Portfolio
| | | Class I | |
| | | Year Ended December 31, | |
Selected Per Share Data and Ratios | | 2018 | | 2017 | | 2016(1) | | 2015 | | 2014 | |
Net Asset Value, Beginning of Period | | $ | 11.13 | | | $ | 10.76 | | | $ | 10.80 | | | $ | 11.10 | | | $ | 9.91 | | |
Income (Loss) from Investment Operations: | |
Net Investment Income(2) | | | 0.27 | | | | 0.25 | | | | 0.21 | | | | 0.18 | | | | 0.20 | | |
Net Realized and Unrealized Gain (Loss) | | | (1.11 | ) | | | 0.80 | | | | 0.15 | | | | (0.28 | ) | | | 1.19 | | |
Total from Investment Operations | | | (0.84 | ) | | | 1.05 | | | | 0.36 | | | | (0.10 | ) | | | 1.39 | | |
Distributions from and/or in Excess of: | |
Net Investment Income | | | (0.51 | ) | | | (0.15 | ) | | | (0.34 | ) | | | (0.20 | ) | | | (0.20 | ) | |
Net Realized Gain | | | (0.59 | ) | | | (0.53 | ) | | | (0.40 | ) | | | — | | | | — | | |
Paid-in-Capital | | | — | | | | — | | | | (0.02 | ) | | | — | | | | — | | |
Total Distributions | | | (1.10 | ) | | | (0.68 | ) | | | (0.40 | ) | | | (0.20 | ) | | | (0.20 | ) | |
Net Asset Value, End of Period | | $ | 9.19 | | | $ | 11.13 | | | $ | 10.76 | | | $ | 10.80 | | | $ | 11.10 | | |
Total Return(3) | | | (7.92 | )% | | | 9.73 | % | | | 3.42 | % | | | (0.94 | )% | | | 14.08 | % | |
Ratios and Supplemental Data: | |
Net Assets, End of Period (Thousands) | | $ | 361,680 | | | $ | 553,319 | | | $ | 471,790 | | | $ | 1,192,624 | | | $ | 1,828,656 | | |
Ratio of Expenses to Average Net Assets(7) | | | 1.03 | %(4)(5) | | | 1.05 | %(4) | | | 1.04 | %(4) | | | 1.05 | %(4) | | | 1.05 | %(4) | |
Ratio of Expenses to Average Net Assets Excluding Non Operating Expenses | | | 1.03 | %(4) | | | 1.05 | %(4) | | | N/A | | | | 1.05 | %(4) | | | N/A | | |
Ratio of Net Investment Income to Average Net Assets(7) | | | 2.54 | %(4) | | | 2.20 | %(4) | | | 1.88 | %(4) | | | 1.65 | %(4) | | | 1.85 | %(4) | |
Ratio of Rebate from Morgan Stanley Affiliates to Average Net Assets | | | 0.00 | %(6) | | | 0.00 | %(6) | | | 0.00 | %(6) | | | 0.00 | %(6) | | | 0.00 | %(6) | |
Portfolio Turnover Rate | | | 38 | % | | | 39 | % | | | 26 | % | | | 29 | % | | | 32 | % | |
(7) Supplemental Information on the Ratios to Average Net Assets: | |
Ratios Before Expense Limitation: | |
Expenses to Average Net Assets | | | 1.10 | % | | | 1.07 | % | | | 1.04 | % | | | 1.05 | % | | | 1.05 | % | |
Net Investment Income to Average Net Assets | | | 2.47 | % | | | 2.18 | % | | | 1.88 | % | | | 1.65 | % | | | 1.85 | % | |
(1) Reflects prior period Custodian out-of-pocket expenses that were reimbursed in September 2016. The amount of the reimbursement was immaterial on a per share basis and did not impact the total return of Class I shares. The Ratio of Expenses to Average Net Assets would have been less than 0.005% higher and the Ratio of Net Investment Income to Average Net Assets would have been less than 0.005% lower had the Custodian not reimbursed the Fund.
(2) Per share amount is based on average shares outstanding.
(3) Calculated based on the net asset value as of the last business day of the period.
(4) The Ratios of Expenses and Net Investment Income reflect the rebate of certain Fund expenses in connection with the investments in Morgan Stanley affiliates during the period. The effect of the rebate on the ratios is disclosed in the above table as "Ratio of Rebate from Morgan Stanley Affiliates to Average Net Assets."
(5) Effective July 1, 2018, the Adviser has agreed to limit the ratio of expenses to average net assets to the maximum ratio of 1.00% for Class I shares. Prior to July 1, 2018, the maximum ratio was 1.05% for Class I shares.
(6) Amount is less than 0.005%.
The accompanying notes are an integral part of the financial statements.
16
Morgan Stanley Institutional Fund, Inc.
Annual Report — December 31, 2018
Financial Highlights
Global Real Estate Portfolio
| | | Class A | |
| | | Year Ended December 31, | |
Selected Per Share Data and Ratios | | 2018 | | 2017 | | 2016(1) | | 2015 | | 2014 | |
Net Asset Value, Beginning of Period | | $ | 11.10 | | | $ | 10.71 | | | $ | 10.74 | | | $ | 11.05 | | | $ | 9.86 | | |
Income (Loss) from Investment Operations: | |
Net Investment Income(2) | | | 0.23 | | | | 0.17 | | | | 0.17 | | | | 0.16 | | | | 0.17 | | |
Net Realized and Unrealized Gain (Loss) | | | (1.10 | ) | | | 0.84 | | | | 0.16 | | | | (0.30 | ) | | | 1.19 | | |
Total from Investment Operations | | | (0.87 | ) | | | 1.01 | | | | 0.33 | | | | (0.14 | ) | | | 1.36 | | |
Distributions from and/or in Excess of: | |
Net Investment Income | | | (0.47 | ) | | | (0.09 | ) | | | (0.30 | ) | | | (0.17 | ) | | | (0.17 | ) | |
Net Realized Gain | | | (0.59 | ) | | | (0.53 | ) | | | (0.04 | ) | | | — | | | | — | | |
Paid-in-Capital | | | — | | | | — | | | | (0.02 | ) | | | — | | | | — | | |
Total Distributions | | | (1.06 | ) | | | (0.62 | ) | | | (0.36 | ) | | | (0.17 | ) | | | (0.17 | ) | |
Net Asset Value, End of Period | | $ | 9.17 | | | $ | 11.10 | | | $ | 10.71 | | | $ | 10.74 | | | $ | 11.05 | | |
Total Return(3) | | | (8.19 | )% | | | 9.44 | % | | | 3.12 | % | | | (1.25 | )% | | | 13.88 | % | |
Ratios and Supplemental Data: | |
Net Assets, End of Period (Thousands) | | $ | 12,775 | | | $ | 17,701 | | | $ | 92,730 | | | $ | 135,517 | | | $ | 105,766 | | |
Ratio of Expenses to Average Net Assets(7) | | | 1.38 | %(4)(5) | | | 1.35 | %(4) | | | 1.35 | %(4) | | | 1.34 | %(4) | | | 1.31 | %(4) | |
Ratio of Expenses to Average Net Assets Excluding Non Operating Expenses | | | 1.38 | %(4) | | | 1.35 | %(4) | | | N/A | | | | 1.34 | %(4) | | | N/A | | |
Ratio of Net Investment Income to Average Net Assets(7) | | | 2.18 | %(4) | | | 1.55 | %(4) | | | 1.51 | %(4) | | | 1.47 | %(4) | | | 1.60 | %(4) | |
Ratio of Rebate from Morgan Stanley Affiliates to Average Net Assets | | | 0.00 | %(6) | | | 0.00 | %(6) | | | 0.00 | %(6) | | | 0.00 | %(6) | | | 0.00 | %(6) | |
Portfolio Turnover Rate | | | 38 | % | | | 39 | % | | | 26 | % | | | 29 | % | | | 32 | % | |
(7) Supplemental Information on the Ratios to Average Net Assets: | |
Ratios Before Expense Limitation: | |
Expenses to Average Net Assets | | | 1.39 | % | | | N/A | | | | 1.36 | % | | | N/A | | | | N/A | | |
Net Investment Income to Average Net Assets | | | 2.17 | % | | | N/A | | | | 1.50 | % | | | N/A | | | | N/A | | |
(1) Reflects prior period Custodian out-of-pocket expenses that were reimbursed in September 2016. The amount of the reimbursement was immaterial on a per share basis and did not impact the total return of Class A shares. The Ratio of Expenses to Average Net Assets would have been 0.01% higher and the Ratio of Net Investment Income to Average Net Assets would have been 0.01% lower had the Custodian not reimbursed the Fund.
(2) Per share amount is based on average shares outstanding.
(3) Calculated based on the net asset value which does not reflect sales charges, if applicable, as of the last business day of the period.
(4) The Ratios of Expenses and Net Investment Income reflect the rebate of certain Fund expenses in connection with the investments in Morgan Stanley affiliates during the period. The effect of the rebate on the ratios is disclosed in the above table as "Ratio of Rebate from Morgan Stanley Affiliates to Average Net Assets."
(5) Effective July 1, 2018, the Adviser has agreed to limit the ratio of expenses to average net assets to the maximum ratio of 1.35% for Class A shares. Prior to July 1, 2018, the maximum ratio was 1.40% for Class A shares.
(6) Amount is less than 0.005%.
The accompanying notes are an integral part of the financial statements.
17
Morgan Stanley Institutional Fund, Inc.
Annual Report — December 31, 2018
Financial Highlights
Global Real Estate Portfolio
| | | Class L | |
| | | Year Ended December 31, | |
Selected Per Share Data and Ratios | | 2018 | | 2017 | | 2016(1) | | 2015 | | 2014 | |
Net Asset Value, Beginning of Period | | $ | 11.01 | | | $ | 10.64 | | | $ | 10.61 | | | $ | 10.91 | | | $ | 9.74 | | |
Income (Loss) from Investment Operations: | |
Net Investment Income(2) | | | 0.17 | | | | 0.14 | | | | 0.12 | | | | 0.12 | | | | 0.12 | | |
Net Realized and Unrealized Gain (Loss) | | | (1.09 | ) | | | 0.81 | | | | 0.16 | | | | (0.31 | ) | | | 1.17 | | |
Total from Investment Operations | | | (0.92 | ) | | | 0.95 | | | | 0.28 | | | | (0.19 | ) | | | 1.29 | | |
Distributions from and/or in Excess of: | |
Net Investment Income | | | (0.41 | ) | | | (0.05 | ) | | | (0.19 | ) | | | (0.11 | ) | | | (0.12 | ) | |
Net Realized Gain | | | (0.59 | ) | | | (0.53 | ) | | | (0.04 | ) | | | — | | | | — | | |
Paid-in-Capital | | | — | | | | — | | | | (0.02 | ) | | | — | | | | — | | |
Total Distributions | | | (1.00 | ) | | | (0.58 | ) | | | (0.25 | ) | | | (0.11 | ) | | | (0.12 | ) | |
Net Asset Value, End of Period | | $ | 9.09 | | | $ | 11.01 | | | $ | 10.64 | | | $ | 10.61 | | | $ | 10.91 | | |
Total Return(3) | | | (8.74 | )% | | | 8.89 | % | | | 2.65 | % | | | (1.71 | )% | | | 13.27 | % | |
Ratios and Supplemental Data: | |
Net Assets, End of Period (Thousands) | | $ | 1,220 | | | $ | 1,344 | | | $ | 1,483 | | | $ | 4,509 | | | $ | 4,755 | | |
Ratio of Expenses to Average Net Assets(7) | | | 1.88 | %(4)(5) | | | 1.90 | %(4) | | | 1.82 | %(4) | | | 1.78 | %(4) | | | 1.79 | %(4) | |
Ratio of Expenses to Average Net Assets Excluding Non Operating Expenses | | | 1.88 | %(4) | | | 1.90 | %(4) | | | N/A | | | | 1.77 | %(4) | | | N/A | | |
Ratio of Net Investment Income to Average Net Assets(7) | | | 1.64 | %(4) | | | 1.32 | %(4) | | | 1.07 | %(4) | | | 1.12 | %(4) | | | 1.08 | %(4) | |
Ratio of Rebate from Morgan Stanley Affiliates to Average Net Assets | | | 0.00 | %(6) | | | 0.00 | %(6) | | | 0.00 | %(6) | | | 0.00 | %(6) | | | 0.00 | %(6) | |
Portfolio Turnover Rate | | | 38 | % | | | 39 | % | | | 26 | % | | | 29 | % | | | 32 | % | |
(7) Supplemental Information on the Ratios to Average Net Assets: | |
Ratios Before Expense Limitation: | |
Expenses to Average Net Assets | | | 2.02 | % | | | 1.93 | % | | | 1.82 | % | | | N/A | | | | N/A | | |
Net Investment Income to Average Net Assets | | | 1.50 | % | | | 1.29 | % | | | 1.07 | % | | | N/A | | | | N/A | | |
(1) Reflects prior period Custodian out-of-pocket expenses that were reimbursed in September 2016. The amount of the reimbursement was immaterial on a per share basis and did not impact the total return of Class L shares. The Ratio of Expenses to Average Net Assets would have been less than 0.005% higher and the Ratio of Net Investment Income to Average Net Assets would have been less than 0.005% lower had the Custodian not reimbursed the Fund.
(2) Per share amount is based on average shares outstanding.
(3) Calculated based on the net asset value as of the last business day of the period.
(4) The Ratios of Expenses and Net Investment Income reflect the rebate of certain Fund expenses in connection with the investments in Morgan Stanley affiliates during the period. The effect of the rebate on the ratios is disclosed in the above table as "Ratio of Rebate from Morgan Stanley Affiliates to Average Net Assets."
(5) Effective July 1, 2018, the Adviser has agreed to limit the ratio of expenses to average net assets to the maximum ratio of 1.85% for Class L shares. Prior to July 1, 2018, the maximum ratio was 1.90% for Class L shares.
(6) Amount is less than 0.005%.
The accompanying notes are an integral part of the financial statements.
18
Morgan Stanley Institutional Fund, Inc.
Annual Report — December 31, 2018
Financial Highlights
Global Real Estate Portfolio
| | | Class C | |
| | | Year Ended December 31, | | Period from
April 30, 2015(2) to | |
Selected Per Share Data and Ratios | | 2018 | | 2017 | | 2016(1) | | December 31, 2015 | |
Net Asset Value, Beginning of Period | | $ | 10.83 | | | $ | 10.49 | | | $ | 10.56 | | | $ | 11.23 | | |
Income (Loss) from Investment Operations: | |
Net Investment Income(3) | | | 0.16 | | | | 0.12 | | | | 0.08 | | | | 0.07 | | |
Net Realized and Unrealized Gain (Loss) | | | (1.09 | ) | | | 0.78 | | | | 0.16 | | | | (0.60 | ) | |
Total from Investment Operations | | | (0.93 | ) | | | 0.90 | | | | 0.24 | | | | (0.53 | ) | |
Distributions from and/or in Excess of: | |
Net Investment Income | | | (0.39 | ) | | | (0.03 | ) | | | (0.25 | ) | | | (0.14 | ) | |
Net Realized Gain | | | (0.59 | ) | | | (0.53 | ) | | | (0.04 | ) | | | — | | |
Paid-in-Capital | | | — | | | | — | | | | (0.02 | ) | | | — | | |
Total Distributions | | | (0.98 | ) | | | (0.56 | ) | | | (0.31 | ) | | | (0.14 | ) | |
Net Asset Value, End of Period | | $ | 8.92 | | | $ | 10.83 | | | $ | 10.49 | | | $ | 10.56 | | |
Total Return(4) | | | (8.93 | )% | | | 8.54 | % | | | 2.31 | % | | | (4.71 | )%(8) | |
Ratios and Supplemental Data: | |
Net Assets, End of Period (Thousands) | | $ | 428 | | | $ | 327 | | | $ | 305 | | | $ | 191 | | |
Ratio of Expenses to Average Net Assets(10) | | | 2.16 | %(5)(6) | | | 2.15 | %(5) | | | 2.15 | %(5) | | | 2.15 | %(5)(9) | |
Ratio of Expenses to Average Net Assets Excluding Non Operating Expenses | | | 2.16 | %(5) | | | 2.15 | %(5) | | | N/A | | | | 2.15 | %(5)(9) | |
Ratio of Net Investment Income to Average Net Assets(10) | | | 1.53 | %(5) | | | 1.11 | %(5) | | | 0.75 | %(5) | | | 1.01 | %(5)(9) | |
Ratio of Rebate from Morgan Stanley Affiliates to Average Net Assets | | | 0.00 | %(7) | | | 0.00 | %(7) | | | 0.00 | %(7) | | | 0.00 | %(7)(9) | |
Portfolio Turnover Rate | | | 38 | % | | | 39 | % | | | 26 | % | | | 29 | % | |
(10) Supplemental Information on the Ratios to Average Net Assets: | |
Ratios Before Expense Limitation: | |
Expenses to Average Net Assets | | | 2.47 | % | | | 2.69 | % | | | 2.86 | % | | | 3.25 | %(9) | |
Net Investment Income (Loss) to Average Net Assets | | | 1.22 | % | | | 0.57 | % | | | 0.04 | % | | | (0.09 | )%(9) | |
(1) Reflects prior period Custodian out-of-pocket expenses that were reimbursed in September 2016. The amount of the reimbursement was immaterial on a per share basis and did not impact the total return of Class C shares. The Ratio of Expenses to Average Net Assets and the Ratio of Net Investment Income to Average Net Assets would be unchanged as the reimbursement of Custodian fees was offset against expense waivers/reimbursements with no impact to net expenses or net investment income.
(2) Commencement of Offering.
(3) Per share amount is based on average shares outstanding.
(4) Calculated based on the net asset value which does not reflect sales charges, if applicable, as of the last business day of the period.
(5) The Ratios of Expenses and Net Investment Income reflect the rebate of certain Fund expenses in connection with the investments in Morgan Stanley affiliates during the period. The effect of the rebate on the ratios is disclosed in the above table as "Ratio of Rebate from Morgan Stanley Affiliates to Average Net Assets."
(6) Effective July 1, 2018, the Adviser has agreed to limit the ratio of expenses to average net assets to the maximum ratio of 2.10% for Class C shares. Prior to July 1, 2018, the maximum ratio was 2.15% for Class C shares.
(7) Amount is less than 0.005%.
(8) Not annualized.
(9) Annualized.
The accompanying notes are an integral part of the financial statements.
19
Morgan Stanley Institutional Fund, Inc.
Annual Report — December 31, 2018
Financial Highlights
Global Real Estate Portfolio
| | | Class IS | |
| | | Year Ended December 31, | |
Selected Per Share Data and Ratios | | 2018 | | 2017 | | 2016(1) | | 2015 | | 2014 | |
Net Asset Value, Beginning of Period | | $ | 11.13 | | | $ | 10.76 | | | $ | 10.81 | | | $ | 11.11 | | | $ | 9.91 | | |
Income (Loss) from Investment Operations: | |
Net Investment Income(2) | | | 0.28 | | | | 0.25 | | | | 0.22 | | | | 0.20 | | | | 0.22 | | |
Net Realized and Unrealized Gain (Loss) | | | (1.11 | ) | | | 0.81 | | | | 0.15 | | | | (0.29 | ) | | | 1.19 | | |
Total from Investment Operations | | | (0.83 | ) | | | 1.06 | | | | 0.37 | | | | (0.09 | ) | | | 1.41 | | |
Distributions from and/or in Excess of: | |
Net Investment Income | | | (0.52 | ) | | | (0.16 | ) | | | (0.36 | ) | | | (0.21 | ) | | | (0.21 | ) | |
Net Realized Gain | | | (0.59 | ) | | | (0.53 | ) | | | (0.04 | ) | | | — | | | | — | | |
Paid-in-Capital | | | — | | | | — | | | | (0.02 | ) | | | — | | | | — | | |
Total Distributions | | | (1.11 | ) | | | (0.69 | ) | | | 0.42 | | | | (0.21 | ) | | | (0.21 | ) | |
Net Asset Value, End of Period | | $ | 9.19 | | | $ | 11.13 | | | $ | 10.76 | | | $ | 10.81 | | | $ | 11.11 | | |
Total Return(3) | | | (7.83 | )% | | | 9.80 | % | | | 3.45 | % | | | (0.84 | )% | | | 14.27 | % | |
Ratios and Supplemental Data: | |
Net Assets, End of Period (Thousands) | | $ | 517,658 | | | $ | 1,049,646 | | | $ | 1,255,498 | | | $ | 1,012,883 | | | $ | 586,511 | | |
Ratio of Expenses to Average Net Assets(7) | | | 0.95 | %(4)(5) | | | 0.97 | %(4) | | | 0.96 | %(4) | | | 0.97 | %(4) | | | 0.96 | %(4) | |
Ratio of Expenses to Average Net Assets Excluding Non Operating Expenses | | | 0.95 | %(4) | | | 0.97 | %(4) | | | N/A | | | | 0.97 | %(4) | | | N/A | | |
Ratio of Net Investment Income to Average Net Assets(7) | | | 2.58 | % | | | 2.26 | %(4) | | | 2.01 | %(4) | | | 1.78 | %(4) | | | 2.01 | %(4) | |
Ratio of Rebate from Morgan Stanley Affiliates to Average Net Assets | | | 0.00 | %(6) | | | 0.00 | %(6) | | | 0.00 | %(6) | | | 0.00 | %(6) | | | 0.00 | %(6) | |
Portfolio Turnover Rate | | | 38 | % | | | 39 | % | | | 26 | % | | | 29 | % | | | 32 | % | |
(7) Supplemental Information on the Ratios to Average Net Assets: | |
Ratios Before Expense Limitation: | |
Expenses to Average Net Assets | | | N/A | | | | N/A | | | | 0.97 | % | | | N/A | | | | 0.96 | % | |
Net Investment Income to Average Net Assets | | | N/A | | | | N/A | | | | 2.00 | % | | | N/A | | | | 2.01 | % | |
(1) Reflects prior period Custodian out-of-pocket expenses that were reimbursed in September 2016. The amount of the reimbursement was immaterial on a per share basis and did not impact the total return of Class IS shares. The Ratio of Expenses to Average Net Assets would have been 0.01% higher and the Ratio of Net Investment Income to Average Net Assets would have been 0.01% lower had the Custodian not reimbursed the Fund.
(2) Per share amount is based on average shares outstanding.
(3) Calculated based on the net asset value as of the last business day of the period.
(4) The Ratios of Expenses and Net Investment Income reflect the rebate of certain Fund expenses in connection with the investments in Morgan Stanley affiliates during the period. The effect of the rebate on the ratios is disclosed in the above table as "Ratio of Rebate from Morgan Stanley Affiliates to Average Net Assets."
(5) Effective July 1, 2018, the Adviser has agreed to limit the ratio of expenses to average net assets to the maximum ratio of 0.94% for Class IS shares. Prior to July 1, 2018, the maximum ratio was 0.99% for Class IS shares.
(6) Amount is less than 0.005%.
The accompanying notes are an integral part of the financial statements.
20
Morgan Stanley Institutional Fund, Inc.
Annual Report — December 31, 2018
Financial Highlights
Global Real Estate Portfolio
| | | Class IR | |
| Selected Per Share Data and Ratios | | Period from
June 15, 2018(1) to
December 31, 2018 | |
Net Asset Value, Beginning of Period | | $ | 11.09 | | |
Income (Loss) from Investment Operations: | |
Net Investment Income(2) | | | 0.23 | | |
Net Realized and Unrealized Loss | | | (1.02 | ) | |
Total from Investment Operations | | | (0.79 | ) | |
Distributions from and/or in Excess of: | |
Net Investment Income | | | (0.52 | ) | |
Net Realized Gain | | | (0.59 | ) | |
Total Distributions | | | (1.11 | ) | |
Net Asset Value, End of Period | | $ | 9.19 | | |
Total Return(3) | | | (7.49 | )%(7) | |
Ratios and Supplemental Data: | |
Net Assets, End of Period (Thousands) | | $ | 8 | | |
Ratio of Expenses to Average Net Assets(9) | | | 0.94 | %(4)(5)(8) | |
Ratio of Net Investment Income to Average Net Assets(9) | | | 3.94 | %(4)(8) | |
Ratio of Rebate from Morgan Stanley Affiliates to Average Net Assets | | | 0.00 | %(6)(8) | |
Portfolio Turnover Rate | | | 38 | % | |
(9) Supplemental Information on the Ratios to Average Net Assets: | |
Ratios Before Expense Limitation: | |
Expenses to Average Net Assets | | | 18.72 | %(8) | |
Net Investment Loss to Average Net Assets | | | (13.84 | )%(8) | |
(1) Commencement of Offering.
(2) Per share amount is based on average shares outstanding.
(3) Calculated based on the net asset value as of the last business day of the period.
(4) The Ratios of Expenses and Net Investment Income reflect the rebate of certain Fund expenses in connection with the investments in Morgan Stanley affiliates during the period. The effect of the rebate on the ratios is disclosed in the above table as "Ratio of Rebate from Morgan Stanley Affiliates to Average Net Assets."
(5) Effective July 1, 2018, the Adviser has agreed to limit the ratio of expenses to average net assets to the maximum ratio of 0.94% for Class IR shares. Prior to July 1, 2018, the maximum ratio was 0.99% for Class IR shares.
(6) Amount is less than 0.005%.
(7) Not annualized.
(8) Annualized.
The accompanying notes are an integral part of the financial statements.
21
Morgan Stanley Institutional Fund, Inc.
Annual Report — December 31, 2018
Notes to Financial Statements
Morgan Stanley Institutional Fund, Inc. (the "Company") is registered under the Investment Company Act of 1940, as amended (the "Act"), as an open-end management investment company. The Company is comprised of thirty separate, active, diversified and non-diversified funds (individually referred to as a "Fund", collectively as the "Funds"). The Company applies investment company accounting and reporting guidance.
The accompanying financial statements relate to the Global Real Estate Portfolio. The Fund seeks to provide current income and capital appreciation. The Fund has capital subscription commitments to an investee company for this same purpose, the details of which are disclosed in the Unfunded Commitments note.
The Fund offers six classes of shares — Class I, Class A, Class L, Class C, Class IS, and Class IR. On April 30, 2015, the Fund suspended offering of Class L shares. Existing Class L shareholders may invest through reinvestment of dividends and distributions. On June 15, 2018, the Fund commenced offering Class IR shares.
A. Significant Accounting Policies: The following significant accounting policies are in conformity with U.S. generally accepted accounting principles ("GAAP"). Such policies are consistently followed by the Company in the preparation of its financial statements. GAAP may require management to make estimates and assumptions that affect the reported amounts and disclosures in the financial statements. Actual results may differ from those estimates.
In August 2018, the Financial Accounting Standards Board ("FASB") issued Accounting Standards Update ("ASU") 2018-13, Fair Value Measurement (Topic 820) — Disclosures Framework — Changes to Disclosure Requirements of Fair Value Measurement ("ASU 2018-13") which introduces new fair value disclosure requirements as well as eliminates and modifies certain existing fair value disclosure requirements. ASU 2018-13 would be effective for fiscal years beginning after December 15, 2019 and for interim periods within those fiscal years; however, management has elected to early adopt ASU 2018-13 effective with the current reporting period as permitted by the standard. The impact of the Fund's adoption was limited to changes in the Fund's financial statement disclosures regarding fair value, primarily those disclosures related to transfers between levels of the fair value hierarchy and disclosure of the range and weighted average used to develop significant unobservable inputs for Level 3 fair value measurements, when applicable.
1. Security Valuation: (1) An equity portfolio security listed or traded on an exchange is valued at its latest reported sales price (or at the exchange official closing price if such exchange reports an official closing price), and if there were no sales on a given day and if there is no official exchange closing price for that day, the security is valued at the mean between the last reported bid and asked prices if such bid and asked prices are available on the relevant exchanges. Listed equity securities not traded on the valuation date with no reported bid and asked prices available on the exchange are valued at the mean between the current bid and asked prices obtained from one or more reputable brokers or dealers. In cases where a security is traded on more than one exchange, the security is valued on the exchange designated as the primary market; (2) all other equity portfolio securities for which over-the-counter ("OTC") market quotations are readily available are valued at the latest reported sales price (or at the market official closing price if such market reports an official closing price), and if there was no trading in the security on a given day and if there is no official closing price from relevant markets for that day, the security is valued at the mean between the last reported bid and asked prices if such bid and asked prices are available on the relevant markets. An unlisted equity security that does not trade on the valuation date and for which bid and asked prices from the relevant markets are unavailable is valued at the mean between the current bid and asked prices obtained from one or more reputable brokers or dealers; (3) certain portfolio securities may be valued by an outside pricing service/vendor approved by the Company's Board of Directors (the "Directors"). The pricing service/vendor may employ a pricing model that takes into account, among other things, bids, yield spreads and/or other market data and specific security characteristics. Alternatively, if a valuation is not available from an outside pricing service/vendor, and the security trades on an exchange, the security may be valued at its latest reported sale price (or at the exchange official closing price if such exchange reports an official closing price), prior to the time when assets are valued. If there are no sales on a given day and if there is no official exchange closing price for that day, the security is valued at the mean between the last reported bid and asked prices if such bid and asked prices are available in the relevant exchanges; (4) when market quotations are not readily available, including circumstances under which Morgan Stanley Investment Management Inc. (the
22
Morgan Stanley Institutional Fund, Inc.
Annual Report — December 31, 2018
Notes to Financial Statements (cont'd)
"Adviser") or Morgan Stanley Investment Management Limited ("MSIM Limited") and Morgan Stanley Investment Management Company ("MSIM Company") (together, the "Sub-Advisers"), each a wholly-owned subsidiary of Morgan Stanley, determine that the closing price, last sale price or the mean between the last reported bid and asked prices are not reflective of a security's market value, portfolio securities are valued at their fair value as determined in good faith under procedures established by and under the general supervision of Directors (the "Directors"). Occasionally, developments affecting the closing prices of securities and other assets may occur between the times at which valuations of such securities are determined (that is, close of the foreign market on which the securities trade) and the close of business of the New York Stock Exchange ("NYSE"). If developments occur during such periods that are expected to materially affect the value of such securities, such valuations may be adjusted to reflect the estimated fair value of such securities as of the close of the NYSE, as determined in good faith by the Directors or by the Adviser using a pricing service and/or procedures approved by the Directors; (5) quotations of foreign portfolio securities, other assets and liabilities and forward contracts stated in foreign currency are translated into U.S. dollar equivalents at the prevailing market rates prior to the close of the NYSE; and (6) investments in mutual funds, including the Morgan Stanley Institutional Liquidity Funds, are valued at the net asset value ("NAV") as of the close of each business day.
The Directors have responsibility for determining in good faith the fair value of the investments, and the Directors may appoint others, such as the Company's Adviser or a valuation committee, to assist the Directors in determining fair value and to make the actual calculations pursuant to the fair valuation methodologies previously approved by the Directors. Under procedures approved by the Directors, the Company's Adviser has formed a Valuation Committee whose members are approved by the Directors. The Valuation Committee provides administration and oversight of the Company's valuation policies and procedures, which are reviewed at least annually by the Directors. These procedures allow the Company to utilize independent pricing services, quotations from securities and financial instrument dealers and other market sources to determine fair value.
The Fund invests a significant portion of its assets in securities of real estate investment trusts ("REITs"). The market's perception of prospective declines in private real estate values and other financial assets may result in increased volatility of market prices that can negatively impact the valuation of certain issuers held by the Fund.
2. Fair Value Measurement: FASB Accounting Standards CodificationTM ("ASC") 820, "Fair Value Measurement" ("ASC 820"), defines fair value as the value that the Fund would receive to sell an investment or pay to transfer a liability in a timely transaction with an independent buyer in the principal market, or in the absence of a principal market, the most advantageous market for the investment or liability. ASC 820 establishes a three-tier hierarchy to distinguish between (1) inputs that reflect the assumptions market participants would use in valuing an asset or liability developed based on market data obtained from sources independent of the reporting entity (observable inputs) and (2) inputs that reflect the reporting entity's own assumptions about the assumptions market participants would use in valuing an asset or liability developed based on the best information available in the circumstances (unobservable inputs) and to establish classification of fair value measurements for disclosure purposes. Various inputs are used in determining the value of the Fund's investments. The inputs are summarized in the three broad levels listed below:
• Level 1 – unadjusted quoted prices in active markets for identical investments
• Level 2 – other significant observable inputs (including quoted prices for similar investments, interest rates, prepayment speeds, credit risk, etc.)
• Level 3 – significant unobservable inputs including the Fund's own assumptions in determining the fair value of investments. Factors considered in making this determination may include, but are not limited to, information obtained by contacting the issuer, analysts, or the appropriate stock exchange (for exchange-traded securities), analysis of the issuer's financial statements or other available documents and, if necessary, available information concerning other securities in similar circumstances
23
Morgan Stanley Institutional Fund, Inc.
Annual Report — December 31, 2018
Notes to Financial Statements (cont'd)
The inputs or methodology used for valuing securities are not necessarily an indication of the risk associated with investing in those securities and the determination of the significance of a particular input to the fair value measurement in its entirety requires judgment and considers factors specific to each security.
The following is a summary of the inputs used to value the Fund's investments as of December 31, 2018:
Investment Type | | Level 1
Unadjusted
quoted
prices
(000) | | Level 2
Other
significant
observable
inputs
(000) | | Level 3
Significant
unobservable
inputs
(000) | | Total
(000) | |
Assets: | |
Common Stocks | |
Diversified | | $ | 38,581 | | | $ | 196,430 | | | $ | — | | | $ | 235,011 | | |
Health Care | | | 28,951 | | | | — | | | | — | | | | 28,951 | | |
Industrial | | | 30,154 | | | | 13,663 | | | | 130 | | | | 43,947 | | |
Industrial/Office Mixed | | | 1,652 | | | | 2,191 | | | | — | | | | 3,843 | | |
Lodging/Resorts | | | 47,480 | | | | 1,727 | | | | — | | | | 49,207 | | |
Office | | | 110,304 | | | | 63,941 | | | | — | | | | 174,245 | | |
Residential | | | 94,844 | | | | 31,865 | | | | 15 | | | | 126,724 | | |
Retail | | | 119,305 | | | | 84,629 | | | | — | | | | 203,934 | | |
Self Storage | | | 24,109 | | | | — | | | | — | | | | 24,109 | | |
Total Common Stocks | | | 495,380 | | | | 394,446 | | | | 145 | | | | 889,971 | | |
Total Assets | | $ | 495,380 | | | $ | 394,446 | | | $ | 145 | | | $ | 889,971 | | |
Transfers between investment levels may occur as the markets fluctuate and/or the availability of data used in an investment's valuation changes.
Following is a reconciliation of investments in which significant unobservable inputs (Level 3) were used in determining fair value:
| | | Common
Stocks
(000) | |
Beginning Balance | | $ | 223 | | |
Purchases | | | — | | |
Sales | | | — | | |
Amortization of discount | | | — | | |
Transfers in | | | — | | |
Transfers out | | | — | | |
Corporate actions | | | — | | |
Change in unrealized appreciation (depreciation) | | | (78 | ) | |
Realized gains (losses) | | | — | | |
Ending Balance | | $ | 145 | | |
Net change in unrealized appreciation (depreciation) from investments
still held as of December 31, 2018 | | $ | (78 | ) | |
The following table presents additional information about valuation techniques and inputs used for investments that are measured at fair value and categorized within Level 3 as of December 31, 2018. Various valuation techniques were used in the valuation of certain investments and weighted based on the level of significance. The Fund calculated the weighted averages of the unobservable inputs relative to each investment's fair value as of December 31, 2018.
| | | Fair Value at
December 31, 2018
(000) | | Valuation
Technique | | Unobservable
Input | | Amount* | | Impact to
Valuation from an
Increase in Input†† | |
Common Stocks | | $ | 145 | | | Reported Capital balance,
adjustments for NAV
practical expedient; including,
adjustments for subsequent
Capital Calls, Return of Capital
and Significant Market
Changes between last Capital
Statement and
Valuation Date | | | | | | | | | |
| | | | Market Transaction
Method | | Adjusted Capital Balance
| | | | | | | | | |
| | | | | | | Transaction Valuation | | $ | 0.001 | | | Increase | |
| | | | | | | Discount for Lack of
Marketability | | | 50.0 | % | | Decrease | |
* Amount is indicative of the weighted average.
†† Represents the expected directional change in the fair value of the Level 3 investments that would result from an increase in the corresponding input. A decrease to the unobservable input would have the opposite effect. Significant changes in these inputs could result in significantly higher or lower fair value measurements.
24
Morgan Stanley Institutional Fund, Inc.
Annual Report — December 31, 2018
Notes to Financial Statements (cont'd)
3. Foreign Currency Translation and Foreign Investments: The books and records of the Fund are maintained in U.S. dollars. Foreign currency amounts are translated into U.S. dollars as follows:
– investments, other assets and liabilities at the prevailing rate of exchange on the valuation date;
– investment transactions and investment income at the prevailing rates of exchange on the dates of such transactions.
Although the net assets of the Fund are presented at the foreign exchange rates and market values at the close of the period, the Fund does not isolate that portion of the results of operations arising as a result of changes in the foreign exchange rates from the fluctuations arising from changes in the market prices of securities held at period end. Similarly, the Fund does not isolate the effect of changes in foreign exchange rates from the fluctuations arising from changes in the market prices of securities sold during the period. Accordingly, realized and unrealized foreign currency gains (losses) on investments in securities are included in the reported net realized and unrealized gains (losses) on investment transactions and balances. However, pursuant to U.S. federal income tax regulations, gains and losses from certain foreign currency transactions and the foreign currency portion of gains and losses realized on sales and maturities of foreign denominated debt securities are treated as ordinary income for U.S. federal income tax purposes.
Net realized gains (losses) on foreign currency transactions represent net foreign exchange gains (losses) from foreign currency forward exchange contracts, disposition of foreign currencies, currency gains (losses) realized between the trade and settlement dates on securities transactions, and the difference between the amount of investment income and foreign withholding taxes recorded on the Fund's books and the U.S. dollar equivalent amounts actually received or paid. Net unrealized currency gains (losses) from valuing foreign currency denominated assets and liabilities at period end exchange rates are reflected as a component of unrealized appreciation (depreciation) in the Statement of Assets and Liabilities. The change in unrealized currency gains (losses) on foreign currency translations for the period is reflected in the Statement of Operations.
Foreign security and currency transactions may involve certain considerations and risks not typically associated with those of U.S. dollar denominated transactions as a result of, among other factors, fluctuations of exchange rates in relation to the U.S. dollar, the possibility of lower levels of governmental supervision and regulation of foreign securities markets and the possibility of political or economic instability.
Governmental approval for foreign investments may be required in advance of making an investment under certain circumstances in some countries, and the extent of foreign investments in domestic companies may be subject to limitation in other countries. Foreign ownership limitations also may be imposed by the charters of individual companies to prevent, among other concerns, violations of foreign investment limitations. As a result, an additional class of shares (identified as "Foreign" in the Portfolio of Investments) may be created and offered for investment. The "local" and "foreign shares" market values may differ. In the absence of trading of the foreign shares in such markets, the Fund values the foreign shares at the closing exchange price of the local shares.
4. Unfunded Commitments: Subject to the terms of a Subscription Agreement between the Fund and Exeter Industrial Value Fund LP, the Fund has made a subscription commitment of $2,000,000 for which it will receive 2,000,000 shares of common stock. As of December 31, 2018, Exeter Industrial Value Fund LP has drawn down approximately $1,860,000, which represents 93.0% of the commitment.
5. Restricted Securities: The Fund invests in unregistered or otherwise restricted securities. The term "restricted securities" refers to securities that are unregistered or are held by control persons of the issuer and securities that are subject to contractual restrictions on their resale. As a result, restricted securities may be more difficult to value and the Fund may have difficulty disposing of such assets either in a timely manner or for a reasonable price. In order to dispose of an unregistered security, the Fund, where it has contractual rights to do so, may have to cause such security to be registered. A considerable period may elapse between the time the decision is made to sell the security and the time the security is registered so that the Fund can sell it. Contractual restrictions on the resale of securities vary in length and scope and are generally the result of a negotiation between the issuer and the acquirer of
25
Morgan Stanley Institutional Fund, Inc.
Annual Report — December 31, 2018
Notes to Financial Statements (cont'd)
the securities. The Fund would, in either case, bear market risks during that period. Restricted securities are identified in the Portfolio of Investments.
6. Indemnifications: The Company enters into contracts that contain a variety of indemnifications. The Company's maximum exposure under these arrangements is unknown. However, the Company has not had prior claims or losses pursuant to these contracts and expects the risk of loss to be remote.
7. Dividends and Distributions to Shareholders: Dividends and distributions to shareholders are recorded on the ex-dividend date. Dividends from net investment income, if any, are declared and paid annually. Net realized capital gains, if any, are distributed at least annually.
8. Security Transactions, Income and Expenses: Security transactions are accounted for on the trade date (date the order to buy or sell is executed). Realized gains and losses on the sale of investment securities are determined on the specific identified cost method. Dividend income and other distributions are recorded on the ex-dividend date (except for certain foreign dividends which may be recorded as soon as the Fund is informed of such dividends) net of applicable withholding taxes. Interest income is recognized on the accrual basis except where collection is in doubt. Discounts are accreted and premiums are amortized over the life of the respective securities. Most expenses of the Company can be directly attributed to a particular Fund. Expenses which cannot be directly attributed are apportioned among the Funds based upon relative net assets or other appropriate methods. Income, expenses (other than class specific expenses — distribution and shareholder services, transfer agency and sub transfer agency fees) and realized and unrealized gains or losses are allocated to each class of shares based upon their relative net assets.
The Fund owns shares of REITs which report information on the source of their distributions annually in the following calendar year. A portion of distributions received from REITs during the year is estimated to be a return of capital and is recorded as a reduction of their cost.
B. Advisory/Sub-Advisory Fees: The Adviser, a wholly-owned subsidiary of Morgan Stanley, provides the Fund with advisory services under the terms of an Investment Advisory
Agreement, paid quarterly, at the annual rate based on the daily net assets as follows:
First $2
billion | | Over $2
billion | |
| | 0.85 | % | | | 0.80 | % | |
Effective July 1, 2018, the Fund's annual rate based on the daily net assets is as follows:
First $2
billion | | Over $2
billion | |
| | 0.80 | % | | | 0.75 | % | |
For the year ended December 31, 2018, the advisory fee rate (net of rebate) was equivalent to an annual effective rate of 0.83% of the Fund's average daily net assets.
The Adviser has agreed to reduce its advisory fee and/or reimburse the Fund so that total annual portfolio operating expenses, excluding certain investment related expenses, taxes, interest and other extraordinary expenses (including litigation), will not exceed 1.05% for Class I shares, 1.40% for Class A shares, 1.90% for Class L shares, 2.15% for Class C shares, 0.99% for Class IS shares and 0.99% for Class IR shares. Effective July 1, 2018, the Adviser has agreed to reduce its advisory fee and/or reimburse the Fund so that the total annual operating expenses will not exceed for 1.00% Class I shares, 1.35% for Class A shares, 1.85% for Class L shares, 2.10% for Class C shares, 0.94% for Class IS shares and 0.94% for Class IR shares. The fee waivers and/or expense reimbursements will continue for at least one year from the date of the Fund's prospectus or until such time that the Directors act to discontinue all or a portion of such waivers or reimbursements when they deem such action is appropriate. For the year ended December 31, 2018, approximately $362,000 of other expenses were reimbursed by the Adviser pursuant to this arrangement.
The Adviser has entered into Sub-Advisory Agreements with the Sub-Advisers, each a wholly-owned subsidiary of Morgan Stanley. The Sub-Advisers provide the Fund with advisory services subject to the overall supervision of the Adviser and the Company's Officers and Directors. The Adviser pays the Sub-Advisers on a monthly basis a portion of the net advisory fees the Adviser receives from the Fund.
C. Administration Fees: The Adviser also serves as Administrator to the Company and provides administrative services pursuant to an Administration Agreement for an annual fee, accrued daily and paid monthly, of 0.08% of the Fund's average daily net assets.
26
Morgan Stanley Institutional Fund, Inc.
Annual Report — December 31, 2018
Notes to Financial Statements (cont'd)
Under a Sub-Administration Agreement between the Administrator and State Street Bank and Trust Company ("State Street"), State Street provides certain administrative services to the Company. For such services, the Administrator pays State Street a portion of the fee the Administrator receives from the Fund.
D. Distribution and Shareholder Services Fees: Morgan Stanley Distribution, Inc. ("MSDI" or the "Distributor"), a wholly-owned subsidiary of the Adviser and an indirect subsidiary of Morgan Stanley, serves as the Company's Distributor of Fund shares pursuant to a Distribution Agreement. The Company has adopted a Shareholder Services Plan with respect to Class A shares pursuant to Rule 12b-1 under the Act. Under the Shareholder Services Plan, the Fund pays the Distributor a shareholder services fee, accrued daily and paid monthly, at an annual rate of 0.25% of the Fund's average daily net assets attributable to Class A shares.
The Company has adopted a Distribution and Shareholder Services Plan with respect to Class L shares pursuant to Rule 12b-1 under the Act. Under the Distribution and Shareholder Services Plan, the Fund pays the Distributor a distribution fee, accrued daily and paid monthly, at an annual rate of 0.50% and a shareholder services fee, accrued daily and paid monthly, at an annual rate of 0.25% of the Fund's average daily net assets attributable to Class L shares.
The Company has adopted a Distribution and Shareholder Services Plan with respect to Class C shares pursuant to Rule 12b-1 under the Act. Under the Distribution and Shareholder Services Plan, the Fund pays the Distributor a distribution fee, accrued daily and paid monthly, at an annual rate of 0.75% and a shareholder services fee, accrued daily and paid monthly, at an annual rate of 0.25% of the Fund's average daily net assets attributable to Class C shares.
The distribution and shareholder services fees are used to support the expenses associated with servicing and maintaining accounts. The Distributor may compensate other parties for providing shareholder support services to investors who purchase Class A, Class L and Class C shares.
E. Dividend Disbursing and Transfer Agent: The Company's dividend disbursing and transfer agent is DST Asset Manager Solutions, Inc. ("DST"). Pursuant to a Transfer Agency Agreement, the Company pays DST a fee based on the number of classes, accounts and transactions relating to the Funds of the Company.
F. Custodian Fees: State Street (the "Custodian") also serves as Custodian for the Company in accordance with a Custodian Agreement. The Custodian holds cash, securities and other assets of the Company as required by the Act. Custody fees are payable monthly based on assets held in custody, investment purchases and sales activity and account maintenance fees, plus reimbursement for certain out-of-pocket expenses.
G. Security Transactions and Transactions with Affiliates: For the year ended December 31, 2018, purchases and sales of investment securities for the Fund, other than long-term U.S. Government securities and short-term investments were approximately $465,879,000 and $985,382,000, respectively. There were no purchases and sales of long-term U.S. Government securities for the year ended December 31, 2018.
The Fund invests in the Institutional Class of the Morgan Stanley Institutional Liquidity Funds — Treasury Portfolio (the "Liquidity Funds"), an open-end management investment company managed by the Adviser. Advisory fees paid by the Fund are reduced by an amount equal to its pro-rata share of the advisory and administration fees paid by the Fund due to its investment in the Liquidity Funds. For the year ended December 31, 2018, advisory fees paid were reduced by approximately $15,000 relating to the Fund's investment in the Liquidity Funds.
A summary of the Fund's transactions in shares of affiliated investments during the year ended December 31, 2018 is as follows:
Affiliated
Investment
Company | | Value
December 31,
2017
(000) | | Purchases
at Cost
(000) | | Proceeds
from Sales
(000) | | Dividend
Income
(000) | |
Liquidity Funds | | $ | 73,614 | | | $ | 271,906 | | | $ | 345,520 | | | $ | 119 | | |
Affiliated
Investment
Company (cont'd) | | Realized
Gain
(Loss)
(000) | | Change in
Unrealized
Appreciation
(Depreciation)
(000) | | Value
December 31,
2018
(000) | |
Liquidity Funds | | $ | — | | | $ | — | | | $ | — | | |
The Fund is permitted to purchase and sell securities ("cross-trade") from and to other Morgan Stanley funds as well as other funds and client accounts for which the Adviser or an affiliate of the Adviser serves as investment adviser, pursuant to procedures approved by the Directors in compliance with Rule 17a-7 under the Act (the "Rule"). Each cross-trade is executed at the current market price in compliance with provisions of the Rule. For the year ended December 31, 2018, the Fund did not engage in any cross-trade transactions.
27
Morgan Stanley Institutional Fund, Inc.
Annual Report — December 31, 2018
Notes to Financial Statements (cont'd)
The Fund has an unfunded Deferred Compensation Plan (the "Compensation Plan"), which allows each independent Director to defer payment of all, or a portion, of the fees he or she receives for serving on the Board of Directors. Each eligible Director generally may elect to have the deferred amounts credited with a return equal to the total return on one or more of the Morgan Stanley funds that are offered as investment options under the Compensation Plan. Appreciation/depreciation and distributions received from these investments are recorded with an offsetting increase/decrease in the deferred compensation obligation and do not affect the NAV of the Fund.
H. Federal Income Taxes: It is the Fund's intention to continue to qualify as a regulated investment company and distribute all of its taxable and tax-exempt income. Accordingly, no provision for federal income taxes is required in the financial statements.
The Fund may be subject to taxes imposed by countries in which it invests. Such taxes are generally based on income and/or capital gains earned or repatriated. Taxes are accrued based on net investment income, net realized gains and net unrealized appreciation as such income and/or gains are earned. Taxes may also be based on transactions in foreign currency and are accrued based on the value of investments denominated in such currency.
FASB ASC 740-10, "Income Taxes — Overall", sets forth a minimum threshold for financial statement recognition of the benefit of a tax position taken or expected to be taken in a tax return. Management has concluded there are no significant uncertain tax positions that would require recognition in the financial statements. If applicable, the Fund recognizes interest accrued related to unrecognized tax benefits in "Interest Expense" and penalties in "Other Expenses" in the Statement of Operations. The Fund files tax returns with the U.S. Internal Revenue Service, New York and various states. Generally, each of the tax years in the four-year period ended December 31, 2018 remains subject to examination by taxing authorities.
The tax character of distributions paid may differ from the character of distributions for GAAP purposes due to short-term capital gains being treated as ordinary income for tax purposes. The tax character of distributions paid during fiscal years 2018 and 2017 was as follows:
2018
Distributions
Paid From: | | 2017
Distributions
Paid From: | |
Ordinary
Income
(000) | | Long-Term
Capital Gain
(000) | | Ordinary
Income
(000) | | Long-Term
Capital Gain
(000) | |
| $ | 53,497 | | | $ | 50,771 | | | $ | 23,486 | | | $ | 69,001 | | |
The amount and character of income and gains to be distributed are determined in accordance with income tax regulations which may differ from GAAP. These book/tax differences are either considered temporary or permanent in nature.
Temporary differences are primarily due to differing book and tax treatments in the timing of the recognition of gains (losses) on certain investment transactions and the timing of the deductibility of certain expenses.
Permanent differences, primarily due to equalization debits, resulted in the following reclassifications among the components of net assets at December 31, 2018:
Total
Distributable
Earnings
(000) | | Paid-in-
Capital
(000) | |
| $ | (24,324 | ) | | $ | 24,324 | | |
At December 31, 2018, the components of distributable earnings for the Fund on a tax basis were as follows:
Undistributed
Ordinary
Income
(000) | | Undistributed
Long-Term
Capital Gain
(000) | |
| $ | 4,345 | | | $ | 7,339 | | |
I. Credit Facility: The Company and other Morgan Stanley funds participated in a $150,000,000 committed, unsecured revolving line of credit facility (the "Facility") with State Street. This Facility is to be used for temporary emergency purposes or funding of shareholder redemption requests. The interest rate on borrowings is based on the federal funds rate or 1 month LIBOR rate plus a spread. The Facility also has a commitment fee of 0.25% per annum based on the unused portion of the Facility. During the year ended December 31, 2018, the Fund did not have any borrowings under the Facility.
J. Other: At December 31, 2018, the Fund had record owners of 10% or greater. Investment activities of these shareholders could have a material impact on the Fund. The aggregate percentage of such owners was 15.4%.
28
Morgan Stanley Institutional Fund, Inc.
Annual Report — December 31, 2018
Report of Independent Registered Public Accounting Firm
To the Shareholders and Board of Directors of
Morgan Stanley Institutional Fund, Inc. —
Global Real Estate Portfolio
Opinion on the Financial Statements
We have audited the accompanying statement of assets and liabilities of Global Real Estate Portfolio (the "Fund") (one of the funds constituting the Morgan Stanley Institutional Fund, Inc. (the "Company")), including the portfolio of investments, as of December 31, 2018, and the related statement of operations for the year then ended, the statements of changes in net assets for each of the two years in the period then ended, the financial highlights for each of the five years in the period then ended and the related notes (collectively referred to as the "financial statements"). In our opinion, the financial statements present fairly, in all material respects, the financial position of Global Real Estate Portfolio (one of the funds constituting Morgan Stanley Institutional Fund, Inc.) at December 31, 2018, the results of its operations for the year then ended, the changes in its net assets for each of the two years in the period then ended and its financial highlights for each of the five years in the period then ended, in conformity with U.S. generally accepted accounting principles.
Basis for Opinion
These financial statements are the responsibility of the Company's management. Our responsibility is to express an opinion on the Fund's financial statements based on our audits. We are a public accounting firm registered with the Public Company Accounting Oversight Board (United States) ("PCAOB") and are required to be independent with respect to the Company in accordance with the U.S. federal securities law and the applicable rules and regulations of the Securities and Exchange Commission and the PCAOB.
We conducted our audits in accordance with the standards of the PCAOB. Those standards require that we plan and perform the audit to obtain reasonable assurance about whether the financial statements are free of material misstatement, whether due to error or fraud. The Company is not required to have, nor were we engaged to perform, an audit of the Company's internal control over financial reporting. As part of our audits, we are required to obtain an understanding of internal control over financial reporting, but not for the purpose of expressing an opinion on the effectiveness of the Company's internal control over financial reporting. Accordingly, we express no such opinion.
Our audits included performing procedures to assess the risks of material misstatement of the financial statements, whether due to error or fraud, and performing procedures that respond to those risks. Such procedures included examining, on a test basis, evidence regarding the amounts and disclosures in the financial statements. Our procedures included confirmation of securities owned as of December 31, 2018 by correspondence with the custodian and others or by other appropriate auditing procedures where replies from others were not received. Our audits also included evaluating the accounting principles used and significant estimates made by management, as well as evaluating the overall presentation of the financial statements. We believe that our audits provide a reasonable basis for our opinion.

We have served as the auditor of one or more Morgan Stanley investment companies since 2000.
Boston, Massachusetts
February 26, 2019
29
Morgan Stanley Institutional Fund, Inc.
Annual Report — December 31, 2018
Federal Tax Notice (unaudited)
For federal income tax purposes, the following information is furnished with respect to the distributions paid by the Fund during its taxable year ended December 31, 2018. For corporate shareholders, 0.1% of the dividends qualified for the dividends received deduction.
The Fund designated and paid approximately $50,771,000 as a long-term capital gain distribution.
For federal income tax purposes, the following information is furnished with respect to the Fund's earnings for its taxable year ended December 31, 2018. When distributed, certain earnings may be subject to a maximum tax rate of 15% as provided for by the Jobs and Growth Tax Relief Reconciliation Act of 2003. The Fund designated up to a maximum of approximately $12,793,000 as taxable at this lower rate.
In January, the Fund provides tax information to shareholders for the preceding calendar year.
30
Morgan Stanley Institutional Fund, Inc.
Annual Report — December 31, 2018
Privacy Notice (unaudited)
MORGAN STANLEY INVESTMENT MANAGEMENT INC.
AN IMPORTANT NOTICE CONCERNING OUR U.S. PRIVACY POLICY
We are required by federal law to provide you with a copy of our privacy policy annually. This policy applies to current and former individual investors in funds managed or sponsored by Morgan Stanley Investment Management Inc. ("MSIM") as well as current and former individual clients of MSIM. This policy is not applicable to partnerships, corporations, trusts or other non-individual clients or investors. Please note that we may amend this policy at any time, and will inform you of any changes as required by law.
WE RESPECT YOUR PRIVACY
We appreciate that you have provided us with your personal financial information. We strive to maintain the privacy of such information while we help you achieve your financial objectives. This Notice describes what non-public personal information we collect about you, why we collect it, when we may share it with others and how certain others may use it. It discusses the steps you may take to limit our sharing of certain information about you to affiliated companies in the Morgan Stanley family of companies ("other Morgan Stanley companies"). It also discloses how you may limit use of certain shared information for marketing purposes by other Morgan Stanley branded companies. Throughout this policy, we refer to the non-public information that personally identifies you or your accounts as "personal information.''
1. WHAT PERSONAL INFORMATION DO WE COLLECT ABOUT YOU?
We obtain personal information from applications and other forms you submit to us, from your dealings with us, from consumer reporting agencies, from our Web sites and from third parties and other sources.
For example:
• We may collect information such as your name, address, e-mail address, telephone/fax numbers, assets, income and investment objectives through subscription documents, applications and other forms you submit to us.
• We may obtain information about account balances, your use of account(s) and the types of products and services you prefer to receive from us through your dealings and transactions with us and other sources.
• We may obtain information about your creditworthiness and credit history from consumer reporting agencies.
• We may collect background information from and through third-party vendors to verify representations you have made and to comply with various regulatory requirements.
• If you interact with us through our public and private Web sites, we may collect information that you provide directly through online communications (such as an e-mail address). We may also collect information about your Internet service provider, your domain name, your computer's operating system and Web browser, your use of our Web sites and your product and service preferences, through the use of "cookies." Please consult the Terms of Use of these sites for more details.
2. WHEN DO WE DISCLOSE PERSONAL INFORMATION WE COLLECT ABOUT YOU?
We may disclose personal information we collect about you to other Morgan Stanley companies and to non-affiliated third parties.
a. Information We Disclose to Other Morgan Stanley Companies.
We may disclose personal information to other Morgan Stanley companies for a variety of reasons, including to manage your account(s) effectively, to service and process your transactions, to let you know about products and services offered by us and other Morgan Stanley companies, to manage our business, and as otherwise required or permitted by law. Offers for products and services from other Morgan Stanley companies are developed under conditions designed to safeguard your personal information.
31
Morgan Stanley Institutional Fund, Inc.
Annual Report — December 31, 2018
Privacy Notice (unaudited) (cont'd)
b. Information We Disclose to Non-affiliated Third Parties.
We do not disclose personal information that we collect about you to non-affiliated third parties except to those who provide marketing services on our behalf, to financial institutions with whom we have joint marketing agreements, and as otherwise required or permitted by law. For example, we may disclose personal information to non-affiliated third parties for servicing and processing transactions, to offer our own products and services, to protect against fraud, for institutional risk control, to respond to judicial process or to perform services on our behalf. When we share personal information with a non-affiliated third party, they are required to limit their use of personal information to the particular purpose for which it was shared and they are not allowed to share personal information with others except to fulfill that limited purpose or as may be permitted or required by law.
3. HOW DO WE PROTECT THE SECURITY AND CONFIDENTIALITY OF PERSONAL INFORMATION WE COLLECT ABOUT YOU?
We maintain physical, electronic and procedural security measures to help safeguard the personal information we collect about you. We have internal policies governing the proper handling of client information. Third parties that provide support or marketing services on our behalf may also receive personal information, and we require them to adhere to confidentiality standards with respect to such information.
4. HOW CAN YOU LIMIT THE SHARING OF CERTAIN TYPES OF PERSONAL INFORMATION WITH OTHER MORGAN STANLEY COMPANIES?
We offer you choices as to whether we share with other Morgan Stanley companies the personal information that was collected to determine your eligibility for products and services you request ("eligibility information"). Eligibility information does not include your identification information or personal information pertaining to our transactions or experiences with you. Please note that, even if you direct us not to share eligibility information with other Morgan Stanley companies ("opt-out"), we may still share personal information, including eligibility information, with those companies in circumstances excluded from the opt-out under applicable law, such as to process transactions or to service your account.
5. HOW CAN YOU LIMIT THE USE OF CERTAIN TYPES OF PERSONAL INFORMATION BY OTHER MORGAN STANLEY COMPANIES FOR MARKETING?
By following the opt-out instructions in Section 6 below, you may limit other Morgan Stanley branded companies from marketing their products or services to you based on personal information we disclose to them. This information may include, for example, your income and account history with us. Please note that, even if you choose to limit Other Morgan Stanley Companies from using personal information about you that we may share with them for marketing their products and services to you, Other Morgan Stanley Companies may use your personal information that they obtain from us to market to you in circumstances permitted by law, such as if the Other Morgan Stanley Company has its own relationship with you.
6. HOW CAN YOU SEND US AN OPT-OUT INSTRUCTION?
If you wish to limit our sharing of eligibility information about you with other Morgan Stanley companies or other Morgan Stanley companies' use of personal information for marketing purposes, as described in this notice, you may do so by:
• Calling us at (800) 548-7786
Monday–Friday between 8a.m. and 6p.m.(EST)
• Writing to us at the following address:
DST Asset Manager Solutions, Inc.
c/o Privacy Coordinator
P.O. Box 219804
Kansas City, Missouri 64121
32
Morgan Stanley Institutional Fund, Inc.
Annual Report — December 31, 2018
Privacy Notice (unaudited) (cont'd)
Your written request should include your name, address, telephone number and account number(s) to which the opt-out applies and whether you are opting out with respect to sharing of eligibility information (Section 4 above), or if information used for Marketing (Section 5 above) or both. Written opt-out requests should not be sent with any other correspondence. In order to process your request, we require that the request be provided by you directly and not through a third party.
Your opt-out preference will remain in effect with respect to this policy (as it may be amended) until you notify us otherwise. If you have a joint account, your direction for us not to share this information with other Morgan Stanley companies and for those other Morgan Stanley companies not to use your personal information for marketing will be applied to all account holders on that account. Please understand that if you limit our sharing or our affiliated companies' use of personal information, you and any joint account holder(s) may not receive information about Morgan Stanley products and services, including products or services that could help you manage your financial resources and achieve your investment objectives.
7. WHAT IF AN AFFILIATED COMPANY BECOMES A NON-AFFILIATED THIRD PARTY?
If, at any time in the future, an affiliated company becomes a non-affiliated third party, further disclosures of personal information made to the former affiliated company will be limited to those described in Section 2(b) above relating to non-affiliated third parties. If you elected under Section 6 to limit disclosures we make to affiliated companies, or use of personal information by affiliated companies, your election will not apply to use by any former affiliated company of your personal information in their possession once it becomes a non-affiliated third party.
SPECIAL NOTICE TO RESIDENTS OF VERMONT
The following section supplements our policy with respect to our individual clients who have a Vermont address and supersedes anything to the contrary in the above policy with respect to those clients only.
The state of Vermont requires financial institutions to obtain your consent prior to sharing personal information that they collect about you with affiliated companies and non-affiliated third parties other than in certain limited circumstances. Except as permitted by law, we will not share personal information we collect about you with non-affiliated third parties or other Morgan Stanley companies unless you provide us with your written consent to share such information ("opt-in").
If you wish to receive offers for investment products and services offered by or through other Morgan Stanley companies, please notify us in writing at the following address:
DST Asset Manager Solutions, Inc.
c/o Privacy Coordinator
P.O. Box 219804
Kansas City, Missouri 64121
Your authorization should include your name, address, telephone number and account number(s) to which the opt-in applies and should not be sent with any other correspondence. In order to process your authorization, we require that the authorization be provided by you directly and not through a third party.
SPECIAL NOTICE TO RESIDENTS OF CALIFORNIA
The following section supplements our policy with respect to our individual clients who have a California address and supersedes anything to the contrary in the above policy with respect to those clients only.
In response to a California law, if your account has a California home address, your personal information will not be disclosed to non-affiliated third parties except as permitted by applicable California law, and we will limit sharing such information with our affiliates to comply with California privacy laws that apply to us.
33
Morgan Stanley Institutional Fund, Inc.
Annual Report — December 31, 2018
Director and Officer Information (unaudited)
Independent Directors:
Name, Age and Address of
Independent Director | | Position(s)
Held with
Registrant | | Length of Time
Served* | | Principal Occupation(s) During Past 5 Years
and Other Relevant Professional Experience | | Number of
Portfolios in
Fund Complex
Overseen by
Independent
Director** | | Other Directorships
Held by Independent
Director*** | |
Frank L. Bowman (74)
c/o Perkins Coie LLP
Counsel to the Independent
Directors
30 Rockefeller Plaza
New York, NY 10112 | | Director | | Since
August
2006 | | President, Strategic Decisions, LLC (consulting) (since February 2009); Director or Trustee of various Morgan Stanley Funds (since August 2006); Chairperson of the Compliance and Insurance Committee (since October 2015); formerly, Chairperson of the Insurance Sub-Committee of the Compliance and Insurance Committee (2007-2015); served as President and Chief Executive Officer of the Nuclear Energy Institute (policy organization) (February 2005-November 2008); retired as Admiral, U.S. Navy after serving over 38 years on active duty including 8 years as Director of the Naval Nuclear Propulsion Program in the Department of the Navy and the U.S. Department of Energy (1996-2004); served as Chief of Naval Personnel (July 1994-September 1996) and on the Joint Staff as Director of Political Military Affairs (June 1992-July 1994); knighted as Honorary Knight Commander of the Most Excellent Order of the British Empire; awarded the Officier de l'Orde National du Mérite by the French Government; elected to the National Academy of Engineering (2009). | | | 82 | | | Director of BP p.l.c.; Director of Naval and Nuclear Technologies LLP; Director Emeritus of the Armed Services YMCA; Member of the National Security Advisory Council of the Center for U.S. Global Engagement and a member of the CNA Military Advisory Board; Trustee of Fairhaven United Methodist Church; Member of the Board of Advisors of the Dolphin Scholarship Foundation; and Director of other various non-profit organizations. | |
Kathleen A. Dennis (65)
c/o Perkins Coie LLP
Counsel to the Independent Directors
30 Rockefeller Plaza
New York, NY 10112 | | Director | | Since
August
2006 | | President, Cedarwood Associates (mutual fund and investment management consulting) (since July 2006); Chairperson of the Liquidity and Alternatives Sub-Committee of the Investment Committee (since October 2006) and Director or Trustee of various Morgan Stanley Funds (since August 2006); formerly, Senior Managing Director of Victory Capital Management (1993-2006). | | | 82 | | | Director of various non-profit organizations. | |
Nancy C. Everett (63)
c/o Perkins Coie LLP
Counsel to the Independent Directors
30 Rockefeller Plaza
New York, NY 10112 | | Director | | Since
January
2015 | | Chief Executive Officer, Virginia Commonwealth University Investment Company (since November 2015); Owner, OBIR, LLC (institutional investment management consulting) (since June 2014); formerly, Managing Director, BlackRock Inc. (February 2011-December 2013); and Chief Executive Officer, General Motors Asset Management (a/k/a Promark Global Advisors, Inc.) (June 2005-May 2010). | | | 83 | | | Formerly, Member of Virginia Commonwealth University School of Business Foundation (2005-2016); Member of Virginia Commonwealth University Board of Visitors (2013-2015); Member of Committee on Directors for Emerging Markets Growth Fund, Inc. (2007-2010); Chairperson of Performance Equity Management, LLC (2006-2010); and Chairperson, GMAM Absolute Return Strategies Fund, LLC (2006-2010). | |
34
Morgan Stanley Institutional Fund, Inc.
Annual Report — December 31, 2018
Director and Officer Information (unaudited) (cont'd)
Independent Directors: (cont'd)
Name, Age and Address of
Independent Director | | Position(s)
Held with
Registrant | | Length of Time
Served* | | Principal Occupation(s) During Past 5 Years
and Other Relevant Professional Experience | | Number of
Portfolios in
Fund Complex
Overseen by
Independent
Director** | | Other Directorships
Held by Independent
Director*** | |
Jakki L. Haussler (61)
c/o Perkins Coie LLP
Counsel to the Independent Directors
30 Rockefeller Plaza
New York, NY 10112 | | Director | | Since
January
2015 | | Chairman and Chief Executive Officer, Opus Capital Group (since January 1996); formerly, Director, Capvest Venture Fund, LP (May 2000-December 2011); Partner, Adena Ventures, LP (July 1999-December 2010); Director, The Victory Funds (February 2005-July 2008). | | | 83 | | | Director of Service Corporation International and Member, Audit Committee and Investment Committee; Director of Cincinnati Bell Inc. and Member, Audit Committee and Governance and Nominating Committee; Chairman of Northern Kentucky University Member Investment Committee; Member of Chase College of Law Transactional Law Practice Center Board of Advisors; Director of Best Transport; Director of Chase College of Law Board of Visitors; formerly, Member, University of Cincinnati Foundation Investment Committee; Member, Miami University Board of Visitors (2008-2011); Trustee of Victory Funds (2005-2008) and Chairman, Investment Committee (2007-2008) and Member, Service Provider Committee (2005-2008). | |
Dr. Manuel H. Johnson (69)
c/o Johnson Smick
International, Inc.
220 I Street, NE — Suite 200
Washington, D.C. 20002 | | Director | | Since
July
1991 | | Senior Partner, Johnson Smick International, Inc. (consulting firm); Chairperson of the Investment Committee (since October 2006) and Director or Trustee of various Morgan Stanley Funds (since July 1991); Co-Chairman and a founder of the Group of Seven Council (G7C) (international economic commission); formerly, Chairperson of the Audit Committee (July 1991-September 2006), Vice Chairman of the Board of Governors of the Federal Reserve System and Assistant Secretary of the U.S. Treasury. | | | 82 | | | Director of NVR, Inc. (home construction). | |
Joseph J. Kearns (76)
c/o Perkins Coie LLP
Counsel to the Independent Directors
30 Rockefeller Plaza
New York, NY 10112 | | Director | | Since
August
1994 | | Senior Adviser, Kearns & Associates LLC (investment consulting); Chairperson of the Audit Committee (since October 2006) and Director or Trustee of various Morgan Stanley Funds (since August 1994); formerly, Deputy Chairperson of the Audit Committee (July 2003-September 2006) and Chairperson of the Audit Committee of various Morgan Stanley Funds (since August 1994); CFO of the J. Paul Getty Trust. | | | 83 | | | Prior to August 10, 2016, Director of Electro Rent Corporation (equipment leasing); Prior to December 31, 2013, Director of The Ford Family Foundation. | |
35
Morgan Stanley Institutional Fund, Inc.
Annual Report — December 31, 2018
Director and Officer Information (unaudited) (cont'd)
Independent Directors: (cont'd)
Name, Age and Address of
Independent Director | | Position(s)
Held with
Registrant | | Length of Time
Served* | | Principal Occupation(s) During Past 5 Years
and Other Relevant Professional Experience | | Number of
Portfolios in
Fund Complex
Overseen by
Independent
Director** | | Other Directorships
Held by Independent
Director*** | |
Michael F. Klein (60)
c/o Perkins Coie LLP
Counsel to the Independent Directors
30 Rockefeller Plaza
New York, NY 10112 | | Director | | Since
August
2006 | | Managing Director, Aetos Alternatives Management, LP (since March 2000); Co-President, Aetos Alternatives Management, LP (since January 2004) and Co-Chief Executive Officer of Aetos Alternatives Management, LP (since August 2013); Chairperson of the Fixed Income Sub-Committee of the Investment Committee (since October 2006) and Director or Trustee of various Morgan Stanley Funds (since August 2006); formerly, Managing Director, Morgan Stanley & Co. Inc. and Morgan Stanley Dean Witter Investment Management and President, various Morgan Stanley Funds (June 1998-March 2000); Principal, Morgan Stanley & Co. Inc. and Morgan Stanley Dean Witter Investment Management (August 1997-December 1999). | | | 82 | | | Director of certain investment funds managed or sponsored by Aetos Alternatives Management, LP; Director of Sanitized AG and Sanitized Marketing AG (specialty chemicals). | |
Patricia Maleski (58)
c/o Perkins Coie LLP
Counsel to the Independent Directors
30 Rockefeller Plaza
New York, NY 10112 | | Director | | Since
January
2017 | | Managing Director, JPMorgan Asset Management (2004-2016); Oversight and Control Head of Fiduciary and Conflicts of Interest Program (2015-2016); Chief Control Officer-Global Asset Management (2013-2015); President, JPMorgan Funds (2010-2013); Chief Administrative Officer (2004-2013); various other positions including Treasurer and Board Liaison (since 2001). | | | 83 | | | None. | |
Michael E. Nugent (82)
522 Fifth Avenue
New York, NY 10036 | | Chair of the Board and Director | | Chair of the Boards since July 2006 and Director since July 1991 | | Chair of the Boards of various Morgan Stanley Funds (since July 2006); Chairperson of the Closed-End Fund Committee (since June 2012) Governance Committee (since January 2019) and Director or Trustee of various Morgan Stanley Funds (since July 1991); formerly, Chairperson of the Insurance Committee (until July 2006); General Partner, Triumph Capital, L.P. (private investment partnership) (1988-2013). | | | 82 | | | None. | |
W. Allen Reed (71)
c/o Perkins Coie LLP
Counsel to the Independent Directors
30 Rockefeller Plaza
New York, NY 10112 | | Director | | Since
August
2006 | | Chairperson of the Equity Sub-Committee of the Investment Committee (since October 2006) and Director or Trustee of various Morgan Stanley Funds (since August 2006); formerly, President and CEO of General Motors Asset Management; Chairman and Chief Executive Officer of the GM Trust Bank and Corporate Vice President of General Motors Corporation (August 1994-December 2005). | | | 82 | | | Director of Legg Mason, Inc.; formerly, Director of the Auburn University Foundation (2010-2015). | |
Fergus Reid (86)****
c/o Joe Pietryka, Inc.
85 Charles Colman Blvd.
Pawling, NY 12564 | | Director | | Since
June
1992 | | Chairman, Joe Pietryka, Inc.; Chairperson of the Governance Committee and Director or Trustee of various Morgan Stanley Funds (since June 1992). | | | 83 | | | Formerly, Trustee and Director of certain investment companies in the JP Morgan Fund Complex managed by JP Morgan Investment Management Inc. (1987-2012). | |
* This is the earliest date the Director began serving the Morgan Stanley Funds. Each Director serves an indefinite term, until his or her successor is elected.
** The Fund Complex includes (as of December 31, 2018) all open-end and closed-end funds (including all of their portfolios) advised by Morgan Stanley Investment Management Inc. (the "Adviser") and any funds that have an adviser that is an affiliated person of the Adviser (including, but not limited to, Morgan Stanley AIP GP LP).
*** This includes any directorships at public companies and registered investment companies held by the Director at any time during the past five years.
**** Effective date of retirement is December 31, 2018.
36
Morgan Stanley Institutional Fund, Inc.
Annual Report — December 31, 2018
Director and Officer Information (unaudited) (cont'd)
Executive Officers:
Name, Age and Address of Executive Officer | | Position(s) Held
with
Registrant | | Length of Time
Served* | | Principal Occupation(s) During Past 5 Years | |
John H. Gernon (55)
522 Fifth Avenue
New York, NY 10036 | | President and Principal Executive Officer | | Since
September
2013 | | President and Principal Executive Officer of the Equity and Fixed Income Funds and the Morgan Stanley AIP Funds (since September 2013) and the Liquidity Funds and various money market funds (since May 2014) in the Fund Complex; Managing Director of the Adviser; Head of Product (since 2006). | |
Timothy J. Knierim (59)
522 Fifth Avenue
New York, NY 10036 | | Chief Compliance Officer | | Since
December
2016 | | Managing Director of the Adviser and various entities affiliated with the Adviser; Chief Compliance Officer of various Morgan Stanley Funds and the Adviser (since December 2016) and Chief Compliance Officer of Morgan Stanley AIP GP LP (since 2014). Formerly, Managing Director and Deputy Chief Compliance Officer of the Adviser (2014-2016); and formerly, Chief Compliance Officer of Prudential Investment Management, Inc. (2007-2014). | |
Francis J. Smith (53)
522 Fifth Avenue
New York, NY 10036 | | Treasurer and Principal Financial Officer | | Treasurer since July 2003 and Principal Financial Officer since September 2002 | | Managing Director of the Adviser and various entities affiliated with the Adviser; Treasurer (since July 2003) and Principal Financial Officer of various Morgan Stanley Funds (since September 2002). | |
Mary E. Mullin (51)
522 Fifth Avenue
New York, NY 10036 | | Secretary | | Since
June
1999 | | Managing Director of the Adviser; Secretary of various Morgan Stanley Funds (since June 1999). | |
Michael J. Key (39)
522 Fifth Avenue
New York, NY 10036 | | Vice President | | Since
June
2017 | | Vice President of the Equity and Fixed Income Funds, Liquidity Funds, various money market funds and the Morgan Stanley AIP Funds in the Fund Complex (since June 2017); Executive Director of the Adviser; Head of Product Development for Equity and Fixed Income Funds (since August 2013). | |
* This is the earliest date the officer began serving the Morgan Stanley Funds. Each officer serves a one-year term, until his or her successor is elected and qualifies.
37
Morgan Stanley Institutional Fund, Inc.
Annual Report — December 31, 2018
Adviser and Administrator
Morgan Stanley Investment Management Inc.
522 Fifth Avenue
New York, New York 10036
Sub-Advisers
Morgan Stanley Investment Management Limited
25 Cabot Square, Canary Wharf
London, E14 4QA, England
Morgan Stanley Investment Management Company
23 Church Street
16-01 Capital Square, Singapore 049481
Distributor
Morgan Stanley Distribution, Inc.
522 Fifth Avenue
New York, New York 10036
Dividend Disbursing and Transfer Agent
DST Asset Manager Solutions, Inc.
2000 Crown Colony Drive
Quincy, Massachusetts 02169
Custodian
State Street Bank and Trust Company
One Lincoln Street
Boston, Massachusetts 02111
Legal Counsel
Dechert LLP
1095 Avenue of the Americas
New York, New York 10036
Counsel to the Independent Directors
Perkins Coie LLP
30 Rockefeller Plaza
New York, New York 10112
Independent Registered Public Accounting Firm
Ernst & Young LLP
200 Clarendon Street
Boston, Massachusetts 02116
Reporting to Shareholders
Each Morgan Stanley fund provides a complete schedule of portfolio holdings in its semi-annual and the annual reports within 60 days of the end of the fund's second and fourth fiscal quarters. The semi-annual and annual reports are filed electronically with the Securities and Exchange Commission ("SEC") on Form N-CSRS and Form N-CSR, respectively. Morgan Stanley also delivers the semi-annual and annual reports to fund shareholders and makes these reports available on its public website, www.morganstanley.com/im/shareholderreports. Each Morgan Stanley fund also files a complete schedule of portfolio holdings with the SEC for the fund's first and third fiscal quarters on Form N-Q. Morgan Stanley does not deliver the reports for the first and third fiscal quarters to shareholders, nor are the reports posted to the Morgan Stanley public website. You may, however, obtain the Form N-Q filings (as well as the Form N-CSR and N-CSRS filings) by accessing the SEC's website, www.sec.gov. You can also request copies of these materials, upon payment of a duplicating fee, by electronic request at the SEC's email address (publicinfo@sec.gov).
Proxy Voting Policies and Procedures and Proxy Voting Record
You may obtain a copy of the Company's Proxy Voting Policy and Procedures and information regarding how the Company voted proxies relating to portfolio securities during the most recent twelve-month period ended June 30, without charge, upon request, by calling toll free 1 (800) 548-7786 or by visiting our website at www.morganstanley.com/im/shareholderreports. This information is also available on the SEC's website at www.sec.gov.
This report is authorized for distribution only when preceded or accompanied by a prospectus or summary prospectus of the applicable Fund of Morgan Stanley Institutional Fund, Inc., which describes in detail the Fund's investment policies, risks, fees and expenses. Please read the prospectus carefully before you invest or send money. For additional information, including information regarding the investments comprising the Fund, please visit our website at www.morganstanley.com/im/shareholderreports or call toll free 1 (800) 548-7786.
38
Printed in U.S.A.
This Report has been prepared for shareholders and may be distributed to others only if preceded or accompanied by a current prospectus.
Morgan Stanley Investment Management Inc.
522 Fifth Avenue
New York, New York 10036
© 2019 Morgan Stanley. Morgan Stanley Distribution, Inc.

IFIGREANN
2403669 EXP. 02.29.20

Morgan Stanley Institutional Fund, Inc.
Global Sustain Portfolio
(formerly Global Quality Portfolio)
Annual Report
December 31, 2018
Beginning on January 1, 2021, as permitted by regulations adopted by the Securities and Exchange Commission ("SEC"), paper copies of the Fund's Annual and Semi-Annual Reports to Shareholders ("Shareholder Reports") will no longer be sent by mail, unless you specifically request paper copies of the Shareholder Reports from the Fund or from your financial intermediary, such as a broker-dealer or a bank. Instead, the Shareholder Reports will be made available on the Fund's website, https://www.morganstanley.com/im/shareholderreports and you will be notified by mail each time a Shareholder Report is posted and provided with a website link to access the Shareholder Report. If you already elected to receive Shareholder Reports electronically, you will not be affected by this change and you need not take any action. You may elect to receive Shareholder Reports and other communications from the Fund electronically anytime by contacting your financial intermediary or, if you are a direct investor, please follow the instructions on the envelope.
Beginning on January 1, 2019, you may elect to receive all future Shareholder Reports in paper free of charge. If you invest through a financial intermediary, you can contact your financial intermediary to request that you continue to receive paper copies of your Shareholder Reports. If you invest directly with the Fund, please follow the instructions on the envelope to let the Fund know you wish to continue receiving paper copies of your Shareholder Reports. Your election to receive Shareholder Reports in paper will apply to all funds held in your account if you invest through your financial intermediary or all funds held with the fund complex if you invest directly with a fund.

Morgan Stanley Institutional Fund, Inc.
Annual Report — December 31, 2018
Shareholders' Letter | | | 2 | | |
Expense Example | | | 3 | | |
Investment Overview | | | 4 | | |
Portfolio of Investments | | | 7 | | |
Statement of Assets and Liabilities | | | 8 | | |
Statement of Operations | | | 10 | | |
Statements of Changes in Net Assets | | | 11 | | |
Financial Highlights | | | 13 | | |
Notes to Financial Statements | | | 18 | | |
Report of Independent Registered Public Accounting Firm | | | 24 | | |
Federal Tax Notice | | | 25 | | |
Privacy Notice | | | 26 | | |
Director and Officer Information | | | 29 | | |
This report is authorized for distribution only when preceded or accompanied by a prospectus or summary prospectus of the applicable Fund of Morgan Stanley Institutional Fund, Inc. To receive a prospectus and/or statement of additional information (SAI), which contains more complete information such as investment objectives, charges, expenses, policies for voting proxies, risk considerations and describes in detail each of the Fund's investment policies to the prospective investor, please call toll free 1 (800) 548-7786. Please read the prospectuses carefully before you invest or send money.
Additionally, you can access information about the Fund, including performance, characteristics and investment team commentary, through Morgan Stanley Investment Management's website: www.morganstanley.com/im/shareholderreports.
Market forecasts provided in this report may not necessarily come to pass. There is no guarantee that any sectors mentioned will continue to perform as discussed herein or that securities in such sectors will be held by the Fund in the future. There is no assurance that a fund will achieve its investment objective. Funds are subject to market risk, which is the possibility that market values of securities owned by the Fund will decline and, therefore, the value of the Fund's shares may be less than what you paid for them. Accordingly, you can lose money investing in this Fund. Please see the prospectus for more complete information on investment risks.
1
Morgan Stanley Institutional Fund, Inc.
Annual Report — December 31, 2018
Shareholders' Letter (unaudited)
Dear Shareholders,
We are pleased to provide this Annual report, in which you will learn how your investment in Global Sustain Portfolio (the "Fund") performed during the latest twelve-month period.
Morgan Stanley Investment Management is a client-centric, investor-led organization. Our global presence, intellectual capital, and breadth of products and services enable us to partner with investors to meet the evolving challenges of today's financial markets. We aim to deliver superior investment service and to empower our clients to make the informed decisions that help them reach their investment goals.
As always, we thank you for selecting Morgan Stanley Investment Management, and look forward to working with you in the months and years ahead.
Sincerely,

John H. Gernon
President and Principal Executive Officer
January 2019
2
Morgan Stanley Institutional Fund, Inc.
Annual Report — December 31, 2018
Expense Example (unaudited)
Global Sustain Portfolio
As a shareholder of the Fund, you incur two types of costs: (1) transactional costs; and (2) ongoing costs, which may include advisory fees, administration fees, distribution and shareholder services fees and other Fund expenses. This example is intended to help you understand your ongoing costs (in dollars) of investing in the Fund and to compare these costs with the ongoing costs of investing in other mutual funds.
This example is based on an investment of $1,000 invested at the beginning of the six-month period ended December 31, 2018 and held for the entire six-month period.
Actual Expenses
The table below provides information about actual account values and actual expenses. You may use the information in this table, together with the amount you invested, to estimate the expenses that you paid over the period. Simply divide your account value by $1,000 (for example, an $8,600 account value divided by $1,000 = 8.6), then multiply the result by the number in the table under the heading entitled "Actual Expenses Paid During Period" to estimate the expenses you paid on your account during this period.
Hypothetical Example for Comparison Purposes
The table below provides information about hypothetical account values and hypothetical expenses based on the Fund's actual expense ratio and an assumed rate of return of 5% per year before expenses, which is not the Fund's actual return. The hypothetical account values and expenses may not be used to estimate the actual ending account balance or expenses you paid for the period. You may use this information to compare the ongoing costs of investing in the Fund and other funds. To do so, compare this 5% hypothetical example with the 5% hypothetical examples that appear in the shareholder reports of the other funds.
Please note that the expenses shown in the table are meant to highlight your ongoing costs only and do not reflect any transactional costs, such as sales charges (loads). Therefore, the information for each class in the table is useful in comparing ongoing costs only, and will not help you determine the relative total costs of owning different funds. In addition, if these transactional costs were included, your costs would have been higher.
| | | Beginning
Account
Value
7/1/18 | | Actual Ending
Account
Value
12/31/18 | | Hypothetical
Ending Account
Value | | Actual
Expenses
Paid
During
Period* | | Hypothetical
Expenses Paid
During Period* | | Net
Expense
Ratio
During
Period** | |
Global Sustain Portfolio Class I | | $ | 1,000.00 | | | $ | 953.90 | | | $ | 1,020.67 | | | $ | 4.43 | | | $ | 4.58 | | | | 0.90 | % | |
Global Sustain Portfolio Class A | | | 1,000.00 | | | | 952.10 | | | | 1,018.90 | | | | 6.15 | | | | 6.36 | | | | 1.25 | | |
Global Sustain Portfolio Class L | | | 1,000.00 | | | | 950.00 | | | | 1,016.38 | | | | 8.60 | | | | 8.89 | | | | 1.75 | | |
Global Sustain Portfolio Class C | | | 1,000.00 | | | | 948.60 | | | | 1,015.12 | | | | 9.82 | | | | 10.16 | | | | 2.00 | | |
Global Sustain Portfolio Class IS | | | 1,000.00 | | | | 954.50 | | | | 1,020.92 | | | | 4.19 | | | | 4.33 | | | | 0.85 | | |
* Expenses are calculated using each Fund Class' annualized net expense ratio (as disclosed), multiplied by the average account value over the period and multiplied by 184/365 (to reflect the most recent one-half year period).
** Annualized.
3
Morgan Stanley Institutional Fund, Inc.
Annual Report — December 31, 2018
Investment Overview (unaudited)
Global Sustain Portfolio
The Fund seeks long-term capital appreciation.
Performance
For the fiscal year ended December 31, 2018, the Fund's Class I shares had a total return based on net asset value and reinvestment of distributions per share of 0.60%, net of fees.(i) The Fund's Class I shares outperformed the Fund's benchmark, the MSCI World Net Index (the "Index"), which returned –8.71%.
Factors Affecting Performance
• The markets had been reasonably constructive for the first three quarters of the year, with the MSCI World Net Index returning around 5% up to the end of September. The final quarter saw a sharp fall, where defensive sectors were the relative winners for 2018 as a whole, with health care and utilities actually up 3%, though consumer staples (–9%) lagged the market a touch, not helped by tobacco (–35%). Information technology ended down only 2% for the year, despite its torrid fourth quarter, while the cyclical materials, financials, energy and industrials all struggled, falling 14% to 17%. The USA was the clear geographic outperformer, while much of Europe lagged, most notably Germany (–22%).
• For the year, sector allocation was positive, as the gain from the overweights in health care and information technology and the underweight in financials more than made up for the drag from the overweight in consumer staples and utilities. However, the main driver of the significant outperformance was stock selection, due to outperformance across all the portfolio's main sectors except consumer staples, most notably communication services and information technology. Over the year the largest absolute contributors(ii) were Twenty First Century Fox , Microsoft and Nike. The largest detractors were British American Tobacco, Reckitt Benckiser and Bayer.
Management Strategies
• The good news about equities is that there are only two ways to lose money — falling earnings or falling multiples. A year ago, it was the multiples that worried us most. After the markets' bull run in 2017, the MSCI World Net Index passed 17x the next 12 months earnings,(iii) implying that markets were pricing in the improbable upside scenario of
synchronized growth everywhere... and threatening considerable downside if things did not go quite according to plan. By contrast, 2019 starts with the MSCI World Net Index on 13.4x forward consensus estimates, 14% lower than the 20-year average price-earnings (P/E) ratio of 15.5x and 20% below a year ago.(iii) As a result our primary fears have moved from multiples to earnings.
• Our generic fear about forward earnings estimates remain — the fact that they are guesses about lies. The guesses are because the sell-side is persistently over-optimistic, by an average of 8% one-year forward, slightly higher than the 7% earnings growth expected for the MSCI World Net Index in 2019.(iv) The lies are down to the gaping gap between the 'adjusted' earnings used to power consensus numbers (and management pay) and the actual number calculated using accepted accounting standards at the bottom of the profit & loss statement. Over the last three years, $600 billion has disappeared between the adjusted and actual earnings totals in the U.S. alone, overstating earnings there by an average of 21%.(iv) Our more specific anxiety is fed by the fact that it is only on the leveraged earnings metric that markets look cheap. Looking at the forward enterprise multiple rather than P/E, the discount to the historic average disappears, and the market is on a slightly higher multiple (9.2x versus 9.0x) than it was in 2003, when the P/E ratio was at a lofty 17.6x.(v) Lower corporate taxes have helped, but so has the sharp increase in leverage. Looking at enterprise value-to-sales ratios, the MSCI World Net Index is 1.8x, still 16% above its 20-year average.(iii) The combination of an expensive market on sales with a 'cheap' market on earnings reflects the really high profitability at present, particularly in the U.S., where all the drivers look fairly maxed out in favor of profits at present, be it fat margins, low tax rates, high leverage or low interest rates.
(i) The Fund's name changed from MSIF Global Quality Portfolio to MSIF Global Sustain Portfolio on April 30, 2018. Performance for the period prior to May 2018 represents MSIF Global Quality Portfolio.
(ii) The information contained in this overview regarding specific securities is for informational purposes only and should not be construed as a recommendation to purchase or sell the securities mentioned.
(iii) Source: FactSet. Data as of December 31, 2018.
(iv) Source: FactSet, Morgan Stanley Investment Management. Data as of December 31, 2018.
(v) Source: FactSet. Data as of December 31, 2018. Enterprise multiple is a measure of valuing a company that includes its debt, by dividing its enterprise value by its earnings before interest, taxes, depreciation and amortization.
4
Morgan Stanley Institutional Fund, Inc.
Annual Report — December 31, 2018
Investment Overview (unaudited) (cont'd)
Global Sustain Portfolio
• We have no greater insight than anyone else on whether the expected earnings growth for 2019 will be delivered, or even exceeded, but we do have opinions (as usual) on the key variables to watch. The current China slowdown is an earnings risk, particularly for cyclical companies, and the extent (and success) of the gathering reflation is crucial. Even if the reflation does happen, and is successful, earnings could be soft in the first part of the year until it takes effect. As mentioned above, U.S. margins are very high, and while elements of this look structural, given the emergence of lucrative platform businesses and the way the country's political system has systematically advantaged capital against labor and consumers over the last four decades, tight labor markets and tariff impacts may cause margin issues for those without pricing power.
• Leaving aside the tail-risks, such as negative trade relations, utter paralysis of the U.S. government, Mid-East conflict or a collapse of the euro, one thing that would definitely cause a margin squeeze would be a significant slowdown in the U.S., or a further slowdown in Europe. The U.S. recovery is now very long in the tooth, and while recoveries do not just die of old age, the change at the U.S. Federal Reserve (the Fed) may be an extra cause for concern. It is still early days, but Jay Powell seems more interested in the state of the real economy than the exact level of the equity markets or the fate of anyone outside the U.S. who chooses to hitch their currencies to the U.S. dollar — i.e., emerging markets. He may therefore continue to tighten via a combination of interest rates and unwinding quantitative easing until he sees weakness in the U.S. economy. He will back off at that point, but this may be too late for markets.
• 2018 has ended with the combined balance sheets of the four major central banks — the Fed, the People's Bank of China, the European Central Bank and the Bank of Japan — finally shrinking after the massive build post the Global Financial Crisis. This means that the world is now in a liquidity squeeze, combining (depending on the geographic bloc) shrinking central bank balance sheets and tightening interest rates. It is precisely the opposite combination which drove up asset prices (and consequent levering up) since the nadir of 2009.
• Our concern is that the combination of potentially falling earnings and a liquidity squeeze could be a truly toxic one for asset prices. We mentioned that
we were unclear whether earnings estimates would be met this year, but we are clear that the world is an asymmetric place, with earnings downsides in bad times far higher than the upsides in good times. This is often forgotten, as is the fact that the asymmetry is magnified by leverage — and there is more leverage than ever, particularly in the U.S. corporate debt market. Corporate America as a whole is not inexpert at levering itself up at the wrong time, most spectacularly, just before the Global Financial Crisis last time round. Given the scale of corporate leverage now and — more particularly — the component of high yield or near-high yield (or as we prefer to call it, given that the interest rates are not that high, junk or near-junk), Corporate America has to be right that earnings will hold up.
• We worry in particular about the outlook for near-junk, i.e. BBB-rated debt. This has been at the epicenter of the build-up of corporate debt, ballooning from $0.7 trillion in October 2008 to the current roughly $3 trillion.(iv) Moreover, the component of near junk (BBB) and actual junk (BB, B and CCC and below) has increased from 46% of the U.S. corporate bond market in October 2008 to 58% currently, so the quality of the overall corporate bond market has clearly deteriorated.(iv) If U.S. earnings do fall significantly, then there could be significant downgrades from BBB to junk. We do not think the currently quiescent so-called high yield market is pricing in such an outcome. In that event, the equity market is sure to hear about it — big problems in the credit market invariably mean big problems in the equity market, especially as they would have a common cause: falling earnings and too much debt.
• In this uncertain and acutely asymmetric world, we would continue to advocate owning compounders. The combination of recurring revenue and pricing power should protect revenues and margins respectively in a downturn, preserving earnings. They are also likely to be insulated from any financial distress if the corporate bond markets have a seizure, given the lower operational and financial leverage. The soft markets of the fourth quarter have deflated the portfolio's multiples a little, with the estimated 2019 free cash flow yield now over 5%, reducing the absolute downside risk.(vi)
(vi) Source: Morgan Stanley Investment Management. Data as of December 31, 2018.
5
Morgan Stanley Institutional Fund, Inc.
Annual Report — December 31, 2018
Investment Overview (unaudited) (cont'd)
Global Sustain Portfolio
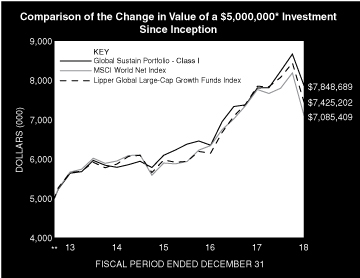
* Minimum Investment for Class I shares
** Commenced Operations on August 30, 2013.
In accordance with SEC regulations, the Fund's performance shown assumes that all recurring fees (including management fees) were deducted and all dividends and distributions were reinvested. The performance of Class A, L, C and IS shares will vary from the performance of Class I shares based upon their different inception dates and will be negatively impacted by additional fees assessed to those classes (if applicable).
Performance Compared to the MSCI World Net Index(1) and the Lipper Global Large-Cap Growth Funds Index(2)
| | | Period Ended December 31, 2018
Total Returns(3) | |
| | | | | Average Annual | |
| | | One
Year | | Five
Years | | Ten
Years | | Since
Inception(7) | |
Fund — Class I Shares
w/o sales charges(4) | | | 0.60 | % | | | 6.83 | % | | | — | | | | 8.82 | % | |
Fund — Class A Shares
w/o sales charges(4) | | | 0.26 | | | | 6.48 | | | | — | | | | 8.46 | | |
Fund — Class A Shares with
maximum 5.25% sales charges(4) | | | –5.01 | | | | 5.34 | | | | — | | | | 7.37 | | |
Fund — Class L Shares
w/o sales charges(4) | | | –0.25 | | | | 5.94 | | | | — | | | | 7.91 | | |
Fund — Class C Shares
w/o sales charges(6) | | | –0.50 | | | | — | | | | — | | | | 6.13 | | |
Fund — Class C Shares with
maximum 1.00% deferred
sales charges(6) | | | –1.42 | | | | — | | | | — | | | | 6.13 | | |
Fund — Class IS Shares
w/o sales charges(5) | | | 0.66 | | | | 6.88 | | | | — | | | | 8.36 | | |
MSCI World Net Index | | | –8.71 | | | | 4.56 | | | | — | | | | 6.75 | | |
Lipper Global Large-Cap
Growth Funds Index | | | –5.34 | | | | 5.60 | | | | — | | | | 7.69 | | |
Performance data quoted represents past performance, which is no guarantee of future results, and current performance may be lower or higher than the figures shown. Performance assumes that all dividends and distributions, if any, were reinvested. For the most recent month-end performance figures, please visit www.morganstanley.com/im/shareholderreports. Investment return and principal value will fluctuate so that Fund shares, when redeemed, may be worth more or less than their original cost. Total returns do not reflect the deduction of taxes that a shareholder would pay on Fund distributions or the redemption of Fund shares. Performance of share classes will vary due to difference in sales charges and expenses.
(1) The MSCI World Net Index is a free float-adjusted market capitalization weighted index designed to measure the equity market performance of developed markets. The term "free float" represents the portion of shares outstanding that are deemed to be available for purchase in the public equity markets by investors. The MSCI World Net Index currently consists of 23 developed market country indices. The performance of the Index is listed in US dollars and assumes reinvestment of net dividends. Net total return indices reinvest dividends after the deduction of withholding taxes, using (for international indices) a tax rate applicable to non-resident institutional investors who do not benefit from double taxation treaties. The Index is unmanaged and its returns do not include any sales charges or fees. Such costs would lower performance. It is not possible to invest directly in an index.
(2) The Lipper Global Large-Cap Growth Funds Index is an equally weighted performance index of the largest qualifying funds (based on net assets) in the Lipper Global Large-Cap Growth Funds classification. The Index, which is adjusted for capital gains distributions and income dividends, is unmanaged and should not be considered an investment. There are currently 10 funds represented in this Index. As of the date of this report, the Fund is in the Lipper Global Large-Cap Growth Funds classification.
(3) Total returns for the Fund reflect fees waived and expenses reimbursed, if applicable, by Morgan Stanley Investment Management Inc. (the "Adviser"). Without such waivers and reimbursements, total returns would have been lower.
(4) Commenced operations on August 30, 2013.
(5) Commenced offering on September 13, 2013.
(6) Commenced offering on April 30, 2015.
(7) For comparative purposes, average annual since inception returns listed for the Indexes refer to the inception date of Class I of the Fund, not the inception of the Index.
6
Morgan Stanley Institutional Fund, Inc.
Annual Report — December 31, 2018
Portfolio of Investments
Global Sustain Portfolio
| | | Shares | | Value
(000) | |
Common Stocks (95.5%) | |
Canada (2.2%) | |
Constellation Software, Inc. | | | 527 | | | $ | 337 | | |
France (3.4%) | |
L'Oreal SA | | | 1,493 | | | | 343 | | |
Sanofi | | | 2,317 | | | | 200 | | |
| | | | 543 | | |
Germany (8.6%) | |
Bayer AG (Registered) | | | 2,990 | | | | 207 | | |
Henkel AG & Co., KGaA (Preference) | | | 4,081 | | | | 446 | | |
SAP SE | | | 7,057 | | | | 703 | | |
| | | | 1,356 | | |
Hong Kong (1.5%) | |
AIA Group Ltd. | | | 29,400 | | | | 242 | | |
United Kingdom (18.8%) | |
Experian PLC | | | 5,370 | | | | 131 | | |
GlaxoSmithKline PLC | | | 27,679 | | | | 525 | | |
Prudential PLC | | | 13,113 | | | | 234 | | |
Reckitt Benckiser Group PLC | | | 13,871 | | | | 1,059 | | |
RELX PLC | | | 16,629 | | | | 342 | | |
RELX PLC (a) | | | 5,275 | | | | 109 | | |
Unilever PLC | | | 11,023 | | | | 577 | | |
| | | | 2,977 | | |
United States (61.0%) | |
Abbott Laboratories | | | 7,160 | | | | 518 | | |
Accenture PLC, Class A | | | 4,270 | | | | 602 | | |
Alphabet, Inc., Class A (a) | | | 868 | | | | 907 | | |
Automatic Data Processing, Inc. | | | 2,633 | | | | 345 | | |
Baxter International, Inc. | | | 9,057 | | | | 596 | | |
Becton Dickinson & Co. | | | 764 | | | | 172 | | |
Booking Holdings, Inc. (a) | | | 154 | | | | 265 | | |
Cerner Corp. (a) | | | 4,549 | | | | 239 | | |
Church & Dwight Co., Inc. | | | 1,295 | | | | 85 | | |
Clorox Co. (The) | | | 518 | | | | 80 | | |
Coca-Cola Co. (The) | | | 8,158 | | | | 386 | | |
Danaher Corp. | | | 4,170 | | | | 430 | | |
Factset Research Systems, Inc. | | | 960 | | | | 192 | | |
Fidelity National Information Services, Inc. | | | 2,929 | | | | 300 | | |
IPG Photonics Corp. (a) | | | 1,390 | | | | 158 | | |
Johnson & Johnson | | | 774 | | | | 100 | | |
Medtronic PLC | | | 6,227 | | | | 566 | | |
Microsoft Corp. | | | 9,586 | | | | 974 | | |
Moody's Corp. | | | 720 | | | | 101 | | |
NIKE, Inc., Class B | | | 3,850 | | | | 285 | | |
Twenty-First Century Fox, Inc., Class A | | | 10,658 | | | | 513 | | |
Twenty-First Century Fox, Inc., Class B | | | 11,942 | | | | 571 | | |
Visa, Inc., Class A | | | 6,291 | | | | 830 | | |
Zoetis, Inc. | | | 5,119 | | | | 438 | | |
| | | | 9,653 | | |
Total Common Stocks (Cost $14,418) | | | 15,108 | | |
| | | Shares | | Value
(000) | |
Short-Term Investment (3.8%) | |
Investment Company (3.8%) | |
Morgan Stanley Institutional Liquidity
Funds — Treasury Securities Portfolio —
Institutional Class (See Note G)
(Cost $606) | | | 605,843 | | | $ | 606 | | |
Total Investments (99.3%) (Cost $15,024) (b)(c) | | | 15,714 | | |
Other Assets in Excess of Liabilities (0.7%) | | | 107 | | |
Net Assets (100.0%) | | $ | 15,821 | | |
Country assignments and aggregations are based generally on third party vendor classifications and information, and may be different from the assignments and aggregations under the policies set forth in the Fund's prospectus and/or statement of additional information relating to geographic classifications.
(a) Non-income producing security.
(b) The approximate fair value and percentage of net assets, $5,118,000 and 32.3%, respectively, represent the securities that have been fair valued under the fair valuation policy for international investments as described in Note A-1 within the Notes to the Financial Statements.
(c) At December 31, 2018, the aggregate cost for federal income tax purposes is approximately $15,154,000. The aggregate gross unrealized appreciation is approximately $952,000 and the aggregate gross unrealized depreciation is approximately $392,000, resulting in net unrealized appreciation of approximately $560,000.
Portfolio Composition
Classification | | Percentage of
Total Investments | |
Other* | | | 19.9 | % | |
Health Care Equipment & Supplies | | | 14.5 | | |
Information Technology Services | | | 14.2 | | |
Software | | | 12.8 | | |
Household Products | | | 10.6 | | |
Pharmaceuticals | | | 9.4 | | |
Media | | | 6.9 | | |
Personal Products | | | 5.9 | | |
Interactive Media & Services | | | 5.8 | | |
Total Investments | | | 100.0 | % | |
* Industries and/or investment types representing less than 5% of total investments.
The accompanying notes are an integral part of the financial statements.
7
Morgan Stanley Institutional Fund, Inc.
Annual Report — December 31, 2018
Statement of Assets and Liabilities | | December 31, 2018
(000) | |
Assets: | |
Investments in Securities of Unaffiliated Issuers, at Value (Cost $14,418) | | $ | 15,108 | | |
Investment in Security of Affiliated Issuer, at Value (Cost $606) | | | 606 | | |
Total Investments in Securities, at Value (Cost $15,024) | | | 15,714 | | |
Receivable for Fund Shares Sold | | | 333 | | |
Due from Adviser | | | 58 | | |
Tax Reclaim Receivable | | | 23 | | |
Dividends Receivable | | | 15 | | |
Receivable for Investments Sold | | | 3 | | |
Receivable from Affiliate | | | 1 | | |
Other Assets | | | 37 | | |
Total Assets | | | 16,184 | | |
Liabilities: | |
Payable for Investments Purchased | | | 251 | | |
Payable for Professional Fees | | | 57 | | |
Payable for Fund Shares Redeemed | | | 36 | | |
Payable for Custodian Fees | | | 6 | | |
Payable for Transfer Agency Fees — Class I | | | 1 | | |
Payable for Transfer Agency Fees — Class A | | | 1 | | |
Payable for Transfer Agency Fees — Class L | | | 1 | | |
Payable for Transfer Agency Fees — Class C | | | 1 | | |
Payable for Transfer Agency Fees — Class IS | | | — | @ | |
Payable for Shareholder Services Fees — Class A | | | — | @ | |
Payable for Distribution and Shareholder Services Fees — Class L | | | 1 | | |
Payable for Distribution and Shareholder Services Fees — Class C | | | 2 | | |
Payable for Sub Transfer Agency Fees — Class I | | | — | @ | |
Payable for Sub Transfer Agency Fees — Class A | | | — | @ | |
Payable for Sub Transfer Agency Fees — Class L | | | — | @ | |
Payable for Sub Transfer Agency Fees — Class C | | | — | @ | |
Payable for Administration Fees | | | 1 | | |
Other Liabilities | | | 5 | | |
Total Liabilities | | | 363 | | |
Net Assets | | $ | 15,821 | | |
Net Assets Consist of: | |
Paid-in-Capital | | $ | 15,158 | | |
Total Distributable Earnings | | | 663 | | |
Net Assets | | $ | 15,821 | | |
The accompanying notes are an integral part of the financial statements.
8
Morgan Stanley Institutional Fund, Inc.
Annual Report — December 31, 2018
Statement of Assets and Liabilities (cont'd) | | December 31, 2018
(000) | |
CLASS I: | |
Net Assets | | $ | 5,891 | | |
| Shares Outstanding $0.001 par value shares of beneficial interest (unlimited shares authorized) (not in 000's) | | | 508,663 | | |
Net Asset Value, Offering and Redemption Price Per Share | | $ | 11.58 | | |
CLASS A: | |
Net Assets | | $ | 1,872 | | |
| Shares Outstanding $0.001 par value shares of beneficial interest (unlimited shares authorized) (not in 000's) | | | 162,028 | | |
Net Asset Value, Redemption Price Per Share | | $ | 11.56 | | |
Maximum Sales Load | | | 5.25 | % | |
Maximum Sales Charge | | $ | 0.64 | | |
Maximum Offering Price Per Share | | $ | 12.20 | | |
CLASS L: | |
Net Assets | | $ | 1,365 | | |
| Shares Outstanding $0.001 par value shares of beneficial interest (unlimited shares authorized) (not in 000's) | | | 118,980 | | |
Net Asset Value, Offering and Redemption Price Per Share | | $ | 11.47 | | |
CLASS C: | |
Net Assets | | $ | 1,846 | | |
| Shares Outstanding $0.001 par value shares of beneficial interest (unlimited shares authorized) (not in 000's) | | | 163,332 | | |
Net Asset Value, Offering and Redemption Price Per Share | | $ | 11.30 | | |
CLASS IS: | |
Net Assets | | $ | 4,847 | | |
| Shares Outstanding $0.001 par value shares of beneficial interest (unlimited shares authorized) (not in 000's) | | | 418,673 | | |
Net Asset Value, Offering and Redemption Price Per Share | | $ | 11.58 | | |
@ Amount is less than $500.
The accompanying notes are an integral part of the financial statements.
9
Morgan Stanley Institutional Fund, Inc.
Annual Report — December 31, 2018
Statement of Operations | | Year Ended
December 31, 2018
(000) | |
Investment Income: | |
Dividends from Securities of Unaffiliated Issuers (Net of $7 of Foreign Taxes Withheld) | | $ | 227 | | |
Dividends from Security of Affiliated Issuer (Note G) | | | 5 | | |
Total Investment Income | | | 232 | | |
Expenses: | |
Professional Fees | | | 115 | | |
Advisory Fees (Note B) | | | 93 | | |
Registration Fees | | | 69 | | |
Shareholder Services Fees — Class A (Note D) | | | 5 | | |
Distribution and Shareholder Services Fees — Class L (Note D) | | | 12 | | |
Distribution and Shareholder Services Fees — Class C (Note D) | | | 18 | | |
Custodian Fees (Note F) | | | 31 | | |
Shareholder Reporting Fees | | | 14 | | |
Transfer Agency Fees — Class I (Note E) | | | 2 | | |
Transfer Agency Fees — Class A (Note E) | | | 2 | | |
Transfer Agency Fees — Class L (Note E) | | | 2 | | |
Transfer Agency Fees — Class C (Note E) | | | 2 | | |
Transfer Agency Fees — Class IS (Note E) | | | 2 | | |
Administration Fees (Note C) | | | 10 | | |
Sub Transfer Agency Fees — Class I | | | 3 | | |
Sub Transfer Agency Fees — Class A | | | 1 | | |
Sub Transfer Agency Fees — Class L | | | 1 | | |
Sub Transfer Agency Fees — Class C | | | 1 | | |
Directors' Fees and Expenses | | | 4 | | |
Pricing Fees | | | — | @ | |
Other Expenses | | | 19 | | |
Total Expenses | | | 406 | | |
Expenses Reimbursed by Adviser (Note B) | | | (149 | ) | |
Waiver of Advisory Fees (Note B) | | | (93 | ) | |
Reimbursement of Class Specific Expenses — Class I (Note B) | | | (2 | ) | |
Reimbursement of Class Specific Expenses — Class A (Note B) | | | (1 | ) | |
Reimbursement of Class Specific Expenses — Class L (Note B) | | | (1 | ) | |
Reimbursement of Class Specific Expenses — Class C (Note B) | | | (1 | ) | |
Reimbursement of Class Specific Expenses — Class IS (Note B) | | | (2 | ) | |
Rebate from Morgan Stanley Affiliate (Note G) | | | (1 | ) | |
Net Expenses | | | 156 | | |
Net Investment Income | | | 76 | | |
Realized Gain (Loss): | |
Investments Sold | | | 1,326 | | |
Foreign Currency Translation | | | (1 | ) | |
Net Realized Gain | | | 1,325 | | |
Change in Unrealized Appreciation (Depreciation): | |
Investments | | | (1,351 | ) | |
Foreign Currency Translation | | | (1 | ) | |
Net Change in Unrealized Appreciation (Depreciation) | | | (1,352 | ) | |
Net Realized Gain and Change in Unrealized Appreciation (Depreciation) | | | (27 | ) | |
Net Increase in Net Assets Resulting from Operations | | $ | 49 | | |
@ Amount is less than $500.
The accompanying notes are an integral part of the financial statements.
10
Morgan Stanley Institutional Fund, Inc.
Annual Report — December 31, 2018
Statements of Changes in Net Assets | | Year Ended
December 31, 2018
(000) | | Year Ended
December 31, 2017
(000) | |
Increase (Decrease) in Net Assets: | |
Operations: | |
Net Investment Income | | $ | 76 | | | $ | 71 | | |
Net Realized Gain | | | 1,325 | | | | 676 | | |
Net Change in Unrealized Appreciation (Depreciation) | | | (1,352 | ) | | | 1,194 | | |
Net Increase in Net Assets Resulting from Operations | | | 49 | | | | 1,941 | | |
Dividends and Distributions to Shareholders: | |
Class I | | | (465 | ) | | | (334 | )* | |
Class A | | | (128 | ) | | | (129 | )* | |
Class L | | | (105 | ) | | | (88 | )* | |
Class C | | | (136 | ) | | | (78 | )* | |
Class IS | | | (337 | ) | | | (1 | )* | |
Total Dividends and Distributions to Shareholders | | | (1,171 | ) | | | (630 | ) | |
Capital Share Transactions:(1) | |
Class I: | |
Subscribed | | | 4,256 | | | | 911 | | |
Distributions Reinvested | | | 290 | | | | 188 | | |
Redeemed | | | (3,702 | ) | | | (408 | ) | |
Class A: | |
Subscribed | | | 389 | | | | 623 | | |
Distributions Reinvested | | | 118 | | | | 121 | | |
Redeemed | | | (787 | ) | | | (939 | ) | |
Class L: | |
Distributions Reinvested | | | 96 | | | | 81 | | |
Redeemed | | | (239 | ) | | | (941 | ) | |
Class C: | |
Subscribed | | | 755 | | | | 543 | | |
Distributions Reinvested | | | 135 | | | | 77 | | |
Redeemed | | | (334 | ) | | | (136 | ) | |
Class IS: | |
Subscribed | | | 5,000 | | | | — | | |
Distributions Reinvested | | | 336 | | | | — | | |
Net Increase in Net Assets Resulting from Capital Share Transactions | | | 6,313 | | | | 120 | | |
Total Increase in Net Assets | | | 5,191 | | | | 1,431 | | |
Net Assets: | |
Beginning of Period | | | 10,630 | | | | 9,199 | | |
End of Period | | $ | 15,821 | | | $ | 10,630 | † | |
The accompanying notes are an integral part of the financial statements.
11
Morgan Stanley Institutional Fund, Inc.
Annual Report — December 31, 2018
Statements of Changes in Net Assets (cont'd) | | Year Ended
December 31, 2018
(000) | | Year Ended
December 31, 2017
(000) | |
(1) Capital Share Transactions: | |
Class I: | |
Shares Subscribed | | | 346 | | | | 76 | | |
Shares Issued on Distributions Reinvested | | | 24 | | | | 15 | | |
Shares Redeemed | | | (289 | ) | | | (33 | ) | |
Net Increase in Class I Shares Outstanding | | | 81 | | | | 58 | | |
Class A: | |
Shares Subscribed | | | 33 | | | | 50 | | |
Shares Issued on Distributions Reinvested | | | 10 | | | | 10 | | |
Shares Redeemed | | | (61 | ) | | | (82 | ) | |
Net Decrease in Class A Shares Outstanding | | | (18 | ) | | | (22 | ) | |
Class L: | |
Shares Issued on Distributions Reinvested | | | 8 | | | | 7 | | |
Shares Redeemed | | | (19 | ) | | | (81 | ) | |
Net Decrease in Class L Shares Outstanding | | | (11 | ) | | | (74 | ) | |
Class C: | |
Shares Subscribed | | | 62 | | | | 45 | | |
Shares Issued on Distributions Reinvested | | | 12 | | | | 6 | | |
Shares Redeemed | | | (27 | ) | | | (11 | ) | |
Net Increase in Class C Shares Outstanding | | | 47 | | | | 40 | | |
Class IS: | |
Shares Subscribed | | | 389 | | | | — | | |
Shares Issued on Distributions Reinvested | | | 29 | | | | — | | |
Net Increase in Class IS Shares Outstanding | | | 418 | | | | — | | |
The following information was previously reported in the December 31, 2017 financial statements. The distribution information for the year ended December 31, 2017 presented on the Statements of Changes in Net Assets is presented for comparative purposes to the December 31, 2018 financial statements, which conform to the SEC Final Rule on Disclosure Update and Simplification which was effective November 5, 2018.
* Dividends and Distributions to Shareholders for the year ended December 31, 2017 were as follows:
Class I: | |
Net Investment Income | | $ | (51 | ) | |
Net Realized Gain | | $ | (283 | ) | |
Class A: | |
Net Investment Income | | $ | (15 | ) | |
Net Realized Gain | | $ | (114 | ) | |
Class L: | |
Net Investment Income | | $ | (1 | ) | |
Net Realized Gain | | $ | (87 | ) | |
Class C: | |
Net Investment Income | | $ | (2 | ) | |
Net Realized Gain | | $ | (76 | ) | |
Class IS: | |
Net Investment Income | | $ | (— | @) | |
Net Realized Gain | | $ | (1 | ) | |
† Accumulated Undistributed Net Investment Income for the year ended December 31, 2017 was $5.
@ Amount is less than $500
The accompanying notes are an integral part of the financial statements.
12
Morgan Stanley Institutional Fund, Inc.
Annual Report — December 31, 2018
Financial Highlights
Global Sustain Portfolio
| | | Class I | |
| | | Year Ended December 31, | |
Selected Per Share Data and Ratios | | 2018 | | 2017 | | 2016(1) | | 2015 | | 2014 | |
Net Asset Value, Beginning of Period | | $ | 12.47 | | | $ | 10.81 | | | $ | 11.43 | | | $ | 11.34 | | | $ | 11.28 | | |
Income (Loss) from Investment Operations: | |
Net Investment Income(2) | | | 0.12 | | | | 0.13 | | | | 0.17 | | | | 0.15 | | | | 0.17 | | |
Net Realized and Unrealized Gain (Loss) | | | (0.04 | ) | | | 2.35 | | | | 0.29 | | | | 0.46 | | | | 0.13 | | |
Total from Investment Operations | | | 0.08 | | | | 2.48 | | | | 0.46 | | | | 0.61 | | | | 0.30 | | |
Distributions from and/or in Excess of: | |
Net Investment Income | | | (0.07 | ) | | | (0.13 | ) | | | (0.20 | ) | | | (0.18 | ) | | | (0.13 | ) | |
Net Realized Gain | | | (0.90 | ) | | | (0.69 | ) | | | (0.88 | ) | | | (0.34 | ) | | | (0.11 | ) | |
Total Distributions | | | (0.97 | ) | | | (0.82 | ) | | | (1.08 | ) | | | (0.52 | ) | | | (0.24 | ) | |
Net Asset Value, End of Period | | $ | 11.58 | | | $ | 12.47 | | | $ | 10.81 | | | $ | 11.43 | | | $ | 11.34 | | |
Total Return(3) | | | 0.60 | % | | | 22.86 | % | | | 4.20 | % | | | 5.27 | % | | | 2.66 | % | |
Ratios and Supplemental Data: | |
Net Assets, End of Period (Thousands) | | $ | 5,891 | | | $ | 5,334 | | | $ | 3,993 | | | $ | 8,531 | | | $ | 14,579 | | |
Ratio of Expenses to Average Net Assets(8) | | | 0.93 | %(4)(6) | | | 1.00 | %(4) | | | 0.99 | %(4) | | | 0.97 | %(4) | | | 1.11 | %(4)(5) | |
Ratio of Net Investment Income to Average Net Assets(8) | | | 0.97 | %(4) | | | 1.10 | %(4) | | | 1.46 | %(4) | | | 1.26 | %(4) | | | 1.49 | %(4) | |
Ratio of Rebate from Morgan Stanley Affiliates to Average Net Assets | | | 0.00 | %(7) | | | 0.00 | %(7) | | | 0.00 | %(7) | | | 0.00 | %(7) | | | 0.00 | %(7) | |
Portfolio Turnover Rate | | | 76 | % | | | 39 | % | | | 35 | % | | | 61 | % | | | 31 | % | |
(8) Supplemental Information on the Ratios to Average Net Assets: | |
Ratios Before Expense Limitation: | |
Expenses to Average Net Assets | | | 2.86 | % | | | 3.54 | % | | | 2.45 | % | | | 2.21 | % | | | 2.34 | % | |
Net Investment Income (Loss) to Average Net Assets | | | (0.96 | )% | | | (1.44 | )% | | | (0.00 | )%(7) | | | 0.02 | % | | | 0.26 | % | |
(1) Reflects prior period Custodian out-of-pocket expenses that were reimbursed in September 2016. The amount of the reimbursement was immaterial on a per share basis and did not impact the total return of Class I shares. The Ratio of Expenses to Average Net Assets and the Ratio of Net Investment Income to Average Net Assets would be unchanged as the reimbursement of Custodian fees was offset against expense waivers/reimbursements with no impact to net expenses or net investment income.
(2) Per share amount is based on average shares outstanding.
(3) Calculated based on the net asset value as of the last business day of the period.
(4) The Ratios of Expenses and Net Investment Income reflect the rebate of certain Fund expenses in connection with the investments in Morgan Stanley affiliates during the period. The effect of the rebate on the ratios is disclosed in the above table as "Ratio of Rebate from Morgan Stanley Affiliates to Average Net Assets."
(5) Effective October 1, 2014, the Adviser has agreed to limit the ratio of expenses to average net assets to the maximum ratio of 1.00% for Class I shares. Prior to October 1, 2014, the maximum ratio was 1.20% for Class I shares.
(6) Effective April 30, 2018, the Adviser has agreed to limit the ratio of expenses to average net assets to the maximum ratio of 0.90% for Class I shares. Prior to April 30, 2018, the maximum ratio was 1.00% for Class I shares.
(7) Amount is less than 0.005%.
The accompanying notes are an integral part of the financial statements.
13
Morgan Stanley Institutional Fund, Inc.
Annual Report — December 31, 2018
Financial Highlights
Global Sustain Portfolio
| | | Class A | |
| | | Year Ended December 31, | |
Selected Per Share Data and Ratios | | 2018 | | 2017 | | 2016(1) | | 2015 | | 2014 | |
Net Asset Value, Beginning of Period | | $ | 12.44 | | | $ | 10.79 | | | $ | 11.40 | | | $ | 11.32 | | | $ | 11.27 | | |
Income (Loss) from Investment Operations: | |
Net Investment Income(2) | | | 0.07 | | | | 0.08 | | | | 0.11 | | | | 0.11 | | | | 0.12 | | |
Net Realized and Unrealized Gain (Loss) | | | (0.03 | ) | | | 2.35 | | | | 0.32 | | | | 0.45 | | | | 0.14 | | |
Total from Investment Operations | | | 0.04 | | | | 2.43 | | | | 0.43 | | | | 0.56 | | | | 0.26 | | |
Distributions from and/or in Excess of: | |
Net Investment Income | | | (0.02 | ) | | | (0.09 | ) | | | (0.16 | ) | | | (0.14 | ) | | | (0.10 | ) | |
Net Realized Gain | | | (0.90 | ) | | | (0.69 | ) | | | (0.88 | ) | | | (0.34 | ) | | | (0.11 | ) | |
Total Distributions | | | (0.92 | ) | | | (0.78 | ) | | | (1.04 | ) | | | (0.48 | ) | | | (0.21 | ) | |
Net Asset Value, End of Period | | $ | 11.56 | | | $ | 12.44 | | | $ | 10.79 | | | $ | 11.40 | | | $ | 11.32 | | |
Total Return(3) | | | 0.26 | % | | | 22.45 | % | | | 3.83 | % | | | 4.91 | % | | | 2.34 | % | |
Ratios and Supplemental Data: | |
Net Assets, End of Period (Thousands) | | $ | 1,872 | | | $ | 2,243 | | | $ | 2,182 | | | $ | 3,246 | | | $ | 4,331 | | |
Ratio of Expenses to Average Net Assets(8) | | | 1.28 | %(4)(6) | | | 1.35 | %(4) | | | 1.33 | %(4) | | | 1.30 | %(4) | | | 1.40 | %(4)(5) | |
Ratio of Net Investment Income to Average Net Assets(8) | | | 0.57 | %(4) | | | 0.66 | %(4) | | | 0.98 | %(4) | | | 0.98 | %(4) | | | 1.03 | %(4) | |
Ratio of Rebate from Morgan Stanley Affiliates to Average Net Assets | | | 0.00 | %(7) | | | 0.00 | %(7) | | | 0.00 | %(7) | | | 0.00 | %(7) | | | 0.00 | %(7) | |
Portfolio Turnover Rate | | | 76 | % | | | 39 | % | | | 35 | % | | | 61 | % | | | 31 | % | |
(8) Supplemental Information on the Ratios to Average Net Assets: | |
Ratios Before Expense Limitation: | |
Expenses to Average Net Assets | | | 3.21 | % | | | 3.90 | % | | | 2.85 | % | | | 2.52 | % | | | 2.62 | % | |
Net Investment Loss to Average Net Assets | | | (1.36 | )% | | | (1.89 | )% | | | (0.54 | )% | | | (0.24 | )% | | | (0.19 | )% | |
(1) Reflects prior period Custodian out-of-pocket expenses that were reimbursed in September 2016. The amount of the reimbursement was immaterial on a per share basis and did not impact the total return of Class A shares. The Ratio of Expenses to Average Net Assets and the Ratio of Net Investment Income to Average Net Assets would be unchanged as the reimbursement of Custodian fees was offset against expense waivers/reimbursements with no impact to net expenses or net investment income.
(2) Per share amount is based on average shares outstanding.
(3) Calculated based on the net asset value which does not reflect sales charges, if applicable, as of the last business day of the period.
(4) The Ratios of Expenses and Net Investment Income reflect the rebate of certain Fund expenses in connection with the investments in Morgan Stanley affiliates during the period. The effect of the rebate on the ratios is disclosed in the above table as "Ratio of Rebate from Morgan Stanley Affiliates to Average Net Assets."
(5) Effective October 1, 2014, the Adviser has agreed to limit the ratio of expenses to average net assets to the maximum ratios of 1.35% for Class A shares. Prior to October 1, 2014, the maximum ratio was 1.55% for Class A shares.
(6) Effective April 30, 2018, the Adviser has agreed to limit the ratio of expenses to average net assets to the maximum ratio of 1.25% for Class A shares. Prior to April 30, 2018, the maximum ratio was 1.35% for Class A shares.
(7) Amount is less than 0.005%.
The accompanying notes are an integral part of the financial statements.
14
Morgan Stanley Institutional Fund, Inc.
Annual Report — December 31, 2018
Financial Highlights
Global Sustain Portfolio
| | | Class L | |
| | | Year Ended December 31, | |
Selected Per Share Data and Ratios | | 2018 | | 2017 | | 2016(1) | | 2015 | | 2014 | |
Net Asset Value, Beginning of Period | | $ | 12.41 | | | $ | 10.76 | | | $ | 11.37 | | | $ | 11.29 | | | $ | 11.25 | | |
Income (Loss) from Investment Operations: | |
Net Investment Income(2) | | | 0.01 | | | | 0.03 | | | | 0.06 | | | | 0.05 | | | | 0.06 | | |
Net Realized and Unrealized Gain (Loss) | | | (0.04 | ) | | | 2.32 | | | | 0.31 | | | | 0.45 | | | | 0.14 | | |
Total from Investment Operations | | | (0.03 | ) | | | 2.35 | | | | 0.37 | | | | 0.50 | | | | 0.20 | | |
Distributions from and/or in Excess of: | |
Net Investment Income | | | (0.01 | ) | | | (0.01 | ) | | | (0.10 | ) | | | (0.08 | ) | | | (0.05 | ) | |
Net Realized Gain | | | (0.90 | ) | | | (0.69 | ) | | | (0.88 | ) | | | (0.34 | ) | | | (0.11 | ) | |
Total Distributions | | | (0.91 | ) | | | (0.70 | ) | | | (0.98 | ) | | | (0.42 | ) | | | (0.16 | ) | |
Net Asset Value, End of Period | | $ | 11.47 | | | $ | 12.41 | | | $ | 10.76 | | | $ | 11.37 | | | $ | 11.29 | | |
Total Return(3) | | | (0.25 | )% | | | 21.80 | % | | | 3.31 | % | | | 4.49 | % | | | 1.74 | % | |
Ratios and Supplemental Data: | |
Net Assets, End of Period (Thousands) | | $ | 1,365 | | | $ | 1,611 | | | $ | 2,194 | | | $ | 2,848 | | | $ | 2,723 | | |
Ratio of Expenses to Average Net Assets(8) | | | 1.78 | %(4)(6) | | | 1.85 | %(4) | | | 1.81 | %(4) | | | 1.81 | %(4) | | | 1.93 | %(4)(5) | |
Ratio of Net Investment Income to Average Net Assets(8) | | | 0.04 | %(4) | | | 0.24 | %(4) | | | 0.52 | %(4) | | | 0.46 | %(4) | | | 0.55 | %(4) | |
Ratio of Rebate from Morgan Stanley Affiliates to Average Net Assets | | | 0.00 | %(7) | | | 0.00 | %(7) | | | 0.00 | %(7) | | | 0.00 | %(7) | | | 0.00 | %(7) | |
Portfolio Turnover Rate | | | 76 | % | | | 39 | % | | | 35 | % | | | 61 | % | | | 31 | % | |
(8) Supplemental Information on the Ratios to Average Net Assets: | |
Ratios Before Expense Limitation: | |
Expenses to Average Net Assets | | | 3.73 | % | | | 4.39 | % | | | 3.35 | % | | | 3.06 | % | | | 3.15 | % | |
Net Investment Loss to Average Net Assets | | | (1.91 | )% | | | (2.30 | )% | | | (1.02 | )% | | | (0.79 | )% | | | (0.67 | )% | |
(1) Reflects prior period Custodian out-of-pocket expenses that were reimbursed in September 2016. The amount of the reimbursement was immaterial on a per share basis and did not impact the total return of Class L shares. The Ratio of Expenses to Average Net Assets and the Ratio of Net Investment Income to Average Net Assets would be unchanged as the reimbursement of Custodian fees was offset against expense waivers/reimbursements with no impact to net expenses or net investment income.
(2) Per share amount is based on average shares outstanding.
(3) Calculated based on the net asset value as of the last business day of the period.
(4) The Ratios of Expenses and Net Investment Income reflect the rebate of certain Fund expenses in connection with the investments in Morgan Stanley affiliates during the period. The effect of the rebate on the ratios is disclosed in the above table as "Ratio of Rebate from Morgan Stanley Affiliates to Average Net Assets."
(5) Effective October 1, 2014, the Adviser has agreed to limit the ratio of expenses to average net assets to the maximum ratios of 1.85% for Class L shares. Prior to October 1, 2014 the maximum ratio was 2.05% for Class L shares.
(6) Effective April 30, 2018, the Adviser has agreed to limit the ratio of expenses to average net assets to the maximum ratio of 1.75% for Class L shares. Prior to April 30, 2018, the maximum ratio was 1.85% for Class L shares.
(7) Amount is less than 0.005%.
The accompanying notes are an integral part of the financial statements.
15
Morgan Stanley Institutional Fund, Inc.
Annual Report — December 31, 2018
Financial Highlights
Global Sustain Portfolio
| | | Class C | |
| | | Year Ended December 31, | | Period from
April 30, 2015(2) to | |
Selected Per Share Data and Ratios | | 2018 | | 2017 | | 2016(1) | | December 31, 2015 | |
Net Asset Value, Beginning of Period | | $ | 12.26 | | | $ | 10.67 | | | $ | 11.30 | | | $ | 11.77 | | |
Income (Loss) from Investment Operations: | |
Net Investment Income (Loss)(3) | | | (0.03 | ) | | | (0.01 | ) | | | 0.02 | | | | (0.03 | ) | |
Net Realized and Unrealized Gain (Loss) | | | (0.02 | ) | | | 2.30 | | | | 0.32 | | | | 0.02 | | |
Total from Investment Operations | | | (0.05 | ) | | | 2.29 | | | | 0.34 | | | | (0.01 | ) | |
Distributions from and/or in Excess of: | |
Net Investment Income | | | (0.01 | ) | | | (0.01 | ) | | | (0.09 | ) | | | (0.12 | ) | |
Net Realized Gain | | | (0.90 | ) | | | (0.69 | ) | | | (0.88 | ) | | | (0.34 | ) | |
Total Distributions | | | (0.91 | ) | | | (0.70 | ) | | | (0.97 | ) | | | (0.46 | ) | |
Net Asset Value, End of Period | | $ | 11.30 | | | $ | 12.26 | | | $ | 10.67 | | | $ | 11.30 | | |
Total Return(4) | | | (0.50 | )% | | | 21.46 | % | | | 3.06 | % | | | (0.13 | )%(8) | |
Ratios and Supplemental Data: | |
Net Assets, End of Period (Thousands) | | $ | 1,846 | | | $ | 1,430 | | | $ | 819 | | | $ | 648 | | |
Ratio of Expenses to Average Net Assets(10) | | | 2.02 | %(5)(6) | | | 2.10 | %(5) | | | 2.10 | %(5) | | | 2.10 | %(5)(9) | |
Ratio of Net Investment Income (Loss) to Average Net Assets(10) | | | (0.24 | )%(5) | | | (0.06 | )%(5) | | | 0.17 | %(5) | | | (0.39 | )%(5)(9) | |
Ratio of Rebate from Morgan Stanley Affiliates to Average Net Assets | | | 0.00 | %(7) | | | 0.00 | %(7) | | | 0.00 | %(7) | | | 0.00 | %(7)(9) | |
Portfolio Turnover Rate | | | 76 | % | | | 39 | % | | | 35 | % | | | 61 | % | |
(10) Supplemental Information on the Ratios to Average Net Assets: | |
Ratios Before Expense Limitation: | |
Expenses to Average Net Assets | | | 4.00 | % | | | 4.71 | % | | | 3.83 | % | | | 3.80 | %(9) | |
Net Investment Loss to Average Net Assets | | | (2.22 | )% | | | (2.67 | )% | | | (1.56 | )% | | | (2.09 | )%(9) | |
(1) Reflects prior period Custodian out-of-pocket expenses that were reimbursed in September 2016. The amount of the reimbursement was immaterial on a per share basis and did not impact the total return of Class C shares. The Ratio of Expenses to Average Net Assets and the Ratio of Net Investment Income to Average Net Assets would be unchanged as the reimbursement of Custodian fees was offset against expense waivers/reimbursements with no impact to net expenses or net investment income.
(2) Commencement of Offering.
(3) Per share amount is based on average shares outstanding.
(4) Calculated based on the net asset value which does not reflect sales charges, if applicable, as of the last business day of the period.
(5) The Ratios of Expenses and Net Investment Income (Loss) reflect the rebate of certain Fund expenses in connection with the investments in Morgan Stanley affiliates during the period. The effect of the rebate on the ratios is disclosed in the above table as "Ratio of Rebate from Morgan Stanley Affiliates to Average Net Assets."
(6) Effective April 30, 2018, the Adviser has agreed to limit the ratio of expenses to average net assets to the maximum ratio of 2.00% for Class C shares. Prior to April 30, 2018, the maximum ratio was 2.10% for Class C shares.
(7) Amount is less than 0.005%.
(8) Not annualized.
(9) Annualized.
The accompanying notes are an integral part of the financial statements.
16
Morgan Stanley Institutional Fund, Inc.
Annual Report — December 31, 2018
Financial Highlights
Global Sustain Portfolio
| | | Class IS | |
| | | Year Ended December 31, | |
Selected Per Share Data and Ratios | | 2018 | | 2017 | | 2016(1) | | 2015 | | 2014 | |
Net Asset Value, Beginning of Period | | $ | 12.47 | | | $ | 10.81 | | | $ | 11.43 | | | $ | 11.34 | | | $ | 11.28 | | |
Income (Loss) from Investment Operations: | |
Net Investment Income(2) | | | 0.05 | | | | 0.14 | | | | 0.16 | | | | 0.16 | | | | 0.17 | | |
Net Realized and Unrealized Gain | | | 0.04 | | | | 2.34 | | | | 0.31 | | | | 0.45 | | | | 0.13 | | |
Total from Investment Operations | | | 0.09 | | | | 2.48 | | | | 0.47 | | | | 0.61 | | | | 0.30 | | |
Distributions from and/or in Excess of: | |
Net Investment Income | | | (0.08 | ) | | | (0.13 | ) | | | (0.21 | ) | | | (0.18 | ) | | | (0.13 | ) | |
Net Realized Gain | | | (0.90 | ) | | | (0.69 | ) | | | (0.88 | ) | | | (0.34 | ) | | | (0.11 | ) | |
Total Distributions | | | (0.98 | ) | | | (0.82 | ) | | | (1.09 | ) | | | (0.52 | ) | | | (0.24 | ) | |
Net Asset Value, End of Period | | $ | 11.58 | | | $ | 12.47 | | | $ | 10.81 | | | $ | 11.43 | | | $ | 11.34 | | |
Total Return(3) | | | 0.66 | % | | | 22.91 | % | | | 4.17 | % | | | 5.38 | % | | | 2.67 | % | |
Ratios and Supplemental Data: | |
Net Assets, End of Period (Thousands) | | $ | 4,847 | | | $ | 12 | | | $ | 11 | | | $ | 11 | | | $ | 11 | | |
Ratio of Expenses to Average Net Assets(8) | | | 0.85 | %(4)(6) | | | 0.95 | %(4) | | | 0.95 | %(4) | | | 0.95 | %(4) | | | 1.10 | %(4)(5) | |
Ratio of Net Investment Income to Average Net Assets(8) | | | 0.41 | %(4) | | | 1.15 | %(4) | | | 1.35 | %(4) | | | 1.31 | %(4) | | | 1.51 | %(4) | |
Ratio of Rebate from Morgan Stanley Affiliates to Average Net Assets | | | 0.00 | %(7) | | | 0.00 | %(7) | | | 0.00 | %(7) | | | 0.00 | %(7) | | | 0.00 | %(7) | |
Portfolio Turnover Rate | | | 76 | % | | | 39 | % | | | 35 | % | | | 61 | % | | | 31 | % | |
(8) Supplemental Information on the Ratios to Average Net Assets: | |
Ratios Before Expense Limitation: | |
Expenses to Average Net Assets | | | 3.12 | % | | | 19.10 | % | | | 19.36 | % | | | 16.35 | % | | | 19.72 | % | |
Net Investment Loss to Average Net Assets | | | (1.86 | )% | | | (17.00 | )% | | | (17.06 | )% | | | (14.09 | )% | | | (17.11 | )% | |
(1) Reflects prior period Custodian out-of-pocket expenses that were reimbursed in September 2016. The amount of the reimbursement was immaterial on a per share basis and did not impact the total return of Class IS shares. The Ratio of Expenses to Average Net Assets and the Ratio of Net Investment Income to Average Net Assets would be unchanged as the reimbursement of Custodian fees was offset against expense waivers/reimbursements with no impact to net expenses or net investment income.
(2) Per share amount is based on average shares outstanding.
(3) Calculated based on the net asset value as of the last business day of the period.
(4) The Ratios of Expenses and Net Investment Income reflect the rebate of certain Fund expenses in connection with the investments in Morgan Stanley affiliates during the period. The effect of the rebate on the ratios is disclosed in the above table as "Ratio of Rebate from Morgan Stanley Affiliates to Average Net Assets."
(5) Effective October 1, 2014, the Adviser has agreed to limit the ratio of expenses to average net assets to the maximum ratio of 0.95% for Class IS shares. Prior to October 1, 2014, the maximum ratio was 1.15% for Class IS shares.
(6) Effective April 30, 2018, the Adviser has agreed to limit the ratio of expenses to average net assets to the maximum ratio of 0.85% for Class IS shares. Prior to April 30, 2018, the maximum ratio was 0.95% for Class IS shares.
(7) Amount is less than 0.005%.
The accompanying notes are an integral part of the financial statements.
17
Morgan Stanley Institutional Fund, Inc.
Annual Report — December 31, 2018
Notes to Financial Statements
Morgan Stanley Institutional Fund, Inc. (the "Company") is registered under the Investment Company Act of 1940, as amended (the "Act"), as an open-end management investment company. The Company is comprised of thirty separate, active, diversified and non-diversified funds (individually referred to as a "Fund", collectively as the "Funds"). The Company applies investment company accounting and reporting guidance.
The accompanying financial statements relate to the Global Sustain Portfolio (name changed on April 30, 2018, formerly Global Quality Portfolio). The Fund seeks long-term capital appreciation.
The Fund offers five classes of shares — Class I, Class A, Class L, Class C and Class IS. On April 30, 2015, the Fund suspended offering of Class L shares. Existing Class L shareholders may invest through reinvestment of dividends and
distributions.
A. Significant Accounting Policies: The following significant accounting policies are in conformity with U.S. generally accepted accounting principles ("GAAP"). Such policies are consistently followed by the Company in the preparation of its financial statements. GAAP may require management to make estimates and assumptions that affect the reported amounts and disclosures in the financial statements. Actual results may differ from those estimates.
In August 2018, the Financial Accounting Standards Board ("FASB") issued Accounting Standards Update ("ASU") 2018-13, Fair Value Measurement (Topic 820) — Disclosures Framework — Changes to Disclosure Requirements of Fair Value Measurement ("ASU 2018-13") which introduces new fair value disclosure requirements as well as eliminates and modifies certain existing fair value disclosure requirements. ASU 2018-13 would be effective for fiscal years beginning after December 15, 2019 and for interim periods within those fiscal years; however, management has elected to early adopt ASU 2018-13 effective with the current reporting period as permitted by the standard. The impact of the Fund's adoption was limited to changes in the Fund's financial statement disclosures regarding fair value, primarily those disclosures related to transfers between levels of the fair value hierarchy and disclosure of the range and weighted average used to develop significant unobservable inputs for Level 3 fair value measurements, when applicable.
1. Security Valuation: (1) An equity portfolio security listed or traded on an exchange is valued at its latest reported sales price (or at the exchange official closing price
if such exchange reports an official closing price), and if there were no sales on a given day and if there is no official exchange closing price for that day, the security is valued at the mean between the last reported bid and asked prices if such bid and asked prices are available on the relevant exchanges. Listed equity securities not traded on the valuation date with no reported bid and asked prices available on the exchange are valued at the mean between the current bid and asked prices obtained from one or more reputable brokers or dealers. In cases where a security is traded on more than one exchange, the security is valued on the exchange designated as the primary market; (2) all other equity portfolio securities for which over-the-counter ("OTC") market quotations are readily available are valued at the latest reported sales price (or at the market official closing price if such market reports an official closing price), and if there was no trading in the security on a given day and if there is no official closing price from relevant markets for that day, the security is valued at the mean between the last reported bid and asked prices if such bid and asked prices are available on the relevant markets. An unlisted equity security that does not trade on the valuation date and for which bid and asked prices from the relevant markets are unavailable is valued at the mean between the current bid and asked prices obtained from one or more reputable brokers or dealers; (3) certain portfolio securities may be valued by an outside pricing service/vendor approved by the Company's Board of Directors (the "Directors"). The pricing service/vendor may employ a pricing model that takes into account, among other things, bids, yield spreads and/or other market data and specific security characteristics. Alternatively, if a valuation is not available from an outside pricing service/vendor, and the security trades on an exchange, the security may be valued at its latest reported sale price (or at the exchange official closing price if such exchange reports an official closing price), prior to the time when assets are valued. If there are no sales on a given day and if there is no official exchange closing price for that day, the security is valued at the mean between the last reported bid and asked prices if such bid and asked prices are available in the relevant exchanges; (4) when market quotations are not readily available, including circumstances under which Morgan Stanley Investment Management Inc. (the "Adviser") or Morgan Stanley Investment Management Limited ("MSIM Limited") (the "Sub-Adviser"), each a wholly-owned
18
Morgan Stanley Institutional Fund, Inc.
Annual Report — December 31, 2018
Notes to Financial Statements (cont'd)
subsidiary of Morgan Stanley, determines that the closing price, last sale price or the mean between the last reported bid and asked prices are not reflective of a security's market value, portfolio securities are valued at their fair value as determined in good faith under procedures established by and under the general supervision of the Directors. Occasionally, developments affecting the closing prices of securities and other assets may occur between the times at which valuations of such securities are determined (that is, close of the foreign market on which the securities trade) and the close of business of the New York Stock Exchange ("NYSE"). If developments occur during such periods that are expected to materially affect the value of such securities, such valuations may be adjusted to reflect the estimated fair value of such securities as of the close of the NYSE, as determined in good faith by the Directors or by the Adviser using a pricing service and/or procedures approved by the Directors; (5) quotations of foreign portfolio securities, other assets and liabilities and forward contracts stated in foreign currency are translated into U.S. dollar equivalents at the prevailing market rates prior to the close of the NYSE; and (6) investments in mutual funds, including the Morgan Stanley Institutional Liquidity Funds, are valued at the net asset value ("NAV") as of the close of each business day.
The Directors have responsibility for determining in good faith the fair value of the investments, and the Directors may appoint others, such as the Company's Adviser or a valuation committee, to assist the Directors in determining fair value and to make the actual calculations pursuant to the fair valuation methodologies previously approved by the Directors. Under procedures approved by the Directors, the Company's Adviser has formed a Valuation Committee whose members are approved by the Directors. The Valuation Committee provides administration and oversight of the Company's valuation policies and procedures, which are reviewed at least annually by the Directors. These procedures allow the Company to utilize independent pricing services, quotations from securities and financial instrument dealers and other market sources to determine fair value.
2. Fair Value Measurement: FASB Accounting Standards CodificationTM ("ASC") 820, "Fair Value Measurement" ("ASC 820"), defines fair value as the value that the
Fund would receive to sell an investment or pay to transfer a liability in a timely transaction with an independent buyer in the principal market, or in the absence of a principal market, the most advantageous market for the investment or liability. ASC 820 establishes a three-tier hierarchy to distinguish between (1) inputs that reflect the assumptions market participants would use in valuing an asset or liability developed based on market data obtained from sources independent of the reporting entity (observable inputs) and (2) inputs that reflect the reporting entity's own assumptions about the assumptions market participants would use in valuing an asset or liability developed based on the best information available in the circumstances (unobservable inputs) and to establish classification of fair value measurements for disclosure purposes. Various inputs are used in determining the value of the Fund's investments. The inputs are summarized in the three broad levels listed below:
• Level 1 – unadjusted quoted prices in active markets for identical investments
• Level 2 – other significant observable inputs (including quoted prices for similar investments, interest rates, prepayment speeds, credit risk, etc.)
• Level 3 – significant unobservable inputs including the Fund's own assumptions in determining the fair value of investments. Factors considered in making this determination may include, but are not limited to, information obtained by contacting the issuer, analysts, or the appropriate stock exchange (for exchange-traded securities), analysis of the issuer's financial statements or other available documents and, if necessary, available information concerning other securities in similar circumstances
The inputs or methodology used for valuing securities are not necessarily an indication of the risk associated with investing in those securities and the determination of the significance of a particular input to the fair value measurement in its entirety requires judgment and considers factors specific to each security.
19
Morgan Stanley Institutional Fund, Inc.
Annual Report — December 31, 2018
Notes to Financial Statements (cont'd)
The following is a summary of the inputs used to value the Fund's investments as of December 31, 2018:
Investment Type | | Level 1
Unadjusted
quoted
prices
(000) | | Level 2
Other
significant
observable
inputs
(000) | | Level 3
Significant
unobservable
inputs
(000) | | Total
(000) | |
Assets: | |
Common Stocks | |
Beverages | | $ | 386 | | | $ | — | | | $ | — | | | $ | 386 | | |
Capital Markets | | | 293 | | | | — | | | | — | | | | 293 | | |
Health Care Equipment &
Supplies | | | 2,282 | | | | — | | | | — | | | | 2,282 | | |
Health Care Technology | | | 239 | | | | — | | | | — | | | | 239 | | |
Household Products | | | 165 | | | | 1,505 | | | | — | | | | 1,670 | | |
Information Technology
Services | | | 2,235 | | | | — | | | | — | | | | 2,235 | | |
Insurance | | | — | | | | 476 | | | | — | | | | 476 | | |
Interactive Media &
Services | | | 907 | | | | — | | | | — | | | | 907 | | |
Internet & Direct Marketing
Retail | | | 265 | | | | — | | | | — | | | | 265 | | |
Media | | | 1,084 | | | | — | | | | — | | | | 1,084 | | |
Personal Products | | | — | | | | 920 | | | | — | | | | 920 | | |
Pharmaceuticals | | | 538 | | | | 932 | | | | — | | | | 1,470 | | |
Professional Services | | | — | | | | 582 | | | | — | | | | 582 | | |
Software | | | 1,311 | | | | 703 | | | | — | | | | 2,014 | | |
Textiles, Apparel & Luxury
Goods | | | 285 | | | | — | | | | — | | | | 285 | | |
Total Common Stocks | | | 9,990 | | | | 5,118 | | | | — | | | | 15,108 | | |
Short-Term Investment | |
Investment Company | | | 606 | | | | — | | | | — | | | | 606 | | |
Total Assets | | $ | 10,596 | | | $ | 5,118 | | | $ | — | | | $ | 15,714 | | |
Transfers between investment levels may occur as the markets fluctuate and/or the availability of data used in an investment's valuation changes.
3. Foreign Currency Translation and Foreign Investments: The books and records of the Fund are maintained in U.S. dollars. Foreign currency amounts are translated into U.S. dollars as follows:
– investments, other assets and liabilities at the prevailing rate of exchange on the valuation date;
– investment transactions and investment income at the prevailing rates of exchange on the dates of such transactions.
Although the net assets of the Fund are presented at the foreign exchange rates and market values at the close of the period, the Fund does not isolate that portion of the results of operations arising as a result of changes in the foreign exchange rates from the fluctuations arising from changes in the market prices of securities held at period end. Similarly, the Fund does not isolate the
effect of changes in foreign exchange rates from the fluctuations arising from changes in the market prices of securities sold during the period. Accordingly, realized and unrealized foreign currency gains (losses) on investments in securities are included in the reported net realized and unrealized gains (losses) on investment transactions and balances. However, pursuant to U.S. federal income tax regulations, gains and losses from certain foreign currency transactions and the foreign currency portion of gains and losses realized on sales and maturities of foreign denominated debt securities are treated as ordinary income for U.S. federal income tax purposes.
Net realized gains (losses) on foreign currency transactions represent net foreign exchange gains (losses) from foreign currency forward exchange contracts, disposition of foreign currencies, currency gains (losses) realized between the trade and settlement dates on securities transactions, and the difference between the amount of investment income and foreign withholding taxes recorded on the Fund's books and the U.S. dollar equivalent amounts actually received or paid. Net unrealized currency gains (losses) from valuing foreign currency denominated assets and liabilities at period end exchange rates are reflected as a component of unrealized appreciation (depreciation) in the Statement of Assets and Liabilities. The change in unrealized currency gains (losses) on foreign currency translations for the period is reflected in the Statement of Operations.
Foreign security and currency transactions may involve certain considerations and risks not typically associated with those of U.S. dollar denominated transactions as a result of, among other factors, fluctuations of exchange rates in relation to the U.S. dollar, the possibility of lower levels of governmental supervision and regulation of foreign securities markets and the possibility of political or economic instability.
Governmental approval for foreign investments may be required in advance of making an investment under certain circumstances in some countries, and the extent of foreign investments in domestic companies may be subject to limitation in other countries. Foreign ownership limitations also may be imposed by the charters of individual companies to prevent, among other concerns, violations of foreign investment limitations. As a result, an additional class of shares (identified as "Foreign" in
20
Morgan Stanley Institutional Fund, Inc.
Annual Report — December 31, 2018
Notes to Financial Statements (cont'd)
the Portfolio of Investments) may be created and offered for investment. The "local" and "foreign shares" market values may differ. In the absence of trading of the foreign shares in such markets, the Fund values the foreign shares at the closing exchange price of the local shares.
4. Indemnifications: The Company enters into contracts that contain a variety of indemnifications. The Company's maximum exposure under these arrangements is unknown. However, the Company has not had prior claims or losses pursuant to these contracts and expects the risk of loss to be remote.
5. Dividends and Distributions to Shareholders: Dividends and distributions to shareholders are recorded on the ex-dividend date. Dividends from net investment income, if any, are declared and paid annually. Net realized capital gains, if any, are distributed at least annually.
6. Security Transactions, Income and Expenses: Security transactions are accounted for on the trade date (date the order to buy or sell is executed). Realized gains and losses on the sale of investment securities are determined on the specific identified cost method. Dividend income and other distributions are recorded on the ex-dividend date (except for certain foreign dividends which may be recorded as soon as the Fund is informed of such dividends) net of applicable withholding taxes. Interest income is recognized on the accrual basis except where collection is in doubt. Discounts are accreted and premiums are amortized over the life of the respective securities. Most expenses of the Company can be directly attributed to a particular Fund. Expenses which cannot be directly attributed are apportioned among the Funds based upon relative net assets or other appropriate methods. Income, expenses (other than class specific expenses — distribution and shareholder services, transfer agency and sub transfer agency fees) and realized and unrealized gains or losses are allocated to each class of shares based upon their relative net assets.
B. Advisory/Sub-Advisory Fees: The Adviser, a wholly-owned subsidiary of Morgan Stanley, provides the Fund with advisory services under the terms of an Investment Advisory Agreement, paid quarterly, at the annual rate based on the daily net assets as follows:
First $500
million | | Next $500
million | | Over $1
billion | |
| | 0.80 | % | | | 0.75 | % | | | 0.70 | % | |
Effective April 30, 2018, the Fund's annual rate based on the daily net assets is as follows:
First $500
million | | Over $500
million | |
| | 0.70 | % | | | 0.65 | % | |
For the year ended December 31, 2018, the advisory fee rate (net of waiver/rebate) was equivalent to an annual effective rate of 0.00% of the Fund's average daily net assets.
The Adviser has agreed to reduce its advisory fee and/or reimburse the Fund so that total annual portfolio operating expenses, excluding certain investment related expenses, taxes, interest and other extraordinary expenses (including litigation), will not exceed 1.00% for Class I shares, 1.35% for Class A shares, 1.85% for Class L shares, 2.10% for Class C shares and 0.95% for Class IS shares. Effective April 30, 2018, the Adviser has agreed to reduce its advisory fee and/or reimburse the Fund so that total annual operating expenses will not exceed 0.90% for Class I shares, 1.25% for Class A shares, 1.75% for Class L shares, 2.00% for Class C shares and 0.85% for Class IS shares. The fee waivers and/or expense reimbursements will continue for at least one year from the date of the Fund's prospectus or until such time as the Directors act to discontinue all or a portion of such waivers and/or reimbursements when they deem such action is appropriate. For the year ended December 31, 2018, approximately $93,000 of advisory fees were waived and approximately $156,000 of other expenses were reimbursed by the Adviser pursuant to this arrangement.
The Adviser has entered into a Sub-Advisory Agreement with the Sub-Adviser, a wholly-owned subsidiary of Morgan Stanley. The Sub-Adviser provides the Fund with advisory services subject to the overall supervision of the Adviser and the Fund's Officers and Directors. The Adviser pays the Sub-Adviser on a monthly basis a portion of the net advisory fees the Adviser receives from the Fund.
C. Administration Fees: The Adviser also serves as Administrator to the Company and provides administrative services pursuant to an Administration Agreement for an annual fee, accrued daily and paid monthly, of 0.08% of the Fund's average daily net assets.
Under a Sub-Administration Agreement between the Administrator and State Street Bank and Trust Company ("State Street"), State Street provides certain administrative services to the Company. For such services, the Administrator pays State Street a portion of the fee the Administrator receives from the Fund.
21
Morgan Stanley Institutional Fund, Inc.
Annual Report — December 31, 2018
Notes to Financial Statements (cont'd)
D. Distribution and Shareholder Services Fees: Morgan Stanley Distribution, Inc. ("MSDI" or the "Distributor"), a wholly-owned subsidiary of the Adviser and an indirect subsidiary of Morgan Stanley, serves as the Company's Distributor of Fund shares pursuant to a Distribution Agreement. The Company has adopted a Shareholder Services Plan with respect to Class A shares pursuant to Rule 12b-1 under the Act. Under the Shareholder Services Plan, the Fund pays the Distributor a shareholder services fee, accrued daily and paid monthly, at an annual rate of 0.25% of the Fund's average daily net assets attributable to Class A shares.
The Company has adopted a Distribution and Shareholder Services Plan with respect to Class L shares pursuant to Rule 12b-1 under the Act. Under the Distribution and Shareholder Services Plan, the Fund pays the Distributor a distribution fee, accrued daily and paid monthly, at an annual rate of 0.50% and a shareholder services fee, accrued daily and paid monthly, at an annual rate of 0.25% of the Fund's average daily net assets attributable to Class L shares.
The Company has adopted a Distribution and Shareholder Services Plan with respect to Class C shares pursuant to Rule 12b-1 under the Act. Under the Distribution and Shareholder Services Plan, the Fund pays the Distributor a distribution fee, accrued daily and paid monthly, at an annual rate of 0.75% and a shareholder services fee, accrued daily and paid monthly, at an annual rate of 0.25% of the Fund's average daily net assets attributable to Class C shares.
The distribution and shareholder services fees are used to support the expenses associated with servicing and maintaining accounts. The Distributor may compensate other parties for providing shareholder support services to investors who purchase Class A, Class L and Class C shares.
E. Dividend Disbursing and Transfer Agent: The Company's dividend disbursing and transfer agent is DST Asset Manager Solutions, Inc. ("DST"). Pursuant to a Transfer Agency Agreement, the Company pays DST a fee based on the number of classes, accounts and transactions relating to the Funds of the Company.
F. Custodian Fees: State Street (the "Custodian") also serves as Custodian for the Company in accordance with a Custodian Agreement. The Custodian holds cash, securities and other assets of the Company as required by the Act. Custody fees are payable monthly based on assets held in custody, investment purchases and sales activity and
account maintenance fees, plus reimbursement for certain out-of-pocket expenses.
G. Security Transactions and Transactions with Affiliates: For the year ended December 31, 2018, purchases and sales of investment securities for the Fund, other than long-term U.S. Government securities and short-term investments were approximately $14,260,000 and $9,361,000, respectively. There were no purchases and sales of long-term U.S. Government securities for the year ended December 31, 2018.
The Fund invests in the Institutional Class of the Morgan Stanley Institutional Liquidity Funds — Treasury Securities Portfolio (the "Liquidity Funds"), an open-end management investment company managed by the Adviser. Advisory fees paid by the Fund are reduced by an amount equal to its pro-rata share of the advisory and administration fees paid by the Fund due to its investment in the Liquidity Funds. For the year ended December 31, 2018, advisory fees paid were reduced by approximately $1,000 relating to the Fund's investment in the Liquidity Funds.
A summary of the Fund's transactions in shares of affiliated investments during the year ended December 31, 2018 is as follows:
Affiliated
Investment
Company | | Value
December 31,
2017
(000) | | Purchases
at Cost
(000) | | Proceeds
from Sales
(000) | | Dividend
Income
(000) | |
Liquidity Funds | | $ | 286 | | | $ | 12,241 | | | $ | 11,921 | | | $ | 5 | | |
Affiliated
Investment
Company (cont'd) | | Realized
Gain
(Loss)
(000) | | Change in
Unrealized
Appreciation
(Depreciation)
(000) | | Value
December 31,
2018
(000) | |
Liquidity Funds | | $ | — | | | $ | — | | | $ | 606 | | |
The Fund is permitted to purchase and sell securities ("cross-trade") from and to other Morgan Stanley funds as well as other funds and client accounts for which the Adviser or an affiliate of the Adviser serves as investment adviser, pursuant to procedures approved by the Directors in compliance with Rule 17a-7 under the Act (the "Rule"). Each cross-trade is executed at the current market price in compliance with provisions of the Rule. For the year ended December 31, 2018, the Fund did not engage in any cross-trade transactions.
The Fund has an unfunded Deferred Compensation Plan (the "Compensation Plan"), which allows each independent Director to defer payment of all, or a portion, of the fees he or she receives for serving on the Board of Directors. Each eligible Director generally may elect to have the deferred amounts
22
Morgan Stanley Institutional Fund, Inc.
Annual Report — December 31, 2018
Notes to Financial Statements (cont'd)
credited with a return equal to the total return on one or more of the Morgan Stanley funds that are offered as investment options under the Compensation Plan. Appreciation/depreciation and distributions received from these investments are recorded with an offsetting increase/decrease in the deferred compensation obligation and do not affect the NAV of the Fund.
H. Federal Income Taxes: It is the Fund's intention to continue to qualify as a regulated investment company and distribute all of its taxable and tax-exempt income. Accordingly, no provision for Federal income taxes is required in the financial statements.
The Fund may be subject to taxes imposed by countries in which it invests. Such taxes are generally based on income and/or capital gains earned or repatriated. Taxes are accrued based on net investment income, net realized gains and net unrealized appreciation as such income and/or gains are earned. Taxes may also be based on transactions in foreign currency and are accrued based on the value of investments denominated in such currency.
FASB ASC 740-10, "Income Taxes — Overall", sets forth a minimum threshold for financial statement recognition of the benefit of a tax position taken or expected to be taken in a tax return. Management has concluded there are no significant uncertain tax positions that would require recognition in the financial statements. If applicable, the Fund recognizes interest accrued related to unrecognized tax benefits in "Interest Expense" and penalties in "Other Expenses" in the Statement of Operations. The Fund files tax returns with the U.S. Internal Revenue Service, New York and various states. Generally, each of the tax years in the four-year period ended December 31, 2018 remains subject to examination by taxing authorities.
The tax character of distributions paid may differ from the character of distributions for GAAP purposes due to short-term capital gains being treated as ordinary income for tax purposes. The tax character of distributions paid during fiscal years 2018 and 2017 was as follows:
2018
Distributions
Paid From: | | 2017
Distributions
Paid From: | |
Ordinary
Income
(000) | | Long-Term
Capital Gain
(000) | | Ordinary
Income
(000) | | Long-Term
Capital Gain
(000) | |
| $ | 66 | | | $ | 1,105 | | | $ | 91 | | | $ | 539 | | |
The amount and character of income and gains to be distributed are determined in accordance with income tax regulations which may differ from GAAP. These book/tax differences are either considered temporary or permanent in nature.
Temporary differences are attributable to differing book and tax treatments for the timing of the recognition of gains (losses) on certain investment transactions and the timing of the deductibility of certain expenses.
Permanent differences, primarily due to equalization debits, resulted in the following reclassifications among the components of net assets at December 31, 2018:
Total
Distributable
Earnings
(000) | | Paid-in-
Capital
(000) | |
| $ | (199 | ) | | $ | 199 | | |
At December 31, 2018, the components of distributable earnings for the Fund on a tax basis were as follows:
Undistributed
Ordinary
Income
(000) | | Undistributed
Long-Term
Capital Gain
(000) | |
| $ | 14 | | | $ | 90 | | |
I. Credit Facility: The Company and other Morgan Stanley funds participated in a $150,000,000 committed, unsecured revolving line of credit facility (the "Facility") with State Street. This Facility is to be used for temporary emergency purposes or funding of shareholder redemption requests. The interest rate on borrowings is based on the federal funds rate or 1 month LIBOR rate plus a spread. The Facility also has a commitment fee of 0.25% per annum based on the unused portion of the Facility. During the year ended December 31, 2018, the Fund did not have any borrowings under the Facility.
J. Other: At December 31, 2018, the Fund had record owners of 10% or greater. Investment activities of these shareholders could have a material impact on the Fund. The aggregate percentage of such owners was 67.9%.
23
Morgan Stanley Institutional Fund, Inc.
Annual Report — December 31, 2018
Report of Independent Registered Public Accounting Firm
To the Shareholders and Board of Directors of
Morgan Stanley Institutional Fund, Inc. —
Global Sustain Portfolio
Opinion on the Financial Statements
We have audited the accompanying statement of assets and liabilities of Global Sustain Portfolio (formerly, Global Quality Portfolio) (the "Fund") (one of the funds constituting the Morgan Stanley Institutional Fund, Inc. (the "Company")), including the portfolio of investments, as of December 31, 2018, and the related statement of operations for the year then ended, the statements of changes in net assets for each of the two years in the period then ended, the financial highlights for each of the five years in the period then ended and the related notes (collectively referred to as the "financial statements"). In our opinion, the financial statements present fairly, in all material respects, the financial position of Global Sustain Portfolio (one of the funds constituting Morgan Stanley Institutional Fund, Inc.) at December 31, 2018, the results of its operations for the year then ended, the changes in its net assets for each of the two years in the period then ended and its financial highlights for each of the five years in the period then ended, in conformity with U.S. generally accepted accounting principles.
Basis for Opinion
These financial statements are the responsibility of the Company's management. Our responsibility is to express an opinion on the Fund's financial statements based on our audits. We are a public accounting firm registered with the Public Company Accounting Oversight Board (United States) ("PCAOB") and are required to be independent with respect to the Company in accordance with the U.S. federal securities law and the applicable rules and regulations of the Securities and Exchange Commission and the PCAOB.
We conducted our audits in accordance with the standards of the PCAOB. Those standards require that we plan and perform the audit to obtain reasonable assurance about whether the financial statements are free of material misstatement, whether due to error or fraud. The Company is not required to have, nor were we engaged to perform, an audit of the Company's internal control over financial reporting. As part of our audits, we are required to obtain an understanding of internal control over financial reporting, but not for the purpose of expressing an opinion on the effectiveness of the Company's internal control over financial reporting. Accordingly, we express no such opinion.
Our audits included performing procedures to assess the risks of material misstatement of the financial statements, whether due to error or fraud, and performing procedures that respond to those risks. Such procedures included examining, on a test basis, evidence regarding the amounts and disclosures in the financial statements. Our procedures included confirmation of securities owned as of December 31, 2018 by correspondence with the custodian and others or by other appropriate auditing procedures where replies from others were not received. Our audits also included evaluating the accounting principles used and significant estimates made by management, as well as evaluating the overall presentation of the financial statements. We believe that our audits provide a reasonable basis for our opinion.

We have served as the auditor of one or more Morgan Stanley investment companies since 2000.
Boston, Massachusetts
February 26, 2019
24
Morgan Stanley Institutional Fund, Inc.
Annual Report — December 31, 2018
Federal Tax Notice (unaudited)
For federal income tax purposes, the following information is furnished with respect to the distributions paid by the Fund during its taxable year ended December 31, 2018. For corporate shareholders, 98.6% of the dividends qualified for the dividends received deduction.
The Fund designated and paid approximately $1,105,000 as a long-term capital gain distribution.
For federal income tax purposes, the following information is furnished with respect to the Fund's earnings for its taxable year ended December 31, 2018. When distributed, certain earnings may be subject to a maximum tax rate of 15% as provided for the Jobs and Growth Tax Relief Reconciliation Act of 2003. The Fund designated up to a maximum of approximately $65,000 as taxable at this lower rate.
In January, the Fund provides tax information to shareholders for the preceding calendar year.
25
Morgan Stanley Institutional Fund, Inc.
Annual Report — December 31, 2018
Privacy Notice (unaudited)
MORGAN STANLEY INVESTMENT MANAGEMENT INC.
AN IMPORTANT NOTICE CONCERNING OUR U.S. PRIVACY POLICY
We are required by federal law to provide you with a copy of our privacy policy annually. This policy applies to current and former individual investors in funds managed or sponsored by Morgan Stanley Investment Management Inc. ("MSIM") as well as current and former individual clients of MSIM. This policy is not applicable to partnerships, corporations, trusts or other non-individual clients or investors. Please note that we may amend this policy at any time, and will inform you of any changes as required by law.
WE RESPECT YOUR PRIVACY
We appreciate that you have provided us with your personal financial information. We strive to maintain the privacy of such information while we help you achieve your financial objectives. This Notice describes what non-public personal information we collect about you, why we collect it, when we may share it with others and how certain others may use it. It discusses the steps you may take to limit our sharing of certain information about you to affiliated companies in the Morgan Stanley family of companies ("other Morgan Stanley companies"). It also discloses how you may limit use of certain shared information for marketing purposes by other Morgan Stanley branded companies. Throughout this policy, we refer to the non-public information that personally identifies you or your accounts as "personal information."
1. WHAT PERSONAL INFORMATION DO WE COLLECT ABOUT YOU?
We obtain personal information from applications and other forms you submit to us, from your dealings with us, from consumer reporting agencies, from our Web sites and from third parties and other sources.
For example:
• We may collect information such as your name, address, e-mail address, telephone/fax numbers, assets, income and investment objectives through subscription documents, applications and other forms you submit to us.
• We may obtain information about account balances, your use of account(s) and the types of products and services you prefer to receive from us through your dealings and transactions with us and other sources.
• We may obtain information about your creditworthiness and credit history from consumer reporting agencies.
• We may collect background information from and through third-party vendors to verify representations you have made and to comply with various regulatory requirements.
• If you interact with us through our public and private Web sites, we may collect information that you provide directly through online communications (such as an e-mail address). We may also collect information about your Internet service provider, your domain name, your computer's operating system and Web browser, your use of our Web sites and your product and service preferences, through the use of "cookies." Please consult the Terms of Use of these sites for more details.
2. WHEN DO WE DISCLOSE PERSONAL INFORMATION WE COLLECT ABOUT YOU?
We may disclose personal information we collect about you to other Morgan Stanley companies and to non-affiliated third parties.
a. Information We Disclose to Other Morgan Stanley Companies.
We may disclose personal information to other Morgan Stanley companies for a variety of reasons, including to manage your account(s) effectively, to service and process your transactions, to let you know about products and services offered by us and other Morgan Stanley companies, to manage our business, and as otherwise required or permitted by law. Offers for products and services from other Morgan Stanley companies are developed under conditions designed to safeguard your personal information.
26
Morgan Stanley Institutional Fund, Inc.
Annual Report — December 31, 2018
Privacy Notice (unaudited) (cont'd)
b. Information We Disclose to Non-affiliated Third Parties.
We do not disclose personal information that we collect about you to non-affiliated third parties except to those who provide marketing services on our behalf, to financial institutions with whom we have joint marketing agreements, and as otherwise required or permitted by law. For example, we may disclose personal information to non-affiliated third parties for servicing and processing transactions, to offer our own products and services, to protect against fraud, for institutional risk control, to respond to judicial process or to perform services on our behalf. When we share personal information with a non-affiliated third party, they are required to limit their use of personal information to the particular purpose for which it was shared and they are not allowed to share personal information with others except to fulfill that limited purpose or as may be permitted or required by law.
3. HOW DO WE PROTECT THE SECURITY AND CONFIDENTIALITY OF PERSONAL INFORMATION WE COLLECT ABOUT YOU?
We maintain physical, electronic and procedural security measures to help safeguard the personal information we collect about you. We have internal policies governing the proper handling of client information. Third parties that provide support or marketing services on our behalf may also receive personal information, and we require them to adhere to confidentiality standards with respect to such information.
4. HOW CAN YOU LIMIT THE SHARING OF CERTAIN TYPES OF PERSONAL INFORMATION WITH OTHER MORGAN STANLEY COMPANIES?
We offer you choices as to whether we share with other Morgan Stanley companies the personal information that was collected to determine your eligibility for products and services you request ("eligibility information"). Eligibility information does not include your identification information or personal information pertaining to our transactions or experiences with you. Please note that, even if you direct us not to share eligibility information with other Morgan Stanley companies ("opt-out"), we may still share personal information, including eligibility information, with those companies in circumstances excluded from the opt-out under applicable law, such as to process transactions or to service your account.
5. HOW CAN YOU LIMIT THE USE OF CERTAIN TYPES OF PERSONAL INFORMATION BY OTHER MORGAN STANLEY COMPANIES FOR MARKETING?
By following the opt-out instructions in Section 6 below, you may limit other Morgan Stanley branded companies from marketing their products or services to you based on personal information we disclose to them. This information may include, for example, your income and account history with us. Please note that, even if you choose to limit Other Morgan Stanley Companies from using personal information about you that we may share with them for marketing their products and services to you, Other Morgan Stanley Companies may use your personal information that they obtain from us to market to you in circumstances permitted by law, such as if the Other Morgan Stanley Company has its own relationship with you.
6. HOW CAN YOU SEND US AN OPT-OUT INSTRUCTION?
If you wish to limit our sharing of eligibility information about you with other Morgan Stanley companies or other Morgan Stanley companies' use of personal information for marketing purposes, as described in this notice, you may do so by:
• Calling us at (800) 548-7786
Monday–Friday between 8a.m. and 6p.m. (EST)
• Writing to us at the following address:
DST Asset Manager Solutions, Inc.
c/o Privacy Coordinator
P.O. Box 219804
Kansas City, Missouri 64121
27
Morgan Stanley Institutional Fund, Inc.
Annual Report — December 31, 2018
Privacy Notice (unaudited) (cont'd)
Your written request should include your name, address, telephone number and account number(s) to which the opt-out applies and whether you are opting out with respect to sharing of eligibility information (Section 4 above), or if information used for Marketing (Section 5 above) or both. Written opt-out requests should not be sent with any other correspondence. In order to process your request, we require that the request be provided by you directly and not through a third party.
Your opt-out preference will remain in effect with respect to this policy (as it may be amended) until you notify us otherwise. If you have a joint account, your direction for us not to share this information with other Morgan Stanley companies and for those other Morgan Stanley companies not to use your personal information for marketing will be applied to all account holders on that account. Please understand that if you limit our sharing or our affiliated companies' use of personal information, you and any joint account holder(s) may not receive information about Morgan Stanley products and services, including products or services that could help you manage your financial resources and achieve your investment objectives.
7. WHAT IF AN AFFILIATED COMPANY BECOMES A NON-AFFILIATED THIRD PARTY?
If, at any time in the future, an affiliated company becomes a non-affiliated third party, further disclosures of personal information made to the former affiliated company will be limited to those described in Section 2(b) above relating to non-affiliated third parties. If you elected under Section 6 to limit disclosures we make to affiliated companies, or use of personal information by affiliated companies, your election will not apply to use by any former affiliated company of your personal information in their possession once it becomes a non-affiliated third party.
SPECIAL NOTICE TO RESIDENTS OF VERMONT
The following section supplements our Policy with respect to our individual clients who have a Vermont address and supersedes anything to the contrary in the above Policy with respect to those clients only.
The state of Vermont requires financial institutions to obtain your consent prior to sharing personal information that they collect about you with affiliated companies and non-affiliated third parties other than in certain limited circumstances. Except as permitted by law, we will not share personal information we collect about you with non-affiliated third parties or other Morgan Stanley companies unless you provide us with your written consent to share such information ("opt-in").
If you wish to receive offers for investment products and services offered by or through other Morgan Stanley companies, please notify us in writing at the following address:
DST Asset Manager Solutions, Inc.
c/o Privacy Coordinator
P.O. Box 219804
Kansas City, Missouri 64121
Your authorization should include your name, address, telephone number and account number(s) to which the opt-in applies and should not be sent with any other correspondence. In order to process your authorization, we require that the authorization be provided by you directly and not through a third party.
SPECIAL NOTICE TO RESIDENTS OF CALIFORNIA
The following section supplements our Policy with respect to our individual clients who have a California address and supersedes anything to the contrary in the above Policy with respect to those clients only.
In response to a California law, if your account has a California home address, your personal information will not be disclosed to non-affiliated third parties except as permitted by applicable California law, and we will limit sharing such information with our affiliates to comply with California privacy laws that apply to us.
28
Morgan Stanley Institutional Fund, Inc.
Annual Report — December 31, 2018
Director and Officer Information (unaudited)
Independent Directors:
Name, Age and Address of
Independent Director | | Position(s)
Held with
Registrant | | Length of Time
Served* | | Principal Occupation(s) During Past 5 Years
and Other Relevant Professional Experience | | Number of
Portfolios in
Fund Complex
Overseen by
Independent
Director** | | Other Directorships
Held by Independent
Director*** | |
Frank L. Bowman (74)
c/o Perkins Coie LLP
Counsel to the Independent
Directors
30 Rockefeller Plaza
New York, NY 10112 | | Director | | Since
August
2006 | | President, Strategic Decisions, LLC (consulting) (since February 2009); Director or Trustee of various Morgan Stanley Funds (since August 2006); Chairperson of the Compliance and Insurance Committee (since October 2015); formerly, Chairperson of the Insurance Sub-Committee of the Compliance and Insurance Committee (2007-2015); served as President and Chief Executive Officer of the Nuclear Energy Institute (policy organization) (February 2005-November 2008); retired as Admiral, U.S. Navy after serving over 38 years on active duty including 8 years as Director of the Naval Nuclear Propulsion Program in the Department of the Navy and the U.S. Department of Energy (1996-2004); served as Chief of Naval Personnel (July 1994-September 1996) and on the Joint Staff as Director of Political Military Affairs (June 1992-July 1994); knighted as Honorary Knight Commander of the Most Excellent Order of the British Empire; awarded the Officier de l'Orde National du Mérite by the French Government; elected to the National Academy of Engineering (2009). | | | 82 | | | Director of BP p.l.c.; Director of Naval and Nuclear Technologies LLP; Director Emeritus of the Armed Services YMCA; Member of the National Security Advisory Council of the Center for U.S. Global Engagement and a member of the CNA Military Advisory Board; Trustee of Fairhaven United Methodist Church; Member of the Board of Advisors of the Dolphin Scholarship Foundation; and Director of other various non-profit organizations. | |
Kathleen A. Dennis (65)
c/o Perkins Coie LLP
Counsel to the Independent Directors
30 Rockefeller Plaza
New York, NY 10112 | | Director | | Since
August
2006 | | President, Cedarwood Associates (mutual fund and investment management consulting) (since July 2006); Chairperson of the Liquidity and Alternatives Sub-Committee of the Investment Committee (since October 2006) and Director or Trustee of various Morgan Stanley Funds (since August 2006); formerly, Senior Managing Director of Victory Capital Management (1993-2006). | | | 82 | | | Director of various non-profit organizations. | |
Nancy C. Everett (63)
c/o Perkins Coie LLP
Counsel to the Independent Directors
30 Rockefeller Plaza
New York, NY 10112 | | Director | | Since
January
2015 | | Chief Executive Officer, Virginia Commonwealth University Investment Company (since November 2015); Owner, OBIR, LLC (institutional investment management consulting) (since June 2014); formerly, Managing Director, BlackRock Inc. (February 2011-December 2013); and Chief Executive Officer, General Motors Asset Management (a/k/a Promark Global Advisors, Inc.) (June 2005-May 2010). | | | 83 | | | Formerly, Member of Virginia Commonwealth University School of Business Foundation (2005-2016); Member of Virginia Commonwealth University Board of Visitors (2013-2015); Member of Committee on Directors for Emerging Markets Growth Fund, Inc. (2007-2010); Chairperson of Performance Equity Management, LLC (2006-2010); and Chairperson, GMAM Absolute Return Strategies Fund, LLC (2006-2010). | |
29
Morgan Stanley Institutional Fund, Inc.
Annual Report — December 31, 2018
Director and Officer Information (unaudited) (cont'd)
Independent Directors: (cont'd)
Name, Age and Address of
Independent Director | | Position(s)
Held with
Registrant | | Length of Time
Served* | | Principal Occupation(s) During Past 5 Years
and Other Relevant Professional Experience | | Number of
Portfolios in
Fund Complex
Overseen by
Independent
Director** | | Other Directorships
Held by Independent
Director*** | |
Jakki L. Haussler (61)
c/o Perkins Coie LLP
Counsel to the Independent Directors
30 Rockefeller Plaza
New York, NY 10112 | | Director | | Since
January
2015 | | Chairman and Chief Executive Officer, Opus Capital Group (since January 1996); formerly, Director, Capvest Venture Fund, LP (May 2000-December 2011); Partner, Adena Ventures, LP (July 1999-December 2010); Director, The Victory Funds (February 2005-July 2008). | | | 83 | | | Director of Service Corporation International and Member, Audit Committee and Investment Committee; Director of Cincinnati Bell Inc. and Member, Audit Committee and Governance and Nominating Committee; Chairman of Northern Kentucky University Member Investment Committee; Member of Chase College of Law Transactional Law Practice Center Board of Advisors; Director of Best Transport; Director of Chase College of Law Board of Visitors; formerly, Member, University of Cincinnati Foundation Investment Committee; Member, Miami University Board of Visitors (2008-2011); Trustee of Victory Funds (2005-2008) and Chairman, Investment Committee (2007-2008) and Member, Service Provider Committee (2005-2008). | |
Dr. Manuel H. Johnson (69)
c/o Johnson Smick
International, Inc.
220 I Street, NE — Suite 200
Washington, D.C. 20002 | | Director | | Since
July
1991 | | Senior Partner, Johnson Smick International, Inc. (consulting firm); Chairperson of the Investment Committee (since October 2006) and Director or Trustee of various Morgan Stanley Funds (since July 1991); Co-Chairman and a founder of the Group of Seven Council (G7C) (international economic commission); formerly, Chairperson of the Audit Committee (July 1991-September 2006), Vice Chairman of the Board of Governors of the Federal Reserve System and Assistant Secretary of the U.S. Treasury. | | | 82 | | | Director of NVR, Inc. (home construction). | |
Joseph J. Kearns (76)
c/o Perkins Coie LLP
Counsel to the Independent Directors
30 Rockefeller Plaza
New York, NY 10112 | | Director | | Since
August
1994 | | Senior Adviser, Kearns & Associates LLC (investment consulting); Chairperson of the Audit Committee (since October 2006) and Director or Trustee of various Morgan Stanley Funds (since August 1994); formerly, Deputy Chairperson of the Audit Committee (July 2003-September 2006) and Chairperson of the Audit Committee of various Morgan Stanley Funds (since August 1994); CFO of the J. Paul Getty Trust. | | | 83 | | | Prior to August 10, 2016, Director of Electro Rent Corporation (equipment leasing); Prior to December 31, 2013, Director of The Ford Family Foundation. | |
30
Morgan Stanley Institutional Fund, Inc.
Annual Report — December 31, 2018
Director and Officer Information (unaudited) (cont'd)
Independent Directors: (cont'd)
Name, Age and Address of
Independent Director | | Position(s)
Held with
Registrant | | Length of Time
Served* | | Principal Occupation(s) During Past 5 Years
and Other Relevant Professional Experience | | Number of
Portfolios in
Fund Complex
Overseen by
Independent
Director** | | Other Directorships
Held by Independent
Director*** | |
Michael F. Klein (60)
c/o Perkins Coie LLP
Counsel to the Independent Directors
30 Rockefeller Plaza
New York, NY 10112 | | Director | | Since
August
2006 | | Managing Director, Aetos Alternatives Management, LP (since March 2000); Co-President, Aetos Alternatives Management, LP (since January 2004) and Co-Chief Executive Officer of Aetos Alternatives Management, LP (since August 2013); Chairperson of the Fixed Income Sub-Committee of the Investment Committee (since October 2006) and Director or Trustee of various Morgan Stanley Funds (since August 2006); formerly, Managing Director, Morgan Stanley & Co. Inc. and Morgan Stanley Dean Witter Investment Management and President, various Morgan Stanley Funds (June 1998-March 2000); Principal, Morgan Stanley & Co. Inc. and Morgan Stanley Dean Witter Investment Management (August 1997-December 1999). | | | 82 | | | Director of certain investment funds managed or sponsored by Aetos Alternatives Management, LP; Director of Sanitized AG and Sanitized Marketing AG (specialty chemicals). | |
Patricia Maleski (58)
c/o Perkins Coie LLP
Counsel to the Independent Directors
30 Rockefeller Plaza
New York, NY 10112 | | Director | | Since
January
2017 | | Managing Director, JPMorgan Asset Management (2004-2016); Oversight and Control Head of Fiduciary and Conflicts of Interest Program (2015-2016); Chief Control Officer-Global Asset Management (2013-2015); President, JPMorgan Funds (2010-2013); Chief Administrative Officer (2004-2013); various other positions including Treasurer and Board Liaison (since 2001). | | | 83 | | | None. | |
Michael E. Nugent (82)
522 Fifth Avenue
New York, NY 10036 | | Chair of the Board and Director | | Chair of the Boards since July 2006 and Director since July 1991 | | Chair of the Boards of various Morgan Stanley Funds (since July 2006); Chairperson of the Closed-End Fund Committee (since June 2012) Governance Committee (since January 2019) and Director or Trustee of various Morgan Stanley Funds (since July 1991); formerly, Chairperson of the Insurance Committee (until July 2006); General Partner, Triumph Capital, L.P. (private investment partnership) (1988-2013). | | | 82 | | | None. | |
W. Allen Reed (71)
c/o Perkins Coie LLP
Counsel to the Independent Directors
30 Rockefeller Plaza
New York, NY 10112 | | Director | | Since
August
2006 | | Chairperson of the Equity Sub-Committee of the Investment Committee (since October 2006) and Director or Trustee of various Morgan Stanley Funds (since August 2006); formerly, President and CEO of General Motors Asset Management; Chairman and Chief Executive Officer of the GM Trust Bank and Corporate Vice President of General Motors Corporation (August 1994-December 2005). | | | 82 | | | Director of Legg Mason, Inc.; formerly, Director of the Auburn University Foundation (2010-2015). | |
Fergus Reid (86)****
c/o Joe Pietryka, Inc.
85 Charles Colman Blvd.
Pawling, NY 12564 | | Director | | Since
June
1992 | | Chairman, Joe Pietryka, Inc.; Chairperson of the Governance Committee and Director or Trustee of various Morgan Stanley Funds (since June 1992). | | | 83 | | | Formerly, Trustee and Director of certain investment companies in the JP Morgan Fund Complex managed by JP Morgan Investment Management Inc. (1987-2012). | |
* This is the earliest date the Director began serving the Morgan Stanley Funds. Each Director serves an indefinite term, until his or her successor is elected.
** The Fund Complex includes (as of December 31, 2018) all open-end and closed-end funds (including all of their portfolios) advised by Morgan Stanley Investment Management Inc. (the "Adviser") and any funds that have an adviser that is an affiliated person of the Adviser (including, but not limited to, Morgan Stanley AIP GP LP).
*** This includes any directorships at public companies and registered investment companies held by the Director at any time during the past five years.
**** Effective date of retirement is December 31, 2018.
31
Morgan Stanley Institutional Fund, Inc.
Annual Report — December 31, 2018
Director and Officer Information (unaudited) (cont'd)
Executive Officers:
Name, Age and Address of Executive Officer | | Position(s) Held
with
Registrant | | Length of
Time Served* | | Principal Occupation(s) During Past 5 Years | |
John H. Gernon (55)
522 Fifth Avenue
New York, NY 10036 | | President and Principal Executive Officer | | Since
September
2013 | | President and Principal Executive Officer of the Equity and Fixed Income Funds and the Morgan Stanley AIP Funds (since September 2013) and the Liquidity Funds and various money market funds (since May 2014) in the Fund Complex; Managing Director of the Adviser; Head of Product (since 2006). | |
Timothy J. Knierim (59)
522 Fifth Avenue
New York, NY 10036 | | Chief Compliance Officer | | Since
December
2016 | | Managing Director of the Adviser and various entities affiliated with the Adviser; Chief Compliance Officer of various Morgan Stanley Funds and the Adviser (since December 2016) and Chief Compliance Officer of Morgan Stanley AIP GP LP (since 2014). Formerly, Managing Director and Deputy Chief Compliance Officer of the Adviser (2014-2016); and formerly, Chief Compliance Officer of Prudential Investment Management, Inc. (2007-2014). | |
Francis J. Smith (53)
522 Fifth Avenue
New York, NY 10036 | | Treasurer and Principal Financial Officer | | Treasurer since July 2003 and Principal Financial Officer since September 2002 | | Managing Director of the Adviser and various entities affiliated with the Adviser; Treasurer (since July 2003) and Principal Financial Officer of various Morgan Stanley Funds (since September 2002). | |
Mary E. Mullin (51)
522 Fifth Avenue
New York, NY 10036 | | Secretary | | Since
June
1999 | | Managing Director of the Adviser; Secretary of various Morgan Stanley Funds (since June 1999). | |
Michael J. Key (39)
522 Fifth Avenue
New York, NY 10036 | | Vice President | | Since
June
2017 | | Vice President of the Equity and Fixed Income Funds, Liquidity Funds, various money market funds and the Morgan Stanley AIP Funds in the Fund Complex (since June 2017); Executive Director of the Adviser; Head of Product Development for Equity and Fixed Income Funds (since August 2013). | |
* This is the earliest date the officer began serving the Morgan Stanley Funds. Each officer serves a one-year term, until his or her successor is elected and qualifies.
32
Morgan Stanley Institutional Fund, Inc.
Annual Report — December 31, 2018
Adviser and Administrator
Morgan Stanley Investment Management Inc.
522 Fifth Avenue
New York, New York 10036
Sub-Adviser
Morgan Stanley Investment Management Limited
25 Cabot Square, Canary Wharf
London, E14 4QA, England
Distributor
Morgan Stanley Distribution, Inc.
522 Fifth Avenue
New York, New York 10036
Dividend Disbursing and Transfer Agent
DST Asset Manager Solutions, Inc.
2000 Crown Colony Drive
Quincy, Massachusetts 02169
Custodian
State Street Bank and Trust Company
One Lincoln Street
Boston, Massachusetts 02111
Legal Counsel
Dechert LLP
1095 Avenue of the Americas
New York, New York 10036
Counsel to the Independent Directors
Perkins Coie LLP
30 Rockefeller Plaza
New York, New York 10112
Independent Registered Public Accounting Firm
Ernst & Young LLP
200 Clarendon Street
Boston, Massachusetts 02116
Reporting to Shareholders
Each Morgan Stanley fund provides a complete schedule of portfolio holdings in its semi-annual and the annual reports within 60 days of the end of the fund's second and fourth fiscal quarters. The semi-annual and annual reports are filed electronically with the Securities and Exchange Commission ("SEC") on Form N-CSRS and Form N-CSR, respectively. Morgan Stanley also delivers the semi-annual and annual reports to fund shareholders and makes these reports available on its public website, www.morganstanley.com/im/shareholderreports. Each Morgan Stanley fund also files a complete schedule of portfolio holdings with the SEC for the fund's first and third fiscal quarters on Form N-Q. Morgan Stanley does not deliver the reports for the first and third fiscal quarters to shareholders, nor are the reports posted to the Morgan Stanley public website. You may, however, obtain the Form N-Q filings (as well as the Form N-CSR and N-CSRS filings) by accessing the SEC's website, www.sec.gov. You can also request copies of these materials, upon payment of a duplicating fee, by electronic request at the SEC's email address (publicinfo@sec.gov).
Proxy Voting Policies and Procedures and Proxy Voting Record
You may obtain a copy of the Company's Proxy Voting Policy and Procedures and information regarding how the Company voted proxies relating to portfolio securities during the most recent twelve-month period ended June 30, without charge, upon request, by calling toll free 1 (800) 548-7786 or by visiting our website at www.morganstanley.com/im/shareholderreports. This information is also available on the SEC's website at www.sec.gov.
This report is authorized for distribution only when preceded or accompanied by a prospectus or summary prospectus of the applicable Fund of Morgan Stanley Institutional Fund, Inc., which describes in detail the Fund's investment policies, risks, fees and expenses. Please read the prospectus carefully before you invest or send money. For additional information, including information regarding the investments comprising the Fund, please visit our website at www.morganstanley.com/im/shareholderreports or call toll free 1 (800) 548-7786.
33
Printed in U.S.A.
This Report has been prepared for shareholders and may be distributed to others only if preceded or accompanied by a current prospectus.
Morgan Stanley Investment Management Inc.
522 Fifth Avenue
New York, New York 10036
© 2019 Morgan Stanley. Morgan Stanley Distribution, Inc.

IFIGQANN
2398663 EXP. 02.29.20

Morgan Stanley Institutional Fund, Inc.
Growth Portfolio
Annual Report
December 31, 2018
Beginning on January 1, 2021, as permitted by regulations adopted by the Securities and Exchange Commission ("SEC"), paper copies of the Fund's Annual and Semi-Annual Reports to Shareholders ("Shareholder Reports") will no longer be sent by mail, unless you specifically request paper copies of the Shareholder Reports from the Fund or from your financial intermediary, such as a broker-dealer or a bank. Instead, the Shareholder Reports will be made available on the Fund's website, https://www.morganstanley.com/im/shareholderreports and you will be notified by mail each time a Shareholder Report is posted and provided with a website link to access the Shareholder Report. If you already elected to receive Shareholder Reports electronically, you will not be affected by this change and you need not take any action. You may elect to receive Shareholder Reports and other communications from the Fund electronically anytime by contacting your financial intermediary or, if you are a direct investor, please follow the instructions on the envelope.
Beginning on January 1, 2019, you may elect to receive all future Shareholder Reports in paper free of charge. If you invest through a financial intermediary, you can contact your financial intermediary to request that you continue to receive paper copies of your Shareholder Reports. If you invest directly with the Fund, please follow the instructions on the envelope to let the Fund know you wish to continue receiving paper copies of your Shareholder Reports. Your election to receive Shareholder Reports in paper will apply to all funds held in your account if you invest through your financial intermediary or all funds held with the fund complex if you invest directly with a fund.

Morgan Stanley Institutional Fund, Inc.
Annual Report — December 31, 2018
Shareholders' Letter | | | 2 | | |
Expense Example | | | 3 | | |
Investment Overview | | | 4 | | |
Portfolio of Investments | | | 6 | | |
Statement of Assets and Liabilities | | | 8 | | |
Statement of Operations | | | 10 | | |
Statements of Changes in Net Assets | | | 11 | | |
Financial Highlights | | | 13 | | |
Notes to Financial Statements | | | 19 | | |
Report of Independent Registered Public Accounting Firm | | | 30 | | |
Federal Tax Notice | | | 31 | | |
Privacy Notice | | | 32 | | |
Director and Officer Information | | | 35 | | |
This report is authorized for distribution only when preceded or accompanied by a prospectus or summary prospectus of the applicable Fund of Morgan Stanley Institutional Fund, Inc. To receive a prospectus and/or statement of additional information (SAI), which contains more complete information such as investment objectives, charges, expenses, policies for voting proxies, risk considerations and describes in detail each of the Fund's investment policies to the prospective investor, please call toll free 1 (800) 548-7786. Please read the prospectuses carefully before you invest or send money.
Additionally, you can access information about the Fund, including performance, characteristics and investment team commentary, through Morgan Stanley Investment Management's website: www.morganstanley.com/im/shareholderreports.
Market forecasts provided in this report may not necessarily come to pass. There is no guarantee that any sectors mentioned will continue to perform as discussed herein or that securities in such sectors will be held by the Fund in the future. There is no assurance that a fund will achieve its investment objective. Funds are subject to market risk, which is the possibility that market values of securities owned by the Fund will decline and, therefore, the value of the Fund's shares may be less than what you paid for them. Accordingly, you can lose money investing in this Fund. Please see the prospectus for more complete information on investment risks.
1
Morgan Stanley Institutional Fund, Inc.
Annual Report — December 31, 2018
Shareholders' Letter (unaudited)
Dear Shareholders,
We are pleased to provide this Annual report, in which you will learn how your investment in Growth Portfolio (the "Fund") performed during the latest twelve-month period.
Morgan Stanley Investment Management is a client-centric, investor-led organization. Our global presence, intellectual capital, and breadth of products and services enable us to partner with investors to meet the evolving challenges of today's financial markets. We aim to deliver superior investment service and to empower our clients to make the informed decisions that help them reach their investment goals.
As always, we thank you for selecting Morgan Stanley Investment Management, and look forward to working with you in the months and years ahead.
Sincerely,

John H. Gernon
President and Principal Executive Officer
January 2019
2
Morgan Stanley Institutional Fund, Inc.
Annual Report — December 31, 2018
Expense Example (unaudited)
Growth Portfolio
As a shareholder of the Fund, you incur two types of costs: (1) transactional costs; and (2) ongoing costs, which may include advisory fees, administration fees, distribution and shareholder services fees and other Fund expenses. This example is intended to help you understand your ongoing costs (in dollars) of investing in the Fund and to compare these costs with the ongoing costs of investing in other mutual funds.
This example is based on an investment of $1,000 invested at the beginning of the six-month period ended December 31, 2018 and held for the entire six-month period.
Actual Expenses
The table below provides information about actual account values and actual expenses. You may use the information in this table, together with the amount you invested, to estimate the expenses that you paid over the period. Simply divide your account value by $1,000 (for example, an $8,600 account value divided by $1,000 = 8.6), then multiply the result by the number in the table under the heading entitled "Actual Expenses Paid During Period" to estimate the expenses you paid on your account during this period.
Hypothetical Example for Comparison Purposes
The table below provides information about hypothetical account values and hypothetical expenses based on the Fund's actual expense ratio and an assumed rate of return of 5% per year before expenses, which is not the Fund's actual return. The hypothetical account values and expenses may not be used to estimate the actual ending account balance or expenses you paid for the period. You may use this information to compare the ongoing costs of investing in the Fund and other funds. To do so, compare this 5% hypothetical example with the 5% hypothetical examples that appear in the shareholder reports of the other funds.
Please note that the expenses shown in the table are meant to highlight your ongoing costs only and do not reflect any transactional costs, such as sales charges (loads). Therefore, the information for each class in the table is useful in comparing ongoing costs only, and will not help you determine the relative total costs of owning different funds. In addition, if these transactional costs were included, your costs would have been higher.
| | | Beginning
Account
Value
7/1/18 | | Actual Ending
Account
Value
12/31/18 | | Hypothetical
Ending Account
Value | | Actual
Expenses
Paid
During
Period* | | Hypothetical
Expenses Paid
During Period* | | Net
Expense
Ratio
During
Period** | |
Growth Portfolio Class I | | $ | 1,000.00 | | | $ | 901.10 | | | $ | 1,022.18 | | | $ | 2.88 | | | $ | 3.06 | | | | 0.60 | % | |
Growth Portfolio Class A | | | 1,000.00 | | | | 900.10 | | | | 1,020.92 | | | | 4.07 | | | | 4.33 | | | | 0.85 | | |
Growth Portfolio Class L | | | 1,000.00 | | | | 898.00 | | | | 1,018.70 | | | | 6.17 | | | | 6.56 | | | | 1.29 | | |
Growth Portfolio Class C | | | 1,000.00 | | | | 896.70 | | | | 1,017.29 | | | | 7.51 | | | | 7.98 | | | | 1.57 | | |
Growth Portfolio Class IS | | | 1,000.00 | | | | 901.50 | | | | 1,022.68 | | | | 2.40 | | | | 2.55 | | | | 0.50 | | |
Growth Portfolio Class IR | | | 1,000.00 | | | | 901.50 | | | | 1,022.68 | | | | 2.40 | | | | 2.55 | | | | 0.50 | | |
* Expenses are calculated using each Fund Class' annualized net expense ratio (as disclosed), multiplied by the average account value over the period and multiplied by 184/365 (to reflect the most recent one-half year period).
** Annualized.
3
Morgan Stanley Institutional Fund, Inc.
Annual Report — December 31, 2018
Investment Overview (unaudited)
Growth Portfolio
The Fund seeks long-term capital appreciation by investing primarily in growth-oriented equity securities of large capitalization companies.
Performance
For the fiscal year ended December 31, 2018, the Fund's Class I shares had a total return based on net asset value and reinvestment of distributions per share of 7.66%, net of fees. The Fund's Class I shares outperformed the Fund's benchmark, the Russell 1000® Growth Index (the "Index"), which returned –1.51%.
Factors Affecting Performance
• U.S. stocks ended the year with a loss, as anxiety over rising downside risks overwhelmed positive fundamental data. While most other major world economies were slowing, the U.S. economy accelerated in 2018. A tight labor market and rising wages supported consumer spending and confidence. Corporate earnings and revenues were robust, aided by tailwinds from tax cuts and deregulation. However, looming risks from geopolitical uncertainties, especially U.S.-China trade relations, and tightening financial conditions began to take a toll on investor sentiment and corporate earnings outlooks. Market volatility increased markedly from 2017's historically low levels, with especially sharp price swings in February, October and December 2018.
• Within the Index, the utilities, consumer discretionary and information technology (IT) were the best-performing sectors, while energy, materials and communication services were the weakest performers.
• The long-term investment horizon and conviction-weighted investment approach embraced by the team since 1998 can result in periods of performance deviation from the benchmark and peers. In this reporting period, the Fund's outperformance was largely driven by stock selection. Sector allocation in aggregate did not have a material impact on performance.
• Our stock selection was most favorable in the health care, IT and consumer discretionary sectors. Three health care holdings — a provider of cloud-based software solutions primarily to the life sciences industry, a leading maker of continuous glucose monitoring devices used by diabetics, and a leading genetic testing and analysis systems developer — were among the top five contributors to performance across the whole portfolio over the 12-month period. Also among the five top contributors were an online retail and cloud computing leader and a provider of cloud-based software for finance and human resource management.
• The communication services sector was the chief detractor from relative performance due to both stock selection and an overweight allocation in the sector. A music streaming service and a video game publisher were the two largest detracting holdings in the communication services sector and across the whole portfolio. Stock selection in the materials sector also dampened relative results, as did an underweight to the IT sector.
Management Strategies
• There were no changes to our bottom-up investment process during the period. We continued to look for high-quality growth companies that we believe have these attributes: sustainable competitive advantages, above-average business visibility, rising return on invested capital, strong free cash flow generation and a favorable risk/reward profile. We find these companies through intense fundamental research. Our emphasis is on secular growth, and as a result short-term market events are not as meaningful in the stock selection process.
4
Morgan Stanley Institutional Fund, Inc.
Annual Report — December 31, 2018
Investment Overview (unaudited) (cont'd)
Growth Portfolio

* Minimum Investment for Class I shares
In accordance with SEC regulations, the Fund's performance shown assumes that all recurring fees (including management fees) were deducted and all dividends and distributions were reinvested. The performance of Class A, L, C, IS and IR shares will vary from the performance of Class I shares based upon their different inception dates and will be negatively impacted by additional fees assessed to those classes (if applicable).
Performance Compared to the Russell 1000® Growth Index(1) and the Lipper Multi-Cap Growth Funds Index(2)
| | | Period Ended December 31, 2018
Total Returns(3) | |
| | | | | Average Annual | |
| | | One
Year | | Five
Years | | Ten
Years | | Since
Inception(10) | |
Fund — Class I Shares
w/o sales charges(4) | | | 7.66 | % | | | 12.59 | % | | | 19.72 | % | | | 10.90 | % | |
Fund — Class A Shares
w/o sales charges(5) | | | 7.39 | | | | 12.29 | | | | 19.42 | | | | 9.91 | | |
Fund — Class A Shares with
maximum 5.25% sales charges(5) | | | 1.76 | | | | 11.09 | | | | 18.78 | | | | 9.65 | | |
Fund — Class L Shares
w/o sales charges(6) | | | 6.89 | | | | 11.70 | | | | — | | | | 14.42 | | |
Fund — Class C Shares
w/o sales charges(8) | | | 6.61 | | | | — | | | | — | | | | 11.94 | | |
Fund — Class C Shares with
maximum 1.00% deferred
sales charges(8) | | | 5.62 | | | | — | | | | — | | | | 11.94 | | |
Fund — Class IS Shares
w/o sales charges(7) | | | 7.74 | | | | 12.69 | | | | — | | | | 15.15 | | |
Fund — Class IR Shares
w/o sales charges(9) | | | — | | | | — | | | | — | | | | –13.48 | | |
Russell 1000® Growth Index | | | –1.51 | | | | 10.40 | | | | 15.29 | | | | 8.91 | | |
Lipper Multi-Cap Growth Funds Index | | | –3.23 | | | | 8.01 | | | | 14.10 | | | | 8.80 | | |
Performance data quoted represents past performance, which is no guarantee of future results, and current performance may be lower or higher than the figures shown. Performance assumes that all dividends and distributions, if any, were reinvested. For the most recent month-end performance figures, please visit www.morganstanley.com/im/shareholderreports. Investment return and principal value will fluctuate so that Fund shares, when redeemed, may be worth more or less than their original cost. Returns for periods less than one year are not annualized. Total returns do not reflect the deduction of taxes that a shareholder would pay on Fund distributions or the redemption of Fund shares. Performance of share classes will vary due to difference in sales charges and expenses.
(1) The Russell 1000® Growth Index measures the performance of the large-cap growth segment of the U.S. equity universe. It includes those Russell 1000® Index companies with higher price-to-book ratios and higher forecasted growth values. The Russell 1000® Index is an index of approximately 1,000 of the largest U.S. companies based on a combination of market capitalization and current index membership. The Index is unmanaged and its returns do not include any sales charges or fees. Such costs would lower performance. It is not possible to invest directly in an index.
(2) The Lipper Multi-Cap Growth Funds Index is an equally weighted performance index of the largest qualifying funds (based on net assets) in the Lipper Multi-Cap Growth Funds classification. The Index, which is adjusted for capital gains distributions and income dividends, is unmanaged and should not be considered an investment. There are currently 30 funds represented in this Index. As of the date of this report, the Fund is in the Lipper Multi-Cap Growth Funds classification.
(3) Total returns for the Fund reflect fees waived and expenses reimbursed, if applicable, by Morgan Stanley Investment Management Inc. (the "Adviser"). Without such waivers and reimbursements, total returns would have been lower.
(4) Commenced operations on April 2, 1991.
(5) Commenced offering on January 2, 1996.
(6) Commenced offering on April 27, 2012.
(7) Commenced offering on September 13, 2013.
(8) Commenced offering on April 30, 2015.
(9) Commenced offering on June 15, 2018.
(10) For comparative purposes, average annual since inception returns listed for the Indexes refer to the inception date of Class I of the Fund, not the inception of the Index.
5
Morgan Stanley Institutional Fund, Inc.
Annual Report — December 31, 2018
Portfolio of Investments
Growth Portfolio
| | | Shares | | Value
(000) | |
Common Stocks (96.5%) | |
Biotechnology (1.2%) | |
Alnylam Pharmaceuticals, Inc. (a) | | | 378,114 | | | $ | 27,568 | | |
Bluebird Bio, Inc. (a) | | | 56,061 | | | | 5,561 | | |
Editas Medicine, Inc. (a) | | | 338,615 | | | | 7,704 | | |
Intellia Therapeutics, Inc. (a) | | | 449,168 | | | | 6,131 | | |
Intrexon Corp. (a)(b) | | | 743,125 | | | | 4,860 | | |
Moderna, Inc. (a)(b) | | | 757,606 | | | | 11,569 | | |
| | | | 63,393 | | |
Entertainment (4.7%) | |
Activision Blizzard, Inc. | | | 1,769,459 | | | | 82,404 | | |
Spotify Technology SA (a) | | | 1,503,618 | | | | 170,660 | | |
| | | | 253,064 | | |
Health Care Equipment & Supplies (9.5%) | |
DexCom, Inc. (a) | | | 1,589,177 | | | | 190,383 | | |
Intuitive Surgical, Inc. (a) | | | 560,529 | | | | 268,449 | | |
LivaNova PLC (a) | | | 524,011 | | | | 47,931 | | |
| | | | 506,763 | | |
Health Care Providers & Services (1.4%) | |
HealthEquity, Inc. (a) | | | 1,236,455 | | | | 73,754 | | |
Health Care Technology (9.8%) | |
Agilon Health Topco, Inc. (a)(c)(d)(e)
(acquisition cost — $25,030;
acquired 11/7/18) | | | 66,188 | | | | 25,069 | | |
athenahealth, Inc. (a) | | | 1,227,256 | | | | 161,912 | | |
Veeva Systems, Inc., Class A (a) | | | 3,782,938 | | | | 337,892 | | |
| | | | 524,873 | | |
Hotels, Restaurants & Leisure (3.4%) | |
Starbucks Corp. | | | 2,855,781 | | | | 183,912 | | |
Information Technology Services (6.3%) | |
MongoDB, Inc. (a) | | | 1,004,862 | | | | 84,147 | | |
Shopify, Inc., Class A (a) | | | 616,245 | | | | 85,319 | | |
Square, Inc., Class A (a) | | | 1,339,201 | | | | 75,116 | | |
Twilio, Inc., Class A (a) | | | 1,058,496 | | | | 94,524 | | |
| | | | 339,106 | | |
Interactive Media & Services (13.9%) | |
Alphabet, Inc., Class C (a) | | | 139,291 | | | | 144,251 | | |
Facebook, Inc., Class A (a) | | | 1,029,649 | | | | 134,977 | | |
IAC/InterActiveCorp (a) | | | 1,157,234 | | | | 211,820 | | |
Twitter, Inc. (a) | | | 8,759,554 | | | | 251,749 | | |
| | | | 742,797 | | |
Internet & Direct Marketing Retail (14.2%) | |
Amazon.com, Inc. (a) | | | 304,051 | | | | 456,676 | | |
Farfetch Ltd., Class A (a) | | | 2,825,848 | | | | 50,046 | | |
GrubHub, Inc. (a) | | | 1,099,902 | | | | 84,483 | | |
MercadoLibre, Inc. | | | 290,577 | | | | 85,095 | | |
Netflix, Inc. (a) | | | 318,884 | | | | 85,353 | | |
| | | | 761,653 | | |
Life Sciences Tools & Services (5.7%) | |
Illumina, Inc. (a) | | | 1,026,732 | | | | 307,948 | | |
| | | Shares | | Value
(000) | |
Pharmaceuticals (0.1%) | |
Nektar Therapeutics (a) | | | 116,932 | | | $ | 3,844 | | |
Road & Rail (3.4%) | |
Union Pacific Corp. | | | 1,323,251 | | | | 182,913 | | |
Semiconductors & Semiconductor Equipment (0.5%) | |
NVIDIA Corp. | | | 193,203 | | | | 25,793 | | |
Software (18.9%) | |
Autodesk, Inc. (a) | | | 641,964 | | | | 82,563 | | |
salesforce.com, Inc. (a) | | | 2,126,298 | | | | 291,239 | | |
ServiceNow, Inc. (a) | | | 1,660,354 | | | | 295,626 | | |
Workday, Inc., Class A (a) | | | 2,141,668 | | | | 341,982 | | |
| | | | 1,011,410 | | |
Textiles, Apparel & Luxury Goods (3.5%) | |
LVMH Moet Hennessy Louis Vuitton SE | | | 646,657 | | | | 190,017 | | |
Total Common Stocks (Cost $3,859,130) | | | 5,171,240 | | |
Preferred Stocks (2.5%) | |
Electronic Equipment, Instruments & Components (0.4%) | |
Magic Leap Series C (a)(c)(d)(e)
(acquisition cost — $18,812;
acquired 12/22/15) | | | 816,725 | | | | 22,052 | | |
Internet & Direct Marketing Retail (2.1%) | |
Airbnb, Inc. Series D (a)(c)(d)(e)
(acquisition cost — $20,638;
acquired 4/16/14) | | | 506,928 | | | | 61,211 | | |
Uber Technologies Series G (a)(c)(d)(e)
(acquisition cost — $54,173;
acquired 12/3/15) | | | 1,110,729 | | | | 51,238 | | |
| | | | 112,449 | | |
Total Preferred Stocks (Cost $93,623) | | | 134,501 | | |
Short-Term Investments (1.2%) | |
Securities held as Collateral on Loaned Securities (0.2%) | |
Investment Company (0.2%) | |
Morgan Stanley Institutional Liquidity
Funds — Treasury Securities Portfolio —
Institutional Class (See Note G) | | | 6,540,774 | | | | 6,541 | | |
| | | Face
Amount
(000) | | | |
Repurchase Agreements (0.0%) | |
Barclays Capital, Inc., (2.90%, dated
12/31/18, due 1/2/19; proceeds $494;
fully collateralized by a U.S. Government
obligation; 2.50% due 5/15/24;
valued at $504) | | $ | 494 | | | | 494 | | |
HSBC Securities USA, Inc., (2.95%, dated
12/31/18, due 1/2/19; proceeds $1,001;
fully collateralized by U.S. Government
obligations; 0.00% - 2.75%
due 1/31/19 - 2/15/42; valued at $1,021) | | | 1,001 | | | | 1,001 | | |
| | | | 1,495 | | |
Total Securities held as Collateral on Loaned
Securities (Cost $8,036) | | | 8,036 | | |
The accompanying notes are an integral part of the financial statements.
6
Morgan Stanley Institutional Fund, Inc.
Annual Report — December 31, 2018
Portfolio of Investments (cont'd)
Growth Portfolio
| | | Shares | | Value
(000) | |
Investment Company (1.0%) | |
Morgan Stanley Institutional Liquidity
Funds — Treasury Securities Portfolio —
Institutional Class (See Note G)
(Cost $54,901) | | | 54,900,669 | | | $ | 54,901 | | |
Total Short-Term Investments (Cost $62,937) | | | 62,937 | | |
Total Investments Excluding Purchased
Options (100.2%) (Cost $4,015,690) | | | 5,368,678 | | |
Total Purchased Options
Outstanding (0.1%) (Cost $15,994) | | | 3,217 | | |
Total Investments (100.3%) (Cost $4,031,684)
Including $15,983 of Securities Loaned (f)(g) | | | 5,371,895 | | |
| Liabilities in Excess of Other Assets (–0.3%) | | | (13,810 | ) | |
Net Assets (100.0%) | | $ | 5,358,085 | | |
(a) Non-income producing security.
(b) All or a portion of this security was on loan at December 31, 2018.
(c) Security has been deemed illiquid at December 31, 2018.
(d) At December 31, 2018, the Fund held fair valued securities valued at approximately $159,570,000, representing 3.0% of net assets. These securities have been fair valued as determined in good faith under procedures established by and under the general supervision of the Company's Directors.
(e) Security cannot be offered for public resale without first being registered under the Securities Act of 1933 and related rules ("restricted security"). Acquisition date represents the day on which an enforceable right to acquire such security is obtained and is presented along with related cost in the security description. The Fund has registration rights for certain restricted securities. Any costs related to such registration are borne by the issuer. The aggregate value of restricted securities (excluding 144A holdings) at December 31, 2018 amounts to approximately $159,570,000 and represents 3.0% of net assets.
(f) The approximate fair value and percentage of net assets, $190,017,000 and 3.6%, respectively, represent the securities that have been fair valued under the fair valuation policy for international investments as described in Note A-1 within the Notes to the Financial Statements.
(g) At December 31, 2018, the aggregate cost for federal income tax purposes is approximately $4,040,958,000. The aggregate gross unrealized appreciation is approximately $1,662,873,000 and the aggregate gross unrealized depreciation is approximately $331,936,000, resulting in net unrealized appreciation of approximately $1,330,937,000.
Call Options Purchased:
The Fund had the following call options purchased open at December 31, 2018:
Counterparty | | Description | | Strike
Price | | Expiration
Date | | Number of
Contracts | | Notional
Amount
(000) | | Value
(000) | | Premiums
Paid
(000) | | Unrealized
Depreciation
(000) | |
Royal Bank of Scotland | | USD/CNH | | CNH | 7.16 | | | Jan-19 | | | 1,006,048,938 | | | | 1,006,049 | | | $ | 103 | | | $ | 4,366 | | | $ | (4,263 | ) | |
Royal Bank of Scotland | | USD/CNH | | CNH | 7.78 | | | Jul-19 | | | 1,184,205,924 | | | | 1,184,206 | | | | 1,282 | | | | 5,770 | | | | (4,488 | ) | |
Royal Bank of Scotland | | USD/CNH | | CNH | 8.00 | | | Oct-19 | | | 996,202,179 | | | | 996,202 | | | | 1,832 | | | | 5,858 | | | | (4,026 | ) | |
| | | | | | | | | | | | | $ | 3,217 | | | $ | 15,994 | | | $ | (12,777 | ) | |
CNH — Chinese Yuan Renminbi Offshore
USD — United States Dollar
Portfolio Composition*
Classification | | Percentage of
Total Investments | |
Other** | | | 19.7 | % | |
Software | | | 18.9 | | |
Internet & Direct Marketing Retail | | | 16.3 | | |
Interactive Media & Services | | | 13.9 | | |
Health Care Technology | | | 9.8 | | |
Health Care Equipment & Supplies | | | 9.4 | | |
Information Technology Services | | | 6.3 | | |
Life Sciences Tools & Services | | | 5.7 | | |
Total Investments | | | 100.0 | % | |
* Percentages indicated are based upon total investments (excluding Securities held as Collateral on Loaned Securities) as of December 31, 2018.
** Industries and/or investment types representing less than 5% of total investments.
The accompanying notes are an integral part of the financial statements.
7
Morgan Stanley Institutional Fund, Inc.
Annual Report — December 31, 2018
Statement of Assets and Liabilities | | December 31, 2018
(000) | |
Assets: | |
Investments in Securities of Unaffiliated Issuers, at Value(1) (Cost $3,970,242) | | $ | 5,310,453 | | |
Investment in Security of Affiliated Issuer, at Value (Cost $61,442) | | | 61,442 | | |
Total Investments in Securities, at Value (Cost $4,031,684) | | | 5,371,895 | | |
Foreign Currency, at Value (Cost $1,247) | | | 1,260 | | |
Cash from Securities Lending | | | 49 | | |
Receivable for Fund Shares Sold | | | 15,931 | | |
Dividends Receivable | | | 533 | | |
Receivable from Affiliate | | | 193 | | |
Receivable from Securities Lending Income | | | 44 | | |
Other Assets | | | 308 | | |
Total Assets | | | 5,390,213 | | |
Liabilities: | |
Payable for Fund Shares Redeemed | | | 12,452 | | |
Collateral on Securities Loaned, at Value | | | 8,085 | | |
Payable for Advisory Fees | | | 5,650 | | |
Due to Broker | | | 3,742 | | |
Payable for Shareholder Services Fees — Class A | | | 450 | | |
Payable for Distribution and Shareholder Services Fees — Class L | | | 55 | | |
Payable for Distribution and Shareholder Services Fees — Class C | | | 80 | | |
Payable for Sub Transfer Agency Fees — Class I | | | 210 | | |
Payable for Sub Transfer Agency Fees — Class A | | | 332 | | |
Payable for Sub Transfer Agency Fees — Class L | | | 12 | | |
Payable for Sub Transfer Agency Fees — Class C | | | 4 | | |
Payable for Administration Fees | | | 376 | | |
Payable for Directors' Fees and Expenses | | | 139 | | |
Payable for Transfer Agency Fees — Class I | | | 30 | | |
Payable for Transfer Agency Fees — Class A | | | 92 | | |
Payable for Transfer Agency Fees — Class L | | | 7 | | |
Payable for Transfer Agency Fees — Class C | | | 3 | | |
Payable for Transfer Agency Fees — Class IS | | | 2 | | |
Payable for Transfer Agency Fees — Class IR | | | 2 | | |
Payable for Professional Fees | | | 59 | | |
Payable for Custodian Fees | | | 34 | | |
Payable for Investments Purchased | | | 2 | | |
Bank Overdraft | | | 1 | | |
Other Liabilities | | | 309 | | |
Total Liabilities | | | 32,128 | | |
Net Assets | | $ | 5,358,085 | | |
Net Assets Consist of: | |
Paid-in-Capital | | $ | 4,031,476 | | |
Total Distributable Earnings | | | 1,326,609 | | |
Net Assets | | $ | 5,358,085 | | |
The accompanying notes are an integral part of the financial statements.
8
Morgan Stanley Institutional Fund, Inc.
Annual Report — December 31, 2018
Statement of Assets and Liabilities (cont'd) | | December 31, 2018
(000) | |
CLASS I: | |
Net Assets | | $ | 1,785,893 | | |
| Shares Outstanding $0.001 par value shares of beneficial interest (unlimited shares authorized) (not in 000's) | | | 42,775,951 | | |
Net Asset Value, Offering and Redemption Price Per Share | | $ | 41.75 | | |
CLASS A: | |
Net Assets | | $ | 2,043,706 | | |
| Shares Outstanding $0.001 par value shares of beneficial interest (unlimited shares authorized) (not in 000's) | | | 51,589,276 | | |
Net Asset Value, Redemption Price Per Share | | $ | 39.61 | | |
Maximum Sales Load | | | 5.25 | % | |
Maximum Sales Charge | | $ | 2.20 | | |
Maximum Offering Price Per Share | | $ | 41.80 | | |
CLASS L: | |
Net Assets | | $ | 83,818 | | |
| Shares Outstanding $0.001 par value shares of beneficial interest (unlimited shares authorized) (not in 000's) | | | 2,234,315 | | |
Net Asset Value, Offering and Redemption Price Per Share | | $ | 37.51 | | |
CLASS C: | |
Net Assets | | $ | 92,431 | | |
| Shares Outstanding $0.001 par value shares of beneficial interest (unlimited shares authorized) (not in 000's) | | | 2,486,821 | | |
Net Asset Value, Offering and Redemption Price Per Share | | $ | 37.17 | | |
CLASS IS: | |
Net Assets | | $ | 1,202,659 | | |
| Shares Outstanding $0.001 par value shares of beneficial interest (unlimited shares authorized) (not in 000's) | | | 28,609,626 | | |
Net Asset Value, Offering and Redemption Price Per Share | | $ | 42.04 | | |
CLASS IR: | |
Net Assets | | $ | 149,578 | | |
| Shares Outstanding $0.001 par value shares of beneficial interest (unlimited shares authorized) (not in 000's) | | | 3,558,313 | | |
Net Asset Value, Offering and Redemption Price Per Share | | $ | 42.04 | | |
(1) Including:
Securities on Loan, at Value: | | $ | 15,983 | | |
The accompanying notes are an integral part of the financial statements.
9
Morgan Stanley Institutional Fund, Inc.
Annual Report — December 31, 2018
Statement of Operations | | Year Ended
December 31, 2018
(000) | |
Investment Income: | |
Dividends from Securities of Unaffiliated Issuers (Net of $729 of Foreign Taxes Withheld) | | $ | 18,108 | | |
Dividends from Security of Affiliated Issuer (Note G) | | | 3,222 | | |
Income from Securities Loaned — Net | | | 766 | | |
Total Investment Income | | | 22,096 | | |
Expenses: | |
Advisory Fees (Note B) | | | 21,914 | | |
Shareholder Services Fees — Class A (Note D) | | | 5,571 | | |
Distribution and Shareholder Services Fees — Class L (Note D) | | | 722 | | |
Distribution and Shareholder Services Fees — Class C (Note D) | | | 731 | | |
Administration Fees (Note C) | | | 4,323 | | |
Sub Transfer Agency Fees — Class I | | | 1,286 | | |
Sub Transfer Agency Fees — Class A | | | 1,780 | | |
Sub Transfer Agency Fees — Class L | | | 41 | | |
Sub Transfer Agency Fees — Class C | | | 46 | | |
Transfer Agency Fees — Class I (Note E) | | | 83 | | |
Transfer Agency Fees — Class A (Note E) | | | 254 | | |
Transfer Agency Fees — Class L (Note E) | | | 21 | | |
Transfer Agency Fees — Class C (Note E) | | | 9 | | |
Transfer Agency Fees — Class IS (Note E) | | | 5 | | |
Transfer Agency Fees — Class IR (Note E) | | | 3 | | |
Shareholder Reporting Fees | | | 314 | | |
Registration Fees | | | 251 | | |
Professional Fees | | | 147 | | |
Directors' Fees and Expenses | | | 130 | | |
Custodian Fees (Note F) | | | 125 | | |
Pricing Fees | | | 3 | | |
Other Expenses | | | 147 | | |
Total Expenses | | | 37,906 | | |
Rebate from Morgan Stanley Affiliate (Note G) | | | (360 | ) | |
Net Expenses | | | 37,546 | | |
Net Investment Loss | | | (15,450 | ) | |
Realized Gain (Loss): | |
Investments Sold | | | 297,761 | | |
Foreign Currency Translation | | | (111 | ) | |
Net Realized Gain | | | 297,650 | | |
Change in Unrealized Appreciation (Depreciation): | |
Investments | | | (58,531 | ) | |
Foreign Currency Translation | | | 11 | | |
Net Change in Unrealized Appreciation (Depreciation) | | | (58,520 | ) | |
Net Realized Gain and Change in Unrealized Appreciation (Depreciation) | | | 239,130 | | |
Net Increase in Net Assets Resulting from Operations | | $ | 223,680 | | |
The accompanying notes are an integral part of the financial statements.
10
Morgan Stanley Institutional Fund, Inc.
Annual Report — December 31, 2018
Statements of Changes in Net Assets | | Year Ended
December 31, 2018
(000) | | Year Ended
December 31, 2017
(000) | |
Increase (Decrease) in Net Assets: | |
Operations: | |
Net Investment Loss | | $ | (15,450 | ) | | $ | (13,973 | ) | |
Net Realized Gain | | | 297,650 | | | | 894,382 | | |
Net Change in Unrealized Appreciation (Depreciation) | | | (58,520 | ) | | | 411,029 | | |
Net Increase in Net Assets Resulting from Operations | | | 223,680 | | | | 1,291,438 | | |
Dividends and Distributions to Shareholders: | |
Class I | | | (128,911 | ) | | | (187,298 | )* | |
Class A | | | (164,975 | ) | | | (345,858 | )* | |
Class L | | | (7,134 | ) | | | (17,850 | )* | |
Class C | | | (6,987 | ) | | | (7,005 | )* | |
Class IS | | | (91,589 | ) | | | (199,297 | )* | |
Class IR | | | (8,886 | ) | | | — | | |
Total Dividends and Distributions to Shareholders | | | (408,482 | ) | | | (757,308 | ) | |
Capital Share Transactions:(1) | |
Class I: | |
Subscribed | | | 1,385,099 | | | | 405,570 | | |
Distributions Reinvested | | | 117,991 | | | | 177,679 | | |
Redeemed | | | (608,627 | ) | | | (447,722 | ) | |
Class A: | |
Subscribed | | | 640,192 | | | | 178,801 | | |
Distributions Reinvested | | | 160,500 | | | | 335,396 | | |
Redeemed | | | (546,860 | ) | | | (300,610 | ) | |
Class L: | |
Exchanged | | | 315 | | | | 223 | | |
Distributions Reinvested | | | 7,014 | | | | 17,412 | | |
Redeemed | | | (13,831 | ) | | | (13,660 | ) | |
Class C: | |
Subscribed | | | 76,038 | | | | 20,320 | | |
Distributions Reinvested | | | 6,370 | | | | 6,339 | | |
Redeemed | | | (17,708 | ) | | | (6,799 | ) | |
Class IS: | |
Subscribed | | | 229,920 | | | | 153,542 | | |
Distributions Reinvested | | | 90,879 | | | | 196,890 | | |
Redeemed | | | (241,666 | ) | | | (248,653 | ) | |
Class IR: | |
Subscribed | | | 169,937 | (a) | | | — | | |
Distributions Reinvested | | | 8,885 | (a) | | | — | | |
Net Increase in Net Assets Resulting from Capital Share Transactions | | | 1,464,448 | | | | 474,728 | | |
Total Increase in Net Assets | | | 1,279,646 | | | | 1,008,858 | | |
Net Assets: | |
Beginning of Period | | | 4,078,439 | | | | 3,069,581 | | |
End of Period | | $ | 5,358,085 | | | $ | 4,078,439 | † | |
The accompanying notes are an integral part of the financial statements.
11
Morgan Stanley Institutional Fund, Inc.
Annual Report — December 31, 2018
Statements of Changes in Net Assets (cont'd) | | Year Ended
December 31, 2018
(000) | | Year Ended
December 31, 2017
(000) | |
(1) Capital Share Transactions: | |
Class I: | |
Shares Subscribed | | | 29,271 | | | | 9,187 | | |
Shares Issued on Distributions Reinvested | | | 2,601 | | | | 4,245 | | |
Shares Redeemed | | | (12,899 | ) | | | (10,284 | ) | |
Net Increase in Class I Shares Outstanding | | | 18,973 | | | | 3,148 | | |
Class A: | |
Shares Subscribed | | | 14,015 | | | | 4,204 | | |
Shares Issued on Distributions Reinvested | | | 3,714 | | | | 8,385 | | |
Shares Redeemed | | | (12,098 | ) | | | (7,161 | ) | |
Net Increase in Class A Shares Outstanding | | | 5,631 | | | | 5,428 | | |
Class L: | |
Shares Exchanged | | | 9 | | | | 6 | | |
Shares Issued on Distributions Reinvested | | | 171 | | | | 455 | | |
Shares Redeemed | | | (319 | ) | | | (346 | ) | |
Net Increase (Decrease) in Class L Shares Outstanding | | | (139 | ) | | | 115 | | |
Class C: | |
Shares Subscribed | | | 1,767 | | | | 491 | | |
Shares Issued on Distributions Reinvested | | | 158 | | | | 167 | | |
Shares Redeemed | | | (432 | ) | | | (171 | ) | |
Net Increase in Class C Shares Outstanding | | | 1,493 | | | | 487 | | |
Class IS: | |
Shares Subscribed | | | 4,734 | | | | 3,485 | | |
Shares Issued on Distributions Reinvested | | | 1,984 | | | | 4,682 | | |
Shares Redeemed | | | (5,123 | ) | | | (5,924 | ) | |
Net Increase in Class IS Shares Outstanding | | | 1,595 | | | | 2,243 | | |
Class IR: | |
Shares Subscribed | | | 3,360 | (a) | | | — | | |
Shares Issued on Distributions Reinvested | | | 198 | (a) | | | — | | |
Net Increase in Class IR Shares Outstanding | | | 3,558 | | | | — | | |
(a) For the period June 15, 2018 through December 31, 2018.
The following information was previously reported in the December 31, 2017 financial statements. The distribution information for the year ended December 31, 2017 presented on the Statements of Changes in Net Assets is presented for comparative purposes to the December 31, 2018 financial statements, which conform to the SEC Final Rule on Disclosure Update and Simplification which was effective November 5, 2018.
* Dividends and Distributions to Shareholders for the year ended December 31, 2017 were as follows:
Class I: | |
Net Realized Gain | | $ | (187,298 | ) | |
Class A: | |
Net Realized Gain | | $ | (345,858 | ) | |
Class L: | |
Net Realized Gain | | $ | (17,850 | ) | |
Class C: | |
Net Realized Gain | | $ | (7,005 | ) | |
Class IS: | |
Net Realized Gain | | $ | (199,297 | ) | |
† Accumulated Net Investment Loss for the year ended December 31, 2017 was $(248).
The accompanying notes are an integral part of the financial statements.
12
Morgan Stanley Institutional Fund, Inc.
Annual Report — December 31, 2018
Financial Highlights
Growth Portfolio
| | | Class I | |
| | | Year Ended December 31, | |
Selected Per Share Data and Ratios | | 2018 | | 2017 | | 2016(1) | | 2015 | | 2014 | |
Net Asset Value, Beginning of Period | | $ | 41.65 | | | $ | 35.19 | | | $ | 40.44 | | | $ | 38.86 | | | $ | 38.38 | | |
Income (Loss) from Investment Operations: | |
Net Investment Income (Loss)(2) | | | (0.08 | ) | | | (0.11 | ) | | | 0.01 | | | | (0.07 | ) | | | (0.03 | ) | |
Net Realized and Unrealized Gain (Loss) | | | 3.50 | | | | 15.39 | | | | (0.79 | ) | | | 4.70 | | | | 2.43 | | |
Total from Investment Operations | | | 3.42 | | | | 15.28 | | | | (0.78 | ) | | | 4.63 | | | | 2.40 | | |
Distributions from and/or in Excess of: | |
Net Investment Income | | | — | | | | — | | | | — | | | | — | | | | (0.00 | )(3) | |
Net Realized Gain | | | (3.32 | ) | | | (8.82 | ) | | | (4.47 | ) | | | (3.05 | ) | | | (1.92 | ) | |
Total Distributions | | | (3.32 | ) | | | (8.82 | ) | | | (4.47 | ) | | | (3.05 | ) | | | (1.92 | ) | |
Net Asset Value, End of Period | | $ | 41.75 | | | $ | 41.65 | | | $ | 35.19 | | | $ | 40.44 | | | $ | 38.86 | | |
Total Return(4) | | | 7.66 | % | | | 43.83 | % | | | (1.91 | )% | | | 11.91 | % | | | 6.42 | % | |
Ratios and Supplemental Data: | |
Net Assets, End of Period (Thousands) | | $ | 1,785,893 | | | $ | 991,362 | | | $ | 726,787 | | | $ | 876,660 | | | $ | 794,648 | | |
Ratio of Expenses to Average Net Assets(9) | | | 0.58 | %(5) | | | 0.61 | %(5) | | | 0.63 | %(5)(7) | | | 0.61 | %(5) | | | 0.69 | %(5)(6) | |
Ratio of Expenses to Average Net Assets Excluding Non Operating Expenses | | | N/A | | | | 0.61 | %(5) | | | N/A | | | | N/A | | | | N/A | | |
Ratio of Net Investment Income (Loss) to Average Net Assets(9) | | | (0.17 | )%(5) | | | (0.25 | )%(5) | | | 0.02 | %(5) | | | (0.18 | )%(5) | | | (0.08 | )%(5) | |
Ratio of Rebate from Morgan Stanley Affiliates to Average Net Assets | | | 0.01 | % | | | 0.01 | % | | | 0.00 | %(8) | | | 0.00 | %(8) | | | 0.01 | % | |
Portfolio Turnover Rate | | | 41 | % | | | 55 | % | | | 39 | % | | | 34 | % | | | 44 | % | |
(9) Supplemental Information on the Ratios to Average Net Assets: | |
Ratios Before Expense Limitation: | |
Expenses to Average Net Assets | | | N/A | | | | N/A | | | | 0.63 | % | | | N/A | | | | N/A | | |
Net Investment Income to Average Net Assets | | | N/A | | | | N/A | | | | 0.02 | % | | | N/A | | | | N/A | | |
(1) Reflects prior period Custodian out-of-pocket expenses that were reimbursed in September 2016. The amount of the reimbursement was immaterial on a per share basis and did not impact the total return of Class I shares. The Ratio of Expenses to Average Net Assets would have been less than 0.005% higher and the Ratio of Net Investment Income to Average Net Assets would have been less than 0.005% lower had the Custodian not reimbursed the Fund.
(2) Per share amount is based on average shares outstanding.
(3) Amount is less than $0.005 per share.
(4) Calculated based on the net asset value as of the last business day of the period.
(5) The Ratios of Expenses and Net Investment Income (Loss) reflect the rebate of certain Fund expenses in connection with the investments in Morgan Stanley affiliates during the period. The effect of the rebate on the ratios is disclosed in the above table as "Ratio of Rebate from Morgan Stanley Affiliates to Average Net Assets."
(6) Effective April 7, 2014, the Adviser has agreed to limit the ratio of expenses to average net assets to the maximum ratio of 0.70% for Class I shares. Prior to April 7, 2014, the maximum ratio was 0.80% for Class I shares.
(7) Effective April 7, 2016, the Adviser has agreed to limit the ratio of expenses to average net assets to the maximum ratio of 0.80% for Class I shares. Prior to April 7, 2016, the maximum ratio was 0.70% for Class I shares.
(8) Amount is less than 0.005%.
The accompanying notes are an integral part of the financial statements.
13
Morgan Stanley Institutional Fund, Inc.
Annual Report — December 31, 2018
Financial Highlights
Growth Portfolio
| | | Class A | |
| | | Year Ended December 31, | |
Selected Per Share Data and Ratios | | 2018 | | 2017 | | 2016(1) | | 2015 | | 2014 | |
Net Asset Value, Beginning of Period | | $ | 39.77 | | | $ | 33.97 | | | $ | 39.31 | | | $ | 37.98 | | | $ | 37.61 | | |
Income (Loss) from Investment Operations: | |
Net Investment Loss(2) | | | (0.19 | ) | | | (0.22 | ) | | | (0.10 | ) | | | (0.21 | ) | | | (0.13 | ) | |
Net Realized and Unrealized Gain (Loss) | | | 3.35 | | | | 14.84 | | | | (0.77 | ) | | | 4.59 | | | | 2.42 | | |
Total from Investment Operations | | | 3.16 | | | | 14.62 | | | | (0.87 | ) | | | 4.38 | | | | 2.29 | | |
Distributions from and/or in Excess of: | |
Net Realized Gain | | | (3.32 | ) | | | (8.82 | ) | | | (4.47 | ) | | | (3.05 | ) | | | (1.92 | ) | |
Net Asset Value, End of Period | | $ | 39.61 | | | $ | 39.77 | | | $ | 33.97 | | | $ | 39.31 | | | $ | 37.98 | | |
Total Return(3) | | | 7.39 | % | | | 43.45 | % | | | (2.21 | )% | | | 11.53 | % | | | 6.25 | % | |
Ratios and Supplemental Data: | |
Net Assets, End of Period (Thousands) | | $ | 2,043,706 | | | $ | 1,827,833 | | | $ | 1,376,836 | | | $ | 1,630,538 | | | $ | 1,549,756 | | |
Ratio of Expenses to Average Net Assets(8) | | | 0.84 | %(4) | | | 0.88 | %(4) | | | 0.92 | %(4)(6) | | | 0.96 | %(4) | | | 0.83 | %(4)(5) | |
Ratio of Expenses to Average Net Assets Excluding Non Operating Expenses | | | N/A | | | | 0.88 | %(4) | | | N/A | | | | N/A | | | | N/A | | |
Ratio of Net Investment Loss to Average Net Assets(8) | | | (0.43 | )%(4) | | | (0.52 | )%(4) | | | (0.26 | )%(4) | | | (0.52 | )%(4) | | | (0.34 | )%(4) | |
Ratio of Rebate from Morgan Stanley Affiliates to Average Net Assets | | | 0.01 | % | | | 0.01 | % | | | 0.00 | %(7) | | | 0.00 | %(7) | | | 0.00 | %(7) | |
Portfolio Turnover Rate | | | 41 | % | | | 55 | % | | | 39 | % | | | 34 | % | | | 44 | % | |
(8) Supplemental Information on the Ratios to Average Net Assets: | |
Ratios Before Expense Limitation: | |
Expenses to Average Net Assets | | | N/A | | | | N/A | | | | 0.92 | % | | | 0.96 | % | | | N/A | | |
Net Investment Loss to Average Net Assets | | | N/A | | | | N/A | | | | (0.26 | )% | | | (0.52 | )% | | | N/A | | |
(1) Reflects prior period Custodian out-of-pocket expenses that were reimbursed in September 2016. The amount of the reimbursement was immaterial on a per share basis and did not impact the total return of Class A shares. The Ratio of Expenses to Average Net Assets would have been less than 0.005% higher and the Ratio of Net Investment Loss to Average Net Assets would have been less than 0.005% lower had the Custodian not reimbursed the Fund.
(2) Per share amount is based on average shares outstanding.
(3) Calculated based on the net asset value which does not reflect sales charges, if applicable, as of the last business day of the period.
(4) The Ratios of Expenses and Net Investment Loss reflect the rebate of certain Fund expenses in connection with the investments in Morgan Stanley affiliates during the period. The effect of the rebate on the ratios is disclosed in the above table as "Ratio of Rebate from Morgan Stanley Affiliates to Average Net Assets."
(5) Effective April 7, 2014, the Adviser has agreed to limit the ratio of expenses to average net assets to the maximum ratio of 1.05% for Class A shares. Prior to April 7, 2014, the maximum ratio was 1.15% for Class A shares.
(6) Effective April 7, 2016, the Adviser has agreed to limit the ratio of expenses to average net assets to the maximum ratio of 1.15% for Class A shares. Prior to April 7, 2016, the maximum ratio was 1.05% for Class A shares.
(7) Amount is less than 0.005%.
The accompanying notes are an integral part of the financial statements.
14
Morgan Stanley Institutional Fund, Inc.
Annual Report — December 31, 2018
Financial Highlights
Growth Portfolio
| | | Class L | |
| | | Year Ended December 31, | |
Selected Per Share Data and Ratios | | 2018 | | 2017 | | 2016(1) | | 2015 | | 2014 | |
Net Asset Value, Beginning of Period | | $ | 37.99 | | | $ | 32.90 | | | $ | 38.41 | | | $ | 37.40 | | | $ | 37.26 | | |
Income (Loss) from Investment Operations: | |
Net Investment Loss(2) | | | (0.39 | ) | | | (0.43 | ) | | | (0.29 | ) | | | (0.44 | ) | | | (0.31 | ) | |
Net Realized and Unrealized Gain (Loss) | | | 3.23 | | | | 14.34 | | | | (0.75 | ) | | | 4.50 | | | | 2.38 | | |
Total from Investment Operations | | | 2.84 | | | | 13.91 | | | | (1.04 | ) | | | 4.06 | | | | 2.07 | | |
Distributions from and/or in Excess of: | |
Net Investment Income | | | — | | | | — | | | | — | | | | — | | | | (0.01 | ) | |
Net Realized Gain | | | (3.32 | ) | | | (8.82 | ) | | | (4.47 | ) | | | (3.05 | ) | | | (1.92 | ) | |
Total Distributions | | | (3.32 | ) | | | (8.82 | ) | | | (4.47 | ) | | | (3.05 | ) | | | (1.93 | ) | |
Net Asset Value, End of Period | | $ | 37.51 | | | $ | 37.99 | | | $ | 32.90 | | | $ | 38.41 | | | $ | 37.40 | | |
Total Return(3) | | | 6.89 | % | | | 42.69 | % | | | (2.72 | )% | | | 10.85 | % | | | 5.72 | % | |
Ratios and Supplemental Data: | |
Net Assets, End of Period (Thousands) | | $ | 83,818 | | | $ | 90,177 | | | $ | 74,324 | | | $ | 89,277 | | | $ | 89,854 | | |
Ratio of Expenses to Average Net Assets(8) | | | 1.31 | %(4) | | | 1.42 | %(4) | | | 1.45 | %(4)(6) | | | 1.55 | %(4) | | | 1.29 | %(4)(5) | |
Ratio of Expenses to Average Net Assets Excluding Non Operating Expenses | | | N/A | | | | 1.42 | %(4) | | | N/A | | | | N/A | | | | N/A | | |
Ratio of Net Investment Loss to Average Net Assets(8) | | | (0.90 | )%(4) | | | (1.05 | )%(4) | | | (0.79 | )%(4) | | | (1.11 | )%(4) | | | (0.82 | )%(4) | |
Ratio of Rebate from Morgan Stanley Affiliates to Average Net Assets | | | 0.01 | % | | | 0.01 | % | | | 0.00 | %(7) | | | 0.00 | %(7) | | | 0.00 | %(7) | |
Portfolio Turnover Rate | | | 41 | % | | | 55 | % | | | 39 | % | | | 34 | % | | | 44 | % | |
(8) Supplemental Information on the Ratios to Average Net Assets: | |
Ratios Before Expense Limitation: | |
Expenses to Average Net Assets | | | N/A | | | | N/A | | | | 1.45 | % | | | 1.57 | % | | | N/A | | |
Net Investment Loss to Average Net Assets | | | N/A | | | | N/A | | | | (0.79 | )% | | | (1.13 | )% | | | N/A | | |
(1) Reflects prior period Custodian out-of-pocket expenses that were reimbursed in September 2016. The amount of the reimbursement was immaterial on a per share basis and did not impact the total return of Class L shares. The Ratio of Expenses to Average Net Assets would have been less than 0.005% higher and the Ratio of Net Investment Loss to Average Net Assets would have been less than 0.005% lower had the Custodian not reimbursed the Fund.
(2) Per share amount is based on average shares outstanding.
(3) Calculated based on the net asset value as of the last business day of the period.
(4) The Ratios of Expenses and Net Investment Loss reflect the rebate of certain Fund expenses in connection with the investments in Morgan Stanley affiliates during the period. The effect of the rebate on the ratios is disclosed in the above table as "Ratio of Rebate from Morgan Stanley Affiliates to Average Net Assets."
(5) Effective April 7, 2014, the Adviser has agreed to limit the ratio of expenses to average net assets to the maximum ratio of 1.55% for Class L shares. Prior to April 7, 2014, the maximum ratio was 1.65% for Class L shares.
(6) Effective April 7, 2016, the Adviser has agreed to limit the ratio of expenses to average net assets to the maximum ratio of 1.65% for Class L shares. Prior to April 7, 2016, the maximum ratio was 1.55% for Class L shares.
(7) Amount is less than 0.005%.
The accompanying notes are an integral part of the financial statements.
15
Morgan Stanley Institutional Fund, Inc.
Annual Report — December 31, 2018
Financial Highlights
Growth Portfolio
| | | Class C | |
| | | Year Ended December 31, | | Period from
April 30, 2015(2) to | |
| | | 2018 | | 2017 | | 2016(1) | | December 31, 2015 | |
Net Asset Value, Beginning of Period | | $ | 37.76 | | | $ | 32.81 | | | $ | 38.40 | | | $ | 40.33 | | |
Income (Loss) from Investment Operations: | |
Net Investment Loss(3) | | | (0.51 | ) | | | (0.51 | ) | | | (0.38 | ) | | | (0.35 | ) | |
Net Realized and Unrealized Gain (Loss) | | | 3.24 | | | | 14.28 | | | | (0.74 | ) | | | 1.47 | | |
Total from Investment Operations | | | 2.73 | | | | 13.77 | | | | (1.12 | ) | | | 1.12 | | |
Distributions from and/or in Excess of: | |
Net Realized Gain | | | (3.32 | ) | | | (8.82 | ) | | | (4.47 | ) | | | (3.05 | ) | |
Net Asset Value, End of Period | | $ | 37.17 | | | $ | 37.76 | | | $ | 32.81 | | | $ | 38.40 | | |
Total Return(4) | | | 6.61 | % | | | 42.37 | % | | | (2.93 | )% | | | 2.71 | %(8) | |
Ratios and Supplemental Data: | |
Net Assets, End of Period (Thousands) | | $ | 92,431 | | | $ | 37,524 | | | $ | 16,613 | | | $ | 13,544 | | |
Ratio of Expenses to Average Net Assets(10) | | | 1.57 | %(5) | | | 1.63 | %(5) | | | 1.70 | %(5)(6) | | | 1.62 | %(5)(9) | |
Ratio of Expenses to Average Net Assets Excluding Non Operating Expenses | | | N/A | | | | 1.63 | %(5) | | | N/A | | | | N/A | | |
Ratio of Net Investment Loss to Average Net Assets(10) | | | (1.17 | )%(5) | | | (1.26 | )%(5) | | | (1.04 | )%(5) | | | (1.29 | )%(5)(9) | |
Ratio of Rebate from Morgan Stanley Affiliates to Average Net Assets | | | 0.01 | % | | | 0.01 | % | | | 0.00 | %(7) | | | 0.00 | %(7)(9) | |
Portfolio Turnover Rate | | | 41 | % | | | 55 | % | | | 39 | % | | | 34 | % | |
(10) Supplemental Information on the Ratios to Average Net Assets: | |
Ratios Before Expense Limitation: | |
Expenses to Average Net Assets | | | N/A | | | | N/A | | | | 1.70 | % | | | N/A | | |
Net Investment Loss to Average Net Assets | | | N/A | | | | N/A | | | | (1.04 | )% | | | N/A | | |
(1) Reflects prior period Custodian out-of-pocket expenses that were reimbursed in September 2016. The amount of the reimbursement was immaterial on a per share basis and did not impact the total return of Class C shares. The Ratio of Expenses to Average Net Assets would have been less than 0.005% higher and the Ratio of Net Investment Loss to Average Net Assets would have been less than 0.005% lower had the Custodian not reimbursed the Fund.
(2) Commencement of Offering.
(3) Per share amount is based on average shares outstanding.
(4) Calculated based on the net asset value which does not reflect sales charges, if applicable, as of the last business day of the period.
(5) The Ratios of Expenses and Net Investment Loss reflect the rebate of certain Fund expenses in connection with the investments in Morgan Stanley affiliates during the period. The effect of the rebate on the ratios is disclosed in the above table as "Ratio of Rebate from Morgan Stanley Affiliates to Average Net Assets."
(6) Effective April 7, 2016, the Adviser has agreed to limit the ratio of expenses to average net assets to the maximum ratio of 1.90% for Class C shares. Prior to April 7, 2016, the maximum ratio was 1.80% for Class C shares.
(7) Amount is less than 0.005%.
(8) Not annualized.
(9) Annualized.
The accompanying notes are an integral part of the financial statements.
16
Morgan Stanley Institutional Fund, Inc.
Annual Report — December 31, 2018
Financial Highlights
Growth Portfolio
| | | Class IS | |
| | | Year Ended December 31, | |
Selected Per Share Data and Ratios | | 2018 | | 2017 | | 2016(1) | | 2015 | | 2014 | |
Net Asset Value, Beginning of Period | | $ | 41.89 | | | $ | 35.32 | | | $ | 40.54 | | | $ | 38.92 | | | $ | 38.40 | | |
Income (Loss) from Investment Operations: | |
Net Investment Income (Loss)(2) | | | (0.04 | ) | | | (0.07 | ) | | | 0.05 | | | | (0.04 | ) | | | (0.05 | ) | |
Net Realized and Unrealized Gain (Loss) | | | 3.51 | | | | 15.46 | | | | (0.80 | ) | | | 4.71 | | | | 2.50 | | |
Total from Investment Operations | | | 3.47 | | | | 15.39 | | | | (0.75 | ) | | | 4.67 | | | | 2.45 | | |
Distributions from and/or in Excess of: | |
Net Investment Income | | | — | | | | — | | | | — | | | | — | | | | (0.01 | ) | |
Net Realized Gain | | | (3.32 | ) | | | (8.82 | ) | | | (4.47 | ) | | | (3.05 | ) | | | (1.92 | ) | |
Total Distributions | | | (3.32 | ) | | | (8.82 | ) | | | (4.47 | ) | | | (3.05 | ) | | | (1.93 | ) | |
Net Asset Value, End of Period | | $ | 42.04 | | | $ | 41.89 | | | $ | 35.32 | | | $ | 40.54 | | | $ | 38.92 | | |
Total Return(3) | | | 7.74 | % | | | 43.98 | % | | | (1.83 | )% | | | 11.97 | % | | | 6.60 | % | |
Ratios and Supplemental Data: | |
Net Assets, End of Period (Thousands) | | $ | 1,202,659 | | | $ | 1,131,543 | | | $ | 875,021 | | | $ | 1,019,889 | | | $ | 964,465 | | |
Ratio of Expenses to Average Net Assets(8) | | | 0.50 | %(4) | | | 0.53 | %(4) | | | 0.54 | %(4)(6) | | | 0.54 | %(4) | | | 0.54 | %(4)(5) | |
Ratio of Expenses to Average Net Assets Excluding Non Operating Expenses | | | N/A | | | | 0.53 | %(4) | | | N/A | | | | N/A | | | | N/A | | |
Ratio of Net Investment Income (Loss) to Average Net Assets(8) | | | (0.09 | )%(4) | | | (0.16 | )%(4) | | | 0.12 | %(4) | | | (0.10 | )%(4) | | | (0.12 | )%(4) | |
Ratio of Rebate from Morgan Stanley Affiliates to Average Net Assets | | | 0.01 | % | | | 0.01 | % | | | 0.00 | %(7) | | | 0.00 | %(7) | | | 0.01 | % | |
Portfolio Turnover Rate | | | 41 | % | | | 55 | % | | | 39 | % | | | 34 | % | | | 44 | % | |
(8) Supplemental Information on the Ratios to Average Net Assets: | |
Ratios Before Expense Limitation: | |
Expenses to Average Net Assets | | | N/A | | | | N/A | | | | 0.54 | % | | | N/A | | | | 0.55 | % | |
Net Investment Income (Loss) to Average Net Assets | | | N/A | | | | N/A | | | | 0.12 | % | | | N/A | | | | (0.13 | )% | |
(1) Reflects prior period Custodian out-of-pocket expenses that were reimbursed in September 2016. The amount of the reimbursement was immaterial on a per share basis and did not impact the total return of Class IS shares. The Ratio of Expenses to Average Net Assets would have been less than 0.005% higher and the Ratio of Net Investment Income to Average Net Assets would have been less than 0.005% lower had the Custodian not reimbursed the Fund.
(2) Per share amount is based on average shares outstanding.
(3) Calculated based on the net asset value as of the last business day of the period.
(4) The Ratios of Expenses and Net Investment Income (Loss) reflect the rebate of certain Fund expenses in connection with the investments in Morgan Stanley affiliates during the period. The effect of the rebate on the ratios is disclosed in the above table as "Ratio of Rebate from Morgan Stanley Affiliates to Average Net Assets."
(5) Effective April 7, 2014, the Adviser has agreed to limit the ratio of expenses to average net assets to the maximum ratio of 0.67% for Class IS shares. Prior to April 7, 2014, the maximum ratio was 0.73% for Class IS shares.
(6) Effective April 7, 2016, the Adviser has agreed to limit the ratio of expenses to average net assets to the maximum ratio of 0.73% for Class IS shares. Prior to April 7, 2016, the maximum ratio was 0.67% for Class IS shares.
(7) Amount is less than 0.005%.
The accompanying notes are an integral part of the financial statements.
17
Morgan Stanley Institutional Fund, Inc.
Annual Report — December 31, 2018
Financial Highlights
Growth Portfolio
| | | Class IR | |
Selected Per Share Data and Ratios | | Period from
June 15, 2018(1) to
December 31, 2018 | |
Net Asset Value, Beginning of Period | | $ | 52.16 | | |
Loss from Investment Operations: | |
Net Investment Loss(2) | | | (0.04 | ) | |
Net Realized and Unrealized Loss | | | (6.76 | ) | |
Total from Investment Operations | | | (6.80 | ) | |
Distributions from and/or in Excess of: | |
Net Realized Gain | | | (3.32 | ) | |
Net Asset Value, End of Period | | $ | 42.04 | | |
Total Return(3) | | | (13.48 | )%(5) | |
Ratios and Supplemental Data: | |
Net Assets, End of Period (Thousands) | | $ | 149,578 | | |
Ratios of Expenses to Average Net Assets | | | 0.49 | %(4)(6) | |
Ratio of Net Investment Loss to Average Net Assets | | | (0.14 | )%(4)(6) | |
Ratio of Rebate from Morgan Stanley Affiliates to Average Net Assets | | | 0.01 | %(6) | |
Portfolio Turnover Rate | | | 41 | % | |
(1) Commencement of Offering.
(2) Per share amount is based on average shares outstanding.
(3) Calculated based on the net asset value as of the last business day of the period.
(4) The Ratios of Expenses and Net Investment Loss reflect the rebate of certain Fund expenses in connection with the investments in Morgan Stanley affiliates during the period. The effect of the rebate on the ratios is disclosed in the above table as "Ratio of Rebate from Morgan Stanley Affiliates to Average Net Assets."
(5) Not annualized.
(6) Annualized.
The accompanying notes are an integral part of the financial statements.
18
Morgan Stanley Institutional Fund, Inc.
Annual Report — December 31, 2018
Notes to Financial Statements
Morgan Stanley Institutional Fund, Inc. (the "Company") is registered under the Investment Company Act of 1940, as amended (the "Act"), as an open-end management investment company. The Company is comprised of thirty separate, active, diversified and non-diversified funds (individually referred to as a "Fund", collectively as the "Funds"). The Company applies investment company accounting and reporting guidance.
The accompanying financial statements relate to the Growth Portfolio. The Fund seeks long-term capital appreciation by investing primarily in growth-oriented equity securities of large capitalization companies.
The Fund offers six classes of shares — Class I, Class A, Class L, Class C, Class IS and Class IR. On April 30, 2015, the Fund suspended offering of Class L shares. Existing Class L shareholders may invest through reinvestment of dividends and distributions. On June 15, 2018, the Fund commenced offering Class IR shares.
A. Significant Accounting Policies: The following significant accounting policies are in conformity with U.S. generally accepted accounting principles ("GAAP"). Such policies are consistently followed by the Company in the preparation of its financial statements. GAAP may require management to make estimates and assumptions that affect the reported amounts and disclosures in the financial statements. Actual results may differ from those estimates.
In August 2018, the Financial Accounting Standards Board ("FASB") issued Accounting Standards Update ("ASU") 2018-13, Fair Value Measurement (Topic 820) — Disclosures Framework — Changes to Disclosure Requirements of Fair Value Measurement ("ASU 2018-13") which introduces new fair value disclosure requirements as well as eliminates and modifies certain existing fair value disclosure requirements. ASU 2018-13 would be effective for fiscal years beginning after December 15, 2019 and for interim periods within those fiscal years; however, management has elected to early adopt ASU 2018-13 effective with the current reporting period as permitted by the standard. The impact of the Fund's adoption was limited to changes in the Fund's financial statement disclosures regarding fair value, primarily those disclosures related to transfers between levels of the fair value hierarchy and disclosure of the range and weighted average used to develop significant unobservable inputs for Level 3 fair value measurements, when applicable.
1. Security Valuation: (1) An equity portfolio security listed or traded on an exchange is valued at its latest reported sales price (or at the exchange official closing price if such exchange reports an official closing price), and if there were no sales on a given day and if there is no official exchange closing price for that day, the security is valued at the mean between the last reported bid and asked prices if such bid and asked prices are available on the relevant exchanges. Listed equity securities not traded on the valuation date with no reported bid and asked prices available on the exchange are valued at the mean between the current bid and asked prices obtained from one or more reputable brokers or dealers. In cases where a security is traded on more than one exchange, the security is valued on the exchange designated as the primary market; (2) all other equity portfolio securities for which over-the-counter ("OTC") market quotations are readily available are valued at the latest reported sales price (or at the market official closing price if such market reports an official closing price), and if there was no trading in the security on a given day and if there is no official closing price from relevant markets for that day, the security is valued at the mean between the last reported bid and asked prices if such bid and asked prices are available on the relevant markets. An unlisted equity security that does not trade on the valuation date and for which bid and asked prices from the relevant markets are unavailable is valued at the mean between the current bid and asked prices obtained from one or more reputable brokers or dealers; (3) certain portfolio securities may be valued by an outside pricing service/vendor approved by the Company's Board of Directors (the "Directors"). The pricing service/vendor may employ a pricing model that takes into account, among other things, bids, yield spreads and/or other market data and specific security characteristics. Alternatively, if a valuation is not available from an outside pricing service/vendor, and the security trades on an exchange, the security may be valued at its latest reported sale price (or at the exchange official closing price if such exchange reports an official closing price), prior to the time when assets are valued. If there are no sales on a given day and if there is no official exchange closing price for that day, the security is valued at the mean between the last reported bid and asked prices if such bid and asked prices are available in the relevant exchanges; (4) listed options are valued at the last reported sales price on the
19
Morgan Stanley Institutional Fund, Inc.
Annual Report — December 31, 2018
Notes to Financial Statements (cont'd)
exchange on which they are listed (or at the exchange official closing price if such exchange reports an official closing price). If an official closing price or last reported sales price is unavailable, the listed option should be fair valued at the mean between its latest bid and ask prices. Unlisted options are valued at the mean between their latest bid and ask prices from a broker/dealer or valued by a pricing service/vendor; (5) when market quotations are not readily available, including circumstances under which Morgan Stanley Investment Management Inc. (the "Adviser") determines that the closing price, last sale price or the mean between the last reported bid and asked prices are not reflective of a security's market value, portfolio securities are valued at their fair value as determined in good faith under procedures established by and under the general supervision of the Directors. Occasionally, developments affecting the closing prices of securities and other assets may occur between the times at which valuations of such securities are determined (that is, close of the foreign market on which the securities trade) and the close of business of the New York Stock Exchange ("NYSE"). If developments occur during such periods that are expected to materially affect the value of such securities, such valuations may be adjusted to reflect the estimated fair value of such securities as of the close of the NYSE, as determined in good faith by the Directors or by the Adviser using a pricing service and/or procedures approved by the Directors; (6) quotations of foreign portfolio securities, other assets and liabilities and forward contracts stated in foreign currency are translated into U.S. dollar equivalents at the prevailing market rates prior to the close of the NYSE; and (7) investments in mutual funds, including the Morgan Stanley Institutional Liquidity Funds, are valued at the net asset value ("NAV") as of the close of each business day.
The Directors have responsibility for determining in good faith the fair value of the investments, and the Directors may appoint others, such as the Company's Adviser or a valuation committee, to assist the Directors in determining fair value and to make the actual calculations pursuant to the fair valuation methodologies previously approved by the Directors. Under procedures approved by the Directors, the Company's Adviser has formed a Valuation Committee whose members are approved by the Directors. The Valuation Committee provides administration and oversight of the Company's valuation policies and procedures, which are reviewed at
least annually by the Directors. These procedures allow the Company to utilize independent pricing services, quotations from securities and financial instrument dealers and other market sources to determine fair value.
2. Fair Value Measurement: FASB Accounting Standards CodificationTM ("ASC") 820, "Fair Value Measurement" ("ASC 820"), defines fair value as the value that the Fund would receive to sell an investment or pay to transfer a liability in a timely transaction with an independent buyer in the principal market, or in the absence of a principal market, the most advantageous market for the investment or liability. ASC 820 establishes a three-tier hierarchy to distinguish between (1) inputs that reflect the assumptions market participants would use in valuing an asset or liability developed based on market data obtained from sources independent of the reporting entity (observable inputs) and (2) inputs that reflect the reporting entity's own assumptions about the assumptions market participants would use in valuing an asset or liability developed based on the best information available in the circumstances (unobservable inputs) and to establish classification of fair value measurements for disclosure purposes. Various inputs are used in determining the value of the Fund's investments. The inputs are summarized in the three broad levels listed below:
• Level 1 – unadjusted quoted prices in active markets for identical investments
• Level 2 – other significant observable inputs (including quoted prices for similar investments, interest rates, prepayment speeds, credit risk, etc.)
• Level 3 – significant unobservable inputs including the Fund's own assumptions in determining the fair value of investments. Factors considered in making this determination may include, but are not limited to, information obtained by contacting the issuer, analysts, or the appropriate stock exchange (for exchange-traded securities), analysis of the issuer's financial statements or other available documents and, if necessary, available information concerning other securities in similar circumstances
20
Morgan Stanley Institutional Fund, Inc.
Annual Report — December 31, 2018
Notes to Financial Statements (cont'd)
The inputs or methodology used for valuing securities are not necessarily an indication of the risk associated with investing in those securities and the determination of the significance of a particular input to the fair value measurement in its entirety requires judgment and considers factors specific to each security.
The following is a summary of the inputs used to value the Fund's investments as of December 31, 2018:
Investment Type | | Level 1
Unadjusted
quoted
prices
(000) | | Level 2
Other
significant
observable
inputs
(000) | | Level 3
Significant
unobservable
inputs
(000) | | Total
(000) | |
Assets: | |
Common Stocks | |
Biotechnology | | $ | 63,393 | | | $ | — | | | $ | — | | | $ | 63,393 | | |
Entertainment | | | 253,064 | | | | — | | | | — | | | | 253,064 | | |
Health Care
Equipment &
Supplies | | | 506,763 | | | | — | | | | — | | | | 506,763 | | |
Health Care
Providers &
Services | | | 73,754 | | | | — | | | | — | | | | 73,754 | | |
Health Care
Technology | | | 499,804 | | | | — | | | | 25,069 | | | | 524,873 | | |
Hotels, Restaurants &
Leisure | | | 183,912 | | | | — | | | | — | | | | 183,912 | | |
Information
Technology
Services | | | 339,106 | | | | — | | | | — | | | | 339,106 | | |
Interactive Media &
Services | | | 742,797 | | | | — | | | | — | | | | 742,797 | | |
Internet & Direct
Marketing Retail | | | 761,653 | | | | — | | | | — | | | | 761,653 | | |
Life Sciences
Tools & Services | | | 307,948 | | | | — | | | | — | | | | 307,948 | | |
Pharmaceuticals | | | 3,844 | | | | — | | | | — | | | | 3,844 | | |
Road & Rail | | | 182,913 | | | | — | | | | — | | | | 182,913 | | |
Semiconductors &
Semiconductor
Equipment | | | 25,793 | | | | — | | | | — | | | | 25,793 | | |
Software | | | 1,011,410 | | | | — | | | | — | | | | 1,011,410 | | |
Textiles, Apparel &
Luxury Goods | | | — | | | | 190,017 | | | | — | | | | 190,017 | | |
Total Common Stocks | | | 4,956,154 | | | | 190,017 | | | | 25,069 | | | | 5,171,240 | | |
Preferred Stocks | |
Electronic Equipment,
Instruments &
Components | | | — | | | | — | | | | 22,052 | | | | 22,052 | | |
Internet & Direct
Marketing Retail | | | — | | | | — | | | | 112,449 | | | | 112,449 | | |
Total Preferred Stocks | | | — | | | | — | | | | 134,501 | | | | 134,501 | | |
Investment Type | | Level 1
Unadjusted
quoted
prices
(000) | | Level 2
Other
significant
observable
inputs
(000) | | Level 3
Significant
unobservable
inputs
(000) | | Total
(000) | |
Call Options
Purchased | | $ | — | | | $ | 3,217 | | | $ | — | | | $ | 3,217 | | |
Short-Term
Investments | |
Investment Company | | | 61,442 | | | | — | | | | — | | | | 61,442 | | |
Repurchase
Agreements | | | — | | | | 1,495 | | | | — | | | | 1,495 | | |
Total Short-Term
Investments | | | 61,442 | | | | 1,495 | | | | — | | | | 62,937 | | |
Total Assets | | $ | 5,017,596 | | | $ | 194,729 | | | $ | 159,570 | | | $ | 5,371,895 | | |
Transfers between investment levels may occur as the markets fluctuate and/or the availability of data used in an investment's valuation changes.
Following is a reconciliation of investments in which significant unobservable inputs (Level 3) were used in determining fair value:
| | | Common
Stock
(000) | | Preferred
Stocks
(000) | |
Beginning Balance | | $ | — | | | $ | 136,474 | | |
Purchases | | | 25,029 | | | | — | | |
Sales | | | — | | | | (25,467 | ) | |
Amortization of discount | | | — | | | | — | | |
Transfers in | | | — | | | | — | | |
Transfers out | | | — | | | | — | | |
Corporate actions | | | — | | | | (7,182 | ) | |
Change in unrealized appreciation (depreciation) | | | 40 | | | | 20,208 | | |
Realized gains (losses) | | | — | | | | 10,468 | | |
Ending Balance | | $ | 25,069 | | | $ | 134,501 | | |
Net change in unrealized appreciation
(depreciation) from investments still
held as of December 31, 2018 | | $ | 40 | | | $ | 19,713 | | |
21
Morgan Stanley Institutional Fund, Inc.
Annual Report — December 31, 2018
Notes to Financial Statements (cont'd)
The following table presents additional information about valuation techniques and inputs used for investments that are measured at fair value and categorized within Level 3 as of December 31, 2018. Various valuation techniques were used in the valuation of certain investments and weighted based on the level of significance. The Fund calculated the weighted averages of the unobservable inputs relative to each investment's fair value as of December 31, 2018.
| | | Fair Value at
December 31, 2018
(000) | | Valuation
Technique | | Unobservable
Input | | Amount or Range/
Weighted Average | | Impact to
Valuation from an
Increase in Input†† | |
Common Stock | | $ | 25,069 | | | Market Transaction
Method | | Precedent Transaction | | $ | 378.16 | | | Increase | |
| | | | | Discounted Cash Flow | | Weighted Average
Cost of Capital | | | 16.50 | % | | Decrease | |
| | | | | | | Perpetual Growth Rate | | | 3.50 | % | | Increase | |
| | | | | Market Comparable
Companies | | Enterprise Value/
Revenue | | | 1.3 | x | | Increase | |
| | | | | | | Discount for Lack of
Marketability | | | 15.00 | % | | Decrease | |
Preferred Stocks | | $ | 134,501 | | | Market Transaction
Method | | Precedent Transaction | | $ | 27.00–$48.77/$42.22 | | | Increase | |
| | | | | Discounted Cash Flow | | Weighted Average
Cost of Capital | | | 14.0%–27.0%/16.80% | | | Decrease | |
| | | | | | | Perpetual Growth Rate | | | 3.0%–4.0%/3.50% | | | Increase | |
| | | | | Market Comparable
Companies | | Enterprise
Value/Revenue | | | 1.1x–10.5x/6.21x | | | Increase | |
| | | | | | | Discount for Lack of
Marketability | | | 9.0%–20.0%/13.53% | | | Decrease | |
†† Represents the expected directional change in the fair value of the Level 3 investments that would result from an increase in the corresponding input. A decrease to the unobservable input would have the opposite effect. Significant changes in these inputs could result in significantly higher or lower fair value measurements.
3. Repurchase Agreements: The Fund may enter into repurchase agreements under which the Fund lends cash and takes possession of securities with an agreement that the counterparty will repurchase such securities. In connection with transactions in repurchase agreements, a bank as custodian for the Fund takes possession of the underlying securities which are held as collateral, with a market value at least equal to the amount of the repurchase transaction, including principal and accrued interest. To the extent that any repurchase transaction exceeds one business day, the value of the collateral is marked-to-market on a daily basis to determine that the value of the collateral does not decrease below the repurchase price plus accrued interest as earned. If such a decrease occurs, additional collateral will be requested and, when received, will be added to the account to maintain full collateralization. In the event of default on the obligation to repurchase, the Fund has the right to liquidate the collateral and apply the proceeds in satisfaction of the obligation. In the event of default or bankruptcy by the counterparty to the agreement, realization of the collateral proceeds may be subject to cost and delays. The Fund, along with other affiliated investment companies, may utilize a joint trading account for the purpose of entering into repurchase agreements.
4. Foreign Currency Translation and Foreign Investments: The books and records of the Fund are maintained in U.S. dollars. Foreign currency amounts are translated into U.S. dollars as follows:
– investments, other assets and liabilities at the prevailing rate of exchange on the valuation date;
– investment transactions and investment income at the prevailing rates of exchange on the dates of such transactions.
Although the net assets of the Fund are presented at the foreign exchange rates and market values at the close of the period, the Fund does not isolate that portion of the results of operations arising as a result of changes in the foreign exchange rates from the fluctuations arising from changes in the market prices of securities held at period end. Similarly, the Fund does not isolate the effect of changes in foreign exchange rates from the fluctuations arising from changes in the market prices of securities sold during the period. Accordingly, realized and unrealized foreign currency gains (losses) on investments in securities are included in the reported net realized and unrealized gains (losses) on investment transactions and balances. However, pursuant to
22
Morgan Stanley Institutional Fund, Inc.
Annual Report — December 31, 2018
Notes to Financial Statements (cont'd)
U.S. federal income tax regulations, gains and losses from certain foreign currency transactions and the foreign currency portion of gains and losses realized on sales and maturities of foreign denominated debt securities are treated as ordinary income for U.S. federal income tax purposes.
Net realized gains (losses) on foreign currency transactions represent net foreign exchange gains (losses) from foreign currency forward exchange contracts, disposition of foreign currencies, currency gains (losses) realized between the trade and settlement dates on securities transactions, and the difference between the amount of investment income and foreign withholding taxes recorded on the Fund's books and the U.S. dollar equivalent amounts actually received or paid. Net unrealized currency gains (losses) from valuing foreign currency denominated assets and liabilities at period end exchange rates are reflected as a component of unrealized appreciation (depreciation) in the Statement of Assets and Liabilities. The change in unrealized currency gains (losses) on foreign currency translations for the period is reflected in the Statement of Operations.
Foreign security and currency transactions may involve certain considerations and risks not typically associated with those of U.S. dollar denominated transactions as a result of, among other factors, fluctuations of exchange rates in relation to the U.S. dollar, the possibility of lower levels of governmental supervision and regulation of foreign securities markets and the possibility of political or economic instability.
Governmental approval for foreign investments may be required in advance of making an investment under certain circumstances in some countries, and the extent of foreign investments in domestic companies may be subject to limitation in other countries. Foreign ownership limitations also may be imposed by the charters of individual companies to prevent, among other concerns, violations of foreign investment limitations. As a result, an additional class of shares (identified as "Foreign" in the Portfolio of Investments) may be created and offered for investment. The "local" and "foreign shares" market values may differ. In the absence of trading of the foreign shares in such markets, the Fund values the foreign shares at the closing exchange price of the local shares.
5. Derivatives: The Fund may, but is not required to, use derivative instruments for a variety of purposes, including hedging, risk management, portfolio management or to earn income. Derivatives are financial instruments whose value is based, in part, on the value of an underlying asset, interest rate, index or financial instrument. Prevailing interest rates and volatility levels, among other things, also affect the value of derivative instruments. A derivative instrument often has risks similar to its underlying asset and may have additional risks, including imperfect correlation between the value of the derivative and the underlying asset, risks of default by the counterparty to certain transactions, magnification of losses incurred due to changes in the market value of the securities, instruments, indices or interest rates to which the derivative instrument relates, risks that the transactions may not be liquid and risks arising from margin requirements. The use of derivatives involves risks that are different from, and possibly greater than, the risks associated with other portfolio investments. Derivatives may involve the use of highly specialized instruments that require investment techniques and risk analyses different from those associated with other portfolio investments. All of the Fund's holdings, including derivative instruments, are marked-to-market each day with the change in value reflected in unrealized appreciation (depreciation). Upon disposition, a realized gain or loss is recognized.
Certain derivative transactions may give rise to a form of leverage. Leverage magnifies the potential for gain and the risk of loss. Leverage associated with derivative transactions may cause the Fund to liquidate portfolio positions when it may not be advantageous to do so to satisfy its obligations or to meet earmarking or segregation requirements, pursuant to applicable Securities and Exchange Commission ("SEC") rules and regulations, or may cause the Fund to be more volatile than if the Fund had not been leveraged. Although the Adviser seeks to use derivatives to further the Fund's investment objectives, there is no assurance that the use of derivatives will achieve this result.
Following is a description of the derivative instruments and techniques that the Fund used during the period and their associated risks:
Options: With respect to options, the Fund is subject to equity risk, interest rate risk and foreign currency
23
Morgan Stanley Institutional Fund, Inc.
Annual Report — December 31, 2018
Notes to Financial Statements (cont'd)
exchange risk in the normal course of pursuing its investment objectives. If the Fund buys an option, it buys a legal contract giving it the right to buy or sell a specific amount of the underlying instrument or foreign currency, or futures contract on the underlying instrument or foreign currency, at an agreed-upon price during a period of time or on a specified date typically in exchange for a premium paid by the Fund. The Fund may purchase and/or sell put and call options. Purchasing call options tends to increase the Fund's exposure to the underlying (or similar) instrument. Purchasing put options tends to decrease the Fund's exposure to the underlying (or similar) instrument. When entering into purchased option contracts, the Fund bears the risk of interest or exchange rates or securities prices moving unexpectedly, in which case, the Fund may not achieve the anticipated benefits of the purchased option contracts; however the risk of loss is limited to the premium paid. Purchased options are reported as part of "Total Investments in Securities" in the Statement of Assets and Liabilities. Premiums paid for purchasing options which expired are treated as realized losses. If the Fund sells an option, it sells to another party the right to buy from or sell to the Fund a specific amount of the underlying instrument or foreign currency, or futures contract on the underlying instrument or foreign currency, at an agreed-upon price during a period of time or on a specified date typically in exchange for a premium received by the Fund. When options are purchased OTC, the Fund bears the risk that the counterparty that wrote the option will be unable or unwilling to perform its obligations under the option contract. Options may also be illiquid and the Fund may have difficulty closing out its position. A decision as to whether, when and how to use options involves the exercise of skill and judgment and even a well-conceived option transaction may be unsuccessful because of market behavior or unexpected events. The prices of options can be highly volatile and the use of options can lower total returns.
FASB ASC 815, "Derivatives and Hedging" ("ASC 815"), is intended to improve financial reporting about derivative instruments by requiring enhanced disclosures to enable investors to better understand how and why the Fund uses derivative instruments, how these derivative instruments are accounted for and their effects on the Fund's financial position and results of operations.
The following table sets forth the fair value of the Fund's derivative contracts by primary risk exposure as of December 31, 2018:
| | | Asset Derivatives
Statement of Assets and
Liabilities Location | | Primary Risk
Exposure | | Value
(000) | |
Purchased Options
| | Investments, at Value
(Purchased Options) | | Currency Risk | | $ | 3,217 | (a) | |
(a) Amounts are included in Investments in Securities in the Statement of Assets and Liabilities.
The following tables sets forth by primary risk exposure the Fund's realized gains (losses) and change in unrealized appreciation (depreciation) by type of derivative contract for the year ended December 31, 2018 in accordance with ASC 815:
Realized Gain (Loss) | |
Primary Risk Exposure | | Derivative Type | | Value
(000) | |
Currency Risk Investments
| | (Purchased Options) | | $ | (8,015 | )(b) | |
(b) Amounts are included in Investments Sold in the Statement of Operations.
Change in Unrealized Appreciation (Depreciation) | |
Primary Risk Exposure | | Derivative Type | | Value
(000) | |
Currency Risk Investments
| | (Purchased Options) | | $ | (5,982 | )(c) | |
(c) Amounts are included in Investments in the Statement of Operations.
At December 31, 2018, the Fund's derivative assets and liabilities are as follows:
Gross Amounts of Assets and Liabilities
Presented in the Statement of Assets and Liabilities | |
Derivatives | | Assets(d)
(000) | | Liabilities(d)
(000) | |
Purchased Options | | $ | 3,217 | (a) | | $ | — | | |
(a) Amounts are included in Investments in Securities in the Statement of Assets and Liabilities.
(d) Absent an event of default or early termination, OTC derivative assets and liabilities are presented gross and not offset in the Statement of Assets and Liabilities.
The Fund typically enters into International Swaps and Derivatives Association, Inc. Master Agreements ("ISDA Master Agreements") or similar master agreements (collectively, "Master Agreements") with its contract counterparties for certain OTC derivatives in order to, among other things, reduce its credit risk to counterparties. ISDA Master Agreements include provisions for general obligations, representations, collateral and events of default or termination. Under an ISDA Master Agreement, the Fund typically may offset with the counterparty certain OTC derivative financial instruments' payables and/or receivables with collateral held and/or posted and create one single net
24
Morgan Stanley Institutional Fund, Inc.
Annual Report — December 31, 2018
Notes to Financial Statements (cont'd)
payment (close-out netting) in the event of default, termination and/or potential deterioration in the credit quality of the counterparty. Various Master Agreements govern the terms of certain transactions with counterparties, including transactions such as swap, forward, repurchase and reverse repurchase agreements. These Master Agreements typically attempt to reduce the counterparty risk associated with such transactions by specifying credit protection mechanisms and providing standardization that improves legal certainty. Cross-termination provisions under Master Agreements typically provide that a default in connection with one transaction between the Fund and a counterparty gives the non-defaulting party the right to terminate any other transactions in place with the defaulting party to create one single net payment due to/due from the defaulting party and may be a feature in certain Master Agreements. In the event the Fund exercises its right to terminate a Master Agreement after a counterparty experiences a termination event as defined in the Master Agreement, the return of collateral with market value in excess of the Fund's net liability may be delayed or denied.
The following table presents derivative financial instruments that are subject to enforceable netting arrangements as of December 31, 2018:
Gross Amounts Not Offset in the Statement of Assets and Liabilities | |
Counterparty | | Gross Asset
Derivatives
Presented in the
Statement of
Assets and
Liabilities
(000) | | Financial
Instrument
(000) | | Collateral
Received(e)
(000) | | Net Amount
(not less
than $0)
(000) | |
Royal Bank of Scotland | | $ | 3,217 | (a) | | $ | — | | | $ | (3,217 | ) | | $ | 0 | | |
(a) Amounts are included in Investments in Securities in the Statement of Assets and Liabilities.
(e) In some instances, the actual collateral received may be more than the amount shown here due to overcollateralization.
For the year ended December 31, 2018, the approximate average monthly amount outstanding for each derivative type is as follows:
Purchased Options: | |
Average monthly notional amount | | | 3,104,681,000 | | |
6. Securities Lending: The Fund lends securities to qualified financial institutions, such as broker-dealers, to earn additional income. Any increase or decrease in the fair value of the securities loaned that might occur and any interest earned or dividends declared on those securities during the term of the loan would remain in the Fund. The
Fund would receive cash or securities as collateral in an amount equal to or exceeding 100% of the current fair value of the loaned securities. The collateral is marked-to-market daily by State Street Bank and Trust Company ("State Street"), the securities lending agent, to ensure that a minimum of 100% collateral coverage is maintained.
Based on pre-established guidelines, the securities lending agent invests any cash collateral that is received in an affiliated money market portfolio and repurchase agreements. Securities lending income is generated from the earnings on the invested collateral and borrowing fees, less any rebates owed to the borrowers and compensation to the lending agent, and is recorded as "Income from Securities Loaned — Net" in the Fund's Statement of Operations. Risks in securities lending transactions are that a borrower may not provide additional collateral when required or return the securities when due, and that the value of the short-term investments will be less than the amount of cash collateral plus any rebate that is required to be returned to the borrower.
The Fund has the right under the securities lending agreement to recover the securities from the borrower on demand.
The following table presents financial instruments that are subject to enforceable netting arrangements as of December 31, 2018:
Gross Amounts Not Offset in the Statement of Assets and Liabilities | |
Gross Asset
Amounts
Presented in
the Statement
of Assets and
Liabilities
(000) | | Financial
Instrument
(000) | | Collateral
Received
(000) | | Net Amount
(not less
than $0)
(000) | |
| $ | 15,983 | (f) | | $ | — | | | $ | (15,710 | )(g) | | $ | 273 | | |
(f) Represents market value of loaned securities at year end.
(g) The Fund received cash collateral of approximately $8,085,000, of which approximately $8,036,000 was subsequently invested in Repurchase Agreements and Morgan Stanley Institutional Liquidity Funds as reported in the Portfolio of Investments. As of December 31, 2018, there was uninvested cash of approximately $49,000, which is not reflected in the Portfolio of Investments. In addition, the Fund received non-cash collateral of approximately $7,625,000 in the form of U.S. Government obligations, which the Fund cannot sell or repledge, and accordingly are not reflected in the Portfolio of Investments.
FASB ASC 860, "Transfers & Servicing: Repurchase-to-Maturity Transactions, Repurchase Financings, and Disclosures", is intended to provide increased transparency about the types of collateral pledged in securities lending
25
Morgan Stanley Institutional Fund, Inc.
Annual Report — December 31, 2018
Notes to Financial Statements (cont'd)
transactions and other similar transactions that are accounted for as secured borrowing.
The following table displays a breakdown of transactions accounted for as secured borrowings, the gross obligations by class of collateral pledged and the remaining contractual maturity of those transactions as of December 31, 2018:
Remaining Contractual Maturity of the Agreements | |
| | | Overnight and
Continuous
(000) | | <30 days
(000) | | Between
30 &
90 days
(000) | | >90 days
(000) | | Total
(000) | |
Securities Lending
Transactions | |
Common Stocks | | $ | 8,085 | | | $ | — | | | $ | — | | | $ | — | | | $ | 8,085 | | |
Total Borrowings | | $ | 8,085 | | | $ | — | | | $ | — | | | $ | — | | | $ | 8,085 | | |
Gross amount of
recognized liabilities
for securities lending
transactions | | | | | | | | | | $ | 8,085 | | |
7. Restricted Securities: The Fund invests in unregistered or otherwise restricted securities. The term "restricted securities" refers to securities that are unregistered or are held by control persons of the issuer and securities that are subject to contractual restrictions on their resale. As a result, restricted securities may be more difficult to value and the Fund may have difficulty disposing of such assets either in a timely manner or for a reasonable price. In order to dispose of an unregistered security, the Fund, where it has contractual rights to do so, may have to cause such security to be registered. A considerable period may elapse between the time the decision is made to sell the security and the time the security is registered so that the Fund can sell it. Contractual restrictions on the resale of securities vary in length and scope and are generally the result of a negotiation between the issuer and the acquirer of the securities. The Fund would, in either case, bear market risks during that period. Restricted securities are identified in the Portfolio of Investments.
8. Indemnifications: The Company enters into contracts that contain a variety of indemnifications. The Company's maximum exposure under these arrangements is unknown. However, the Company has not had prior claims or losses pursuant to these contracts and expects the risk of loss to be remote.
9. Dividends and Distributions to Shareholders: Dividends and distributions to shareholders are recorded on the ex-dividend date. Dividends from net investment income, if any, are declared and paid annually. Net realized capital gains, if any, are distributed at least annually.
10. Security Transactions, Income and Expenses: Security transactions are accounted for on the trade date (date the order to buy or sell is executed). Realized gains and losses on the sale of investment securities are determined on the specific identified cost method. Dividend income and other distributions are recorded on the ex-dividend date (except for certain foreign dividends which may be recorded as soon as the Fund is informed of such dividends) net of applicable withholding taxes. Interest income is recognized on the accrual basis except where collection is in doubt. Discounts are accreted and premiums are amortized over the life of the respective securities. Most expenses of the Company can be directly attributed to a particular Fund. Expenses which cannot be directly attributed are apportioned among the Funds based upon relative net assets or other appropriate methods. Income, expenses (other than class specific expenses — distribution and shareholder services, transfer agency and sub transfer agency fees) and realized and unrealized gains or losses are allocated to each class of shares based upon their relative net assets.
B. Advisory Fees: The Adviser, a wholly-owned subsidiary of Morgan Stanley, provides the Fund with advisory services under the terms of an Investment Advisory Agreement, paid quarterly, at the annual rate based on the daily net assets as follows:
First $1
billion | | Next $1
billion | | Next $1
billion | | Over $3
billion | |
| | 0.50 | % | | | 0.45 | % | | | 0.40 | % | | | 0.35 | % | |
For the year ended December 31, 2018, the advisory fee rate (net of rebate) was equivalent to an annual effective rate of 0.40% of the Fund's average daily net assets.
The Adviser has agreed to reduce its advisory fee and/or reimburse the Fund so that total annual portfolio operating expenses, excluding certain investment related expenses, taxes, interest and other extraordinary expenses (including litigation), will not exceed 0.80% for Class I shares, 1.15% for Class A shares, 1.65% for Class L shares, 1.90% for Class C shares, 0.73% for Class IS shares and 0.73% for Class IR shares. the
26
Morgan Stanley Institutional Fund, Inc.
Annual Report — December 31, 2018
Notes to Financial Statements (cont'd)
fee waivers and/or expense reimbursements will continue for at least one year from the date of the Fund's prospectus or until such time as the Directors act to discontinue all or a portion of such waivers and/or reimbursements when they deem such action is appropriate. This arrangement had no effect for the year ended December 31, 2018.
C. Administration Fees: The Adviser also serves as Administrator to the Company and provides administrative services pursuant to an Administration Agreement for an annual fee, accrued daily and paid monthly, of 0.08% of the Fund's average daily net assets.
Under a Sub-Administration Agreement between the Administrator and State Street, State Street provides certain administrative services to the Company. For such services, the Administrator pays State Street a portion of the fee the Administrator receives from the Fund.
D. Distribution and Shareholder Services Fees: Morgan Stanley Distribution, Inc. ("MSDI" or the "Distributor"), a wholly-owned subsidiary of the Adviser and an indirect subsidiary of Morgan Stanley, serves as the Company's Distributor of Fund shares pursuant to a Distribution Agreement. The Company has adopted a Shareholder Services Plan with respect to Class A shares pursuant to Rule 12b-1 under the Act. Under the Shareholder Services Plan, the Fund pays the Distributor a shareholder services fee, accrued daily and paid monthly, at an annual rate of 0.25% of the Fund's average daily net assets attributable to Class A shares.
The Company has adopted a Distribution and Shareholder Services Plan with respect to Class L shares pursuant to Rule 12b-1 under the Act. Under the Distribution and Shareholder Services Plan, the Fund pays the Distributor a distribution fee, accrued daily and paid monthly, at an annual rate of 0.50% and a shareholder services fee, accrued daily and paid monthly, at an annual rate of 0.25% of the Fund's average daily net assets attributable to Class L shares.
The Company has adopted a Distribution and Shareholder Services Plan with respect to Class C shares pursuant to Rule 12b-1 under the Act. Under the Distribution and Shareholder Services Plan, the Fund pays the Distributor a distribution fee, accrued daily and paid monthly, at an annual rate of 0.75% and a shareholder services fee, accrued daily and paid monthly, at an annual rate of 0.25% of the Fund's average daily net assets attributable to Class C shares.
The distribution and shareholder services fees are used to support the expenses associated with servicing and maintaining accounts. The Distributor may compensate other parties for providing shareholder support services to investors who purchase Class A, Class L and Class C shares.
E. Dividend Disbursing and Transfer Agent: The Company's dividend disbursing and transfer agent is DST Asset Manager Solutions, Inc. ("DST"). Pursuant to a Transfer Agency Agreement, the Company pays DST a fee based on the number of classes, accounts and transactions relating to the Funds of the Company.
F. Custodian Fees: State Street (the "Custodian") also serves as Custodian for the Company in accordance with a Custodian Agreement. The Custodian holds cash, securities and other assets of the Company as required by the Act. Custody fees are payable monthly based on assets held in custody, investment purchases and sales activity and account maintenance fees, plus reimbursement for certain out-of-pocket expenses.
G. Security Transactions and Transactions with Affiliates: For the year ended December 31, 2018, purchases and sales of investment securities for the Fund, other than long-term U.S. Government securities and short-term investments were approximately $3,148,475,000 and $2,122,670,000, respectively. There were no purchases and sales of long-term U.S. Government securities for the year ended December 31, 2018.
The Fund invests in the Institutional Class of the Morgan Stanley Institutional Liquidity Funds — Treasury Securities Portfolio (the "Liquidity Funds"), an open-end management investment company managed by the Adviser, both directly and as a portion of the securities held as collateral on loaned securities. Advisory fees paid by the Fund are reduced by an amount equal to its pro-rata share of the advisory and administration fees paid by the Fund due to its investment in the Liquidity Funds. For the year ended December 31, 2018, advisory fees paid were reduced by approximately $360,000 relating to the Fund's investment in the Liquidity Funds.
27
Morgan Stanley Institutional Fund, Inc.
Annual Report — December 31, 2018
Notes to Financial Statements (cont'd)
A summary of the Fund's transactions in shares of affiliated investments during the year ended December 31, 2018 is as follows:
Affiliated
Investment
Company | | Value
December 31,
2017
(000) | | Purchases
at Cost
(000) | | Proceeds
from Sales
(000) | | Dividend
Income
(000) | |
Liquidity Funds | | $ | 120,418 | | | $ | 1,848,339 | | | $ | 1,907,315 | | | $ | 3,222 | | |
Affiliated
Investment
Company (cont'd) | | Realized
Gain
(Loss)
(000) | | Change in
Unrealized
Appreciation
(Depreciation)
(000) | | Value
December 31,
2018
(000) | |
Liquidity Funds | | $ | — | | | $ | — | | | $ | 61,442 | | |
The Fund is permitted to purchase and sell securities ("cross-trade") from and to other Morgan Stanley funds as well as other funds and client accounts for which the Adviser or an affiliate of the Adviser serves as investment adviser, pursuant to procedures approved by the Directors in compliance with Rule 17a-7 under the Act (the "Rule"). Each cross-trade is executed at the current market price in compliance with provisions of the Rule. For the year ended December 31, 2018, the Fund did not engage in any cross-trade transactions.
The Fund has an unfunded Deferred Compensation Plan (the "Compensation Plan"), which allows each independent Director to defer payment of all, or a portion, of the fees he or she receives for serving on the Board of Directors. Each eligible Director generally may elect to have the deferred amounts credited with a return equal to the total return on one or more of the Morgan Stanley funds that are offered as investment options under the Compensation Plan. Appreciation/depreciation and distributions received from these investments are recorded with an offsetting increase/decrease in the deferred compensation obligation and do not affect the NAV of the Fund.
H. Federal Income Taxes: It is the Fund's intention to continue to qualify as a regulated investment company and distribute all of its taxable and tax-exempt income. Accordingly, no provision for Federal income taxes is required in the financial statements.
The Fund may be subject to taxes imposed by countries in which it invests. Such taxes are generally based on income and/or capital gains earned or repatriated. Taxes are accrued based on net investment income, net realized gains and net unrealized appreciation as such income and/or gains are earned. Taxes may also be based on transactions in foreign currency and are accrued based on the value of investments denominated in such currency.
FASB ASC 740-10, "Income Taxes — Overall", sets forth a minimum threshold for financial statement recognition of the benefit of a tax position taken or expected to be taken in a tax return. Management has concluded there are no significant uncertain tax positions that would require recognition in the financial statements. If applicable, the Fund recognizes interest accrued related to unrecognized tax benefits in "Interest Expense" and penalties in "Other Expenses" in the Statement of Operations. The Fund files tax returns with the U.S. Internal Revenue Service, New York and various states. Each of the tax years in the four-year period ended December 31, 2018 remains subject to examination by taxing authorities.
The tax character of distributions paid may differ from the character of distributions for GAAP purposes due to short-term capital gains being treated as ordinary income for tax purposes. The tax character of distributions paid during fiscal years 2018 and 2017 was as follows:
2018
Distributions
Paid From: | | 2017
Distributions
Paid From: | |
Ordinary
Income
(000) | | Long-Term
Capital Gain
(000) | | Ordinary
Income
(000) | | Long-Term
Capital Gain
(000) | |
| $ | 21,258 | | | $ | 387,224 | | | $ | 95,691 | | | $ | 661,617 | | |
The amount and character of income and gains to be distributed are determined in accordance with income tax regulations which may differ from GAAP. These book/tax differences are either considered temporary or permanent in nature.
Temporary differences are primarily due to differing book and tax treatments in the timing of the recognition of gains (losses) on certain investment transactions and the timing of the deductibility of certain expenses.
Permanent differences, primarily due to equalization debits and a net operating loss, resulted in the following reclassifications among the components of net assets at December 31, 2018:
Total
Distributable
Earnings
(000) | | Paid-in-
Capital
(000) | |
| $ | (83,958 | ) | | $ | 83,958 | | |
At December 31, 2018, the Fund had no distributable earnings on a tax basis.
28
Morgan Stanley Institutional Fund, Inc.
Annual Report — December 31, 2018
Notes to Financial Statements (cont'd)
Qualified late year losses are capital losses and specified ordinary losses, including currency losses, incurred after October 31 but within the taxable year that, if elected, are deemed to arise on the first day of the Fund's next taxable year. For the year ended December 31, 2018, the Fund intends to defer to January 1, 2019 for U.S. federal income tax purposes the following losses:
Qualified
Late Year
Ordinary
Losses
(000) | | Post-October
Capital
Losses
(000) | |
| $ | 4,144 | | | $ | — | | |
I. Credit Facility: The Company and other Morgan Stanley funds participated in a $150,000,000 committed, unsecured revolving line of credit facility (the "Facility") with State Street. This Facility is to be used for temporary emergency purposes or funding of shareholder redemption requests. The interest rate on borrowings is based on the federal funds rate or 1 month LIBOR rate plus a spread. The Facility also has a commitment fee of 0.25% per annum based on the unused portion of the Facility. During the year ended December 31, 2018, the Fund did not have any borrowings under the Facility.
J. Other: At December 31, 2018, the Fund had record owners of 10% or greater. Investment activities of these shareholders could have a material impact on the Fund. The aggregate percentage of such owners was 47.0%.
29
Morgan Stanley Institutional Fund, Inc.
Annual Report — December 31, 2018
Report of Independent Registered Public Accounting Firm
To the Shareholders and Board of Directors of
Morgan Stanley Institutional Fund, Inc. —
Growth Portfolio
Opinion on the Financial Statements
We have audited the accompanying statement of assets and liabilities of Growth Portfolio (the "Fund") (one of the funds constituting the Morgan Stanley Institutional Fund, Inc. (the "Company")), including the portfolio of investments, as of December 31, 2018, and the related statement of operations for the year then ended, the statements of changes in net assets for each of the two years in the period then ended, the financial highlights for each of the five years in the period then ended and the related notes (collectively referred to as the "financial statements"). In our opinion, the financial statements present fairly, in all material respects, the financial position of Growth Portfolio (one of the funds constituting Morgan Stanley Institutional Fund, Inc.) at December 31, 2018, the results of its operations for the year then ended, the changes in its net assets for each of the two years in the period then ended and its financial highlights for each of the five years in the period then ended, in conformity with U.S. generally accepted accounting principles.
Basis for Opinion
These financial statements are the responsibility of the Company's management. Our responsibility is to express an opinion on the Fund's financial statements based on our audits. We are a public accounting firm registered with the Public Company Accounting Oversight Board (United States) ("PCAOB") and are required to be independent with respect to the Company in accordance with the U.S. federal securities law and the applicable rules and regulations of the Securities and Exchange Commission and the PCAOB.
We conducted our audits in accordance with the standards of the PCAOB. Those standards require that we plan and perform the audit to obtain reasonable assurance about whether the financial statements are free of material misstatement, whether due to error or fraud. The Company is not required to have, nor were we engaged to perform, an audit of the Company's internal control over financial reporting. As part of our audits, we are required to obtain an understanding of internal control over financial reporting, but not for the purpose of expressing an opinion on the effectiveness of the Company's internal control over financial reporting. Accordingly, we express no such opinion.
Our audits included performing procedures to assess the risks of material misstatement of the financial statements, whether due to error or fraud, and performing procedures that respond to those risks. Such procedures included examining, on a test basis, evidence regarding the amounts and disclosures in the financial statements. Our procedures included confirmation of securities owned as of December 31, 2018 by correspondence with the custodian and others or by other appropriate auditing procedures where replies from others were not received. Our audits also included evaluating the accounting principles used and significant estimates made by management, as well as evaluating the overall presentation of the financial statements. We believe that our audits provide a reasonable basis for our opinion.

We have served as the auditor of one or more Morgan Stanley investment companies since 2000.
Boston, Massachusetts
February 26, 2019
30
Morgan Stanley Institutional Fund, Inc.
Annual Report — December 31, 2018
Federal Tax Notice (unaudited)
For federal income tax purposes, the following information is furnished with respect to the distributions paid by the Fund during its taxable year ended December 31, 2018. For corporate shareholders, 8.0% of the dividends qualified for the dividends received deduction.
The Fund designated and paid approximately $387,224,000 as a long-term capital gain distribution.
In January, the Fund provides tax information to shareholders for the preceding calendar year.
31
Morgan Stanley Institutional Fund, Inc.
Annual Report — December 31, 2018
Privacy Notice (unaudited)
MORGAN STANLEY INVESTMENT MANAGEMENT INC.
AN IMPORTANT NOTICE CONCERNING OUR U.S. PRIVACY POLICY
We are required by federal law to provide you with a copy of our privacy policy annually. This policy applies to current and former individual investors in funds managed or sponsored by Morgan Stanley Investment Management Inc. ("MSIM") as well as current and former individual clients of MSIM. This policy is not applicable to partnerships, corporations, trusts or other non-individual clients or investors. Please note that we may amend this policy at any time, and will inform you of any changes as required by law.
WE RESPECT YOUR PRIVACY
We appreciate that you have provided us with your personal financial information. We strive to maintain the privacy of such information while we help you achieve your financial objectives. This Notice describes what non-public personal information we collect about you, why we collect it, when we may share it with others and how certain others may use it. It discusses the steps you may take to limit our sharing of certain information about you to affiliated companies in the Morgan Stanley family of companies ("other Morgan Stanley companies"). It also discloses how you may limit use of certain shared information for marketing purposes by other Morgan Stanley branded companies. Throughout this policy, we refer to the non-public information that personally identifies you or your accounts as "personal information.''
1. WHAT PERSONAL INFORMATION DO WE COLLECT ABOUT YOU?
We obtain personal information from applications and other forms you submit to us, from your dealings with us, from consumer reporting agencies, from our Web sites and from third parties and other sources.
For example:
• We may collect information such as your name, address, e-mail address, telephone/fax numbers, assets, income and investment objectives through subscription documents, applications and other forms you submit to us.
• We may obtain information about account balances, your use of account(s) and the types of products and services you prefer to receive from us through your dealings and transactions with us and other sources.
• We may obtain information about your creditworthiness and credit history from consumer reporting agencies.
• We may collect background information from and through third-party vendors to verify representations you have made and to comply with various regulatory requirements.
• If you interact with us through our public and private Web sites, we may collect information that you provide directly through online communications (such as an e-mail address). We may also collect information about your Internet service provider, your domain name, your computer's operating system and Web browser, your use of our Web sites and your product and service preferences, through the use of "cookies." Please consult the Terms of Use of these sites for more details.
2. WHEN DO WE DISCLOSE PERSONAL INFORMATION WE COLLECT ABOUT YOU?
We may disclose personal information we collect about you to other Morgan Stanley companies and to non-affiliated third parties.
a. Information We Disclose to Other Morgan Stanley Companies.
We may disclose personal information to other Morgan Stanley companies for a variety of reasons, including to manage your account(s) effectively, to service and process your transactions, to let you know about products and services offered by us and other Morgan Stanley companies, to manage our business, and as otherwise required or permitted by law. Offers for products and services from other Morgan Stanley companies are developed under conditions designed to safeguard your personal information.
32
Morgan Stanley Institutional Fund, Inc.
Annual Report — December 31, 2018
Privacy Notice (unaudited) (cont'd)
b. Information We Disclose to Non-affiliated Third Parties.
We do not disclose personal information that we collect about you to non-affiliated third parties except to those who provide marketing services on our behalf, to financial institutions with whom we have joint marketing agreements, and as otherwise required or permitted by law. For example, we may disclose personal information to non-affiliated third parties for servicing and processing transactions, to offer our own products and services, to protect against fraud, for institutional risk control, to respond to judicial process or to perform services on our behalf. When we share personal information with a non-affiliated third party, they are required to limit their use of personal information to the particular purpose for which it was shared and they are not allowed to share personal information with others except to fulfill that limited purpose or as may be permitted or required by law.
3. HOW DO WE PROTECT THE SECURITY AND CONFIDENTIALITY OF PERSONAL INFORMATION WE COLLECT ABOUT YOU?
We maintain physical, electronic and procedural security measures to help safeguard the personal information we collect about you. We have internal policies governing the proper handling of client information. Third parties that provide support or marketing services on our behalf may also receive personal information, and we require them to adhere to confidentiality standards with respect to such information.
4. HOW CAN YOU LIMIT THE SHARING OF CERTAIN TYPES OF PERSONAL INFORMATION WITH OTHER MORGAN STANLEY COMPANIES?
We offer you choices as to whether we share with other Morgan Stanley companies the personal information that was collected to determine your eligibility for products and services you request ("eligibility information"). Eligibility information does not include your identification information or personal information pertaining to our transactions or experiences with you. Please note that, even if you direct us not to share eligibility information with other Morgan Stanley companies ("opt-out"), we may still share personal information, including eligibility information, with those companies in circumstances excluded from the opt-out under applicable law, such as to process transactions or to service your account.
5. HOW CAN YOU LIMIT THE USE OF CERTAIN TYPES OF PERSONAL INFORMATION BY OTHER MORGAN STANLEY COMPANIES FOR MARKETING?
By following the opt-out instructions in Section 6 below, you may limit other Morgan Stanley branded companies from marketing their products or services to you based on personal information we disclose to them. This information may include, for example, your income and account history with us. Please note that, even if you choose to limit Other Morgan Stanley Companies from using personal information about you that we may share with them for marketing their products and services to you, Other Morgan Stanley Companies may use your personal information that they obtain from us to market to you in circumstances permitted by law, such as if the Other Morgan Stanley Company has its own relationship with you.
6. HOW CAN YOU SEND US AN OPT-OUT INSTRUCTION?
If you wish to limit our sharing of eligibility information about you with other Morgan Stanley companies or other Morgan Stanley companies' use of personal information for marketing purposes, as described in this notice, you may do so by:
• Calling us at (800) 548-7786
Monday–Friday between 8a.m. and 6p.m.(EST)
• Writing to us at the following address:
DST Asset Manager Solutions, Inc.
c/o Privacy Coordinator
P.O. Box 219804
Kansas City, Missouri 64121
33
Morgan Stanley Institutional Fund, Inc.
Annual Report — December 31, 2018
Privacy Notice (unaudited) (cont'd)
Your written request should include your name, address, telephone number and account number(s) to which the opt-out applies and whether you are opting out with respect to sharing of eligibility information (Section 4 above), or if information used for Marketing (Section 5 above) or both. Written opt-out requests should not be sent with any other correspondence. In order to process your request, we require that the request be provided by you directly and not through a third party.
Your opt-out preference will remain in effect with respect to this policy (as it may be amended) until you notify us otherwise. If you have a joint account, your direction for us not to share this information with other Morgan Stanley companies and for those other Morgan Stanley companies not to use your personal information for marketing will be applied to all account holders on that account. Please understand that if you limit our sharing or our affiliated companies' use of personal information, you and any joint account holder(s) may not receive information about Morgan Stanley products and services, including products or services that could help you manage your financial resources and achieve your investment objectives.
7. WHAT IF AN AFFILIATED COMPANY BECOMES A NON-AFFILIATED THIRD PARTY?
If, at any time in the future, an affiliated company becomes a non-affiliated third party, further disclosures of personal information made to the former affiliated company will be limited to those described in Section 2(b) above relating to non-affiliated third parties. If you elected under Section 6 to limit disclosures we make to affiliated companies, or use of personal information by affiliated companies, your election will not apply to use by any former affiliated company of your personal information in their possession once it becomes a non-affiliated third party.
SPECIAL NOTICE TO RESIDENTS OF VERMONT
The following section supplements our policy with respect to our individual clients who have a Vermont address and supersedes anything to the contrary in the above policy with respect to those clients only.
The state of Vermont requires financial institutions to obtain your consent prior to sharing personal information that they collect about you with affiliated companies and non-affiliated third parties other than in certain limited circumstances. Except as permitted by law, we will not share personal information we collect about you with non-affiliated third parties or other Morgan Stanley companies unless you provide us with your written consent to share such information ("opt-in").
If you wish to receive offers for investment products and services offered by or through other Morgan Stanley companies, please notify us in writing at the following address:
DST Asset Manager Solutions, Inc.
c/o Privacy Coordinator
P.O. Box 219804
Kansas City, Missouri 64121
Your authorization should include your name, address, telephone number and account number(s) to which the opt-in applies and should not be sent with any other correspondence. In order to process your authorization, we require that the authorization be provided by you directly and not through a third party.
SPECIAL NOTICE TO RESIDENTS OF CALIFORNIA
The following section supplements our policy with respect to our individual clients who have a California address and supersedes anything to the contrary in the above policy with respect to those clients only.
In response to a California law, if your account has a California home address, your personal information will not be disclosed to non-affiliated third parties except as permitted by applicable California law, and we will limit sharing such information with our affiliates to comply with California privacy laws that apply to us.
34
Morgan Stanley Institutional Fund, Inc.
Annual Report — December 31, 2018
Director and Officer Information (unaudited)
Independent Directors:
Name, Age and Address of
Independent Director | | Position(s)
Held with
Registrant | | Length of Time
Served* | | Principal Occupation(s) During Past 5 Years
and Other Relevant Professional Experience | | Number of
Portfolios in
Fund Complex
Overseen by
Independent
Director** | | Other Directorships
Held by Independent
Director*** | |
Frank L. Bowman (74)
c/o Perkins Coie LLP
Counsel to the Independent
Directors
30 Rockefeller Plaza
New York, NY 10112 | | Director | | Since
August
2006 | | President, Strategic Decisions, LLC (consulting) (since February 2009); Director or Trustee of various Morgan Stanley Funds (since August 2006); Chairperson of the Compliance and Insurance Committee (since October 2015); formerly, Chairperson of the Insurance Sub-Committee of the Compliance and Insurance Committee (2007-2015); served as President and Chief Executive Officer of the Nuclear Energy Institute (policy organization) (February 2005-November 2008); retired as Admiral, U.S. Navy after serving over 38 years on active duty including 8 years as Director of the Naval Nuclear Propulsion Program in the Department of the Navy and the U.S. Department of Energy (1996-2004); served as Chief of Naval Personnel (July 1994-September 1996) and on the Joint Staff as Director of Political Military Affairs (June 1992-July 1994); knighted as Honorary Knight Commander of the Most Excellent Order of the British Empire; awarded the Officier de l'Orde National du Mérite by the French Government; elected to the National Academy of Engineering (2009). | | | 82 | | | Director of BP p.l.c.; Director of Naval and Nuclear Technologies LLP; Director Emeritus of the Armed Services YMCA; Member of the National Security Advisory Council of the Center for U.S. Global Engagement and a member of the CNA Military Advisory Board; Trustee of Fairhaven United Methodist Church; Member of the Board of Advisors of the Dolphin Scholarship Foundation; and Director of other various non-profit organizations. | |
Kathleen A. Dennis (65)
c/o Perkins Coie LLP
Counsel to the Independent Directors
30 Rockefeller Plaza
New York, NY 10112 | | Director | | Since
August
2006 | | President, Cedarwood Associates (mutual fund and investment management consulting) (since July 2006); Chairperson of the Liquidity and Alternatives Sub-Committee of the Investment Committee (since October 2006) and Director or Trustee of various Morgan Stanley Funds (since August 2006); formerly, Senior Managing Director of Victory Capital Management (1993-2006). | | | 82 | | | Director of various non-profit organizations. | |
Nancy C. Everett (63)
c/o Perkins Coie LLP
Counsel to the Independent Directors
30 Rockefeller Plaza
New York, NY 10112 | | Director | | Since
January
2015 | | Chief Executive Officer, Virginia Commonwealth University Investment Company (since November 2015); Owner, OBIR, LLC (institutional investment management consulting) (since June 2014); formerly, Managing Director, BlackRock Inc. (February 2011-December 2013); and Chief Executive Officer, General Motors Asset Management (a/k/a Promark Global Advisors, Inc.) (June 2005-May 2010). | | | 83 | | | Formerly, Member of Virginia Commonwealth University School of Business Foundation (2005-2016); Member of Virginia Commonwealth University Board of Visitors (2013-2015); Member of Committee on Directors for Emerging Markets Growth Fund, Inc. (2007-2010); Chairperson of Performance Equity Management, LLC (2006-2010); and Chairperson, GMAM Absolute Return Strategies Fund, LLC (2006-2010). | |
35
Morgan Stanley Institutional Fund, Inc.
Annual Report — December 31, 2018
Director and Officer Information (unaudited) (cont'd)
Independent Directors: (cont'd)
Name, Age and Address of
Independent Director | | Position(s)
Held with
Registrant | | Length of Time
Served* | | Principal Occupation(s) During Past 5 Years
and Other Relevant Professional Experience | | Number of
Portfolios in
Fund Complex
Overseen by
Independent
Director** | | Other Directorships
Held by Independent
Director*** | |
Jakki L. Haussler (61)
c/o Perkins Coie LLP
Counsel to the Independent Directors
30 Rockefeller Plaza
New York, NY 10112 | | Director | | Since
January
2015 | | Chairman and Chief Executive Officer, Opus Capital Group (since January 1996); formerly, Director, Capvest Venture Fund, LP (May 2000-December 2011); Partner, Adena Ventures, LP (July 1999-December 2010); Director, The Victory Funds (February 2005-July 2008). | | | 83 | | | Director of Service Corporation International and Member, Audit Committee and Investment Committee; Director of Cincinnati Bell Inc. and Member, Audit Committee and Governance and Nominating Committee; Chairman of Northern Kentucky University Member Investment Committee; Member of Chase College of Law Transactional Law Practice Center Board of Advisors; Director of Best Transport; Director of Chase College of Law Board of Visitors; formerly, Member, University of Cincinnati Foundation Investment Committee; Member, Miami University Board of Visitors (2008-2011); Trustee of Victory Funds (2005-2008) and Chairman, Investment Committee (2007-2008) and Member, Service Provider Committee (2005-2008). | |
Dr. Manuel H. Johnson (69)
c/o Johnson Smick
International, Inc.
220 I Street, NE — Suite 200
Washington, D.C. 20002 | | Director | | Since
July
1991 | | Senior Partner, Johnson Smick International, Inc. (consulting firm); Chairperson of the Investment Committee (since October 2006) and Director or Trustee of various Morgan Stanley Funds (since July 1991); Co-Chairman and a founder of the Group of Seven Council (G7C) (international economic commission); formerly, Chairperson of the Audit Committee (July 1991-September 2006), Vice Chairman of the Board of Governors of the Federal Reserve System and Assistant Secretary of the U.S. Treasury. | | | 82 | | | Director of NVR, Inc. (home construction). | |
Joseph J. Kearns (76)
c/o Perkins Coie LLP
Counsel to the Independent Directors
30 Rockefeller Plaza
New York, NY 10112 | | Director | | Since
August
1994 | | Senior Adviser, Kearns & Associates LLC (investment consulting); Chairperson of the Audit Committee (since October 2006) and Director or Trustee of various Morgan Stanley Funds (since August 1994); formerly, Deputy Chairperson of the Audit Committee (July 2003-September 2006) and Chairperson of the Audit Committee of various Morgan Stanley Funds (since August 1994); CFO of the J. Paul Getty Trust. | | | 83 | | | Prior to August 10, 2016, Director of Electro Rent Corporation (equipment leasing); Prior to December 31, 2013, Director of The Ford Family Foundation. | |
36
Morgan Stanley Institutional Fund, Inc.
Annual Report — December 31, 2018
Director and Officer Information (unaudited) (cont'd)
Independent Directors: (cont'd)
Name, Age and Address of
Independent Director | | Position(s)
Held with
Registrant | | Length of Time
Served* | | Principal Occupation(s) During Past 5 Years
and Other Relevant Professional Experience | | Number of
Portfolios in
Fund Complex
Overseen by
Independent
Director** | | Other Directorships
Held by Independent
Director*** | |
Michael F. Klein (60)
c/o Perkins Coie LLP
Counsel to the Independent Directors
30 Rockefeller Plaza
New York, NY 10112 | | Director | | Since
August
2006 | | Managing Director, Aetos Alternatives Management, LP (since March 2000); Co-President, Aetos Alternatives Management, LP (since January 2004) and Co-Chief Executive Officer of Aetos Alternatives Management, LP (since August 2013); Chairperson of the Fixed Income Sub-Committee of the Investment Committee (since October 2006) and Director or Trustee of various Morgan Stanley Funds (since August 2006); formerly, Managing Director, Morgan Stanley & Co. Inc. and Morgan Stanley Dean Witter Investment Management and President, various Morgan Stanley Funds (June 1998-March 2000); Principal, Morgan Stanley & Co. Inc. and Morgan Stanley Dean Witter Investment Management (August 1997-December 1999). | | | 82 | | | Director of certain investment funds managed or sponsored by Aetos Alternatives Management, LP; Director of Sanitized AG and Sanitized Marketing AG (specialty chemicals). | |
Patricia Maleski (58)
c/o Perkins Coie LLP
Counsel to the Independent Directors
30 Rockefeller Plaza
New York, NY 10112 | | Director | | Since
January
2017 | | Managing Director, JPMorgan Asset Management (2004-2016); Oversight and Control Head of Fiduciary and Conflicts of Interest Program (2015-2016); Chief Control Officer-Global Asset Management (2013-2015); President, JPMorgan Funds (2010-2013); Chief Administrative Officer (2004-2013); various other positions including Treasurer and Board Liaison (since 2001). | | | 83 | | | None. | |
Michael E. Nugent (82)
522 Fifth Avenue
New York, NY 10036 | | Chair of the Board and Director | | Chair of the Boards since July 2006 and Director since July 1991 | | Chair of the Boards of various Morgan Stanley Funds (since July 2006); Chairperson of the Closed-End Fund Committee (since June 2012) Governance Committee (since January 2019) and Director or Trustee of various Morgan Stanley Funds (since July 1991); formerly, Chairperson of the Insurance Committee (until July 2006); General Partner, Triumph Capital, L.P. (private investment partnership) (1988-2013). | | | 82 | | | None. | |
W. Allen Reed (71)
c/o Perkins Coie LLP
Counsel to the Independent Directors
30 Rockefeller Plaza
New York, NY 10112 | | Director | | Since
August
2006 | | Chairperson of the Equity Sub-Committee of the Investment Committee (since October 2006) and Director or Trustee of various Morgan Stanley Funds (since August 2006); formerly, President and CEO of General Motors Asset Management; Chairman and Chief Executive Officer of the GM Trust Bank and Corporate Vice President of General Motors Corporation (August 1994-December 2005). | | | 82 | | | Director of Legg Mason, Inc.; formerly, Director of the Auburn University Foundation (2010-2015). | |
Fergus Reid (86)****
c/o Joe Pietryka, Inc.
85 Charles Colman Blvd.
Pawling, NY 12564 | | Director | | Since
June
1992 | | Chairman, Joe Pietryka, Inc.; Chairperson of the Governance Committee and Director or Trustee of various Morgan Stanley Funds (since June 1992). | | | 83 | | | Formerly, Trustee and Director of certain investment companies in the JP Morgan Fund Complex managed by JP Morgan Investment Management Inc. (1987-2012). | |
* This is the earliest date the Director began serving the Morgan Stanley Funds. Each Director serves an indefinite term, until his or her successor is elected.
** The Fund Complex includes (as of December 31, 2018) all open-end and closed-end funds (including all of their portfolios) advised by Morgan Stanley Investment Management Inc. (the "Adviser") and any funds that have an adviser that is an affiliated person of the Adviser (including, but not limited to, Morgan Stanley AIP GP LP).
*** This includes any directorships at public companies and registered investment companies held by the Director at any time during the past five years.
**** Effective date of retirement is December 31, 2018.
37
Morgan Stanley Institutional Fund, Inc.
Annual Report — December 31, 2018
Director and Officer Information (unaudited) (cont'd)
Executive Officers:
Name, Age and Address of Executive Officer | | Position(s) Held
with
Registrant | | Length of Time
Served* | | Principal Occupation(s) During Past 5 Years | |
John H. Gernon (55)
522 Fifth Avenue
New York, NY 10036 | | President and Principal Executive Officer | | Since
September
2013 | | President and Principal Executive Officer of the Equity and Fixed Income Funds and the Morgan Stanley AIP Funds (since September 2013) and the Liquidity Funds and various money market funds (since May 2014) in the Fund Complex; Managing Director of the Adviser; Head of Product (since 2006). | |
Timothy J. Knierim (59)
522 Fifth Avenue
New York, NY 10036 | | Chief Compliance Officer | | Since
December
2016 | | Managing Director of the Adviser and various entities affiliated with the Adviser; Chief Compliance Officer of various Morgan Stanley Funds and the Adviser (since December 2016) and Chief Compliance Officer of Morgan Stanley AIP GP LP (since 2014). Formerly, Managing Director and Deputy Chief Compliance Officer of the Adviser (2014-2016); and formerly, Chief Compliance Officer of Prudential Investment Management, Inc. (2007-2014). | |
Francis J. Smith (53)
522 Fifth Avenue
New York, NY 10036 | | Treasurer and Principal Financial Officer | | Treasurer since July 2003 and Principal Financial Officer since September 2002 | | Managing Director of the Adviser and various entities affiliated with the Adviser; Treasurer (since July 2003) and Principal Financial Officer of various Morgan Stanley Funds (since September 2002). | |
Mary E. Mullin (51)
522 Fifth Avenue
New York, NY 10036 | | Secretary | | Since
June
1999 | | Managing Director of the Adviser; Secretary of various Morgan Stanley Funds (since June 1999). | |
Michael J. Key (39)
522 Fifth Avenue
New York, NY 10036 | | Vice President | | Since
June
2017 | | Vice President of the Equity and Fixed Income Funds, Liquidity Funds, various money market funds and the Morgan Stanley AIP Funds in the Fund Complex (since June 2017); Executive Director of the Adviser; Head of Product Development for Equity and Fixed Income Funds (since August 2013). | |
* This is the earliest date the officer began serving the Morgan Stanley Funds. Each officer serves a one-year term, until his or her successor is elected and qualifies.
38
Morgan Stanley Institutional Fund, Inc.
Annual Report — December 31, 2018
Adviser and Administrator
Morgan Stanley Investment Management Inc.
522 Fifth Avenue
New York, New York 10036
Distributor
Morgan Stanley Distribution, Inc.
522 Fifth Avenue
New York, New York 10036
Dividend Disbursing and Transfer Agent
DST Asset Manager Solutions, Inc.
2000 Crown Colony Drive
Quincy, Massachusetts 02169
Custodian
State Street Bank and Trust Company
One Lincoln Street
Boston, Massachusetts 02111
Legal Counsel
Dechert LLP
1095 Avenue of the Americas
New York, New York 10036
Counsel to the Independent Directors
Perkins Coie LLP
30 Rockefeller Plaza
New York, New York 10112
Independent Registered Public Accounting Firm
Ernst & Young LLP
200 Clarendon Street
Boston, Massachusetts 02116
Reporting to Shareholders
Each Morgan Stanley fund provides a complete schedule of portfolio holdings in its semi-annual and the annual reports within 60 days of the end of the fund's second and fourth fiscal quarters. The semi-annual and annual reports are filed electronically with the Securities and Exchange Commission ("SEC") on Form N-CSRS and Form N-CSR, respectively. Morgan Stanley also delivers the semi-annual and annual reports to fund shareholders and makes these reports available on its public website, www.morganstanley.com/im/shareholderreports. Each Morgan Stanley fund also files a complete schedule of portfolio holdings with the SEC for the fund's first and third fiscal quarters on Form N-Q. Morgan Stanley does not deliver the reports for the first and third fiscal quarters to shareholders, nor are the reports posted to the Morgan Stanley public website. You may, however, obtain the Form N-Q filings (as well as the Form N-CSR and N-CSRS filings) by accessing the SEC's website, www.sec.gov. You can also request copies of these materials, upon payment of a duplicating fee, by electronic request at the SEC's email address (publicinfo@sec.gov).
Proxy Voting Policies and Procedures and Proxy Voting Record
You may obtain a copy of the Company's Proxy Voting Policy and Procedures and information regarding how the Company voted proxies relating to portfolio securities during the most recent twelve-month period ended June 30, without charge, upon request, by calling toll free 1 (800) 548-7786 or by visiting our website at www.morganstanley.com/im/shareholderreports. This information is also available on the SEC's website at www.sec.gov.
This report is authorized for distribution only when preceded or accompanied by a prospectus or summary prospectus of the applicable Fund of Morgan Stanley Institutional Fund, Inc., which describes in detail the Fund's investment policies, risks, fees and expenses. Please read the prospectus carefully before you invest or send money. For additional information, including information regarding the investments comprising the Fund, please visit our website at www.morganstanley.com/im/shareholderreports or call toll free 1 (800) 548-7786.
39
Printed in U.S.A.
This Report has been prepared for shareholders and may be distributed to others only if preceded or accompanied by a current prospectus.
Morgan Stanley Investment Management Inc.
522 Fifth Avenue
New York, New York 10036
© 2019 Morgan Stanley. Morgan Stanley Distribution, Inc.

IFIGRWANN
2404076 EXP. 02.29.20

Morgan Stanley Institutional Fund, Inc.
International Advantage Portfolio
Annual Report
December 31, 2018
Beginning on January 1, 2021, as permitted by regulations adopted by the Securities and Exchange Commission ("SEC"), paper copies of the Fund's Annual and Semi-Annual Reports to Shareholders ("Shareholder Reports") will no longer be sent by mail, unless you specifically request paper copies of the Shareholder Reports from the Fund or from your financial intermediary, such as a broker-dealer or a bank. Instead, the Shareholder Reports will be made available on the Fund's website, https://www.morganstanley.com/im/shareholderreports and you will be notified by mail each time a Shareholder Report is posted and provided with a website link to access the Shareholder Report. If you already elected to receive Shareholder Reports electronically, you will not be affected by this change and you need not take any action. You may elect to receive Shareholder Reports and other communications from the Fund electronically anytime by contacting your financial intermediary or, if you are a direct investor, please follow the instructions on the envelope.
Beginning on January 1, 2019, you may elect to receive all future Shareholder Reports in paper free of charge. If you invest through a financial intermediary, you can contact your financial intermediary to request that you continue to receive paper copies of your Shareholder Reports. If you invest directly with the Fund, please follow the instructions on the envelope to let the Fund know you wish to continue receiving paper copies of your Shareholder Reports. Your election to receive Shareholder Reports in paper will apply to all funds held in your account if you invest through your financial intermediary or all funds held with the fund complex if you invest directly with a fund.

Morgan Stanley Institutional Fund, Inc.
Annual Report — December 31, 2018
Shareholders' Letter | | | 2 | | |
Expense Example | | | 3 | | |
Investment Overview | | | 4 | | |
Portfolio of Investments | | | 7 | | |
Statement of Assets and Liabilities | | | 9 | | |
Statement of Operations | | | 11 | | |
Statements of Changes in Net Assets | | | 12 | | |
Financial Highlights | | | 14 | | |
Notes to Financial Statements | | | 19 | | |
Report of Independent Registered Public Accounting Firm | | | 28 | | |
Federal Tax Notice | | | 29 | | |
Privacy Notice | | | 30 | | |
Director and Officer Information | | | 33 | | |
This report is authorized for distribution only when preceded or accompanied by a prospectus or summary prospectus of the applicable Fund of Morgan Stanley Institutional Fund, Inc. To receive a prospectus and/or statement of additional information (SAI), which contains more complete information such as investment objectives, charges, expenses, policies for voting proxies, risk considerations and describes in detail each of the Fund's investment policies to the prospective investor, please call toll free 1 (800) 548-7786. Please read the prospectuses carefully before you invest or send money.
Additionally, you can access information about the Fund, including performance, characteristics and investment team commentary, through Morgan Stanley Investment Management's website: www.morganstanley.com/im/shareholderreports.
Market forecasts provided in this report may not necessarily come to pass. There is no guarantee that any sectors mentioned will continue to perform as discussed herein or that securities in such sectors will be held by the Fund in the future. There is no assurance that a fund will achieve its investment objective. Funds are subject to market risk, which is the possibility that market values of securities owned by the Fund will decline and, therefore, the value of the Fund's shares may be less than what you paid for them. Accordingly, you can lose money investing in this Fund. Please see the prospectus for more complete information on investment risks.
1
Morgan Stanley Institutional Fund, Inc.
Annual Report — December 31, 2018
Shareholders' Letter (unaudited)
Dear Shareholders,
We are pleased to provide this Annual report, in which you will learn how your investment in International Advantage Portfolio (the "Fund") performed during the latest twelve-month period.
Morgan Stanley Investment Management is a client-centric, investor-led organization. Our global presence, intellectual capital, and breadth of products and services enable us to partner with investors to meet the evolving challenges of today's financial markets. We aim to deliver superior investment service and to empower our clients to make the informed decisions that help them reach their investment goals.
As always, we thank you for selecting Morgan Stanley Investment Management, and look forward to working with you in the months and years ahead.
Sincerely,

John H. Gernon
President and Principal Executive Officer
January 2019
2
Morgan Stanley Institutional Fund, Inc.
Annual Report — December 31, 2018
Expense Example (unaudited)
International Advantage Portfolio
As a shareholder of the Fund, you incur two types of costs: (1) transactional costs, including redemption fees; and (2) ongoing costs, which may include advisory fees, administration fees, distribution and shareholder services fees and other Fund expenses. This example is intended to help you understand your ongoing costs (in dollars) of investing in the Fund and to compare these costs with the ongoing costs of investing in other mutual funds.
This example is based on an investment of $1,000 invested at the beginning of the six-month period ended December 31, 2018 and held for the entire six-month period.
Actual Expenses
The table below provides information about actual account values and actual expenses. You may use the information in this table, together with the amount you invested, to estimate the expenses that you paid over the period. Simply divide your account value by $1,000 (for example, an $8,600 account value divided by $1,000 = 8.6), then multiply the result by the number in the table under the heading entitled "Actual Expenses Paid During Period" to estimate the expenses you paid on your account during this period.
Hypothetical Example for Comparison Purposes
The table below provides information about hypothetical account values and hypothetical expenses based on the Fund's actual expense ratio and an assumed rate of return of 5% per year before expenses, which is not the Fund's actual return. The hypothetical account values and expenses may not be used to estimate the actual ending account balance or expenses you paid for the period. You may use this information to compare the ongoing costs of investing in the Fund and other funds. To do so, compare this 5% hypothetical example with the 5% hypothetical examples that appear in the shareholder reports of the other funds.
Please note that the expenses shown in the table are meant to highlight your ongoing costs only and do not reflect any transactional costs, such as sales charges (loads) and redemption fees. Therefore, the information for each class in the table is useful in comparing ongoing costs only, and will not help you determine the relative total costs of owning different funds. In addition, if these transactional costs were included, your costs would have been higher.
| | | Beginning
Account
Value
7/1/18 | | Actual Ending
Account
Value
12/31/18 | | Hypothetical
Ending Account
Value | | Actual
Expenses
Paid
During
Period* | | Hypothetical
Expenses Paid
During Period* | | Net
Expense
Ratio
During
Period** | |
International Advantage Portfolio Class I | | $ | 1,000.00 | | | $ | 871.70 | | | $ | 1,020.27 | | | $ | 4.62 | | | $ | 4.99 | | | | 0.98 | % | |
International Advantage Portfolio Class A | | | 1,000.00 | | | | 870.40 | | | | 1,018.35 | | | | 6.41 | | | | 6.92 | | | | 1.36 | | |
International Advantage Portfolio Class L | | | 1,000.00 | | | | 868.10 | | | | 1,015.98 | | | | 8.62 | | | | 9.30 | | | | 1.83 | | |
International Advantage Portfolio Class C | | | 1,000.00 | | | | 867.40 | | | | 1,014.67 | | | | 9.84 | | | | 10.61 | | | | 2.09 | | |
International Advantage Portfolio Class IS | | | 1,000.00 | | | | 872.20 | | | | 1,020.52 | | | | 4.39 | | | | 4.74 | | | | 0.93 | | |
* Expenses are calculated using each Fund Class' annualized net expense ratio (as disclosed), multiplied by the average account value over the period and multiplied by 184/365 (to reflect the most recent one-half year period).
** Annualized.
3
Morgan Stanley Institutional Fund, Inc.
Annual Report — December 31, 2018
Investment Overview (unaudited)
International Advantage Portfolio
The Fund seeks long-term capital appreciation.
Performance
For the fiscal year ended December 31, 2018, the Fund's Class I shares had a total return based on net asset value and reinvestment of distributions per share of –5.19%, net of fees. The Fund's Class I shares outperformed the Fund's benchmark, the MSCI All Country World ex USA Net Index (the "Index"), which returned –14.20%.
Factors Affecting Performance
• Global growth concerns weighed heavily on global equities in the 12-month period. Economic indicators were signaling slowdowns across China, Europe and the U.K., and Japan while at the same time financial conditions were tightening and geopolitical risks increased, particularly regarding trade protectionism. The U.S. economy was an outlier, as growth accelerated on tailwinds from tax cuts and deregulation. But by the end of the year, U.S. companies downgraded their earnings forecasts as the benefits of fiscal stimulus were expected to recede and business sentiment deteriorated due to the U.S.-China trade relations. With global growth fading and the outcome of trade disputes, Brexit and other issues still largely unpredictable, investors grew anxious about the duration of the Federal Reserve's monetary tightening and the European Central Bank's decision to begin withdrawing its stimulus. Pricing these risks was challenging, which led to increased equity volatility through the year.
• International equity markets declined 14.20% for the 12-month period ended December 31, 2018, as measured by the Index. Against this backdrop, our team remained focused on assessing company prospects over a longer-term period of three to five years, and owning a portfolio of high quality companies with diverse business drivers not tied to a particular market environment.
• The team manages concentrated portfolios that are highly differentiated from the benchmark, with securities weighted on our assessment of the quality of the company and our conviction. Our longer-term focus results in lower turnover than many of our peers. The value added or detracted in any period of time will typically result from stock selection, given our philosophy and process.
• For the 12-month period, the Fund outperformed the Index due to favorable stock selection and sector allocation.
• The main positive contributor to performance was our stock selection in consumer discretionary, health care and information technology.
• Detractors from performance included our stock selection in utilities, an overweight in consumer discretionary and an underweight in energy. The Fund had no energy holdings at the end of reporting period.
Management Strategies
• There were no changes to our bottom-up investment process during the period. The team seeks high quality companies, which we define primarily as those with sustainable competitive advantages. Our team continues to focus on bottom-up stock selection and the long-term outlook for companies owned in the portfolio; accordingly, we have had very limited turnover in the portfolio to date, as our ongoing work reaffirms our assessment of quality and competitive advantage in the names we own.
• At the close of the period ended December 31, 2018, consumer staples represented the largest sector weight in the Fund, followed by consumer discretionary and information technology. The team's bottom-up investment process resulted in sector overweight positions in consumer staples, consumer discretionary and information technology, and underweight positions in financials, materials, energy, communication services, industrials, real estate, health care and utilities. The Fund had no energy and real estate holdings at the end of the reporting period.
4
Morgan Stanley Institutional Fund, Inc.
Annual Report — December 31, 2018
Investment Overview (unaudited) (cont'd)
International Advantage Portfolio
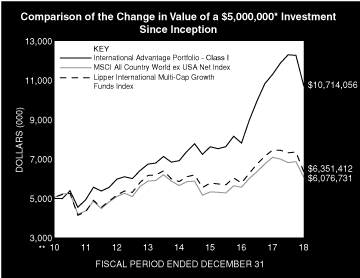
* Minimum Investment for Class I shares
** Commenced Operations on December 28, 2010.
In accordance with SEC regulations, the Fund's performance shown assumes that all recurring fees (including management fees) were deducted and all dividends and distributions were reinvested. The performance of Class A, L, C and IS shares will vary from the performance of Class I shares based upon their different inception dates and will be negatively impacted by additional fees assessed to those classes (if applicable).
Performance Compared to the MSCI All Country World ex USA Net Index(1) and the Lipper International Multi-Cap Growth Funds Index(2)
| | | Period Ended December 31, 2018
Total Returns(3) | |
| | | | | Average Annual | |
| | | One
Year | | Five
Years | | Ten
Years | | Since
Inception(7) | |
Fund — Class I Shares
w/o sales charges(4) | | | –5.19 | % | | | 9.72 | % | | | — | | | | 9.98 | % | |
Fund — Class A Shares
w/o sales charges(4) | | | –5.48 | | | | 9.35 | | | | — | | | | 9.65 | | |
Fund — Class A Shares with
maximum 5.25% sales charges(4) | | | –10.45 | | | | 8.17 | | | | — | | | | 8.92 | | |
Fund — Class L Shares
w/o sales charges(4) | | | –5.95 | | | | 8.79 | | | | — | | | | 9.10 | | |
Fund — Class C Shares
w/o sales charges(5) | | | –6.18 | | | | — | | | | — | | | | 7.99 | | |
Fund — Class C Shares with
maximum 1.00% deferred
sales charges(5) | | | –7.10 | | | | — | | | | — | | | | 7.99 | | |
Fund — Class IS Shares
w/o sales charges(6) | | | — | | | | — | | | | — | | | | –15.22 | | |
MSCI All Country World
ex USA Net Index | | | –14.20 | | | | 0.68 | | | | — | | | | 2.47 | | |
Lipper International Multi-Cap
Growth Funds Index | | | –14.74 | | | | 0.60 | | | | — | | | | 3.03 | | |
Performance data quoted represents past performance, which is no guarantee of future results, and current performance may be lower or higher than the figures shown. Performance assumes that all dividends and distributions, if any, were reinvested. For the most recent month-end performance figures, please visit www.morganstanley.com/im/shareholderreports. Investment return and principal value will fluctuate so that Fund shares, when redeemed, may be worth more or less than their original cost. Returns for periods less than one year are not annualized. Total returns do not reflect the deduction of taxes that a shareholder would pay on Fund distributions or the redemption of Fund shares. Performance of share classes will vary due to difference in sales charges and expenses.
(1) The MSCI All Country World ex USA Net Index is a free float-adjusted market capitalization weighted index designed to measure the equity market performance of developed and emerging markets, excluding the United States. The term "free float" represents the portion of shares outstanding that are deemed to be available for purchase in the public equity markets by investors.The performance of the Index is listed in U.S. dollars and assumes reinvestment of net dividends. Net total return indices reinvest dividends after the deduction of withholding taxes, using (for international indices) a tax rate applicable to non-resident institutional investors who do not benefit from double taxation treaties. The Index is unmanaged and its returns do not include any sales charges or fees. Such costs would lower performance. It is not possible to invest directly in an index.
(2) The Lipper International Multi-Cap Growth Funds Index is an equally weighted performance index of the largest qualifying funds (based on net assets) in the Lipper International Multi-Cap Growth Funds classification. The Index, which is adjusted for capital gains distributions and income dividends, is unmanaged and should not be considered an investment. There are currently 30 funds represented in this Index. As of the date of this report, the Fund was in the Lipper International Multi-Cap Growth Funds classification.
5
Morgan Stanley Institutional Fund, Inc.
Annual Report — December 31, 2018
Investment Overview (unaudited) (cont'd)
International Advantage Portfolio
(3) Total returns for the Fund reflect fees waived and expenses reimbursed, if applicable, by Morgan Stanley Investment Management Inc. (the "Adviser"). Without such waivers and reimbursements, total returns would have been lower.
(4) Commenced operations on December 28, 2010.
(5) Commenced offering on April 30, 2015.
(6) Commenced offering on June 15, 2018.
(7) For comparative purposes, average annual since inception returns listed for the Indexes refer to the inception date of Class I of the Fund, not the inception of the Index.
6
Morgan Stanley Institutional Fund, Inc.
Annual Report — December 31, 2018
Portfolio of Investments
International Advantage Portfolio
| | | Shares | | Value
(000) | |
Common Stocks (88.0%) | |
Australia (4.2%) | |
Brookfield Infrastructure Partners LP | | | 637,232 | | | $ | 22,004 | | |
Cochlear Ltd. | | | 91,007 | | | | 11,058 | | |
| | | | 33,062 | | |
Belgium (2.4%) | |
Anheuser-Busch InBev SA N.V. | | | 286,756 | | | | 18,978 | | |
Canada (4.1%) | |
Brookfield Asset Management, Inc., Class A | | | 441,915 | | | | 16,948 | | |
Constellation Software, Inc. | | | 23,514 | | | | 15,051 | | |
| | | | 31,999 | | |
China (5.4%) | |
Foshan Haitian Flavouring & Food Co., Ltd.,
Class A | | | 2,053,104 | | | | 20,550 | | |
TAL Education Group ADR (a) | | | 827,311 | | | | 22,073 | | |
| | | | 42,623 | | |
Denmark (8.8%) | |
Chr Hansen Holding A/S | | | 291,754 | | | | 25,839 | | |
DSV A/S | | | 656,871 | | | | 43,314 | | |
| | | | 69,153 | | |
France (8.5%) | |
Danone SA | | | 155,685 | | | | 10,972 | | |
Hermes International | | | 73,704 | | | | 40,762 | | |
Pernod Ricard SA | | | 90,301 | | | | 14,827 | | |
| | | | 66,561 | | |
Germany (1.0%) | |
Rational AG | | | 13,520 | | | | 7,680 | | |
Hong Kong (3.6%) | |
AIA Group Ltd. | | | 2,567,900 | | | | 21,124 | | |
Haidilao International Holding Ltd. (a) | | | 863,000 | | | | 1,827 | | |
Haidilao International Holding Ltd. (a)(b) | | | 2,266,000 | | | | 4,971 | | |
| | | | 27,922 | | |
India (4.2%) | |
HDFC Bank Ltd. | | | 1,091,345 | | | | 33,205 | | |
Italy (5.9%) | |
Brunello Cucinelli SpA | | | 32,036 | | | | 1,101 | | |
Moncler SpA | | | 1,339,805 | | | | 44,771 | | |
| | | | 45,872 | | |
Japan (11.2%) | |
Calbee, Inc. | | | 882,100 | | | | 27,567 | | |
Keyence Corp. | | | 70,400 | | | | 35,480 | | |
Pigeon Corp. | | | 564,900 | | | | 24,392 | | |
| | | | 87,439 | | |
Sweden (2.7%) | |
Vitrolife AB | | | 1,254,589 | | | | 20,785 | | |
Switzerland (5.8%) | |
Chocoladefabriken Lindt & Spruengli AG
(Registered) | | | 401 | | | | 29,886 | | |
Kuehne & Nagel International AG (Registered) | | | 118,584 | | | | 15,287 | | |
| | | | 45,173 | | |
| | | Shares | | Value
(000) | |
United Kingdom (11.6%) | |
Diageo PLC | | | 308,142 | | | $ | 10,953 | | |
Fevertree Drinks PLC | | | 555,034 | | | | 15,449 | | |
Reckitt Benckiser Group PLC | | | 393,095 | | | | 30,019 | | |
Rightmove PLC | | | 6,289,471 | | | | 34,561 | | |
| | | | 90,982 | | |
United States (8.6%) | |
Booking Holdings, Inc. (a) | | | 18,837 | | | | 32,445 | | |
EPAM Systems, Inc. (a) | | | 303,628 | | | | 35,224 | | |
| | | | 67,669 | | |
Total Common Stocks (Cost $715,841) | | | 689,103 | | |
Short-Term Investment (14.0%) | |
Investment Company (14.0%) | |
Morgan Stanley Institutional Liquidity
Funds — Treasury Securities Portfolio —
Institutional Class (See Note G)
(Cost $109,356) | | | 109,355,777 | | | | 109,356 | | |
Total Investments Excluding Purchased
Options (102.0%) (Cost $825,197) | | | | | 798,459 | | |
Total Purchased Options Outstanding (0.0%)
(Cost $1,388) | | | 297 | | |
Total Investments (102.0%) (Cost $826,585) (c)(d) | | | 798,756 | | |
Liabilities in Excess of Other Assets (–2.0%) | | | (15,360 | ) | |
Net Assets (100.0%) | | $ | 783,396 | | |
Country assignments and aggregations are based generally on third party vendor classifications and information, and may be different from the assignments and aggregations under the policies set forth in the Fund's prospectus and/or statement of additional information relating to geographic classifications.
(a) Non-income producing security.
(b) 144A security — Certain conditions for public sale may exist. Unless otherwise noted, these securities are deemed to be liquid.
(c) The approximate fair value and percentage of net assets, $545,359,000 and 69.6%, respectively, represent the securities that have been fair valued under the fair valuation policy for international investments as described in Note A-1 within the Notes to the Financial Statements.
(d) At December 31, 2018, the aggregate cost for federal income tax purposes is approximately $830,545,000. The aggregate gross unrealized appreciation is approximately $10,997,000 and the aggregate gross unrealized depreciation is approximately $42,786,000, resulting in net unrealized depreciation of approximately $31,789,000.
ADR American Depositary Receipt.
The accompanying notes are an integral part of the financial statements.
7
Morgan Stanley Institutional Fund, Inc.
Annual Report — December 31, 2018
Portfolio of Investments (cont'd)
International Advantage Portfolio
Call Options Purchased:
The Fund had the following call options purchased open at December 31, 2018:
Counterparty | | Description | | Strike
Price | | Expiration
Date | | Number of
Contracts | | Notional
Amount
(000) | | Value
(000) | | Premiums
Paid
(000) | | Unrealized
Depreciation
(000) | |
Royal Bank of Scotland | | USD/CNH | | CNH | 7.16 | | | Jan-19 | | | 75,828,194 | | | | 75,828 | | | $ | 8 | | | $ | 329 | | | $ | (321 | ) | |
Royal Bank of Scotland | | USD/CNH | | CNH | 7.78 | | | Jul-19 | | | 95,067,431 | | | | 95,067 | | | | 103 | | | | 463 | | | | (360 | ) | |
Royal Bank of Scotland | | USD/CNH | | CNH | 8.00 | | | Oct-19 | | | 101,329,227 | | | | 101,329 | | | | 186 | | | | 596 | | | | (410 | ) | |
| | | | | | | | | | | | | $ | 297 | | | $ | 1,388 | | | $ | (1,091 | ) | |
CNH — Chinese Yuan Renminbi Offshore
USD — United States Dollar
Portfolio Composition
Classification | | Percentage of
Total Investments | |
Other* | | | 44.5 | % | |
Short-Term Investments | | | 13.7 | | |
Food Products | | | 11.2 | | |
Textiles, Apparel & Luxury Goods | | | 10.9 | | |
Beverages | | | 7.5 | | |
Household Products | | | 6.8 | | |
Road & Rail | | | 5.4 | | |
Total Investments | | | 100.0 | % | |
* Industries and/or investment types representing less than 5% of total investments.
The accompanying notes are an integral part of the financial statements.
8
Morgan Stanley Institutional Fund, Inc.
Annual Report — December 31, 2018
International Advantage Portfolio
Statement of Assets and Liabilities | | December 31, 2018
(000) | |
Assets: | |
Investments in Securities of Unaffiliated Issuers, at Value (Cost $717,229) | | $ | 689,400 | | |
Investment in Security of Affiliated Issuer, at Value (Cost $109,356) | | | 109,356 | | |
Total Investments in Securities, at Value (Cost $826,585) | | | 798,756 | | |
Foreign Currency, at Value (Cost $571) | | | 573 | | |
Cash | | | 246 | | |
Receivable for Fund Shares Sold | | | 17,703 | | |
Receivable for Investments Sold | | | 6,161 | | |
Tax Reclaim Receivable | | | 248 | | |
Receivable from Affiliate | | | 155 | | |
Other Assets | | | 116 | | |
Total Assets | | | 823,958 | | |
Liabilities: | |
Payable for Investments Purchased | | | 34,968 | | |
Payable for Fund Shares Redeemed | | | 3,535 | | |
Payable for Advisory Fees | | | 1,032 | | |
Due to Broker | | | 570 | | |
Deferred Capital Gain Country Tax | | | 141 | | |
Payable for Sub Transfer Agency Fees — Class I | | | 46 | | |
Payable for Sub Transfer Agency Fees — Class A | | | 29 | | |
Payable for Sub Transfer Agency Fees — Class L | | | — | @ | |
Payable for Sub Transfer Agency Fees — Class C | | | 2 | | |
Payable for Shareholder Services Fees — Class A | | | 45 | | |
Payable for Distribution and Shareholder Services Fees — Class L | | | — | @ | |
Payable for Distribution and Shareholder Services Fees — Class C | | | 9 | | |
Payable for Professional Fees | | | 52 | | |
Payable for Administration Fees | | | 47 | | |
Payable for Custodian Fees | | | 28 | | |
Payable for Transfer Agency Fees — Class I | | | 19 | | |
Payable for Transfer Agency Fees — Class A | | | 6 | | |
Payable for Transfer Agency Fees — Class L | | | 1 | | |
Payable for Transfer Agency Fees — Class C | | | 1 | | |
Payable for Transfer Agency Fees — Class IS | | | — | @ | |
Other Liabilities | | | 31 | | |
Total Liabilities | | | 40,562 | | |
Net Assets | | $ | 783,396 | | |
Net Assets Consist of: | |
Paid-in-Capital | | $ | 811,973 | | |
Total Accumulated Loss | | | (28,577 | ) | |
Net Assets | | $ | 783,396 | | |
The accompanying notes are an integral part of the financial statements.
9
Morgan Stanley Institutional Fund, Inc.
Annual Report — December 31, 2018
International Advantage Portfolio
Statement of Assets and Liabilities (cont'd) | | December 31, 2018
(000) | |
CLASS I: | |
Net Assets | | $ | 569,408 | | |
| Shares Outstanding $0.001 par value shares of beneficial interest (unlimited shares authorized) (not in 000's) | | | 36,175,170 | | |
Net Asset Value, Offering and Redemption Price Per Share | | $ | 15.74 | | |
CLASS A: | |
Net Assets | | $ | 202,732 | | |
| Shares Outstanding $0.001 par value shares of beneficial interest (unlimited shares authorized) (not in 000's) | | | 13,029,067 | | |
Net Asset Value, Redemption Price Per Share | | $ | 15.56 | | |
Maximum Sales Load | | | 5.25 | % | |
Maximum Sales Charge | | $ | 0.86 | | |
Maximum Offering Price Per Share | | $ | 16.42 | | |
CLASS L: | |
Net Assets | | $ | 161 | | |
| Shares Outstanding $0.001 par value shares of beneficial interest (unlimited shares authorized) (not in 000's) | | | 10,604 | | |
Net Asset Value, Offering and Redemption Price Per Share | | $ | 15.18 | | |
CLASS C: | |
Net Assets | | $ | 11,087 | | |
| Shares Outstanding $0.001 par value shares of beneficial interest (unlimited shares authorized) (not in 000's) | | | 738,398 | | |
Net Asset Value, Offering and Redemption Price Per Share | | $ | 15.02 | | |
CLASS IS: | |
Net Assets | | $ | 8 | | |
| Shares Outstanding $0.001 par value shares of beneficial interest (unlimited shares authorized) (not in 000's) | | | 529 | | |
Net Asset Value, Offering and Redemption Price Per Share | | $ | 15.75 | | |
@ Amount is less than $500.
The accompanying notes are an integral part of the financial statements.
10
Morgan Stanley Institutional Fund, Inc.
Annual Report — December 31, 2018
International Advantage Portfolio
Statement of Operations | | Year Ended
December 31, 2018
(000) | |
Investment Income: | |
Dividends from Securities of Unaffiliated Issuers (Net of $452 of Foreign Taxes Withheld) | | $ | 3,894 | | |
Non-Cash Dividends from Securities of Unaffiliated Issuers | | | 1,140 | | |
Dividends from Security of Affiliated Issuer (Note G) | | | 788 | | |
Income from Securities Loaned — Net | | | 3 | | |
Total Investment Income | | | 5,825 | | |
Expenses: | |
Advisory Fees (Note B) | | | 3,846 | | |
Sub Transfer Agency Fees — Class I | | | 334 | | |
Sub Transfer Agency Fees — Class A | | | 252 | | |
Sub Transfer Agency Fees — Class L | | | — | @ | |
Sub Transfer Agency Fees — Class C | | | 10 | | |
Shareholder Services Fees — Class A (Note D) | | | 453 | | |
Distribution and Shareholder Services Fees — Class L (Note D) | | | 1 | | |
Distribution and Shareholder Services Fees — Class C (Note D) | | | 103 | | |
Administration Fees (Note C) | | | 385 | | |
Professional Fees | | | 124 | | |
Registration Fees | | | 107 | | |
Custodian Fees (Note F) | | | 105 | | |
Transfer Agency Fees — Class I (Note E) | | | 55 | | |
Transfer Agency Fees — Class A (Note E) | | | 17 | | |
Transfer Agency Fees — Class L (Note E) | | | 2 | | |
Transfer Agency Fees — Class C (Note E) | | | 3 | | |
Transfer Agency Fees — Class IS (Note E) | | | 1 | | |
Shareholder Reporting Fees | | | 67 | | |
Directors' Fees and Expenses | | | 14 | | |
Other Expenses | | | 32 | | |
Total Expenses | | | 5,911 | | |
Reimbursement of Class Specific Expenses — Class I (Note B) | | | (261 | ) | |
Reimbursement of Class Specific Expenses — Class A (Note B) | | | (10 | ) | |
Reimbursement of Class Specific Expenses — Class L (Note B) | | | (2 | ) | |
Reimbursement of Class Specific Expenses — Class IS (Note B) | | | (1 | ) | |
Rebate from Morgan Stanley Affiliate (Note G) | | | (83 | ) | |
Waiver of Advisory Fees (Note B) | | | (81 | ) | |
Net Expenses | | | 5,473 | | |
Net Investment Income | | | 352 | | |
Realized Gain: | |
Investments Sold | | | 10,138 | | |
Foreign Currency Translation | | | 29 | | |
Net Realized Gain | | | 10,167 | | |
Change in Unrealized Appreciation (Depreciation): | |
Investments (Net Increase in Deferred Capital Gain Country Tax of $141) | | | (65,692 | ) | |
Foreign Currency Translation | | | (31 | ) | |
Net Change in Unrealized Appreciation (Depreciation) | | | (65,723 | ) | |
Net Realized Gain and Change in Unrealized Appreciation (Depreciation) | | | (55,556 | ) | |
Net Decrease in Net Assets Resulting from Operations | | $ | (55,204 | ) | |
@ Amount is less than $500.
The accompanying notes are an integral part of the financial statements.
11
Morgan Stanley Institutional Fund, Inc.
Annual Report — December 31, 2018
International Advantage Portfolio
Statements of Changes in Net Assets | | Year Ended
December 31, 2018
(000) | | Year Ended
December 31, 2017
(000) | |
Increase (Decrease) in Net Assets: | |
Operations: | |
Net Investment Income (Loss) | | $ | 352 | | | $ | (273 | ) | |
Net Realized Gain | | | 10,167 | | | | 6,311 | | |
Net Change in Unrealized Appreciation (Depreciation) | | | (65,723 | ) | | | 37,214 | | |
Net Increase (Decrease) in Net Assets Resulting from Operations | | | (55,204 | ) | | | 43,252 | | |
Dividends and Distributions to Shareholders: | |
Class I | | | (7,460 | ) | | | (3,225 | )* | |
Class A | | | (3,589 | ) | | | (2,609 | )* | |
Class L | | | (3 | ) | | | (3 | )* | |
Class C | | | (193 | ) | | | (134 | )* | |
Class IS | | | (— | @) | | | — | | |
Total Dividends and Distributions to Shareholders | | | (11,245 | ) | | | (5,971 | ) | |
Capital Share Transactions:(1) | |
Class I: | |
Subscribed | | | 540,991 | | | | 152,464 | | |
Distributions Reinvested | | | 7,436 | | | | 3,224 | | |
Redeemed | | | (101,820 | ) | | | (44,827 | ) | |
Class A: | |
Subscribed | | | 225,567 | | | | 129,943 | | |
Distributions Reinvested | | | 3,589 | | | | 2,609 | | |
Redeemed | | | (148,854 | ) | | | (10,165 | ) | |
Class L: | |
Exchanged | | | 75 | | | | 27 | | |
Distributions Reinvested | | | 3 | | | | 2 | | |
Redeemed | | | (33 | ) | | | — | | |
Class C: | |
Subscribed | | | 8,414 | | | | 5,022 | | |
Distributions Reinvested | | | 193 | | | | 134 | | |
Redeemed | | | (2,953 | ) | | | (270 | ) | |
Class IS: | |
Subscribed | | | 10 | (a) | | | — | | |
Net Increase in Net Assets Resulting from Capital Share Transactions | | | 532,618 | | | | 238,163 | | |
Redemption Fees | | | 31 | | | | 7 | | |
Total Increase in Net Assets | | | 466,200 | | | | 275,451 | | |
Net Assets: | |
Beginning of Period | | | 317,196 | | | | 41,745 | | |
End of Period | | $ | 783,396 | | | $ | 317,196 | † | |
The accompanying notes are an integral part of the financial statements.
12
Morgan Stanley Institutional Fund, Inc.
Annual Report — December 31, 2018
International Advantage Portfolio
Statements of Changes in Net Assets (cont'd) | | Year Ended
December 31, 2018
(000) | | Year Ended
December 31, 2017
(000) | |
(1) Capital Share Transactions: | |
Class I: | |
Shares Subscribed | | | 31,862 | | | | 10,012 | | |
Shares Issued on Distributions Reinvested | | | 468 | | | | 194 | | |
Shares Redeemed | | | (5,996 | ) | | | (2,865 | ) | |
Net Increase in Class I Shares Outstanding | | | 26,334 | | | | 7,341 | | |
Class A: | |
Shares Subscribed | | | 12,985 | | | | 8,199 | | |
Shares Issued on Distributions Reinvested | | | 228 | | | | 158 | | |
Shares Redeemed | | | (8,785 | ) | | | (668 | ) | |
Net Increase in Class A Shares Outstanding | | | 4,428 | | | | 7,689 | | |
Class L: | |
Shares Exchanged | | | 4 | | | | 2 | | |
Shares Issued on Distributions Reinvested | | | — | @@ | | | — | @@ | |
Shares Redeemed | | | (2 | ) | | | (— | @@) | |
Net Increase in Class L Shares Outstanding | | | 2 | | | | 2 | | |
Class C: | |
Shares Subscribed | | | 494 | | | | 334 | | |
Shares Issued on Distributions Reinvested | | | 13 | | | | 8 | | |
Shares Redeemed | | | (183 | ) | | | (19 | ) | |
Net Increase in Class C Shares Outstanding | | | 324 | | | | 323 | | |
Class IS: | |
Shares Subscribed | | | 1 | (a) | | | — | | |
@ Amount is less than $500.
@@ Amount is less than 500 shares.
(a) For the period June 15, 2018 through December 31, 2018.
The following information was previously reported in the December 31, 2017 financial statements. The distribution information for the year ended December 31, 2017 presented on the Statements of Changes in Net Assets is presented for comparative purposes to the December 31, 2018 financial statements, which conform to the SEC Final Rule on Disclosure Update and Simplification which was effective November 5, 2018.
* Dividends and Distributions to Shareholders for the year ended December 31, 2017 were as follows:
Class I: | |
Net Realized Gain | | $ | (3,225 | ) | |
Class A: | |
Net Realized Gain | | $ | (2,609 | ) | |
Class L: | |
Net Realized Gain | | $ | (3 | ) | |
Class C: | |
Net Realized Gain | | $ | (134 | ) | |
† Accumulated Net Investment Loss for the year ended December 31, 2017 was $(4).
The accompanying notes are an integral part of the financial statements.
13
Morgan Stanley Institutional Fund, Inc.
Annual Report — December 31, 2018
Financial Highlights
International Advantage Portfolio
| | | Class I | |
| | | Year Ended December 31, | |
Selected Per Share Data and Ratios | | 2018 | | 2017 | | 2016(1) | | 2015 | | 2014 | |
Net Asset Value, Beginning of Period | | $ | 16.89 | | | $ | 11.91 | | | $ | 11.80 | | | $ | 12.36 | | | $ | 12.36 | | |
Income (Loss) from Investment Operations: | |
Net Investment Income(2) | | | 0.04 | | | | 0.00 | (3) | | | 0.02 | | | | 0.10 | | | | 0.13 | | |
Net Realized and Unrealized Gain (Loss) | | | (0.91 | ) | | | 5.32 | | | | 0.29 | | | | 1.18 | | | | 0.20 | | |
Total from Investment Operations | | | (0.87 | ) | | | 5.32 | | | | 0.31 | | | | 1.28 | | | | 0.33 | | |
Distributions from and/or in Excess of: | |
Net Investment Income | | | — | | | | — | | | | — | | | | (0.10 | ) | | | (0.07 | ) | |
Net Realized Gain | | | (0.28 | ) | | | (0.34 | ) | | | (0.20 | ) | | | (1.74 | ) | | | (0.26 | ) | |
Total Distributions | | | (0.28 | ) | | | (0.34 | ) | | | (0.20 | ) | | | (1.84 | ) | | | (0.33 | ) | |
Redemption Fees | | | 0.00 | (3) | | | 0.00 | (3) | | | 0.00 | (3) | | | — | | | | 0.00 | (3) | |
Net Asset Value, End of Period | | $ | 15.74 | | | $ | 16.89 | | | $ | 11.91 | | | $ | 11.80 | | | $ | 12.36 | | |
Total Return(4) | | | (5.19 | )% | | | 44.75 | % | | | 2.47 | % | | | 10.23 | % | | | 2.58 | % | |
Ratios and Supplemental Data: | |
Net Assets, End of Period (Thousands) | | $ | 569,408 | | | $ | 166,189 | | | $ | 29,781 | | | $ | 2,361 | | | $ | 3,387 | | |
Ratio of Expenses to Average Net Assets(8) | | | 0.98 | %(5) | | | 0.98 | %(5) | | | 0.99 | %(5) | | | 1.16 | %(5)(6) | | | 1.24 | %(5) | |
Ratio of Net Investment Income to Average Net Assets(8) | | | 0.21 | %(5) | | | 0.02 | %(5) | | | 0.20 | %(5) | | | 0.76 | %(5) | | | 1.05 | %(5) | |
Ratio of Rebate from Morgan Stanley Affiliates to Average Net Assets | | | 0.02 | % | | | 0.02 | % | | | 0.01 | % | | | 0.00 | %(7) | | | 0.01 | % | |
Portfolio Turnover Rate | | | 29 | % | | | 30 | % | | | 23 | % | | | 96 | % | | | 30 | % | |
(8) Supplemental Information on the Ratios to Average Net Assets: | |
Ratios Before Expense Limitation: | |
Expenses to Average Net Assets | | | 1.11 | % | | | 1.21 | % | | | 2.26 | % | | | 4.82 | % | | | 5.47 | % | |
Net Investment Income (Loss) to Average Net Assets | | | 0.08 | % | | | (0.21 | )% | | | (1.07 | )% | | | (2.90 | )% | | | (3.18 | )% | |
(1) Reflects prior period Custodian out-of-pocket expenses that were reimbursed in September 2016. The amount of the reimbursement was immaterial on a per share basis and did not impact the total return of Class I shares. The Ratio of Expenses to Average Net Assets and the Ratio of Net Investment Income to Average Net Assets would be unchanged as the reimbursement of Custodian fees was offset against expense waivers/reimbursements with no impact to net expenses or net investment income.
(2) Per share amount is based on average shares outstanding.
(3) Amount is less than $0.005 per share.
(4) Calculated based on the net asset value as of the last business day of the period.
(5) The Ratios of Expenses and Net Investment Income reflect the rebate of certain Fund expenses in connection with the investments in Morgan Stanley affiliates during the period. The effect of the rebate on the ratios is disclosed in the above table as "Ratio of Rebate from Morgan Stanley Affiliates to Average Net Assets."
(6) Effective July 1, 2015, the Adviser has agreed to limit the ratio of expenses to average net assets to the maximum ratio of 1.00% for Class I shares. Prior to July 1, 2015, the maximum ratio was 1.25% for Class I shares.
(7) Amount is less than 0.005%.
The accompanying notes are an integral part of the financial statements.
14
Morgan Stanley Institutional Fund, Inc.
Annual Report — December 31, 2018
Financial Highlights
International Advantage Portfolio
| | | Class A | |
| | | Year Ended December 31, | |
Selected Per Share Data and Ratios | | 2018 | | 2017 | | 2016(1) | | 2015 | | 2014 | |
Net Asset Value, Beginning of Period | | $ | 16.75 | | | $ | 11.86 | | | $ | 11.79 | | | $ | 12.37 | | | $ | 12.38 | | |
Income (Loss) from Investment Operations: | |
Net Investment Income (Loss)(2) | | | (0.02 | ) | | | (0.07 | ) | | | (0.00 | )(3) | | | 0.01 | | | | 0.09 | | |
Net Realized and Unrealized Gain (Loss) | | | (0.89 | ) | | | 5.30 | | | | 0.27 | | | | 1.23 | | | | 0.19 | | |
Total from Investment Operations | | | (0.91 | ) | | | 5.23 | | | | 0.27 | | | | 1.24 | | | | 0.28 | | |
Distributions from and/or in Excess of: | |
Net Investment Income | | | — | | | | — | | | | — | | | | (0.08 | ) | | | (0.03 | ) | |
Net Realized Gain | | | (0.28 | ) | | | (0.34 | ) | | | (0.20 | ) | | | (1.74 | ) | | | (0.26 | ) | |
Total Distributions | | | (0.28 | ) | | | (0.34 | ) | | | (0.20 | ) | | | (1.82 | ) | | | (0.29 | ) | |
Redemption Fees | | | 0.00 | (3) | | | 0.00 | (3) | | | 0.00 | (3) | | | — | | | | 0.00 | (3) | |
Net Asset Value, End of Period | | $ | 15.56 | | | $ | 16.75 | | | $ | 11.86 | | | $ | 11.79 | | | $ | 12.37 | | |
Total Return(4) | | | (5.48 | )% | | | 44.18 | % | | | 2.13 | % | | | 9.92 | % | | | 2.21 | % | |
Ratios and Supplemental Data: | |
Net Assets, End of Period (Thousands) | | $ | 202,732 | | | $ | 144,112 | | | $ | 10,822 | | | $ | 2,966 | | | $ | 889 | | |
Ratio of Expenses to Average Net Assets(8) | | | 1.33 | %(5) | | | 1.31 | %(5) | | | 1.34 | %(5) | | | 1.46 | %(5)(6) | | | 1.59 | %(5) | |
Ratio of Net Investment Income (Loss) to Average Net Assets(8) | | | (0.10 | )%(5) | | | (0.46 | )%(5) | | | (0.04 | )%(5) | | | 0.09 | %(5) | | | 0.70 | %(5) | |
Ratio of Rebate from Morgan Stanley Affiliates to Average Net Assets | | | 0.02 | % | | | 0.02 | % | | | 0.01 | % | | | 0.00 | %(7) | | | 0.01 | % | |
Portfolio Turnover Rate | | | 29 | % | | | 30 | % | | | 23 | % | | | 96 | % | | | 30 | % | |
(8) Supplemental Information on the Ratios to Average Net Assets: | |
Ratios Before Expense Limitation: | |
Expenses to Average Net Assets | | | 1.37 | % | | | 1.42 | % | | | 2.55 | % | | | 5.77 | % | | | 6.03 | % | |
Net Investment Loss to Average Net Assets | | | (0.14 | )% | | | (0.57 | )% | | | (1.25 | )% | | | (4.22 | )% | | | (3.74 | )% | |
(1) Reflects prior period Custodian out-of-pocket expenses that were reimbursed in September 2016. The amount of the reimbursement was immaterial on a per share basis and did not impact the total return of Class A shares. The Ratio of Expenses to Average Net Assets and the Ratio of Net Investment Loss to Average Net Assets would be unchanged as the reimbursement of Custodian fees was offset against expense waivers/reimbursements with no impact to net expenses or net investment loss.
(2) Per share amount is based on average shares outstanding.
(3) Amount is less than $0.005 per share.
(4) Calculated based on the net asset value which does not reflect sales charges, if applicable, as of the last business day of the period.
(5) The Ratios of Expenses and Net Investment Income (Loss) reflect the rebate of certain Fund expenses in connection with the investments in Morgan Stanley affiliates during the period. The effect of the rebate on the ratios is disclosed in the above table as "Ratio of Rebate from Morgan Stanley Affiliates to Average Net Assets."
(6) Effective July 1, 2015, the Adviser has agreed to limit the ratio of expenses to average net assets to the maximum ratio of 1.35% for Class A shares. Prior to July 1, 2015, the maximum ratio was 1.60% for Class A shares.
(7) Amount is less than 0.005%.
The accompanying notes are an integral part of the financial statements.
15
Morgan Stanley Institutional Fund, Inc.
Annual Report — December 31, 2018
Financial Highlights
International Advantage Portfolio
| | | Class L | |
| | | Year Ended December 31, | |
Selected Per Share Data and Ratios | | 2018 | | 2017 | | 2016(1) | | 2015 | | 2014 | |
Net Asset Value, Beginning of Period | | $ | 16.43 | | | $ | 11.70 | | | $ | 11.69 | | | $ | 12.31 | | | $ | 12.36 | | |
Income (Loss) from Investment Operations: | |
Net Investment Income (Loss)(2) | | | (0.09 | ) | | | (0.11 | ) | | | (0.06 | ) | | | (0.04 | ) | | | 0.02 | | |
Net Realized and Unrealized Gain (Loss) | | | (0.88 | ) | | | 5.18 | | | | 0.27 | | | | 1.20 | | | | 0.20 | | |
Total from Investment Operations | | | (0.97 | ) | | | 5.07 | | | | 0.21 | | | | 1.16 | | | | 0.22 | | |
Distributions from and/or in Excess of: | |
Net Investment Income | | | — | | | | — | | | | — | | | | (0.04 | ) | | | (0.01 | ) | |
Net Realized Gain | | | (0.28 | ) | | | (0.34 | ) | | | (0.20 | ) | | | (1.74 | ) | | | (0.26 | ) | |
Total Distributions | | | (0.28 | ) | | | (0.34 | ) | | | (0.20 | ) | | | (1.78 | ) | | | (0.27 | ) | |
Redemption Fees | | | 0.00 | (3) | | | 0.00 | (3) | | | 0.00 | (3) | | | — | | | | 0.00 | (3) | |
Net Asset Value, End of Period | | $ | 15.18 | | | $ | 16.43 | | | $ | 11.70 | | | $ | 11.69 | | | $ | 12.31 | | |
Total Return(4) | | | (5.95 | )% | | | 43.41 | % | | | 1.64 | % | | | 9.34 | % | | | 1.69 | % | |
Ratios and Supplemental Data: | |
Net Assets, End of Period (Thousands) | | $ | 161 | | | $ | 135 | | | $ | 75 | | | $ | 211 | | | $ | 148 | | |
Ratio of Expenses to Average Net Assets(8) | | | 1.83 | %(5) | | | 1.84 | %(5) | | | 1.84 | %(5) | | | 1.97 | %(5)(6) | | | 2.09 | %(5) | |
Ratio of Net Investment Income (Loss) to Average Net Assets(8) | | | (0.55 | )%(5) | | | (0.77 | )%(5) | | | (0.52 | )%(5) | | | (0.31 | )%(5) | | | 0.20 | %(5) | |
Ratio of Rebate from Morgan Stanley Affiliates to Average Net Assets | | | 0.02 | % | | | 0.01 | % | | | 0.01 | % | | | 0.00 | %(7) | | | 0.01 | % | |
Portfolio Turnover Rate | | | 29 | % | | | 30 | % | | | 23 | % | | | 96 | % | | | 30 | % | |
(8) Supplemental Information on the Ratios to Average Net Assets: | |
Ratios Before Expense Limitation: | |
Expenses to Average Net Assets | | | 2.82 | % | | | 3.82 | % | | | 3.96 | % | | | 6.87 | % | | | 7.42 | % | |
Net Investment Loss to Average Net Assets | | | (1.54 | )% | | | (2.75 | )% | | | (2.64 | )% | | | (5.21 | )% | | | (5.13 | )% | |
(1) Reflects prior period Custodian out-of-pocket expenses that were reimbursed in September 2016. The amount of the reimbursement was immaterial on a per share basis and did not impact the total return of Class L shares. The Ratio of Expenses to Average Net Assets and the Ratio of Net Investment Loss to Average Net Assets would be unchanged as the reimbursement of Custodian fees was offset against expense waivers/reimbursements with no impact to net expenses or net investment loss.
(2) Per share amount is based on average shares outstanding.
(3) Amount is less than $0.005 per share.
(4) Calculated based on the net asset value as of the last business day of the period.
(5) The Ratios of Expenses and Net Investment Income (Loss) reflect the rebate of certain Fund expenses in connection with the investments in Morgan Stanley affiliates during the period. The effect of the rebate on the ratios is disclosed in the above table as "Ratio of Rebate from Morgan Stanley Affiliates to Average Net Assets."
(6) Effective July 1, 2015, the Adviser has agreed to limit the ratio of expenses to average net assets to the maximum ratio of 1.85% for Class L shares. Prior to July 1, 2015, the maximum ratio was 2.10% for Class L shares.
(7) Amount is less than 0.005%.
The accompanying notes are an integral part of the financial statements.
16
Morgan Stanley Institutional Fund, Inc.
Annual Report — December 31, 2018
Financial Highlights
International Advantage Portfolio
| | | Class C | |
| | | Year Ended December 31, | | Period from
April 30, 2015(2) to | |
Selected Per Share Data and Ratios | | 2018 | | 2017 | | 2016(1) | | December 31, 2015 | |
Net Asset Value, Beginning of Period | | $ | 16.30 | | | $ | 11.63 | | | $ | 11.66 | | | $ | 13.80 | | |
Income (Loss) from Investment Operations: | |
Net Investment Loss(3) | | | (0.15 | ) | | | (0.17 | ) | | | (0.11 | ) | | | (0.08 | ) | |
Net Realized and Unrealized Gain (Loss) | | | (0.85 | ) | | | 5.18 | | | | 0.28 | | | | (0.26 | ) | |
Total from Investment Operations | | | (1.00 | ) | | | 5.01 | | | | 0.17 | | | | (0.34 | ) | |
Distributions from and/or in Excess of: | |
Net Investment Income | | | — | | | | — | | | | — | | | | (0.06 | ) | |
Net Realized Gain | | | (0.28 | ) | | | (0.34 | ) | | | (0.20 | ) | | | (1.74 | ) | |
Total Distributions | | | (0.28 | ) | | | (0.34 | ) | | | (0.20 | ) | | | (1.80 | ) | |
Redemption Fees | | | 0.00 | (4) | | | 0.00 | (4) | | | 0.00 | (4) | | | — | | |
Net Asset Value, End of Period | | $ | 15.02 | | | $ | 16.30 | | | $ | 11.63 | | | $ | 11.66 | | |
Total Return(5) | | | (6.18 | )% | | | 43.16 | % | | | 1.38 | % | | | (2.63 | )%(9) | |
Ratios and Supplemental Data: | |
Net Assets, End of Period (Thousands) | | $ | 11,087 | | | $ | 6,760 | | | $ | 1,067 | | | $ | 247 | | |
Ratio of Expenses to Average Net Assets(11) | | | 2.07 | %(6) | | | 2.08 | %(6) | | | 2.09 | %(6) | | | 2.11 | %(6)(7)(10) | |
Ratio of Net Investment Loss to Average Net Assets(11) | | | (0.88 | )%(6) | | | (1.12 | )%(6) | | | (0.91 | )%(6) | | | (0.94 | )%(6)(10) | |
Ratio of Rebate from Morgan Stanley Affiliates to Average Net Assets | | | 0.02 | % | | | 0.02 | % | | | 0.01 | % | | | 0.00 | %(8)(10) | |
Portfolio Turnover Rate | | | 29 | % | | | 30 | % | | | 23 | % | | | 96 | % | |
(11) Supplemental Information on the Ratios to Average Net Assets: | |
Ratios Before Expense Limitation: | |
Expenses to Average Net Assets | | | 2.10 | % | | | 2.25 | % | | | 3.60 | % | | | 9.11 | %(10) | |
Net Investment Loss to Average Net Assets | | | (0.91 | )% | | | (1.29 | )% | | | (2.42 | )% | | | (7.94 | )%(10) | |
(1) Reflects prior period Custodian out-of-pocket expenses that were reimbursed in September 2016. The amount of the reimbursement was immaterial on a per share basis and did not impact the total return of Class C shares. The Ratio of Expenses to Average Net Assets and the Ratio of Net Investment Loss to Average Net Assets would be unchanged as the reimbursement of Custodian fees was offset against expense waivers/reimbursements with no impact to net expenses or net investment loss.
(2) Commencement of Offering.
(3) Per share amount is based on average shares outstanding.
(4) Amount is less than $0.005 per share.
(5) Calculated based on the net asset value which does not reflect sales charges, if applicable, as of the last business day of the period.
(6) The Ratios of Expenses and Net Investment Loss reflect the rebate of certain Fund expenses in connection with the investments in Morgan Stanley affiliates during the period. The effect of the rebate on the ratios is disclosed in the above table as "Ratio of Rebate from Morgan Stanley Affiliates to Average Net Assets."
(7) Effective July 1, 2015, the Adviser has agreed to limit the ratio of expenses to average net assets to the maximum ratio of 2.10% for Class C shares. Prior to July 1, 2015, the maximum ratio was 2.35% for Class C shares.
(8) Amount is less than 0.005%.
(9) Not annualized.
(10) Annualized.
The accompanying notes are an integral part of the financial statements.
17
Morgan Stanley Institutional Fund, Inc.
Annual Report — December 31, 2018
Financial Highlights
International Advantage Portfolio
| | | Class IS | |
Selected Per Share Data and Ratios | | Period from
June 15, 2018(1) to
December 31, 2018 | |
Net Asset Value, Beginning of Period | | $ | 18.90 | | |
Loss from Investment Operations: | |
Net Investment Loss(2) | | | (0.00 | )(3) | |
Net Realized and Unrealized Loss | | | (2.87 | ) | |
Total from Investment Operations | | | (2.87 | ) | |
Distributions from and/or in Excess of: | |
Net Realized Gain | | | (0.28 | ) | |
Redemption Fees | | | 0.00 | (3) | |
Net Asset Value, End of Period | | $ | 15.75 | | |
Total Return(4) | | | (15.22 | )%(6) | |
Ratios and Supplemental Data: | |
Net Assets, End of Period (Thousands) | | $ | 8 | | |
Ratio of Expenses to Average Net Assets(8) | | | 0.93 | %(5)(7) | |
Ratio of Net Investment Loss to Average Net Assets(8) | | | (0.04 | )%(5)(7) | |
Ratio of Rebate from Morgan Stanley Affiliates to Average Net Assets | | | 0.02 | %(7) | |
Portfolio Turnover Rate | | | 29 | % | |
(8) Supplemental Information on the Ratios to Average Net Assets: | |
Ratios Before Expense Limitation: | |
Expenses to Average Net Assets | | | 19.51 | %(7) | |
Net Investment Loss to Average Net Assets | | | (18.62 | )%(7) | |
(1) Commencement of Offering.
(2) Per share amount is based on average shares outstanding.
(3) Amount is less than $0.005 per share.
(4) Calculated based on the net asset value as of the last business day of the period.
(5) The Ratios of Expenses and Net Investment Loss reflect the rebate of certain Fund expenses in connection with the investments in Morgan Stanley affiliates during the period. The effect of the rebate on the ratios is disclosed in the above table as "Ratio of Rebate from Morgan Stanley Affiliates to Average Net Assets."
(6) Not annualized.
(7) Annualized.
The accompanying notes are an integral part of the financial statements.
18
Morgan Stanley Institutional Fund, Inc.
Annual Report — December 31, 2018
Notes to Financial Statements
Morgan Stanley Institutional Fund, Inc. (the "Company") is registered under the Investment Company Act of 1940, as amended (the "Act"), as an open-end management investment company. The Company is comprised of thirty separate, active, diversified and non-diversified funds (individually referred to as a "Fund", collectively as the "Funds"). The Company applies investment company accounting and reporting guidance.
The accompanying financial statements relate to the International Advantage Portfolio. The Fund seeks long-term capital appreciation.
The Fund offers five classes of shares — Class I, Class A, Class L, Class C and Class IS. On April 30, 2015, the Fund suspended offering of Class L shares. Existing Class L shareholders may invest through reinvestment of dividends and distributions. On June 15, 2018, the Fund commenced offering Class IS shares.
A. Significant Accounting Policies: The following significant accounting policies are in conformity with U.S. generally accepted accounting principles ("GAAP"). Such policies are consistently followed by the Company in the preparation of its financial statements. GAAP may require management to make estimates and assumptions that affect the reported amounts and disclosures in the financial statements. Actual results may differ from those estimates.
In August 2018, the Financial Accounting Standards Board ("FASB") issued Accounting Standards Update ("ASU") 2018-13, Fair Value Measurement (Topic 820) — Disclosures Framework — Changes to Disclosure Requirements of Fair Value Measurement ("ASU 2018-13") which introduces new fair value disclosure requirements as well as eliminates and modifies certain existing fair value disclosure requirements. ASU 2018-13 would be effective for fiscal years beginning after December 15, 2019 and for interim periods within those fiscal years; however, management has elected to early adopt ASU 2018-13 effective with the current reporting period as permitted by the standard. The impact of the Fund's adoption was limited to changes in the Fund's financial statement disclosures regarding fair value, primarily those disclosures related to transfers between levels of the fair value hierarchy and disclosure of the range and weighted average used to develop significant unobservable inputs for Level 3 fair value measurements, when applicable.
1. Security Valuation: (1) An equity portfolio security listed or traded on an exchange is valued at its latest reported sales price (or at the exchange official closing
price if such exchange reports an official closing price), and if there were no sales on a given day and if there is no official exchange closing price for that day, the security is valued at the mean between the last reported bid and asked prices if such bid and asked prices are available on the relevant exchanges. Listed equity securities not traded on the valuation date with no reported bid and asked prices available on the exchange are valued at the mean between the current bid and asked prices obtained from one or more reputable brokers or dealers. In cases where a security is traded on more than one exchange, the security is valued on the exchange designated as the primary market; (2) all other equity portfolio securities for which over-the-counter ("OTC") market quotations are readily available are valued at the latest reported sales price (or at the market official closing price if such market reports an official closing price), and if there was no trading in the security on a given day and if there is no official closing price from relevant markets for that day, the security is valued at the mean between the last reported bid and asked prices if such bid and asked prices are available on the relevant markets. An unlisted equity security that does not trade on the valuation date and for which bid and asked prices from the relevant markets are unavailable is valued at the mean between the current bid and asked prices obtained from one or more reputable brokers or dealers; (3) certain portfolio securities may be valued by an outside pricing service/vendor approved by the Company's Board of Directors (the "Directors"). The pricing service/vendor may employ a pricing model that takes into account, among other things, bids, yield spreads and/or other market data and specific security characteristics. Alternatively, if a valuation is not available from an outside pricing service/vendor, and the security trades on an exchange, the security may be valued at its latest reported sale price (or at the exchange official closing price if such exchange reports an official closing price), prior to the time when assets are valued. If there are no sales on a given day and if there is no official exchange closing price for that day, the security is valued at the mean between the last reported bid and asked prices if such bid and asked prices are available in the relevant exchanges; (4) listed options are valued at the last reported sales price on the exchange on which they are listed (or at the exchange official closing price if such exchange reports an official closing price). If an official closing price or last reported sales price is unavailable, the listed option should be fair valued at the mean between its
19
Morgan Stanley Institutional Fund, Inc.
Annual Report — December 31, 2018
Notes to Financial Statements (cont'd)
latest bid and ask prices. Unlisted options are valued at the mean between their latest bid and ask prices from a broker/dealer or valued by a pricing service/vendor; (5) when market quotations are not readily available, including circumstances under which Morgan Stanley Investment Management Inc. (the "Adviser") determines that the closing price, last sale price or the mean between the last reported bid and asked prices are not reflective of a security's market value, portfolio securities are valued at their fair value as determined in good faith under procedures established by and under the general supervision of the Directors. Occasionally, developments affecting the closing prices of securities and other assets may occur between the times at which valuations of such securities are determined (that is, close of the foreign market on which the securities trade) and the close of business of the New York Stock Exchange ("NYSE"). If developments occur during such periods that are expected to materially affect the value of such securities, such valuations may be adjusted to reflect the estimated fair value of such securities as of the close of the NYSE, as determined in good faith by the Directors or by the Adviser using a pricing service and/or procedures approved by the Directors; (6) quotations of foreign portfolio securities, other assets and liabilities and forward contracts stated in foreign currency are translated into U.S. dollar equivalents at the prevailing market rates prior to the close of the NYSE; and (7) investments in mutual funds, including the Morgan Stanley Institutional Liquidity Funds, are valued at the net asset value ("NAV") as of the close of each business day.
The Directors have responsibility for determining in good faith the fair value of the investments, and the Directors may appoint others, such as the Company's Adviser or a valuation committee, to assist the Directors in determining fair value and to make the actual calculations pursuant to the fair valuation methodologies previously approved by the Directors. Under procedures approved by the Directors, the Company's Adviser has formed a Valuation Committee whose members are approved by the Directors. The Valuation Committee provides administration and oversight of the Company's valuation policies and procedures, which are reviewed at least annually by the Directors. These procedures allow the Company to utilize independent pricing services, quotations from securities and financial instrument dealers and other market sources to determine fair value.
2. Fair Value Measurement: FASB Accounting Standards CodificationTM ("ASC") 820, "Fair Value Measurement" ("ASC 820"), defines fair value as the value that the Fund would receive to sell an investment or pay to transfer a liability in a timely transaction with an independent buyer in the principal market, or in the absence of a principal market, the most advantageous market for the investment or liability. ASC 820 establishes a three-tier hierarchy to distinguish between (1) inputs that reflect the assumptions market participants would use in valuing an asset or liability developed based on market data obtained from sources independent of the reporting entity (observable inputs) and (2) inputs that reflect the reporting entity's own assumptions about the assumptions market participants would use in valuing an asset or liability developed based on the best information available in the circumstances (unobservable inputs) and to establish classification of fair value measurements for disclosure purposes. Various inputs are used in determining the value of the Fund's investments. The inputs are summarized in the three broad levels listed below:
• Level 1 – unadjusted quoted prices in active markets for identical investments
• Level 2 – other significant observable inputs (including quoted prices for similar investments, interest rates, prepayment speeds, credit risk, etc.)
• Level 3 – significant unobservable inputs including the Fund's own assumptions in determining the fair value of investments. Factors considered in making this determination may include, but are not limited to, information obtained by contacting the issuer, analysts, or the appropriate stock exchange (for exchange-traded securities), analysis of the issuer's financial statements or other available documents and, if necessary, available information concerning other securities in similar circumstances
The inputs or methodology used for valuing securities are not necessarily an indication of the risk associated with investing in those securities and the determination of the significance of a particular input to the fair value measurement in its entirety requires judgment and considers factors specific to each security.
20
Morgan Stanley Institutional Fund, Inc.
Annual Report — December 31, 2018
Notes to Financial Statements (cont'd)
The following is a summary of the inputs used to value the Fund's investments as of December 31, 2018:
Investment Type | | Level 1
Unadjusted
quoted
prices
(000) | | Level 2
Other
significant
observable
inputs
(000) | | Level 3
Significant
unobservable
inputs
(000) | | Total
(000) | |
Assets: | |
Common Stocks | |
Banks | | $ | — | | | $ | 33,205 | | | $ | — | | | $ | 33,205 | | |
Beverages | | | — | | | | 60,207 | | | | — | | | | 60,207 | | |
Biotechnology | | | — | | | | 20,786 | | | | — | | | | 20,786 | | |
Capital Markets | | | 16,948 | | | | — | | | | — | | | | 16,948 | | |
Chemicals | | | — | | | | 25,839 | | | | — | | | | 25,839 | | |
Diversified Consumer
Services | | | 22,072 | | | | — | | | | — | | | | 22,072 | | |
Electronic Equipment,
Instruments &
Components | | | — | | | | 35,480 | | | | — | | | | 35,480 | | |
Food Products | | | — | | | | 88,975 | | | | — | | | | 88,975 | | |
Health Care Equipment &
Supplies | | | — | | | | 11,058 | | | | — | | | | 11,058 | | |
Hotels, Restaurants &
Leisure | | | — | | | | 6,798 | | | | — | | | | 6,798 | | |
Household Products | | | — | | | | 54,411 | | | | — | | | | 54,411 | | |
Information Technology
Services | | | 35,224 | | | | — | | | | — | | | | 35,224 | | |
Insurance | | | — | | | | 21,124 | | | | — | | | | 21,124 | | |
Interactive Media &
Services | | | — | | | | 34,560 | | | | — | | | | 34,560 | | |
Internet & Direct
Marketing Retail | | | 32,445 | | | | — | | | | — | | | | 32,445 | | |
Machinery | | | — | | | | 7,680 | | | | — | | | | 7,680 | | |
Marine | | | — | | | | 15,287 | | | | — | | | | 15,287 | | |
Multi-Utilities | | | 22,004 | | | | — | | | | — | | | | 22,004 | | |
Road & Rail | | | — | | | | 43,314 | | | | — | | | | 43,314 | | |
Software | | | 15,051 | | | | — | | | | — | | | | 15,051 | | |
Textiles, Apparel &
Luxury Goods | | | — | | | | 86,635 | | | | — | | | | 86,635 | | |
Total Common Stocks | | | 143,744 | | | | 545,359 | | | | — | | | | 689,103 | | |
Call Options Purchased | | | | | 297 | | | | | | 297 | | |
Short-Term Investment | |
Investment Company | | | 109,356 | | | | — | | | | — | | | | 109,356 | | |
Total Assets | | $ | 253,100 | | | $ | 545,656 | | | $ | — | | | $ | 798,756 | | |
Transfers between investment levels may occur as the markets fluctuate and/or the availability of data used in an investment's valuation changes.
3. Foreign Currency Translation and Foreign Investments: The books and records of the Fund are maintained in U.S. dollars. Foreign currency amounts are translated into U.S. dollars as follows:
– investments, other assets and liabilities at the prevailing rate of exchange on the valuation date;
– investment transactions and investment income at the prevailing rates of exchange on the dates of such transactions.
Although the net assets of the Fund are presented at the foreign exchange rates and market values at the close of the period, the Fund does not isolate that portion of the results of operations arising as a result of changes in the foreign exchange rates from the fluctuations arising from changes in the market prices of securities held at period end. Similarly, the Fund does not isolate the effect of changes in foreign exchange rates from the fluctuations arising from changes in the market prices of securities sold during the period. Accordingly, realized and unrealized foreign currency gains (losses) on investments in securities are included in the reported net realized and unrealized gains (losses) on investment transactions and balances. However, pursuant to U.S. federal income tax regulations, gains and losses from certain foreign currency transactions and the foreign currency portion of gains and losses realized on sales and maturities of foreign denominated debt securities are treated as ordinary income for U.S. federal income tax purposes.
Net realized gains (losses) on foreign currency transactions represent net foreign exchange gains (losses) from foreign currency forward exchange contracts, disposition of foreign currencies, currency gains (losses) realized between the trade and settlement dates on securities transactions, and the difference between the amount of investment income and foreign withholding taxes recorded on the Fund's books and the U.S. dollar equivalent amounts actually received or paid. Net unrealized currency gains (losses) from valuing foreign currency denominated assets and liabilities at period end exchange rates are reflected as a component of unrealized appreciation (depreciation) in the Statement of Assets and Liabilities. The change in unrealized currency gains (losses) on foreign currency translations for the period is reflected in the Statement of Operations.
Foreign security and currency transactions may involve certain considerations and risks not typically associated with those of U.S. dollar denominated transactions as a result of, among other factors, fluctuations of exchange rates in relation to the U.S. dollar, the possibility of lower levels of governmental supervision and regulation of foreign securities markets and the possibility of political or economic instability.
Governmental approval for foreign investments may be required in advance of making an investment under
21
Morgan Stanley Institutional Fund, Inc.
Annual Report — December 31, 2018
Notes to Financial Statements (cont'd)
certain circumstances in some countries, and the extent of foreign investments in domestic companies may be subject to limitation in other countries. Foreign ownership limitations also may be imposed by the charters of individual companies to prevent, among other concerns, violations of foreign investment limitations. As a result, an additional class of shares (identified as "Foreign" in the Portfolio of Investments) may be created and offered for investment. The "local" and "foreign shares" market values may differ. In the absence of trading of the foreign shares in such markets, the Fund values the foreign shares at the closing exchange price of the local shares.
4. Derivatives: The Fund may, but is not required to, use derivative instruments for a variety of purposes, including hedging, risk management, portfolio management or to earn income. Derivatives are financial instruments whose value is based, in part, on the value of an underlying asset, interest rate, index or financial instrument. Prevailing interest rates and volatility levels, among other things, also affect the value of derivative instruments. A derivative instrument often has risks similar to its underlying asset and may have additional risks, including imperfect correlation between the value of the derivative and the underlying asset, risks of default by the counterparty to certain transactions, magnification of losses incurred due to changes in the market value of the securities, instruments, indices or interest rates to which the derivative instrument relates, risks that the transactions may not be liquid and risks arising from margin requirements. The use of derivatives involves risks that are different from, and possibly greater than, the risks associated with other portfolio investments. Derivatives may involve the use of highly specialized instruments that require investment techniques and risk analyses different from those associated with other portfolio investments. All of the Fund's holdings, including derivative instruments, are marked-to-market each day with the change in value reflected in unrealized appreciation (depreciation). Upon disposition, a realized gain or loss is recognized.
Certain derivative transactions may give rise to a form of leverage. Leverage magnifies the potential for gain and the risk of loss. Leverage associated with derivative transactions may cause the Fund to liquidate portfolio positions when it may not be advantageous to do so to satisfy its obligations or to meet earmarking or segregation requirements, pursuant to applicable Securities and Exchange Commission ("SEC") rules and regulations, or
may cause the Fund to be more volatile than if the Fund had not been leveraged. Although the Adviser seeks to use derivatives to further the Fund's investment objectives, there is no assurance that the use of derivatives will achieve this result.
Following is a description of the derivative instruments and techniques that the Fund used during the period and their associated risks:
Options: With respect to options, the Fund is subject to equity risk, interest rate risk and foreign currency exchange risk in the normal course of pursuing its investment objectives. If the Fund buys an option, it buys a legal contract giving it the right to buy or sell a specific amount of the underlying instrument or foreign currency, or futures contract on the underlying instrument or foreign currency, at an agreed-upon price during a period of time or on a specified date typically in exchange for a premium paid by the Fund. The Fund may purchase and/or sell put and call options. Purchasing call options tends to increase the Fund's exposure to the underlying (or similar) instrument. Purchasing put options tends to decrease the Fund's exposure to the underlying (or similar) instrument. When entering into purchased option contracts, the Fund bears the risk of interest or exchange rates or securities prices moving unexpectedly, in which case, the Fund may not achieve the anticipated benefits of the purchased option contracts; however the risk of loss is limited to the premium paid. Purchased options are reported as part of "Total Investments in Securities" in the Statement of Assets and Liabilities. Premiums paid for purchasing options which expired are treated as realized losses. If the Fund sells an option, it sells to another party the right to buy from or sell to the Fund a specific amount of the underlying instrument or foreign currency, or futures contract on the underlying instrument or foreign currency, at an agreed-upon price during a period of time or on a specified date typically in exchange for a premium received by the Fund. When options are purchased OTC, the Fund bears the risk that the counterparty that wrote the option will be unable or unwilling to perform its obligations under the option contract. Options may also be illiquid and the Fund may have difficulty closing out its position. A decision as to whether, when and how to use options involves the exercise of skill and judgment and even a well-conceived option transaction may be unsuccessful because of market behavior or unexpected events.
22
Morgan Stanley Institutional Fund, Inc.
Annual Report — December 31, 2018
Notes to Financial Statements (cont'd)
The prices of options can be highly volatile and the use of options can lower total returns.
FASB ASC 815, "Derivatives and Hedging" ("ASC 815"), is intended to improve financial reporting about derivative instruments by requiring enhanced disclosures to enable investors to better understand how and why the Fund uses derivative instruments, how these derivative instruments are accounted for and their effects on the Fund's financial position and results of operations.
The following table sets forth the fair value of the Fund's derivative contracts by primary risk exposure as of December 31, 2018:
| | | Asset Derivatives
Statement of Assets and
Liabilities Location | | Primary Risk
Exposure | | Value
(000) | |
Purchased Options
| | Investments, at Value
(Purchased Options) | | Currency Risk | | $ | 297 | (a) | |
(a) Amounts are included in Investments in Securities in the Statement of Assets and Liabilities.
The following tables set forth by primary risk exposure the Fund's change in unrealized appreciation (depreciation) by type of derivative contract for the year ended December 31, 2018 in accordance with ASC 815:
Realized Gain (Loss) | |
Primary Risk Exposure | | Derivative Type | | Value
(000) | |
Currency Risk | | Investments
(Purchased Options) | | $ | (453 | )(b) | |
(b) Amounts are included in Investments Sold in the Statement of Operations.
Change in Unrealized Appreciation (Depreciation) | |
Primary Risk Exposure | | Derivative Type | | Value
(000) | |
Currency Risk | | Investments
(Purchased Options) | | $ | (713 | )(c) | |
(c) Amounts are included in Investments in the Statement of Operations.
At December 31, 2018, the Fund's derivative assets and liabilities are as follows:
Presented in the Statement of Assets and Liabilities | | Gross Amounts of Assets and Liabilities | |
Derivatives | | Assets(d)
(000) | | Liabilities(d)
(000) | |
Purchased Options | | $ | 297 | (a) | | $ | — | | |
(a) Amounts are included in Investments in Securities in the Statement of Assets and Liabilities.
(d) Absent an event of default or early termination, OTC derivative assets and liabilities are presented gross and not offset in the Statement of Assets and Liabilities.
The Fund typically enters into International Swaps and Derivatives Association, Inc. Master Agreements ("ISDA
Master Agreements") or similar master agreements (collectively, "Master Agreements") with its contract counterparties for certain OTC derivatives in order to, among other things, reduce its credit risk to counterparties. ISDA Master Agreements include provisions for general obligations, representations, collateral and events of default or termination. Under an ISDA Master Agreement, the Fund typically may offset with the counterparty certain OTC derivative financial instruments' payables and/or receivables with collateral held and/or posted and create one single net payment (close-out netting) in the event of default, termination and/or potential deterioration in the credit quality of the counterparty. Various Master Agreements govern the terms of certain transactions with counterparties, including transactions such as swap, forward, repurchase and reverse repurchase agreements. These Master Agreements typically attempt to reduce the counterparty risk associated with such transactions by specifying credit protection mechanisms and providing standardization that improves legal certainty. Cross-termination provisions under Master Agreements typically provide that a default in connection with one transaction between the Fund and a counterparty gives the non-defaulting party the right to terminate any other transactions in place with the defaulting party to create one single net payment due to/due from the defaulting party and may be a feature in certain Master Agreements. In the event the Fund exercises its right to terminate a Master Agreement after a counterparty experiences a termination event as defined in the Master Agreement, the return of collateral with market value in excess of the Fund's net liability may be delayed or denied.
The following table presents derivative financial instruments that are subject to enforceable netting arrangements as of December 31, 2018:
Gross Amounts Not Offset in the Statement of Assets and Liabilities | |
Counterparty | | Gross Asset
Derivatives
Presented in
the Statement
of Assets and
Liabilities
(000) | | Financial
Instrument
(000) | | Collateral
Received(e)
(000) | | Net Amount
(not less
than $0)
(000) | |
Royal Bank of Scotland | | $ | 297 | (a) | | $ | — | | | $ | (297 | ) | | $ | 0 | | |
(a) Amounts are included in Investments in Securities in the Statement of Assets and Liabilities.
(e) In some instances, the actual collateral received may be more than the amount shown here due to overcollateralization.
23
Morgan Stanley Institutional Fund, Inc.
Annual Report — December 31, 2018
Notes to Financial Statements (cont'd)
For the year ended December 31, 2018, the approximate average monthly amount outstanding for each derivative type is as follows:
Purchased Options: | |
Average monthly notional amount | | | 222,961,000 | | |
5. Securities Lending: The Fund lends securities to qualified financial institutions, such as broker-dealers, to earn additional income. Any increase or decrease in the fair value of the securities loaned that might occur and any interest earned or dividends declared on those securities during the term of the loan would remain in the Fund. The Fund would receive cash or securities as collateral in an amount equal to or exceeding 100% of the current fair value of the loaned securities. The collateral is marked-to-market daily by State Street Bank and Trust Company ("State Street"), the securities lending agent, to ensure that a minimum of 100% collateral coverage is maintained.
Based on pre-established guidelines, the securities lending agent invests any cash collateral that is received in an affiliated money market portfolio and repurchase agreements. Securities lending income is generated from the earnings on the invested collateral and borrowing fees, less any rebates owed to the borrowers and compensation to the lending agent, and is recorded as "Income from Securities Loaned — Net" in the Fund's Statement of Operations. Risks in securities lending transactions are that a borrower may not provide additional collateral when required or return the securities when due, and that the value of the short-term investments will be less than the amount of cash collateral plus any rebate that is required to be returned to the borrower.
The Fund has the right under the securities lending agreement to recover the securities from the borrower on demand.
At December 31, 2018, the Fund did not have any outstanding securities on loan.
6. Redemption Fees: The Fund will assess a 2% redemption fee on Class I shares, Class A shares, Class L shares, Class C shares, Class IS shares and Class IR shares, which is paid directly to the Fund, for shares redeemed or exchanged within thirty days of purchase, subject to certain exceptions. The redemption fee is designed to protect the Fund and its remaining shareholders from the effects of short-term trading. These fees, if any, are included in the Statements of Changes in Net Assets.
7. Indemnifications: The Company enters into contracts that contain a variety of indemnifications. The Company's maximum exposure under these arrangements is unknown. However, the Company has not had prior claims or losses pursuant to these contracts and expects the risk of loss to be remote.
8. Dividends and Distributions to Shareholders: Dividends and distributions to shareholders are recorded on the ex-dividend date. Dividends from net investment income, if any, are declared and paid annually. Net realized capital gains, if any, are distributed at least annually.
9. Security Transactions, Income and Expenses: Security transactions are accounted for on the trade date (date the order to buy or sell is executed). Realized gains and losses on the sale of investment securities are determined on the specific identified cost method. Dividend income and other distributions are recorded on the ex-dividend date (except for certain foreign dividends which may be recorded as soon as the Fund is informed of such dividends) net of applicable withholding taxes. Non-cash dividends received in the form of stock, if any, are recognized on the ex-dividend date and recorded as non-cash dividend income at fair value. Interest income is recognized on the accrual basis except where collection is in doubt. Discounts are accreted and premiums are amortized over the life of the respective securities. Most expenses of the Company can be directly attributed to a particular Fund. Expenses which cannot be directly attributed are apportioned among the Funds based upon relative net assets or other appropriate methods. Income, expenses (other than class specific expenses — distribution and shareholder services, transfer agency and sub transfer agency fees) and realized and unrealized gains or losses are allocated to each class of shares based upon their relative net assets.
B. Advisory Fees: The Adviser, a wholly-owned subsidiary of Morgan Stanley, provides the Fund with advisory services under the terms of an Investment Advisory Agreement, paid quarterly, at the annual rate based on the daily net assets as follows:
First $1
billion | | Over $1
billion | |
| | 0.80 | % | | | 0.75 | % | |
For the year ended December 31, 2018, the advisory fee rate (net of waiver/rebate) was equivalent to an annual effective rate of 0.77% of the Fund's average daily net assets.
24
Morgan Stanley Institutional Fund, Inc.
Annual Report — December 31, 2018
Notes to Financial Statements (cont'd)
The Adviser has agreed to reduce its advisory fee and/or reimburse the Fund so that total annual fund operating expenses, excluding certain investment related expenses, taxes, interest and other extraordinary expenses (including litigation), will not exceed 1.00% for Class I shares, 1.35% for Class A shares, 1.85% for Class L shares, 2.10% for Class C shares and 0.95% for Class IS shares. The fee waivers and/or expense reimbursements will continue for at least one year from the date of the Fund's prospectus or until such time as the Directors act to discontinue all or a portion of such waivers and/or reimbursements when they deem such action is appropriate. For the year ended December 31, 2018, approximately $81,000 of advisory fees were waived and approximately $274,000 of other expenses were reimbursed by the Adviser pursuant to this arrangement.
C. Administration Fees: The Adviser also serves as Administrator to the Company and provides administrative services pursuant to an Administration Agreement for an annual fee, accrued daily and paid monthly, of 0.08% of the Fund's average daily net assets.
Under a Sub-Administration Agreement between the Administrator and State Street, State Street provides certain administrative services to the Company. For such services, the Administrator pays State Street a portion of the fee the Administrator receives from the Fund.
D. Distribution and Shareholder Services Fees: Morgan Stanley Distribution, Inc. ("MSDI" or the "Distributor"), a wholly-owned subsidiary of the Adviser and an indirect subsidiary of Morgan Stanley, serves as the Company's Distributor of Fund shares pursuant to a Distribution Agreement. The Company has adopted a Shareholder Services Plan with respect to Class A shares pursuant to Rule 12b-1 under the Act. Under the Shareholder Services Plan, the Fund pays the Distributor a shareholder services fee, accrued daily and paid monthly, at an annual rate of 0.25% of the Fund's average daily net assets attributable to Class A shares.
The Company has adopted a Distribution and Shareholder Services Plan with respect to Class L shares pursuant to Rule 12b-1 under the Act. Under the Distribution and Shareholder Services Plan, the Fund pays the Distributor a distribution fee, accrued daily and paid monthly, at an annual rate of 0.50% and a shareholder services fee, accrued daily and paid monthly, at an annual rate of 0.25% of the Fund's average daily net assets attributable to Class L shares.
The Company has adopted a Distribution and Shareholder Services Plan with respect to Class C shares pursuant to Rule 12b-1 under the Act. Under the Distribution and Shareholder Services Plan, the Fund pays the Distributor a distribution fee, accrued daily and paid monthly, at an annual rate of 0.75% and a shareholder services fee, accrued daily and paid monthly, at an annual rate of 0.25% of the Fund's average daily net assets attributable to Class C shares.
The distribution and shareholder services fees are used to support the expenses associated with servicing and maintaining accounts. The Distributor may compensate other parties for providing shareholder support services to investors who purchase Class A, Class L and Class C shares.
E. Dividend Disbursing and Transfer Agent: The Company's dividend disbursing and transfer agent is DST Asset Manager Solutions, Inc. ("DST"). Pursuant to a Transfer Agency Agreement, the Company pays DST a fee based on the number of classes, accounts and transactions relating to the Funds of the Company.
F. Custodian Fees: State Street (the "Custodian") also serves as Custodian for the Company in accordance with a Custodian Agreement. The Custodian holds cash, securities and other assets of the Company as required by the Act. Custody fees are payable monthly based on assets held in custody, investment purchases and sales activity and account maintenance fees, plus reimbursement for certain out-of-pocket expenses.
G. Security Transactions and Transactions with Affiliates: For the year ended December 31, 2018, purchases and sales of investment securities for the Fund, other than long-term U.S. Government securities and short-term investments, were approximately $581,968,000 and $128,570,000, respectively. There were no purchases and sales of long-term U.S. Government securities for the year ended December 31, 2018.
The Fund invests in the Institutional Class of the Morgan Stanley Institutional Liquidity Funds — Treasury Securities Portfolio (the "Liquidity Funds"), an open-end management investment company managed by the Adviser, both directly and as a portion of the securities held as collateral on loaned securities. Advisory fees paid by the Fund are reduced by an amount equal to its pro-rata share of the advisory and administration fees paid by the Fund due to its investment in the Liquidity Funds. For the year ended December 31, 2018, advisory
25
Morgan Stanley Institutional Fund, Inc.
Annual Report — December 31, 2018
Notes to Financial Statements (cont'd)
fees paid were reduced by approximately $83,000 relating to the Fund's investment in the Liquidity Funds.
A summary of the Fund's transactions in shares of affiliated investments during the year ended December 31, 2018 is as follows:
Affiliated
Investment
Company | | Value
December 31,
2017
(000) | | Purchases
at Cost
(000) | | Proceeds
from Sales
(000) | | Dividend
Income
(000) | |
Liquidity Funds | | $ | 26,761 | | | $ | 347,617 | | | $ | 265,022 | | | $ | 788 | | |
Affiliated
Investment
Company (cont'd) | | Realized
Gain (Loss)
(000) | | Change in
Unrealized
Appreciation
(Depreciation)
(000) | | Value
December 31,
2018
(000) | |
Liquidity Funds | | $ | — | | | $ | — | | | $ | 109,356 | | |
During the year ended December 31, 2018, the Fund incurred less than $500 in brokerage commissions with Morgan Stanley & Co. LLC, an affiliate of the Adviser/Administrator and Distributor, for portfolio transactions executed on behalf of the Fund.
The Fund is permitted to purchase and sell securities ("cross-trade") from and to other Morgan Stanley funds as well as other funds and client accounts for which the Adviser or an affiliate of the Adviser serves as investment adviser, pursuant to procedures approved by the Directors in compliance with Rule 17a-7 under the Act (the "Rule"). Each cross-trade is executed at the current market price in compliance with provisions of the Rule. For the year ended December 31, 2018, the Fund did not engage in any cross-trade transactions.
The Fund has an unfunded Deferred Compensation Plan (the "Compensation Plan"), which allows each independent Director to defer payment of all, or a portion, of the fees he or she receives for serving on the Board of Directors. Each eligible Director generally may elect to have the deferred amounts credited with a return equal to the total return on one or more of the Morgan Stanley funds that are offered as investment options under the Compensation Plan. Appreciation/depreciation and distributions received from these investments are recorded with an offsetting increase/decrease in the deferred compensation obligation and do not affect the NAV of the Fund.
H. Federal Income Taxes: It is the Fund's intention to continue to qualify as a regulated investment company and distribute all of its taxable and tax-exempt income. Accordingly, no provision for Federal income taxes is required in the financial statements.
The Fund may be subject to taxes imposed by countries in which it invests. Such taxes are generally based on income
and/or capital gains earned or repatriated. Taxes are accrued based on net investment income, net realized gains and net unrealized appreciation as such income and/or gains are earned. Taxes may also be based on transactions in foreign currency and are accrued based on the value of investments denominated in such currency.
FASB ASC 740-10, "Income Taxes — Overall", sets forth a minimum threshold for financial statement recognition of the benefit of a tax position taken or expected to be taken in a tax return. Management has concluded there are no significant uncertain tax positions that would require recognition in the financial statements. If applicable, the Fund recognizes interest accrued related to unrecognized tax benefits in "Interest Expense" and penalties in "Other Expenses" in the Statement of Operations. The Fund files tax returns with the U.S. Internal Revenue Service, New York and various states. Generally, each of the tax years in the four-year period ended December 31, 2018 remains subject to examination by taxing authorities.
The tax character of distributions paid may differ from the character of distributions for GAAP purposes due to short-term capital gains being treated as ordinary income for tax purposes. The tax character of distributions paid during fiscal 2018 and 2017 was as follows:
2018
Distributions
Paid From: | | 2017
Distributions
Paid From: | |
Ordinary
Income
(000) | | Long-Term
Capital Gain
(000) | | Ordinary
Income
(000) | | Long-Term
Capital Gain
(000) | |
| $ | 44 | | | $ | 11,201 | | | $ | 2,814 | | | $ | 3,157 | | |
The amount and character of income and gains to be distributed are determined in accordance with income tax regulations which may differ from GAAP. These book/tax differences are either considered temporary or permanent in nature.
Temporary differences are primarily due to differing book and tax treatments in the timing of the recognition of gains (losses) on certain investment transactions and the timing of the deductibility of certain expenses.
The Fund had no permanent differences causing reclassifications among the components of net assets for the year ended December 31, 2018.
At December 31, 2018, the components of distributable earnings for the Fund on a tax basis were as follows:
Undistributed
Ordinary
Income
(000) | | Undistributed
Long-Term
Capital Gain
(000) | |
| $ | — | | | $ | 3,391 | | |
26
Morgan Stanley Institutional Fund, Inc.
Annual Report — December 31, 2018
Notes to Financial Statements (cont'd)
Qualified late year losses are capital losses and specified ordinary losses, including currency losses, incurred after October 31 but within the taxable year that, if elected, are deemed to arise on the first day of the Fund's next taxable year. For the year ended December 31, 2018, the Fund intends to defer to January 1, 2019 for U.S. federal income tax purposes the following losses:
Qualified
Late Year
Ordinary
Losses
(000) | | Post-October
Capital Losses
(000) | |
| $ | 2 | | | $ | — | | |
I. Credit Facility: The Company and other Morgan Stanley funds participated in a $150,000,000 committed, unsecured revolving line of credit facility (the "Facility") with State Street. This Facility is to be used for temporary emergency purposes or funding of shareholder redemption requests. The interest rate on borrowings is based on the federal funds rate or 1 month LIBOR rate plus a spread. The Facility also has a commitment fee of 0.25% per annum based on the unused portion of the Facility. During the year ended December 31, 2018, the Fund did not have any borrowings under the Facility.
J. Other: At December 31, 2018, the Fund had record owners of 10% or greater. Investment activities of these shareholders could have a material impact on the Fund. The aggregate percentage of such owners was 45.1%.
27
Morgan Stanley Institutional Fund, Inc.
Annual Report — December 31, 2018
Report of Independent Registered Public Accounting Firm
To the Shareholders and Board of Directors of
Morgan Stanley Institutional Fund, Inc. —
International Advantage Portfolio
Opinion on the Financial Statements
We have audited the accompanying statement of assets and liabilities of International Advantage Portfolio (the "Fund") (one of the funds constituting the Morgan Stanley Institutional Fund, Inc. (the "Company")), including the portfolio of investments, as of December 31, 2018, and the related statement of operations for the year then ended, the statements of changes in net assets for each of the two years in the period then ended, the financial highlights for each of the five years in the period then ended and the related notes (collectively referred to as the "financial statements"). In our opinion, the financial statements present fairly, in all material respects, the financial position of International Advantage Portfolio (one of the funds constituting Morgan Stanley Institutional Fund, Inc.) at December 31, 2018, the results of its operations for the year then ended, the changes in its net assets for each of the two years in the period then ended and its financial highlights for each of the five years in the period then ended, in conformity with U.S. generally accepted accounting principles.
Basis for Opinion
These financial statements are the responsibility of the Company's management. Our responsibility is to express an opinion on the Fund's financial statements based on our audits. We are a public accounting firm registered with the Public Company Accounting Oversight Board (United States) ("PCAOB") and are required to be independent with respect to the Company in accordance with the U.S. federal securities law and the applicable rules and regulations of the Securities and Exchange Commission and the PCAOB.
We conducted our audits in accordance with the standards of the PCAOB. Those standards require that we plan and perform the audit to obtain reasonable assurance about whether the financial statements are free of material misstatement, whether due to error or fraud. The Company is not required to have, nor were we engaged to perform, an audit of the Company's internal control over financial reporting. As part of our audits, we are required to obtain an understanding of internal control over financial reporting, but not for the purpose of expressing an opinion on the effectiveness of the Company's internal control over financial reporting. Accordingly, we express no such opinion.
Our audits included performing procedures to assess the risks of material misstatement of the financial statements, whether due to error or fraud, and performing procedures that respond to those risks. Such procedures included examining, on a test basis, evidence regarding the amounts and disclosures in the financial statements. Our procedures included confirmation of securities owned as of December 31, 2018 by correspondence with the custodian and others or by other appropriate auditing procedures where replies from others were not received. Our audits also included evaluating the accounting principles used and significant estimates made by management, as well as evaluating the overall presentation of the financial statements. We believe that our audits provide a reasonable basis for our opinion.

We have served as the auditor of one or more Morgan Stanley investment companies since 2000.
Boston, Massachusetts
February 26, 2019
28
Morgan Stanley Institutional Fund, Inc.
Annual Report — December 31, 2018
Federal Tax Notice (unaudited)
For federal income tax purposes, the following information is furnished with respect to the distributions paid by the Fund during its taxable year ended December 31, 2018.
The Fund designated and paid approximately $11,201,000 as a long-term capital gain distribution.
For federal income tax purposes, the following information is furnished with respect to the Fund's earnings for its taxable year ended December 31, 2018. When distributed, certain earnings may be subject to a maximum tax rate of 15% as provided for the Jobs and Growth Tax Relief Reconciliation Act of 2003. The Fund designated up to a maximum of approximately $457,000 as taxable at this lower rate.
In January, the Fund provides tax information to shareholders for the preceding calendar year.
29
Morgan Stanley Institutional Fund, Inc.
Annual Report — December 31, 2018
Privacy Notice (unaudited)
MORGAN STANLEY INVESTMENT MANAGEMENT INC.
AN IMPORTANT NOTICE CONCERNING OUR U.S. PRIVACY POLICY
We are required by federal law to provide you with a copy of our privacy policy annually. This policy applies to current and former individual investors in funds managed or sponsored by Morgan Stanley Investment Management Inc. ("MSIM") as well as current and former individual clients of MSIM. This policy is not applicable to partnerships, corporations, trusts or other non-individual clients or investors. Please note that we may amend this policy at any time, and will inform you of any changes as required by law.
WE RESPECT YOUR PRIVACY
We appreciate that you have provided us with your personal financial information. We strive to maintain the privacy of such information while we help you achieve your financial objectives. This Notice describes what non-public personal information we collect about you, why we collect it, when we may share it with others and how certain others may use it. It discusses the steps you may take to limit our sharing of certain information about you to affiliated companies in the Morgan Stanley family of companies ("other Morgan Stanley companies"). It also discloses how you may limit use of certain shared information for marketing purposes by other Morgan Stanley branded companies. Throughout this policy, we refer to the non-public information that personally identifies you or your accounts as "personal information."
1. WHAT PERSONAL INFORMATION DO WE COLLECT ABOUT YOU?
We obtain personal information from applications and other forms you submit to us, from your dealings with us, from consumer reporting agencies, from our Web sites and from third parties and other sources.
For example:
• We may collect information such as your name, address, e-mail address, telephone/fax numbers, assets, income and investment objectives through subscription documents, applications and other forms you submit to us.
• We may obtain information about account balances, your use of account(s) and the types of products and services you prefer to receive from us through your dealings and transactions with us and other sources.
• We may obtain information about your creditworthiness and credit history from consumer reporting agencies.
• We may collect background information from and through third-party vendors to verify representations you have made and to comply with various regulatory requirements.
• If you interact with us through our public and private Web sites, we may collect information that you provide directly through online communications (such as an e-mail address). We may also collect information about your Internet service provider, your domain name, your computer's operating system and Web browser, your use of our Web sites and your product and service preferences, through the use of "cookies." Please consult the Terms of Use of these sites for more details.
2. WHEN DO WE DISCLOSE PERSONAL INFORMATION WE COLLECT ABOUT YOU?
We may disclose personal information we collect about you to other Morgan Stanley companies and to non-affiliated third parties.
a. Information We Disclose to Other Morgan Stanley Companies.
We may disclose personal information to other Morgan Stanley companies for a variety of reasons, including to manage your account(s) effectively, to service and process your transactions, to let you know about products and services offered by us and other Morgan Stanley companies, to manage our business, and as otherwise required or permitted by law. Offers for products and services from other Morgan Stanley companies are developed under conditions designed to safeguard your personal information.
30
Morgan Stanley Institutional Fund, Inc.
Annual Report — December 31, 2018
Privacy Notice (unaudited) (cont'd)
b. Information We Disclose to Non-affiliated Third Parties.
We do not disclose personal information that we collect about you to non-affiliated third parties except to those who provide marketing services on our behalf, to financial institutions with whom we have joint marketing agreements, and as otherwise required or permitted by law. For example, we may disclose personal information to non-affiliated third parties for servicing and processing transactions, to offer our own products and services, to protect against fraud, for institutional risk control, to respond to judicial process or to perform services on our behalf. When we share personal information with a non-affiliated third party, they are required to limit their use of personal information to the particular purpose for which it was shared and they are not allowed to share personal information with others except to fulfill that limited purpose or as may be permitted or required by law.
3. HOW DO WE PROTECT THE SECURITY AND CONFIDENTIALITY OF PERSONAL INFORMATION WE COLLECT ABOUT YOU?
We maintain physical, electronic and procedural security measures to help safeguard the personal information we collect about you. We have internal policies governing the proper handling of client information. Third parties that provide support or marketing services on our behalf may also receive personal information, and we require them to adhere to confidentiality standards with respect to such information.
4. HOW CAN YOU LIMIT THE SHARING OF CERTAIN TYPES OF PERSONAL INFORMATION WITH OTHER MORGAN STANLEY COMPANIES?
We offer you choices as to whether we share with other Morgan Stanley companies the personal information that was collected to determine your eligibility for products and services you request ("eligibility information"). Eligibility information does not include your identification information or personal information pertaining to our transactions or experiences with you. Please note that, even if you direct us not to share eligibility information with other Morgan Stanley companies ("opt-out"), we may still share personal information, including eligibility information, with those companies in circumstances excluded from the opt-out under applicable law, such as to process transactions or to service your account.
5. HOW CAN YOU LIMIT THE USE OF CERTAIN TYPES OF PERSONAL INFORMATION BY OTHER MORGAN STANLEY COMPANIES FOR MARKETING?
By following the opt-out instructions in Section 6 below, you may limit other Morgan Stanley branded companies from marketing their products or services to you based on personal information we disclose to them. This information may include, for example, your income and account history with us. Please note that, even if you choose to limit Other Morgan Stanley Companies from using personal information about you that we may share with them for marketing their products and services to you, Other Morgan Stanley Companies may use your personal information that they obtain from us to market to you in circumstances permitted by law, such as if the Other Morgan Stanley Company has its own relationship with you.
6. HOW CAN YOU SEND US AN OPT-OUT INSTRUCTION?
If you wish to limit our sharing of eligibility information about you with other Morgan Stanley companies or other Morgan Stanley companies' use of personal information for marketing purposes, as described in this notice, you may do so by:
• Calling us at (800) 548-7786
Monday–Friday between 8a.m. and 6p.m.(EST)
• Writing to us at the following address:
DST Asset Manager Solutions, Inc.
c/o Privacy Coordinator
P.O. Box 219804
Kansas City, Missouri 64121
31
Morgan Stanley Institutional Fund, Inc.
Annual Report — December 31, 2018
Privacy Notice (unaudited) (cont'd)
Your written request should include your name, address, telephone number and account number(s) to which the opt-out applies and whether you are opting out with respect to sharing of eligibility information (Section 4 above), or if information used for Marketing (Section 5 above) or both. Written opt-out requests should not be sent with any other correspondence. In order to process your request, we require that the request be provided by you directly and not through a third party.
Your opt-out preference will remain in effect with respect to this policy (as it may be amended) until you notify us otherwise. If you have a joint account, your direction for us not to share this information with other Morgan Stanley companies and for those other Morgan Stanley companies not to use your personal information for marketing will be applied to all account holders on that account. Please understand that if you limit our sharing or our affiliated companies' use of personal information, you and any joint account holder(s) may not receive information about Morgan Stanley products and services, including products or services that could help you manage your financial resources and achieve your investment objectives.
7. WHAT IF AN AFFILIATED COMPANY BECOMES A NON-AFFILIATED THIRD PARTY?
If, at any time in the future, an affiliated company becomes a non-affiliated third party, further disclosures of personal information made to the former affiliated company will be limited to those described in Section 2(b) above relating to non-affiliated third parties. If you elected under Section 6 to limit disclosures we make to affiliated companies, or use of personal information by affiliated companies, your election will not apply to use by any former affiliated company of your personal information in their possession once it becomes a non-affiliated third party.
SPECIAL NOTICE TO RESIDENTS OF VERMONT
The following section supplements our policy with respect to our individual clients who have a Vermont address and supersedes anything to the contrary in the above policy with respect to those clients only.
The state of Vermont requires financial institutions to obtain your consent prior to sharing personal information that they collect about you with affiliated companies and non-affiliated third parties other than in certain limited circumstances. Except as permitted by law, we will not share personal information we collect about you with non-affiliated third parties or other Morgan Stanley companies unless you provide us with your written consent to share such information ("opt-in").
If you wish to receive offers for investment products and services offered by or through other Morgan Stanley companies, please notify us in writing at the following address:
DST Asset Manager Solutions, Inc.
c/o Privacy Coordinator
P.O. Box 219804
Kansas City, Missouri 64121
Your authorization should include your name, address, telephone number and account number(s) to which the opt-in applies and should not be sent with any other correspondence. In order to process your authorization, we require that the authorization be provided by you directly and not through a third party.
SPECIAL NOTICE TO RESIDENTS OF CALIFORNIA
The following section supplements our policy with respect to our individual clients who have a California address and supersedes anything to the contrary in the above policy with respect to those clients only.
In response to a California law, if your account has a California home address, your personal information will not be disclosed to non-affiliated third parties except as permitted by applicable California law, and we will limit sharing such information with our affiliates to comply with California privacy laws that apply to us.
32
Morgan Stanley Institutional Fund, Inc.
Annual Report — December 31, 2018
Director and Officer Information (unaudited)
Independent Directors:
Name, Age and Address of
Independent Director | | Position(s)
Held with
Registrant | | Length of Time
Served* | | Principal Occupation(s) During Past 5 Years
and Other Relevant Professional Experience | | Number of
Portfolios in
Fund Complex
Overseen by
Independent
Director** | | Other Directorships
Held by Independent
Director*** | |
Frank L. Bowman (74)
c/o Perkins Coie LLP
Counsel to the Independent
Directors
30 Rockefeller Plaza
New York, NY 10112 | | Director | | Since
August
2006 | | President, Strategic Decisions, LLC (consulting) (since February 2009); Director or Trustee of various Morgan Stanley Funds (since August 2006); Chairperson of the Compliance and Insurance Committee (since October 2015); formerly, Chairperson of the Insurance Sub-Committee of the Compliance and Insurance Committee (2007-2015); served as President and Chief Executive Officer of the Nuclear Energy Institute (policy organization) (February 2005-November 2008); retired as Admiral, U.S. Navy after serving over 38 years on active duty including 8 years as Director of the Naval Nuclear Propulsion Program in the Department of the Navy and the U.S. Department of Energy (1996-2004); served as Chief of Naval Personnel (July 1994-September 1996) and on the Joint Staff as Director of Political Military Affairs (June 1992-July 1994); knighted as Honorary Knight Commander of the Most Excellent Order of the British Empire; awarded the Officier de l'Orde National du Mérite by the French Government; elected to the National Academy of Engineering (2009). | | | 82 | | | Director of BP p.l.c.; Director of Naval and Nuclear Technologies LLP; Director Emeritus of the Armed Services YMCA; Member of the National Security Advisory Council of the Center for U.S. Global Engagement and a member of the CNA Military Advisory Board; Trustee of Fairhaven United Methodist Church; Member of the Board of Advisors of the Dolphin Scholarship Foundation; and Director of other various non-profit organizations. | |
Kathleen A. Dennis (65)
c/o Perkins Coie LLP
Counsel to the Independent Directors
30 Rockefeller Plaza
New York, NY 10112 | | Director | | Since
August
2006 | | President, Cedarwood Associates (mutual fund and investment management consulting) (since July 2006); Chairperson of the Liquidity and Alternatives Sub-Committee of the Investment Committee (since October 2006) and Director or Trustee of various Morgan Stanley Funds (since August 2006); formerly, Senior Managing Director of Victory Capital Management (1993-2006). | | | 82 | | | Director of various non-profit organizations. | |
Nancy C. Everett (63)
c/o Perkins Coie LLP
Counsel to the Independent Directors
30 Rockefeller Plaza
New York, NY 10112 | | Director | | Since
January
2015 | | Chief Executive Officer, Virginia Commonwealth University Investment Company (since November 2015); Owner, OBIR, LLC (institutional investment management consulting) (since June 2014); formerly, Managing Director, BlackRock Inc. (February 2011-December 2013); and Chief Executive Officer, General Motors Asset Management (a/k/a Promark Global Advisors, Inc.) (June 2005-May 2010). | | | 83 | | | Formerly, Member of Virginia Commonwealth University School of Business Foundation (2005-2016); Member of Virginia Commonwealth University Board of Visitors (2013-2015); Member of Committee on Directors for Emerging Markets Growth Fund, Inc. (2007-2010); Chairperson of Performance Equity Management, LLC (2006-2010); and Chairperson, GMAM Absolute Return Strategies Fund, LLC (2006-2010). | |
33
Morgan Stanley Institutional Fund, Inc.
Annual Report — December 31, 2018
Director and Officer Information (unaudited) (cont'd)
Independent Directors: (cont'd)
Name, Age and Address of
Independent Director | | Position(s)
Held with
Registrant | | Length of Time
Served* | | Principal Occupation(s) During Past 5 Years
and Other Relevant Professional Experience | | Number of
Portfolios in
Fund Complex
Overseen by
Independent
Director** | | Other Directorships
Held by Independent
Director*** | |
Jakki L. Haussler (61)
c/o Perkins Coie LLP
Counsel to the Independent Directors
30 Rockefeller Plaza
New York, NY 10112 | | Director | | Since
January
2015 | | Chairman and Chief Executive Officer, Opus Capital Group (since January 1996); formerly, Director, Capvest Venture Fund, LP (May 2000-December 2011); Partner, Adena Ventures, LP (July 1999-December 2010); Director, The Victory Funds (February 2005-July 2008). | | | 83 | | | Director of Service Corporation International and Member, Audit Committee and Investment Committee; Director of Cincinnati Bell Inc. and Member, Audit Committee and Governance and Nominating Committee; Chairman of Northern Kentucky University Member Investment Committee; Member of Chase College of Law Transactional Law Practice Center Board of Advisors; Director of Best Transport; Director of Chase College of Law Board of Visitors; formerly, Member, University of Cincinnati Foundation Investment Committee; Member, Miami University Board of Visitors (2008-2011); Trustee of Victory Funds (2005-2008) and Chairman, Investment Committee (2007-2008) and Member, Service Provider Committee (2005-2008). | |
Dr. Manuel H. Johnson (69)
c/o Johnson Smick
International, Inc.
220 I Street, NE — Suite 200
Washington, D.C. 20002 | | Director | | Since
July
1991 | | Senior Partner, Johnson Smick International, Inc. (consulting firm); Chairperson of the Investment Committee (since October 2006) and Director or Trustee of various Morgan Stanley Funds (since July 1991); Co-Chairman and a founder of the Group of Seven Council (G7C) (international economic commission); formerly, Chairperson of the Audit Committee (July 1991-September 2006), Vice Chairman of the Board of Governors of the Federal Reserve System and Assistant Secretary of the U.S. Treasury. | | | 82 | | | Director of NVR, Inc. (home construction). | |
Joseph J. Kearns (76)
c/o Perkins Coie LLP
Counsel to the Independent Directors
30 Rockefeller Plaza
New York, NY 10112 | | Director | | Since
August
1994 | | Senior Adviser, Kearns & Associates LLC (investment consulting); Chairperson of the Audit Committee (since October 2006) and Director or Trustee of various Morgan Stanley Funds (since August 1994); formerly, Deputy Chairperson of the Audit Committee (July 2003-September 2006) and Chairperson of the Audit Committee of various Morgan Stanley Funds (since August 1994); CFO of the J. Paul Getty Trust. | | | 83 | | | Prior to August 10, 2016, Director of Electro Rent Corporation (equipment leasing); Prior to December 31, 2013, Director of The Ford Family Foundation. | |
34
Morgan Stanley Institutional Fund, Inc.
Annual Report — December 31, 2018
Director and Officer Information (unaudited) (cont'd)
Independent Directors: (cont'd)
Name, Age and Address of
Independent Director | | Position(s)
Held with
Registrant | | Length of Time
Served* | | Principal Occupation(s) During Past 5 Years
and Other Relevant Professional Experience | | Number of
Portfolios in
Fund Complex
Overseen by
Independent
Director** | | Other Directorships
Held by Independent
Director*** | |
Michael F. Klein (60)
c/o Perkins Coie LLP
Counsel to the Independent Directors
30 Rockefeller Plaza
New York, NY 10112 | | Director | | Since
August
2006 | | Managing Director, Aetos Alternatives Management, LP (since March 2000); Co-President, Aetos Alternatives Management, LP (since January 2004) and Co-Chief Executive Officer of Aetos Alternatives Management, LP (since August 2013); Chairperson of the Fixed Income Sub-Committee of the Investment Committee (since October 2006) and Director or Trustee of various Morgan Stanley Funds (since August 2006); formerly, Managing Director, Morgan Stanley & Co. Inc. and Morgan Stanley Dean Witter Investment Management and President, various Morgan Stanley Funds (June 1998-March 2000); Principal, Morgan Stanley & Co. Inc. and Morgan Stanley Dean Witter Investment Management (August 1997-December 1999). | | | 82 | | | Director of certain investment funds managed or sponsored by Aetos Alternatives Management, LP; Director of Sanitized AG and Sanitized Marketing AG (specialty chemicals). | |
Patricia Maleski (58)
c/o Perkins Coie LLP
Counsel to the Independent Directors
30 Rockefeller Plaza
New York, NY 10112 | | Director | | Since
January
2017 | | Managing Director, JPMorgan Asset Management (2004-2016); Oversight and Control Head of Fiduciary and Conflicts of Interest Program (2015-2016); Chief Control Officer-Global Asset Management (2013-2015); President, JPMorgan Funds (2010-2013); Chief Administrative Officer (2004-2013); various other positions including Treasurer and Board Liaison (since 2001). | | | 83 | | | None. | |
Michael E. Nugent (82)
522 Fifth Avenue
New York, NY 10036 | | Chair of the Board and Director | | Chair of the Boards since July 2006 and Director since July 1991 | | Chair of the Boards of various Morgan Stanley Funds (since July 2006); Chairperson of the Closed-End Fund Committee (since June 2012) Governance Committee (since January 2019) and Director or Trustee of various Morgan Stanley Funds (since July 1991); formerly, Chairperson of the Insurance Committee (until July 2006); General Partner, Triumph Capital, L.P. (private investment partnership) (1988-2013). | | | 82 | | | None. | |
W. Allen Reed (71)
c/o Perkins Coie LLP
Counsel to the Independent Directors
30 Rockefeller Plaza
New York, NY 10112 | | Director | | Since
August
2006 | | Chairperson of the Equity Sub-Committee of the Investment Committee (since October 2006) and Director or Trustee of various Morgan Stanley Funds (since August 2006); formerly, President and CEO of General Motors Asset Management; Chairman and Chief Executive Officer of the GM Trust Bank and Corporate Vice President of General Motors Corporation (August 1994-December 2005). | | | 82 | | | Director of Legg Mason, Inc.; formerly, Director of the Auburn University Foundation (2010-2015). | |
Fergus Reid (86)****
c/o Joe Pietryka, Inc.
85 Charles Colman Blvd.
Pawling, NY 12564 | | Director | | Since
June
1992 | | Chairman, Joe Pietryka, Inc.; Chairperson of the Governance Committee and Director or Trustee of various Morgan Stanley Funds (since June 1992). | | | 83 | | | Formerly, Trustee and Director of certain investment companies in the JP Morgan Fund Complex managed by JP Morgan Investment Management Inc. (1987-2012). | |
* This is the earliest date the Director began serving the Morgan Stanley Funds. Each Director serves an indefinite term, until his or her successor is elected.
** The Fund Complex includes (as of December 31, 2018) all open-end and closed-end funds (including all of their portfolios) advised by Morgan Stanley Investment Management Inc. (the "Adviser") and any funds that have an adviser that is an affiliated person of the Adviser (including, but not limited to, Morgan Stanley AIP GP LP).
*** This includes any directorships at public companies and registered investment companies held by the Director at any time during the past five years.
**** Effective date of retirement is December 31, 2018.
35
Morgan Stanley Institutional Fund, Inc.
Annual Report — December 31, 2018
Director and Officer Information (unaudited) (cont'd)
Executive Officers:
Name, Age and Address of Executive Officer | | Position(s) Held
with
Registrant | | Length of Time
Served* | | Principal Occupation(s) During Past 5 Years | |
John H. Gernon (55)
522 Fifth Avenue
New York, NY 10036 | | President and Principal Executive Officer | | Since
September
2013 | | President and Principal Executive Officer of the Equity and Fixed Income Funds and the Morgan Stanley AIP Funds (since September 2013) and the Liquidity Funds and various money market funds (since May 2014) in the Fund Complex; Managing Director of the Adviser; Head of Product (since 2006). | |
Timothy J. Knierim (59)
522 Fifth Avenue
New York, NY 10036 | | Chief Compliance Officer | | Since
December
2016 | | Managing Director of the Adviser and various entities affiliated with the Adviser; Chief Compliance Officer of various Morgan Stanley Funds and the Adviser (since December 2016) and Chief Compliance Officer of Morgan Stanley AIP GP LP (since 2014). Formerly, Managing Director and Deputy Chief Compliance Officer of the Adviser (2014-2016); and formerly, Chief Compliance Officer of Prudential Investment Management, Inc. (2007-2014). | |
Francis J. Smith (53)
522 Fifth Avenue
New York, NY 10036 | | Treasurer and Principal Financial Officer | | Treasurer since July 2003 and Principal Financial Officer since September 2002 | | Managing Director of the Adviser and various entities affiliated with the Adviser; Treasurer (since July 2003) and Principal Financial Officer of various Morgan Stanley Funds (since September 2002). | |
Mary E. Mullin (51)
522 Fifth Avenue
New York, NY 10036 | | Secretary | | Since
June
1999 | | Managing Director of the Adviser; Secretary of various Morgan Stanley Funds (since June 1999). | |
Michael J. Key (39)
522 Fifth Avenue
New York, NY 10036 | | Vice President | | Since
June
2017 | | Vice President of the Equity and Fixed Income Funds, Liquidity Funds, various money market funds and the Morgan Stanley AIP Funds in the Fund Complex (since June 2017); Executive Director of the Adviser; Head of Product Development for Equity and Fixed Income Funds (since August 2013). | |
* This is the earliest date the officer began serving the Morgan Stanley Funds. Each officer serves a one-year term, until his or her successor is elected and qualifies.
36
Morgan Stanley Institutional Fund, Inc.
Annual Report — December 31, 2018
Adviser and Administrator
Morgan Stanley Investment Management Inc.
522 Fifth Avenue
New York, New York 10036
Distributor
Morgan Stanley Distribution, Inc.
522 Fifth Avenue
New York, New York 10036
Dividend Disbursing and Transfer Agent
DST Asset Manager Solutions, Inc.
2000 Crown Colony Drive
Quincy, Massachusetts 02169
Custodian
State Street Bank and Trust Company
One Lincoln Street
Boston, Massachusetts 02111
Legal Counsel
Dechert LLP
1095 Avenue of the Americas
New York, New York 10036
Counsel to the Independent Directors
Perkins Coie LLP
30 Rockefeller Plaza
New York, New York 10112
Independent Registered Public Accounting Firm
Ernst & Young LLP
200 Clarendon Street
Boston, Massachusetts 02116
Reporting to Shareholders
Each Morgan Stanley fund provides a complete schedule of portfolio holdings in its semi-annual and the annual reports within 60 days of the end of the fund's second and fourth fiscal quarters. The semi-annual and annual reports are filed electronically with the Securities and Exchange Commission ("SEC") on Form N-CSRS and Form N-CSR, respectively. Morgan Stanley also delivers the semi-annual and annual reports to fund shareholders and makes these reports available on its public website, www.morganstanley.com/im/shareholderreports. Each Morgan Stanley fund also files a complete schedule of portfolio holdings with the SEC for the fund's first and third fiscal quarters on Form N-Q. Morgan Stanley does not deliver the reports for the first and third fiscal quarters to shareholders, nor are the reports posted to the Morgan Stanley public website. You may, however, obtain the Form N-Q filings (as well as the Form N-CSR and N-CSRS filings) by accessing the SEC's website, www.sec.gov. You can also request copies of these materials, upon payment of a duplicating fee, by electronic request at the SEC's email address (publicinfo@sec.gov).
Proxy Voting Policies and Procedures and Proxy Voting Record
You may obtain a copy of the Company's Proxy Voting Policy and Procedures and information regarding how the Company voted proxies relating to portfolio securities during the most recent twelve-month period ended June 30, without charge, upon request, by calling toll free 1 (800) 548-7786 or by visiting our website at www.morganstanley.com/im/shareholderreports. This information is also available on the SEC's website at www.sec.gov.
This report is authorized for distribution only when preceded or accompanied by a prospectus or summary prospectus of the applicable Fund of Morgan Stanley Institutional Fund, Inc., which describes in detail the Fund's investment policies, risks, fees and expenses. Please read the prospectus carefully before you invest or send money. For additional information, including information regarding the investments comprising the Fund, please visit our website at www.morganstanley.com/im/shareholderreports or call toll free 1 (800) 548-7786.
37
Printed in U.S.A.
This Report has been prepared for shareholders and may be distributed to others only if preceded or accompanied by a current prospectus.
Morgan Stanley Investment Management Inc.
522 Fifth Avenue
New York, New York 10036
© 2019 Morgan Stanley. Morgan Stanley Distribution, Inc.

IFIIAANN
2400552 EXP. 02.29.20

Morgan Stanley Institutional Fund, Inc.
International Equity Portfolio
Annual Report
December 31, 2018
Beginning on January 1, 2021, as permitted by regulations adopted by the Securities and Exchange Commission ("SEC"), paper copies of the Fund's Annual and Semi-Annual Reports to Shareholders ("Shareholder Reports") will no longer be sent by mail, unless you specifically request paper copies of the Shareholder Reports from the Fund or from your financial intermediary, such as a broker-dealer or a bank. Instead, the Shareholder Reports will be made available on the Fund's website, https://www.morganstanley.com/im/shareholderreports and you will be notified by mail each time a Shareholder Report is posted and provided with a website link to access the Shareholder Report. If you already elected to receive Shareholder Reports electronically, you will not be affected by this change and you need not take any action. You may elect to receive Shareholder Reports and other communications from the Fund electronically anytime by contacting your financial intermediary or, if you are a direct investor, please follow the instructions on the envelope.
Beginning on January 1, 2019, you may elect to receive all future Shareholder Reports in paper free of charge. If you invest through a financial intermediary, you can contact your financial intermediary to request that you continue to receive paper copies of your Shareholder Reports. If you invest directly with the Fund, please follow the instructions on the envelope to let the Fund know you wish to continue receiving paper copies of your Shareholder Reports. Your election to receive Shareholder Reports in paper will apply to all funds held in your account if you invest through your financial intermediary or all funds held with the fund complex if you invest directly with a fund.

Morgan Stanley Institutional Fund, Inc.
Annual Report — December 31, 2018
Shareholders' Letter | | | 2 | | |
Expense Example | | | 3 | | |
Investment Overview | | | 4 | | |
Portfolio of Investments | | | 8 | | |
Statement of Assets and Liabilities | | | 10 | | |
Statement of Operations | | | 12 | | |
Statements of Changes in Net Assets | | | 13 | | |
Financial Highlights | | | 15 | | |
Notes to Financial Statements | | | 20 | | |
Report of Independent Registered Public Accounting Firm | | | 29 | | |
Federal Tax Notice | | | 30 | | |
Privacy Notice | | | 31 | | |
Director and Officer Information | | | 34 | | |
This report is authorized for distribution only when preceded or accompanied by a prospectus or summary prospectus of the applicable Fund of Morgan Stanley Institutional Fund, Inc. To receive a prospectus and/or statement of additional information (SAI), which contains more complete information such as investment objectives, charges, expenses, policies for voting proxies, risk considerations and describes in detail each of the Fund's investment policies to the prospective investor, please call toll free 1 (800) 548-7786. Please read the prospectuses carefully before you invest or send money.
Additionally, you can access information about the Fund, including performance, characteristics and investment team commentary, through Morgan Stanley Investment Management's website: www.morganstanley.com/im/shareholderreports.
Market forecasts provided in this report may not necessarily come to pass. There is no guarantee that any sectors mentioned will continue to perform as discussed herein or that securities in such sectors will be held by the Fund in the future. There is no assurance that a fund will achieve its investment objective. Funds are subject to market risk, which is the possibility that market values of securities owned by the Fund will decline and, therefore, the value of the Fund's shares may be less than what you paid for them. Accordingly, you can lose money investing in this Fund. Please see the prospectus for more complete information on investment risks.
1
Morgan Stanley Institutional Fund, Inc.
Annual Report — December 31, 2018
Shareholders' Letter (unaudited)
Dear Shareholders,
We are pleased to provide this Annual report, in which you will learn how your investment in International Equity Portfolio (the "Fund") performed during the latest twelve-month period.
Morgan Stanley Investment Management is a client-centric, investor-led organization. Our global presence, intellectual capital, and breadth of products and services enable us to partner with investors to meet the evolving challenges of today's financial markets. We aim to deliver superior investment service and to empower our clients to make the informed decisions that help them reach their investment goals.
As always, we thank you for selecting Morgan Stanley Investment Management, and look forward to working with you in the months and years ahead.
Sincerely,

John H. Gernon
President and Principal Executive Officer
January 2019
2
Morgan Stanley Institutional Fund, Inc.
Annual Report — December 31, 2018
Expense Example (unaudited)
International Equity Portfolio
As a shareholder of the Fund, you incur two types of costs: (1) transactional costs, including redemption fees; and (2) ongoing costs, which may include advisory fees, administration fees, distribution and shareholder services fees and other Fund expenses. This example is intended to help you understand your ongoing costs (in dollars) of investing in the Fund and to compare these costs with the ongoing costs of investing in other mutual funds.
This example is based on an investment of $1,000 invested at the beginning of the six-month period ended December 31, 2018 and held for the entire six-month period.
Actual Expenses
The table below provides information about actual account values and actual expenses. You may use the information in this table, together with the amount you invested, to estimate the expenses that you paid over the period. Simply divide your account value by $1,000 (for example, an $8,600 account value divided by $1,000 = 8.6), then multiply the result by the number in the table under the heading entitled "Actual Expenses Paid During Period" to estimate the expenses you paid on your account during this period.
Hypothetical Example for Comparison Purposes
The table below provides information about hypothetical account values and hypothetical expenses based on the Fund's actual expense ratio and an assumed rate of return of 5% per year before expenses, which is not the Fund's actual return. The hypothetical account values and expenses may not be used to estimate the actual ending account balance or expenses you paid for the period. You may use this information to compare the ongoing costs of investing in the Fund and other funds. To do so, compare this 5% hypothetical example with the 5% hypothetical examples that appear in the shareholder reports of the other funds.
Please note that the expenses shown in the table are meant to highlight your ongoing costs only and do not reflect any transactional costs, such as sales charges (loads) and redemption fees. Therefore, the information for each class in the table is useful in comparing ongoing costs only, and will not help you determine the relative total costs of owning different funds. In addition, if these transactional costs were included, your costs would have been higher.
| | | Beginning
Account
Value
7/1/18 | | Actual Ending
Account
Value
12/31/18 | | Hypothetical
Ending Account
Value | | Actual
Expenses
Paid
During
Period* | | Hypothetical
Expenses Paid
During Period* | | Net
Expense
Ratio
During
Period** | |
International Equity Portfolio Class I | | $ | 1,000.00 | | | $ | 876.60 | | | $ | 1,020.42 | | | $ | 4.49 | | | $ | 4.84 | | | | 0.95 | % | |
International Equity Portfolio Class A | | | 1,000.00 | | | | 875.00 | | | | 1,018.65 | | | | 6.14 | | | | 6.61 | | | | 1.30 | | |
International Equity Portfolio Class L | | | 1,000.00 | | | | 873.40 | | | | 1,016.89 | | | | 7.79 | | | | 8.39 | | | | 1.65 | | |
International Equity Portfolio Class C | | | 1,000.00 | | | | 871.20 | | | | 1,014.87 | | | | 9.67 | | | | 10.41 | | | | 2.05 | | |
International Equity Portfolio Class IS | | | 1,000.00 | | | | 877.00 | | | | 1,020.67 | | | | 4.26 | | | | 4.58 | | | | 0.90 | | |
* Expenses are calculated using each Fund Class' annualized net expense ratio (as disclosed), multiplied by the average account value over the period and multiplied by 184/365 (to reflect the most recent one-half year period).
** Annualized.
3
Morgan Stanley Institutional Fund, Inc.
Annual Report — December 31, 2018
Investment Overview (unaudited)
International Equity Portfolio
The Fund seeks long-term capital appreciation by investing primarily in equity securities of non-U.S. issuers.
Performance
For the fiscal year ended December 31, 2018, the Fund's Class I shares had a total return based on net asset value and reinvestment of distributions per share of –13.80%, net of fees. The Fund's Class I shares underperformed the Fund's benchmark, the MSCI EAFE Index (the "Index"), which returned –13.79%.
Factors Affecting Performance
• The EAFE markets held up reasonably well for the first nine months of 2018 with only marginally negative returns up to the end of September, but then cracked in the fourth quarter, finishing the quarter down 12.5% in U.S. dollar (USD) terms and a very similar –12.2% in local currency, as measured by the Index.
• This year-end slump left the Index down 13.8% for the year in USD (–11.0% in local currencies). As in the fourth quarter, the defensive sectors fell less, with utilities actually up 1% and health care down just 4%. Consumer staples (–11%) only outperformed slightly, not helped by the 40% fall in tobacco. The cyclical sectors suffered worst, most notably financials (–20%) and materials (–17%). In geographic terms, the worst performing major market was Germany (–22% in USD, –18% local), which managed to underperform Italy (–18% USD, –14% local) and the U.K. (–14% USD, –9% local) despite their political travails. Japan (–13% USD, –15% local) was in line with the overall Index, while the Asian constituents, Hong Kong (–8% USD, –8% local) and Singapore (–9% USD, –8% local), outperformed. The U.S. (–5%) was well ahead of EAFE for the year as a whole.
• The Fund finished the year in line with the Index. Sector allocation was positive overall, with the benefit from the overweight positions in consumer staples and health care, along with the underweights in consumer discretionary and financials, outweighing the headwind from not owning any
utilities. Stock selection was roughly neutral overall as outperformance in industrials, information technology and energy roughly matched underperformance in health care, materials and financials. The hedge on the Japanese yen to USD, which is managed using forward contracts, was negative for the year. In April 2018, the team decided to cease rolling their yen hedge.
Management Strategies
• The good news about equities is that there are only two ways to lose money — falling earnings or falling multiples. A year ago, it was the multiples that worried us most. After the markets' bull run in 2017, the MSCI EAFE Index neared 15x the next 12 months earnings,(i) implying that markets were pricing in the improbable upside scenario of synchronized growth everywhere... and threatening considerable downside if things did not go quite according to plan. By contrast, 2019 starts with the MSCI EAFE Index on 11.9x forward consensus estimates, 20% lower than the 20-year average price-earnings (P/E) ratio of 14.8x, and 21% below a year ago.(i) As a result, our primary fears have moved from multiples to earnings.
• Our generic fear about forward earnings estimates remains — the fact that they are guesses about lies. The guesses are because the sell-side is persistently over-optimistic, by an average of 8% one-year forward, slightly higher than the 6% earnings growth expected for MSCI EAFE Index in 2019.(ii) The lies are down to the gaping gap between the "adjusted" earnings used to power consensus numbers (and management pay) and the actual number calculated using accepted accounting standards at the bottom of the profit & loss statement. Over the last three years $600 billion has disappeared between the adjusted and actual earnings totals in the U.S. alone, overstating earnings there by an average of 21%.(ii)
• Our more specific anxiety is fed by the fact that it is only on the leveraged earnings metric that markets look cheap. Looking at the forward enterprise multiple(iii) rather than P/E, the discount to the
(i) Source: FactSet. Data as of December 31, 2018.
(ii) Source: FactSet, Morgan Stanley Investment Management. Data as of December 31, 2018.
(iii) Source: FactSet. Data as of December 31, 2018. Enterprise multiple is a measure of valuing a company that includes its debt, by dividing its enterprise value by its earnings before interest, taxes, depreciation and amortization.
4
Morgan Stanley Institutional Fund, Inc.
Annual Report — December 31, 2018
Investment Overview (unaudited) (cont'd)
International Equity Portfolio
historic average disappears and the market is on a slightly higher multiple than it was in 2003 (8.0x versus 7.7x), when the P/E ratio was at a lofty near-17x.(i) Lower corporate taxes have helped, but so has the sharp increase in leverage, which we discuss further later in the piece. Looking at enterprise value-to-sales, the MSCI EAFE Index is at 1.3x, still 6% above its 20-year average.(i) The combination of a fairly expensive market on sales with a cheap market on earnings reflects the really high profitability at present, particularly in the U.S., where all the drivers look fairly maxed out in favour of profits, be it fat margins, low tax rates, high leverage or low interest rates.
• We have no greater insight than anyone else on whether the expected earnings growth for 2019 will be delivered, or even exceeded, but we do have opinions (as usual) on the key variables to watch. The current China slowdown is an earnings risk, particularly for cyclical companies, and the extent (and success) of the gathering reflation is crucial. Even if the reflation does happen, and is successful, earnings could be soft in the first part of the year until it takes effect. As mentioned above, U.S. margins are very high, and while elements of this look structural, given the emergence of lucrative platform businesses and the way the country's political system has systematically advantaged capital against labour and consumers over the last four decades, tight labour markets and tariff impacts may cause margin issues for those without pricing power.
• Leaving aside the tail-risks, such as negative trade relations, utter paralysis of the U.S. government, Mid-East conflict or a collapse of the euro, one thing that would definitely cause a margin squeeze would be a significant slowdown in the U.S., or a further slowdown in Europe. The U.S. recovery is now very long in the tooth, and while recoveries do not just die of old age, the change at the Federal Reserve (Fed) may be an extra cause for concern. It is still early days, but Jay Powell seems more interested in the state of the real economy than the exact level of the equity markets or the fate of anyone outside the U.S. who chooses to hitch their currencies to the U.S. dollar — i.e., emerging markets. He may
therefore continue to tighten via a combination of interest rates and unwinding quantitative easing until he sees weakness in the U.S. economy. He will back off at that point, but this may be too late for markets.
• 2018 has ended with the combined balance sheets of the four major central banks — the Fed, the People's Bank of China, the European Central Bank and the Bank of Japan — finally shrinking after the massive build post the Global Financial Crisis (GFC). This means that the world is now in a liquidity squeeze, combining (depending on the geographic bloc) shrinking central bank balance sheets and tightening interest rates. It is precisely the opposite combination that drove up asset prices (and consequent levering up) since the nadir of 2009.
• Our concern is that the combination of potentially falling earnings and a liquidity squeeze could be a truly toxic one for asset prices. We mentioned that we were unclear whether earnings estimates would be met this year, but we are clear that the world is an asymmetric place, with earnings downsides in bad times far greater than the upsides in good times. This is often forgotten, as is the fact that the asymmetry is magnified by leverage — and there is now more leverage than ever, particularly in the U.S. corporate debt market. Corporate America as a whole is not inexpert at levering itself up at the wrong time, most spectacularly just before the GFC last time round. Given the scale of corporate leverage now and — more particularly — the component of high-yield or near-high yield (or as we prefer to call it, given that interest rates are not that high, junk, or near-junk), Corporate America has to be right that earnings will hold up.
• We worry in particular about the outlook for near-junk, i.e., BBB. This has been at the epicenter of the build-up of corporate debt, ballooning from $0.7 trillion in October 2008 to the current circa $3 trillion.(i) Moreover, the component of near junk (BBB) and actual junk (BB, B and CCC & below) has increased from 46% of the U.S. corporate bond market in October 2008 to 58% currently,(i) so the quality of the overall corporate bond market has clearly deteriorated. If U.S. earnings do fall
(i) Source: FactSet. Data as of December 31, 2018.
5
Morgan Stanley Institutional Fund, Inc.
Annual Report — December 31, 2018
Investment Overview (unaudited) (cont'd)
International Equity Portfolio
significantly, then there could be significant downgrades from BBB to junk. We do not think the currently quiescent so-called high yield market is pricing in such an outcome. In that event, the equity market is sure to hear about it — big problems in the credit market invariably mean big problems in the equity market, especially as they would have a common cause: falling earnings and too much debt.
• In this uncertain and acutely asymmetric world, we are continuing our bias to owning compounders. The combination of recurring revenue and pricing power should protect revenues and margins respectively in a downturn, preserving earnings. They are also likely to be insulated from any financial distress if the corporate bond markets have a seizure, given their lower operational and financial leverage. The more cyclical sectors still do not offer a sufficient margin of safety given the uncertainty and potential pressure on earnings, although opportunities may come if the China slowdown does impact earnings in the first half of 2019. As such, we retain our strong overweight positions in the two most defensive sectors, consumer staples and health care, which between them make up 48% of the portfolio.(iv)
(iv) Source: Morgan Stanley Investment Management. Data as of December 31, 2018.
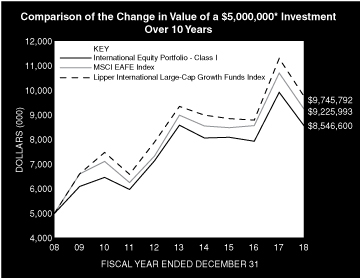
* Minimum Investment for Class I shares
In accordance with SEC regulations, the Fund's performance shown assumes that all recurring fees (including management fees) were deducted and all dividends and distributions were reinvested. The performance of Class A, L, C and IS shares will vary from the performance of Class I shares based upon their different inception dates and will be negatively impacted by additional fees assessed to those classes (if applicable).
6
Morgan Stanley Institutional Fund, Inc.
Annual Report — December 31, 2018
Investment Overview (unaudited) (cont'd)
International Equity Portfolio
Performance Compared to the MSCI EAFE Index(1) and the Lipper International Large-Cap Growth Funds Index(2)
| | | Period Ended December 31, 2018
Total Returns(3) | |
| | | | | Average Annual | |
| | | One
Year | | Five
Years | | Ten
Years | | Since
Inception(9) | |
Fund — Class I Shares
w/o sales charges(4) | | | –13.80 | % | | | –0.07 | % | | | 5.51 | % | | | 7.75 | % | |
Fund — Class A Shares
w/o sales charges(5) | | | –14.13 | | | | –0.42 | | | | 5.18 | | | | 6.61 | | |
Fund — Class A Shares with
maximum 5.25% sales charges(5) | | | –18.62 | | | | –1.49 | | | | 4.62 | | | | 6.36 | | |
Fund — Class L Shares
w/o sales charges(6) | | | –14.49 | | | | –0.91 | | | | — | | | | 4.45 | | |
Fund — Class C Shares
w/o sales charges(8) | | | –14.82 | | | | — | | | | — | | | | –2.06 | | |
Fund — Class C Shares with
maximum 1.00% deferred
sales charges(8) | | | –15.56 | | | | — | | | | — | | | | –2.06 | | |
Fund — Class IS Shares
w/o sales charges(7) | | | –13.76 | | | | –0.03 | | | | — | | | | 1.33 | | |
MSCI EAFE Index | | | –13.79 | | | | 0.53 | | | | 6.32 | | | | 4.13 | | |
Lipper International Large-Cap
Growth Funds Index | | | –13.74 | | | | 0.85 | | | | 6.90 | | | | N/A | | |
Performance data quoted represents past performance, which is no guarantee of future results, and current performance may be lower or higher than the figures shown. Performance assumes that all dividends and distributions, if any, were reinvested. For the most recent month-end performance figures, please visit www.morganstanley.com/im/shareholderreports. Investment return and principal value will fluctuate so that Fund shares, when redeemed, may be worth more or less than their original cost. Total returns do not reflect the deduction of taxes that a shareholder would pay on Fund distributions or the redemption of Fund shares. Performance of share classes will vary due to difference in sales charges and expenses.
(1) The MSCI EAFE Index (Europe, Australasia, Far East) is a free float-adjusted market capitalization index that is designed to measure the international equity market performance of developed markets, excluding the U.S. & Canada. The term "free float" represents the portion of shares outstanding that are deemed to be available for purchase in the public equity markets by investors. The MSCI EAFE Index currently consists of 21 developed market country indices. The performance of the Index is listed in U.S. dollars and assumes reinvestment of net dividends. Net total return indices reinvest dividends after the deduction of withholding taxes, using (for international indices) a tax rate applicable to non-resident institutional investors who do not benefit from double taxation treaties. The Index is unmanaged and its returns do not include any sales charges or fees. Such costs would lower performance. It is not possible to invest directly in an index.
(2) The Lipper International Large-Cap Growth Funds Index is an equally weighted performance index of the largest qualifying funds (based on net assets) in the Lipper International Large-Cap Growth Funds classification. The Index, which is adjusted for capital gains distributions and income dividends, is unmanaged and should not be considered an investment. There are currently 30 funds represented in this Index. As of the date of this report, the Fund is in the Lipper International Large-Cap Growth Funds classification.
(3) Total returns for the Fund reflect fees waived and expenses reimbursed, if applicable, by Morgan Stanley Investment Management Inc. (the "Adviser"). Without such waivers and reimbursements, total returns would have been lower.
(4) Commenced operations on August 4, 1989.
(5) Commenced offering on January 2, 1996.
(6) Commenced offering on June 14, 2012.
(7) Commenced offering on September 13, 2013.
(8) Commenced offering on April 30, 2015.
(9) For comparative purposes, average annual since inception returns listed for the Indexes refer to the inception date of Class I of the Fund, not the inception of the Index.
7
Morgan Stanley Institutional Fund, Inc.
Annual Report — December 31, 2018
Portfolio of Investments
International Equity Portfolio
| | | Shares | | Value
(000) | |
Common Stocks (98.4%) | |
Canada (4.7%) | |
Barrick Gold Corp. (a) | | | 3,594,069 | | | $ | 48,519 | | |
Cameco Corp. | | | 1,202,142 | | | | 13,631 | | |
Constellation Software, Inc. | | | 81,686 | | | | 52,287 | | |
| | | | 114,437 | | |
China (3.1%) | |
China Petroleum & Chemical Corp. H Shares (b) | | | 42,598,000 | | | | 30,435 | | |
Tencent Holdings Ltd. (b) | | | 1,157,600 | | | | 45,886 | | |
| | | | 76,321 | | |
Denmark (0.6%) | |
Danske Bank A/S | | | 734,978 | | | | 14,563 | | |
Finland (1.2%) | |
Neste Oyj | | | 368,312 | | | | 28,438 | | |
France (15.5%) | |
AXA SA | | | 1,352,538 | | | | 29,141 | | |
L'Oreal SA | | | 226,547 | | | | 52,004 | | |
Pernod Ricard SA | | | 460,118 | | | | 75,550 | | |
Safran SA | | | 554,183 | | | | 66,580 | | |
Sanofi | | | 932,986 | | | | 80,628 | | |
Thales SA | | | 240,568 | | | | 27,984 | | |
TOTAL SA | | | 879,735 | | | | 46,475 | | |
| | | | 378,362 | | |
Germany (14.2%) | |
Bayer AG (Registered) | | | 851,176 | | | | 59,022 | | |
Continental AG | | | 106,870 | | | | 14,778 | | |
Deutsche Post AG (Registered) | | | 1,203,374 | | | | 32,959 | | |
Fresenius SE & Co., KGaA | | | 1,335,427 | | | | 64,551 | | |
HeidelbergCement AG | | | 360,438 | | | | 22,044 | | |
Henkel AG & Co., KGaA (Preference) | | | 683,942 | | | | 74,686 | | |
SAP SE | | | 782,264 | | | | 77,921 | | |
| | | | 345,961 | | |
Hong Kong (3.2%) | |
AIA Group Ltd. | | | 7,845,600 | | | | 64,540 | | |
Minth Group Ltd. (a) | | | 4,376,000 | | | | 13,966 | | |
| | | | 78,506 | | |
Ireland (0.8%) | |
CRH PLC | | | 732,874 | | | | 19,319 | | |
Japan (14.1%) | |
FANUC Corp. | | | 188,400 | | | | 28,323 | | |
Keyence Corp. | | | 53,700 | | | | 27,064 | | |
Kirin Holdings Co., Ltd. | | | 4,075,300 | | | | 85,723 | | |
Lion Corp. | | | 1,245,700 | | | | 25,695 | | |
Mizuho Financial Group, Inc. | | | 11,603,700 | | | | 18,085 | | |
Nitto Denko Corp. | | | 530,700 | | | | 26,497 | | |
Shiseido Co., Ltd. | | | 905,400 | | | | 56,257 | | |
Sumitomo Mitsui Financial Group, Inc. | | | 1,034,051 | | | | 34,100 | | |
Toyota Motor Corp. | | | 443,900 | | | | 25,782 | | |
USS Co., Ltd. | | | 958,600 | | | | 15,999 | | |
| | | | 343,525 | | |
| | | Shares | | Value
(000) | |
Korea, Republic of (2.2%) | |
LG Household & Health Care Ltd. | | | 41,912 | | | $ | 41,381 | | |
NCSoft Corp. | | | 33,020 | | | | 13,835 | | |
| | | | 55,216 | | |
Netherlands (8.3%) | |
Heineken N.V. | | | 727,744 | | | | 64,141 | | |
ING Groep N.V. | | | 3,102,861 | | | | 33,253 | | |
Unilever N.V. CVA | | | 1,923,147 | | | | 104,494 | | |
| | | | 201,888 | | |
Spain (1.0%) | |
Banco Bilbao Vizcaya Argentaria SA | | | 4,593,063 | | | | 24,228 | | |
Switzerland (5.1%) | |
Novartis AG (Registered) | | | 1,000,334 | | | | 85,677 | | |
Roche Holding AG (Genusschein) | | | 158,188 | | | | 39,116 | | |
| | | | 124,793 | | |
United Kingdom (24.4%) | |
Admiral Group PLC | | | 596,171 | | | | 15,497 | | |
Aggreko PLC | | | 1,768,241 | | | | 16,525 | | |
Aviva PLC | | | 7,561,168 | | | | 36,063 | | |
British American Tobacco PLC | | | 2,071,459 | | | | 66,057 | | |
BT Group PLC | | | 11,975,465 | | | | 36,250 | | |
Experian PLC | | | 1,761,707 | | | | 42,818 | | |
Ferguson PLC | | | 212,185 | | | | 13,590 | | |
GlaxoSmithKline PLC | | | 4,315,343 | | | | 81,904 | | |
Imperial Brands PLC | | | 478,934 | | | | 14,483 | | |
Man Group PLC | | | 14,587,660 | | | | 24,607 | | |
Prudential PLC | | | 3,262,356 | | | | 58,289 | | |
Reckitt Benckiser Group PLC | | | 1,406,987 | | | | 107,446 | | |
RELX PLC (c) | | | 2,293,803 | | | | 47,221 | | |
RELX PLC | | | 1,647,525 | | | | 33,838 | | |
| | | | 594,588 | | |
Total Common Stocks (Cost $2,069,112) | | | 2,400,145 | | |
Short-Term Investments (2.3%) | |
Securities held as Collateral on Loaned Securities (1.1%) | |
Investment Company (0.9%) | |
Morgan Stanley Institutional Liquidity
Funds — Treasury Securities Portfolio —
Institutional Class (See Note G) | | | 22,110,137 | | | | 22,110 | | |
The accompanying notes are an integral part of the financial statements.
8
Morgan Stanley Institutional Fund, Inc.
Annual Report — December 31, 2018
Portfolio of Investments (cont'd)
International Equity Portfolio
| | | Face
Amount
(000) | | Value
(000) | |
Repurchase Agreements (0.2%) | |
Barclays Capital, Inc., (2.90%,
dated 12/31/18, due 01/02/19;
proceeds $1,670; fully collateralized by a
U.S. Government obligation;
2.50% due 05/15/24; valued at $1,703) | | $ | 1,670 | | | $ | 1,670 | | |
HSBC Securities USA, Inc., (2.95%,
dated 12/31/18, due 01/02/19;
proceeds $3,385; fully collateralized by
U.S. Government obligations;
0.00% - 2.75% due
01/31/19 - 02/15/42; valued at $3,452) | | | 3,384 | | | | 3,384 | | |
| | | | 5,054 | | |
Total Securities held as Collateral on Loaned
Securities (Cost $27,164) | | | 27,164 | | |
| | | Shares | | | |
Investment Company (1.2%) | |
Morgan Stanley Institutional Liquidity
Funds — Treasury Securities Portfolio —
Institutional Class (See Note G)
(Cost $28,296) | | | 28,295,760 | | | | 28,296 | | |
Total Short-Term Investments (Cost $55,460) | | | 55,460 | | |
Total Investments (100.7%) (Cost $2,124,572)
Including $50,746 of Securities Loaned (d)(e) | | | 2,455,605 | | |
Liabilities in Excess of Other Assets (–0.7%) | | | (16,030 | ) | |
Net Assets (100.0%) | | $ | 2,439,575 | | |
Country assignments and aggregations are based generally on third party vendor classifications and information, and may be different from the assignments and aggregations under the policies set forth in the Fund's prospectus and/or statement of additional information relating to geographic classifications.
(a) All or a portion of this security was on loan at December 31, 2018.
(b) Security trades on the Hong Kong exchange.
(c) Non-income producing security.
(d) The approximate fair value and percentage of net assets, $2,285,708,000 and 93.7%, respectively, represent the securities that have been fair valued under the fair valuation policy for international investments as described in Note A-1 within the Notes to the Financial Statements.
(e) At December 31, 2018, the aggregate cost for federal income tax purposes is approximately $2,159,332,000. The aggregate gross unrealized appreciation is approximately $478,562,000 and the aggregate gross unrealized depreciation is approximately $182,289,000, resulting in net unrealized appreciation of approximately $296,273,000.
CVA Certificaten Van Aandelen.
Portfolio Composition*
Classification | | Percentage of
Total Investments | |
Other** | | | 32.9 | % | |
Pharmaceuticals | | | 14.3 | | |
Personal Products | | | 10.5 | | |
Beverages | | | 9.3 | | |
Household Products | | | 8.5 | | |
Insurance | | | 8.4 | | |
Software | | | 5.9 | | |
Banks | | | 5.1 | | |
Professional Services | | | 5.1 | | |
Total Investments | | | 100.0 | % | |
* Percentages indicated are based upon total investments (excluding Securities held as Collateral on Loaned Securities) as of December 31, 2018.
** Industries and/or investment types representing less than 5% of total investments.
The accompanying notes are an integral part of the financial statements.
9
Morgan Stanley Institutional Fund, Inc.
Annual Report — December 31, 2018
International Equity Portfolio
Statement of Assets and Liabilities | | December 31, 2018
(000) | |
Assets: | |
Investments in Securities of Unaffiliated Issuers, at Value(1) (Cost $2,074,166) | | $ | 2,405,199 | | |
Investment in Security of Affiliated Issuer, at Value (Cost $50,406) | | | 50,406 | | |
Total Investments in Securities, at Value (Cost $2,124,572) | | | 2,455,605 | | |
Foreign Currency, at Value (Cost $2,009) | | | 2,024 | | |
Cash from Securities Lending | | | 167 | | |
Tax Reclaim Receivable | | | 6,367 | | |
Receivable for Investments Sold | | | 5,951 | | |
Dividends Receivable | | | 5,186 | | |
Receivable for Fund Shares Sold | | | 3,528 | | |
Receivable from Securities Lending Income | | | 92 | | |
Receivable from Affiliate | | | 51 | | |
Other Assets | | | 208 | | |
Total Assets | | | 2,479,179 | | |
Liabilities: | |
Collateral on Securities Loaned, at Value | | | 27,331 | | |
Payable for Advisory Fees | | | 5,463 | | |
Payable for Fund Shares Redeemed | | | 5,233 | | |
Payable for Sub Transfer Agency Fees — Class I | | | 294 | | |
Payable for Sub Transfer Agency Fees — Class A | | | 163 | | |
Payable for Sub Transfer Agency Fees — Class L | | | 1 | | |
Payable for Sub Transfer Agency Fees — Class C | | | — | @ | |
Payable for Directors' Fees and Expenses | | | 345 | | |
Payable for Administration Fees | | | 178 | | |
Payable for Investments Purchased | | | 177 | | |
Payable for Custodian Fees | | | 86 | | |
Payable for Shareholder Services Fees — Class A | | | 65 | | |
Payable for Distribution and Shareholder Services Fees — Class L | | | 3 | | |
Payable for Distribution and Shareholder Services Fees — Class C | | | 1 | | |
Payable for Professional Fees | | | 59 | | |
Payable for Transfer Agency Fees — Class I | | | 9 | | |
Payable for Transfer Agency Fees — Class A | | | 5 | | |
Payable for Transfer Agency Fees — Class L | | | 1 | | |
Payable for Transfer Agency Fees — Class C | | | 1 | | |
Payable for Transfer Agency Fees — Class IS | | | 1 | | |
Other Liabilities | | | 188 | | |
Total Liabilities | | | 39,604 | | |
Net Assets | | $ | 2,439,575 | | |
Net Assets Consist of: | |
Paid-in-Capital | | $ | 2,121,345 | | |
Total Distributable Earnings | | | 318,230 | | |
Net Assets | | $ | 2,439,575 | | |
The accompanying notes are an integral part of the financial statements.
10
Morgan Stanley Institutional Fund, Inc.
Annual Report — December 31, 2018
International Equity Portfolio
Statement of Assets and Liabilities (cont'd) | | December 31, 2018
(000) | |
CLASS I: | |
Net Assets | | $ | 1,725,392 | | |
| Shares Outstanding $0.001 par value shares of beneficial interest (unlimited shares authorized) (not in 000's) | | | 127,936,608 | | |
Net Asset Value, Offering and Redemption Price Per Share | | $ | 13.49 | | |
CLASS A: | |
Net Assets | | $ | 244,622 | | |
| Shares Outstanding $0.001 par value shares of beneficial interest (unlimited shares authorized) (not in 000's) | | | 18,227,689 | | |
Net Asset Value, Redemption Price Per Share | | $ | 13.42 | | |
Maximum Sales Load | | | 5.25 | % | |
Maximum Sales Charge | | $ | 0.74 | | |
Maximum Offering Price Per Share | | $ | 14.16 | | |
CLASS L: | |
Net Assets | | $ | 6,022 | | |
| Shares Outstanding $0.001 par value shares of beneficial interest (unlimited shares authorized) (not in 000's) | | | 453,422 | | |
Net Asset Value, Offering and Redemption Price Per Share | | $ | 13.28 | | |
CLASS C: | |
Net Assets | | $ | 787 | | |
| Shares Outstanding $0.001 par value shares of beneficial interest (unlimited shares authorized) (not in 000's) | | | 60,158 | | |
Net Asset Value, Offering and Redemption Price Per Share | | $ | 13.08 | | |
CLASS IS: | |
Net Assets | | $ | 462,752 | | |
| Shares Outstanding $0.001 par value shares of beneficial interest (unlimited shares authorized) (not in 000's) | | | 34,316,137 | | |
Net Asset Value, Offering and Redemption Price Per Share | | $ | 13.48 | | |
(1) Including:
Securities on Loan, at Value: | | $ | 50,746 | | |
@ Amount is less than $500.
The accompanying notes are an integral part of the financial statements.
11
Morgan Stanley Institutional Fund, Inc.
Annual Report — December 31, 2018
International Equity Portfolio
Statement of Operations | | Year Ended
December 31, 2018
(000) | |
Investment Income: | |
Dividends from Securities of Unaffiliated Issuers (Net of $9,690 of Foreign Taxes Withheld) | | $ | 100,493 | | |
Dividends from Security of Affiliated Issuer (Note G) | | | 914 | | |
Income from Securities Loaned — Net | | | 776 | | |
Total Investment Income | | | 102,183 | | |
Expenses: | |
Advisory Fees (Note B) | | | 27,880 | | |
Sub Transfer Agency Fees — Class I | | | 1,511 | | |
Sub Transfer Agency Fees — Class A | | | 1,371 | | |
Sub Transfer Agency Fees — Class L | | | — | @ | |
Sub Transfer Agency Fees — Class C | | | 1 | | |
Administration Fees (Note C) | | | 2,788 | | |
Shareholder Services Fees — Class A (Note D) | | | 2,197 | | |
Distribution and Shareholder Services Fees — Class L (Note D) | | | 47 | | |
Distribution and Shareholder Services Fees — Class C (Note D) | | | 8 | | |
Custodian Fees (Note F) | | | 183 | | |
Registration Fees | | | 125 | | |
Professional Fees | | | 118 | | |
Shareholder Reporting Fees | | | 107 | | |
Directors' Fees and Expenses | | | 96 | | |
Transfer Agency Fees — Class I (Note E) | | | 25 | | |
Transfer Agency Fees — Class A (Note E) | | | 16 | | |
Transfer Agency Fees — Class L (Note E) | | | 4 | | |
Transfer Agency Fees — Class C (Note E) | | | 2 | | |
Transfer Agency Fees — Class IS (Note E) | | | 3 | | |
Pricing Fees | | | 2 | | |
Other Expenses | | | 166 | | |
Total Expenses | | | 36,650 | | |
Reimbursement of Class Specific Expenses — Class I (Note B) | | | (678 | ) | |
Reimbursement of Class Specific Expenses — Class A (Note B) | | | (98 | ) | |
Reimbursement of Class Specific Expenses — Class C (Note B) | | | (2 | ) | |
Rebate from Morgan Stanley Affiliate (Note G) | | | (108 | ) | |
Net Expenses | | | 35,764 | | |
Net Investment Income | | | 66,419 | | |
Realized Gain (Loss): | |
Investments Sold | | | 405,949 | | |
Foreign Currency Forward Exchange Contracts | | | (8,197 | ) | |
Foreign Currency Translation | | | (735 | ) | |
Net Realized Gain | | | 397,017 | | |
Change in Unrealized Appreciation (Depreciation): | |
Investments | | | (917,225 | ) | |
Foreign Currency Forward Exchange Contracts | | | 777 | | |
Foreign Currency Translation | | | (214 | ) | |
Net Change in Unrealized Appreciation (Depreciation) | | | (916,662 | ) | |
Net Realized Gain and Change in Unrealized Appreciation (Depreciation) | | | (519,645 | ) | |
Net Decrease in Net Assets Resulting from Operations | | $ | (453,226 | ) | |
@ Amount is less than $500.
The accompanying notes are an integral part of the financial statements.
12
Morgan Stanley Institutional Fund, Inc.
Annual Report — December 31, 2018
International Equity Portfolio
Statements of Changes in Net Assets | | Year Ended
December 31, 2018
(000) | | Year Ended
December 31, 2017
(000) | |
Increase (Decrease) in Net Assets: | |
Operations: | |
Net Investment Income | | $ | 66,419 | | | $ | 59,107 | | |
Net Realized Gain | | | 397,017 | | | | 184,476 | | |
Net Change in Unrealized Appreciation (Depreciation) | | | (916,662 | ) | | | 682,743 | | |
Net Increase (Decrease) in Net Assets Resulting from Operations | | | (453,226 | ) | | | 926,326 | | |
Dividends and Distributions to Shareholders: | |
Class I | | | (239,211 | ) | | | (33,238 | )* | |
Class A | | | (35,769 | ) | | | (20,120 | )* | |
Class L | | | (631 | ) | | | (80 | )* | |
Class C | | | (98 | ) | | | (7 | )* | |
Class IS | | | (61,348 | ) | | | (23,796 | )* | |
Total Dividends and Distributions to Shareholders | | | (337,057 | ) | | | (77,241 | ) | |
Capital Share Transactions:(1) | |
Class I: | |
Subscribed | | | 851,975 | | | | 188,753 | | |
Distributions Reinvested | | | 226,885 | | | | 31,004 | | |
Redeemed | | | (503,337 | ) | | | (607,988 | ) | |
Class A: | |
Subscribed | | | 67,050 | | | | 78,806 | | |
Distributions Reinvested | | | 35,438 | | | | 20,074 | | |
Redeemed | | | (984,495 | ) | | | (294,914 | ) | |
Class L: | |
Exchanged | | | 1,371 | | | | 115 | | |
Distributions Reinvested | | | 624 | | | | 79 | | |
Redeemed | | | (1,549 | ) | | | (1,585 | ) | |
Class C: | |
Subscribed | | | 314 | | | | 260 | | |
Distributions Reinvested | | | 96 | | | | 7 | | |
Redeemed | | | (74 | ) | | | (164 | ) | |
Class IS: | |
Subscribed | | | 58,361 | | | | 206,211 | | |
Distributions Reinvested | | | 53,242 | | | | 22,187 | | |
Redeemed | | | (737,033 | ) | | | (293,178 | ) | |
Net Decrease in Net Assets Resulting from Capital Share Transactions | | | (931,132 | ) | | | (650,333 | ) | |
Redemption Fees | | | 24 | | | | 31 | | |
Total Increase (Decrease) in Net Assets | | | (1,721,391 | ) | | | 198,783 | | |
Net Assets: | |
Beginning of Period | | | 4,160,966 | | | | 3,962,183 | | |
End of Period | | $ | 2,439,575 | | | $ | 4,160,966 | † | |
The accompanying notes are an integral part of the financial statements.
13
Morgan Stanley Institutional Fund, Inc.
Annual Report — December 31, 2018
International Equity Portfolio
Statements of Changes in Net Assets (cont'd) | | Year Ended
December 31, 2018
(000) | | Year Ended
December 31, 2017
(000) | |
(1) Capital Share Transactions: | |
Class I: | |
Shares Subscribed | | | 48,024 | | | | 11,313 | | |
Shares Issued on Distributions Reinvested | | | 16,732 | | | | 1,773 | | |
Shares Redeemed | | | (30,945 | ) | | | (36,417 | ) | |
Net Increase (Decrease) in Class I Shares Outstanding | | | 33,811 | | | | (23,331 | ) | |
Class A: | |
Shares Subscribed | | | 4,034 | | | | 4,760 | | |
Shares Issued on Distributions Reinvested | | | 2,603 | | | | 1,168 | | |
Shares Redeemed | | | (57,785 | ) | | | (17,931 | ) | |
Net Decrease in Class A Shares Outstanding | | | (51,148 | ) | | | (12,003 | ) | |
Class L: | |
Shares Exchanged | | | 103 | | | | 7 | | |
Shares Issued on Distributions Reinvested | | | 47 | | | | 5 | | |
Shares Redeemed | | | (98 | ) | | | (97 | ) | |
Net Increase (Decrease) in Class L Shares Outstanding | | | 52 | | | | (85 | ) | |
Class C: | |
Shares Subscribed | | | 19 | | | | 16 | | |
Shares Issued on Distributions Reinvested | | | 7 | | | | — | @@ | |
Shares Redeemed | | | (5 | ) | | | (11 | ) | |
Net Increase in Class C Shares Outstanding | | | 21 | | | | 5 | | |
Class IS: | |
Shares Subscribed | | | 3,302 | | | | 12,066 | | |
Shares Issued on Distributions Reinvested | | | 3,921 | | | | 1,267 | | |
Shares Redeemed | | | (41,355 | ) | | | (17,169 | ) | |
Net Decrease in Class IS Shares Outstanding | | | (34,132 | ) | | | (3,836 | ) | |
@@ Amount is less than 500 shares.
The following information was previously reported in the December 31, 2017 financial statements. The distribution information for the year ended December 31, 2017 presented on the Statements of Changes in Net Assets is presented for comparative purposes to the December 31, 2018 financial statements, which conform to the SEC Final Rule on Disclosure Update and Simplification which was effective November 5, 2018.
* Dividends and Distributions to Shareholders for the year ended December 31, 2017 were as follows:
Class I: | |
Net Investment Income | | $ | (33,238 | ) | |
Class A: | |
Net Investment Income | | $ | (20,120 | ) | |
Class L: | |
Net Investment Income | | $ | (80 | ) | |
Class C: | |
Net Investment Income | | $ | (7 | ) | |
Class IS: | |
Net Investment Income | | $ | (23,796 | ) | |
† Accumulated Undistributed Net Investment Income for the year ended December 31, 2017 was $5,551.
The accompanying notes are an integral part of the financial statements.
14
Morgan Stanley Institutional Fund, Inc.
Annual Report — December 31, 2018
Financial Highlights
International Equity Portfolio
| | | Class I | |
| | | Year Ended December 31, | |
Selected Per Share Data and Ratios | | 2018 | | 2017 | | 2016(1) | | 2015 | | 2014 | |
Net Asset Value, Beginning of Period | | $ | 17.97 | | | $ | 14.64 | | | $ | 15.10 | | | $ | 15.47 | | | $ | 16.98 | | |
Income (Loss) from Investment Operations: | |
Net Investment Income(2) | | | 0.31 | | | | 0.26 | | | | 0.27 | | | | 0.30 | | | | 0.39 | | |
Net Realized and Unrealized Gain (Loss) | | | (2.78 | ) | | | 3.41 | | | | (0.57 | ) | | | (0.23 | ) | | | (1.42 | ) | |
Total from Investment Operations | | | (2.47 | ) | | | 3.67 | | | | (0.30 | ) | | | 0.07 | | | | (1.03 | ) | |
Distributions from and/or in Excess of: | |
Net Investment Income | | | (0.39 | ) | | | (0.34 | ) | | | (0.16 | ) | | | (0.44 | ) | | | (0.48 | ) | |
Net Realized Gain | | | (1.62 | ) | | | — | | | | — | | | | — | | | | — | | |
Total Distributions | | | (2.01 | ) | | | (0.34 | ) | | | (0.16 | ) | | | (0.44 | ) | | | (0.48 | ) | |
Redemption Fees | | | 0.00 | (3) | | | 0.00 | (3) | | | 0.00 | (3) | | | 0.00 | (3) | | | 0.00 | (3) | |
Net Asset Value, End of Period | | $ | 13.49 | | | $ | 17.97 | | | $ | 14.64 | | | $ | 15.10 | | | $ | 15.47 | | |
Total Return(4) | | | (13.80 | )% | | | 25.17 | % | | | (2.00 | )% | | | 0.36 | % | | | (6.08 | )% | |
Ratios and Supplemental Data: | |
Net Assets, End of Period (Thousands) | | $ | 1,725,392 | | | $ | 1,691,807 | | | $ | 1,719,699 | | | $ | 2,073,782 | | | $ | 2,620,040 | | |
Ratio of Expenses to Average Net Assets(7) | | | 0.95 | %(5) | | | 0.95 | %(5) | | | 0.95 | %(5) | | | 0.95 | %(5) | | | 0.95 | %(5) | |
Ratio of Expenses to Average Net Assets Excluding Non Operating Expenses | | | N/A | | | | N/A | | | | 0.95 | %(5) | | | 0.95 | %(5) | | | 0.95 | %(5) | |
Ratio of Net Investment Income to Average Net Assets(7) | | | 1.82 | %(5) | | | 1.54 | %(5) | | | 1.86 | %(5) | | | 1.85 | %(5) | | | 2.33 | %(5) | |
Ratio of Rebate from Morgan Stanley Affiliates to Average Net Assets | | | 0.00 | %(6) | | | 0.00 | %(6) | | | 0.00 | %(6) | | | 0.00 | %(6) | | | 0.00 | %(6) | |
Portfolio Turnover Rate | | | 34 | % | | | 18 | % | | | 33 | % | | | 29 | % | | | 29 | % | |
(7) Supplemental Information on the Ratios to Average Net Assets: | |
Ratios Before Expense Limitation: | |
Expenses to Average Net Assets | | | 0.99 | % | | | 0.99 | % | | | 0.98 | % | | | 1.01 | % | | | 1.04 | % | |
Net Investment Income to Average Net Assets | | | 1.78 | % | | | 1.50 | % | | | 1.83 | % | | | 1.79 | % | | | 2.24 | % | |
(1) Reflects prior period Custodian out-of-pocket expenses that were reimbursed in September 2016. The amount of the reimbursement was immaterial on a per share basis and did not impact the total return of Class I shares. The Ratio of Expenses to Average Net Assets and the Ratio of Net Investment Income to Average Net Assets would be unchanged as the reimbursement of Custodian fees was offset against expense waivers/reimbursements with no impact to net expenses or net investment income.
(2) Per share amount is based on average shares outstanding.
(3) Amount is less than $0.005 per share.
(4) Calculated based on the net asset value as of the last business day of the period.
(5) The Ratios of Expenses and Net Investment Income reflect the rebate of certain Fund expenses in connection with the investments in Morgan Stanley affiliates during the period. The effect of the rebate on the ratios is disclosed in the above table as "Ratio of Rebate from Morgan Stanley Affiliates to Average Net Assets."
(6) Amount is less than 0.005%.
The accompanying notes are an integral part of the financial statements.
15
Morgan Stanley Institutional Fund, Inc.
Annual Report — December 31, 2018
Financial Highlights
International Equity Portfolio
| | | Class A | |
| | | Year Ended December 31, | |
Selected Per Share Data and Ratios | | 2018 | | 2017 | | 2016(1) | | 2015 | | 2014 | |
Net Asset Value, Beginning of Period | | $ | 17.75 | | | $ | 14.46 | | | $ | 14.91 | | | $ | 15.28 | | | $ | 16.78 | | |
Income (Loss) from Investment Operations: | |
Net Investment Income(2) | | | 0.32 | | | | 0.19 | | | | 0.23 | | | | 0.24 | | | | 0.31 | | |
Net Realized and Unrealized Gain (Loss) | | | (2.82 | ) | | | 3.38 | | | | (0.58 | ) | | | (0.23 | ) | | | (1.38 | ) | |
Total from Investment Operations | | | (2.50 | ) | | | 3.57 | | | | (0.35 | ) | | | 0.01 | | | | (1.07 | ) | |
Distributions from and/or in Excess of: | |
Net Investment Income | | | (0.21 | ) | | | (0.28 | ) | | | (0.10 | ) | | | (0.38 | ) | | | (0.43 | ) | |
Net Realized Gain | | | (1.62 | ) | | | — | | | | — | | | | — | | | | — | | |
Total Distributions | | | (1.83 | ) | | | (0.28 | ) | | | (0.10 | ) | | | (0.38 | ) | | | (0.43 | ) | |
Redemption Fees | | | 0.00 | (3) | | | 0.00 | (3) | | | 0.00 | (3) | | | 0.00 | (3) | | | 0.00 | (3) | |
Net Asset Value, End of Period | | $ | 13.42 | | | $ | 17.75 | | | $ | 14.46 | | | $ | 14.91 | | | $ | 15.28 | | |
Total Return(4) | | | (14.13 | )% | | | 24.77 | % | | | (2.33 | )% | | | (0.02 | )% | | | (6.43 | )% | |
Ratios and Supplemental Data: | |
Net Assets, End of Period (Thousands) | | $ | 244,622 | | | $ | 1,231,279 | | | $ | 1,176,835 | | | $ | 1,369,566 | | | $ | 1,576,475 | | |
Ratio of Expenses to Average Net Assets(7) | | | 1.30 | %(5) | | | 1.30 | %(5) | | | 1.29 | %(5) | | | 1.30 | %(5) | | | 1.30 | %(5) | |
Ratio of Expenses to Average Net Assets Excluding Non Operating Expenses | | | N/A | | | | N/A | | | | 1.29 | %(5) | | | 1.30 | %(5) | | | 1.30 | %(5) | |
Ratio of Net Investment Income to Average Net Assets(7) | | | 1.83 | %(5) | | | 1.16 | %(5) | | | 1.60 | %(5) | | | 1.48 | %(5) | | | 1.89 | %(5) | |
Ratio of Rebate from Morgan Stanley Affiliates to Average Net Assets | | | 0.00 | %(6) | | | 0.00 | %(6) | | | 0.01 | % | | | 0.00 | %(6) | | | 0.00 | %(6) | |
Portfolio Turnover Rate | | | 34 | % | | | 18 | % | | | 33 | % | | | 29 | % | | | 29 | % | |
(7) Supplemental Information on the Ratios to Average Net Assets: | |
Ratios Before Expense Limitation: | |
Expenses to Average Net Assets | | | 1.31 | % | | | 1.31 | % | | | 1.30 | % | | | 1.32 | % | | | 1.34 | % | |
Net Investment Income to Average Net Assets | | | 1.82 | % | | | 1.15 | % | | | 1.59 | % | | | 1.46 | % | | | 1.85 | % | |
(1) Reflects prior period Custodian out-of-pocket expenses that were reimbursed in September 2016. The amount of the reimbursement was immaterial on a per share basis and did not impact the total return of Class A shares. The Ratio of Expenses to Average Net Assets would have been less than 0.005% higher and the Ratio of Net Investment Income to Average Net Assets would have been less than 0.005% lower had the Custodian not reimbursed the Fund.
(2) Per share amount is based on average shares outstanding.
(3) Amount is less than $0.005 per share.
(4) Calculated based on the net asset value which does not reflect sales charges, if applicable, as of the last business day of the period.
(5) The Ratios of Expenses and Net Investment Income reflect the rebate of certain Fund expenses in connection with the investments in Morgan Stanley affiliates during the period. The effect of the rebate on the ratios is disclosed in the above table as "Ratio of Rebate from Morgan Stanley Affiliates to Average Net Assets."
(6) Amount is less than 0.005%.
The accompanying notes are an integral part of the financial statements.
16
Morgan Stanley Institutional Fund, Inc.
Annual Report — December 31, 2018
Financial Highlights
International Equity Portfolio
| | | Class L | |
| | | Year Ended December 31, | |
Selected Per Share Data and Ratios | | 2018 | | 2017 | | 2016(1) | | 2015 | | 2014 | |
Net Asset Value, Beginning of Period | | $ | 17.70 | | | $ | 14.43 | | | $ | 14.87 | | | $ | 15.23 | | | $ | 16.71 | | |
Income (Loss) from Investment Operations: | |
Net Investment Income(2) | | | 0.10 | | | | 0.11 | | | | 0.16 | | | | 0.15 | | | | 0.24 | | |
Net Realized and Unrealized Gain (Loss) | | | (2.66 | ) | | | 3.35 | | | | (0.58 | ) | | | (0.21 | ) | | | (1.39 | ) | |
Total from Investment Operations | | | (2.56 | ) | | | 3.46 | | | | (0.42 | ) | | | (0.06 | ) | | | (1.15 | ) | |
Distributions from and/or in Excess of: | |
Net Investment Income | | | (0.24 | ) | | | (0.19 | ) | | | (0.02 | ) | | | (0.30 | ) | | | (0.33 | ) | |
Net Realized Gain | | | (1.62 | ) | | | — | | | | — | | | | — | | | | — | | |
Total Distributions | | | (1.86 | ) | | | (0.19 | ) | | | (0.02 | ) | | | (0.30 | ) | | | (0.33 | ) | |
Redemption Fees | | | 0.00 | (3) | | | 0.00 | (3) | | | 0.00 | (3) | | | 0.00 | (3) | | | 0.00 | (3) | |
Net Asset Value, End of Period | | $ | 13.28 | | | $ | 17.70 | | | $ | 14.43 | | | $ | 14.87 | | | $ | 15.23 | | |
Total Return(4) | | | (14.49 | )% | | | 24.06 | % | | | (2.82 | )% | | | (0.47 | )% | | | (6.91 | )% | |
Ratios and Supplemental Data: | |
Net Assets, End of Period (Thousands) | | $ | 6,022 | | | $ | 7,099 | | | $ | 7,008 | | | $ | 9,053 | | | $ | 9,763 | | |
Ratio of Expenses to Average Net Assets(7) | | | 1.72 | %(5) | | | 1.80 | %(5) | | | 1.80 | %(5) | | | 1.80 | %(5) | | | 1.80 | %(5) | |
Ratio of Expenses to Average Net Assets Excluding Non Operating Expenses | | | N/A | | | | N/A | | | | 1.80 | %(5) | | | 1.80 | %(5) | | | 1.80 | %(5) | |
Ratio of Net Investment Income to Average Net Assets(7) | | | 1.17 | %(5) | | | 0.69 | %(5) | | | 1.09 | %(5) | | | 0.97 | %(5) | | | 1.48 | %(5) | |
Ratio of Rebate from Morgan Stanley Affiliates to Average Net Assets | | | 0.00 | %(6) | | | 0.00 | %(6) | | | 0.00 | %(6) | | | 0.00 | %(6) | | | 0.00 | %(6) | |
Portfolio Turnover Rate | | | 34 | % | | | 18 | % | | | 33 | % | | | 29 | % | | | 29 | % | |
(7) Supplemental Information on the Ratios to Average Net Assets: | |
Ratios Before Expense Limitation: | |
Expenses to Average Net Assets | | | N/A | | | | 1.90 | % | | | 1.93 | % | | | 1.89 | % | | | 1.89 | % | |
Net Investment Income to Average Net Assets | | | N/A | | | | 0.59 | % | | | 0.96 | % | | | 0.88 | % | | | 1.38 | % | |
(1) Reflects prior period Custodian out-of-pocket expenses that were reimbursed in September 2016. The amount of the reimbursement was immaterial on a per share basis and did not impact the total return of Class L shares. The Ratio of Expenses to Average Net Assets and the Ratio of Net Investment Income to Average Net Assets would be unchanged as the reimbursement of Custodian fees was offset against expense waivers/reimbursements with no impact to net expenses or net investment income.
(2) Per share amount is based on average shares outstanding.
(3) Amount is less than $0.005 per share.
(4) Calculated based on the net asset value as of the last business day of the period.
(5) The Ratios of Expenses and Net Investment Income reflect the rebate of certain Fund expenses in connection with the investments in Morgan Stanley affiliates during the period. The effect of the rebate on the ratios is disclosed in the above table as "Ratio of Rebate from Morgan Stanley Affiliates to Average Net Assets."
(6) Amount is less than 0.005%.
The accompanying notes are an integral part of the financial statements.
17
Morgan Stanley Institutional Fund, Inc.
Annual Report — December 31, 2018
Financial Highlights
International Equity Portfolio
| | | Class C | |
| | | Year Ended December 31, | | Period from
April 30, 2015(2) to | |
Selected Per Share Data and Ratios | | 2018 | | 2017 | | 2016(1) | | December 31, 2015 | |
Net Asset Value, Beginning of Period | | $ | 17.51 | | | $ | 14.31 | | | $ | 14.77 | | | $ | 16.70 | | |
Income (Loss) from Investment Operations: | |
Net Investment Income (Loss)(3) | | | 0.05 | | | | 0.04 | | | | 0.14 | | | | (0.03 | ) | |
Net Realized and Unrealized Gain (Loss) | | | (2.64 | ) | | | 3.35 | | | | (0.58 | ) | | | (1.53 | ) | |
Total from Investment Operations | | | (2.59 | ) | | | 3.39 | | | | (0.44 | ) | | | (1.56 | ) | |
Distributions from and/or in Excess of: | |
Net Investment Income | | | (0.22 | ) | | | (0.19 | ) | | | (0.02 | ) | | | (0.37 | ) | |
Net Realized Gain | | | (1.62 | ) | | | — | | | | — | | | | — | | |
Total Distributions | | | (1.84 | ) | | | (0.19 | ) | | | (0.02 | ) | | | (0.37 | ) | |
Redemption Fees | | | 0.00 | (4) | | | 0.00 | (4) | | | 0.00 | (4) | | | 0.00 | (4) | |
Net Asset Value, End of Period | | $ | 13.08 | | | $ | 17.51 | | | $ | 14.31 | | | $ | 14.77 | | |
Total Return(5) | | | (14.82 | )% | | | 23.78 | % | | | (3.01 | )% | | | (9.41 | )%(8) | |
Ratios and Supplemental Data: | |
Net Assets, End of Period (Thousands) | | $ | 787 | | | $ | 677 | | | $ | 476 | | | $ | 372 | | |
Ratio of Expenses to Average Net Assets(10) | | | 2.05 | %(6) | | | 2.05 | %(6) | | | 2.05 | %(6) | | | 2.05 | %(6)(9) | |
Ratio of Expenses to Average Net Assets Excluding Non Operating Expenses | | | N/A | | | | N/A | | | | 2.05 | %(6) | | | 2.05 | %(6)(9) | |
Ratio of Net Investment Income (Loss) to Average Net Assets(10) | | | 0.83 | %(6) | | | 0.22 | %(6) | | | 0.95 | %(6) | | | (0.27 | )%(6)(9) | |
Ratio of Rebate from Morgan Stanley Affiliates to Average Net Assets | | | 0.00 | %(7) | | | 0.00 | %(7) | | | 0.00 | %(7) | | | 0.00 | %(7)(9) | |
Portfolio Turnover Rate | | | 34 | % | | | 18 | % | | | 33 | % | | | 29 | % | |
(10) Supplemental Information on the Ratios to Average Net Assets: | |
Ratios Before Expense Limitation: | |
Expenses to Average Net Assets | | | 2.27 | % | | | 2.41 | % | | | 2.40 | % | | | 2.75 | %(9) | |
Net Investment Income (Loss) to Average Net Assets | | | 0.61 | % | | | (0.14 | )% | | | 0.60 | % | | | (0.97 | )%(9) | |
(1) Reflects prior period Custodian out-of-pocket expenses that were reimbursed in September 2016. The amount of the reimbursement was immaterial on a per share basis and did not impact the total return of Class C shares. The Ratio of Expenses to Average Net Assets and the Ratio of Net Investment Income to Average Net Assets would be unchanged as the reimbursement of Custodian fees was offset against expense waivers/reimbursements with no impact to net expenses or net investment income.
(2) Commencement of Offering.
(3) Per share amount is based on average shares outstanding.
(4) Amount is less than $0.005 per share.
(5) Calculated based on the net asset value which does not reflect sales charges, if applicable, as of the last business day of the period.
(6) The Ratios of Expenses and Net Investment Income (Loss) reflect the rebate of certain Fund expenses in connection with the investments in Morgan Stanley affiliates during the period. The effect of the rebate on the ratios is disclosed in the above table as "Ratio of Rebate from Morgan Stanley Affiliates to Average Net Assets."
(7) Amount is less than 0.005%.
(8) Not annualized.
(9) Annualized.
The accompanying notes are an integral part of the financial statements.
18
Morgan Stanley Institutional Fund, Inc.
Annual Report — December 31, 2018
Financial Highlights
International Equity Portfolio
| | | Class IS | |
| | | Year Ended December 31, | |
Selected Per Share Data and Ratios | | 2018 | | 2017 | | 2016(1) | | 2015 | | 2014 | |
Net Asset Value, Beginning of Period | | $ | 17.97 | | | $ | 14.64 | | | $ | 15.10 | | | $ | 15.47 | | | $ | 16.98 | | |
Income (Loss) from Investment Operations: | |
Net Investment Income(2) | | | 0.38 | | | | 0.26 | | | | 0.29 | | | | 0.30 | | | | 0.40 | | |
Net Realized and Unrealized Gain (Loss) | | | (2.86 | ) | | | 3.42 | | | | (0.59 | ) | | | (0.23 | ) | | | (1.43 | ) | |
Total from Investment Operations | | | (2.48 | ) | | | 3.68 | | | | (0.30 | ) | | | 0.07 | | | | (1.03 | ) | |
Distributions from and/or in Excess of: | |
Net Investment Income | | | (0.39 | ) | | | (0.35 | ) | | | (0.16 | ) | | | (0.44 | ) | | | (0.48 | ) | |
Net Realized Gain | | | (1.62 | ) | | | — | | | | — | | | | — | | | | — | | |
Total Distributions | | | (2.01 | ) | | | (0.35 | ) | | | (0.16 | ) | | | (0.44 | ) | | | (0.48 | ) | |
Redemption Fees | | | 0.00 | (3) | | | 0.00 | (3) | | | 0.00 | (3) | | | 0.00 | (3) | | | 0.00 | (3) | |
Net Asset Value, End of Period | | $ | 13.48 | | | $ | 17.97 | | | $ | 14.64 | | | $ | 15.10 | | | $ | 15.47 | | |
Total Return(4) | | | (13.76 | )% | | | 25.22 | % | | | (1.95 | )% | | | 0.40 | % | | | (6.07 | )% | |
Ratios and Supplemental Data: | |
Net Assets, End of Period (Thousands) | | $ | 462,752 | | | $ | 1,230,104 | | | $ | 1,058,165 | | | $ | 872,167 | | | $ | 715,262 | | |
Ratio of Expenses to Average Net Assets(7) | | | 0.90 | %(5) | | | 0.91 | %(5) | | | 0.91 | %(5) | | | 0.91 | %(5) | | | 0.91 | %(5) | |
Ratio of Expenses to Average Net Assets Excluding Non Operating Expenses | | | N/A | | | | N/A | | | | 0.91 | %(5) | | | 0.91 | %(5) | | | 0.91 | %(5) | |
Ratio of Net Investment Income to Average Net Assets(7) | | | 2.19 | %(5) | | | 1.52 | %(5) | | | 1.96 | %(5) | | | 1.84 | %(5) | | | 2.36 | %(5) | |
Ratio of Rebate from Morgan Stanley Affiliates to Average Net Assets | | | 0.00 | %(6) | | | 0.00 | %(6) | | | 0.00 | %(6) | | | 0.00 | %(6) | | | 0.00 | %(6) | |
Portfolio Turnover Rate | | | 34 | % | | | 18 | % | | | 33 | % | | | 29 | % | | | 29 | % | |
(7) Supplemental Information on the Ratios to Average Net Assets: | |
Ratios Before Expense Limitation: | |
Expenses to Average Net Assets | | | N/A | | | | 0.91 | % | | | 0.91 | % | | | 0.91 | % | | | 0.91 | % | |
Net Investment Income to Average Net Assets | | | N/A | | | | 1.52 | % | | | 1.96 | % | | | 1.84 | % | | | 2.36 | % | |
(1) Reflects prior period Custodian out-of-pocket expenses that were reimbursed in September 2016. The amount of the reimbursement was immaterial on a per share basis and did not impact the total return of Class IS shares. The Ratio of Expenses to Average Net Assets would have been less than 0.005% higher and the Ratio of Net Investment Income to Average Net Assets would have been less than 0.005% lower had the Custodian not reimbursed the Fund.
(2) Per share amount is based on average shares outstanding.
(3) Amount is less than $0.005 per share.
(4) Calculated based on the net asset value as of the last business day of the period.
(5) The Ratios of Expenses and Net Investment Income reflect the rebate of certain Fund expenses in connection with the investments in Morgan Stanley affiliates during the period. The effect of the rebate on the ratios is disclosed in the above table as "Ratio of Rebate from Morgan Stanley Affiliates to Average Net Assets."
(6) Amount is less than 0.005%.
The accompanying notes are an integral part of the financial statements.
19
Morgan Stanley Institutional Fund, Inc.
Annual Report — December 31, 2018
Notes to Financial Statements
Morgan Stanley Institutional Fund, Inc. (the "Company") is registered under the Investment Company Act of 1940, as amended (the "Act"), as an open-end management investment company. The Company is comprised of thirty separate, active, diversified and non-diversified funds (individually referred to as a "Fund", collectively as the "Funds"). The Company applies investment company accounting and reporting guidance.
The accompanying financial statements relate to the International Equity Portfolio. The Fund seeks long-term capital appreciation by investing primarily in equity securities of non-U.S. issuers.
The Fund offers five classes of shares — Class I, Class A, Class L, Class C and Class IS. On April 30, 2015, the Fund suspended offering of Class L shares. Existing Class L shareholders may invest through reinvestment of dividends and distributions.
A. Significant Accounting Policies: The following significant accounting policies are in conformity with U.S. generally accepted accounting principles ("GAAP"). Such policies are consistently followed by the Company in the preparation of its financial statements. GAAP may require management to make estimates and assumptions that affect the reported amounts and disclosures in the financial statements. Actual results may differ from those estimates.
In August 2018, the Financial Accounting Standards Board ("FASB") issued Accounting Standards Update ("ASU") 2018-13, Fair Value Measurement (Topic 820) — Disclosures Framework — Changes to Disclosure Requirements of Fair Value Measurement ("ASU 2018-13") which introduces new fair value disclosure requirements as well as eliminates and modifies certain existing fair value disclosure requirements. ASU 2018-13 would be effective for fiscal years beginning after December 15, 2019 and for interim periods within those fiscal years; however, management has elected to early adopt ASU 2018-13 effective with the current reporting period as permitted by the standard. The impact of the Fund's adoption was limited to changes in the Fund's financial statement disclosures regarding fair value, primarily those disclosures related to transfers between levels of the fair value hierarchy and disclosure of the range and weighted average used to develop significant unobservable inputs for Level 3 fair value measurements, when applicable.
1. Security Valuation: (1) An equity portfolio security listed or traded on an exchange is valued at its latest reported sales price (or at the exchange official closing price
if such exchange reports an official closing price), and if there were no sales on a given day and if there is no official exchange closing price for that day, the security is valued at the mean between the last reported bid and asked prices if such bid and asked prices are available on the relevant exchanges. Listed equity securities not traded on the valuation date with no reported bid and asked prices available on the exchange are valued at the mean between the current bid and asked prices obtained from one or more reputable brokers or dealers. In cases where a security is traded on more than one exchange, the security is valued on the exchange designated as the primary market; (2) all other equity portfolio securities for which over-the-counter ("OTC") market quotations are readily available are valued at the latest reported sales price (or at the market official closing price if such market reports an official closing price), and if there was no trading in the security on a given day and if there is no official closing price from relevant markets for that day, the security is valued at the mean between the last reported bid and asked prices if such bid and asked prices are available on the relevant markets. An unlisted equity security that does not trade on the valuation date and for which bid and asked prices from the relevant markets are unavailable is valued at the mean between the current bid and asked prices obtained from one or more reputable brokers or dealers; (3) certain portfolio securities may be valued by an outside pricing service/vendor approved by the Company's Board of Directors (the "Directors"). The pricing service/vendor may employ a pricing model that takes into account, among other things, bids, yield spreads and/or other market data and specific security characteristics. Alternatively, if a valuation is not available from an outside pricing service/vendor, and the security trades on an exchange, the security may be valued at its latest reported sale price (or at the exchange official closing price if such exchange reports an official closing price), prior to the time when assets are valued. If there are no sales on a given day and if there is no official exchange closing price for that day, the security is valued at the mean between the last reported bid and asked prices if such bid and asked prices are available in the relevant exchanges; (4) when market quotations are not readily available, including circumstances under which Morgan Stanley Investment Management Inc. (the "Adviser") or Morgan Stanley Investment Management Limited ("MSIM Limited") (the "Sub-Adviser"), each a wholly-owned subsidiary of Morgan Stanley, determines
20
Morgan Stanley Institutional Fund, Inc.
Annual Report — December 31, 2018
Notes to Financial Statements (cont'd)
that the closing price, last sale price or the mean between the last reported bid and asked prices are not reflective of a security's market value, portfolio securities are valued at their fair value as determined in good faith under procedures established by and under the general supervision of the Directors. Occasionally, developments affecting the closing prices of securities and other assets may occur between the times at which valuations of such securities are determined (that is, close of the foreign market on which the securities trade) and the close of business of the New York Stock Exchange ("NYSE"). If developments occur during such periods that are expected to materially affect the value of such securities, such valuations may be adjusted to reflect the estimated fair value of such securities as of the close of the NYSE, as determined in good faith by the Directors or by the Adviser using a pricing service and/or procedures approved by the Directors; (5) quotations of foreign portfolio securities, other assets and liabilities and forward contracts stated in foreign currency are translated into U.S. dollar equivalents at the prevailing market rates prior to the close of the NYSE; and (6) investments in mutual funds, including the Morgan Stanley Institutional Liquidity Funds, are valued at the net asset value ("NAV") as of the close of each business day.
The Directors have responsibility for determining in good faith the fair value of the investments, and the Directors may appoint others, such as the Company's Adviser or a valuation committee, to assist the Directors in determining fair value and to make the actual calculations pursuant to the fair valuation methodologies previously approved by the Directors. Under procedures approved by the Directors, the Company's Adviser has formed a Valuation Committee whose members are approved by the Directors. The Valuation Committee provides administration and oversight of the Company's valuation policies and procedures, which are reviewed at least annually by the Directors. These procedures allow the Company to utilize independent pricing services, quotations from securities and financial instrument dealers and other market sources to determine fair value.
2. Fair Value Measurement: FASB Accounting Standards CodificationTM ("ASC") 820, "Fair Value Measurement" ("ASC 820"), defines fair value as the value that the Fund would receive to sell an investment or pay to transfer
a liability in a timely transaction with an independent buyer in the principal market, or in the absence of a principal market, the most advantageous market for the investment or liability. ASC 820 establishes a three-tier hierarchy to distinguish between (1) inputs that reflect the assumptions market participants would use in valuing an asset or liability developed based on market data obtained from sources independent of the reporting entity (observable inputs) and (2) inputs that reflect the reporting entity's own assumptions about the assumptions market participants would use in valuing an asset or liability developed based on the best information available in the circumstances (unobservable inputs) and to establish classification of fair value measurements for disclosure purposes. Various inputs are used in determining the value of the Fund's investments. The inputs are summarized in the three broad levels listed below:
• Level 1 – unadjusted quoted prices in active markets for identical investments
• Level 2 – other significant observable inputs (including quoted prices for similar investments, interest rates, prepayment speeds, credit risk, etc.)
• Level 3 – significant unobservable inputs including the Fund's own assumptions in determining the fair value of investments. Factors considered in making this determination may include, but are not limited to, information obtained by contacting the issuer, analysts, or the appropriate stock exchange (for exchange-traded securities), analysis of the issuer's financial statements or other available documents and, if necessary, available information concerning other securities in similar circumstances
The inputs or methodology used for valuing securities are not necessarily an indication of the risk associated with investing in those securities and the determination of the significance of a particular input to the fair value measurement in its entirety requires judgment and considers factors specific to each security.
21
Morgan Stanley Institutional Fund, Inc.
Annual Report — December 31, 2018
Notes to Financial Statements (cont'd)
The following is a summary of the inputs used to value the Fund's investments as of December 31, 2018:
Investment Type | | Level 1
Unadjusted
quoted
prices
(000) | | Level 2
Other
significant
observable
inputs
(000) | | Level 3
Significant
unobservable
inputs
(000) | | Total
(000) | |
Assets: | |
Common Stocks | |
Aerospace & Defense | | $ | — | | | $ | 94,564 | | | $ | — | | | $ | 94,564 | | |
Air Freight & Logistics | | | — | | | | 32,959 | | | | — | | | | 32,959 | | |
Auto Components | | | — | | | | 28,744 | | | | — | | | | 28,744 | | |
Automobiles | | | — | | | | 25,782 | | | | — | | | | 25,782 | | |
Banks | | | — | | | | 124,229 | | | | — | | | | 124,229 | | |
Beverages | | | — | | | | 225,414 | | | | — | | | | 225,414 | | |
Capital Markets | | | — | | | | 24,607 | | | | — | | | | 24,607 | | |
Chemicals | | | — | | | | 26,497 | | | | — | | | | 26,497 | | |
Commercial Services &
Supplies | | | — | | | | 16,525 | | | | — | | | | 16,525 | | |
Construction Materials | | | — | | | | 41,363 | | | | — | | | | 41,363 | | |
Diversified
Telecommunication
Services | | | — | | | | 36,250 | | | | — | | | | 36,250 | | |
Electronic Equipment,
Instruments &
Components | | | — | | | | 27,064 | | | | — | | | | 27,064 | | |
Health Care Providers &
Services | | | — | | | | 64,551 | | | | — | | | | 64,551 | | |
Household Products | | | — | | | | 207,827 | | | | — | | | | 207,827 | | |
Insurance | | | — | | | | 203,530 | | | | — | | | | 203,530 | | |
Interactive Media &
Services | | | — | | | | 45,886 | | | | — | | | | 45,886 | | |
Machinery | | | — | | | | 28,323 | | | | — | | | | 28,323 | | |
Metals & Mining | | | 48,519 | | | | — | | | | — | | | | 48,519 | | |
Oil, Gas & Consumable
Fuels | | | 13,631 | | | | 105,348 | | | | — | | | | 118,979 | | |
Personal Products | | | — | | | | 254,136 | | | | — | | | | 254,136 | | |
Pharmaceuticals | | | — | | | | 346,347 | | | | — | | | | 346,347 | | |
Professional Services | | | — | | | | 123,877 | | | | — | | | | 123,877 | | |
Software | | | 52,287 | | | | 91,756 | | | | — | | | | 144,043 | | |
Specialty Retail | | | — | | | | 15,999 | | | | — | | | | 15,999 | | |
Tobacco | | | — | | | | 80,540 | | | | — | | | | 80,540 | | |
Trading Companies &
Distributors | | | — | | | | 13,590 | | | | — | | | | 13,590 | | |
Total Common
Stocks | | | 114,437 | | | | 2,285,708 | | | | — | | | | 2,400,145 | | |
Short-Term Investments | |
Investment Company | | | 50,406 | | | | — | | | | — | | | | 50,406 | | |
Repurchase
Agreements | | | — | | | | 5,054 | | | | — | | | | 5,054 | | |
Total Short-Term
Investments | | | 50,406 | | | | 5,054 | | | | — | | | | 55,460 | | |
Total Assets | | $ | 164,843 | | | $ | 2,290,762 | | | $ | — | | | $ | 2,455,605 | | |
Transfers between investment levels may occur as the markets fluctuate and/or the availability of data used in an investment's valuation changes.
3. Repurchase Agreements: The Fund may enter into repurchase agreements under which the Fund lends cash and takes possession of securities with an agreement that
the counterparty will repurchase such securities. In connection with transactions in repurchase agreements, a bank as custodian for the Fund takes possession of the underlying securities which are held as collateral, with a market value at least equal to the amount of the repurchase transaction, including principal and accrued interest. To the extent that any repurchase transaction exceeds one business day, the value of the collateral is marked-to-market on a daily basis to determine that the value of the collateral does not decrease below the repurchase price plus accrued interest as earned. If such a decrease occurs, additional collateral will be requested and, when received, will be added to the account to maintain full collateralization. In the event of default on the obligation to repurchase, the Fund has the right to liquidate the collateral and apply the proceeds in satisfaction of the obligation. In the event of default or bankruptcy by the counterparty to the agreement, realization of the collateral proceeds may be subject to cost and delays. The Fund, along with other affiliated investment companies, may utilize a joint trading account for the purpose of entering into repurchase agreements.
4. Foreign Currency Translation and Foreign Investments: The books and records of the Fund are maintained in U.S. dollars. Foreign currency amounts are translated into U.S. dollars as follows:
– investments, other assets and liabilities at the prevailing rate of exchange on the valuation date;
– investment transactions and investment income at the prevailing rates of exchange on the dates of such transactions.
Although the net assets of the Fund are presented at the foreign exchange rates and market values at the close of the period, the Fund does not isolate that portion of the results of operations arising as a result of changes in the foreign exchange rates from the fluctuations arising from changes in the market prices of securities held at period end. Similarly, the Fund does not isolate the effect of changes in foreign exchange rates from the fluctuations arising from changes in the market prices of securities sold during the period. Accordingly, realized and unrealized foreign currency gains (losses) on investments in securities are included in the reported net realized and unrealized gains (losses) on investment transactions and balances. However, pursuant to U.S.
22
Morgan Stanley Institutional Fund, Inc.
Annual Report — December 31, 2018
Notes to Financial Statements (cont'd)
federal income tax regulations, gains and losses from certain foreign currency transactions and the foreign currency portion of gains and losses realized on sales and maturities of foreign denominated debt securities are treated as ordinary income for U.S. federal income tax purposes.
Net realized gains (losses) on foreign currency transactions represent net foreign exchange gains (losses) from foreign currency forward exchange contracts, disposition of foreign currencies, currency gains (losses) realized between the trade and settlement dates on securities transactions, and the difference between the amount of investment income and foreign withholding taxes recorded on the Fund's books and the U.S. dollar equivalent amounts actually received or paid. Net unrealized currency gains (losses) from valuing foreign currency denominated assets and liabilities at period end exchange rates are reflected as a component of unrealized appreciation (depreciation) in the Statement of Assets and Liabilities. The change in unrealized currency gains (losses) on foreign currency translations for the period is reflected in the Statement of Operations.
Foreign security and currency transactions may involve certain considerations and risks not typically associated with those of U.S. dollar denominated transactions as a result of, among other factors, fluctuations of exchange rates in relation to the U.S. dollar, the possibility of lower levels of governmental supervision and regulation of foreign securities markets and the possibility of political or economic instability.
Governmental approval for foreign investments may be required in advance of making an investment under certain circumstances in some countries, and the extent of foreign investments in domestic companies may be subject to limitation in other countries. Foreign ownership limitations also may be imposed by the charters of individual companies to prevent, among other concerns, violations of foreign investment limitations. As a result, an additional class of shares (identified as "Foreign" in the Portfolio of Investments) may be created and offered for investment. The "local" and "foreign shares" market values may differ. In the absence of trading of the foreign shares in such markets, the Fund values the foreign shares at the closing exchange price of the local shares.
5. Derivatives: The Fund may, but is not required to, use derivative instruments for a variety of purposes, including hedging, risk management, portfolio management or to earn income. Derivatives are financial instruments whose value is based, in part, on the value of an underlying asset, interest rate, index or financial instrument. Prevailing interest rates and volatility levels, among other things, also affect the value of derivative instruments. A derivative instrument often has risks similar to its underlying asset and may have additional risks, including imperfect correlation between the value of the derivative and the underlying asset, risks of default by the counterparty to certain transactions, magnification of losses incurred due to changes in the market value of the securities, instruments, indices or interest rates to which the derivative instrument relates, risks that the transactions may not be liquid and risks arising from margin requirements. The use of derivatives involves risks that are different from, and possibly greater than, the risks associated with other portfolio investments. Derivatives may involve the use of highly specialized instruments that require investment techniques and risk analyses different from those associated with other portfolio investments. All of the Fund's holdings, including derivative instruments, are marked-to-market each day with the change in value reflected in unrealized appreciation (depreciation). Upon disposition, a realized gain or loss is recognized.
Certain derivative transactions may give rise to a form of leverage. Leverage magnifies the potential for gain and the risk of loss. Leverage associated with derivative transactions may cause the Fund to liquidate portfolio positions when it may not be advantageous to do so to satisfy its obligations or to meet earmarking or segregation requirements, pursuant to applicable Securities and Exchange Commission ("SEC") rules and regulations, or may cause the Fund to be more volatile than if the Fund had not been leveraged. Although the Adviser seeks to use derivatives to further the Fund's investment objectives, there is no assurance that the use of derivatives will achieve this result.
Following is a description of the derivative instruments and techniques that the Fund used during the period and their associated risks:
Foreign Currency Forward Exchange Contracts: In connection with its investments in foreign securities, the Fund also entered into contracts with banks, brokers or
23
Morgan Stanley Institutional Fund, Inc.
Annual Report — December 31, 2018
Notes to Financial Statements (cont'd)
dealers to purchase or sell securities or foreign currencies at a future date. A foreign currency forward exchange contract ("currency contract") is a negotiated agreement between the contracting parties to exchange a specified amount of currency at a specified future time at a specified rate. The rate can be higher or lower than the spot rate between the currencies that are the subject of the contract. Currency contracts may be used to protect against uncertainty in the level of future foreign currency exchange rates or to gain or modify exposure to a particular currency. To the extent hedged by the use of currency contracts, the precise matching of the currency contract amounts and the value of the securities involved will not generally be possible because the future value of such securities in foreign currencies will change as a consequence of market movements in the value of those securities between the date on which the contract is entered into and the date it matures. Furthermore, such transactions may reduce or preclude the opportunity for gain if the value of the currency should move in the direction opposite to the position taken. There is additional risk to the extent that currency contracts create exposure to currencies in which the Fund's securities are not denominated. Unanticipated changes in currency prices may result in poorer overall performance for the Fund than if it had not entered into such contracts. The use of currency contracts involves the risk of loss from the insolvency or bankruptcy of the counterparty to the contract or the failure of the counterparty to make payments or otherwise comply with the terms of the contract. A currency contract is marked-to-market daily and the change in market value is recorded by the Fund as unrealized gain or loss. The Fund records realized gains (losses) when the currency contract is closed equal to the difference between the value of the currency contract at the time it was opened and the value at the time it was closed.
As of December 31, 2018, the Fund did not have any open foreign currency forward exchange contracts.
FASB ASC 815, "Derivatives and Hedging" ("ASC 815"), is intended to improve financial reporting about derivative instruments by requiring enhanced disclosures to enable investors to better understand how and why the Fund uses derivative instruments, how these derivative instruments are accounted for and their effects on the Fund's financial position and results of operations.
The following tables set forth by primary risk exposure the Fund's realized gains (losses) and change in unrealized appreciation (depreciation) by type of derivative contract for the year ended December 31, 2018 in accordance with ASC 815:
Realized Gain (Loss) | |
Primary Risk Exposure | | Derivative Type | | Value
(000) | |
Currency Risk
| | Foreign Currency
Forward Exchange Contracts | | $ | (8,197 | ) | |
Change in Unrealized Appreciation (Depreciation) | |
Primary Risk Exposure | | Derivative Type | | Value
(000) | |
Currency Risk
| | Foreign Currency
Forward Exchange Contracts | | $ | 777 | | |
For the year ended December 31, 2018, the approximate average monthly amount outstanding for each derivative type is as follows:
Foreign Currency Forward Exchange Contracts: | |
Average monthly principal amount | | $ | 117,155,000 | | |
6. Securities Lending: The Fund lends securities to qualified financial institutions, such as broker-dealers, to earn additional income. Any increase or decrease in the fair value of the securities loaned that might occur and any interest earned or dividends declared on those securities during the term of the loan would remain in the Fund. The Fund would receive cash or securities as collateral in an amount equal to or exceeding 100% of the current fair value of the loaned securities. The collateral is marked-to-market daily by State Street Bank and Trust Company ("State Street"), the securities lending agent, to ensure that a minimum of 100% collateral coverage is maintained.
Based on pre-established guidelines, the securities lending agent invests any cash collateral that is received in an affiliated money market portfolio and repurchase agreements. Securities lending income is generated from the earnings on the invested collateral and borrowing fees, less any rebates owed to the borrowers and compensation to the lending agent, and is recorded as "Income from Securities Loaned — Net" in the Fund's Statement of Operations. Risks in securities lending transactions are that a borrower may not provide additional collateral when required or return the securities when due, and that the value of the short-term investments will be less than the amount of cash collateral plus any rebate that is required to be returned to the borrower.
24
Morgan Stanley Institutional Fund, Inc.
Annual Report — December 31, 2018
Notes to Financial Statements (cont'd)
The Fund has the right under the securities lending agreement to recover the securities from the borrower on demand.
The following table presents financial instruments that are subject to enforceable netting arrangements as of December 31, 2018:
Gross Amounts Not Offset in the Statement of Assets and Liabilities | |
Gross Asset
Amounts
Presented in the
Statement of
Assets and
Liabilities
(000) | | Financial
Instrument
(000) | | Collateral
Received
(000) | | Net Amount
(not less
than $0)
(000) | |
| $ | 50,746 | (a) | | $ | — | | | $ | (50,746 | )(b)(c) | | $ | 0 | | |
(a) Represents market value of loaned securities at year end.
(b) The Fund received cash collateral of approximately $27,331,000, of which approximately $27,164,000 was subsequently invested in Repurchase Agreements and Morgan Stanley Institutional Liquidity Funds as reported in the Portfolio of Investments. As of December 31, 2018, there was uninvested cash of approximately $167,000, which is not reflected in the Portfolio of Investments. In addition, the Fund received non-cash collateral of approximately $23,885,000 in the form of U.S. Government obligations, which the Fund cannot sell or repledge, and accordingly are not reflected in the Portfolio of Investments.
(c) The actual collateral received is greater than the amount shown here due to overcollateralization.
FASB ASC 860, "Transfers & Servicing: Repurchase-to-Maturity Transactions, Repurchase Financings, and Disclosures", is intended to provide increased transparency about the types of collateral pledged in securities lending transactions and other similar transactions that are accounted for as secured borrowing.
The following table displays a breakdown of transactions accounted for as secured borrowings, the gross obligations by class of collateral pledged and the remaining contractual maturity of those transactions as of December 31, 2018:
Remaining Contractual Maturity of the Agreements | |
| | | Overnight and
Continuous
(000) | | <30 days
(000) | | Between
30 &
90 days
(000) | | >90 days
(000) | | Total
(000) | |
Securities Lending
Transactions | |
Common Stocks | | $ | 27,331 | | | $ | — | | | $ | — | | | $ | — | | | $ | 27,331 | | |
Total Borrowings | | $ | 27,331 | | | $ | — | | | $ | — | | | $ | — | | | $ | 27,331 | | |
Gross amount of
recognized liabilities
for securities lending
transactions | | | | | | | | | | $ | 27,331 | | |
7. Redemption Fees: The Fund will assess a 2% redemption fee on Class I shares, Class A shares, Class L shares, Class C shares and Class IS shares, which is paid directly
to the Fund, for shares redeemed or exchanged within thirty days of purchase, subject to certain exceptions. The redemption fee is designed to protect the Fund and its remaining shareholders from the effects of short-term trading. These fees, if any, are included in the Statements of Changes in Net Assets.
8. Indemnifications: The Company enters into contracts that contain a variety of indemnifications. The Company's maximum exposure under these arrangements is unknown. However, the Company has not had prior claims or losses pursuant to these contracts and expects the risk of loss to be remote.
9. Dividends and Distributions to Shareholders: Dividends and distributions to shareholders are recorded on the ex-dividend date. Dividends from net investment income, if any, are declared and paid annually. Net realized capital gains, if any, are distributed at least annually.
10. Security Transactions, Income and Expenses: Security transactions are accounted for on the trade date (date the order to buy or sell is executed). Realized gains and losses on the sale of investment securities are determined on the specific identified cost method. Dividend income and other distributions are recorded on the ex-dividend date (except for certain foreign dividends which may be recorded as soon as the Fund is informed of such dividends) net of applicable withholding taxes. Interest income is recognized on the accrual basis except where collection is in doubt. Discounts are accreted and premiums are amortized over the life of the respective securities. Most expenses of the Company can be directly attributed to a particular Fund. Expenses which cannot be directly attributed are apportioned among the Funds based upon relative net assets or other appropriate methods. Income, expenses (other than class specific expenses — distribution and shareholder services, transfer agency and sub transfer agency fees) and realized and unrealized gains or losses are allocated to each class of shares based upon their relative net assets.
B. Advisory/Sub-Advisory Fees: The Adviser, a wholly-owned subsidiary of Morgan Stanley, provides the Fund with advisory services under the terms of an Investment Advisory Agreement, paid quarterly, at the annual rate based on the daily net assets as follows:
First $10
billion | | Over $10
billion | |
| | 0.80 | % | | | 0.75 | % | |
25
Morgan Stanley Institutional Fund, Inc.
Annual Report — December 31, 2018
Notes to Financial Statements (cont'd)
For the year ended December 31, 2018, the advisory fee rate (net of rebate) was equivalent to an annual effective rate of 0.80% of the Fund's average daily net assets.
The Adviser has agreed to reduce its advisory fee and/or reimburse the Fund so that total annual portfolio operating expenses, excluding certain investment related expenses, taxes, interest and other extraordinary expenses (including litigation), will not exceed 0.95% for Class I shares, 1.30% for Class A shares, 1.80% for Class L shares, 2.05% for Class C shares and 0.91% for Class IS shares. The fee waivers and/or expense reimbursements will continue for at least one year from the date of the Fund's prospectus or until such time as the Directors act to discontinue all or a portion of such waivers and/or reimbursements when they deem such action is appropriate. For the year ended December 31, 2018, there were no advisory fees waived and approximately $778,000 of other expenses were reimbursed by the Adviser pursuant to this arrangement.
The Adviser has entered into a Sub-Advisory Agreement with the Sub-Adviser, a wholly-owned subsidiary of Morgan Stanley. The Sub-Adviser provides the Fund with advisory services subject to the overall supervision of the Adviser and the Fund's Officers and Directors. The Adviser pays the Sub-Adviser on a monthly basis a portion of the net advisory fees the Adviser receives from the Fund.
C. Administration Fees: The Adviser also serves as Administrator to the Company and provides administrative services pursuant to an Administration Agreement for an annual fee, accrued daily and paid monthly, of 0.08% of the Fund's average daily net assets.
Under a Sub-Administration Agreement between the Administrator and State Street, State Street provides certain administrative services to the Company. For such services, the Administrator pays State Street a portion of the fee the Administrator receives from the Fund.
D. Distribution and Shareholder Services Fees: Morgan Stanley Distribution, Inc. ("MSDI" or the "Distributor"), a wholly-owned subsidiary of the Adviser and an indirect subsidiary of Morgan Stanley, serves as the Company's Distributor of Fund shares pursuant to a Distribution Agreement. The Company has adopted a Shareholder Services Plan with respect to Class A shares pursuant to Rule 12b-1 under the Act. Under the Shareholder Services Plan, the Fund pays the Distributor a shareholder services fee, accrued daily and paid monthly, at an annual rate of 0.25% of the Fund's average daily net assets attributable to Class A shares.
The Company has adopted a Distribution and Shareholder Services Plan with respect to Class L shares pursuant to Rule 12b-1 under the Act. Under the Distribution and Shareholder Services Plan, the Fund pays the Distributor a distribution fee, accrued daily and paid monthly, at an annual rate of 0.50% and a shareholder services fee, accrued daily and paid monthly, at an annual rate of 0.25% of the Fund's average daily net assets attributable to Class L shares.
The Company has adopted a Distribution and Shareholder Services Plan with respect to Class C shares pursuant to Rule 12b-1 under the Act. Under the Distribution and Shareholder Services Plan, the Fund pays the Distributor a distribution fee, accrued daily and paid monthly, at an annual rate of 0.75% and a shareholder services fee, accrued daily and paid monthly, at an annual rate of 0.25% of the Fund's average daily net assets attributable to Class C shares.
The distribution and shareholder services fees are used to support the expenses associated with servicing and maintaining accounts. The Distributor may compensate other parties for providing shareholder support services to investors who purchase Class A, Class L and Class C shares.
E. Dividend Disbursing and Transfer Agent: The Company's dividend disbursing and transfer agent is DST Asset Manager Solutions, Inc. ("DST"). Pursuant to a Transfer Agency Agreement, the Company pays DST a fee based on the number of classes, accounts and transactions relating to the Funds of the Company.
F. Custodian Fees: State Street (the "Custodian") also serves as Custodian for the Company in accordance with a Custodian Agreement. The Custodian holds cash, securities and other assets of the Company as required by the Act. Custody fees are payable monthly based on assets held in custody, investment purchases and sales activity and account maintenance fees, plus reimbursement for certain out-of-pocket expenses.
G. Security Transactions and Transactions with Affiliates: For the year ended December 31, 2018, purchases and sales of investment securities for the Fund, other than long-term U.S. Government securities and short-term investments, were approximately $1,165,611,000 and $2,320,635,000, respectively. There were no purchases and sales of long-term U.S. Government securities for the year ended December 31, 2018.
26
Morgan Stanley Institutional Fund, Inc.
Annual Report — December 31, 2018
Notes to Financial Statements (cont'd)
The Fund invests in the Institutional Class of the Morgan Stanley Institutional Liquidity Funds — Treasury Securities Portfolio (the "Liquidity Funds"), an open-end management investment company managed by the Adviser, both directly and as a portion of the securities held as collateral on loaned securities. Advisory fees paid by the Fund are reduced by an amount equal to its pro-rata share of the advisory and administration fees paid by the Fund due to its investment in the Liquidity Funds. For the year ended December 31, 2018, advisory fees paid were reduced by approximately $108,000 relating to the Fund's investment in the Liquidity Funds.
A summary of the Fund's transactions in shares of affiliated investments during the year ended December 31, 2018 is as follows:
Affiliated
Investment
Company | | Value
December 31,
2017
(000) | | Purchases
at Cost
(000) | | Proceeds
from Sales
(000) | | Dividend
Income
(000) | |
Liquidity Funds | | $ | 91,984 | | | $ | 910,684 | | | $ | 952,262 | | | $ | 914 | | |
Affiliated
Investment
Company (cont'd) | | Realized
Gain
(Loss)
(000) | | Change in
Unrealized
Appreciation
(Depreciation)
(000) | | Value
December 31,
2018
(000) | |
Liquidity Funds | | $ | — | | | $ | — | | | $ | 50,406 | | |
The Fund is permitted to purchase and sell securities ("cross-trade") from and to other Morgan Stanley funds as well as other funds and client accounts for which the Adviser or an affiliate of the Adviser serves as investment adviser, pursuant to procedures approved by the Directors in compliance with Rule 17a-7 under the Act (the "Rule"). Each cross-trade is executed at the current market price in compliance with provisions of the Rule. For the year ended December 31, 2018, the Fund did not engage in any cross-trade transactions.
The Fund has an unfunded Deferred Compensation Plan (the "Compensation Plan"), which allows each independent Director to defer payment of all, or a portion, of the fees he or she receives for serving on the Board of Directors. Each eligible Director generally may elect to have the deferred amounts credited with a return equal to the total return on one or more of the Morgan Stanley funds that are offered as investment options under the Compensation Plan. Appreciation/depreciation and distributions received from these investments are recorded with an offsetting increase/decrease in the deferred compensation obligation and do not affect the NAV of the Fund.
H. Federal Income Taxes: It is the Fund's intention to continue to qualify as a regulated investment company and
distribute all of its taxable and tax-exempt income. Accordingly, no provision for Federal income taxes is required in the financial statements.
The Fund may be subject to taxes imposed by countries in which it invests. Such taxes are generally based on income and/or capital gains earned or repatriated. Taxes are accrued based on net investment income, net realized gains and net unrealized appreciation as such income and/or gains are earned. Taxes may also be based on transactions in foreign currency and are accrued based on the value of investments denominated in such currency.
FASB ASC 740-10, "Income Taxes — Overall", sets forth a minimum threshold for financial statement recognition of the benefit of a tax position taken or expected to be taken in a tax return. Management has concluded there are no significant uncertain tax positions that would require recognition in the financial statements. If applicable, the Fund recognizes interest accrued related to unrecognized tax benefits in "Interest Expense" and penalties in "Other Expenses" in the Statement of Operations. The Fund files tax returns with the U.S. Internal Revenue Service, New York and various states. Generally, each of the tax years in the four-year period ended December 31, 2018 remains subject to examination by taxing authorities.
The tax character of distributions paid may differ from the character of distributions for GAAP purposes due to short-term capital gains being treated as ordinary income for tax purposes. The tax character of distributions paid during fiscal years 2018 and 2017 was as follows:
2018
Distributions
Paid From: | | 2017
Distributions
Paid From: | |
Ordinary
Income
(000) | | Long-Term
Capital Gain
(000) | | Ordinary
Income
(000) | | Long-Term
Capital Gain
(000) | |
| $ | 62,556 | | | $ | 274,501 | | | $ | 77,241 | | | $ | — | | |
The amount and character of income and gains to be distributed are determined in accordance with income tax regulations which may differ from GAAP. These book/tax differences are either considered temporary or permanent in nature.
Temporary differences are primarily due to differing book and tax treatments in the timing of the recognition of gains (losses) on certain investment transactions and the timing of the deductibility of certain expenses.
27
Morgan Stanley Institutional Fund, Inc.
Annual Report — December 31, 2018
Notes to Financial Statements (cont'd)
Permanent differences, primarily due to equalization debits, resulted in the following reclassifications among the components of net assets at December 31, 2018:
Total
Distributable
Earnings
(000) | | Paid-in-
Capital
(000) | |
| $ | (109,637 | ) | | $ | 109,637 | | |
At December 31, 2018, the components of distributable earnings for the Fund on a tax basis were as follows:
Undistributed
Ordinary
Income
(000) | | Undistributed
Long-Term
Capital Gain
(000) | |
| $ | 633 | | | $ | 21,445 | | |
I. Credit Facility: The Company and other Morgan Stanley funds participated in a $150,000,000 committed, unsecured revolving line of credit facility (the "Facility") with State Street. This Facility is to be used for temporary emergency purposes or funding of shareholder redemption requests. The interest rate on borrowings is based on the federal funds rate or 1 month LIBOR rate plus a spread. The Facility also has a commitment fee of 0.25% per annum based on the unused portion of the Facility. During the year ended December 31, 2018, the Fund did not have any borrowings under the Facility.
J. Other: At December 31, 2018, the Fund had record owners of 10% or greater. Investment activities of these shareholders could have a material impact on the Fund. The aggregate percentage of such owners was 38.0%.
28
Morgan Stanley Institutional Fund, Inc.
Annual Report — December 31, 2018
Report of Independent Registered Public Accounting Firm
To the Shareholders and Board of Directors of
Morgan Stanley Institutional Fund, Inc. —
International Equity Portfolio
Opinion on the Financial Statements
We have audited the accompanying statement of assets and liabilities of International Equity Portfolio (the "Fund") (one of the funds constituting the Morgan Stanley Institutional Fund, Inc. (the "Company")), including the portfolio of investments, as of December 31, 2018, and the related statement of operations for the year then ended, the statements of changes in net assets for each of the two years in the period then ended, the financial highlights for each of the five years in the period then ended and the related notes (collectively referred to as the "financial statements"). In our opinion, the financial statements present fairly, in all material respects, the financial position of International Equity Portfolio (one of the funds constituting Morgan Stanley Institutional Fund, Inc.) at December 31, 2018, the results of its operations for the year then ended, the changes in its net assets for each of the two years in the period then ended and its financial highlights for each of the five years in the period then ended, in conformity with U.S. generally accepted accounting principles.
Basis for Opinion
These financial statements are the responsibility of the Company's management. Our responsibility is to express an opinion on the Fund's financial statements based on our audits. We are a public accounting firm registered with the Public Company Accounting Oversight Board (United States) ("PCAOB") and are required to be independent with respect to the Company in accordance with the U.S. federal securities law and the applicable rules and regulations of the Securities and Exchange Commission and the PCAOB.
We conducted our audits in accordance with the standards of the PCAOB. Those standards require that we plan and perform the audit to obtain reasonable assurance about whether the financial statements are free of material misstatement, whether due to error or fraud. The Company is not required to have, nor were we engaged to perform, an audit of the Company's internal control over financial reporting. As part of our audits, we are required to obtain an understanding of internal control over financial reporting, but not for the purpose of expressing an opinion on the effectiveness of the Company's internal control over financial reporting. Accordingly, we express no such opinion.
Our audits included performing procedures to assess the risks of material misstatement of the financial statements, whether due to error or fraud, and performing procedures that respond to those risks. Such procedures included examining, on a test basis, evidence regarding the amounts and disclosures in the financial statements. Our procedures included confirmation of securities owned as of December 31, 2018 by correspondence with the custodian and others or by other appropriate auditing procedures where replies from others were not received. Our audits also included evaluating the accounting principles used and significant estimates made by management, as well as evaluating the overall presentation of the financial statements. We believe that our audits provide a reasonable basis for our opinion.

We have served as the auditor of one or more Morgan Stanley investment companies since 2000.
Boston, Massachusetts
February 26, 2019
29
Morgan Stanley Institutional Fund, Inc.
Annual Report — December 31, 2018
Federal Tax Notice (unaudited)
For federal income tax purposes, the following information is furnished with respect to the distributions paid by the Fund during its taxable year ended December 31, 2018.
The Fund designated and paid approximately $274,501,000 as a long-term capital gain distribution.
For federal income tax purposes, the following information is furnished with respect to the Fund's earnings for the taxable year ended December 31, 2018.
When distributed, certain earnings may be subject to a maximum tax rate of 15% as provided for the Jobs and Growth Tax Relief Reconciliation Act of 2003. The Fund designated up to a maximum of approximately $68,649,000 as taxable at this lower rate.
The Fund intends to pass through foreign tax credits of approximately $6,094,000, and has derived net income from sources within foreign countries amounting to approximately $110,197,000.
In January, the Fund provides tax information to shareholders for the preceding calendar year.
30
Morgan Stanley Institutional Fund, Inc.
Annual Report — December 31, 2018
Privacy Notice (unaudited)
MORGAN STANLEY INVESTMENT MANAGEMENT INC.
AN IMPORTANT NOTICE CONCERNING OUR U.S. PRIVACY POLICY
We are required by federal law to provide you with a copy of our privacy policy annually. This policy applies to current and former individual investors in funds managed or sponsored by Morgan Stanley Investment Management Inc. ("MSIM") as well as current and former individual clients of MSIM. This policy is not applicable to partnerships, corporations, trusts or other non-individual clients or investors. Please note that we may amend this policy at any time, and will inform you of any changes as required by law.
WE RESPECT YOUR PRIVACY
We appreciate that you have provided us with your personal financial information. We strive to maintain the privacy of such information while we help you achieve your financial objectives. This Notice describes what non-public personal information we collect about you, why we collect it, when we may share it with others and how certain others may use it. It discusses the steps you may take to limit our sharing of certain information about you to affiliated companies in the Morgan Stanley family of companies ("other Morgan Stanley companies"). It also discloses how you may limit use of certain shared information for marketing purposes by other Morgan Stanley branded companies. Throughout this policy, we refer to the non-public information that personally identifies you or your accounts as "personal information.''
1. WHAT PERSONAL INFORMATION DO WE COLLECT ABOUT YOU?
We obtain personal information from applications and other forms you submit to us, from your dealings with us, from consumer reporting agencies, from our Web sites and from third parties and other sources.
For example:
• We may collect information such as your name, address, e-mail address, telephone/fax numbers, assets, income and investment objectives through subscription documents, applications and other forms you submit to us.
• We may obtain information about account balances, your use of account(s) and the types of products and services you prefer to receive from us through your dealings and transactions with us and other sources.
• We may obtain information about your creditworthiness and credit history from consumer reporting agencies.
• We may collect background information from and through third-party vendors to verify representations you have made and to comply with various regulatory requirements.
• If you interact with us through our public and private Web sites, we may collect information that you provide directly through online communications (such as an e-mail address). We may also collect information about your Internet service provider, your domain name, your computer's operating system and Web browser, your use of our Web sites and your product and service preferences, through the use of "cookies." Please consult the Terms of Use of these sites for more details.
2. WHEN DO WE DISCLOSE PERSONAL INFORMATION WE COLLECT ABOUT YOU?
We may disclose personal information we collect about you to other Morgan Stanley companies and to non-affiliated third parties.
a. Information We Disclose to Other Morgan Stanley Companies.
We may disclose personal information to other Morgan Stanley companies for a variety of reasons, including to manage your account(s) effectively, to service and process your transactions, to let you know about products and services offered by us and other Morgan Stanley companies, to manage our business, and as otherwise required or permitted by law. Offers for products and services from other Morgan Stanley companies are developed under conditions designed to safeguard your personal information.
31
Morgan Stanley Institutional Fund, Inc.
Annual Report — December 31, 2018
Privacy Notice (unaudited) (cont'd)
b. Information We Disclose to Non-affiliated Third Parties.
We do not disclose personal information that we collect about you to non-affiliated third parties except to those who provide marketing services on our behalf, to financial institutions with whom we have joint marketing agreements, and as otherwise required or permitted by law. For example, we may disclose personal information to non-affiliated third parties for servicing and processing transactions, to offer our own products and services, to protect against fraud, for institutional risk control, to respond to judicial process or to perform services on our behalf. When we share personal information with a non-affiliated third party, they are required to limit their use of personal information to the particular purpose for which it was shared and they are not allowed to share personal information with others except to fulfill that limited purpose or as may be permitted or required by law.
3. HOW DO WE PROTECT THE SECURITY AND CONFIDENTIALITY OF PERSONAL INFORMATION WE COLLECT ABOUT YOU?
We maintain physical, electronic and procedural security measures to help safeguard the personal information we collect about you. We have internal policies governing the proper handling of client information. Third parties that provide support or marketing services on our behalf may also receive personal information, and we require them to adhere to confidentiality standards with respect to such information.
4. HOW CAN YOU LIMIT THE SHARING OF CERTAIN TYPES OF PERSONAL INFORMATION WITH OTHER MORGAN STANLEY COMPANIES?
We offer you choices as to whether we share with other Morgan Stanley companies the personal information that was collected to determine your eligibility for products and services you request ("eligibility information"). Eligibility information does not include your identification information or personal information pertaining to our transactions or experiences with you. Please note that, even if you direct us not to share eligibility information with other Morgan Stanley companies ("opt-out"), we may still share personal information, including eligibility information, with those companies in circumstances excluded from the opt-out under applicable law, such as to process transactions or to service your account.
5. HOW CAN YOU LIMIT THE USE OF CERTAIN TYPES OF PERSONAL INFORMATION BY OTHER MORGAN STANLEY COMPANIES FOR MARKETING?
By following the opt-out instructions in Section 6 below, you may limit other Morgan Stanley branded companies from marketing their products or services to you based on personal information we disclose to them. This information may include, for example, your income and account history with us. Please note that, even if you choose to limit Other Morgan Stanley Companies from using personal information about you that we may share with them for marketing their products and services to you, Other Morgan Stanley Companies may use your personal information that they obtain from us to market to you in circumstances permitted by law, such as if the Other Morgan Stanley Company has its own relationship with you.
6. HOW CAN YOU SEND US AN OPT-OUT INSTRUCTION?
If you wish to limit our sharing of eligibility information about you with other Morgan Stanley companies or other Morgan Stanley companies' use of personal information for marketing purposes, as described in this notice, you may do so by:
• Calling us at (800) 548-7786
Monday–Friday between 8a.m. and 6p.m.(EST)
• Writing to us at the following address:
DST Asset Manager Solutions, Inc.
c/o Privacy Coordinator
P.O. Box 219804
Kansas City, Missouri 64121
32
Morgan Stanley Institutional Fund, Inc.
Annual Report — December 31, 2018
Privacy Notice (unaudited) (cont'd)
Your written request should include your name, address, telephone number and account number(s) to which the opt-out applies and whether you are opting out with respect to sharing of eligibility information (Section 4 above), or if information used for Marketing (Section 5 above) or both. Written opt-out requests should not be sent with any other correspondence. In order to process your request, we require that the request be provided by you directly and not through a third party.
Your opt-out preference will remain in effect with respect to this policy (as it may be amended) until you notify us otherwise. If you have a joint account, your direction for us not to share this information with other Morgan Stanley companies and for those other Morgan Stanley companies not to use your personal information for marketing will be applied to all account holders on that account. Please understand that if you limit our sharing or our affiliated companies' use of personal information, you and any joint account holder(s) may not receive information about Morgan Stanley products and services, including products or services that could help you manage your financial resources and achieve your investment objectives.
7. WHAT IF AN AFFILIATED COMPANY BECOMES A NON-AFFILIATED THIRD PARTY?
If, at any time in the future, an affiliated company becomes a non-affiliated third party, further disclosures of personal information made to the former affiliated company will be limited to those described in Section 2(b) above relating to non-affiliated third parties. If you elected under Section 6 to limit disclosures we make to affiliated companies, or use of personal information by affiliated companies, your election will not apply to use by any former affiliated company of your personal information in their possession once it becomes a non-affiliated third party.
SPECIAL NOTICE TO RESIDENTS OF VERMONT
The following section supplements our policy with respect to our individual clients who have a Vermont address and supersedes anything to the contrary in the above policy with respect to those clients only.
The state of Vermont requires financial institutions to obtain your consent prior to sharing personal information that they collect about you with affiliated companies and non-affiliated third parties other than in certain limited circumstances. Except as permitted by law, we will not share personal information we collect about you with non-affiliated third parties or other Morgan Stanley companies unless you provide us with your written consent to share such information ("opt-in").
If you wish to receive offers for investment products and services offered by or through other Morgan Stanley companies, please notify us in writing at the following address:
DST Asset Manager Solutions, Inc.
c/o Privacy Coordinator
P.O. Box 219804
Kansas City, Missouri 64121
Your authorization should include your name, address, telephone number and account number(s) to which the opt-in applies and should not be sent with any other correspondence. In order to process your authorization, we require that the authorization be provided by you directly and not through a third party.
SPECIAL NOTICE TO RESIDENTS OF CALIFORNIA
The following section supplements our policy with respect to our individual clients who have a California address and supersedes anything to the contrary in the above policy with respect to those clients only.
In response to a California law, if your account has a California home address, your personal information will not be disclosed to non-affiliated third parties except as permitted by applicable California law, and we will limit sharing such information with our affiliates to comply with California privacy laws that apply to us.
33
Morgan Stanley Institutional Fund, Inc.
Annual Report — December 31, 2018
Director and Officer Information (unaudited)
Independent Directors:
Name, Age and Address of
Independent Director | | Position(s)
Held with
Registrant | | Length of Time
Served* | | Principal Occupation(s) During Past 5 Years
and Other Relevant Professional Experience | | Number of
Portfolios in
Fund Complex
Overseen by
Independent
Director** | | Other Directorships
Held by Independent
Director*** | |
Frank L. Bowman (74)
c/o Perkins Coie LLP
Counsel to the Independent
Directors
30 Rockefeller Plaza
New York, NY 10112 | | Director | | Since
August
2006 | | President, Strategic Decisions, LLC (consulting) (since February 2009); Director or Trustee of various Morgan Stanley Funds (since August 2006); Chairperson of the Compliance and Insurance Committee (since October 2015); formerly, Chairperson of the Insurance Sub-Committee of the Compliance and Insurance Committee (2007-2015); served as President and Chief Executive Officer of the Nuclear Energy Institute (policy organization) (February 2005-November 2008); retired as Admiral, U.S. Navy after serving over 38 years on active duty including 8 years as Director of the Naval Nuclear Propulsion Program in the Department of the Navy and the U.S. Department of Energy (1996-2004); served as Chief of Naval Personnel (July 1994-September 1996) and on the Joint Staff as Director of Political Military Affairs (June 1992-July 1994); knighted as Honorary Knight Commander of the Most Excellent Order of the British Empire; awarded the Officier de l'Orde National du Mérite by the French Government; elected to the National Academy of Engineering (2009). | | | 82 | | | Director of BP p.l.c.; Director of Naval and Nuclear Technologies LLP; Director Emeritus of the Armed Services YMCA; Member of the National Security Advisory Council of the Center for U.S. Global Engagement and a member of the CNA Military Advisory Board; Trustee of Fairhaven United Methodist Church; Member of the Board of Advisors of the Dolphin Scholarship Foundation; and Director of other various non-profit organizations. | |
Kathleen A. Dennis (65)
c/o Perkins Coie LLP
Counsel to the Independent Directors
30 Rockefeller Plaza
New York, NY 10112 | | Director | | Since
August
2006 | | President, Cedarwood Associates (mutual fund and investment management consulting) (since July 2006); Chairperson of the Liquidity and Alternatives Sub-Committee of the Investment Committee (since October 2006) and Director or Trustee of various Morgan Stanley Funds (since August 2006); formerly, Senior Managing Director of Victory Capital Management (1993-2006). | | | 82 | | | Director of various non-profit organizations. | |
Nancy C. Everett (63)
c/o Perkins Coie LLP
Counsel to the Independent Directors
30 Rockefeller Plaza
New York, NY 10112 | | Director | | Since
January
2015 | | Chief Executive Officer, Virginia Commonwealth University Investment Company (since November 2015); Owner, OBIR, LLC (institutional investment management consulting) (since June 2014); formerly, Managing Director, BlackRock Inc. (February 2011-December 2013); and Chief Executive Officer, General Motors Asset Management (a/k/a Promark Global Advisors, Inc.) (June 2005-May 2010). | | | 83 | | | Formerly, Member of Virginia Commonwealth University School of Business Foundation (2005-2016); Member of Virginia Commonwealth University Board of Visitors (2013-2015); Member of Committee on Directors for Emerging Markets Growth Fund, Inc. (2007-2010); Chairperson of Performance Equity Management, LLC (2006-2010); and Chairperson, GMAM Absolute Return Strategies Fund, LLC (2006-2010). | |
34
Morgan Stanley Institutional Fund, Inc.
Annual Report — December 31, 2018
Director and Officer Information (unaudited) (cont'd)
Independent Directors: (cont'd)
Name, Age and Address of
Independent Director | | Position(s)
Held with
Registrant | | Length of Time
Served* | | Principal Occupation(s) During Past 5 Years
and Other Relevant Professional Experience | | Number of
Portfolios in
Fund Complex
Overseen by
Independent
Director** | | Other Directorships
Held by Independent
Director*** | |
Jakki L. Haussler (61)
c/o Perkins Coie LLP
Counsel to the Independent Directors
30 Rockefeller Plaza
New York, NY 10112 | | Director | | Since
January
2015 | | Chairman and Chief Executive Officer, Opus Capital Group (since January 1996); formerly, Director, Capvest Venture Fund, LP (May 2000-December 2011); Partner, Adena Ventures, LP (July 1999-December 2010); Director, The Victory Funds (February 2005-July 2008). | | | 83 | | | Director of Service Corporation International and Member, Audit Committee and Investment Committee; Director of Cincinnati Bell Inc. and Member, Audit Committee and Governance and Nominating Committee; Chairman of Northern Kentucky University Member Investment Committee; Member of Chase College of Law Transactional Law Practice Center Board of Advisors; Director of Best Transport; Director of Chase College of Law Board of Visitors; formerly, Member, University of Cincinnati Foundation Investment Committee; Member, Miami University Board of Visitors (2008-2011); Trustee of Victory Funds (2005-2008) and Chairman, Investment Committee (2007-2008) and Member, Service Provider Committee (2005-2008). | |
Dr. Manuel H. Johnson (69)
c/o Johnson Smick
International, Inc.
220 I Street, NE — Suite 200
Washington, D.C. 20002 | | Director | | Since
July
1991 | | Senior Partner, Johnson Smick International, Inc. (consulting firm); Chairperson of the Investment Committee (since October 2006) and Director or Trustee of various Morgan Stanley Funds (since July 1991); Co-Chairman and a founder of the Group of Seven Council (G7C) (international economic commission); formerly, Chairperson of the Audit Committee (July 1991-September 2006), Vice Chairman of the Board of Governors of the Federal Reserve System and Assistant Secretary of the U.S. Treasury. | | | 82 | | | Director of NVR, Inc. (home construction). | |
Joseph J. Kearns (76)
c/o Perkins Coie LLP
Counsel to the Independent Directors
30 Rockefeller Plaza
New York, NY 10112 | | Director | | Since
August
1994 | | Senior Adviser, Kearns & Associates LLC (investment consulting); Chairperson of the Audit Committee (since October 2006) and Director or Trustee of various Morgan Stanley Funds (since August 1994); formerly, Deputy Chairperson of the Audit Committee (July 2003-September 2006) and Chairperson of the Audit Committee of various Morgan Stanley Funds (since August 1994); CFO of the J. Paul Getty Trust. | | | 83 | | | Prior to August 10, 2016, Director of Electro Rent Corporation (equipment leasing); Prior to December 31, 2013, Director of The Ford Family Foundation. | |
35
Morgan Stanley Institutional Fund, Inc.
Annual Report — December 31, 2018
Director and Officer Information (unaudited) (cont'd)
Independent Directors: (cont'd)
Name, Age and Address of
Independent Director | | Position(s)
Held with
Registrant | | Length of Time
Served* | | Principal Occupation(s) During Past 5 Years
and Other Relevant Professional Experience | | Number of
Portfolios in
Fund Complex
Overseen by
Independent
Director** | | Other Directorships
Held by Independent
Director*** | |
Michael F. Klein (60)
c/o Perkins Coie LLP
Counsel to the Independent Directors
30 Rockefeller Plaza
New York, NY 10112 | | Director | | Since
August
2006 | | Managing Director, Aetos Alternatives Management, LP (since March 2000); Co-President, Aetos Alternatives Management, LP (since January 2004) and Co-Chief Executive Officer of Aetos Alternatives Management, LP (since August 2013); Chairperson of the Fixed Income Sub-Committee of the Investment Committee (since October 2006) and Director or Trustee of various Morgan Stanley Funds (since August 2006); formerly, Managing Director, Morgan Stanley & Co. Inc. and Morgan Stanley Dean Witter Investment Management and President, various Morgan Stanley Funds (June 1998-March 2000); Principal, Morgan Stanley & Co. Inc. and Morgan Stanley Dean Witter Investment Management (August 1997-December 1999). | | | 82 | | | Director of certain investment funds managed or sponsored by Aetos Alternatives Management, LP; Director of Sanitized AG and Sanitized Marketing AG (specialty chemicals). | |
Patricia Maleski (58)
c/o Perkins Coie LLP
Counsel to the Independent Directors
30 Rockefeller Plaza
New York, NY 10112 | | Director | | Since
January
2017 | | Managing Director, JPMorgan Asset Management (2004-2016); Oversight and Control Head of Fiduciary and Conflicts of Interest Program (2015-2016); Chief Control Officer-Global Asset Management (2013-2015); President, JPMorgan Funds (2010-2013); Chief Administrative Officer (2004-2013); various other positions including Treasurer and Board Liaison (since 2001). | | | 83 | | | None. | |
Michael E. Nugent (82)
522 Fifth Avenue
New York, NY 10036 | | Chair of the Board and Director | | Chair of the Boards since July 2006 and Director since July 1991 | | Chair of the Boards of various Morgan Stanley Funds (since July 2006); Chairperson of the Closed-End Fund Committee (since June 2012) Governance Committee (since January 2019) and Director or Trustee of various Morgan Stanley Funds (since July 1991); formerly, Chairperson of the Insurance Committee (until July 2006); General Partner, Triumph Capital, L.P. (private investment partnership) (1988-2013). | | | 82 | | | None. | |
W. Allen Reed (71)
c/o Perkins Coie LLP
Counsel to the Independent Directors
30 Rockefeller Plaza
New York, NY 10112 | | Director | | Since
August
2006 | | Chairperson of the Equity Sub-Committee of the Investment Committee (since October 2006) and Director or Trustee of various Morgan Stanley Funds (since August 2006); formerly, President and CEO of General Motors Asset Management; Chairman and Chief Executive Officer of the GM Trust Bank and Corporate Vice President of General Motors Corporation (August 1994-December 2005). | | | 82 | | | Director of Legg Mason, Inc.; formerly, Director of the Auburn University Foundation (2010-2015). | |
Fergus Reid (86)****
c/o Joe Pietryka, Inc.
85 Charles Colman Blvd.
Pawling, NY 12564 | | Director | | Since
June
1992 | | Chairman, Joe Pietryka, Inc.; Chairperson of the Governance Committee and Director or Trustee of various Morgan Stanley Funds (since June 1992). | | | 83 | | | Formerly, Trustee and Director of certain investment companies in the JP Morgan Fund Complex managed by JP Morgan Investment Management Inc. (1987-2012). | |
* This is the earliest date the Director began serving the Morgan Stanley Funds. Each Director serves an indefinite term, until his or her successor is elected.
** The Fund Complex includes (as of December 31, 2018) all open-end and closed-end funds (including all of their portfolios) advised by Morgan Stanley Investment Management Inc. (the "Adviser") and any funds that have an adviser that is an affiliated person of the Adviser (including, but not limited to, Morgan Stanley AIP GP LP).
*** This includes any directorships at public companies and registered investment companies held by the Director at any time during the past five years.
**** Effective date of retirement is December 31, 2018.
36
Morgan Stanley Institutional Fund, Inc.
Annual Report — December 31, 2018
Director and Officer Information (unaudited) (cont'd)
Executive Officers:
Name, Age and Address of Executive Officer | | Position(s) Held
with
Registrant | | Length of Time
Served* | | Principal Occupation(s) During Past 5 Years | |
John H. Gernon (55)
522 Fifth Avenue
New York, NY 10036 | | President and Principal Executive Officer | | Since
September
2013 | | President and Principal Executive Officer of the Equity and Fixed Income Funds and the Morgan Stanley AIP Funds (since September 2013) and the Liquidity Funds and various money market funds (since May 2014) in the Fund Complex; Managing Director of the Adviser; Head of Product (since 2006). | |
Timothy J. Knierim (59)
522 Fifth Avenue
New York, NY 10036 | | Chief Compliance Officer | | Since
December
2016 | | Managing Director of the Adviser and various entities affiliated with the Adviser; Chief Compliance Officer of various Morgan Stanley Funds and the Adviser (since December 2016) and Chief Compliance Officer of Morgan Stanley AIP GP LP (since 2014). Formerly, Managing Director and Deputy Chief Compliance Officer of the Adviser (2014-2016); and formerly, Chief Compliance Officer of Prudential Investment Management, Inc. (2007-2014). | |
Francis J. Smith (53)
522 Fifth Avenue
New York, NY 10036 | | Treasurer and Principal Financial Officer | | Treasurer since July 2003 and Principal Financial Officer since September 2002 | | Managing Director of the Adviser and various entities affiliated with the Adviser; Treasurer (since July 2003) and Principal Financial Officer of various Morgan Stanley Funds (since September 2002). | |
Mary E. Mullin (51)
522 Fifth Avenue
New York, NY 10036 | | Secretary | | Since
June
1999 | | Managing Director of the Adviser; Secretary of various Morgan Stanley Funds (since June 1999). | |
Michael J. Key (39)
522 Fifth Avenue
New York, NY 10036 | | Vice President | | Since
June
2017 | | Vice President of the Equity and Fixed Income Funds, Liquidity Funds, various money market funds and the Morgan Stanley AIP Funds in the Fund Complex (since June 2017); Executive Director of the Adviser; Head of Product Development for Equity and Fixed Income Funds (since August 2013). | |
* This is the earliest date the officer began serving the Morgan Stanley Funds. Each officer serves a one-year term, until his or her successor is elected and qualifies.
37
Morgan Stanley Institutional Fund, Inc.
Annual Report — December 31, 2018
Adviser and Administrator
Morgan Stanley Investment Management Inc.
522 Fifth Avenue
New York, New York 10036
Sub-Adviser
Morgan Stanley Investment Management Limited
25 Cabot Square, Canary Wharf
London, E14 4QA, England
Distributor
Morgan Stanley Distribution, Inc.
522 Fifth Avenue
New York, New York 10036
Dividend Disbursing and Transfer Agent
DST Asset Manager Solutions, Inc.
2000 Crown Colony Drive
Quincy, Massachusetts 02169
Custodian
State Street Bank and Trust Company
One Lincoln Street
Boston, Massachusetts 02111
Legal Counsel
Dechert LLP
1095 Avenue of the Americas
New York, New York 10036
Counsel to the Independent Directors
Perkins Coie LLP
30 Rockefeller Plaza
New York, New York 10112
Independent Registered Public Accounting Firm
Ernst & Young LLP
200 Clarendon Street
Boston, Massachusetts 02116
Reporting to Shareholders
Each Morgan Stanley fund provides a complete schedule of portfolio holdings in its semi-annual and the annual reports within 60 days of the end of the fund's second and fourth fiscal quarters. The semi-annual and annual reports are filed electronically with the Securities and Exchange Commission ("SEC") on Form N-CSRS and Form N-CSR, respectively. Morgan Stanley also delivers the semi-annual and annual reports to fund shareholders and makes these reports available on its public website, www.morganstanley.com/im/shareholderreports. Each Morgan Stanley fund also files a complete schedule of portfolio holdings with the SEC for the fund's first and third fiscal quarters on Form N-Q. Morgan Stanley does not deliver the reports for the first and third fiscal quarters to shareholders, nor are the reports posted to the Morgan Stanley public website. You may, however, obtain the Form N-Q filings (as well as the Form N-CSR and N-CSRS filings) by accessing the SEC's website, www.sec.gov. You can also request copies of these materials, upon payment of a duplicating fee, by electronic request at the SEC's email address (publicinfo@sec.gov).
Proxy Voting Policies and Procedures and Proxy Voting Record
You may obtain a copy of the Company's Proxy Voting Policy and Procedures and information regarding how the Company voted proxies relating to portfolio securities during the most recent twelve-month period ended June 30, without charge, upon request, by calling toll free 1 (800) 548-7786 or by visiting our website at www.morganstanley.com/im/shareholderreports. This information is also available on the SEC's website at www.sec.gov.
This report is authorized for distribution only when preceded or accompanied by a prospectus or summary prospectus of the applicable Fund of Morgan Stanley Institutional Fund, Inc., which describes in detail the Fund's investment policies, risks, fees and expenses. Please read the prospectus carefully before you invest or send money. For additional information, including information regarding the investments comprising the Fund, please visit our website at www.morganstanley.com/im/shareholderreports or call toll free 1 (800) 548-7786.
38
Printed in U.S.A.
This Report has been prepared for shareholders and may be distributed to others only if preceded or accompanied by a current prospectus.
Morgan Stanley Investment Management Inc.
522 Fifth Avenue
New York, New York 10036
© 2019 Morgan Stanley. Morgan Stanley Distribution, Inc.

IFIIEANN
2398486 EXP. 02.29.20

Morgan Stanley Institutional Fund, Inc.
International Opportunity Portfolio
Annual Report
December 31, 2018
Beginning on January 1, 2021, as permitted by regulations adopted by the Securities and Exchange Commission ("SEC"), paper copies of the Fund's Annual and Semi-Annual Reports to Shareholders ("Shareholder Reports") will no longer be sent by mail, unless you specifically request paper copies of the Shareholder Reports from the Fund or from your financial intermediary, such as a broker-dealer or a bank. Instead, the Shareholder Reports will be made available on the Fund's website, https://www.morganstanley.com/im/shareholderreports and you will be notified by mail each time a Shareholder Report is posted and provided with a website link to access the Shareholder Report. If you already elected to receive Shareholder Reports electronically, you will not be affected by this change and you need not take any action. You may elect to receive Shareholder Reports and other communications from the Fund electronically anytime by contacting your financial intermediary or, if you are a direct investor, please follow the instructions on the envelope.
Beginning on January 1, 2019, you may elect to receive all future Shareholder Reports in paper free of charge. If you invest through a financial intermediary, you can contact your financial intermediary to request that you continue to receive paper copies of your Shareholder Reports. If you invest directly with the Fund, please follow the instructions on the envelope to let the Fund know you wish to continue receiving paper copies of your Shareholder Reports. Your election to receive Shareholder Reports in paper will apply to all funds held in your account if you invest through your financial intermediary or all funds held with the fund complex if you invest directly with a fund.

Morgan Stanley Institutional Fund, Inc.
Annual Report — December 31, 2018
Shareholders' Letter | | | 2 | | |
Expense Example | | | 3 | | |
Investment Overview | | | 4 | | |
Portfolio of Investments | | | 6 | | |
Statement of Assets and Liabilities | | | 8 | | |
Statement of Operations | | | 10 | | |
Statements of Changes in Net Assets | | | 11 | | |
Financial Highlights | | | 13 | | |
Notes to Financial Statements | | | 19 | | |
Report of Independent Registered Public Accounting Firm | | | 28 | | |
Federal Tax Notice | | | 29 | | |
Privacy Notice | | | 30 | | |
Director and Officer Information | | | 33 | | |
This report is authorized for distribution only when preceded or accompanied by a prospectus or summary prospectus of the applicable Fund of Morgan Stanley Institutional Fund, Inc. To receive a prospectus and/or statement of additional information (SAI), which contains more complete information such as investment objectives, charges, expenses, policies for voting proxies, risk considerations and describes in detail each of the Fund's investment policies to the prospective investor, please call toll free 1 (800) 548-7786. Please read the prospectuses carefully before you invest or send money.
Additionally, you can access information about the Fund, including performance, characteristics and investment team commentary, through Morgan Stanley Investment Management's website: www.morganstanley.com/im/shareholderreports.
Market forecasts provided in this report may not necessarily come to pass. There is no guarantee that any sectors mentioned will continue to perform as discussed herein or that securities in such sectors will be held by the Fund in the future. There is no assurance that a fund will achieve its investment objective. Funds are subject to market risk, which is the possibility that market values of securities owned by the Fund will decline and, therefore, the value of the Fund's shares may be less than what you paid for them. Accordingly, you can lose money investing in this Fund. Please see the prospectus for more complete information on investment risks.
1
Morgan Stanley Institutional Fund, Inc.
Annual Report — December 31, 2018
Shareholders' Letter (unaudited)
Dear Shareholders,
We are pleased to provide this Annual report, in which you will learn how your investment in International Opportunity Portfolio (the "Fund") performed during the latest twelve-month period.
Morgan Stanley Investment Management is a client-centric, investor-led organization. Our global presence, intellectual capital, and breadth of products and services enable us to partner with investors to meet the evolving challenges of today's financial markets. We aim to deliver superior investment service and to empower our clients to make the informed decisions that help them reach their investment goals.
As always, we thank you for selecting Morgan Stanley Investment Management, and look forward to working with you in the months and years ahead.
Sincerely,

John H. Gernon
President and Principal Executive Officer
January 2019
2
Morgan Stanley Institutional Fund, Inc.
Annual Report — December 31, 2018
Expense Example (unaudited)
International Opportunity Portfolio
As a shareholder of the Fund, you incur two types of costs: (1) transactional costs, including redemption fees; and (2) ongoing costs, which may include advisory fees, administration fees, distribution and shareholder services fees and other Fund expenses. This example is intended to help you understand your ongoing costs (in dollars) of investing in the Fund and to compare these costs with the ongoing costs of investing in other mutual funds.
This example is based on an investment of $1,000 invested at the beginning of the six-month period ended December 31, 2018 and held for the entire six-month period.
Actual Expenses
The table below provides information about actual account values and actual expenses. You may use the information in this table, together with the amount you invested, to estimate the expenses that you paid over the period. Simply divide your account value by $1,000 (for example, an $8,600 account value divided by $1,000 = 8.6), then multiply the result by the number in the table under the heading entitled "Actual Expenses Paid During Period" to estimate the expenses you paid on your account during this period.
Hypothetical Example for Comparison Purposes
The table below provides information about hypothetical account values and hypothetical expenses based on the Fund's actual expense ratio and an assumed rate of return of 5% per year before expenses, which is not the Fund's actual return. The hypothetical account values and expenses may not be used to estimate the actual ending account balance or expenses you paid for the period. You may use this information to compare the ongoing costs of investing in the Fund and other funds. To do so, compare this 5% hypothetical example with the 5% hypothetical examples that appear in the shareholder reports of the other funds.
Please note that the expenses shown in the table are meant to highlight your ongoing costs only and do not reflect any transactional costs, such as sales charges (loads) and redemption fees. Therefore, the information for each class in the table is useful in comparing ongoing costs only, and will not help you determine the relative total costs of owning different funds. In addition, if these transactional costs were included, your costs would have been higher.
| | | Beginning
Account
Value
7/1/18 | | Actual Ending
Account
Value
12/31/18 | | Hypothetical
Ending Account
Value | | Actual
Expenses
Paid
During
Period* | | Hypothetical
Expenses Paid
During Period* | | Net
Expense
Ratio
During
Period** | |
International Opportunity Portfolio Class I | | $ | 1,000.00 | | | $ | 810.20 | | | $ | 1,020.16 | | | $ | 4.56 | | | $ | 5.09 | | | | 1.00 | % | |
International Opportunity Portfolio Class A | | | 1,000.00 | | | | 808.40 | | | | 1,018.25 | | | | 6.29 | | | | 7.02 | | | | 1.38 | | |
International Opportunity Portfolio Class L | | | 1,000.00 | | | | 806.60 | | | | 1,015.93 | | | | 8.38 | | | | 9.35 | | | | 1.84 | | |
International Opportunity Portfolio Class C | | | 1,000.00 | | | | 805.40 | | | | 1,014.72 | | | | 9.47 | | | | 10.56 | | | | 2.08 | | |
International Opportunity Portfolio Class IS | | | 1,000.00 | | | | 810.40 | | | | 1,020.42 | | | | 4.34 | | | | 4.84 | | | | 0.95 | | |
International Opportunity Portfolio Class IR | | | 1,000.00 | | | | 810.40 | | | | 1,020.47 | | | | 4.29 | | | | 4.79 | | | | 0.94 | | |
* Expenses are calculated using each Fund Class' annualized net expense ratio (as disclosed), multiplied by the average account value over the period and multiplied by 184/365 (to reflect the most recent one-half year period).
** Annualized.
3
Morgan Stanley Institutional Fund, Inc.
Annual Report — December 31, 2018
Investment Overview (unaudited)
International Opportunity Portfolio
The Fund seeks long-term capital appreciation.
Performance
For the fiscal year ended December 31, 2018, the Fund's Class I shares had a total return based on net asset value and reinvestment of distributions per share of –12.04%, net of fees. The Fund's Class I shares outperformed the Fund's benchmark, the MSCI All Country World ex USA Net Index (the "Index"), which returned –14.20%.
Factors Affecting Performance
• Global growth concerns weighed heavily on global equities in the 12-month period. Economic indicators were signaling slowdowns across China, Europe and the U.K., and Japan while at the same time financial conditions were tightening and geopolitical risks increased, particularly regarding trade protectionism. The U.S. economy was an outlier, as growth accelerated on tailwinds from tax cuts and deregulation. But by the end of the year, U.S. companies downgraded their earnings forecasts as the benefits of fiscal stimulus were expected to recede and business sentiment deteriorated due to the U.S.-China trade relations. With global growth fading and the outcome of trade disputes, Brexit and other issues still largely unpredictable, investors grew anxious about the duration of the Federal Reserve's monetary tightening and the European Central Bank's decision to begin withdrawing its stimulus. Pricing these risks was challenging, which led to increased equity volatility through the year.
• International equity markets declined 14.20% for the 12-month period ended December 31, 2018, as measured by the Index. Against this backdrop, our team remained focused on assessing company prospects over a longer-term period of three to five years, and owning a portfolio of high quality companies with diverse business drivers not tied to a particular market environment.
• The team manages concentrated portfolios that are highly differentiated from the benchmark, with securities weighted on our assessment of the quality of the company and our conviction. Our longer-term focus results in lower turnover than many of our peers. The value added or detracted in any period of time will typically result from stock selection, given our philosophy and process.
• For the 12-month period, the Fund outperformed the Index due to favorable stock selection and sector allocation.
• The chief contributor to the Fund's relative outperformance was our stock selection in consumer staples, materials and health care.
• Detracting from relative gains were our stock selection in consumer discretionary and energy, and an overweight in consumer staples. The Fund had no energy holdings at the end of reporting period.
Management Strategies
• There were no changes to our bottom-up investment process during the period. The team seeks high quality companies, which we define primarily as those with sustainable competitive advantages. Our team continues to focus on bottom-up stock selection and the long-term outlook for companies owned in the portfolio; accordingly, we have had very limited turnover in the portfolio to date, as our ongoing work reaffirms our assessment of quality and competitive advantage in the names we own.
• At the close of the period ended December 31, 2018, consumer discretionary represented the largest sector weight in the Fund, followed by consumer staples and information technology. The team's bottom-up investment process resulted in sector overweight positions in consumer discretionary, information technology and consumer staples and underweight positions in financials, materials, energy, health care, industrials, communication services, real estate and utilities. The Fund had no energy holdings at the end of reporting period.
4
Morgan Stanley Institutional Fund, Inc.
Annual Report — December 31, 2018
Investment Overview (unaudited) (cont'd)
International Opportunity Portfolio

* Minimum Investment for Class I shares
** Commenced Operations on March 31, 2010.
In accordance with SEC regulations, the Fund's performance shown assumes that all recurring fees (including management fees) were deducted and all dividends and distributions were reinvested. The performance of Class A, L, C, IS and IR shares will vary from the performance of Class I shares based upon their different inception dates and will be negatively impacted by additional fees assessed to those classes (if applicable).
Performance Compared to the MSCI All Country World ex USA Net Index(1) and the Lipper International Multi-Cap Growth Funds Index(2)
| | | Period Ended December 31, 2018
Total Returns(3) | |
| | | | | Average Annual | |
| | | One
Year | | Five
Years | | Ten
Years | | Since
Inception(8) | |
Fund — Class I Shares
w/o sales charges(4) | | | –12.04 | % | | | 9.02 | % | | | — | | | | 10.08 | % | |
Fund — Class A Shares
w/o sales charges(4) | | | –12.36 | | | | 8.64 | | | | — | | | | 9.74 | | |
Fund — Class A Shares with
maximum 5.25% sales charges(4) | | | –16.95 | | | | 7.48 | | | | — | | | | 9.07 | | |
Fund — Class L Shares
w/o sales charges(4) | | | –12.81 | | | | 8.07 | | | | — | | | | 9.18 | | |
Fund — Class C Shares
w/o sales charges(6) | | | –13.00 | | | | — | | | | — | | | | 6.81 | | |
Fund — Class C Shares with
maximum 1.00% deferred
sales charges(6) | | | –13.87 | | | | — | | | | — | | | | 6.81 | | |
Fund — Class IS Shares
w/o sales charges(5) | | | –12.03 | | | | 9.05 | | | | — | | | | 10.67 | | |
Fund — Class IR Shares
w/o sales charges(7) | | | — | | | | — | | | | — | | | | –21.84 | | |
MSCI All Country World
ex USA Net Index | | | –14.20 | | | | 0.68 | | | | — | | | | 3.18 | | |
Lipper International Multi-Cap
Growth Funds Index | | | –14.74 | | | | 0.60 | | | | — | | | | 3.97 | | |
Performance data quoted represents past performance, which is no guarantee of future results, and current performance may be lower or higher than the figures shown. Performance assumes that all dividends and distributions, if any, were reinvested. For the most recent month-end performance figures, please visit www.morganstanley.com/im/shareholderreports. Investment return and principal value will fluctuate so that Fund shares, when redeemed, may be worth more or less than their original cost. Returns for periods less than one year are not annualized. Total returns do not reflect the deduction of taxes that a shareholder would pay on Fund distributions or the redemption of Fund shares. Performance of share classes will vary due to difference in sales charges and expenses.
(1) The MSCI All Country World ex USA Net Index is a free float-adjusted market capitalization weighted index designed to measure the equity market performance of developed and emerging markets, excluding the United States. The term "free float" represents the portion of shares outstanding that are deemed to be available for purchase in the public equity markets by investors. The performance of the Index is listed in U.S. dollars and assumes reinvestment of net dividends. Net total return indices reinvest dividends after the deduction of withholding taxes, using (for international indices) a tax rate applicable to nonresident institutional investors who do not benefit from double taxation treaties. The Index is unmanaged and its returns do not include any sales charges or fees. Such costs would lower performance. It is not possible to invest directly in an index.
(2) The Lipper International Multi-Cap Growth Funds Index is an equally weighted performance index of the largest qualifying funds (based on net assets) in the Lipper International Multi-Cap Growth Funds classification. The Index, which is adjusted for capital gains distributions and income dividends, is unmanaged and should not be considered an investment. There are currently 30 funds represented in this Index. As of the date of this report, the Fund was in the Lipper International Multi-Cap Growth Funds classification.
(3) Total returns for the Fund reflect fees waived and expenses reimbursed, if applicable, by Morgan Stanley Investment Management Inc. (the "Adviser"). Without such waivers and reimbursements, total returns would have been lower.
(4) Commenced operations on March 31, 2010.
(5) Commenced offering on September 13, 2013.
(6) Commenced offering on April 30, 2015.
(7) Commenced offering on June 15, 2018.
(8) For comparative purposes, average annual since inception returns listed for the Indexes refer to the inception date of Class I of the Fund, not the inception of the Index.
5
Morgan Stanley Institutional Fund, Inc.
Annual Report — December 31, 2018
Portfolio of Investments
International Opportunity Portfolio
| | | Shares | | Value
(000) | |
Common Stocks (97.5%) | |
Argentina (1.6%) | |
Globant SA (a) | | | 282,623 | | | $ | 15,917 | | |
Belgium (0.9%) | |
Anheuser-Busch InBev SA N.V. | | | 131,694 | | | | 8,716 | | |
China (20.9%) | |
China Resources Beer Holdings Co., Ltd. (b) | | | 5,334,666 | | | | 18,485 | | |
Ctrip.com International Ltd. ADR (a) | | | 696,832 | | | | 18,856 | | |
Foshan Haitian Flavouring & Food Co., Ltd.,
Class A | | | 4,073,072 | | | | 40,768 | | |
Haidilao International Holding Ltd. (a) | | | 1,985,000 | | | | 4,202 | | |
Huazhu Group Ltd. ADR | | | 895,691 | | | | 25,644 | | |
Jiangsu Yanghe Brewery Joint-Stock Co., Ltd.,
Class A | | | 1,528,107 | | | | 21,060 | | |
Kweichow Moutai Co., Ltd., Class A | | | 172,614 | | | | 14,819 | | |
TAL Education Group ADR (a) | | | 2,457,985 | | | | 65,579 | | |
| | | | 209,413 | | |
Denmark (5.0%) | |
DSV A/S | | | 758,077 | | | | 49,987 | | |
France (4.6%) | |
Hermes International | | | 83,206 | | | | 46,017 | | |
Germany (2.1%) | |
Adidas AG | | | 101,438 | | | | 21,198 | | |
Hong Kong (1.7%) | |
Haidilao International Holding Ltd. (a)(c) | | | 4,355,000 | | | | 9,554 | | |
Meituan Dianping, Class B (a)(d) | | | 1,322,600 | | | | 7,439 | | |
| | | | 16,993 | | |
India (7.9%) | |
HDFC Bank Ltd. | | | 2,074,523 | | | | 63,119 | | |
IndusInd Bank Ltd. | | | 687,621 | | | | 15,779 | | |
| | | | 78,898 | | |
Italy (7.6%) | |
Moncler SpA | | | 2,297,947 | | | | 76,788 | | |
Japan (9.1%) | |
Calbee, Inc. | | | 937,900 | | | | 29,310 | | |
Keyence Corp. | | | 61,700 | | | | 31,096 | | |
Nihon M&A Center, Inc. | | | 695,200 | | | | 13,842 | | |
Pigeon Corp. | | | 202,700 | | | | 8,752 | | |
Yume No Machi Souzou Iinkai Co. Ltd. | | | 733,100 | | | | 8,641 | | |
| | | | 91,641 | | |
Korea, Republic of (2.5%) | |
NAVER Corp. | | | 235,308 | | | | 25,639 | | |
Sweden (3.0%) | |
Vitrolife AB | | | 1,826,093 | | | | 30,254 | | |
Switzerland (3.0%) | |
Chocoladefabriken Lindt & Spruengli AG
(Registered) | | | 408 | | | | 30,408 | | |
Taiwan (2.1%) | |
Taiwan Semiconductor Manufacturing Co., Ltd. | | | 2,968,000 | | | | 21,546 | | |
United Kingdom (14.1%) | |
Fevertree Drinks PLC | | | 1,503,420 | | | | 41,846 | | |
Just Eat PLC (a) | | | 3,380,424 | | | | 25,286 | | |
| | | Shares | | Value
(000) | |
Reckitt Benckiser Group PLC | | | 507,109 | | | $ | 38,726 | | |
Rightmove PLC | | | 6,418,722 | | | | 35,270 | | |
| | | | 141,128 | | |
United States (11.4%) | |
Booking Holdings, Inc. (a) | | | 27,821 | | | | 47,920 | | |
CEVA, Inc. (a) | | | 265,563 | | | | 5,866 | | |
EPAM Systems, Inc. (a) | | | 416,880 | | | | 48,362 | | |
MercadoLibre, Inc. | | | 42,634 | | | | 12,485 | | |
| | | | 114,633 | | |
Total Common Stocks (Cost $1,065,692) | | | 979,176 | | |
Short-Term Investments (2.5%) | |
Securities held as Collateral on Loaned Securities (0.0%) | |
Investment Company (0.0%) | |
Morgan Stanley Institutional Liquidity
Funds — Treasury Securities Portfolio —
Institutional Class (See Note G) | | | 67,604 | | | | 68 | | |
| | | Face
Amount
(000) | | | |
Repurchase Agreements (0.0%) | |
Barclays Capital, Inc., (2.90%,
dated 12/31/18, due 01/02/19;
proceeds $5; fully collateralized by
a U.S. Government obligation; 2.50%
due 05/15/24; valued at $5) | | $ | 5 | | | | 5 | | |
HSBC Securities USA, Inc., (2.95%,
dated 12/31/18, due 1/02/19;
proceeds $10; fully collateralized by
U.S. Government obligations; 0.00% - 2.75%
due 1/31/19 - 2/15/42; valued at $11) | | | 10 | | | | 10 | | |
| | | | 15 | | |
Total Securities held as Collateral on Loaned
Securities (Cost $83) | | | 83 | | |
| | | Shares | | | |
Investment Company (2.5%) | |
Morgan Stanley Institutional Liquidity
Funds — Treasury Securities Portfolio —
Institutional Class (See Note G)
(Cost $25,132) | | | 25,132,475 | | | | 25,132 | | |
Total Short-Term Investments (Cost $25,215) | | | 25,215 | | |
Total Investments Excluding Purchased
Options (100.0%) (Cost $1,090,908) | | | | | 1,004,391 | | |
Total Purchased Options Outstanding (0.1%)
(Cost $3,137) | | | 669 | | |
Total Investments (100.1%) (Cost $1,094,044)
Including $7,272 of Securities Loaned (e)(f) | | | 1,005,060 | | |
Liabilities in Excess of Other Assets (–0.1%) | | | (1,095 | ) | |
Net Assets (100.0%) | | $ | 1,003,965 | | |
Country assignments and aggregations are based generally on third party vendor classifications and information, and may be different from the assignments and aggregations under the policies set forth in the Fund's prospectus and/or statement of additional information relating to geographic classifications.
The accompanying notes are an integral part of the financial statements.
6
Morgan Stanley Institutional Fund, Inc.
Annual Report — December 31, 2018
Portfolio of Investments (cont'd)
International Opportunity Portfolio
(a) Non-income producing security.
(b) Security trades on the Hong Kong exchange.
(c) 144A security — Certain conditions for public sale may exist. Unless otherwise noted, these securities are deemed to be liquid.
(d) All or a portion of this security was on loan at December 31, 2018.
(e) The approximate fair value and percentage of net assets, $671,226,000 and 66.9%, respectively, represent the securities that have been fair valued under the fair valuation policy for international investments as described in Note A-1 within the Notes to the Financial Statements.
(f) At December 31, 2018, the aggregate cost for federal income tax purposes is approximately $1,096,501,000. The aggregate gross unrealized appreciation is approximately $25,266,000 and the aggregate gross unrealized depreciation is approximately $116,707,000, resulting in net unrealized depreciation of approximately $91,441,000.
ADR American Depositary Receipt.
Call Options Purchased:
The Fund had the following call options purchased open at December 31, 2018:
Counterparty | | Description | | Strike
Price | | Expiration
Date | | Number of
Contracts | | Notional
Amount
(000) | | Value
(000) | | Premiums
Paid
(000) | | Unrealized
Depreciation
(000) | |
Royal Bank of Scotland | | USD/CNH | | CNH | 7.16 | | | Jan-19 | | | 159,887,690 | | | | 159,888 | | | $ | 16 | | | $ | 694 | | | $ | (678 | ) | |
Royal Bank of Scotland | | USD/CNH | | CNH | 7.78 | | | Jul-19 | | | 253,361,109 | | | | 253,361 | | | | 275 | | | | 1,235 | | | | (960 | ) | |
Royal Bank of Scotland | | USD/CNH | | CNH | 8.00 | | | Oct-19 | | | 205,458,191 | | | | 205,458 | | | | 378 | | | | 1,208 | | | | (830 | ) | |
| | | | | | | | | | | | | $ | 669 | | | $ | 3,137 | | | $ | (2,468 | ) | |
CNH — Chinese Yuan Renminbi Offshore
USD — United States Dollar
Portfolio Composition*
Classification | | Percentage of
Total Investments | |
Other** | | | 27.8 | % | |
Textiles, Apparel & Luxury Goods | | | 14.3 | | |
Beverages | | | 10.4 | | |
Food Products | | | 10.0 | | |
Internet & Direct Marketing Retail | | | 9.5 | | |
Interactive Media & Services | | | 8.6 | | |
Banks | | | 7.9 | | |
Diversified Consumer Services | | | 6.5 | | |
Road & Rail | | | 5.0 | | |
Total Investments | | | 100.0 | % | |
* Percentages indicated are based upon total investments (excluding Securities held as Collateral on Loaned Securities) as of December 31, 2018.
** Industries and/or investment types representing less than 5% of total investments.
The accompanying notes are an integral part of the financial statements.
7
Morgan Stanley Institutional Fund, Inc.
Annual Report — December 31, 2018
International Opportunity Portfolio
Statement of Assets and Liabilities | | December 31, 2018
(000) | |
Assets: | |
Investments in Securities of Unaffiliated Issuers, at Value(1) (Cost $1,068,844) | | $ | 979,860 | | |
Investment in Security of Affiliated Issuer, at Value (Cost $25,200) | | | 25,200 | | |
Total Investments in Securities, at Value (Cost $1,094,044) | | | 1,005,060 | | |
Foreign Currency, at Value (Cost $323) | | | 325 | | |
Cash from Securities Lending | | | 1 | | |
Receivable for Investments Sold | | | 19,992 | | |
Receivable for Fund Shares Sold | | | 8,386 | | |
Dividends Receivable | | | 305 | | |
Tax Reclaim Receivable | | | 183 | | |
Receivable from Affiliate | | | 119 | | |
Receivable from Securities Lending Income | | | 17 | | |
Other Assets | | | 104 | | |
Total Assets | | | 1,034,492 | | |
Liabilities: | |
Payable for Investments Purchased | | | 17,340 | | |
Payable for Fund Shares Redeemed | | | 9,946 | | |
Payable for Advisory Fees | | | 1,912 | | |
Due to Broker | | | 735 | | |
Payable for Sub Transfer Agency Fees — Class I | | | 94 | | |
Payable for Sub Transfer Agency Fees — Class A | | | 56 | | |
Payable for Sub Transfer Agency Fees — Class L | | | — | @ | |
Payable for Sub Transfer Agency Fees — Class C | | | 5 | | |
Collateral on Securities Loaned, at Value | | | 84 | | |
Payable for Shareholder Services Fees — Class A | | | 49 | | |
Payable for Distribution and Shareholder Services Fees — Class L | | | — | @ | |
Payable for Distribution and Shareholder Services Fees — Class C | | | 32 | | |
Payable for Administration Fees | | | 72 | | |
Payable for Professional Fees | | | 67 | | |
Payable for Custodian Fees | | | 56 | | |
Payable for Transfer Agency Fees — Class I | | | 22 | | |
Payable for Transfer Agency Fees — Class A | | | 5 | | |
Payable for Transfer Agency Fees — Class L | | | 1 | | |
Payable for Transfer Agency Fees — Class C | | | 4 | | |
Payable for Transfer Agency Fees — Class IS | | | 3 | | |
Payable for Transfer Agency Fees — Class IR | | | 1 | | |
Other Liabilities | | | 43 | | |
Total Liabilities | | | 30,527 | | |
Net Assets | | $ | 1,003,965 | | |
Net Assets Consist of: | |
Paid-in-Capital | | $ | 1,122,229 | | |
Total Accumulated Loss | | | (118,264 | ) | |
Net Assets | | $ | 1,003,965 | | |
The accompanying notes are an integral part of the financial statements.
8
Morgan Stanley Institutional Fund, Inc.
Annual Report — December 31, 2018
International Opportunity Portfolio
Statement of Assets and Liabilities (cont'd) | | December 31, 2018
(000) | |
CLASS I: | |
Net Assets | | $ | 649,580 | | |
| Shares Outstanding $0.001 par value shares of beneficial interest (unlimited shares authorized) (not in 000's) | | | 32,862,247 | | |
Net Asset Value, Offering and Redemption Price Per Share | | $ | 19.77 | | |
CLASS A: | |
Net Assets | | $ | 223,098 | | |
| Shares Outstanding $0.001 par value shares of beneficial interest (unlimited shares authorized) (not in 000's) | | | 11,465,059 | | |
Net Asset Value, Redemption Price Per Share | | $ | 19.46 | | |
Maximum Sales Load | | | 5.25 | % | |
Maximum Sales Charge | | $ | 1.08 | | |
Maximum Offering Price Per Share | | $ | 20.54 | | |
CLASS L: | |
Net Assets | | $ | 382 | | |
| Shares Outstanding $0.001 par value shares of beneficial interest (unlimited shares authorized) (not in 000's) | | | 20,278 | | |
Net Asset Value, Offering and Redemption Price Per Share | | $ | 18.82 | | |
CLASS C: | |
Net Assets | | $ | 35,297 | | |
| Shares Outstanding $0.001 par value shares of beneficial interest (unlimited shares authorized) (not in 000's) | | | 1,894,245 | | |
Net Asset Value, Offering and Redemption Price Per Share | | $ | 18.63 | | |
CLASS IS: | |
Net Assets | | $ | 14,016 | | |
| Shares Outstanding $0.001 par value shares of beneficial interest (unlimited shares authorized) (not in 000's) | | | 708,419 | | |
Net Asset Value, Offering and Redemption Price Per Share | | $ | 19.79 | | |
CLASS IR: | |
Net Assets | | $ | 81,592 | | |
| Shares Outstanding $0.001 par value shares of beneficial interest (unlimited shares authorized) (not in 000's) | | | 4,122,237 | | |
Net Asset Value, Offering and Redemption Price Per Share | | $ | 19.79 | | |
(1) Including:
Securities on Loan, at Value: | | $ | 7,272 | | |
@ Amount is less than $500.
The accompanying notes are an integral part of the financial statements.
9
Morgan Stanley Institutional Fund, Inc.
Annual Report — December 31, 2018
International Opportunity Portfolio
Statement of Operations | | Year Ended
December 31, 2018
(000) | |
Investment Income: | |
Dividends from Securities of Unaffiliated Issuers (Net of $595 of Foreign Taxes Withheld) | | $ | 5,777 | | |
Non-Cash Dividends from Securities of Unaffiliated Issuers | | | 1,406 | | |
Dividends from Security of Affiliated Issuer (Note G) | | | 1,253 | | |
Income from Securities Loaned — Net | | | 156 | | |
Total Investment Income | | | 8,592 | | |
Expenses: | |
Advisory Fees (Note B) | | | 8,540 | | |
Shareholder Services Fees — Class A (Note D) | | | 685 | | |
Distribution and Shareholder Services Fees — Class L (Note D) | | | 3 | | |
Distribution and Shareholder Services Fees — Class C (Note D) | | | 385 | | |
Sub Transfer Agency Fees — Class I | | | 615 | | |
Sub Transfer Agency Fees — Class A | | | 401 | | |
Sub Transfer Agency Fees — Class L | | | — | @ | |
Sub Transfer Agency Fees — Class C | | | 34 | | |
Administration Fees (Note C) | | | 861 | | |
Custodian Fees (Note F) | | | 262 | | |
Registration Fees | | | 160 | | |
Professional Fees | | | 150 | | |
Transfer Agency Fees — Class I (Note E) | | | 59 | | |
Transfer Agency Fees — Class A (Note E) | | | 13 | | |
Transfer Agency Fees — Class L (Note E) | | | 2 | | |
Transfer Agency Fees — Class C (Note E) | | | 11 | | |
Transfer Agency Fees — Class IS (Note E) | | | 9 | | |
Transfer Agency Fees — Class IR (Note E) | | | 1 | | |
Shareholder Reporting Fees | | | 93 | | |
Directors' Fees and Expenses | | | 28 | | |
Pricing Fees | | | — | @ | |
Other Expenses | | | 44 | | |
Total Expenses | | | 12,356 | | |
Reimbursement of Class Specific Expenses — Class I (Note B) | | | (237 | ) | |
Reimbursement of Class Specific Expenses — Class L (Note B) | | | (2 | ) | |
Reimbursement of Class Specific Expenses — Class IS (Note B) | | | (5 | ) | |
Reimbursement of Class Specific Expenses — Class IR (Note B) | | | (1 | ) | |
Rebate from Morgan Stanley Affiliate (Note G) | | | (145 | ) | |
Waiver of Advisory Fees (Note B) | | | (76 | ) | |
Net Expenses | | | 11,890 | | |
Net Investment Loss | | | (3,298 | ) | |
Realized Loss: | |
Investments Sold | | | (26,700 | ) | |
Foreign Currency Translation | | | (442 | ) | |
Net Realized Loss | | | (27,142 | ) | |
Change in Unrealized Appreciation (Depreciation): | |
Investments (Net Decrease in Deferred Capital Gain Country Tax of $351) | | | (171,430 | ) | |
Foreign Currency Translation | | | 3 | | |
Net Change in Unrealized Appreciation (Depreciation) | | | (171,427 | ) | |
Net Realized Loss and Change in Unrealized Appreciation (Depreciation) | | | (198,569 | ) | |
Net Decrease in Net Assets Resulting from Operations | | $ | (201,867 | ) | |
@ Amount is less than $500.
The accompanying notes are an integral part of the financial statements.
10
Morgan Stanley Institutional Fund, Inc.
Annual Report — December 31, 2018
International Opportunity Portfolio
Statements of Changes in Net Assets | | Year Ended
December 31, 2018
(000) | | Year Ended
December 31, 2017
(000) | |
Increase (Decrease) in Net Assets: | |
Operations: | |
Net Investment Loss | | $ | (3,298 | ) | | $ | (1,517 | ) | |
Net Realized Gain (Loss) | | | (27,142 | ) | | | 11,848 | | |
Net Change in Unrealized Appreciation (Depreciation) | | | (171,427 | ) | | | 79,819 | | |
Net Increase (Decrease) in Net Assets Resulting from Operations | | | (201,867 | ) | | | 90,150 | | |
Dividends and Distributions to Shareholders: | |
Class I | | | (1,559 | ) | | | (5,012 | )* | |
Class A | | | (642 | ) | | | (2,793 | )* | |
Class L | | | (1 | ) | | | (6 | )* | |
Class C | | | (92 | ) | | | (360 | )* | |
Class IS | | | (212 | ) | | | (849 | )* | |
Class IR | | | (8 | ) | | | — | | |
Total Dividends and Distributions to Shareholders | | | (2,514 | ) | | | (9,020 | ) | |
Capital Share Transactions:(1) | |
Class I: | |
Subscribed | | | 760,795 | | | | 267,962 | | |
Distributions Reinvested | | | 1,546 | | | | 5,005 | | |
Redeemed | | | (336,583 | ) | | | (29,983 | ) | |
Class A: | |
Subscribed | | | 289,203 | | | | 177,334 | | |
Distributions Reinvested | | | 642 | | | | 2,793 | | |
Redeemed | | | (208,727 | ) | | | (26,941 | ) | |
Class L: | |
Exchanged | | | 70 | | | | 42 | | |
Distributions Reinvested | | | 1 | | | | 6 | | |
Redeemed | | | — | | | | (16 | ) | |
Class C: | |
Subscribed | | | 32,690 | | | | 19,131 | | |
Distributions Reinvested | | | 92 | | | | 360 | | |
Redeemed | | | (13,408 | ) | | | (1,137 | ) | |
Class IS: | |
Subscribed | | | 59,381 | | | | 53,039 | | |
Distributions Reinvested | | | 212 | | | | 848 | | |
Redeemed | | | (105,874 | ) | | | (443 | ) | |
Class IR: | |
Subscribed | | | 101,727 | | | | — | | |
Distributions Reinvested | | | 8 | | | | — | | |
Net Increase in Net Assets Resulting from Capital Share Transactions | | | 581,775 | | | | 468,000 | | |
Redemption Fees | | | 115 | | | | 46 | | |
Total Increase in Net Assets | | | 377,509 | | | | 549,176 | | |
Net Assets: | |
Beginning of Period | | | 626,456 | | | | 77,280 | | |
End of Period | | $ | 1,003,965 | | | $ | 626,456 | † | |
The accompanying notes are an integral part of the financial statements.
11
Morgan Stanley Institutional Fund, Inc.
Annual Report — December 31, 2018
International Opportunity Portfolio
Statements of Changes in Net Assets (cont'd) | | Year Ended
December 31, 2018
(000) | | Year Ended
December 31, 2017
(000) | |
(1) Capital Share Transactions: | |
Class I: | |
Shares Subscribed | | | 32,491 | | | | 13,008 | | |
Shares Issued on Distributions Reinvested | | | 64 | | | | 228 | | |
Shares Redeemed | | | (15,594 | ) | | | (1,515 | ) | |
Net Increase in Class I Shares Outstanding | | | 16,961 | | | | 11,721 | | |
Class A: | |
Shares Subscribed | | | 12,370 | | | | 8,781 | | |
Shares Issued on Distributions Reinvested | | | 27 | | | | 129 | | |
Shares Redeemed | | | (9,337 | ) | | | (1,298 | ) | |
Net Increase in Class A Shares Outstanding | | | 3,060 | | | | 7,612 | | |
Class L: | |
Shares Exchanged | | | 3 | | | | 3 | | |
Shares Issued on Distributions Reinvested | | | — | @@ | | | — | @@ | |
Shares Redeemed | | | (— | @@) | | | (1 | ) | |
Net Increase in Class L Shares Outstanding | | | 3 | | | | 2 | | |
Class C: | |
Shares Subscribed | | | 1,444 | | | | 999 | | |
Shares Issued on Distributions Reinvested | | | 4 | | | | 17 | | |
Shares Redeemed | | | (641 | ) | | | (58 | ) | |
Net Increase in Class C Shares Outstanding | | | 807 | | | | 958 | | |
Class IS: | |
Shares Subscribed | | | 2,436 | | | | 2,471 | | |
Shares Issued on Distributions Reinvested | | | 9 | | | | 38 | | |
Shares Redeemed | | | (4,293 | ) | | | (21 | ) | |
Net Increase (Decrease) in Class IS Shares Outstanding | | | (1,848 | ) | | | 2,488 | | |
Class IR: | |
Shares Subscribed | | | 4,122 | | | | — | | |
Shares Issued on Distributions Reinvested | | | — | @@ | | | — | | |
Net Increase in Class IR Shares Outstanding | | | 4,122 | (a) | | | — | | |
(a) For the period June 15, 2018 through December 31, 2018.
@ Amount is less than $500.
@@ Amount is less than 500 shares.
The following information was previously reported in the December 31, 2017 financial statements. The distribution information for the year ended December 31, 2017 presented on the Statements of Changes in Net Assets is presented for comparative purposes to the December 31, 2018 financial statements, which conform to the SEC Final Rule on Disclosure Update and Simplification which was effective November 5, 2018.
* Dividends and Distributions to Shareholders for the year ended December 31, 2017 were as follows:
Class I: | |
Net Realized Gain | | $ | (5,012 | ) | |
Class A: | |
Net Realized Gain | | $ | (2,793 | ) | |
Class L: | |
Net Realized Gain | | $ | (6 | ) | |
Class C: | |
Net Realized Gain | | $ | (360 | ) | |
Class IS: | |
Net Realized Gain | | $ | (849 | ) | |
† Accumulated Net Investment Loss for the year ended December 31, 2017 was $(9).
The accompanying notes are an integral part of the financial statements.
12
Morgan Stanley Institutional Fund, Inc.
Annual Report — December 31, 2018
Financial Highlights
International Opportunity Portfolio
| | | Class I | |
| | | Year Ended December 31, | |
Selected Per Share Data and Ratios | | 2018 | | 2017 | | 2016(1) | | 2015 | | 2014 | |
Net Asset Value, Beginning of Period | | $ | 22.52 | | | $ | 14.93 | | | $ | 15.03 | | | $ | 13.92 | | | $ | 13.77 | | |
Income (Loss) from Investment Operations: | |
Net Investment Income (Loss)(2) | | | (0.04 | ) | | | (0.08 | ) | | | (0.03 | ) | | | (0.00 | )(3) | | | 0.08 | | |
Net Realized and Unrealized Gain (Loss) | | | (2.66 | ) | | | 8.04 | | | | (0.07 | ) | | | 1.58 | | | | 0.36 | | |
Total from Investment Operations | | | (2.70 | ) | | | 7.96 | | | | (0.10 | ) | | | 1.58 | | | | 0.44 | | |
Distributions from and/or in Excess of: | |
Net Investment Income | | | — | | | | — | | | | (0.00 | )(3) | | | (0.03 | ) | | | (0.01 | ) | |
Net Realized Gain | | | (0.05 | ) | | | (0.37 | ) | | | — | | | | (0.44 | ) | | | (0.28 | ) | |
Total Distributions | | | (0.05 | ) | | | (0.37 | ) | | | (0.00 | )(3) | | | (0.47 | ) | | | (0.29 | ) | |
Redemption Fees | | | 0.00 | (3) | | | 0.00 | (3) | | | 0.00 | (3) | | | 0.00 | (3) | | | 0.00 | (3) | |
Net Asset Value, End of Period | | $ | 19.77 | | | $ | 22.52 | | | $ | 14.93 | | | $ | 15.03 | | | $ | 13.92 | | |
Total Return(4) | | | (12.04 | )% | | | 53.38 | % | | | (0.65 | )% | | | 11.40 | % | | | 3.14 | % | |
Ratios and Supplemental Data: | |
Net Assets, End of Period (Thousands) | | $ | 649,580 | | | $ | 358,141 | | | $ | 62,440 | | | $ | 52,128 | | | $ | 10,943 | | |
Ratio of Expenses to Average Net Assets(8) | | | 0.99 | %(5) | | | 0.98 | %(5) | | | 1.00 | %(5) | | | 1.01 | %(5)(6) | | | 1.09 | %(5) | |
Ratio of Net Investment Income (Loss) to Average Net Assets(8) | | | (0.19 | )%(5) | | | (0.42 | )%(5) | | | (0.22 | )%(5) | | | (0.01 | )%(5) | | | 0.57 | %(5) | |
Ratio of Rebate from Morgan Stanley Affiliates to Average Net Assets | | | 0.01 | % | | | 0.02 | % | | | 0.00 | %(7) | | | 0.01 | % | | | 0.01 | % | |
Portfolio Turnover Rate | | | 36 | % | | | 30 | % | | | 42 | % | | | 51 | % | | | 33 | % | |
(8) Supplemental Information on the Ratios to Average Net Assets: | |
Ratios Before Expense Limitation: | |
Expenses to Average Net Assets | | | 1.04 | % | | | 1.10 | % | | | 1.34 | % | | | 1.95 | % | | | 3.25 | % | |
Net Investment Loss to Average Net Assets | | | (0.24 | )% | | | (0.54 | )% | | | (0.56 | )% | | | (0.95 | )% | | | (1.59 | )% | |
(1) Reflects prior period Custodian out-of-pocket expenses that were reimbursed in September 2016. The amount of the reimbursement was immaterial on a per share basis and did not impact the total return of Class I shares. The Ratio of Expenses to Average Net Assets and the Ratio of Net Investment Loss to Average Net Assets would be unchanged as the reimbursement of Custodian fees was offset against expense waivers/reimbursements with no impact to net expenses or net investment loss.
(2) Per share amount is based on average shares outstanding.
(3) Amount is less than $0.005 per share.
(4) Calculated based on the net asset value as of the last business day of the period.
(5) The Ratios of Expenses and Net Investment Income (Loss) reflect the rebate of certain Fund expenses in connection with the investments in Morgan Stanley affiliates during the period. The effect of the rebate on the ratios is disclosed in the above table as "Ratio of Rebate from Morgan Stanley Affiliates to Average Net Assets."
(6) Effective July 1, 2015, the Adviser has agreed to limit the ratio of expenses to average net assets to the maximum ratio of 1.00% for Class I shares. Prior to July 1, 2015, the maximum ratio was 1.15% for Class I shares.
(7) Amount is less than 0.005%.
The accompanying notes are an integral part of the financial statements.
13
Morgan Stanley Institutional Fund, Inc.
Annual Report — December 31, 2018
Financial Highlights
International Opportunity Portfolio
| | | Class A | |
| | | Year Ended December 31, | |
Selected Per Share Data and Ratios | | 2018 | | 2017 | | 2016(1) | | 2015 | | 2014 | |
Net Asset Value, Beginning of Period | | $ | 22.25 | | | $ | 14.79 | | | $ | 14.93 | | | $ | 13.87 | | | $ | 13.78 | | |
Income (Loss) from Investment Operations: | |
Net Investment Income (Loss)(2) | | | (0.11 | ) | | | (0.15 | ) | | | (0.08 | ) | | | (0.06 | ) | | | 0.01 | | |
Net Realized and Unrealized Gain (Loss) | | | (2.63 | ) | | | 7.98 | | | | (0.06 | ) | | | 1.57 | | | | 0.37 | | |
Total from Investment Operations | | | (2.74 | ) | | | 7.83 | | | | (0.14 | ) | | | 1.51 | | | | 0.38 | | |
Distributions from and/or in Excess of: | |
Net Investment Income | | | — | | | | — | | | | — | | | | (0.01 | ) | | | (0.01 | ) | |
Net Realized Gain | | | (0.05 | ) | | | (0.37 | ) | | | — | | | | (0.44 | ) | | | (0.28 | ) | |
Total Distributions | | | (0.05 | ) | | | (0.37 | ) | | | — | | | | (0.45 | ) | | | (0.29 | ) | |
Redemption Fees | | | 0.00 | (3) | | | 0.00 | (3) | | | 0.00 | (3) | | | 0.00 | (3) | | | 0.00 | (3) | |
Net Asset Value, End of Period | | $ | 19.46 | | | $ | 22.25 | | | $ | 14.79 | | | $ | 14.93 | | | $ | 13.87 | | |
Total Return(4) | | | (12.36 | )% | | | 53.01 | % | | | (1.00 | )% | | | 10.99 | % | | | 2.71 | % | |
Ratios and Supplemental Data: | |
Net Assets, End of Period (Thousands) | | $ | 223,098 | | | $ | 186,988 | | | $ | 11,727 | | | $ | 9,520 | | | $ | 992 | | |
Ratio of Expenses to Average Net Assets(8) | | | 1.33 | %(5) | | | 1.27 | %(5) | | | 1.35 | %(5) | | | 1.34 | %(5)(6) | | | 1.49 | %(5) | |
Ratio of Net Investment Income (Loss) to Average Net Assets(8) | | | (0.51 | )%(5) | | | (0.74 | )%(5) | | | (0.55 | )%(5) | | | (0.39 | )%(5) | | | 0.04 | %(5) | |
Ratio of Rebate from Morgan Stanley Affiliates to Average Net Assets | | | 0.01 | % | | | 0.02 | % | | | 0.00 | %(7) | | | 0.01 | % | | | 0.01 | % | |
Portfolio Turnover Rate | | | 36 | % | | | 30 | % | | | 42 | % | | | 51 | % | | | 33 | % | |
(8) Supplemental Information on the Ratios to Average Net Assets: | |
Ratios Before Expense Limitation: | |
Expenses to Average Net Assets | | | 1.34 | % | | | 1.36 | % | | | 1.66 | % | | | 2.28 | % | | | 3.81 | % | |
Net Investment Loss to Average Net Assets | | | (0.52 | )% | | | (0.83 | )% | | | (0.86 | )% | | | (1.33 | )% | | | (2.28 | )% | |
(1) Reflects prior period Custodian out-of-pocket expenses that were reimbursed in September 2016. The amount of the reimbursement was immaterial on a per share basis and did not impact the total return of Class A shares. The Ratio of Expenses to Average Net Assets and the Ratio of Net Investment Loss to Average Net Assets would be unchanged as the reimbursement of Custodian fees was offset against expense waivers/reimbursements with no impact to net expenses or net investment loss.
(2) Per share amount is based on average shares outstanding.
(3) Amount is less than $0.005 per share.
(4) Calculated based on the net asset value which does not reflect sales charges, if applicable, as of the last business day of the period.
(5) The Ratios of Expenses and Net Investment Income (Loss) reflect the rebate of certain Fund expenses in connection with the investments in Morgan Stanley affiliates during the period. The effect of the rebate on the ratios is disclosed in the above table as "Ratio of Rebate from Morgan Stanley Affiliates to Average Net Assets."
(6) Effective July 1, 2015, the Adviser has agreed to limit the ratio of expenses to average net assets to the maximum ratio of 1.35% for Class A shares. Prior to July 1, 2015, the maximum ratio was 1.50% for Class A shares.
(7) Amount is less than 0.005%.
The accompanying notes are an integral part of the financial statements.
14
Morgan Stanley Institutional Fund, Inc.
Annual Report — December 31, 2018
Financial Highlights
International Opportunity Portfolio
| | | Class L | |
| | | Year Ended December 31, | |
Selected Per Share Data and Ratios | | 2018 | | 2017 | | 2016(1) | | 2015 | | 2014 | |
Net Asset Value, Beginning of Period | | $ | 21.63 | | | $ | 14.47 | | | $ | 14.69 | | | $ | 13.71 | | | $ | 13.68 | | |
Income (Loss) from Investment Operations: | |
Net Investment Loss(2) | | | (0.22 | ) | | | (0.22 | ) | | | (0.14 | ) | | | (0.12 | ) | | | (0.05 | ) | |
Net Realized and Unrealized Gain (Loss) | | | (2.54 | ) | | | 7.75 | | | | (0.08 | ) | | | 1.54 | | | | 0.36 | | |
Total from Investment Operations | | | (2.76 | ) | | | 7.53 | | | | (0.22 | ) | | | 1.42 | | | | 0.31 | | |
Distributions from and/or in Excess of: | |
Net Realized Gain | | | (0.05 | ) | | | (0.37 | ) | | | — | | | | (0.44 | ) | | | (0.28 | ) | |
Redemption Fees | | | 0.00 | (3) | | | 0.00 | (3) | | | 0.00 | (3) | | | 0.00 | (3) | | | 0.00 | (3) | |
Net Asset Value, End of Period | | $ | 18.82 | | | $ | 21.63 | | | $ | 14.47 | | | $ | 14.69 | | | $ | 13.71 | | |
Total Return(4) | | | (12.81 | )% | | | 52.11 | % | | | (1.50 | )% | | | 10.38 | % | | | 2.24 | % | |
Ratios and Supplemental Data: | |
Net Assets, End of Period (Thousands) | | $ | 382 | | | $ | 364 | | | $ | 221 | | | $ | 266 | | | $ | 193 | | |
Ratio of Expenses to Average Net Assets(8) | | | 1.84 | %(5) | | | 1.84 | %(5) | | | 1.85 | %(5) | | | 1.91 | %(5)(6) | | | 1.99 | %(5) | |
Ratio of Net Investment Loss to Average Net Assets(8) | | | (1.02 | )%(5) | | | (1.16 | )%(5) | | | (1.00 | )%(5) | | | (0.80 | )%(5) | | | (0.38 | )%(5) | |
Ratio of Rebate from Morgan Stanley Affiliates to Average Net Assets | | | 0.01 | % | | | 0.01 | % | | | 0.00 | %(7) | | | 0.01 | % | | | 0.01 | % | |
Portfolio Turnover Rate | | | 36 | % | | | 30 | % | | | 42 | % | | | 51 | % | | | 33 | % | |
(8) Supplemental Information on the Ratios to Average Net Assets: | |
Ratios Before Expense Limitation: | |
Expenses to Average Net Assets | | | 2.28 | % | | | 2.51 | % | | | 3.16 | % | | | 3.54 | % | | | 5.06 | % | |
Net Investment Loss to Average Net Assets | | | (1.46 | )% | | | (1.83 | )% | | | (2.31 | )% | | | (2.43 | )% | | | (3.45 | )% | |
(1) Reflects prior period Custodian out-of-pocket expenses that were reimbursed in September 2016. The amount of the reimbursement was immaterial on a per share basis and did not impact the total return of Class L shares. The Ratio of Expenses to Average Net Assets and the Ratio of Net Investment Loss to Average Net Assets would be unchanged as the reimbursement of Custodian fees was offset against expense waivers/reimbursements with no impact to net expenses or net investment loss.
(2) Per share amount is based on average shares outstanding.
(3) Amount is less than $0.005 per share.
(4) Calculated based on the net asset value as of the last business day of the period.
(5) The Ratios of Expenses and Net Investment Loss reflect the rebate of certain Fund expenses in connection with the investments in Morgan Stanley affiliates during the period. The effect of the rebate on the ratios is disclosed in the above table as "Ratio of Rebate from Morgan Stanley Affiliates to Average Net Assets."
(6) Effective July 1, 2015, the Adviser has agreed to limit the ratio of expenses to average net assets to the maximum ratio of 1.85% for Class L shares. Prior to July 1, 2015, the maximum ratio was 2.00% for Class L shares.
(7) Amount is less than 0.005%.
The accompanying notes are an integral part of the financial statements.
15
Morgan Stanley Institutional Fund, Inc.
Annual Report — December 31, 2018
Financial Highlights
International Opportunity Portfolio
| | | Class C | |
| | | Year Ended December 31, | | Period from
April 30, 2015(2) to | |
Selected Per Share Data and Ratios | | 2018 | | 2017 | | 2016(1) | | December 31, 2015 | |
Net Asset Value, Beginning of Period | | $ | 21.46 | | | $ | 14.39 | | | $ | 14.63 | | | $ | 15.39 | | |
Income (Loss) from Investment Operations: | |
Net Investment Loss(3) | | | (0.27 | ) | | | (0.29 | ) | | | (0.19 | ) | | | (0.13 | ) | |
Net Realized and Unrealized Gain (Loss) | | | (2.51 | ) | | | 7.73 | | | | (0.05 | ) | | | (0.16 | ) | |
Total from Investment Operations | | | (2.78 | ) | | | 7.44 | | | | (0.24 | ) | | | (0.29 | ) | |
Distributions from and/or in Excess of: | |
Net Investment Income | | | — | | | | — | | | | — | | | | (0.03 | ) | |
Net Realized Gain | | | (0.05 | ) | | | (0.37 | ) | | | — | | | | (0.44 | ) | |
Total Distributions | | | (0.05 | ) | | | (0.37 | ) | | | — | | | | (0.47 | ) | |
Redemption Fees | | | 0.00 | (4) | | | 0.00 | (4) | | | 0.00 | (4) | | | 0.00 | (4) | |
Net Asset Value, End of Period | | $ | 18.63 | | | $ | 21.46 | | | $ | 14.39 | | | $ | 14.63 | | |
Total Return(5) | | | (13.00 | )% | | | 51.77 | % | | | (1.71 | )% | | | (1.85 | )%(9) | |
Ratios and Supplemental Data: | |
Net Assets, End of Period (Thousands) | | $ | 35,297 | | | $ | 23,334 | | | $ | 1,862 | | | $ | 1,776 | | |
Ratio of Expenses to Average Net Assets(11) | | | 2.04 | %(6) | | | 2.01 | %(6) | | | 2.10 | %(6) | | | 2.10 | %(6)(7)(10) | |
Ratio of Net Investment Loss to Average Net Assets(11) | | | (1.24 | )%(6) | | | (1.45 | )%(6) | | | (1.32 | )%(6) | | | (1.28 | )%(6)(10) | |
Ratio of Rebate from Morgan Stanley Affiliates to Average Net Assets | | | 0.01 | % | | | 0.02 | % | | | 0.00 | %(8) | | | 0.01 | %(10) | |
Portfolio Turnover Rate | | | 36 | % | | | 30 | % | | | 42 | % | | | 51 | % | |
(11) Supplemental Information on the Ratios to Average Net Assets: | |
Ratios Before Expense Limitation: | |
Expenses to Average Net Assets | | | 2.06 | % | | | 2.10 | % | | | 2.43 | % | | | 3.03 | %(10) | |
Net Investment Loss to Average Net Assets | | | (1.26 | )% | | | (1.54 | )% | | | (1.65 | )% | | | (2.21 | )%(10) | |
(1) Reflects prior period Custodian out-of-pocket expenses that were reimbursed in September 2016. The amount of the reimbursement was immaterial on a per share basis and did not impact the total return of Class C shares. The Ratio of Expenses to Average Net Assets and the Ratio of Net Investment Loss to Average Net Assets would be unchanged as the reimbursement of Custodian fees was offset against expense waivers/reimbursements with no impact to net expenses or net investment loss.
(2) Commencement of Offering.
(3) Per share amount is based on average shares outstanding.
(4) Amount is less than $0.005 per share.
(5) Calculated based on the net asset value which does not reflect sales charges, if applicable, as of the last business day of the period.
(6) The Ratios of Expenses and Net Investment Loss reflect the rebate of certain Fund expenses in connection with the investments in Morgan Stanley affiliates during the period. The effect of the rebate on the ratios is disclosed in the above table as "Ratio of Rebate from Morgan Stanley Affiliates to Average Net Assets."
(7) Effective July 1, 2015, the Adviser has agreed to limit the ratio of expenses to average net assets to the maximum ratio of 2.10% for Class C shares. Prior to July 1, 2015, the maximum ratio was 2.25% for Class C shares.
(8) Amount is less than 0.005%.
(9) Not annualized.
(10) Annualized.
The accompanying notes are an integral part of the financial statements.
16
Morgan Stanley Institutional Fund, Inc.
Annual Report — December 31, 2018
Financial Highlights
International Opportunity Portfolio
| | | Class IS | |
| | | Year Ended December 31, | |
Selected Per Share Data and Ratios | | 2018 | | 2017 | | 2016(1) | | 2015 | | 2014 | |
Net Asset Value, Beginning of Period | | $ | 22.54 | | | $ | 14.94 | | | $ | 15.03 | | | $ | 13.92 | | | $ | 13.77 | | |
Income (Loss) from Investment Operations: | |
Net Investment Income (Loss)(2) | | | 0.02 | | | | (0.12 | ) | | | (0.03 | ) | | | 0.02 | | | | 0.07 | | |
Net Realized and Unrealized Gain (Loss) | | | (2.72 | ) | | | 8.09 | | | | (0.06 | ) | | | 1.56 | | | | 0.37 | | |
Total from Investment Operations | | | (2.70 | ) | | | 7.97 | | | | (0.09 | ) | | | 1.58 | | | | 0.44 | | |
Distributions from and/or in Excess of: | |
Net Investment Income | | | — | | | | — | | | | (0.00 | )(3) | | | (0.03 | ) | | | (0.01 | ) | |
Net Realized Gain | | | (0.05 | ) | | | (0.37 | ) | | | — | | | | (0.44 | ) | | | (0.28 | ) | |
Total Distributions | | | (0.05 | ) | | | (0.37 | ) | | | (0.00 | )(3) | | | (0.47 | ) | | | (0.29 | ) | |
Redemption Fees | | | 0.00 | (3) | | | 0.00 | (3) | | | 0.00 | (3) | | | 0.00 | (3) | | | 0.00 | (3) | |
Net Asset Value, End of Period | | $ | 19.79 | | | $ | 22.54 | | | $ | 14.94 | | | $ | 15.03 | | | $ | 13.92 | | |
Total Return(4) | | | (12.03 | )% | | | 53.41 | % | | | (0.64 | )% | | | 11.40 | % | | | 3.22 | % | |
Ratios and Supplemental Data: | |
Net Assets, End of Period (Thousands) | | $ | 14,016 | | | $ | 57,629 | | | $ | 1,030 | | | $ | 12 | | | $ | 11 | | |
Ratio of Expenses to Average Net Assets(8) | | | 0.92 | %(5) | | | 0.92 | %(5) | | | 0.93 | %(5) | | | 1.01 | %(5)(6) | | | 1.08 | %(5) | |
Ratio of Net Investment Income (Loss) to Average Net Assets(8) | | | 0.09 | %(5) | | | (0.56 | )%(5) | | | (0.20 | )%(5) | | | 0.12 | %(5) | | | 0.51 | %(5) | |
Ratio of Rebate from Morgan Stanley Affiliates to Average Net Assets | | | 0.02 | % | | | 0.02 | % | | | 0.01 | % | | | 0.00 | %(7) | | | 0.01 | % | |
Portfolio Turnover Rate | | | 36 | % | | | 30 | % | | | 42 | % | | | 51 | % | | | 33 | % | |
(8) Supplemental Information on the Ratios to Average Net Assets: | |
Ratios Before Expense Limitation: | |
Expenses to Average Net Assets | | | 0.95 | % | | | 1.03 | % | | | 5.64 | % | | | 15.79 | % | | | 20.64 | % | |
Net Investment Income (Loss) to Average Net Assets | | | 0.06 | % | | | (0.67 | )% | | | (4.91 | )% | | | (14.66 | )% | | | (19.05 | )% | |
(1) Reflects prior period Custodian out-of-pocket expenses that were reimbursed in September 2016. The amount of the reimbursement was immaterial on a per share basis and did not impact the total return of Class IS shares. The Ratio of Expenses to Average Net Assets and the Ratio of Net Investment Loss to Average Net Assets would be unchanged as the reimbursement of Custodian fees was offset against expense waivers/reimbursements with no impact to net expenses or net investment loss.
(2) Per share amount is based on average shares outstanding.
(3) Amount is less than $0.005 per share.
(4) Calculated based on the net asset value as of the last business day of the period.
(5) The Ratios of Expenses and Net Investment Income (Loss) reflect the rebate of certain Fund expenses in connection with the investments in Morgan Stanley affiliates during the period. The effect of the rebate on the ratios is disclosed in the above table as "Ratio of Rebate from Morgan Stanley Affiliates to Average Net Assets."
(6) Effective July 1, 2015, the Adviser has agreed to limit the ratio of expenses to average net assets to the maximum ratio of 0.94% for Class IS shares. Prior to July 1, 2015, the maximum ratio was 1.09% for Class IS shares.
(7) Amount is less than 0.005%.
The accompanying notes are an integral part of the financial statements.
17
Morgan Stanley Institutional Fund, Inc.
Annual Report — December 31, 2018
Financial Highlights
International Opportunity Portfolio
| | | Class IR | |
Selected Per Share Data and Ratios | | Period from
June 15, 2018(1) to
December 31, 2018 | |
Net Asset Value, Beginning of Period | | $ | 25.37 | | |
Loss from Investment Operations: | |
Net Investment Loss(2) | | | (0.06 | ) | |
Net Realized and Unrealized Loss | | | (5.47 | ) | |
Total from Investment Operations | | | (5.53 | ) | |
Distributions from and/or in Excess of: | |
Net Realized Gain | | | (0.05 | ) | |
Redemption Fees | | | 0.00 | (3) | |
Net Asset Value, End of Period | | $ | 19.79 | | |
Total Return(4) | | | (21.84 | )%(6) | |
Ratios and Supplemental Data: | |
Net Assets, End of Period (Thousands) | | $ | 81,592 | | |
Ratios of Expenses to Average Net Assets(8) | | | 0.93 | %(5)(7) | |
Ratio of Net Investment Loss to Average Net Assets(8) | | | (0.46 | )%(5)(7) | |
Ratio of Rebate from Morgan Stanley Affiliates to Average Net Assets | | | 0.01 | %(7) | |
Portfolio Turnover Rate | | | 36 | % | |
(8) Supplemental Information on the Ratios to Average Net Assets: | |
Ratios Before Expense Limitation: | |
Expenses to Average Net Assets | | | 0.95 | %(7) | |
Net Investment Loss to Average Net Assets | | | (0.48 | )%(7) | |
(1) Commencement of Offering.
(2) Per share amount is based on average shares outstanding.
(3) Amount is less than $0,005 per share.
(4) Calculated based on the net asset value as of the last business day of the period.
(5) The Ratios of Expenses and Net Investment Loss reflect the rebate of certain Fund expenses in connection with the investments in Morgan Stanley affiliates during the period. The effect of the rebate on the ratios is disclosed in the above table as "Ratio of Rebate from Morgan Stanley Affiliates to Average Net Assets."
(6) Not annualized.
(7) Annualized.
The accompanying notes are an integral part of the financial statements.
18
Morgan Stanley Institutional Fund, Inc.
Annual Report — December 31, 2018
Notes to Financial Statements
Morgan Stanley Institutional Fund, Inc. (the "Company") is registered under the Investment Company Act of 1940, as amended (the "Act"), as an open-end management investment company. The Company is comprised of thirty separate, active, diversified and non-diversified funds (individually referred to as a "Fund", collectively as the "Funds"). The Company applies investment company accounting and reporting guidance.
The accompanying financial statements relate to the International Opportunity Portfolio. The Fund seeks long-term capital appreciation.
The Fund offers six classes of shares — Class I, Class A, Class L, Class C, Class IS and Class IR. On April, 30, 2015 the Fund suspended offering of Class L shares. Existing Class L shareholders may invest through reinvestment of dividends and distributions. On June 15, 2018, the Fund commenced offering Class IR shares.
A. Significant Accounting Policies: The following significant accounting policies are in conformity with U.S. generally accepted accounting principles ("GAAP"). Such policies are consistently followed by the Company in the preparation of its financial statements. GAAP may require management to make estimates and assumptions that affect the reported amounts and disclosures in the financial statements. Actual results may differ from those estimates.
In August 2018, the Financial Accounting Standards Board ("FASB") issued Accounting Standards Update ("ASU") 2018-13, Fair Value Measurement (Topic 820) — Disclosures Framework — Changes to Disclosure Requirements of Fair Value Measurement ("ASU 2018-13") which introduces new fair value disclosure requirements as well as eliminates and modifies certain existing fair value disclosure requirements. ASU 2018-13 would be effective for fiscal years beginning after December 15, 2019 and for interim periods within those fiscal years; however, management has elected to early adopt ASU 2018-13 effective with the current reporting period as permitted by the standard. The impact of the Fund's adoption was limited to changes in the Fund's financial statement disclosures regarding fair value, primarily those disclosures related to transfers between levels of the fair value hierarchy and disclosure of the range and weighted average used to develop significant unobservable inputs for Level 3 fair value measurements, when applicable.
1. Security Valuation: (1) An equity portfolio security listed or traded on an exchange is valued at its latest reported sales price (or at the exchange official closing
price if such exchange reports an official closing price), and if there were no sales on a given day and if there is no official exchange closing price for that day, the security is valued at the mean between the last reported bid and asked prices if such bid and asked prices are available on the relevant exchanges. Listed equity securities not traded on the valuation date with no reported bid and asked prices available on the exchange are valued at the mean between the current bid and asked prices obtained from one or more reputable brokers or dealers. In cases where a security is traded on more than one exchange, the security is valued on the exchange designated as the primary market; (2) all other equity portfolio securities for which over-the-counter ("OTC") market quotations are readily available are valued at the latest reported sales price (or at the market official closing price if such market reports an official closing price), and if there was no trading in the security on a given day and if there is no official closing price from relevant markets for that day, the security is valued at the mean between the last reported bid and asked prices if such bid and asked prices are available on the relevant markets. An unlisted equity security that does not trade on the valuation date and for which bid and asked prices from the relevant markets are unavailable is valued at the mean between the current bid and asked prices obtained from one or more reputable brokers or dealers; (3) certain portfolio securities may be valued by an outside pricing service/vendor approved by the Company's Board of Directors (the "Directors"). The pricing service/vendor may employ a pricing model that takes into account, among other things, bids, yield spreads and/or other market data and specific security characteristics. Alternatively, if a valuation is not available from an outside pricing service/vendor, and the security trades on an exchange, the security may be valued at its latest reported sale price (or at the exchange official closing price if such exchange reports an official closing price), prior to the time when assets are valued. If there are no sales on a given day and if there is no official exchange closing price for that day, the security is valued at the mean between the last reported bid and asked prices if such bid and asked prices are available in the relevant exchanges; (4) listed options are valued at the last reported sales price on the exchange on which they are listed (or at the exchange official closing price if such exchange reports an official closing price). If an official closing price or last reported sales price is unavailable, the listed option should be fair valued at the mean between its latest bid and ask
19
Morgan Stanley Institutional Fund, Inc.
Annual Report — December 31, 2018
Notes to Financial Statements (cont'd)
prices. Unlisted options are valued at the mean between their latest bid and ask prices from a broker/dealer or valued by a pricing service/vendor; (5) when market quotations are not readily available, including circumstances under which Morgan Stanley Investment Management Inc. (the "Adviser") determines that the closing price, last sale price or the mean between the last reported bid and asked prices are not reflective of a security's market value, portfolio securities are valued at their fair value as determined in good faith under procedures established by and under the general supervision of the Directors. Occasionally, developments affecting the closing prices of securities and other assets may occur between the times at which valuations of such securities are determined (that is, close of the foreign market on which the securities trade) and the close of business of the New York Stock Exchange ("NYSE"). If developments occur during such periods that are expected to materially affect the value of such securities, such valuations may be adjusted to reflect the estimated fair value of such securities as of the close of the NYSE, as determined in good faith by the Directors or by the Adviser using a pricing service and/or procedures approved by the Directors; (6) quotations of foreign portfolio securities, other assets and liabilities and forward contracts stated in foreign currency are translated into U.S. dollar equivalents at the prevailing market rates prior to the close of the NYSE; and (7) investments in mutual funds, including the Morgan Stanley Institutional Liquidity Funds, are valued at the net asset value ("NAV") as of the close of each business day.
The Directors have responsibility for determining in good faith the fair value of the investments, and the Directors may appoint others, such as the Company's Adviser or a valuation committee, to assist the Directors in determining fair value and to make the actual calculations pursuant to the fair valuation methodologies previously approved by the Directors. Under procedures approved by the Directors, the Company's Adviser has formed a Valuation Committee whose members are approved by the Directors. The Valuation Committee provides administration and oversight of the Company's valuation policies and procedures, which are reviewed at least annually by the Directors. These procedures allow the Company to utilize independent pricing services, quotations from securities and financial instrument dealers and other market sources to determine fair value.
2. Fair Value Measurement: FASB Accounting Standards CodificationTM ("ASC") 820, "Fair Value Measurement" ("ASC 820"), defines fair value as the value that the Fund would receive to sell an investment or pay to transfer a liability in a timely transaction with an independent buyer in the principal market, or in the absence of a principal market, the most advantageous market for the investment or liability. ASC 820 establishes a three-tier hierarchy to distinguish between (1) inputs that reflect the assumptions market participants would use in valuing an asset or liability developed based on market data obtained from sources independent of the reporting entity (observable inputs) and (2) inputs that reflect the reporting entity's own assumptions about the assumptions market participants would use in valuing an asset or liability developed based on the best information available in the circumstances (unobservable inputs) and to establish classification of fair value measurements for disclosure purposes. Various inputs are used in determining the value of the Fund's investments. The inputs are summarized in the three broad levels listed below:
• Level 1 – unadjusted quoted prices in active markets for identical investments
• Level 2 – other significant observable inputs (including quoted prices for similar investments, interest rates, prepayment speeds, credit risk, etc.)
• Level 3 – significant unobservable inputs including the Fund's own assumptions in determining the fair value of investments. Factors considered in making this determination may include, but are not limited to, information obtained by contacting the issuer, analysts, or the appropriate stock exchange (for exchange-traded securities), analysis of the issuer's financial statements or other available documents and, if necessary, available information concerning other securities in similar circumstances
The inputs or methodology used for valuing securities are not necessarily an indication of the risk associated with investing in those securities and the determination of the significance of a particular input to the fair value measurement in its entirety requires judgment and considers factors specific to each security.
20
Morgan Stanley Institutional Fund, Inc.
Annual Report — December 31, 2018
Notes to Financial Statements (cont'd)
The following is a summary of the inputs used to value the Fund's investments as of December 31, 2018:
Investment Type | | Level 1
Unadjusted
quoted
prices
(000) | | Level 2
Other
significant
observable
inputs
(000) | | Level 3
Significant
unobservable
inputs
(000) | | Total
(000) | |
Assets: | |
Common Stocks | |
Banks | | $ | — | | | $ | 78,898 | | | $ | — | | | $ | 78,898 | | |
Beverages | | | — | | | | 104,926 | | | | — | | | | 104,926 | | |
Biotechnology | | | — | | | | 30,254 | | | | — | | | | 30,254 | | |
Diversified Consumer
Services | | | 65,579 | | | | — | | | | — | | | | 65,579 | | |
Electronic Equipment,
Instruments &
Components | | | — | | | | 31,096 | | | | — | | | | 31,096 | | |
Food Products | | | — | | | | 100,486 | | | | — | | | | 100,486 | | |
Hotels, Restaurants &
Leisure | | | 25,644 | | | | 13,756 | | | | — | | | | 39,400 | | |
Household Products | | | — | | | | 47,478 | | | | — | | | | 47,478 | | |
Information Technology
Services | | | 48,362 | | | | — | | | | — | | | | 48,362 | | |
Interactive Media &
Services | | | — | | | | 86,195 | | | | — | | | | 86,195 | | |
Internet & Direct
Marketing Retail | | | 79,261 | | | | 16,080 | | | | — | | | | 95,341 | | |
Professional Services | | | — | | | | 13,842 | | | | — | | | | 13,842 | | |
Road & Rail | | | — | | | | 49,987 | | | | — | | | | 49,987 | | |
Semiconductors &
Semiconductor
Equipment | | | 5,866 | | | | 21,546 | | | | — | | | | 27,412 | | |
Software | | | 15,917 | | | | — | | | | — | | | | 15,917 | | |
Textiles, Apparel &
Luxury Goods | | | — | | | | 144,003 | | | | — | | | | 144,003 | | |
Total Common Stocks | | | 240,629 | | | | 738,547 | | | | — | | | | 979,176 | | |
Call Options Purchased | | | | | 669 | | | | | | 669 | | |
Short-Term Investments | |
Investment Company | | | 25,200 | | | | — | | | | — | | | | 25,200 | | |
Repurchase Agreements | | | — | | | | 15 | | | | — | | | | 15 | | |
Total Assets | | $ | 265,829 | | | $ | 739,231 | | | $ | — | | | $ | 1,005,060 | | |
Transfers between investment levels may occur as the markets fluctuate and/or the availability of data used in an investment's valuation changes.
3. Repurchase Agreements: The Fund may enter into repurchase agreements under which the Fund lends cash and takes possession of securities with an agreement that the counterparty will repurchase such securities. In connection with transactions in repurchase agreements, a bank as custodian for the Fund takes possession of the underlying securities which are held as collateral, with a market value at least equal to the amount of the repurchase transaction, including principal and accrued interest. To the extent that any repurchase transaction exceeds one business day, the value of the collateral is marked-to-market on a daily basis to determine that the value of the collateral does not
decrease below the repurchase price plus accrued interest as earned. If such a decrease occurs, additional collateral will be requested and, when received, will be added to the account to maintain full collateralization. In the event of default on the obligation to repurchase, the Fund has the right to liquidate the collateral and apply the proceeds in satisfaction of the obligation. In the event of default or bankruptcy by the counterparty to the agreement, realization of the collateral proceeds may be subject to cost and delays. The Fund, along with other affiliated investment companies, may utilize a joint trading account for the purpose of entering into repurchase agreements.
4. Foreign Currency Translation and Foreign Investments: The books and records of the Fund are maintained in U.S. dollars. Foreign currency amounts are translated into U.S. dollars as follows:
– investments, other assets and liabilities at the prevailing rate of exchange on the valuation date;
– investment transactions and investment income at the prevailing rates of exchange on the dates of such transactions.
Although the net assets of the Fund are presented at the foreign exchange rates and market values at the close of the period, the Fund does not isolate that portion of the results of operations arising as a result of changes in the foreign exchange rates from the fluctuations arising from changes in the market prices of securities held at period end. Similarly, the Fund does not isolate the effect of changes in foreign exchange rates from the fluctuations arising from changes in the market prices of securities sold during the period. Accordingly, realized and unrealized foreign currency gains (losses) on investments in securities are included in the reported net realized and unrealized gains (losses) on investment transactions and balances. However, pursuant to U.S. federal income tax regulations, gains and losses from certain foreign currency transactions and the foreign currency portion of gains and losses realized on sales and maturities of foreign denominated debt securities are treated as ordinary income for U.S. federal income tax purposes.
Net realized gains (losses) on foreign currency transactions represent net foreign exchange gains (losses) from foreign currency forward exchange contracts, disposition of foreign currencies, currency gains (losses) realized between the trade and settlement dates on securities transactions, and
21
Morgan Stanley Institutional Fund, Inc.
Annual Report — December 31, 2018
Notes to Financial Statements (cont'd)
the difference between the amount of investment income and foreign withholding taxes recorded on the Fund's books and the U.S. dollar equivalent amounts actually received or paid. Net unrealized currency gains (losses) from valuing foreign currency denominated assets and liabilities at period end exchange rates are reflected as a component of unrealized appreciation (depreciation) in the Statement of Assets and Liabilities. The change in unrealized currency gains (losses) on foreign currency translations for the period is reflected in the Statement of Operations.
Foreign security and currency transactions may involve certain considerations and risks not typically associated with those of U.S. dollar denominated transactions as a result of, among other factors, fluctuations of exchange rates in relation to the U.S. dollar, the possibility of lower levels of governmental supervision and regulation of foreign securities markets and the possibility of political or economic instability.
Governmental approval for foreign investments may be required in advance of making an investment under certain circumstances in some countries, and the extent of foreign investments in domestic companies may be subject to limitation in other countries. Foreign ownership limitations also may be imposed by the charters of individual companies to prevent, among other concerns, violations of foreign investment limitations. As a result, an additional class of shares (identified as "Foreign" in the Portfolio of Investments) may be created and offered for investment. The "local" and "foreign shares" market values may differ. In the absence of trading of the foreign shares in such markets, the Fund values the foreign shares at the closing exchange price of the local shares.
5. Derivatives: The Fund may, but is not required to, use derivative instruments for a variety of purposes, including hedging, risk management, portfolio management or to earn income. Derivatives are financial instruments whose value is based, in part, on the value of an underlying asset, interest rate, index or financial instrument. Prevailing interest rates and volatility levels, among other things, also affect the value of derivative instruments. A derivative instrument often has risks similar to its underlying asset and may have additional risks, including imperfect correlation between the value of the derivative and the underlying asset, risks of default by the counterparty to certain transactions, magnification of losses incurred due to changes in the market value of the securities, instruments, indices or
interest rates to which the derivative instrument relates, risks that the transactions may not be liquid and risks arising from margin requirements. The use of derivatives involves risks that are different from, and possibly greater than, the risks associated with other portfolio investments. Derivatives may involve the use of highly specialized instruments that require investment techniques and risk analyses different from those associated with other portfolio investments. All of the Fund's holdings, including derivative instruments, are marked-to-market each day with the change in value reflected in unrealized appreciation (depreciation). Upon disposition, a realized gain or loss is recognized.
Certain derivative transactions may give rise to a form of leverage. Leverage magnifies the potential for gain and the risk of loss. Leverage associated with derivative transactions may cause the Fund to liquidate portfolio positions when it may not be advantageous to do so to satisfy its obligations or to meet earmarking or segregation requirements, pursuant to applicable Securities and Exchange Commission ("SEC") rules and regulations, or may cause the Fund to be more volatile than if the Fund had not been leveraged. Although the Adviser seeks to use derivatives to further the Fund's investment objectives, there is no assurance that the use of derivatives will achieve this result.
Following is a description of the derivative instruments and techniques that the Fund used during the period and their associated risks:
Options: With respect to options, the Fund is subject to equity risk, interest rate risk and foreign currency exchange risk in the normal course of pursuing its investment objectives. If the Fund buys an option, it buys a legal contract giving it the right to buy or sell a specific amount of the underlying instrument or foreign currency, or futures contract on the underlying instrument or foreign currency, at an agreed-upon price typically in exchange for a premium paid by the Fund. The Fund may purchase and/or sell put and call options. Purchasing call options tends to increase the Fund's exposure to the underlying (or similar) instrument. Purchasing put options tends to decrease the Fund's exposure to the underlying (or similar) instrument. When entering into purchased option contracts, the Fund bears the risk of interest or exchange rates or securities prices moving unexpectedly, in which case, the Fund may not achieve the anticipated benefits of the purchased option contracts; however the risk of loss is limited to the premium paid. Purchased options are reported
22
Morgan Stanley Institutional Fund, Inc.
Annual Report — December 31, 2018
Notes to Financial Statements (cont'd)
as part of "Total Investments in Securities" in the Statement of Assets and Liabilities. Premiums paid for purchasing options which expired are treated as realized losses. If the Fund sells an option, it sells to another party the right to buy from or sell to the Fund a specific amount of the underlying instrument or foreign currency, or futures contract on the underlying instrument or foreign currency, at an agreed-upon price during a period of time or on a specified date typically in exchange for a premium received by the Fund. When options are purchased OTC, the Fund bears the risk that the counterparty that wrote the option will be unable or unwilling to perform its obligations under the option contract. Options may also be illiquid and the Fund may have difficulty closing out its position. A decision as to whether, when and how to use options involves the exercise of skill and judgment and even a well-conceived option transaction may be unsuccessful because of market behavior or unexpected events. The prices of options can be highly volatile and the use of options can lower total returns.
FASB ASC 815, "Derivatives and Hedging" ("ASC 815"), is intended to improve financial reporting about derivative instruments by requiring enhanced disclosures to enable investors to better understand how and why the Fund uses derivative instruments, how these derivative instruments are accounted for and their effects on the Fund's financial position and results of operations.
The following table sets forth the fair value of the Fund's derivative contracts by primary risk exposure as of December 31, 2018:
| | | Asset Derivatives
Statement of Assets and
Liabilities Location | | Primary Risk
Exposure | | Value
(000) | |
Purchased Options
| | Investments, at Value
(Purchased Options) | | Currency Risk | | $ | 669 | (a) | |
(a) Amounts are included in Investments in Securities in the Statement of Assets and Liabilities.
The following tables set forth by primary risk exposure the Fund's realized gains (losses) and change in unrealized appreciation (depreciation) by type of derivative contract for the year ended December 31, 2018 in accordance with ASC 815:
Realized Gain (Loss) | |
Primary Risk Exposure | | Derivative Type | | Value
(000) | |
Currency Risk
| | Investments
(Purchased Options) | | $ | (778 | )(b) | |
(b) Amounts are included in Investments Sold in the Statement of Operations.
Change in Unrealized Appreciation (Depreciation) | |
Primary Risk Exposure | | Derivative Type | | Value
(000) | |
Currency Risk
| | Investments
(Purchased Options) | | $ | (1,821 | )(c) | |
(c) Amounts are included in Investments in the Statement of Operations.
At December 31, 2018, the Fund's derivative assets and liabilities are as follows:
Gross Amounts of Assets and Liabilities
Presented in the Statement of Assets and Liabilities | |
Derivatives | | Assets(d)
(000) | | Liabilities(d)
(000) | |
Purchased Options | | $ | 669 | (a) | | $ | — | | |
(a) Amounts are included in Investments in Securities in the Statement of Assets and Liabilities.
(d) Absent an event of default or early termination, OTC derivative assets and liabilities are presented gross and not offset in the Statement of Assets and Liabilities.
The Fund typically enters into International Swaps and Derivatives Association, Inc. Master Agreements ("ISDA Master Agreements") or similar master agreements (collectively, "Master Agreements") with its contract counterparties for certain OTC derivatives in order to, among other things, reduce its credit risk to counterparties. ISDA Master Agreements include provisions for general obligations, representations, collateral and events of default or termination. Under an ISDA Master Agreement, the Fund typically may offset with the counterparty certain OTC derivative financial instruments' payables and/or receivables with collateral held and/or posted and create one single net payment (close-out netting) in the event of default, termination and/or potential deterioration in the credit quality of the counterparty. Various Master Agreements govern the terms of certain transactions with counterparties, including transactions such as swap, forward, repurchase and reverse repurchase agreements. These Master Agreements typically attempt to reduce the counterparty risk associated with such transactions by specifying credit protection mechanisms and providing standardization that improves legal certainty. Cross-termination provisions under Master Agreements typically provide that a default in connection with one transaction between the Fund and a counterparty gives the non-defaulting party the right to terminate any other transactions in place with the defaulting party to create one single net payment due to/due from the defaulting party and may be a feature in certain Master Agreements. In the event the Fund exercises its right to terminate a Master Agreement
23
Morgan Stanley Institutional Fund, Inc.
Annual Report — December 31, 2018
Notes to Financial Statements (cont'd)
after a counterparty experiences a termination event as defined in the Master Agreement, the return of collateral with market value in excess of the Fund's net liability may be delayed or denied.
The following table presents derivative financial instruments that are subject to enforceable netting arrangements as of December 31, 2018:
Gross Amounts Not Offset in the Statement of Assets and Liabilities | |
Counterparty | | Gross Asset
Derivatives
Presented in the
Statement of
Assets and
Liabilities
(000) | | Financial
Instrument
(000) | | Collateral
Received(e)
(000) | | Net Amount
(not less
than $0)
(000) | |
Royal Bank of Scotland | | $ | 669 | (a) | | $ | — | | | $ | (669 | ) | | $ | 0 | | |
(a) Amounts are included in Investments in Securities in the Statement of Assets and Liabilities.
(e) In some instances, the actual collateral received may be more than the amount shown here due to overcollateralization.
For the year ended December 31, 2018, the approximate average monthly amount outstanding for each derivative type is as follows:
Options Purchased: | |
Average monthly notional amount | | | 466,955,000 | | |
6. Securities Lending: The Fund lends securities to qualified financial institutions, such as broker-dealers, to earn additional income. Any increase or decrease in the fair value of the securities loaned that might occur and any interest earned or dividends declared on those securities during the term of the loan would remain in the Fund. The Fund would receive cash or securities as collateral in an amount equal to or exceeding 100% of the current fair value of the loaned securities. The collateral is marked-to-market daily by State Street Bank and Trust Company ("State Street"), the securities lending agent, to ensure that a minimum of 100% collateral coverage is maintained.
Based on pre-established guidelines, the securities lending agent invests any cash collateral that is received in an affiliated money market portfolio and repurchase agreements. Securities lending income is generated from the earnings on the invested collateral and borrowing fees, less any rebates owed to the borrowers and compensation to the lending agent, and is recorded as "Income from Securities Loaned — Net" in the Fund's Statement of Operations. Risks in securities lending transactions are that a borrower may not provide additional collateral
when required or return the securities when due, and that the value of the short-term investments will be less than the amount of cash collateral plus any rebate that is required to be returned to the borrower.
The Fund has the right under the securities lending agreement to recover the securities from the borrower on demand.
The following table presents financial instruments that are subject to enforceable netting arrangements as of
December 31, 2018:
Gross Amounts Not Offset in the Statement of Assets and Liabilities | |
Gross Asset
Amounts
Presented in the
Statement of
Assets and
Liabilities
(000) | | Financial
Instrument
(000) | | Collateral
Received
(000) | | Net Amount
(not less
than $0)
(000) | |
| $ | 7,272 | (e) | | $ | — | | | $ | 7,272 | (f)(g) | | $ | 0 | | |
(e) Represents market value of loaned securities at period end.
(f) The Fund received cash collateral of approximately $84,000, of which approximately $83,000 was subsequently invested in Repurchase Agreements and Morgan Stanley Institutional Liquidity Funds as reported in the Portfolio of Investments. As of
December 31, 2018, there was uninvested cash of approximately $1,000, which is not reflected in the Portfolio of Investments. In addition, the Fund received non-cash collateral of approximately $7,634,000 in the form of U.S. Government obligations, which the Fund cannot sell or repledge, and accordingly are not reflected in the Portfolio of Investments.
(g) The actual collateral received is greater than the amount shown here due to overcollateralization.
7. Structured Investments: The Fund invested a portion of its assets in structured investments. A structured investment is a derivative security designed to offer a return linked to a particular underlying security, currency, commodity or market. Structured investments may come in various forms including notes (such as exchange-traded notes), warrants and options to purchase securities. The Fund will typically use structured investments to gain exposure to a permitted underlying security, currency, commodity or market when direct access to a market is limited or inefficient from a tax or cost standpoint. There can be no assurance that structured investments will trade at the same price or have the same value as the underlying security, currency, commodity or market. Investments in structured investments involve risks including issuer risk, counterparty risk and market risk. Holders of structured investments bear risks of the underlying investment and are subject to issuer or counterparty risk because the Fund is relying on the creditworthiness of such issuer or
24
Morgan Stanley Institutional Fund, Inc.
Annual Report — December 31, 2018
Notes to Financial Statements (cont'd)
counterparty and has no rights with respect to the underlying investment. Certain structured investments may be thinly traded or have a limited trading market and may have the effect of increasing the Fund's illiquidity to the extent that the Fund, at a particular time, may be unable to find qualified buyers for these securities.
8. Redemption Fees: The Fund will assess a 2% redemption fee on Class I shares, Class A shares, Class L shares, Class C shares, Class IS shares and Class IR shares, which is paid directly to the Fund, for shares redeemed or exchanged within thirty days of purchase, subject to certain exceptions. The redemption fee is designed to protect the Fund and its remaining shareholders from the effects of short-term trading. These fees, if any, are included in the Statements of Changes in Net Assets.
9. Indemnifications: The Company enters into contracts that contain a variety of indemnifications. The Company's maximum exposure under these arrangements is unknown. However, the Company has not had prior claims or losses pursuant to these contracts and expects the risk of loss to be remote.
10. Dividends and Distributions to Shareholders: Dividends and distributions to shareholders are recorded on the ex-dividend date. Dividends from net investment income, if any, are declared and paid annually. Net realized capital gains, if any, are distributed at least annually.
11. Security Transactions, Income and Expenses: Security transactions are accounted for on the trade date (date the order to buy or sell is executed). Realized gains and losses on the sale of investment securities are determined on the specific identified cost method. Dividend income and other distributions are recorded on the ex-dividend date (except for certain foreign dividends which may be recorded as soon as the Fund is informed of such dividends) net of applicable withholding taxes. Non-cash dividends received in the form of stock, if any, are recognized on the ex-dividend date and recorded as non-cash dividend income at fair value. Interest income is recognized on the accrual basis except where collection is in doubt. Discounts are accreted and premiums are amortized over the life of the respective securities. Most expenses of the Company can be directly attributed to a particular Fund. Expenses which cannot be directly attributed are apportioned among the Funds based upon relative net assets or other appropriate methods. Income, expenses (other than class specific expenses — distribution and shareholder services, transfer agency and sub transfer agency
fees) and realized and unrealized gains or losses are allocated to each class of shares based upon their relative net assets.
B. Advisory Fees: The Adviser, a wholly-owned subsidiary of Morgan Stanley, provides the Fund with advisory services under the terms of an Investment Advisory Agreement, paid quarterly, at the annual rate based on the daily net assets as follows:
First $1
billion | | Over $1
billion | |
| | 0.80 | % | | | 0.75 | % | |
For the year ended December 31, 2018, the advisory fee rate (net of waiver/rebate) was equivalent to an annual effective rate of 0.77% of the Fund's average daily net assets.
The Adviser has agreed to reduce its advisory fee and/or reimburse the Fund so that total annual portfolio operating expenses, excluding certain investment related expenses, taxes, interest and other extraordinary expenses (including litigation), will not exceed 1.00% for Class I shares, 1.35% for Class A shares, 1.85% for Class L shares, 2.10% for Class C shares, 0.94% for Class IS shares and 0.94% for Class IR shares. The fee waivers and/or expense reimbursements will continue for at least one year from the date of the Fund's prospectus or until such time as the Directors act to discontinue all or a portion of such waivers and/or reimbursements when they deem such action is appropriate. For the year ended December 31, 2018, approximately $76,000 of advisory fees were waived and approximately $245,000 of other expenses were reimbursed by the Adviser pursuant to this arrangement.
C. Administration Fees: The Adviser also serves as Administrator to the Company and provides administrative services pursuant to an Administration Agreement for an annual fee, accrued daily and paid monthly, of 0.08% of the Fund's average daily net assets.
Under a Sub-Administration Agreement between the Administrator and State Street, State Street provides certain administrative services to the Company. For such services, the Administrator pays State Street a portion of the fee the Administrator receives from the Fund.
D. Distribution and Shareholder Services Fees: Morgan Stanley Distribution, Inc. ("MSDI" or the "Distributor"), a wholly-owned subsidiary of the Adviser and an indirect subsidiary of Morgan Stanley, serves as the Company's Distributor of Fund shares pursuant to a Distribution Agreement. The Company has adopted a Shareholder Services Plan with respect to Class A shares pursuant to Rule 12b-1 under the Act. Under
25
Morgan Stanley Institutional Fund, Inc.
Annual Report — December 31, 2018
Notes to Financial Statements (cont'd)
the Shareholder Services Plan, the Fund pays the Distributor a shareholder services fee, accrued daily and paid monthly, at an annual rate of 0.25% of the Fund's average daily net assets attributable to Class A shares.
The Company has adopted a Distribution and Shareholder Services Plan with respect to Class L shares pursuant to Rule 12b-1 under the Act. Under the Distribution and Shareholder Services Plan, the Fund pays the Distributor a distribution fee, accrued daily and paid monthly, at an annual rate of 0.50% and a shareholder services fee, accrued daily and paid monthly, at an annual rate of 0.25% of the Fund's average daily net assets attributable to Class L shares.
The Company has adopted a Distribution and Shareholder Services Plan with respect to Class C shares pursuant to Rule 12b-1 under the Act. Under the Distribution and Shareholder Services Plan, the Fund pays the Distributor a distribution fee, accrued daily and paid monthly, at an annual rate of 0.75% and a shareholder services fee, accrued daily and paid monthly, at an annual rate of 0.25% of the Fund's average daily net assets attributable to Class C shares.
The distribution and shareholder services fees are used to support the expenses associated with servicing and maintaining accounts. The Distributor may compensate other parties for providing shareholder support services to investors who purchase Class A, Class L and Class C shares.
E. Dividend Disbursing and Transfer Agent: The Company's dividend disbursing and transfer agent is DST Asset Manager Solutions, Inc. ("DST"). Pursuant to a Transfer Agency Agreement, the Company pays DST a fee based on the number of classes, accounts and transactions relating to the Funds of the Company.
F. Custodian Fees: State Street (the "Custodian") also serves as Custodian for the Company in accordance with a Custodian Agreement. The Custodian holds cash, securities and other assets of the Company as required by the Act. Custody fees are payable monthly based on assets held in custody, investment purchases and sales activity and account maintenance fees, plus reimbursement for certain out-of-pocket expenses.
G. Security Transactions and Transactions with Affiliates: For the year ended December 31, 2018, purchases and sales of investment securities for the Fund, other than long-term U.S. Government securities and short-term investments were approximately $960,508,000 and $352,946,000, respectively. There were no purchases and
sales of long-term U.S. Government securities for the year ended December 31, 2018.
The Fund invests in the Institutional Class of the Morgan Stanley Institutional Liquidity Funds (the "Liquidity Funds"), an open-end management investment company managed by the Adviser, both directly and as a portion of the securities held as collateral on loaned securities. Advisory fees paid by the Fund are reduced by an amount equal to its pro-rata share of the advisory and administration fees paid by the Fund due to its investment in the Liquidity Funds. For the year ended December 31, 2018, advisory fees paid were reduced by approximately $145,000 relating to the Fund's investment in the Liquidity Funds.
A summary of the Fund's transactions in shares of affiliated investments during the year ended December 31, 2018 is as follows:
Affiliated
Investment
Company | | Value
December 31,
2017
(000) | | Purchases
at Cost
(000) | | Proceeds
from Sales
(000) | | Dividend
Income
(000) | |
Liquidity Funds | | $ | 61,592 | | | $ | 517,394 | | | $ | 553,786 | | | $ | 1,253 | | |
Affiliated
Investment
Company (cont'd) | | Realized
Gain (Loss)
(000) | | Change in
Unrealized
Appreciation
(Depreciation)
(000) | | Value
December 31,
2018
(000) | |
Liquidity Funds | | $ | — | | | $ | — | | | $ | 25,200 | | |
During the year ended December 31, 2018, the Fund incurred approximately $1,000 in brokerage commissions with Morgan Stanley & Co. LLC, an affiliate of the Adviser/Administrator and Distributor, for portfolio transactions executed on behalf of the Fund.
The Fund is permitted to purchase and sell securities ("cross-trade") from and to other Morgan Stanley funds as well as other funds and client accounts for which the Adviser or an affiliate of the Adviser serves as investment adviser, pursuant to procedures approved by the Directors in compliance with Rule 17a-7 under the Act (the "Rule"). Each cross-trade is executed at the current market price in compliance with provisions of the Rule. For the year ended December 31, 2018, the Fund did not engage in any cross-trade transactions.
The Fund has an unfunded Deferred Compensation Plan (the "Compensation Plan"), which allows each independent Director to defer payment of all, or a portion, of the fees he or she receives for serving on the Board of Directors. Each eligible Director generally may elect to have the deferred amounts credited with a return equal to the total return on one or more of the Morgan
26
Morgan Stanley Institutional Fund, Inc.
Annual Report — December 31, 2018
Notes to Financial Statements (cont'd)
Stanley funds that are offered as investment options under the Compensation Plan. Appreciation/depreciation and distributions received from these investments are recorded with an offsetting increase/decrease in the deferred compensation obligation and do not affect the NAV of the Fund.
H. Federal Income Taxes: It is the Fund's intention to continue to qualify as a regulated investment company and distribute all of its taxable and tax-exempt income. Accordingly, no provision for Federal income taxes is required in the financial statements.
The Fund may be subject to taxes imposed by countries in which it invests. Such taxes are generally based on income and/or capital gains earned or repatriated. Taxes are accrued based on net investment income, net realized gains and net unrealized appreciation as such income and/or gains are earned. Taxes may also be based on transactions in foreign currency and are accrued based on the value of investments denominated in such currency.
FASB ASC 740-10, "Income Taxes — Overall", sets forth a minimum threshold for financial statement recognition of the benefit of a tax position taken or expected to be taken in a tax return. Management has concluded there are no significant uncertain tax positions that would require recognition in the financial statements. If applicable, the Fund recognizes interest accrued related to unrecognized tax benefits in "Interest Expense" and penalties in "Other Expenses" in the Statement of Operations. The Fund files tax returns with the U.S. Internal Revenue Service, New York and various states. Generally, each of the tax years in the four-year period ended December 31, 2018 remains subject to examination by taxing authorities.
The tax character of distributions paid may differ from the character of distributions for GAAP purposes due to short-term capital gains being treated as ordinary income for tax purposes. The tax character of distributions paid during fiscal years 2018 and 2017 was as follows:
2018
Distributions
Paid From: | | 2017
Distributions
Paid From: | |
Ordinary
Income
(000) | | Long-Term
Capital Gain
(000) | | Ordinary
Income
(000) | | Long-Term
Capital Gain
(000) | |
| $ | 608 | | | $ | 1,906 | | | $ | 385 | | | $ | 8,635 | | |
The amount and character of income and gains to be distributed are determined in accordance with income tax regulations
which may differ from GAAP. These book/tax differences are either considered temporary or permanent in nature.
Temporary differences are primarily due to differing book and tax treatments in the timing of the recognition of gains (losses) on certain investment transactions and the timing of the deductibility of certain expenses.
Permanent differences, primarily due to a net operating loss, resulted in the following reclassifications among the components of net assets at December 31, 2018:
Total
Accumulated
Loss
(000) | | Paid-in-
Capital
(000) | |
| $ | 2,152 | | | $ | (2,152 | ) | |
At December 31, 2018, the Fund had no distributable earnings on a tax basis.
Qualified late year losses are capital losses and specified ordinary losses, including currency losses, incurred after October 31 but within the taxable year that, if elected, are deemed to arise on the first day of the Fund's next taxable year. For the year ended December 31, 2018, the Fund intends to defer to January 1, 2019 for U.S. federal income tax purposes the following losses:
Qualified
Late Year
Ordinary
Losses
(000) | | Post-October
Capital
Losses
(000) | |
| $ | 484 | | | $ | 26,320 | | |
I. Credit Facility: The Company and other Morgan Stanley funds participated in a $150,000,000 committed, unsecured revolving line of credit facility (the "Facility") with State Street. This Facility is to be used for temporary emergency purposes or funding of shareholder redemption requests. The interest rate on borrowings is based on the federal funds rate or 1 month LIBOR rate plus a spread. The Facility also has a commitment fee of 0.25% per annum based on the unused portion of the Facility. During the year ended December 31, 2018, the Fund did not have any borrowings under the Facility.
J. Other: At December 31, 2018, the Fund had record owners of 10% or greater. Investment activities of these shareholders could have a material impact on the Fund. The aggregate percentage of such owners was 37.9%.
27
Morgan Stanley Institutional Fund, Inc.
Annual Report — December 31, 2018
Report of Independent Registered Public Accounting Firm
To the Shareholders and Board of Directors of
Morgan Stanley Institutional Fund, Inc. —
International Opportunity Portfolio
Opinion on the Financial Statements
We have audited the accompanying statement of assets and liabilities of International Opportunity Portfolio (the "Fund") (one of the funds constituting the Morgan Stanley Institutional Fund, Inc. (the "Company")), including the portfolio of investments, as of December 31, 2018, and the related statement of operations for the year then ended, the statements of changes in net assets for each of the two years in the period then ended, the financial highlights for each of the five years in the period then ended and the related notes (collectively referred to as the "financial statements"). In our opinion, the financial statements present fairly, in all material respects, the financial position of International Opportunity Portfolio (one of the funds constituting Morgan Stanley Institutional Fund, Inc.) at December 31, 2018, the results of its operations for the year then ended, the changes in its net assets for each of the two years in the period then ended and its financial highlights for each of the five years in the period then ended, in conformity with U.S. generally accepted accounting principles.
Basis for Opinion
These financial statements are the responsibility of the Company's management. Our responsibility is to express an opinion on the Fund's financial statements based on our audits. We are a public accounting firm registered with the Public Company Accounting Oversight Board (United States) ("PCAOB") and are required to be independent with respect to the Company in accordance with the U.S. federal securities law and the applicable rules and regulations of the Securities and Exchange Commission and the PCAOB.
We conducted our audits in accordance with the standards of the PCAOB. Those standards require that we plan and perform the audit to obtain reasonable assurance about whether the financial statements are free of material misstatement, whether due to error or fraud. The Company is not required to have, nor were we engaged to perform, an audit of the Company's internal control over financial reporting. As part of our audits, we are required to obtain an understanding of internal control over financial reporting, but not for the purpose of expressing an opinion on the effectiveness of the Company's internal control over financial reporting. Accordingly, we express no such opinion.
Our audits included performing procedures to assess the risks of material misstatement of the financial statements, whether due to error or fraud, and performing procedures that respond to those risks. Such procedures included examining, on a test basis, evidence regarding the amounts and disclosures in the financial statements. Our procedures included confirmation of securities owned as of December 31, 2018 by correspondence with the custodian and others or by other appropriate auditing procedures where replies from others were not received. Our audits also included evaluating the accounting principles used and significant estimates made by management, as well as evaluating the overall presentation of the financial statements. We believe that our audits provide a reasonable basis for our opinion.

We have served as the auditor of one or more Morgan Stanley investment companies since 2000.
Boston, Massachusetts
February 26, 2019
28
Morgan Stanley Institutional Fund, Inc.
Annual Report — December 31, 2018
Federal Tax Notice (unaudited)
For federal income tax purposes, the following information is furnished with respect to the distributions paid by the Fund during its taxable year ended December 31, 2018.
The Fund designated and paid approximately $1,906,000 as a long-term capital gain distribution.
For federal income tax purposes, the following information is furnished with respect to the Fund's earnings for its taxable year ended December 31, 2018. When distributed, certain earnings may be subject to a maximum tax rate of 15% as provided for the Jobs and Growth Tax Relief Reconciliation Act of 2003. The Fund designated up to a maximum of approximately $1,151,000 as taxable at this lower rate.
In January, the Fund provides tax information to shareholders for the preceding calendar year.
29
Morgan Stanley Institutional Fund, Inc.
Annual Report — December 31, 2018
Privacy Notice (unaudited)
MORGAN STANLEY INVESTMENT MANAGEMENT INC.
AN IMPORTANT NOTICE CONCERNING OUR U.S. PRIVACY POLICY
We are required by federal law to provide you with a copy of our privacy policy annually. This policy applies to current and former individual investors in funds managed or sponsored by Morgan Stanley Investment Management Inc. ("MSIM") as well as current and former individual clients of MSIM. This policy is not applicable to partnerships, corporations, trusts or other non-individual clients or investors. Please note that we may amend this policy at any time, and will inform you of any changes as required by law.
WE RESPECT YOUR PRIVACY
We appreciate that you have provided us with your personal financial information. We strive to maintain the privacy of such information while we help you achieve your financial objectives. This Notice describes what non-public personal information we collect about you, why we collect it, when we may share it with others and how certain others may use it. It discusses the steps you may take to limit our sharing of certain information about you to affiliated companies in the Morgan Stanley family of companies ("other Morgan Stanley companies"). It also discloses how you may limit use of certain shared information for marketing purposes by other Morgan Stanley branded companies. Throughout this policy, we refer to the non-public information that personally identifies you or your accounts as "personal information.''
1. WHAT PERSONAL INFORMATION DO WE COLLECT ABOUT YOU?
We obtain personal information from applications and other forms you submit to us, from your dealings with us, from consumer reporting agencies, from our Web sites and from third parties and other sources.
For example:
• We may collect information such as your name, address, e-mail address, telephone/fax numbers, assets, income and investment objectives through subscription documents, applications and other forms you submit to us.
• We may obtain information about account balances, your use of account(s) and the types of products and services you prefer to receive from us through your dealings and transactions with us and other sources.
• We may obtain information about your creditworthiness and credit history from consumer reporting agencies.
• We may collect background information from and through third-party vendors to verify representations you have made and to comply with various regulatory requirements.
• If you interact with us through our public and private Web sites, we may collect information that you provide directly through online communications (such as an e-mail address). We may also collect information about your Internet service provider, your domain name, your computer's operating system and Web browser, your use of our Web sites and your product and service preferences, through the use of "cookies." Please consult the Terms of Use of these sites for more details.
2. WHEN DO WE DISCLOSE PERSONAL INFORMATION WE COLLECT ABOUT YOU?
We may disclose personal information we collect about you to other Morgan Stanley companies and to non-affiliated third parties.
a. Information We Disclose to Other Morgan Stanley Companies.
We may disclose personal information to other Morgan Stanley companies for a variety of reasons, including to manage your account(s) effectively, to service and process your transactions, to let you know about products and services offered by us and other Morgan Stanley companies, to manage our business, and as otherwise required or permitted by law. Offers for products and services from other Morgan Stanley companies are developed under conditions designed to safeguard your personal information.
30
Morgan Stanley Institutional Fund, Inc.
Annual Report — December 31, 2018
Privacy Notice (unaudited) (cont'd)
b. Information We Disclose to Non-affiliated Third Parties.
We do not disclose personal information that we collect about you to non-affiliated third parties except to those who provide marketing services on our behalf, to financial institutions with whom we have joint marketing agreements, and as otherwise required or permitted by law. For example, we may disclose personal information to non-affiliated third parties for servicing and processing transactions, to offer our own products and services, to protect against fraud, for institutional risk control, to respond to judicial process or to perform services on our behalf. When we share personal information with a non-affiliated third party, they are required to limit their use of personal information to the particular purpose for which it was shared and they are not allowed to share personal information with others except to fulfill that limited purpose or as may be permitted or required by law.
3. HOW DO WE PROTECT THE SECURITY AND CONFIDENTIALITY OF PERSONAL INFORMATION WE COLLECT ABOUT YOU?
We maintain physical, electronic and procedural security measures to help safeguard the personal information we collect about you. We have internal policies governing the proper handling of client information. Third parties that provide support or marketing services on our behalf may also receive personal information, and we require them to adhere to confidentiality standards with respect to such information.
4. HOW CAN YOU LIMIT THE SHARING OF CERTAIN TYPES OF PERSONAL INFORMATION WITH OTHER MORGAN STANLEY COMPANIES?
We offer you choices as to whether we share with other Morgan Stanley companies the personal information that was collected to determine your eligibility for products and services you request ("eligibility information"). Eligibility information does not include your identification information or personal information pertaining to our transactions or experiences with you. Please note that, even if you direct us not to share eligibility information with other Morgan Stanley companies ("opt-out"), we may still share personal information, including eligibility information, with those companies in circumstances excluded from the opt-out under applicable law, such as to process transactions or to service your account.
5. HOW CAN YOU LIMIT THE USE OF CERTAIN TYPES OF PERSONAL INFORMATION BY OTHER MORGAN STANLEY COMPANIES FOR MARKETING?
By following the opt-out instructions in Section 6 below, you may limit other Morgan Stanley branded companies from marketing their products or services to you based on personal information we disclose to them. This information may include, for example, your income and account history with us. Please note that, even if you choose to limit Other Morgan Stanley Companies from using personal information about you that we may share with them for marketing their products and services to you, Other Morgan Stanley Companies may use your personal information that they obtain from us to market to you in circumstances permitted by law, such as if the Other Morgan Stanley Company has its own relationship with you.
6. HOW CAN YOU SEND US AN OPT-OUT INSTRUCTION?
If you wish to limit our sharing of eligibility information about you with other Morgan Stanley companies or other Morgan Stanley companies' use of personal information for marketing purposes, as described in this notice, you may do so by:
• Calling us at (800) 548-7786
Monday–Friday between 8a.m. and 6p.m.(EST)
• Writing to us at the following address:
DST Asset Manager Solutions, Inc.
c/o Privacy Coordinator
P.O. Box 219804
Kansas City, Missouri 64121
31
Morgan Stanley Institutional Fund, Inc.
Annual Report — December 31, 2018
Privacy Notice (unaudited) (cont'd)
Your written request should include your name, address, telephone number and account number(s) to which the opt-out applies and whether you are opting out with respect to sharing of eligibility information (Section 4 above), or if information used for Marketing (Section 5 above) or both. Written opt-out requests should not be sent with any other correspondence. In order to process your request, we require that the request be provided by you directly and not through a third party.
Your opt-out preference will remain in effect with respect to this policy (as it may be amended) until you notify us otherwise. If you have a joint account, your direction for us not to share this information with other Morgan Stanley companies and for those other Morgan Stanley companies not to use your personal information for marketing will be applied to all account holders on that account. Please understand that if you limit our sharing or our affiliated companies' use of personal information, you and any joint account holder(s) may not receive information about Morgan Stanley products and services, including products or services that could help you manage your financial resources and achieve your investment objectives.
7. WHAT IF AN AFFILIATED COMPANY BECOMES A NON-AFFILIATED THIRD PARTY?
If, at any time in the future, an affiliated company becomes a non-affiliated third party, further disclosures of personal information made to the former affiliated company will be limited to those described in Section 2(b) above relating to non-affiliated third parties. If you elected under Section 6 to limit disclosures we make to affiliated companies, or use of personal information by affiliated companies, your election will not apply to use by any former affiliated company of your personal information in their possession once it becomes a non-affiliated third party.
SPECIAL NOTICE TO RESIDENTS OF VERMONT
The following section supplements our policy with respect to our individual clients who have a Vermont address and supersedes anything to the contrary in the above policy with respect to those clients only.
The state of Vermont requires financial institutions to obtain your consent prior to sharing personal information that they collect about you with affiliated companies and non-affiliated third parties other than in certain limited circumstances. Except as permitted by law, we will not share personal information we collect about you with non-affiliated third parties or other Morgan Stanley companies unless you provide us with your written consent to share such information ("opt-in").
If you wish to receive offers for investment products and services offered by or through other Morgan Stanley companies, please notify us in writing at the following address:
DST Asset Manager Solutions, Inc.
c/o Privacy Coordinator
P.O. Box 219804
Kansas City, Missouri 64121
Your authorization should include your name, address, telephone number and account number(s) to which the opt-in applies and should not be sent with any other correspondence. In order to process your authorization, we require that the authorization be provided by you directly and not through a third party.
SPECIAL NOTICE TO RESIDENTS OF CALIFORNIA
The following section supplements our policy with respect to our individual clients who have a California address and supersedes anything to the contrary in the above policy with respect to those clients only.
In response to a California law, if your account has a California home address, your personal information will not be disclosed to non-affiliated third parties except as permitted by applicable California law, and we will limit sharing such information with our affiliates to comply with California privacy laws that apply to us.
32
Morgan Stanley Institutional Fund, Inc.
Annual Report — December 31, 2018
Director and Officer Information (unaudited)
Independent Directors:
Name, Age and Address of
Independent Director | | Position(s)
Held with
Registrant | | Length of Time
Served* | | Principal Occupation(s) During Past 5 Years
and Other Relevant Professional Experience | | Number of
Portfolios in
Fund Complex
Overseen by
Independent
Director** | | Other Directorships
Held by Independent
Director*** | |
Frank L. Bowman (74)
c/o Perkins Coie LLP
Counsel to the Independent
Directors
30 Rockefeller Plaza
New York, NY 10112 | | Director | | Since
August
2006 | | President, Strategic Decisions, LLC (consulting) (since February 2009); Director or Trustee of various Morgan Stanley Funds (since August 2006); Chairperson of the Compliance and Insurance Committee (since October 2015); formerly, Chairperson of the Insurance Sub-Committee of the Compliance and Insurance Committee (2007-2015); served as President and Chief Executive Officer of the Nuclear Energy Institute (policy organization) (February 2005-November 2008); retired as Admiral, U.S. Navy after serving over 38 years on active duty including 8 years as Director of the Naval Nuclear Propulsion Program in the Department of the Navy and the U.S. Department of Energy (1996-2004); served as Chief of Naval Personnel (July 1994-September 1996) and on the Joint Staff as Director of Political Military Affairs (June 1992-July 1994); knighted as Honorary Knight Commander of the Most Excellent Order of the British Empire; awarded the Officier de l'Orde National du Mérite by the French Government; elected to the National Academy of Engineering (2009). | | | 82 | | | Director of BP p.l.c.; Director of Naval and Nuclear Technologies LLP; Director Emeritus of the Armed Services YMCA; Member of the National Security Advisory Council of the Center for U.S. Global Engagement and a member of the CNA Military Advisory Board; Trustee of Fairhaven United Methodist Church; Member of the Board of Advisors of the Dolphin Scholarship Foundation; and Director of other various non-profit organizations. | |
Kathleen A. Dennis (65)
c/o Perkins Coie LLP
Counsel to the Independent Directors
30 Rockefeller Plaza
New York, NY 10112 | | Director | | Since
August
2006 | | President, Cedarwood Associates (mutual fund and investment management consulting) (since July 2006); Chairperson of the Liquidity and Alternatives Sub-Committee of the Investment Committee (since October 2006) and Director or Trustee of various Morgan Stanley Funds (since August 2006); formerly, Senior Managing Director of Victory Capital Management (1993-2006). | | | 82 | | | Director of various non-profit organizations. | |
Nancy C. Everett (63)
c/o Perkins Coie LLP
Counsel to the Independent Directors
30 Rockefeller Plaza
New York, NY 10112 | | Director | | Since
January
2015 | | Chief Executive Officer, Virginia Commonwealth University Investment Company (since November 2015); Owner, OBIR, LLC (institutional investment management consulting) (since June 2014); formerly, Managing Director, BlackRock Inc. (February 2011-December 2013); and Chief Executive Officer, General Motors Asset Management (a/k/a Promark Global Advisors, Inc.) (June 2005-May 2010). | | | 83 | | | Formerly, Member of Virginia Commonwealth University School of Business Foundation (2005-2016); Member of Virginia Commonwealth University Board of Visitors (2013-2015); Member of Committee on Directors for Emerging Markets Growth Fund, Inc. (2007-2010); Chairperson of Performance Equity Management, LLC (2006-2010); and Chairperson, GMAM Absolute Return Strategies Fund, LLC (2006-2010). | |
33
Morgan Stanley Institutional Fund, Inc.
Annual Report — December 31, 2018
Director and Officer Information (unaudited) (cont'd)
Independent Directors: (cont'd)
Name, Age and Address of
Independent Director | | Position(s)
Held with
Registrant | | Length of Time
Served* | | Principal Occupation(s) During Past 5 Years
and Other Relevant Professional Experience | | Number of
Portfolios in
Fund Complex
Overseen by
Independent
Director** | | Other Directorships
Held by Independent
Director*** | |
Jakki L. Haussler (61)
c/o Perkins Coie LLP
Counsel to the Independent Directors
30 Rockefeller Plaza
New York, NY 10112 | | Director | | Since
January
2015 | | Chairman and Chief Executive Officer, Opus Capital Group (since January 1996); formerly, Director, Capvest Venture Fund, LP (May 2000-December 2011); Partner, Adena Ventures, LP (July 1999-December 2010); Director, The Victory Funds (February 2005-July 2008). | | | 83 | | | Director of Service Corporation International and Member, Audit Committee and Investment Committee; Director of Cincinnati Bell Inc. and Member, Audit Committee and Governance and Nominating Committee; Chairman of Northern Kentucky University Member Investment Committee; Member of Chase College of Law Transactional Law Practice Center Board of Advisors; Director of Best Transport; Director of Chase College of Law Board of Visitors; formerly, Member, University of Cincinnati Foundation Investment Committee; Member, Miami University Board of Visitors (2008-2011); Trustee of Victory Funds (2005-2008) and Chairman, Investment Committee (2007-2008) and Member, Service Provider Committee (2005-2008). | |
Dr. Manuel H. Johnson (69)
c/o Johnson Smick
International, Inc.
220 I Street, NE — Suite 200
Washington, D.C. 20002 | | Director | | Since
July
1991 | | Senior Partner, Johnson Smick International, Inc. (consulting firm); Chairperson of the Investment Committee (since October 2006) and Director or Trustee of various Morgan Stanley Funds (since July 1991); Co-Chairman and a founder of the Group of Seven Council (G7C) (international economic commission); formerly, Chairperson of the Audit Committee (July 1991-September 2006), Vice Chairman of the Board of Governors of the Federal Reserve System and Assistant Secretary of the U.S. Treasury. | | | 82 | | | Director of NVR, Inc. (home construction). | |
Joseph J. Kearns (76)
c/o Perkins Coie LLP
Counsel to the Independent Directors
30 Rockefeller Plaza
New York, NY 10112 | | Director | | Since
August
1994 | | Senior Adviser, Kearns & Associates LLC (investment consulting); Chairperson of the Audit Committee (since October 2006) and Director or Trustee of various Morgan Stanley Funds (since August 1994); formerly, Deputy Chairperson of the Audit Committee (July 2003-September 2006) and Chairperson of the Audit Committee of various Morgan Stanley Funds (since August 1994); CFO of the J. Paul Getty Trust. | | | 83 | | | Prior to August 10, 2016, Director of Electro Rent Corporation (equipment leasing); Prior to December 31, 2013, Director of The Ford Family Foundation. | |
34
Morgan Stanley Institutional Fund, Inc.
Annual Report — December 31, 2018
Director and Officer Information (unaudited) (cont'd)
Independent Directors: (cont'd)
Name, Age and Address of
Independent Director | | Position(s)
Held with
Registrant | | Length of Time
Served* | | Principal Occupation(s) During Past 5 Years
and Other Relevant Professional Experience | | Number of
Portfolios in
Fund Complex
Overseen by
Independent
Director** | | Other Directorships
Held by Independent
Director*** | |
Michael F. Klein (60)
c/o Perkins Coie LLP
Counsel to the Independent Directors
30 Rockefeller Plaza
New York, NY 10112 | | Director | | Since
August
2006 | | Managing Director, Aetos Alternatives Management, LP (since March 2000); Co-President, Aetos Alternatives Management, LP (since January 2004) and Co-Chief Executive Officer of Aetos Alternatives Management, LP (since August 2013); Chairperson of the Fixed Income Sub-Committee of the Investment Committee (since October 2006) and Director or Trustee of various Morgan Stanley Funds (since August 2006); formerly, Managing Director, Morgan Stanley & Co. Inc. and Morgan Stanley Dean Witter Investment Management and President, various Morgan Stanley Funds (June 1998-March 2000); Principal, Morgan Stanley & Co. Inc. and Morgan Stanley Dean Witter Investment Management (August 1997-December 1999). | | | 82 | | | Director of certain investment funds managed or sponsored by Aetos Alternatives Management, LP; Director of Sanitized AG and Sanitized Marketing AG (specialty chemicals). | |
Patricia Maleski (58)
c/o Perkins Coie LLP
Counsel to the Independent Directors
30 Rockefeller Plaza
New York, NY 10112 | | Director | | Since
January
2017 | | Managing Director, JPMorgan Asset Management (2004-2016); Oversight and Control Head of Fiduciary and Conflicts of Interest Program (2015-2016); Chief Control Officer-Global Asset Management (2013-2015); President, JPMorgan Funds (2010-2013); Chief Administrative Officer (2004-2013); various other positions including Treasurer and Board Liaison (since 2001). | | | 83 | | | None. | |
Michael E. Nugent (82)
522 Fifth Avenue
New York, NY 10036 | | Chair of the Board and Director | | Chair of the Boards since July 2006 and Director since July 1991 | | Chair of the Boards of various Morgan Stanley Funds (since July 2006); Chairperson of the Closed-End Fund Committee (since June 2012) Governance Committee (since January 2019) and Director or Trustee of various Morgan Stanley Funds (since July 1991); formerly, Chairperson of the Insurance Committee (until July 2006); General Partner, Triumph Capital, L.P. (private investment partnership) (1988-2013). | | | 82 | | | None. | |
W. Allen Reed (71)
c/o Perkins Coie LLP
Counsel to the Independent Directors
30 Rockefeller Plaza
New York, NY 10112 | | Director | | Since
August
2006 | | Chairperson of the Equity Sub-Committee of the Investment Committee (since October 2006) and Director or Trustee of various Morgan Stanley Funds (since August 2006); formerly, President and CEO of General Motors Asset Management; Chairman and Chief Executive Officer of the GM Trust Bank and Corporate Vice President of General Motors Corporation (August 1994-December 2005). | | | 82 | | | Director of Legg Mason, Inc.; formerly, Director of the Auburn University Foundation (2010-2015). | |
Fergus Reid (86)****
c/o Joe Pietryka, Inc.
85 Charles Colman Blvd.
Pawling, NY 12564 | | Director | | Since
June
1992 | | Chairman, Joe Pietryka, Inc.; Chairperson of the Governance Committee and Director or Trustee of various Morgan Stanley Funds (since June 1992). | | | 83 | | | Formerly, Trustee and Director of certain investment companies in the JP Morgan Fund Complex managed by JP Morgan Investment Management Inc. (1987-2012). | |
* This is the earliest date the Director began serving the Morgan Stanley Funds. Each Director serves an indefinite term, until his or her successor is elected.
** The Fund Complex includes (as of December 31, 2018) all open-end and closed-end funds (including all of their portfolios) advised by Morgan Stanley Investment Management Inc. (the "Adviser") and any funds that have an adviser that is an affiliated person of the Adviser (including, but not limited to, Morgan Stanley AIP GP LP).
*** This includes any directorships at public companies and registered investment companies held by the Director at any time during the past five years.
**** Effective date of retirement is December 31, 2018.
35
Morgan Stanley Institutional Fund, Inc.
Annual Report — December 31, 2018
Director and Officer Information (unaudited) (cont'd)
Executive Officers:
Name, Age and Address of Executive Officer | | Position(s) Held
with
Registrant | | Length of Time
Served* | | Principal Occupation(s) During Past 5 Years | |
John H. Gernon (55)
522 Fifth Avenue
New York, NY 10036 | | President and Principal Executive Officer | | Since
September
2013 | | President and Principal Executive Officer of the Equity and Fixed Income Funds and the Morgan Stanley AIP Funds (since September 2013) and the Liquidity Funds and various money market funds (since May 2014) in the Fund Complex; Managing Director of the Adviser; Head of Product (since 2006). | |
Timothy J. Knierim (59)
522 Fifth Avenue
New York, NY 10036 | | Chief Compliance Officer | | Since
December
2016 | | Managing Director of the Adviser and various entities affiliated with the Adviser; Chief Compliance Officer of various Morgan Stanley Funds and the Adviser (since December 2016) and Chief Compliance Officer of Morgan Stanley AIP GP LP (since 2014). Formerly, Managing Director and Deputy Chief Compliance Officer of the Adviser (2014-2016); and formerly, Chief Compliance Officer of Prudential Investment Management, Inc. (2007-2014). | |
Francis J. Smith (53)
522 Fifth Avenue
New York, NY 10036 | | Treasurer and Principal Financial Officer | | Treasurer since July 2003 and Principal Financial Officer since September 2002 | | Managing Director of the Adviser and various entities affiliated with the Adviser; Treasurer (since July 2003) and Principal Financial Officer of various Morgan Stanley Funds (since September 2002). | |
Mary E. Mullin (51)
522 Fifth Avenue
New York, NY 10036 | | Secretary | | Since
June
1999 | | Managing Director of the Adviser; Secretary of various Morgan Stanley Funds (since June 1999). | |
Michael J. Key (39)
522 Fifth Avenue
New York, NY 10036 | | Vice President | | Since
June
2017 | | Vice President of the Equity and Fixed Income Funds, Liquidity Funds, various money market funds and the Morgan Stanley AIP Funds in the Fund Complex (since June 2017); Executive Director of the Adviser; Head of Product Development for Equity and Fixed Income Funds (since August 2013). | |
* This is the earliest date the officer began serving the Morgan Stanley Funds. Each officer serves a one-year term, until his or her successor is elected and qualifies.
36
Morgan Stanley Institutional Fund, Inc.
Annual Report — December 31, 2018
Adviser and Administrator
Morgan Stanley Investment Management Inc.
522 Fifth Avenue
New York, New York 10036
Distributor
Morgan Stanley Distribution, Inc.
522 Fifth Avenue
New York, New York 10036
Dividend Disbursing and Transfer Agent
DST Asset Manager Solutions, Inc.
2000 Crown Colony Drive
Quincy, Massachusetts 02169
Custodian
State Street Bank and Trust Company
One Lincoln Street
Boston, Massachusetts 02111
Legal Counsel
Dechert LLP
1095 Avenue of the Americas
New York, New York 10036
Counsel to the Independent Directors
Perkins Coie LLP
30 Rockefeller Plaza
New York, New York 10112
Independent Registered Public Accounting Firm
Ernst & Young LLP
200 Clarendon Street
Boston, Massachusetts 02116
Reporting to Shareholders
Each Morgan Stanley fund provides a complete schedule of portfolio holdings in its semi-annual and the annual reports within 60 days of the end of the fund's second and fourth fiscal quarters. The semi-annual and annual reports are filed electronically with the Securities and Exchange Commission ("SEC") on Form N-CSRS and Form N-CSR, respectively. Morgan Stanley also delivers the semi-annual and annual reports to fund shareholders and makes these reports available on its public website, www.morganstanley.com/im/shareholderreports. Each Morgan Stanley fund also files a complete schedule of portfolio holdings with the SEC for the fund's first and third fiscal quarters on Form N-Q. Morgan Stanley does not deliver the reports for the first and third fiscal quarters to shareholders, nor are the reports posted to the Morgan Stanley public website. You may, however, obtain the Form N-Q filings (as well as the Form N-CSR and N-CSRS filings) by accessing the SEC's website, www.sec.gov. You can also request copies of these materials, upon payment of a duplicating fee, by electronic request at the SEC's email address (publicinfo@sec.gov).
Proxy Voting Policies and Procedures and Proxy Voting Record
You may obtain a copy of the Company's Proxy Voting Policy and Procedures and information regarding how the Company voted proxies relating to portfolio securities during the most recent twelve-month period ended June 30, without charge, upon request, by calling toll free 1 (800) 548-7786 or by visiting our website at www.morganstanley.com/im/shareholderreports. This information is also available on the SEC's website at www.sec.gov.
This report is authorized for distribution only when preceded or accompanied by a prospectus or summary prospectus of the applicable Fund of Morgan Stanley Institutional Fund, Inc, which describes in detail the Fund's investment policies, risks, fees and expenses. Please read the prospectus carefully before you invest or send money. For additional information, including information regarding the investments comprising the Fund, please visit our website at www.morganstanley.com/im/shareholderreports or call toll free 1 (800) 548-7786.
37
Printed in U.S.A.
This Report has been prepared for shareholders and may be distributed to others only if preceded or accompanied by a current prospectus.
Morgan Stanley Investment Management Inc.
522 Fifth Avenue
New York, New York 10036
© 2019 Morgan Stanley. Morgan Stanley Distribution, Inc.

IFIIIOANN
2398547 EXP. 02.29.20

Morgan Stanley Institutional Fund, Inc.
International Real Estate Portfolio
Annual Report
December 31, 2018
Beginning on January 1, 2021, as permitted by regulations adopted by the Securities and Exchange Commission ("SEC"), paper copies of the Fund's Annual and Semi-Annual Reports to Shareholders ("Shareholder Reports") will no longer be sent by mail, unless you specifically request paper copies of the Shareholder Reports from the Fund or from your financial intermediary, such as a broker-dealer or a bank. Instead, the Shareholder Reports will be made available on the Fund's website, https://www.morganstanley.com/im/shareholderreports and you will be notified by mail each time a Shareholder Report is posted and provided with a website link to access the Shareholder Report. If you already elected to receive Shareholder Reports electronically, you will not be affected by this change and you need not take any action. You may elect to receive Shareholder Reports and other communications from the Fund electronically anytime by contacting your financial intermediary or, if you are a direct investor, please follow the instructions on the envelope.
Beginning on January 1, 2019, you may elect to receive all future Shareholder Reports in paper free of charge. If you invest through a financial intermediary, you can contact your financial intermediary to request that you continue to receive paper copies of your Shareholder Reports. If you invest directly with the Fund, please follow the instructions on the envelope to let the Fund know you wish to continue receiving paper copies of your Shareholder Reports. Your election to receive Shareholder Reports in paper will apply to all funds held in your account if you invest through your financial intermediary or all funds held with the fund complex if you invest directly with a fund.

Morgan Stanley Institutional Fund, Inc.
Annual Report — December 31, 2018
Shareholders' Letter | | | 2 | | |
Expense Example | | | 3 | | |
Investment Overview | | | 4 | | |
Portfolio of Investments | | | 8 | | |
Statement of Assets and Liabilities | | | 10 | | |
Statement of Operations | | | 12 | | |
Statements of Changes in Net Assets | | | 13 | | |
Financial Highlights | | | 15 | | |
Notes to Financial Statements | | | 20 | | |
Report of Independent Registered Public Accounting Firm | | | 27 | | |
Federal Tax Notice | | | 28 | | |
Privacy Notice | | | 29 | | |
Director and Officer Information | | | 32 | | |
This report is authorized for distribution only when preceded or accompanied by a prospectus or summary prospectus of the applicable Fund of Morgan Stanley Institutional Fund, Inc. To receive a prospectus and/or statement of additional information (SAI), which contains more complete information such as investment objectives, charges, expenses, policies for voting proxies, risk considerations and describes in detail each of the Fund's investment policies to the prospective investor, please call toll free 1 (800) 548-7786. Please read the prospectuses carefully before you invest or send money.
Additionally, you can access information about the Fund, including performance, characteristics and investment team commentary, through Morgan Stanley Investment Management's website: www.morganstanley.com/im/shareholderreports.
Market forecasts provided in this report may not necessarily come to pass. There is no guarantee that any sectors mentioned will continue to perform as discussed herein or that securities in such sectors will be held by the Fund in the future. There is no assurance that a fund will achieve its investment objective. Funds are subject to market risk, which is the possibility that market values of securities owned by the Fund will decline and, therefore, the value of the Fund's shares may be less than what you paid for them. Accordingly, you can lose money investing in this Fund. Please see the prospectus for more complete information on investment risks.
1
Morgan Stanley Institutional Fund, Inc.
Annual Report — December 31, 2018
Shareholders' Letter (unaudited)
Dear Shareholders,
We are pleased to provide this Annual report, in which you will learn how your investment in International Real Estate Portfolio (the "Fund") performed during the latest twelve-month period.
Morgan Stanley Investment Management is a client-centric, investor-led organization. Our global presence, intellectual capital, and breadth of products and services enable us to partner with investors to meet the evolving challenges of today's financial markets. We aim to deliver superior investment service and to empower our clients to make the informed decisions that help them reach their investment goals.
As always, we thank you for selecting Morgan Stanley Investment Management, and look forward to working with you in the months and years ahead.
Sincerely,

John H. Gernon
President and Principal Executive Officer
January 2019
2
Morgan Stanley Institutional Fund, Inc.
Annual Report — December 31, 2018
Expense Example (unaudited)
International Real Estate Portfolio
As a shareholder of the Fund, you incur two types of costs: (1) transactional costs, including redemption fees; and (2) ongoing costs, which may include advisory fees, administration fees, distribution and shareholder services fees and other Fund expenses. This example is intended to help you understand your ongoing costs (in dollars) of investing in the Fund and to compare these costs with the ongoing costs of investing in other mutual funds.
This example is based on an investment of $1,000 invested at the beginning of the six-month period ended December 31, 2018 and held for the entire six-month period.
Actual Expenses
The table below provides information about actual account values and actual expenses. You may use the information in this table, together with the amount you invested, to estimate the expenses that you paid over the period. Simply divide your account value by $1,000 (for example, an $8,600 account value divided by $1,000 = 8.6), then multiply the result by the number in the table under the heading entitled "Actual Expenses Paid During Period" to estimate the expenses you paid on your account during this period.
Hypothetical Example for Comparison Purposes
The table below provides information about hypothetical account values and hypothetical expenses based on the Fund's actual expense ratio and an assumed rate of return of 5% per year before expenses, which is not the Fund's actual return. The hypothetical account values and expenses may not be used to estimate the actual ending account balance or expenses you paid for the period. You may use this information to compare the ongoing costs of investing in the Fund and other funds. To do so, compare this 5% hypothetical example with the 5% hypothetical examples that appear in the shareholder reports of the other funds.
Please note that the expenses shown in the table are meant to highlight your ongoing costs only and do not reflect any transactional costs, such as sales charges (loads) and redemption fees. Therefore, the information for each class in the table is useful in comparing ongoing costs only, and will not help you determine the relative total costs of owning different funds. In addition, if these transactional costs were included, your costs would have been higher.
| | | Beginning
Account
Value
7/1/18 | | Actual Ending
Account
Value
12/31/18 | | Hypothetical
Ending Account
Value | | Actual
Expenses
Paid
During
Period* | | Hypothetical
Expenses Paid
During Period* | | Net
Expense
Ratio
During
Period** | |
International Real Estate Portfolio Class I | | $ | 1,000.00 | | | $ | 916.70 | | | $ | 1,020.16 | | | $ | 4.83 | | | $ | 5.09 | | | | 1.00 | % | |
International Real Estate Portfolio Class A | | | 1,000.00 | | | | 915.50 | | | | 1,018.40 | | | | 6.52 | | | | 6.87 | | | | 1.35 | | |
International Real Estate Portfolio Class L | | | 1,000.00 | | | | 913.10 | | | | 1,015.88 | | | | 8.92 | | | | 9.40 | | | | 1.85 | | |
International Real Estate Portfolio Class C | | | 1,000.00 | | | | 911.70 | | | | 1,014.62 | | | | 10.12 | | | | 10.66 | | | | 2.10 | | |
International Real Estate Portfolio Class IS | | | 1,000.00 | | | | 917.00 | | | | 1,020.32 | | | | 4.69 | | | | 4.94 | | | | 0.97 | | |
* Expenses are calculated using each Fund Class' annualized net expense ratio (as disclosed), multiplied by the average account value over the period and multiplied by 184/365 (to reflect the most recent one-half year period).
** Annualized.
3
Morgan Stanley Institutional Fund, Inc.
Annual Report — December 31, 2018
Investment Overview (unaudited)
International Real Estate Portfolio
The Fund seeks to provide current income and long-term capital appreciation.
Performance
For the fiscal year ended December 31, 2018, the Fund's Class I shares had a total return based on net asset value and reinvestment of distributions per share of –8.14%, net of fees. The Fund's Class I shares underperformed against the Fund's benchmark, the FTSE EPRA Nareit Developed ex-North America Real Estate — Net Total Return Index (the "Index"), which returned –6.44%, and outperformed the MSCI EAFE Index, which returned –13.79%.
Factors Affecting Performance
• The broader equity market declined for the 12-month period and appears to be pricing in an economic slowdown scenario. In the fourth quarter, a host of macro concerns appeared to result in a broad-based sell-off, which also negatively impacted listed real estate share prices. Within real estate, market segments viewed as more defensive generally outperformed.
• The international real estate securities market declined 6.4% during the 12-month period ending December 31, 2018, as measured by the Index.
• Property stocks in Asia, measured by the FTSE EPRA Nareit Developed Asia Index, declined 1.5%. In Hong Kong, concerns about the negative trade relations, interest rates and economic weakness continue to weigh on investor sentiment. In Japan, the currency experienced strength and the Japan REITs (J-REITs) posted the largest gains on a global basis due to their defensive characteristics.
• Property stocks in Europe, measured by the FTSE EPRA Nareit Developed EMEA Index, declined 12.1% and lagged Asia. Share prices of Continental retail companies experienced significant declines due to concerns over retailer challenges. In the U.K., uncertainty over Brexit persisted and became more acute in the fourth quarter, but leasing activity and investment transactions for London office remain active and have demonstrated resilience in underlying asset values.
• Listed real estate security returns should mirror private real estate performance. There are concerns that values may have peaked or are even poised to
decline after significant appreciation. However, based on significant transactional evidence, pricing has generally remained stable for high-quality assets for the last two years, which has resulted in a significant disparity in real estate valuations between the public markets and private markets following share price declines over the period.
• Overall, share prices have largely been driven by macro themes, central bank policies and investor preference for market segments with more defensive characteristics, as opposed to valuations and fundamentals. This has resulted in pockets of the global listed property market trading at premium valuations relative to their peers due to their perceived defensive characteristics (e.g., German residential stocks, J-REITs and Australian REITs). Despite transactional evidence continuing to demonstrate strength in asset values, there was significant negative investor sentiment towards key market segments resulting in very wide discounts to net asset values (NAVs), which included Hong Kong commercial property companies, Continental high-quality retail, and the U.K. Majors and London office specialists. Given the Fund's value-oriented investment style, the Fund was underweight many of the segments viewed as defensive and trading at relative premium valuations. As those segments outperformed over the period, this underweighting was a key detractor from relative performance.
• From a regional perspective, performance within the Asian regional portfolio contributed to relative performance, while the European portfolio detracted. Top-down regional allocation modestly contributed to relative performance. In Asia, the Fund benefited from stock selection in Hong Kong and the underweight to Singapore; this was partially offset by the overweight to Hong Kong and the underweight to Japan. In Europe, the Fund benefited from the underweight to U.K. retail securities and stock selection within and the overweight to Spain; but this was more than offset by the overweight to Continental retail, the overweight to and stock selection within the U.K. Majors, and the underweights to German residential and Belgium.
4
Morgan Stanley Institutional Fund, Inc.
Annual Report — December 31, 2018
Investment Overview (unaudited) (cont'd)
International Real Estate Portfolio
Management Strategies
• The Fund is comprised of two regional portfolios with a global allocation which weights the European and Asian regions relative to the Index based on our view of the relative attractiveness of each region in terms of underlying real estate fundamentals and public market valuations. Moreover, both regional portfolios reflect our core investment philosophy as a real estate value investor, which results in the ownership of stocks that we believe provide the best valuation relative to their underlying real estate values, while maintaining portfolio diversification. Our company-specific research leads us to specific preferences for sub-segments within each of the property sectors and countries. For the period ended December 31, 2018, the Fund was overweight the Asian listed property sector and underweight the European listed property sector. We would note that regional bets are currently relatively muted due to a lack of large valuation disparities among the regions and due to macro uncertainties which may impact regional share prices far more than underlying fundamentals and valuations, and we have instead focused on the enormous disparities in valuations among market segments within each of the major regions. We see the most attractive expected return prospects from companies concentrated in the Hong Kong commercial property companies, Continental high-quality retail, the U.K. Majors and London office specialists and select opportunities to invest in other core assets at attractive discounted valuations in a number of other global markets.
• In Hong Kong, there is continued strength in valuations for commercial assets as evidenced by elevated transaction volumes. The Hong Kong office market features low vacancy levels and continued rental growth, while there has been a recent slowdown in strong growth of retail sales in Hong Kong. The Hong Kong real estate operating companies (REOCs) continue to represent a significant overweight in the global portfolio, as the stocks offer highly attractive value with the widest overall discrepancy between public and private valuations among public listed global property
markets despite healthy operating fundamentals, solid recurring cash flow growth and continued strength in asset values in the private markets, as well as improving corporate governance and capital management. The discounted valuations are further accentuated as the Hong Kong REOCs maintain very modest leverage levels. These NAV discounts could eventually narrow for companies that are willing to recycle assets on the balance sheet to realize their latent gains and engage in corporate restructuring to improve transparency and capital management, and potentially eliminate any holding company discounts, as well as any improvement in recent negative sentiment. In Japan, the investment market remains active but there is some caution due to all-time low capitalization rates and continued policy uncertainty. There is a significant disparity in valuations with the Japan REOCs trading at discounts to NAVs and the J-REITs trading at premiums to NAVs. The J-REITs generally own lower-quality assets as compared to the J-REOCs, but J-REIT share prices have been bolstered by investors' search for yield, the Bank of Japan's commitment to monetary easing and the asset purchase program, and the perception of REITs as a bond proxy. The Fund is underweight Japan overall, driven primarily by the large underweight to the J-REITs. In Australia, key office markets are experiencing improved rental growth, while operating fundamentals in the Australian retail sector remain lackluster relative to historical levels. The Australian REIT sector ended the period trading at a premium to NAVs and remains far less attractive relative to the Hong Kong REOCs within Asia.
• In the U.K., the Brexit vote created expectations for declines in NAVs, but office market transaction and leasing activity to date have indicated far more modest declines than initially expected. Although uncertainty over Brexit persists (and became more acute in the fourth quarter of 2018), there remains continued investor interest in London assets, especially from foreign investors showing a willingness to pay prices that reflect values at or above pre-Brexit levels, although the value of U.K. retail assets are weakening. Overall, property stocks in the U.K. ended the period trading at a 21%
5
Morgan Stanley Institutional Fund, Inc.
Annual Report — December 31, 2018
Investment Overview (unaudited) (cont'd)
International Real Estate Portfolio
discount to NAVs.(i) There is attractive value in the large-cap U.K. Majors, which trade at a 35% discount to NAVs,(i) and London office specialists, which trade at a 25% discount.(i) These discounts are well in excess of expected asset value declines and reflect a disparity in value versus Other U.K. stocks. On the Continent, valuations are being supported by stable property fundamentals. Property stocks on the Continent ended the period trading at a 15% discount to NAVs(i) overall, although there is meaningful disparity in valuations, with the Continental retail stocks trading at a 35% discount to NAVs(i) following accelerated share price weakness on concerns over retail challenges despite stable operating results by the companies. Within Europe, we remain overweight the U.K. Majors and London office specialists and Continental retail, and underweight Germany and other segments in the U.K.
(i) Morgan Stanley Investment Management, as of December 31, 2018
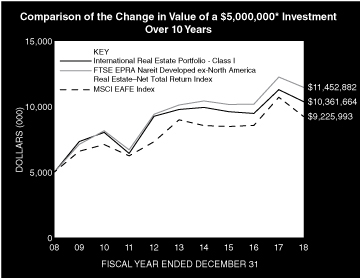
* Minimum Investment for Class I shares
In accordance with SEC regulations, the Fund's performance shown assumes that all recurring fees (including management fees) were deducted and all dividends and distributions were reinvested. The performance of Class A, L, C and IS shares will vary from the performance of Class I shares based upon their different inception dates and will be negatively impacted by additional fees assessed to those classes (if applicable).
6
Morgan Stanley Institutional Fund, Inc.
Annual Report — December 31, 2018
Investment Overview (unaudited) (cont'd)
International Real Estate Portfolio
Performance Compared to the FTSE EPRA Nareit Developed ex-North America Real Estate — Net Total Return Index(1) and the MSCI EAFE Index(2)
| | | Period Ended December 31, 2018
Total Returns(3) | |
| | | | | Average Annual | |
| | | One
Year | | Five
Years | | Ten
Years | | Since
Inception(8) | |
Fund — Class I Shares
w/o sales charges(4) | | | –8.14 | % | | | 1.18 | % | | | 7.56 | % | | | 6.94 | % | |
Fund — Class A Shares
w/o sales charges(4) | | | –8.45 | | | | 0.84 | | | | 7.23 | | | | 6.65 | | |
Fund — Class A Shares with
maximum 5.25% sales charges(4) | | | –13.24 | | | | –0.25 | | | | 6.65 | | | | 6.38 | | |
Fund — Class L Shares
w/o sales charges(5) | | | –8.88 | | | | 0.33 | | | | — | | | | 3.90 | | |
Fund — Class C Shares
w/o sales charges(7) | | | –9.11 | | | | — | | | | — | | | | –2.11 | | |
Fund — Class C Shares with
maximum 1.00% deferred sales
charges(7) | | | –10.00 | | | | — | | | | — | | | | –2.11 | | |
Fund — Class IS Shares
w/o sales charges(6) | | | –8.11 | | | | 1.21 | | | | — | | | | 1.46 | | |
FTSE EPRA Nareit Developed
ex-North America Real
Estate — Net Total Return Index | | | –6.44 | | | | 2.52 | | | | 8.64 | | | | 5.60 | | |
MSCI EAFE Index | | | –13.79 | | | | 0.53 | | | | 6.32 | | | | 3.79 | | |
Performance data quoted represents past performance, which is no guarantee of future results, and current performance may be lower or higher than the figures shown. Performance assumes that all dividends and distributions, if any, were reinvested. For the most recent month-end performance figures, please visit www.morganstanley.com/im/shareholderreports. Investment return and principal value will fluctuate so that Fund shares, when redeemed, may be worth more or less than their original cost. Total returns do not reflect the deduction of taxes that a shareholder would pay on Fund distributions or the redemption of Fund shares. Performance of share classes will vary due to difference in sales charges and expenses.
(1) The FTSE EPRA Nareit Developed ex-North America Real Estate — Net Total Return Index is a free float-adjusted market capitalization weighted index designed to reflect the stock performance of companies engaged in the European and Asian real estate markets. The performance of the Index is listed in U.S. dollars and assumes reinvestment of dividends. "Net Total Return" reflects a reduction in total returns after taking into account the withholding tax on dividends by certain foreign countries represented in the Index for periods after 2/18/05 (gross returns used prior to 2/18/05). The Index is unmanaged and its returns do not include any sales charges or fees. Such costs would lower performance. It is not possible to invest directly in an index.
(2) The MSCI EAFE Index (Europe, Australasia, Far East) is a free float-adjusted market capitalization index that is designed to measure the international equity market performance of developed markets, excluding the U.S. & Canada. The term "free float" represents the portion of shares outstanding that are deemed to be available for purchase in the public equity markets by investors. The MSCI EAFE Index currently consists of 21 developed market country indices. The performance of the Index is listed in U.S. dollars and assumes reinvestment of net dividends. Net total return indices reinvest dividends after the deduction of withholding taxes, using (for international indices) a tax rate applicable to non-resident institutional investors who do not benefit from double taxation treaties. The Index is unmanaged and its returns do not include any sales charges or fees. Such costs would lower performance. It is not possible to invest directly in an index.
(3) Total returns for the Fund reflect fees waived and expenses reimbursed, if applicable, by Morgan Stanley Investment Management Inc. (the "Adviser"). Without such waivers and reimbursements, total returns would have been lower.
(4) Commenced operations on October 1, 1997.
(5) Commenced offering on April 27, 2012.
(6) Commenced offering on September 13, 2013.
(7) Commenced offering on April 30, 2015.
(8) For comparative purposes, average annual since inception returns listed for the Indexes refer to the inception date of Class I of the Fund, not the inception of the Index.
7
Morgan Stanley Institutional Fund, Inc.
Annual Report — December 31, 2018
Portfolio of Investments
International Real Estate Portfolio
| | | Shares | | Value
(000) | |
Common Stocks (99.5%) | |
Australia (8.7%) | |
Dexus REIT | | | 38,888 | | | $ | 291 | | |
Goodman Group REIT | | | 44,035 | | | | 330 | | |
GPT Group (The) REIT | | | 59,084 | | | | 222 | | |
Mirvac Group REIT | | | 101,118 | | | | 159 | | |
Scentre Group REIT | | | 191,015 | | | | 525 | | |
Stockland REIT | | | 81,600 | | | | 202 | | |
Vicinity Centres REIT | | | 161,575 | | | | 296 | | |
| | | | 2,025 | | |
Austria (0.4%) | |
Atrium European Real Estate Ltd. (a) | | | 24,000 | | | | 89 | | |
China (2.3%) | |
China Overseas Land & Investment Ltd. (b) | | | 44,000 | | | | 152 | | |
China Resources Land Ltd. (b) | | | 10,000 | | | | 38 | | |
Country Garden Holdings Co., Ltd. (b) | | | 161,000 | | | | 194 | | |
Guangzhou R&F Properties Co., Ltd. H Shares (b) | | | 60,000 | | | | 90 | | |
Longfor Group Holdings Ltd. (b) | | | 22,500 | | | | 67 | | |
| | | | 541 | | |
Finland (0.6%) | |
Citycon Oyj | | | 13,961 | | | | 26 | | |
Kojamo Oyj (a) | | | 11,903 | | | | 110 | | |
| | | | 136 | | |
France (11.3%) | |
Carmila SA REIT | | | 2,241 | | | | 41 | | |
Covivio REIT | | | 1,694 | | | | 163 | | |
Gecina SA REIT | | | 3,453 | | | | 446 | | |
ICADE REIT | | | 2,446 | | | | 186 | | |
Klepierre SA REIT | | | 19,190 | | | | 591 | | |
Mercialys SA REIT | | | 12,913 | | | | 177 | | |
Unibail-Rodamco-Westfield REIT | | | 6,679 | | | | 1,032 | | |
| | | | 2,636 | | |
Germany (6.3%) | |
ADO Properties SA (c) | | | 2,177 | | | | 114 | | |
Alstria Office AG REIT | | | 10,305 | | | | 144 | | |
Deutsche Wohnen SE | | | 8,000 | | | | 367 | | |
LEG Immobilien AG | | | 1,024 | | | | 107 | | |
Vonovia SE | | | 16,041 | | | | 728 | | |
| | | | 1,460 | | |
Hong Kong (26.6%) | |
Champion REIT | | | 227,000 | | | | 155 | | |
CK Asset Holdings Ltd. | | | 54,500 | | | | 396 | | |
Henderson Land Development Co., Ltd. | | | 26,813 | | | | 133 | | |
Hongkong Land Holdings Ltd. | | | 166,900 | | | | 1,052 | | |
Hysan Development Co., Ltd. | | | 74,836 | | | | 355 | | |
Link REIT | | | 114,895 | | | | 1,157 | | |
New World Development Co., Ltd. | | | 247,788 | | | | 326 | | |
Sino Land Co., Ltd. | | | 124,795 | | | | 212 | | |
Sun Hung Kai Properties Ltd. | | | 85,456 | | | | 1,212 | | |
Swire Properties Ltd. | | | 167,300 | | | | 585 | | |
| | | Shares | | Value
(000) | |
Wharf Holdings Ltd. (The) | | | 70,117 | | | $ | 182 | | |
Wharf Real Estate Investment Co., Ltd. | | | 70,370 | | | | 418 | | |
| | | | 6,183 | | |
Ireland (1.4%) | |
Green REIT PLC | | | 135,111 | | | | 209 | | |
Hibernia REIT PLC | | | 74,823 | | | | 107 | | |
| | | | 316 | | |
Japan (22.3%) | |
Activia Properties, Inc. REIT | | | 28 | | | | 113 | | |
Advance Residence Investment Corp. REIT | | | 60 | | | | 166 | | |
Frontier Real Estate Investment Corp. REIT | | | 12 | | | | 48 | | |
GLP J-REIT | | | 183 | | | | 187 | | |
Hulic Co., Ltd. | | | 18,100 | | | | 162 | | |
Hulic REIT, Inc. | | | 23 | | | | 36 | | |
Invincible Investment Corp. REIT | | | 138 | | | | 57 | | |
Japan Hotel REIT Investment Corp. | | | 139 | | | | 99 | | |
Japan Real Estate Investment Corp. REIT | | | 63 | | | | 354 | | |
Japan Retail Fund Investment Corp. REIT | | | 133 | | | | 266 | | |
Kenedix Office Investment Corp. REIT | | | 11 | | | | 70 | | |
Mitsubishi Estate Co., Ltd. | | | 57,900 | | | | 907 | | |
Mitsui Fudosan Co., Ltd. | | | 39,100 | | | | 866 | | |
Mori Trust Sogo Reit, Inc. | | | 44 | | | | 64 | | |
Nippon Building Fund, Inc. REIT | | | 81 | | | | 510 | | |
Nippon Prologis, Inc. REIT | | | 36 | | | | 76 | | |
Nomura Real Estate Holdings, Inc. | | | 2,500 | | | | 46 | | |
Nomura Real Estate Master Fund, Inc. REIT | | | 201 | | | | 265 | | |
Orix, Inc. J-REIT | | | 42 | | | | 70 | | |
Premier Investment Corp. REIT | | | 70 | | | | 80 | | |
Sumitomo Realty & Development Co., Ltd. | | | 13,200 | | | | 482 | | |
Tokyo Tatemono Co., Ltd. | | | 1,400 | | | | 14 | | |
United Urban Investment Corp. REIT | | | 154 | | | | 239 | | |
| | | | 5,177 | | |
Malta (0.0%) | |
BGP Holdings PLC (a)(d)(e) | | | 4,769,371 | | | | 5 | | |
Netherlands (1.2%) | |
Eurocommercial Properties N.V. CVA REIT | | | 8,473 | | | | 262 | | |
NSI NV REIT | | | 680 | | | | 26 | | |
| | | | 288 | | |
Norway (1.0%) | |
Entra ASA (c) | | | 14,749 | | | | 196 | | |
Norwegian Property ASA | | | 28,357 | | | | 35 | | |
| | | | 231 | | |
Singapore (1.7%) | |
APAC Realty Ltd. | | | 53,600 | | | | 17 | | |
Ascendas Real Estate Investment Trust REIT | | | 21,700 | | | | 41 | | |
CapitaLand Commercial Trust REIT | | | 91,360 | | | | 117 | | |
CapitaLand Mall Trust REIT | | | 34,800 | | | | 57 | | |
City Developments Ltd. | | | 4,200 | | | | 25 | | |
Mapletree Logistics Trust REIT | | | 33,500 | | | | 31 | | |
Suntec Real Estate Investment Trust REIT | | | 14,500 | | | | 19 | | |
UOL Group Ltd. | | | 17,413 | | | | 79 | | |
| | | | 386 | | |
The accompanying notes are an integral part of the financial statements.
8
Morgan Stanley Institutional Fund, Inc.
Annual Report — December 31, 2018
Portfolio of Investments (cont'd)
International Real Estate Portfolio
| | | Shares | | Value
(000) | |
Spain (2.4%) | |
Inmobiliaria Colonial Socimi SA REIT | | | 14,589 | | | $ | 136 | | |
Merlin Properties Socimi SA REIT | | | 33,475 | | | | 413 | | |
| | | | 549 | | |
Sweden (1.9%) | |
Atrium Ljungberg AB, Class B | | | 5,122 | | | | 88 | | |
Castellum AB | | | 4,984 | | | | 92 | | |
Hufvudstaden AB, Class A | | | 12,681 | | | | 196 | | |
Kungsleden AB | | | 10,459 | | | | 74 | | |
| | | | 450 | | |
Switzerland (0.8%) | |
PSP Swiss Property AG (Registered) | | | 1,865 | | | | 184 | | |
United Kingdom (10.6%) | |
British Land Co., PLC (The) REIT | | | 86,068 | | | | 585 | | |
Derwent London PLC REIT | | | 6,787 | | | | 246 | | |
Grainger PLC | | | 33,849 | | | | 91 | | |
Great Portland Estates PLC REIT | | | 22,934 | | | | 192 | | |
Hammerson PLC REIT | | | 25,899 | | | | 108 | | |
Intu Properties PLC REIT | | | 35,095 | | | | 51 | | |
Land Securities Group PLC REIT | | | 61,419 | | | | 630 | | |
LXB Retail Properties PLC (a) | | | 102,398 | | | | 15 | | |
Segro PLC REIT | | | 18,265 | | | | 137 | | |
Shaftesbury PLC REIT | | | 4,477 | | | | 47 | | |
St. Modwen Properties PLC | | | 27,194 | | | | 137 | | |
Urban & Civic PLC | | | 54,358 | | | | 181 | | |
Workspace Group PLC REIT | | | 5,028 | | | | 51 | | |
| | | | 2,471 | | |
Total Common Stocks (Cost $21,616) | | | 23,127 | | |
Short-Term Investment (0.2%) | |
Investment Company (0.2%) | |
Morgan Stanley Institutional Liquidity
Funds — Treasury Portfolio —
Institutional Class (See Note G)
(Cost $36) | | | 36,240 | | | | 36 | | |
Total Investments (99.7%) (Cost $21,652) (f)(g) | | | 23,163 | | |
Other Assets in Excess of Liabilities (0.3%) | | | 60 | | |
Net Assets (100.0%) | | $ | 23,223 | | |
Country assignments and aggregations are based generally on third party vendor classifications and information, and may be different from the assignments and aggregations under the policies set forth in the Fund's prospectus and/or statement of additional information relating to geographic classifications.
(a) Non-income producing security.
(b) Security trades on the Hong Kong exchange.
(c) 144A security — Certain conditions for public sale may exist. Unless otherwise noted, these securities are deemed to be liquid.
(d) At December 31, 2018, the Fund held a fair valued security valued at approximately $5,000, representing less than 0.05% of net assets. This security has been fair valued as determined in good faith under procedures established by and under the general supervision of the Company's Directors.
(e) Security has been deemed illiquid at December 31, 2018.
(f) The approximate fair value and percentage of net assets, $23,122,000 and 99.6%, respectively, represent the securities that have been fair valued under the fair valuation policy for international investments as described in Note A-1 within the Notes to the Financial Statements.
(g) At December 31, 2018, the aggregate cost for federal income tax purposes is approximately $25,249,000. The aggregate gross unrealized depreciation is approximately $2,087,000, which is the net unrealized depreciation.
CVA Certificaten Van Aandelen.
REIT Real Estate Investment Trust.
Portfolio Composition
Classification | | Percentage of
Total Investments | |
Diversified | | | 49.4 | % | |
Retail | | | 20.5 | | |
Office | | | 16.8 | | |
Residential | | | 8.9 | | |
Other* | | | 4.4 | | |
Total Investments | | | 100.0 | % | |
* Industries and/or investment types representing less than 5% of total investments.
The accompanying notes are an integral part of the financial statements.
9
Morgan Stanley Institutional Fund, Inc.
Annual Report — December 31, 2018
International Real Estate Portfolio
Statement of Assets and Liabilities | | December 31, 2018
(000) | |
Assets: | |
Investments in Securities of Unaffiliated Issuers, at Value (Cost $21,616) | | $ | 23,127 | | |
Investment in Security of Affiliated Issuer, at Value (Cost $36) | | | 36 | | |
Total Investments in Securities, at Value (Cost $21,652) | | | 23,163 | | |
Foreign Currency, at Value (Cost $2) | | | 2 | | |
Dividends Receivable | | | 60 | | |
Receivable for Investments Sold | | | 25 | | |
Tax Reclaim Receivable | | | 24 | | |
Due from Adviser | | | 22 | | |
Receivable for Fund Shares Sold | | | 5 | | |
Receivable from Affiliate | | | — | @ | |
Other Assets | | | 36 | | |
Total Assets | | | 23,337 | | |
Liabilities: | |
Payable for Professional Fees | | | 64 | | |
Payable for Custodian Fees | | | 16 | | |
Payable for Investments Purchased | | | 14 | | |
Payable for Transfer Agency Fees — Class I | | | 1 | | |
Payable for Transfer Agency Fees — Class A | | | 1 | | |
Payable for Transfer Agency Fees — Class L | | | 1 | | |
Payable for Transfer Agency Fees — Class C | | | 1 | | |
Payable for Transfer Agency Fees — Class IS | | | 1 | | |
Payable for Administration Fees | | | 2 | | |
Payable for Directors' Fees and Expenses | | | 2 | | |
Payable for Sub Transfer Agency Fees — Class I | | | 2 | | |
Payable for Sub Transfer Agency Fees — Class A | | | — | @ | |
Payable for Sub Transfer Agency Fees — Class C | | | — | @ | |
Payable for Shareholder Services Fees — Class A | | | — | @ | |
Payable for Distribution and Shareholder Services Fees — Class L | | | — | @ | |
Payable for Distribution and Shareholder Services Fees — Class C | | | — | @ | |
Other Liabilities | | | 9 | | |
Total Liabilities | | | 114 | | |
Net Assets | | $ | 23,223 | | |
Net Assets Consist of: | |
Paid-in-Capital | | $ | 249,217 | | |
Total Accumulated Loss | | | (225,994 | ) | |
Net Assets | | $ | 23,223 | | |
The accompanying notes are an integral part of the financial statements.
10
Morgan Stanley Institutional Fund, Inc.
Annual Report — December 31, 2018
International Real Estate Portfolio
Statement of Assets and Liabilities (cont'd) | | December 31, 2018
(000) | |
CLASS I: | |
Net Assets | | $ | 13,276 | | |
| Shares Outstanding $0.001 par value shares of beneficial interest (unlimited shares authorized) (not in 000's) | | | 781,228 | | |
Net Asset Value, Offering and Redemption Price Per Share | | $ | 16.99 | | |
CLASS A: | |
Net Assets | | $ | 1,422 | | |
| Shares Outstanding $0.001 par value shares of beneficial interest (unlimited shares authorized) (not in 000's) | | | 83,608 | | |
Net Asset Value, Redemption Price Per Share | | $ | 17.01 | | |
Maximum Sales Load | | | 5.25 | % | |
Maximum Sales Charge | | $ | 0.94 | | |
Maximum Offering Price Per Share | | $ | 17.95 | | |
CLASS L: | |
Net Assets | | $ | 10 | | |
| Shares Outstanding $0.001 par value shares of beneficial interest (unlimited shares authorized) (not in 000's) | | | 578 | | |
Net Asset Value, Offering and Redemption Price Per Share | | $ | 16.94 | | |
CLASS C: | |
Net Assets | | $ | 8 | | |
| Shares Outstanding $0.001 par value shares of beneficial interest (unlimited shares authorized) (not in 000's) | | | 470 | | |
Net Asset Value, Offering and Redemption Price Per Share | | $ | 16.91 | | |
CLASS IS: | |
Net Assets | | $ | 8,507 | | |
| Shares Outstanding $0.001 par value shares of beneficial interest (unlimited shares authorized) (not in 000's) | | | 500,947 | | |
Net Asset Value, Offering and Redemption Price Per Share | | $ | 16.98 | | |
@ Amount is less than $500.
The accompanying notes are an integral part of the financial statements.
11
Morgan Stanley Institutional Fund, Inc.
Annual Report — December 31, 2018
International Real Estate Portfolio
Statement of Operations | | Year Ended
December 31, 2018
(000) | |
Investment Income: | |
Dividends from Securities of Unaffiliated Issuers (Net of $91 of Foreign Taxes Withheld) | | $ | 1,044 | | |
Non-Cash Dividends from Securities of Unaffiliated Issuers | | | 59 | | |
Dividends from Security of Affiliated Issuer (Note G) | | | 3 | | |
Total Investment Income | | | 1,106 | | |
Expenses: | |
Advisory Fees (Note B) | | | 237 | | |
Professional Fees | | | 109 | | |
Registration Fees | | | 66 | | |
Custodian Fees (Note F) | | | 53 | | |
Administration Fees (Note C) | | | 24 | | |
Shareholder Reporting Fees | | | 15 | | |
Sub Transfer Agency Fees — Class I | | | 14 | | |
Sub Transfer Agency Fees — Class A | | | — | @ | |
Sub Transfer Agency Fees — Class C | | | — | @ | |
Transfer Agency Fees — Class I (Note E) | | | 3 | | |
Transfer Agency Fees — Class A (Note E) | | | 3 | | |
Transfer Agency Fees — Class L (Note E) | | | 2 | | |
Transfer Agency Fees — Class C (Note E) | | | 2 | | |
Transfer Agency Fees — Class IS (Note E) | | | 2 | | |
Shareholder Services Fees — Class A (Note D) | | | 4 | | |
Distribution and Shareholder Services Fees — Class L (Note D) | | | — | @ | |
Distribution and Shareholder Services Fees — Class C (Note D) | | | 1 | | |
Directors' Fees and Expenses | | | 5 | | |
Pricing Fees | | | 5 | | |
Other Expenses | | | 18 | | |
Total Expenses | | | 563 | | |
Waiver of Advisory Fees (Note B) | | | (244 | ) | |
Reimbursement of Class Specific Expenses — Class I (Note B) | | | (13 | ) | |
Reimbursement of Class Specific Expenses — Class A (Note B) | | | (1 | ) | |
Reimbursement of Class Specific Expenses — Class L (Note B) | | | (2 | ) | |
Reimbursement of Class Specific Expenses — Class C (Note B) | | | (2 | ) | |
Reimbursement of Class Specific Expenses — Class IS (Note B) | | | (2 | ) | |
Rebate from Morgan Stanley Affiliate (Note G) | | | (— | @) | |
Net Expenses | | | 299 | | |
Net Investment Income | | | 807 | | |
Realized Gain (Loss): | |
Investments Sold | | | 1,091 | | |
Foreign Currency Translation | | | (17 | ) | |
Net Realized Gain | | | 1,074 | | |
Change in Unrealized Appreciation (Depreciation): | |
Investments | | | (4,142 | ) | |
Foreign Currency Translation | | | (1 | ) | |
Net Change in Unrealized Appreciation (Depreciation) | | | (4,143 | ) | |
Net Realized Gain and Change in Unrealized Appreciation (Depreciation) | | | (3,069 | ) | |
Net Decrease in Net Assets Resulting from Operations | | $ | (2,262 | ) | |
@ Amount is less than $500.
The accompanying notes are an integral part of the financial statements.
12
Morgan Stanley Institutional Fund, Inc.
Annual Report — December 31, 2018
International Real Estate Portfolio
Statements of Changes in Net Assets | | Year Ended
December 31, 2018
(000) | | Year Ended
December 31, 2017
(000) | |
Increase (Decrease) in Net Assets: | |
Operations: | |
Net Investment Income | | $ | 807 | | | $ | 1,247 | | |
Net Realized Gain | | | 1,074 | | | | 1,276 | | |
Net Change in Unrealized Appreciation (Depreciation) | | | (4,143 | ) | | | 4,423 | | |
Net Increase (Decrease) in Net Assets Resulting from Operations | | | (2,262 | ) | | | 6,946 | | |
Dividends and Distributions to Shareholders: | |
Class I | | | (702 | ) | | | (1,752 | )* | |
Class A | | | (67 | ) | | | (125 | )* | |
Class L | | | — | @ | | | (1 | )* | |
Class C | | | (2 | ) | | | (8 | )* | |
Class IS | | | (452 | ) | | | (890 | )* | |
Total Dividends and Distributions to Shareholders | | | (1,223 | ) | | | (2,776 | ) | |
Capital Share Transactions:(1) | |
Class I: | |
Subscribed | | | 322 | | | | 2,617 | | |
Distributions Reinvested | | | 699 | | | | 1,727 | | |
Redeemed | | | (5,620 | ) | | | (13,538 | ) | |
Class A: | |
Subscribed | | | 9 | | | | 558 | | |
Distributions Reinvested | | | 59 | | | | 108 | | |
Redeemed | | | (359 | ) | | | (426 | ) | |
Class L: | |
Redeemed | | | — | | | | (44 | ) | |
Class C: | |
Subscribed | | | — | | | | 121 | | |
Distributions Reinvested | | | 2 | | | | 9 | | |
Redeemed | | | (117 | ) | | | (22 | ) | |
Class IS: | |
Subscribed | | | — | | | | 168 | | |
Distributions Reinvested | | | 452 | | | | 889 | | |
Redeemed | | | (2,000 | ) | | | (2,449 | ) | |
Net Decrease in Net Assets Resulting from Capital Share Transactions | | | (6,553 | ) | | | (10,282 | ) | |
Redemption Fees | | | — | | | | 1 | | |
Total Decrease in Net Assets | | | (10,038 | ) | | | (6,111 | ) | |
Net Assets: | |
Beginning of Period | | | 33,261 | | | | 39,372 | | |
End of Period | | $ | 23,223 | | | $ | 33,261 | † | |
The accompanying notes are an integral part of the financial statements.
13
Morgan Stanley Institutional Fund, Inc.
Annual Report — December 31, 2018
International Real Estate Portfolio
Statements of Changes in Net Assets (cont'd) | | Year Ended
December 31, 2018
(000) | | Year Ended
December 31, 2017
(000) | |
(1) Capital Share Transactions: | |
Class I: | |
Shares Subscribed | | | 17 | | | | 138 | | |
Shares Issued on Distributions Reinvested | | | 38 | | | | 93 | | |
Shares Redeemed | | | (299 | ) | | | (701 | ) | |
Net Decrease in Class I Shares Outstanding | | | (244 | ) | | | (470 | ) | |
Class A: | |
Shares Subscribed | | | 1 | | | | 29 | | |
Shares Issued on Distributions Reinvested | | | 3 | | | | 6 | | |
Shares Redeemed | | | (19 | ) | | | (22 | ) | |
Net Increase (Decrease) in Class A Shares Outstanding | | | (15 | ) | | | 13 | | |
Class L: | |
Shares Redeemed | | | — | | | | (2 | ) | |
Class C: | |
Shares Subscribed | | | — | | | | 6 | | |
Shares Issued on Distributions Reinvested | | | — | @@ | | | — | @@ | |
Shares Redeemed | | | (6 | ) | | | (1 | ) | |
Net Increase (Decrease) in Class C Shares Outstanding | | | (6 | ) | | | 5 | | |
Class IS: | |
Shares Subscribed | | | — | | | | 9 | | |
Shares Issued on Distributions Reinvested | | | 25 | | | | 48 | | |
Shares Redeemed | | | (111 | ) | | | (131 | ) | |
Net Decrease in Class IS Shares Outstanding | | | (86 | ) | | | (74 | ) | |
@ Amount is less than $500.
@@ Amount is less than 500 shares.
The following information was previously reported in the December 31, 2017 financial statements. The distribution information for the year ended December 31, 2017 presented on the Statements of Changes in Net Assets is presented for comparative purposes to the December 31, 2018 financial statements, which conform to the SEC Final Rule on Disclosure Update and Simplification which was effective November 5, 2018.
* Dividends and Distributions to Shareholders for the year ended December 31, 2017 were as follows:
Class I: | |
Net Investment Income | | $ | (1,752 | ) | |
Class A: | |
Net Investment Income | | $ | (125 | ) | |
Class L: | |
Net Investment Income | | $ | (1 | ) | |
Class C: | |
Net Investment Income | | $ | (8 | ) | |
Class IS: | |
Net Investment Income | | $ | (890 | ) | |
† Distributions in Excess of Net Investment Income for the year ended December 31, 2017 was $(639).
The accompanying notes are an integral part of the financial statements.
14
Morgan Stanley Institutional Fund, Inc.
Annual Report — December 31, 2018
Financial Highlights
International Real Estate Portfolio
| | | Class I | |
| | | Year Ended December 31, | |
Selected Per Share Data and Ratios | | 2018 | | 2017 | | 2016(1) | | 2015 | | 2014 | |
Net Asset Value, Beginning of Period | | $ | 19.36 | | | $ | 17.53 | | | $ | 18.72 | | | $ | 19.84 | | | $ | 19.99 | | |
Income (Loss) from Investment Operations: | |
Net Investment Income(2) | | | 0.52 | | | | 0.59 | | | | 0.46 | | | | 0.37 | | | | 0.39 | | |
Net Realized and Unrealized Gain (Loss) | | | (2.05 | ) | | | 2.69 | | | | (0.73 | ) | | | (1.00 | ) | | | (0.07 | ) | |
Total from Investment Operations | | | (1.53 | ) | | | 3.28 | | | | (0.27 | ) | | | (0.63 | ) | | | 0.32 | | |
Distributions from and/or in Excess of: | |
Net Investment Income | | | (0.84 | ) | | | (1.45 | ) | | | (0.92 | ) | | | (0.49 | ) | | | (0.47 | ) | |
Redemption Fees | | | — | | | | 0.00 | (3) | | | 0.00 | (3) | | | 0.00 | (3) | | | 0.00 | (3) | |
Net Asset Value, End of Period | | $ | 16.99 | | | $ | 19.36 | | | $ | 17.53 | | | $ | 18.72 | | | $ | 19.84 | | |
Total Return(4) | | | (8.14 | )% | | | 19.13 | % | | | (1.38 | )% | | | (3.29 | )% | | | 1.61 | % | |
Ratios and Supplemental Data: | |
Net Assets, End of Period (Thousands) | | $ | 13,276 | | | $ | 19,846 | | | $ | 26,213 | | | $ | 67,459 | | | $ | 94,269 | | |
Ratio of Expenses to Average Net Assets(7) | | | 1.00 | %(5) | | | 1.00 | %(5) | | | 1.00 | %(5) | | | 1.00 | %(5) | | | 1.00 | %(5) | |
Ratio of Expenses to Average Net Assets Excluding Non Operating Expenses | | | N/A | | | | 1.00 | %(5) | | | N/A | | | | N/A | | | | N/A | | |
Ratio of Net Investment Income to Average Net Assets(7) | | | 2.74 | %(5) | | | 3.13 | %(5) | | | 2.47 | %(5) | | | 1.84 | %(5) | | | 1.91 | %(5) | |
Ratio of Rebate from Morgan Stanley Affiliates to Average Net Assets | | | 0.00 | %(6) | | | 0.00 | %(6) | | | 0.00 | %(6) | | | 0.00 | %(6) | | | 0.00 | %(6) | |
Portfolio Turnover Rate | | | 28 | % | | | 23 | % | | | 21 | % | | | 37 | % | | | 59 | % | |
(7) Supplemental Information on the Ratios to Average Net Assets: | |
Ratios Before Expense Limitation: | |
Expenses to Average Net Assets | | | 1.90 | % | | | 1.76 | % | | | 1.37 | % | | | 1.29 | % | | | 1.16 | % | |
Net Investment Income to Average Net Assets | | | 1.84 | % | | | 2.37 | % | | | 2.10 | % | | | 1.55 | % | | | 1.75 | % | |
(1) Reflects prior period Custodian out-of-pocket expenses that were reimbursed in September 2016. The amount of the reimbursement was immaterial on a per share basis and did not impact the total return of Class I shares. The Ratio of Expenses to Average Net Assets and the Ratio of Net Investment Income to Average Net Assets would be unchanged as the reimbursement of Custodian fees was offset against expense waivers/reimbursements with no impact to net expenses or net investment income.
(2) Per share amount is based on average shares outstanding.
(3) Amount is less than $0.005 per share.
(4) Calculated based on the net asset value as of the last business day of the period.
(5) The Ratios of Expenses and Net Investment Income reflect the rebate of certain Fund expenses in connection with the investments in Morgan Stanley affiliates during the period. The effect of the rebate on the ratios is disclosed in the above table as "Ratio of Rebate from Morgan Stanley Affiliates to Average Net Assets."
(6) Amount is less than 0.005%.
The accompanying notes are an integral part of the financial statements.
15
Morgan Stanley Institutional Fund, Inc.
Annual Report — December 31, 2018
Financial Highlights
International Real Estate Portfolio
| | | Class A | |
| | | Year Ended December 31, | |
Selected Per Share Data and Ratios | | 2018 | | 2017 | | 2016(1) | | 2015 | | 2014 | |
Net Asset Value, Beginning of Period | | $ | 19.37 | | | $ | 17.54 | | | $ | 18.73 | | | $ | 19.84 | | | $ | 19.98 | | |
Income (Loss) from Investment Operations: | |
Net Investment Income(2) | | | 0.45 | | | | 0.51 | | | | 0.39 | | | | 0.30 | | | | 0.31 | | |
Net Realized and Unrealized Gain (Loss) | | | (2.04 | ) | | | 2.71 | | | | (0.73 | ) | | | (1.00 | ) | | | (0.06 | ) | |
Total from Investment Operations | | | (1.59 | ) | | | 3.22 | | | | (0.34 | ) | | | (0.70 | ) | | | 0.25 | | |
Distributions from and/or in Excess of: | |
Net Investment Income | | | (0.77 | ) | | | (1.39 | ) | | | (0.85 | ) | | | (0.41 | ) | | | (0.39 | ) | |
Redemption Fees | | | — | | | | 0.00 | (3) | | | 0.00 | (3) | | | 0.00 | (3) | | | 0.00 | (3) | |
Net Asset Value, End of Period | | $ | 17.01 | | | $ | 19.37 | | | $ | 17.54 | | | $ | 18.73 | | | $ | 19.84 | | |
Total Return(4) | | | (8.45 | )% | | | 18.78 | % | | | (1.78 | )% | | | (3.61 | )% | | | 1.27 | % | |
Ratios and Supplemental Data: | |
Net Assets, End of Period (Thousands) | | $ | 1,422 | | | $ | 1,917 | | | $ | 1,512 | | | $ | 2,308 | | | $ | 2,792 | | |
Ratio of Expenses to Average Net Assets(7) | | | 1.35 | %(5) | | | 1.35 | %(5) | | | 1.35 | %(5) | | | 1.35 | %(5) | | | 1.35 | %(5) | |
Ratio of Expenses to Average Net Assets Excluding Non Operating Expenses | | | N/A | | | | 1.35 | %(5) | | | N/A | | | | N/A | | | | N/A | | |
Ratio of Net Investment Income to Average Net Assets(7) | | | 2.40 | %(5) | | | 2.71 | %(5) | | | 2.10 | %(5) | | | 1.48 | %(5) | | | 1.55 | %(5) | |
Ratio of Rebate from Morgan Stanley Affiliates to Average Net Assets | | | 0.00 | %(6) | | | 0.00 | %(6) | | | 0.00 | %(6) | | | 0.00 | %(6) | | | 0.00 | %(6) | |
Portfolio Turnover Rate | | | 28 | % | | | 23 | % | | | 21 | % | | | 37 | % | | | 59 | % | |
(7) Supplemental Information on the Ratios to Average Net Assets: | |
Ratios Before Expense Limitation: | |
Expenses to Average Net Assets | | | 2.22 | % | | | 2.23 | % | | | 1.85 | % | | | 1.70 | % | | | 1.58 | % | |
Net Investment Income to Average Net Assets | | | 1.53 | % | | | 1.83 | % | | | 1.60 | % | | | 1.13 | % | | | 1.32 | % | |
(1) Reflects prior period Custodian out-of-pocket expenses that were reimbursed in September 2016. The amount of the reimbursement was immaterial on a per share basis and did not impact the total return of Class A shares. The Ratio of Expenses to Average Net Assets and the Ratio of Net Investment Income to Average Net Assets would be unchanged as the reimbursement of Custodian fees was offset against expense waivers/reimbursements with no impact to net expenses or net investment income.
(2) Per share amount is based on average shares outstanding.
(3) Amount is less than $0.005 per share.
(4) Calculated based on the net asset value which does not reflect sales charges, if applicable, as of the last business day of the period.
(5) The Ratios of Expenses and Net Investment Income reflect the rebate of certain Fund expenses in connection with the investments in Morgan Stanley affiliates during the period. The effect of the rebate on the ratios is disclosed in the above table as "Ratio of Rebate from Morgan Stanley Affiliates to Average Net Assets."
(6) Amount is less than 0.005%.
The accompanying notes are an integral part of the financial statements.
16
Morgan Stanley Institutional Fund, Inc.
Annual Report — December 31, 2018
Financial Highlights
International Real Estate Portfolio
| | | Class L | |
| | | Year Ended December 31, | |
Selected Per Share Data and Ratios | | 2018 | | 2017 | | 2016(1) | | 2015 | | 2014 | |
Net Asset Value, Beginning of Period | | $ | 19.29 | | | $ | 17.42 | | | $ | 18.61 | | | $ | 19.69 | | | $ | 19.86 | | |
Income (Loss) from Investment Operations: | |
Net Investment Income(2) | | | 0.36 | | | | 0.50 | | | | 0.29 | | | | 0.18 | | | | 0.21 | | |
Net Realized and Unrealized Gain (Loss) | | | (2.03 | ) | | | 2.59 | | | | (0.71 | ) | | | (0.97 | ) | | | (0.06 | ) | |
Total from Investment Operations | | | (1.67 | ) | | | 3.09 | | | | (0.42 | ) | | | (0.79 | ) | | | 0.15 | | |
Distributions from and/or in Excess of: | |
Net Investment Income | | | (0.68 | ) | | | (1.22 | ) | | | (0.77 | ) | | | (0.29 | ) | | | (0.32 | ) | |
Redemption Fees | | | — | | | | 0.00 | (3) | | | 0.00 | (3) | | | 0.00 | (3) | | | 0.00 | (3) | |
Net Asset Value, End of Period | | $ | 16.94 | | | $ | 19.29 | | | $ | 17.42 | | | $ | 18.61 | | | $ | 19.69 | | |
Total Return(4) | | | (8.88 | )% | | | 18.14 | % | | | (2.23 | )% | | | (4.11 | )% | | | 0.75 | % | |
Ratios and Supplemental Data: | |
Net Assets, End of Period (Thousands) | | $ | 10 | | | $ | 11 | | | $ | 53 | | | $ | 55 | | | $ | 95 | | |
Ratio of Expenses to Average Net Assets(7) | | | 1.85 | %(5) | | | 1.85 | %(5) | | | 1.85 | %(5) | | | 1.85 | %(5) | | | 1.85 | %(5) | |
Ratio of Expenses to Average Net Assets Excluding Non Operating Expenses | | | N/A | | | | 1.85 | %(5) | | | N/A | | | | N/A | | | | N/A | | |
Ratio of Net Investment Income to Average Net Assets(7) | | | 1.90 | %(5) | | | 2.70 | %(5) | | | 1.58 | %(5) | | | 0.90 | %(5) | | | 1.05 | %(5) | |
Ratio of Rebate from Morgan Stanley Affiliates to Average Net Assets | | | 0.00 | %(6) | | | 0.00 | %(6) | | | 0.00 | %(6) | | | 0.00 | %(6) | | | 0.00 | %(6) | |
Portfolio Turnover Rate | | | 28 | % | | | 23 | % | | | 21 | % | | | 37 | % | | | 59 | % | |
(7) Supplemental Information on the Ratios to Average Net Assets: | |
Ratios Before Expense Limitation: | |
Expenses to Average Net Assets | | | 20.23 | % | | | 14.81 | % | | | 5.51 | % | | | 4.58 | % | | | 3.90 | % | |
Net Investment Loss to Average Net Assets | | | (16.48 | )% | | | (10.26 | )% | | | (2.08 | )% | | | (1.83 | )% | | | (1.00 | )% | |
(1) Reflects prior period Custodian out-of-pocket expenses that were reimbursed in September 2016. The amount of the reimbursement was immaterial on a per share basis and did not impact the total return of Class L shares. The Ratio of Expenses to Average Net Assets and the Ratio of Net Investment Income to Average Net Assets would be unchanged as the reimbursement of Custodian fees was offset against expense waivers/reimbursements with no impact to net expenses or net investment income.
(2) Per share amount is based on average shares outstanding.
(3) Amount is less than $0.005 per share.
(4) Calculated based on the net asset value as of the last business day of the period.
(5) The Ratios of Expenses and Net Investment Income reflect the rebate of certain Fund expenses in connection with the investments in Morgan Stanley affiliates during the period. The effect of the rebate on the ratios is disclosed in the above table as "Ratio of Rebate from Morgan Stanley Affiliates to Average Net Assets."
(6) Amount is less than 0.005%.
The accompanying notes are an integral part of the financial statements.
17
Morgan Stanley Institutional Fund, Inc.
Annual Report — December 31, 2018
Financial Highlights
International Real Estate Portfolio
| | | Class C | |
| | | Year Ended December 31, | | Period from
April 30, 2015(2) to | |
Selected Per Share Data and Ratios | | 2018 | | 2017 | | 2016(1) | | December 31, 2015 | |
Net Asset Value, Beginning of Period | | $ | 19.00 | | | $ | 17.32 | | | $ | 18.50 | | | $ | 21.28 | | |
Income (Loss) from Investment Operations: | |
Net Investment Income(3) | | | 0.35 | | | | 0.30 | | | | 0.25 | | | | 0.06 | | |
Net Realized and Unrealized Gain (Loss) | | | (2.04 | ) | | | 2.71 | | | | (0.71 | ) | | | (2.48 | ) | |
Total from Investment Operations | | | (1.69 | ) | | | 3.01 | | | | (0.46 | ) | | | (2.42 | ) | |
Distributions from and/or in Excess of: | |
Net Investment Income | | | (0.40 | ) | | | (1.33 | ) | | | (0.72 | ) | | | (0.36 | ) | |
Redemption Fees | | | — | | | | 0.00 | (4) | | | 0.00 | (4) | | | 0.00 | (4) | |
Net Asset Value, End of Period | | $ | 16.91 | | | $ | 19.00 | | | $ | 17.32 | | | $ | 18.50 | | |
Total Return(5) | | | (9.11 | )% | | | 17.78 | % | | | (2.44 | )% | | | (11.47 | )%(8) | |
Ratios and Supplemental Data: | |
Net Assets, End of Period (Thousands) | | $ | 8 | | | $ | 128 | | | $ | 21 | | | $ | 22 | | |
Ratio of Expenses to Average Net Assets(10) | | | 2.10 | %(6) | | | 2.10 | %(6) | | | 2.10 | %(6) | | | 2.10 | %(6)(9) | |
Ratio of Expenses to Average Net Assets Excluding Non Operating Expenses | | | N/A | | | | 2.10 | %(6) | | | N/A | | | | N/A | | |
Ratio of Net Investment Income to Average Net Assets(10) | | | 1.84 | %(6) | | | 1.58 | %(6) | | | 1.33 | %(6) | | | 0.45 | %(6)(9) | |
Ratio of Rebate from Morgan Stanley Affiliates to Average Net Assets | | | 0.00 | %(7) | | | 0.00 | %(7) | | | 0.00 | %(7) | | | 0.00 | %(7)(9) | |
Portfolio Turnover Rate | | | 28 | % | | | 23 | % | | | 21 | % | | | 37 | % | |
(10) Supplemental Information on the Ratios to Average Net Assets: | |
Ratios Before Expense Limitation: | |
Expenses to Average Net Assets | | | 5.51 | % | | | 5.62 | % | | | 12.39 | % | | | 10.98 | %(9) | |
Net Investment Loss to Average Net Assets | | | (1.57 | )% | | | (1.94 | )% | | | (8.96 | )% | | | (8.43 | )%(9) | |
(1) Reflects prior period Custodian out-of-pocket expenses that were reimbursed in September 2016. The amount of the reimbursement was immaterial on a per share basis and did not impact the total return of Class C shares. The Ratio of Expenses to Average Net Assets and the Ratio of Net Investment Income to Average Net Assets would be unchanged as the reimbursement of Custodian fees was offset against expense waivers/reimbursements with no impact to net expenses or net investment income.
(2) Commencement of Offering.
(3) Per share amount is based on average shares outstanding.
(4) Amount is less than $0.005 per share.
(5) Calculated based on the net asset value which does not reflect sales charges, if applicable, as of the last business day of the period.
(6) The Ratios of Expenses and Net Investment Income reflect the rebate of certain Fund expenses in connection with the investments in Morgan Stanley affiliates during the period. The effect of the rebate on the ratios is disclosed in the above table as "Ratio of Rebate from Morgan Stanley Affiliates to Average Net Assets."
(7) Amount is less than 0.005%.
(8) Not annualized.
(9) Annualized.
The accompanying notes are an integral part of the financial statements.
18
Morgan Stanley Institutional Fund, Inc.
Annual Report — December 31, 2018
Financial Highlights
International Real Estate Portfolio
| | | Class IS | |
| | | Year Ended December 31, | |
Selected Per Share Data and Ratios | | 2018 | | 2017 | | 2016(1) | | 2015 | | 2014 | |
Net Asset Value, Beginning of Period | | $ | 19.35 | | | $ | 17.52 | | | $ | 18.71 | | | $ | 19.83 | | | $ | 19.99 | | |
Income (Loss) from Investment Operations: | |
Net Investment Income(2) | | | 0.52 | | | | 0.59 | | | | 0.47 | | | | 0.37 | | | | 0.23 | | |
Net Realized and Unrealized Gain (Loss) | | | (2.04 | ) | | | 2.70 | | | | (0.73 | ) | | | (1.00 | ) | | | 0.09 | | |
Total from Investment Operations | | | (1.52 | ) | | | 3.29 | | | | (0.26 | ) | | | (0.63 | ) | | | 0.32 | | |
Distributions from and/or in Excess of: | |
Net Investment Income | | | (0.85 | ) | | | (1.46 | ) | | | (0.93 | ) | | | (0.49 | ) | | | (0.48 | ) | |
Redemption Fees | | | — | | | | 0.00 | (3) | | | 0.00 | (3) | | | 0.00 | (3) | | | 0.00 | (3) | |
Net Asset Value, End of Period | | $ | 16.98 | | | $ | 19.35 | | | $ | 17.52 | | | $ | 18.71 | | | $ | 19.83 | | |
Total Return(4) | | | (8.11 | )% | | | 19.19 | % | | | (1.33 | )% | | | (3.26 | )% | | | 1.60 | % | |
Ratios and Supplemental Data: | |
Net Assets, End of Period (Thousands) | | $ | 8,507 | | | $ | 11,359 | | | $ | 11,573 | | | $ | 20,944 | | | $ | 2,557 | | |
Ratio of Expenses to Average Net Assets(7) | | | 0.97 | %(5) | | | 0.97 | %(5) | | | 0.97 | %(5) | | | 0.97 | %(5) | | | 0.97 | %(5) | |
Ratio of Expenses to Average Net Assets Excluding Non Operating Expenses | | | N/A | | | | 0.97 | %(5) | | | N/A | | | | N/A | | | | N/A | | |
Ratio of Net Investment Income to Average Net Assets(7) | | | 2.76 | %(5) | | | 3.11 | %(5) | | | 2.52 | %(5) | | | 1.86 | %(5) | | | 1.14 | %(5) | |
Ratio of Rebate from Morgan Stanley Affiliates to Average Net Assets | | | 0.00 | %(6) | | | 0.00 | %(6) | | | 0.00 | %(6) | | | 0.00 | %(6) | | | 0.00 | %(6) | |
Portfolio Turnover Rate | | | 28 | % | | | 23 | % | | | 21 | % | | | 37 | % | | | 59 | % | |
(7) Supplemental Information on the Ratios to Average Net Assets: | |
Ratios Before Expense Limitation: | |
Expenses to Average Net Assets | | | 1.81 | % | | | 1.70 | % | | | 1.33 | % | | | 1.30 | % | | | 1.13 | % | |
Net Investment Income to Average Net Assets | | | 1.92 | % | | | 2.38 | % | | | 2.16 | % | | | 1.53 | % | | | 0.98 | % | |
(1) Reflects prior period Custodian out-of-pocket expenses that were reimbursed in September 2016. The amount of the reimbursement was immaterial on a per share basis and did not impact the total return of Class IS shares. The Ratio of Expenses to Average Net Assets and the Ratio of Net Investment Income to Average Net Assets would be unchanged as the reimbursement of Custodian fees was offset against expense waivers/reimbursements with no impact to net expenses or net investment income.
(2) Per share amount is based on average shares outstanding.
(3) Amount is less than $0.005 per share.
(4) Calculated based on the net asset value as of the last business day of the period.
(5) The Ratios of Expenses and Net Investment Income reflect the rebate of certain Fund expenses in connection with the investments in Morgan Stanley affiliates during the period. The effect of the rebate on the ratios is disclosed in the above table as "Ratio of Rebate from Morgan Stanley Affiliates to Average Net Assets."
(6) Amount is less than 0.005%.
The accompanying notes are an integral part of the financial statements.
19
Morgan Stanley Institutional Fund, Inc.
Annual Report — December 31, 2018
Notes to Financial Statements
Morgan Stanley Institutional Fund, Inc. (the "Company") is registered under the Investment Company Act of 1940, as amended (the "Act"), as an open-end management investment company. The Company is comprised of thirty separate, active, diversified and non-diversified funds (individually referred to as a "Fund", collectively as the "Funds"). The Company applies investment company accounting and reporting guidance.
The accompanying financial statements relate to the International Real Estate Portfolio. The Fund seeks to provide current income and long-term capital appreciation.
The Fund offers five classes of shares — Class I, Class A, Class L, Class C and Class IS. On April 30, 2015, the Fund suspended offering of Class L shares. Existing Class L shareholders may invest through reinvestment of dividends and distributions.
A. Significant Accounting Policies: The following significant accounting policies are in conformity with U.S. generally accepted accounting principles ("GAAP"). Such policies are consistently followed by the Company in the preparation of its financial statements. GAAP may require management to make estimates and assumptions that affect the reported amounts and disclosures in the financial statements. Actual results may differ from those estimates.
In August 2018, the Financial Accounting Standards Board ("FASB") issued Accounting Standards Update ("ASU") 2018-13, Fair Value Measurement (Topic 820) — Disclosures Framework — Changes to Disclosure Requirements of Fair Value Measurement ("ASU 2018-13") which introduces new fair value disclosure requirements as well as eliminates and modifies certain existing fair value disclosure requirements. ASU 2018-13 would be effective for fiscal years beginning after December 15, 2019 and for interim periods within those fiscal years; however, management has elected to early adopt ASU 2018-13 effective with the current reporting period as permitted by the standard. The impact of the Fund's adoption was limited to changes in the Fund's financial statement disclosures regarding fair value, primarily those disclosures related to transfers between levels of the fair value hierarchy and disclosure of the range and weighted average used to develop significant unobservable inputs for Level 3 fair value measurements, when applicable.
1. Security Valuation: (1) An equity portfolio security listed or traded on an exchange is valued at its latest reported sales price (or at the exchange official closing price if such exchange reports an official closing price), and if
there were no sales on a given day and if there is no official exchange closing price for that day, the security is valued at the mean between the last reported bid and asked prices if such bid and asked prices are available on the relevant exchanges. Listed equity securities not traded on the valuation date with no reported bid and asked prices available on the exchange are valued at the mean between the current bid and asked prices obtained from one or more reputable brokers or dealers. In cases where a security is traded on more than one exchange, the security is valued on the exchange designated as the primary market; (2) all other equity portfolio securities for which over-the-counter ("OTC") market quotations are readily available are valued at the latest reported sales price (or at the market official closing price if such market reports an official closing price), and if there was no trading in the security on a given day and if there is no official closing price from relevant markets for that day, the security is valued at the mean between the last reported bid and asked prices if such bid and asked prices are available on the relevant markets. An unlisted equity security that does not trade on the valuation date and for which bid and asked prices from the relevant markets are unavailable is valued at the mean between the current bid and asked prices obtained from one or more reputable brokers or dealers; (3) certain portfolio securities may be valued by an outside pricing service/vendor approved by the Company's Board of Directors (the "Directors"). The pricing service/vendor may employ a pricing model that takes into account, among other things, bids, yield spreads and/or other market data and specific security characteristics. Alternatively, if a valuation is not available from an outside pricing service/vendor, and the security trades on an exchange, the security may be valued at its latest reported sale price (or at the exchange official closing price if such exchange reports an official closing price), prior to the time when assets are valued. If there are no sales on a given day and if there is no official exchange closing price for that day, the security is valued at the mean between the last reported bid and asked prices if such bid and asked prices are available in the relevant exchanges; (4) when market quotations are not readily available, including circumstances under which Morgan Stanley Investment Management Inc. (the "Adviser") or Morgan Stanley Investment Management Limited ("MSIM Limited") and Morgan Stanley Investment Management Company ("MSIM Company") (together, the "Sub-Advisers"), each a wholly-owned subsidiary of
20
Morgan Stanley Institutional Fund, Inc.
Annual Report — December 31, 2018
Notes to Financial Statements (cont'd)
Morgan Stanley, determine that the closing price, last sale price or the mean between the last reported bid and asked prices are not reflective of a security's market value, portfolio securities are valued at their fair value as determined in good faith under procedures established by and under the general supervision of the Directors. Occasionally, developments affecting the closing prices of securities and other assets may occur between the times at which valuations of such securities are determined (that is, close of the foreign market on which the securities trade) and the close of business of the New York Stock Exchange ("NYSE"). If developments occur during such periods that are expected to materially affect the value of such securities, such valuations may be adjusted to reflect the estimated fair value of such securities as of the close of the NYSE, as determined in good faith by the Directors or by the Adviser using a pricing service and/or procedures approved by the Directors; (5) quotations of foreign portfolio securities, other assets and liabilities and forward contracts stated in foreign currency are translated into U.S. dollar equivalents at the prevailing market rates prior to the close of the NYSE; and (6) investments in mutual funds, including the Morgan Stanley Institutional Liquidity Funds, are valued at the net asset value ("NAV") as of the close of each business day.
The Directors have responsibility for determining in good faith the fair value of the investments, and the Directors may appoint others, such as the Company's Adviser or a valuation committee, to assist the Directors in determining fair value and to make the actual calculations pursuant to the fair valuation methodologies previously approved by the Directors. Under procedures approved by the Directors, the Company's Adviser has formed a Valuation Committee whose members are approved by the Directors. The Valuation Committee provides administration and oversight of the Company's valuation policies and procedures, which are reviewed at least annually by the Directors. These procedures allow the Company to utilize independent pricing services, quotations from securities and financial instrument dealers and other market sources to determine fair value.
The Fund invests a significant portion of its assets in securities of real estate investment trusts ("REITs"). The market's perception of prospective declines in private real estate values and other financial assets may result in increased volatility of market prices that can negatively impact the valuation of certain issuers held by the Fund.
2. Fair Value Measurement: FASB Accounting Standards CodificationTM ("ASC") 820, "Fair Value Measurement" ("ASC 820"), defines fair value as the value that the Fund would receive to sell an investment or pay to transfer a liability in a timely transaction with an independent buyer in the principal market, or in the absence of a principal market, the most advantageous market for the investment or liability. ASC 820 establishes a three-tier hierarchy to distinguish between (1) inputs that reflect the assumptions market participants would use in valuing an asset or liability developed based on market data obtained from sources independent of the reporting entity (observable inputs) and (2) inputs that reflect the reporting entity's own assumptions about the assumptions market participants would use in valuing an asset or liability developed based on the best information available in the circumstances (unobservable inputs) and to establish classification of fair value measurements for disclosure purposes. Various inputs are used in determining the value of the Fund's investments. The inputs are summarized in the three broad levels listed below:
• Level 1 – unadjusted quoted prices in active markets for identical investments
• Level 2 – other significant observable inputs (including quoted prices for similar investments, interest rates, prepayment speeds, credit risk, etc.)
• Level 3 – significant unobservable inputs including the Fund's own assumptions in determining the fair value of investments. Factors considered in making this determination may include, but are not limited to, information obtained by contacting the issuer, analysts, or the appropriate stock exchange (for exchange-traded securities), analysis of the issuer's financial statements or other available documents and, if necessary, available information concerning other securities in similar circumstances
The inputs or methodology used for valuing securities are not necessarily an indication of the risk associated with investing in those securities and the determination of the significance of a particular input to the fair value measurement in its entirety requires judgment and considers factors specific to each security.
21
Morgan Stanley Institutional Fund, Inc.
Annual Report — December 31, 2018
Notes to Financial Statements (cont'd)
The following is a summary of the inputs used to value the Fund's investments as of December 31, 2018:
Investment Type | | Level 1
Unadjusted
quoted
prices
(000) | | Level 2
Other
significant
observable
inputs
(000) | | Level 3
Significant
unobservable
inputs
(000) | | Total
(000) | |
Assets: | |
Common Stocks | |
Diversified | | $ | — | | | $ | 11,452 | | | $ | — | | | $ | 11,452 | | |
Industrial | | | — | | | | 761 | | | | — | | | | 761 | | |
Industrial/Office Mixed | | | — | | | | 115 | | | | — | | | | 115 | | |
Lodging/Resorts | | | — | | | | 99 | | | | — | | | | 99 | | |
Office | | | — | | | | 3,887 | | | | — | | | | 3,887 | | |
Residential | | | — | | | | 2,067 | | | | 5 | | | | 2,072 | | |
Retail | | | — | | | | 4,741 | | | | — | | | | 4,741 | | |
Total Common Stocks | | | — | | | | 23,122 | | | | 5 | | | | 23,127 | | |
Short-Term Investment | |
Investment Company | | | 36 | | | | — | | | | — | | | | 36 | | |
Total Assets | | $ | 36 | | | $ | 23,122 | | | $ | 5 | | | $ | 23,163 | | |
Transfers between investment levels may occur as the markets fluctuate and/or the availability of data used in an investment's valuation changes.
Following is a reconciliation of investments in which significant unobservable inputs (Level 3) were used in determining fair value:
| | | Common
Stock
(000) | |
Beginning Balance | | $ | 6 | | |
Purchases | | | — | | |
Sales | | | — | | |
Amortization of discount | | | — | | |
Transfers in | | | — | | |
Transfers out | | | — | | |
Corporate actions | | | — | | |
Change in unrealized appreciation (depreciation) | | | (1 | ) | |
Realized gains (losses) | | | — | | |
Ending Balance | | $ | 5 | | |
Net change in unrealized appreciation (depreciation) from investments
still held as of December 31, 2018 | | $ | (1 | ) | |
The following table presents additional information about valuation techniques and inputs used for investments that are measured at fair value and categorized within Level 3 as of December 31, 2018. Various valuation techniques were used in the valuation of certain investments and weighted based on the level of significance. The Fund calculated the weighted averages of the unobservable inputs relative to each investment's fair value as of December 31, 2018.
| | | Fair Value at
December 31, 2018
(000) | | Valuation
Technique | | Unobservable
Input | | Amount* | | Impact to
Valuation from an
Increase in Input†† | |
Common Stock | |
| | $ | 5
| | | Market Transaction
Method | | Transaction Valuation | | $ | 0.001 | | | Increase | |
| |
| |
| | Discount for Lack of
Marketability | | | 50.0 | % | | Decrease | |
* Amount is indicative of the weighted average.
†† Represents the expected directional change in the fair value of the Level 3 investments that would result from an increase in the corresponding input. A decrease to the unobservable input would have the opposite effect. Significant changes in these inputs could result in significantly higher or lower fair value measurements.
3. Foreign Currency Translation and Foreign Investments: The books and records of the Fund are maintained in U.S. dollars. Foreign currency amounts are translated into U.S. dollars as follows:
– investments, other assets and liabilities at the prevailing rate of exchange on the valuation date;
– investment transactions and investment income at the prevailing rates of exchange on the dates of such transactions.
Although the net assets of the Fund are presented at the foreign exchange rates and market values at the close of
the period, the Fund does not isolate that portion of the results of operations arising as a result of changes in the foreign exchange rates from the fluctuations arising from changes in the market prices of securities held at period end. Similarly, the Fund does not isolate the effect of changes in foreign exchange rates from the fluctuations arising from changes in the market prices of securities sold during the period. Accordingly, realized and unrealized foreign currency gains (losses) on investments in securities are included in the reported net realized and unrealized gains (losses) on investment transactions and balances. However, pursuant to
22
Morgan Stanley Institutional Fund, Inc.
Annual Report — December 31, 2018
Notes to Financial Statements (cont'd)
U.S. federal income tax regulations, gains and losses from certain foreign currency transactions and the foreign currency portion of gains and losses realized on sales and maturities of foreign denominated debt securities are treated as ordinary income for U.S. federal income tax purposes.
Net realized gains (losses) on foreign currency transactions represent net foreign exchange gains (losses) from foreign currency forward exchange contracts, disposition of foreign currencies, currency gains (losses) realized between the trade and settlement dates on securities transactions, and the difference between the amount of investment income and foreign withholding taxes recorded on the Fund's books and the U.S. dollar equivalent amounts actually received or paid. Net unrealized currency gains (losses) from valuing foreign currency denominated assets and liabilities at period end exchange rates are reflected as a component of unrealized appreciation (depreciation) in the Statement of Assets and Liabilities. The change in unrealized currency gains (losses) on foreign currency translations for the period is reflected in the Statement of Operations.
Foreign security and currency transactions may involve certain considerations and risks not typically associated with those of U.S. dollar denominated transactions as a result of, among other factors, fluctuations of exchange rates in relation to the U.S. dollar, the possibility of lower levels of governmental supervision and regulation of foreign securities markets and the possibility of political or economic instability.
Governmental approval for foreign investments may be required in advance of making an investment under certain circumstances in some countries, and the extent of foreign investments in domestic companies may be subject to limitation in other countries. Foreign ownership limitations also may be imposed by the charters of individual companies to prevent, among other concerns, violations of foreign investment limitations. As a result, an additional class of shares (identified as "Foreign" in the Portfolio of Investments) may be created and offered for investment. The "local" and "foreign shares" market values may differ. In the absence of trading of the foreign shares in such markets, the Fund values the foreign shares at the closing exchange price of the local shares.
4. Redemption Fees: The Fund will assess a 2% redemption fee on Class I shares, Class A shares, Class L shares,
Class C shares and Class IS shares, which is paid directly to the Fund, for shares redeemed or exchanged within thirty days of purchase, subject to certain exceptions. The redemption fee is designed to protect the Fund and its remaining shareholders from the effects of short-term trading. These fees, if any, are included in the Statements of Changes in Net Assets.
5. Indemnifications: The Company enters into contracts that contain a variety of indemnifications. The Company's maximum exposure under these arrangements is unknown. However, the Company has not had prior claims or losses pursuant to these contracts and expects the risk of loss to be remote.
6. Dividends and Distributions to Shareholders: Dividend income and distributions to shareholders are recorded on the ex-dividend date. Dividends from net investment income, if any, are declared and paid annually. Net realized capital gains, if any, are distributed at least annually.
7. Security Transactions, Income and Expenses: Security transactions are accounted for on the trade date (date the order to buy or sell is executed). Realized gains and losses on the sale of investment securities are determined on the specific identified cost method. Dividend income and other distributions are recorded on the ex-dividend date (except for certain foreign dividends which may be recorded as soon as the Fund is informed of such dividends) net of applicable withholding taxes. Interest income is recognized on the accrual basis except where collection is in doubt. Discounts are accreted and premiums are amortized over the life of the respective securities. Most expenses of the Company can be directly attributed to a particular Fund. Expenses which cannot be directly attributed are apportioned among the Funds based upon relative net assets or other appropriate methods. Income, expenses (other than class specific expenses — distribution and shareholder services, transfer agency and sub transfer agency fees) and realized and unrealized gains or losses are allocated to each class of shares based upon their relative net assets.
The Fund owns shares of REITs which report information on the source of their distributions annually in the following calendar year. A portion of distributions received from REITs during the year is estimated to be a return of capital and is recorded as a reduction of their cost.
23
Morgan Stanley Institutional Fund, Inc.
Annual Report — December 31, 2018
Notes to Financial Statements (cont'd)
B. Advisory/Sub-Advisory Fees: The Adviser, a wholly-owned subsidiary of Morgan Stanley, provides the Fund with advisory services under the terms of an Investment Advisory Agreement, paid quarterly, at an annual rate of 0.80% of the daily net assets of the Fund.
The Adviser has agreed to reduce its advisory fee and/or reimburse the Fund so that total annual portfolio operating expenses, excluding certain investment related expenses, taxes, interest and other extraordinary expenses (including litigation), will not exceed 1.00% for Class I shares, 1.35% for Class A shares, 1.85% for Class L shares, 2.10% for Class C shares and 0.97% for Class IS shares. The fee waivers and/or expense reimbursements will continue for at least one year from the date of the Fund's prospectus or until such time as the Directors act to discontinue all or a portion of such waivers and/or reimbursements when they deem such action is appropriate. For the year ended December 31, 2018, approximately $244,000 of advisory fees were waived and approximately $20,000 of other expenses were reimbursed by the Adviser pursuant to this arrangement.
The Adviser has entered into Sub-Advisory Agreements with the Sub-Advisers, each a wholly-owned subsidiary of Morgan Stanley. The Sub-Advisers provide the Fund with advisory services subject to the overall supervision of the Adviser and the Company's Officers and Directors. The Adviser pays the Sub-Advisers on a monthly basis a portion of the net advisory fees the Adviser receives from the Fund.
C. Administration Fees: The Adviser also serves as Administrator to the Company and provides administrative services pursuant to an Administration Agreement for an annual fee, accrued daily and paid monthly, of 0.08% of the Fund's average daily net assets.
Under a Sub-Administration Agreement between the Administrator and State Street Bank and Trust Company ("State Street"), State Street provides certain administrative services to the Company. For such services, the Administrator pays State Street a portion of the fee the Administrator receives from the Fund.
D. Distribution and Shareholder Services Fees: Morgan Stanley Distribution, Inc. ("MSDI" or the "Distributor"), a wholly-owned subsidiary of the Adviser and an indirect subsidiary of Morgan Stanley, serves as the Company's Distributor of Fund shares pursuant to a Distribution Agreement. The Fund has adopted a Shareholder Services Plan with respect to Class A shares pursuant to Rule 12b-1 under the Act. Under
the Shareholder Services Plan, the Fund pays the Distributor a shareholder services fee, accrued daily and paid monthly, at an annual rate of 0.25% of the Fund's average daily net assets attributable to Class A shares.
The Company has adopted a Distribution and Shareholder Services Plan with respect to Class L shares pursuant to Rule 12b-1 under the Act. Under the Distribution and Shareholder Services Plan, the Fund pays the Distributor a distribution fee, accrued daily and paid monthly, at an annual rate of 0.50% and a shareholder services fee, accrued daily and paid monthly, at an annual rate of 0.25% of the Fund's average daily net assets attributable to Class L shares.
The Company has adopted a Distribution and Shareholder Services Plan with respect to Class C shares pursuant to Rule 12b-1 under the Act. Under the Distribution and Shareholder Services Plan, the Fund pays the Distributor a distribution fee, accrued daily and paid monthly, at an annual rate of 0.75% and a shareholder services fee, accrued daily and paid monthly, at an annual rate of 0.25% of the Fund's average daily net assets attributable to Class C shares.
The distribution and shareholder services fees are used to support the expenses associated with servicing and maintaining accounts. The Distributor may compensate other parties for providing shareholder support services to investors who purchase Class A, Class L and Class C shares.
E. Dividend Disbursing and Transfer Agent: The Company's dividend disbursing and transfer agent is DST Asset Manager Solutions, Inc. ("DST"). Pursuant to a Transfer Agency Agreement, the Company pays DST a fee based on the number of classes, accounts and transactions relating to the Funds of the Company.
F. Custodian Fees: State Street (the "Custodian") also serves as Custodian for the Company in accordance with a Custodian Agreement. The Custodian holds cash, securities and other assets of the Company as required by the Act. Custody fees are payable monthly based on assets held in custody, investment purchases and sales activity and account maintenance fees, plus reimbursement for certain out-of-pocket expenses.
G. Security Transactions and Transactions with Affiliates: For the year ended December 31, 2018, purchases and sales of investment securities for the Fund, other than long-term U.S. Government securities and short-term investments, were approximately $8,206,000 and $14,678,000,
24
Morgan Stanley Institutional Fund, Inc.
Annual Report — December 31, 2018
Notes to Financial Statements (cont'd)
respectively. There were no purchases and sales of long-term U.S. Government securities for the year ended December 31, 2018.
The Fund invests in the Institutional Class of the Morgan Stanley Institutional Liquidity Funds — Treasury Portfolio (the "Liquidity Funds"), an open-end management investment company managed by the Adviser. Advisory fees paid by the Fund are reduced by an amount equal to its pro-rata share of the advisory and administration fees paid by the Fund due to its investment in the Liquidity Funds. For the year ended December 31, 2018, advisory fees paid were reduced by less than $500 relating to the Fund's investment in the Liquidity Funds.
A summary of the Fund's transactions in shares of affiliated investments during the year ended December 31, 2018 is as follows:
Affiliated
Investment
Company | | Value
December 31,
2017
(000) | | Purchases
at Cost
(000) | | Proceeds
from Sales
(000) | | Dividend
Income
(000) | |
Liquidity Funds | | $ | 151 | | | $ | 4,970 | | | $ | 5,085 | | | $ | 3 | | |
Affiliated
Investment
Company (cont'd) | | Realized
Gain
(Loss)
(000) | | Change in
Unrealized
Appreciation
(Depreciation)
(000) | | Value
December 31,
2018
(000) | |
Liquidity Funds | | $ | — | | | $ | — | | | $ | 36 | | |
The Fund is permitted to purchase and sell securities ("cross-trade") from and to other Morgan Stanley funds as well as other funds and client accounts for which the Adviser or an affiliate of the Adviser serves as investment adviser, pursuant to procedures approved by the Directors in compliance with Rule 17a-7 under the Act (the "Rule"). Each cross-trade is executed at the current market price in compliance with provisions of the Rule. For the year ended December 31, 2018, the Fund did not engage in any cross-trade transactions.
The Fund has an unfunded Deferred Compensation Plan (the "Compensation Plan"), which allows each independent Director to defer payment of all, or a portion, of the fees he or she receives for serving on the Board of Directors. Each eligible Director generally may elect to have the deferred amounts credited with a return equal to the total return on one or more of the Morgan Stanley funds that are offered as investment options under the Compensation Plan. Appreciation/depreciation and distributions received from these investments are recorded with an offsetting increase/decrease in the deferred compensation obligation and do not affect the NAV of the Fund.
H. Federal Income Taxes: It is the Fund's intention to continue to qualify as a regulated investment company and
distribute all of its taxable and tax-exempt income. Accordingly, no provision for Federal income taxes is required in the financial statements.
The Fund may be subject to taxes imposed by countries in which it invests. Such taxes are generally based on income and/or capital gains earned or repatriated. Taxes are accrued based on net investment income, net realized gains and net unrealized appreciation as such income and/or gains are earned. Taxes may also be based on transactions in foreign currency and are accrued based on the value of investments denominated in such currency.
FASB ASC 740-10, "Income Taxes — Overall", sets forth a minimum threshold for financial statement recognition of the benefit of a tax position taken or expected to be taken in a tax return. Management has concluded there are no significant uncertain tax positions that would require recognition in the financial statements. If applicable, the Fund recognizes interest accrued related to unrecognized tax benefits in "Interest Expense" and penalties in "Other Expenses" in the Statement of Operations. The Fund files tax returns with the U.S. Internal Revenue Service, New York and various states. Generally, each of the tax years in the four-year period ended December 31, 2018 remains subject to examination by taxing authorities.
The tax character of distributions paid may differ from the character of distributions for GAAP purposes due to short-term capital gains being treated as ordinary income for tax purposes. The tax character of distributions paid during fiscal years 2018 and 2017 was as follows:
2018
Distributions
Paid From: | | 2017
Distributions
Paid From: | |
Ordinary
Income
(000) | | Long-Term
Capital Gain
(000) | | Ordinary
Income
(000) | | Long-Term
Capital Gain
(000) | |
| $ | 1,223 | | | $ | — | | | $ | 2,776 | | | $ | — | | |
The amount and character of income and gains to be distributed are determined in accordance with income tax regulations which may differ from GAAP. These book/tax differences are either considered temporary or permanent in nature.
Temporary differences are primarily due to differing book and tax treatments in the timing of the recognition of gains (losses) on certain investment transactions and the timing of the deductibility of certain expenses.
25
Morgan Stanley Institutional Fund, Inc.
Annual Report — December 31, 2018
Notes to Financial Statements (cont'd)
Permanent differences, primarily due to an expired capital loss carryforward, resulted in the following reclassifications among the components of net assets at December 31, 2018:
Total
Accumulated
Loss
(000) | | Paid-in-
Capital
(000) | |
| $ | 66,872 | | | $ | (66,872 | ) | |
At December 31, 2018, the components of distributable earnings for the Fund on a tax basis were as follows:
Undistributed
Ordinary
Income
(000) | | Undistributed
Long-Term
Capital Gain
(000) | |
| $ | 192 | | | $ | — | | |
At December 31, 2018, the Fund had available for federal income tax purposes unused short-term and long-term capital losses of approximately $3,185,000 and $220,914,000, respectively that do not have an expiration date.
During the year ended December 31, 2018, capital loss carryforwards of approximately $66,872,000 expired for federal income tax purposes.
To the extent that capital loss carryforwards are used to offset any future capital gains realized, no capital gains tax liability will be incurred by the Fund for gains realized and not distributed. To the extent that capital gains are offset, such gains will not be distributed to the shareholders.
I. Credit Facility: The Company and other Morgan Stanley funds participated in a $150,000,000 committed, unsecured revolving line of credit facility (the "Facility") with State Street. This Facility is to be used for temporary emergency purposes or funding of shareholder redemption requests. The interest rate on borrowings is based on the federal funds rate or 1 month LIBOR rate plus a spread. The Facility also has a commitment fee of 0.25% per annum based on the unused portion of the Facility. During the year ended December 31, 2018, the Fund did not have any borrowings under the Facility.
J. Other: At December 31, 2018, the Fund had record owners of 10% or greater. Investment activities of these shareholders could have a material impact on the Fund. The aggregate percentage of such owners was 71.9%.
26
Morgan Stanley Institutional Fund, Inc.
Annual Report — December 31, 2018
Report of Independent Registered Public Accounting Firm
To the Shareholders and Board of Directors of
Morgan Stanley Institutional Fund, Inc. —
International Real Estate Portfolio
Opinion on the Financial Statements
We have audited the accompanying statement of assets and liabilities of International Real Estate Portfolio (the "Fund") (one of the funds constituting the Morgan Stanley Institutional Fund, Inc. (the "Company")), including the portfolio of investments, as of December 31, 2018, and the related statement of operations for the year then ended, the statements of changes in net assets for each of the two years in the period then ended, the financial highlights for each of the five years in the period then ended and the related notes (collectively referred to as the "financial statements"). In our opinion, the financial statements present fairly, in all material respects, the financial position of International Real Estate Portfolio (one of the funds constituting Morgan Stanley Institutional Fund, Inc.) at December 31, 2018, the results of its operations for the year then ended, the changes in its net assets for each of the two years in the period then ended and its financial highlights for each of the five years in the period then ended, in conformity with U.S. generally accepted accounting principles.
Basis for Opinion
These financial statements are the responsibility of the Company's management. Our responsibility is to express an opinion on the Fund's financial statements based on our audits. We are a public accounting firm registered with the Public Company Accounting Oversight Board (United States) ("PCAOB") and are required to be independent with respect to the Company in accordance with the U.S. federal securities law and the applicable rules and regulations of the Securities and Exchange Commission and the PCAOB.
We conducted our audits in accordance with the standards of the PCAOB. Those standards require that we plan and perform the audit to obtain reasonable assurance about whether the financial statements are free of material misstatement, whether due to error or fraud. The Company is not required to have, nor were we engaged to perform, an audit of the Company's internal control over financial reporting. As part of our audits, we are required to obtain an understanding of internal control over financial reporting, but not for the purpose of expressing an opinion on the effectiveness of the Company's internal control over financial reporting. Accordingly, we express no such opinion.
Our audits included performing procedures to assess the risks of material misstatement of the financial statements, whether due to error or fraud, and performing procedures that respond to those risks. Such procedures included examining, on a test basis, evidence regarding the amounts and disclosures in the financial statements. Our procedures included confirmation of securities owned as of December 31, 2018 by correspondence with the custodian and others or by other appropriate auditing procedures where replies from others were not received. Our audits also included evaluating the accounting principles used and significant estimates made by management, as well as evaluating the overall presentation of the financial statements. We believe that our audits provide a reasonable basis for our opinion.

We have served as the auditor of one or more Morgan Stanley investment companies since 2000.
Boston, Massachusetts
February 26, 2019
27
Morgan Stanley Institutional Fund, Inc.
Annual Report — December 31, 2018
Federal Tax Notice (unaudited)
For federal income tax purposes, the following information is furnished with respect to the Fund's earnings for the taxable year ended December 31, 2018.
When distributed, certain earnings may be subject to a maximum tax rate of 15% as provided for the Jobs and Growth Tax Relief Reconciliation Act of 2003. The Fund designated up to a maximum of approximately $563,000 as taxable at this lower rate.
The Fund intends to pass through foreign tax credits of approximately $70,000, and has derived net income from sources within foreign countries amounting to approximately $1,195,000.
In January, the Fund provides tax information to shareholders for the preceding calendar year.
28
Morgan Stanley Institutional Fund, Inc.
Annual Report — December 31, 2018
Privacy Notice (unaudited)
MORGAN STANLEY INVESTMENT MANAGEMENT INC.
AN IMPORTANT NOTICE CONCERNING OUR U.S. PRIVACY POLICY
We are required by federal law to provide you with a copy of our privacy policy annually. This policy applies to current and former individual investors in funds managed or sponsored by Morgan Stanley Investment Management Inc. ("MSIM") as well as current and former individual clients of MSIM. This policy is not applicable to partnerships, corporations, trusts or other non-individual clients or investors. Please note that we may amend this policy at any time, and will inform you of any changes as required by law.
WE RESPECT YOUR PRIVACY
We appreciate that you have provided us with your personal financial information. We strive to maintain the privacy of such information while we help you achieve your financial objectives. This Notice describes what non-public personal information we collect about you, why we collect it, when we may share it with others and how certain others may use it. It discusses the steps you may take to limit our sharing of certain information about you to affiliated companies in the Morgan Stanley family of companies ("other Morgan Stanley companies"). It also discloses how you may limit use of certain shared information for marketing purposes by other Morgan Stanley branded companies. Throughout this policy, we refer to the non-public information that personally identifies you or your accounts as "personal information."
1. WHAT PERSONAL INFORMATION DO WE COLLECT ABOUT YOU?
We obtain personal information from applications and other forms you submit to us, from your dealings with us, from consumer reporting agencies, from our Web sites and from third parties and other sources.
For example:
• We may collect information such as your name, address, e-mail address, telephone/fax numbers, assets, income and investment objectives through subscription documents, applications and other forms you submit to us.
• We may obtain information about account balances, your use of account(s) and the types of products and services you prefer to receive from us through your dealings and transactions with us and other sources.
• We may obtain information about your creditworthiness and credit history from consumer reporting agencies.
• We may collect background information from and through third-party vendors to verify representations you have made and to comply with various regulatory requirements.
• If you interact with us through our public and private Web sites, we may collect information that you provide directly through online communications (such as an e-mail address). We may also collect information about your Internet service provider, your domain name, your computer's operating system and Web browser, your use of our Web sites and your product and service preferences, through the use of "cookies." Please consult the Terms of Use of these sites for more details.
2. WHEN DO WE DISCLOSE PERSONAL INFORMATION WE COLLECT ABOUT YOU?
We may disclose personal information we collect about you to other Morgan Stanley companies and to non-affiliated third parties.
a. Information We Disclose to Other Morgan Stanley Companies.
We may disclose personal information to other Morgan Stanley companies for a variety of reasons, including to manage your account(s) effectively, to service and process your transactions, to let you know about products and services offered by us and other Morgan Stanley companies, to manage our business, and as otherwise required or permitted by law. Offers for products and services from other Morgan Stanley companies are developed under conditions designed to safeguard your personal information.
29
Morgan Stanley Institutional Fund, Inc.
Annual Report — December 31, 2018
Privacy Notice (unaudited) (cont'd)
b. Information We Disclose to Non-affiliated Third Parties.
We do not disclose personal information that we collect about you to non-affiliated third parties except to those who provide marketing services on our behalf, to financial institutions with whom we have joint marketing agreements, and as otherwise required or permitted by law. For example, we may disclose personal information to non-affiliated third parties for servicing and processing transactions, to offer our own products and services, to protect against fraud, for institutional risk control, to respond to judicial process or to perform services on our behalf. When we share personal information with a non-affiliated third party, they are required to limit their use of personal information to the particular purpose for which it was shared and they are not allowed to share personal information with others except to fulfill that limited purpose or as may be permitted or required by law.
3. HOW DO WE PROTECT THE SECURITY AND CONFIDENTIALITY OF PERSONAL INFORMATION WE COLLECT ABOUT YOU?
We maintain physical, electronic and procedural security measures to help safeguard the personal information we collect about you. We have internal policies governing the proper handling of client information. Third parties that provide support or marketing services on our behalf may also receive personal information, and we require them to adhere to confidentiality standards with respect to such information.
4. HOW CAN YOU LIMIT THE SHARING OF CERTAIN TYPES OF PERSONAL INFORMATION WITH OTHER MORGAN STANLEY COMPANIES?
We offer you choices as to whether we share with other Morgan Stanley companies the personal information that was collected to determine your eligibility for products and services you request ("eligibility information"). Eligibility information does not include your identification information or personal information pertaining to our transactions or experiences with you. Please note that, even if you direct us not to share eligibility information with other Morgan Stanley companies ("opt-out"), we may still share personal information, including eligibility information, with those companies in circumstances excluded from the opt-out under applicable law, such as to process transactions or to service your account.
5. HOW CAN YOU LIMIT THE USE OF CERTAIN TYPES OF PERSONAL INFORMATION BY OTHER MORGAN STANLEY COMPANIES FOR MARKETING?
By following the opt-out instructions in Section 6 below, you may limit other Morgan Stanley branded companies from marketing their products or services to you based on personal information we disclose to them. This information may include, for example, your income and account history with us. Please note that, even if you choose to limit Other Morgan Stanley Companies from using personal information about you that we may share with them for marketing their products and services to you, Other Morgan Stanley Companies may use your personal information that they obtain from us to market to you in circumstances permitted by law, such as if the Other Morgan Stanley Company has its own relationship with you.
6. HOW CAN YOU SEND US AN OPT-OUT INSTRUCTION?
If you wish to limit our sharing of eligibility information about you with other Morgan Stanley companies or other Morgan Stanley companies' use of personal information for marketing purposes, as described in this notice, you may do so by:
• Calling us at (800) 548-7786
Monday–Friday between 8a.m. and 6p.m.(EST)
• Writing to us at the following address:
DST Asset Manager Solutions, Inc.
c/o Privacy Coordinator
P.O. Box 219804
Kansas City, Missouri 64121
30
Morgan Stanley Institutional Fund, Inc.
Annual Report — December 31, 2018
Privacy Notice (unaudited) (cont'd)
Your written request should include your name, address, telephone number and account number(s) to which the opt-out applies and whether you are opting out with respect to sharing of eligibility information (Section 4 above), or if information used for Marketing (Section 5 above) or both. Written opt-out requests should not be sent with any other correspondence. In order to process your request, we require that the request be provided by you directly and not through a third party.
Your opt-out preference will remain in effect with respect to this policy (as it may be amended) until you notify us otherwise. If you have a joint account, your direction for us not to share this information with other Morgan Stanley companies and for those other Morgan Stanley companies not to use your personal information for marketing will be applied to all account holders on that account. Please understand that if you limit our sharing or our affiliated companies' use of personal information, you and any joint account holder(s) may not receive information about Morgan Stanley products and services, including products or services that could help you manage your financial resources and achieve your investment objectives.
7. WHAT IF AN AFFILIATED COMPANY BECOMES A NON-AFFILIATED THIRD PARTY?
If, at any time in the future, an affiliated company becomes a non-affiliated third party, further disclosures of personal information made to the former affiliated company will be limited to those described in Section 2(b) above relating to non-affiliated third parties. If you elected under Section 6 to limit disclosures we make to affiliated companies, or use of personal information by affiliated companies, your election will not apply to use by any former affiliated company of your personal information in their possession once it becomes a non-affiliated third party.
SPECIAL NOTICE TO RESIDENTS OF VERMONT
The following section supplements our policy with respect to our individual clients who have a Vermont address and supersedes anything to the contrary in the above policy with respect to those clients only.
The state of Vermont requires financial institutions to obtain your consent prior to sharing personal information that they collect about you with affiliated companies and non-affiliated third parties other than in certain limited circumstances. Except as permitted by law, we will not share personal information we collect about you with non-affiliated third parties or other Morgan Stanley companies unless you provide us with your written consent to share such information ("opt-in").
If you wish to receive offers for investment products and services offered by or through other Morgan Stanley companies, please notify us in writing at the following address:
DST Asset Manager Solutions, Inc.
c/o Privacy Coordinator
P.O. Box 219804
Kansas City, Missouri 64121
Your authorization should include your name, address, telephone number and account number(s) to which the opt-in applies and should not be sent with any other correspondence. In order to process your authorization, we require that the authorization be provided by you directly and not through a third party.
SPECIAL NOTICE TO RESIDENTS OF CALIFORNIA
The following section supplements our policy with respect to our individual clients who have a California address and supersedes anything to the contrary in the above policy with respect to those clients only.
In response to a California law, if your account has a California home address, your personal information will not be disclosed to non-affiliated third parties except as permitted by applicable California law, and we will limit sharing such information with our affiliates to comply with California privacy laws that apply to us.
31
Morgan Stanley Institutional Fund, Inc.
Annual Report — December 31, 2018
Director and Officer Information (unaudited)
Independent Directors:
Name, Age and Address of
Independent Director | | Position(s)
Held with
Registrant | | Length of Time
Served* | | Principal Occupation(s) During Past 5 Years
and Other Relevant Professional Experience | | Number of
Portfolios in
Fund Complex
Overseen by
Independent
Director** | | Other Directorships
Held by Independent
Director*** | |
Frank L. Bowman (74)
c/o Perkins Coie LLP
Counsel to the Independent
Directors
30 Rockefeller Plaza
New York, NY 10112 | | Director | | Since
August
2006 | | President, Strategic Decisions, LLC (consulting) (since February 2009); Director or Trustee of various Morgan Stanley Funds (since August 2006); Chairperson of the Compliance and Insurance Committee (since October 2015); formerly, Chairperson of the Insurance Sub-Committee of the Compliance and Insurance Committee (2007-2015); served as President and Chief Executive Officer of the Nuclear Energy Institute (policy organization) (February 2005-November 2008); retired as Admiral, U.S. Navy after serving over 38 years on active duty including 8 years as Director of the Naval Nuclear Propulsion Program in the Department of the Navy and the U.S. Department of Energy (1996-2004); served as Chief of Naval Personnel (July 1994-September 1996) and on the Joint Staff as Director of Political Military Affairs (June 1992-July 1994); knighted as Honorary Knight Commander of the Most Excellent Order of the British Empire; awarded the Officier de l'Orde National du Mérite by the French Government; elected to the National Academy of Engineering (2009). | | | 82 | | | Director of BP p.l.c.; Director of Naval and Nuclear Technologies LLP; Director Emeritus of the Armed Services YMCA; Member of the National Security Advisory Council of the Center for U.S. Global Engagement and a member of the CNA Military Advisory Board; Trustee of Fairhaven United Methodist Church; Member of the Board of Advisors of the Dolphin Scholarship Foundation; and Director of other various non-profit organizations. | |
Kathleen A. Dennis (65)
c/o Perkins Coie LLP
Counsel to the Independent Directors
30 Rockefeller Plaza
New York, NY 10112 | | Director | | Since
August
2006 | | President, Cedarwood Associates (mutual fund and investment management consulting) (since July 2006); Chairperson of the Liquidity and Alternatives Sub-Committee of the Investment Committee (since October 2006) and Director or Trustee of various Morgan Stanley Funds (since August 2006); formerly, Senior Managing Director of Victory Capital Management (1993-2006). | | | 82 | | | Director of various non-profit organizations. | |
Nancy C. Everett (63)
c/o Perkins Coie LLP
Counsel to the Independent Directors
30 Rockefeller Plaza
New York, NY 10112 | | Director | | Since
January
2015 | | Chief Executive Officer, Virginia Commonwealth University Investment Company (since November 2015); Owner, OBIR, LLC (institutional investment management consulting) (since June 2014); formerly, Managing Director, BlackRock Inc. (February 2011-December 2013); and Chief Executive Officer, General Motors Asset Management (a/k/a Promark Global Advisors, Inc.) (June 2005-May 2010). | | | 83 | | | Formerly, Member of Virginia Commonwealth University School of Business Foundation (2005-2016); Member of Virginia Commonwealth University Board of Visitors (2013-2015); Member of Committee on Directors for Emerging Markets Growth Fund, Inc. (2007-2010); Chairperson of Performance Equity Management, LLC (2006-2010); and Chairperson, GMAM Absolute Return Strategies Fund, LLC (2006-2010). | |
32
Morgan Stanley Institutional Fund, Inc.
Annual Report — December 31, 2018
Director and Officer Information (unaudited) (cont'd)
Independent Directors: (cont'd)
Name, Age and Address of
Independent Director | | Position(s)
Held with
Registrant | | Length of Time
Served* | | Principal Occupation(s) During Past 5 Years
and Other Relevant Professional Experience | | Number of
Portfolios in
Fund Complex
Overseen by
Independent
Director** | | Other Directorships
Held by Independent
Director*** | |
Jakki L. Haussler (61)
c/o Perkins Coie LLP
Counsel to the Independent Directors
30 Rockefeller Plaza
New York, NY 10112 | | Director | | Since
January
2015 | | Chairman and Chief Executive Officer, Opus Capital Group (since January 1996); formerly, Director, Capvest Venture Fund, LP (May 2000-December 2011); Partner, Adena Ventures, LP (July 1999-December 2010); Director, The Victory Funds (February 2005-July 2008). | | | 83 | | | Director of Service Corporation International and Member, Audit Committee and Investment Committee; Director of Cincinnati Bell Inc. and Member, Audit Committee and Governance and Nominating Committee; Chairman of Northern Kentucky University Member Investment Committee; Member of Chase College of Law Transactional Law Practice Center Board of Advisors; Director of Best Transport; Director of Chase College of Law Board of Visitors; formerly, Member, University of Cincinnati Foundation Investment Committee; Member, Miami University Board of Visitors (2008-2011); Trustee of Victory Funds (2005-2008) and Chairman, Investment Committee (2007-2008) and Member, Service Provider Committee (2005-2008). | |
Dr. Manuel H. Johnson (69)
c/o Johnson Smick
International, Inc.
220 I Street, NE — Suite 200
Washington, D.C. 20002 | | Director | | Since
July
1991 | | Senior Partner, Johnson Smick International, Inc. (consulting firm); Chairperson of the Investment Committee (since October 2006) and Director or Trustee of various Morgan Stanley Funds (since July 1991); Co-Chairman and a founder of the Group of Seven Council (G7C) (international economic commission); formerly, Chairperson of the Audit Committee (July 1991-September 2006), Vice Chairman of the Board of Governors of the Federal Reserve System and Assistant Secretary of the U.S. Treasury. | | | 82 | | | Director of NVR, Inc. (home construction). | |
Joseph J. Kearns (76)
c/o Perkins Coie LLP
Counsel to the Independent Directors
30 Rockefeller Plaza
New York, NY 10112 | | Director | | Since
August
1994 | | Senior Adviser, Kearns & Associates LLC (investment consulting); Chairperson of the Audit Committee (since October 2006) and Director or Trustee of various Morgan Stanley Funds (since August 1994); formerly, Deputy Chairperson of the Audit Committee (July 2003-September 2006) and Chairperson of the Audit Committee of various Morgan Stanley Funds (since August 1994); CFO of the J. Paul Getty Trust. | | | 83 | | | Prior to August 10, 2016, Director of Electro Rent Corporation (equipment leasing); Prior to December 31, 2013, Director of The Ford Family Foundation. | |
33
Morgan Stanley Institutional Fund, Inc.
Annual Report — December 31, 2018
Director and Officer Information (unaudited) (cont'd)
Independent Directors: (cont'd)
Name, Age and Address of
Independent Director | | Position(s)
Held with
Registrant | | Length of Time
Served* | | Principal Occupation(s) During Past 5 Years
and Other Relevant Professional Experience | | Number of
Portfolios in
Fund Complex
Overseen by
Independent
Director** | | Other Directorships
Held by Independent
Director*** | |
Michael F. Klein (60)
c/o Perkins Coie LLP
Counsel to the Independent Directors
30 Rockefeller Plaza
New York, NY 10112 | | Director | | Since
August
2006 | | Managing Director, Aetos Alternatives Management, LP (since March 2000); Co-President, Aetos Alternatives Management, LP (since January 2004) and Co-Chief Executive Officer of Aetos Alternatives Management, LP (since August 2013); Chairperson of the Fixed Income Sub-Committee of the Investment Committee (since October 2006) and Director or Trustee of various Morgan Stanley Funds (since August 2006); formerly, Managing Director, Morgan Stanley & Co. Inc. and Morgan Stanley Dean Witter Investment Management and President, various Morgan Stanley Funds (June 1998-March 2000); Principal, Morgan Stanley & Co. Inc. and Morgan Stanley Dean Witter Investment Management (August 1997-December 1999). | | | 82 | | | Director of certain investment funds managed or sponsored by Aetos Alternatives Management, LP; Director of Sanitized AG and Sanitized Marketing AG (specialty chemicals). | |
Patricia Maleski (58)
c/o Perkins Coie LLP
Counsel to the Independent Directors
30 Rockefeller Plaza
New York, NY 10112 | | Director | | Since
January
2017 | | Managing Director, JPMorgan Asset Management (2004-2016); Oversight and Control Head of Fiduciary and Conflicts of Interest Program (2015-2016); Chief Control Officer-Global Asset Management (2013-2015); President, JPMorgan Funds (2010-2013); Chief Administrative Officer (2004-2013); various other positions including Treasurer and Board Liaison (since 2001). | | | 83 | | | None. | |
Michael E. Nugent (82)
522 Fifth Avenue
New York, NY 10036 | | Chair of the Board and Director | | Chair of the Boards since July 2006 and Director since July 1991 | | Chair of the Boards of various Morgan Stanley Funds (since July 2006); Chairperson of the Closed-End Fund Committee (since June 2012) Governance Committee (since January 2019) and Director or Trustee of various Morgan Stanley Funds (since July 1991); formerly, Chairperson of the Insurance Committee (until July 2006); General Partner, Triumph Capital, L.P. (private investment partnership) (1988-2013). | | | 82 | | | None. | |
W. Allen Reed (71)
c/o Perkins Coie LLP
Counsel to the Independent Directors
30 Rockefeller Plaza
New York, NY 10112 | | Director | | Since
August
2006 | | Chairperson of the Equity Sub-Committee of the Investment Committee (since October 2006) and Director or Trustee of various Morgan Stanley Funds (since August 2006); formerly, President and CEO of General Motors Asset Management; Chairman and Chief Executive Officer of the GM Trust Bank and Corporate Vice President of General Motors Corporation (August 1994-December 2005). | | | 82 | | | Director of Legg Mason, Inc.; formerly, Director of the Auburn University Foundation (2010-2015). | |
Fergus Reid (86)****
c/o Joe Pietryka, Inc.
85 Charles Colman Blvd.
Pawling, NY 12564 | | Director | | Since
June
1992 | | Chairman, Joe Pietryka, Inc.; Chairperson of the Governance Committee and Director or Trustee of various Morgan Stanley Funds (since June 1992). | | | 83 | | | Formerly, Trustee and Director of certain investment companies in the JP Morgan Fund Complex managed by JP Morgan Investment Management Inc. (1987-2012). | |
* This is the earliest date the Director began serving the Morgan Stanley Funds. Each Director serves an indefinite term, until his or her successor is elected.
** The Fund Complex includes (as of December 31, 2018) all open-end and closed-end funds (including all of their portfolios) advised by Morgan Stanley Investment Management Inc. (the "Adviser") and any funds that have an adviser that is an affiliated person of the Adviser (including, but not limited to, Morgan Stanley AIP GP LP).
*** This includes any directorships at public companies and registered investment companies held by the Director at any time during the past five years.
**** Effective date of retirement is December 31, 2018.
34
Morgan Stanley Institutional Fund, Inc.
Annual Report — December 31, 2018
Director and Officer Information (unaudited) (cont'd)
Executive Officers:
Name, Age and Address of Executive Officer | | Position(s) Held
with
Registrant | | Length of Time
Served* | | Principal Occupation(s) During Past 5 Years | |
John H. Gernon (55)
522 Fifth Avenue
New York, NY 10036 | | President and Principal Executive Officer | | Since
September
2013 | | President and Principal Executive Officer of the Equity and Fixed Income Funds and the Morgan Stanley AIP Funds (since September 2013) and the Liquidity Funds and various money market funds (since May 2014) in the Fund Complex; Managing Director of the Adviser; Head of Product (since 2006). | |
Timothy J. Knierim (59)
522 Fifth Avenue
New York, NY 10036 | | Chief Compliance Officer | | Since
December
2016 | | Managing Director of the Adviser and various entities affiliated with the Adviser; Chief Compliance Officer of various Morgan Stanley Funds and the Adviser (since December 2016) and Chief Compliance Officer of Morgan Stanley AIP GP LP (since 2014). Formerly, Managing Director and Deputy Chief Compliance Officer of the Adviser (2014-2016); and formerly, Chief Compliance Officer of Prudential Investment Management, Inc. (2007-2014). | |
Francis J. Smith (53)
522 Fifth Avenue
New York, NY 10036 | | Treasurer and Principal Financial Officer | | Treasurer since July 2003 and Principal Financial Officer since September 2002 | | Managing Director of the Adviser and various entities affiliated with the Adviser; Treasurer (since July 2003) and Principal Financial Officer of various Morgan Stanley Funds (since September 2002). | |
Mary E. Mullin (51)
522 Fifth Avenue
New York, NY 10036 | | Secretary | | Since
June
1999 | | Managing Director of the Adviser; Secretary of various Morgan Stanley Funds (since June 1999). | |
Michael J. Key (39)
522 Fifth Avenue
New York, NY 10036 | | Vice President | | Since
June
2017 | | Vice President of the Equity and Fixed Income Funds, Liquidity Funds, various money market funds and the Morgan Stanley AIP Funds in the Fund Complex (since June 2017); Executive Director of the Adviser; Head of Product Development for Equity and Fixed Income Funds (since August 2013). | |
* This is the earliest date the officer began serving the Morgan Stanley Funds. Each officer serves a one-year term, until his or her successor is elected and qualifies.
35
Morgan Stanley Institutional Fund, Inc.
Annual Report — December 31, 2018
Adviser and Administrator
Morgan Stanley Investment Management Inc.
522 Fifth Avenue
New York, New York 10036
Sub-Advisers
Morgan Stanley Investment Management Limited
25 Cabot Square, Canary Wharf
London, E14 4QA, England
Morgan Stanley Investment Management Company
23 Church Street
16-01 Capital Square, Singapore 049481
Distributor
Morgan Stanley Distribution, Inc.
522 Fifth Avenue
New York, New York 10036
Dividend Disbursing and Transfer Agent
DST Asset Manager Solutions, Inc.
2000 Crown Colony Drive
Quincy, Massachusetts 02169
Custodian
State Street Bank and Trust Company
One Lincoln Street
Boston, Massachusetts 02111
Legal Counsel
Dechert LLP
1095 Avenue of the Americas
New York, New York 10036
Counsel to the Independent Directors
Perkins Coie LLP
30 Rockefeller Plaza
New York, New York 10112
Independent Registered Public Accounting Firm
Ernst & Young LLP
200 Clarendon Street
Boston, Massachusetts 02116
Reporting to Shareholders
Each Morgan Stanley fund provides a complete schedule of portfolio holdings in its semi-annual and the annual reports within 60 days of the end of the fund's second and fourth fiscal quarters. The semi-annual and annual reports are filed electronically with the Securities and Exchange Commission ("SEC") on Form N-CSRS and Form N-CSR, respectively. Morgan Stanley also delivers the semi-annual and annual reports to fund shareholders and makes these reports available on its public website, www.morganstanley.com/im/shareholderreports. Each Morgan Stanley fund also files a complete schedule of portfolio holdings with the SEC for the fund's first and third fiscal quarters on Form N-Q. Morgan Stanley does not deliver the reports for the first and third fiscal quarters to shareholders, nor are the reports posted to the Morgan Stanley public website. You may, however, obtain the Form N-Q filings (as well as the Form N-CSR and N-CSRS filings) by accessing the SEC's website, www.sec.gov. You can also request copies of these materials, upon payment of a duplicating fee, by electronic request at the SEC's email address (publicinfo@sec.gov).
Proxy Voting Policies and Procedures and Proxy Voting Record
You may obtain a copy of the Company's Proxy Voting Policy and Procedures and information regarding how the Company voted proxies relating to portfolio securities during the most recent twelve-month period ended June 30, without charge, upon request, by calling toll free 1 (800) 548-7786 or by visiting our website at www.morganstanley.com/im/shareholderreports. This information is also available on the SEC's website at www.sec.gov.
This report is authorized for distribution only when preceded or accompanied by a prospectus or summary prospectus of the applicable Fund of Morgan Stanley Institutional Fund, Inc., which describes in detail the Fund's investment policies, risks, fees and expenses. Please read the prospectus carefully before you invest or send money. For additional information, including information regarding the investments comprising the Fund, please visit our website at www.morganstanley.com/im/shareholderreports or call toll free 1 (800) 548-7786.
36
Printed in U.S.A.
This Report has been prepared for shareholders and may be distributed to others only if preceded or accompanied by a current prospectus.
Morgan Stanley Investment Management Inc.
522 Fifth Avenue
New York, New York 10036
© 2019 Morgan Stanley. Morgan Stanley Distribution, Inc.

IFIIREANN
2404006 EXP. 02.29.20

Morgan Stanley Institutional Fund, Inc.
Multi-Asset Portfolio
Annual Report
December 31, 2018
Beginning on January 1, 2021, as permitted by regulations adopted by the Securities and Exchange Commission ("SEC"), paper copies of the Fund's Annual and Semi-Annual Reports to Shareholders ("Shareholder Reports") will no longer be sent by mail, unless you specifically request paper copies of the Shareholder Reports from the Fund or from your financial intermediary, such as a broker-dealer or a bank. Instead, the Shareholder Reports will be made available on the Fund's website, https://www.morganstanley.com/im/shareholderreports and you will be notified by mail each time a Shareholder Report is posted and provided with a website link to access the Shareholder Report. If you already elected to receive Shareholder Reports electronically, you will not be affected by this change and you need not take any action. You may elect to receive Shareholder Reports and other communications from the Fund electronically anytime by contacting your financial intermediary or, if you are a direct investor, please follow the instructions on the envelope.
Beginning on January 1, 2019, you may elect to receive all future Shareholder Reports in paper free of charge. If you invest through a financial intermediary, you can contact your financial intermediary to request that you continue to receive paper copies of your Shareholder Reports. If you invest directly with the Fund, please follow the instructions on the envelope to let the Fund know you wish to continue receiving paper copies of your Shareholder Reports. Your election to receive Shareholder Reports in paper will apply to all funds held in your account if you invest through your financial intermediary or all funds held with the fund complex if you invest directly with a fund.

Morgan Stanley Institutional Fund, Inc.
Annual Report — December 31, 2018
Shareholders' Letter | | | 2 | | |
Consolidated Expense Example | | | 3 | | |
Investment Overview | | | 4 | | |
Consolidated Portfolio of Investments | | | 10 | | |
Consolidated Statement of Assets and Liabilities | | | 25 | | |
Consolidated Statement of Operations | | | 27 | | |
Consolidated Statements of Changes in Net Assets | | | 28 | | |
Consolidated Financial Highlights | | | 29 | | |
Notes to Consolidated Financial Statements | | | 34 | | |
Report of Independent Registered Public Accounting Firm | | | 46 | | |
Federal Tax Notice | | | 47 | | |
Privacy Notice | | | 48 | | |
Director and Officer Information | | | 51 | | |
This report is authorized for distribution only when preceded or accompanied by a prospectus or summary prospectus of the applicable Fund of Morgan Stanley Institutional Fund, Inc. To receive a prospectus and/or statement of additional information (SAI), which contains more complete information such as investment objectives, charges, expenses, policies for voting proxies, risk considerations and describes in detail each of the Fund's investment policies to the prospective investor, please call toll free 1 (800) 548-7786. Please read the prospectuses carefully before you invest or send money.
Additionally, you can access information about the Fund, including performance, characteristics and investment team commentary, through Morgan Stanley Investment Management's website: www.morganstanley.com/im/shareholderreports.
Market forecasts provided in this report may not necessarily come to pass. There is no guarantee that any sectors mentioned will continue to perform as discussed herein or that securities in such sectors will be held by the Fund in the future. There is no assurance that a fund will achieve its investment objective. Funds are subject to market risk, which is the possibility that market values of securities owned by the Fund will decline and, therefore, the value of the Fund's shares may be less than what you paid for them. Accordingly, you can lose money investing in this Fund. Please see the prospectus for more complete information on investment risks.
1
Morgan Stanley Institutional Fund, Inc.
Annual Report — December 31, 2018
Shareholders' Letter (unaudited)
Dear Shareholders,
We are pleased to provide this Annual report, in which you will learn how your investment in Multi-Asset Portfolio (the "Fund") performed during the latest twelve-month period.
Morgan Stanley Investment Management is a client-centric, investor-led organization. Our global presence, intellectual capital, and breadth of products and services enable us to partner with investors to meet the evolving challenges of today's financial markets. We aim to deliver superior investment service and to empower our clients to make the informed decisions that help them reach their investment goals.
As always, we thank you for selecting Morgan Stanley Investment Management, and look forward to working with you in the months and years ahead.
Sincerely,

John H. Gernon
President and Principal Executive Officer
January 2019
2
Morgan Stanley Institutional Fund, Inc.
Annual Report — December 31, 2018
Consolidated Expense Example (unaudited)
Multi-Asset Portfolio
As a shareholder of the Fund, you incur two types of costs: (1) transactional costs; and (2) ongoing costs, which may include advisory fees, administration fees, distribution and shareholder services fees and other Fund expenses. This example is intended to help you understand your ongoing costs (in dollars) of investing in the Fund and to compare these costs with the ongoing costs of investing in other mutual funds.
This example is based on an investment of $1,000 invested at the beginning of the six-month period ended December 31, 2018 and held for the entire six-month period.
Actual Expenses
The table below provides information about actual account values and actual expenses. You may use the information in this table, together with the amount you invested, to estimate the expenses that you paid over the period. Simply divide your account value by $1,000 (for example, an $8,600 account value divided by $1,000 = 8.6), then multiply the result by the number in the table under the heading entitled "Actual Expenses Paid During Period" to estimate the expenses you paid on your account during this period.
Hypothetical Example for Comparison Purposes
The table below provides information about hypothetical account values and hypothetical expenses based on the Fund's actual expense ratio and an assumed rate of return of 5% per year before expenses, which is not the Fund's actual return. The hypothetical account values and expenses may not be used to estimate the actual ending account balance or expenses you paid for the period. You may use this information to compare the ongoing costs of investing in the Fund and other funds. To do so, compare this 5% hypothetical example with the 5% hypothetical examples that appear in the shareholder reports of the other funds.
Please note that the expenses shown in the table are meant to highlight your ongoing costs only and do not reflect any transactional costs, such as sales charges (loads). Therefore, the information for each class in the table is useful in comparing ongoing costs only, and will not help you determine the relative total costs of owning different funds. In addition, if these transactional costs were included, your costs would have been higher.
| | | Beginning
Account
Value
7/1/18 | | Actual Ending
Account
Value
12/31/18 | | Hypothetical
Ending Account
Value | | Actual
Expenses
Paid
During
Period* | | Hypothetical
Expenses Paid
During Period* | | Net
Expense
Ratio
During
Period** | |
Multi-Asset Portfolio Class I | | $ | 1,000.00 | | | $ | 1,000.90 | | | $ | 1,019.86 | | | $ | 5.35 | | | $ | 5.40 | | | | 1.06 | % | |
Multi-Asset Portfolio Class A | | | 1,000.00 | | | | 998.30 | | | | 1,018.10 | | | | 7.10 | | | | 7.17 | | | | 1.41 | | |
Multi-Asset Portfolio Class L | | | 1,000.00 | | | | 997.00 | | | | 1,015.88 | | | | 9.31 | | | | 9.40 | | | | 1.85 | | |
Multi-Asset Portfolio Class C | | | 1,000.00 | | | | 993.80 | | | | 1,014.32 | | | | 10.86 | | | | 10.97 | | | | 2.16 | | |
Multi-Asset Portfolio Class IS | | | 1,000.00 | | | | 1,000.30 | | | | 1,020.01 | | | | 5.19 | | | | 5.24 | | | | 1.03 | | |
* Expenses are calculated using each Fund Class' annualized net expense ratio (as disclosed), multiplied by the average account value over the period and multiplied by 184/365 (to reflect the most recent one-half year period).
** Annualized.
3
Morgan Stanley Institutional Fund, Inc.
Annual Report — December 31, 2018
Investment Overview (unaudited)
Multi-Asset Portfolio
The Fund seeks total return. The Fund's "Adviser," Morgan Stanley Investment Management Inc., seeks to achieve this objective with an emphasis on positive absolute return and controlling downside portfolio risk.
Performance
For the fiscal year ended December 31, 2018, the Fund's Class I shares had a total return based on net asset value and reinvestment of distributions per share of –0.32%, net of fees. The Fund's Class I shares underperformed the Fund's primary benchmark, the ICE BofAML U.S. Dollar 1-month LIBID Average Index (the "Index"), which returned 1.91%, but outperformed the secondary benchmark, the Customized MSIM Global Allocation Index (the "Customized Index"), which returned –6.00%. The Fund and benchmark index performance is in U.S. dollar ("USD") terms.
Factors Affecting Performance*(ii)
• Global equities fell –7.7% during 2018, the worst annual return since 2008 and the first negative full-year return since 2011 (as measured by the MSCI All Country World Index net total returns in local currency), amid declining central bank liquidity and slowing global growth. After a negative first quarter in which markets were weighed down by rising rates and inflation as well as increasing protectionism, global equities steadily rallied during the second and third quarters, propelled by strong U.S. earnings and economic growth. Global equities sold off again sharply in the fourth quarter (–12.5% as measured by the MSCI All Country World Index net total returns in local currency) on renewed concerns over rising rates and geopolitical tensions (Brexit, Italy and U.S.-China trade wars), now combined with slowing growth data in the U.S. and China.
• All equity regions had negative performance for the year. Despite the sharp (nearly –20%) sell-off in the fourth quarter, the U.S. was still the regional leader for the full year (–4.4%, S&P 500 Index, total return). A strong late-cycle economy combined with tax cuts helped 2018 U.S. earnings per share growth to surprise positively, growing +23% year-over-year. And yet stock prices fell by –6% (S&P 500 Index price return; or –4.4% on a total return basis including dividends), because trailing price-earnings
(P/E) multiples compressed by –24%.(iii) Multiple compression was driven by slowing growth, an increasingly hawkish Federal Reserve (Fed) for most of the year, and fears of peaking stimulus and earnings amid rising protectionism. Eurozone equities fell –12% (Euro Stoxx 50 Index in euros), hurt by last year's currency strength, political uncertainty in Italy, Brexit, persistently disappointing economic data and the end of the European Central Bank's (ECB) quantitative easing program in December. Emerging market (EM) equities fell –14.6% in USD and –10.1% in local currency in 2018 (MSCI Emerging Markets Index). EM equities initially rose in the first quarter when the USD weakened, then fell sharply in the second and third quarters, coming under immense pressure from Fed rate hikes, USD strength and a brewing trade war between the U.S. and China. They held up relatively well in the fourth quarter despite evidence of slowing Chinese growth, having already underperformed developed markets by –14% in the first three quarters of the year (MSCI Indices, in USD). Japanese equities were the laggards for 2018 (–17.6% TOPIX Index in yen). Japan equity markets fell during the first half of 2018 on concerns over withdrawal of monetary stimulus by the Bank of Japan as well as trade frictions with the U.S. They temporarily rebounded in the third quarter amid strong economic data (second quarter gross domestic product growth +3% quarter-over-quarter annualized(iv)), improving corporate earnings, yen weakness (–2.6% in the third quarter) and easing concerns around trade talks, but then were weighed down again in the fourth quarter by yen strength (+3.7% in the fourth quarter) amid risk-off flows.
(ii) Source: Morgan Stanley Investment Management (MSIM) Global Multi-Asset Team analysis; market data sourced from Bloomberg.
(iii) Source: MSIM Global Multi Asset Team analysis; IBES Pro Forma EPS as of January 9, 2019. Actual/trailing 2018 EPS rose by +22.6%, while trailing P/E multiples contracted by 23.5%, and the market fell –6.3% (1.23 x 0.76 = 0.94).
(iv) MSIM Global Multi Asset Team analysis; Bloomberg.
* Certain of the Fund's investment themes may, in whole or part, be implemented through the use of derivatives, including the purchase and sale of futures, options, swaps, structured investments (including commodity-linked notes) and other related instruments and techniques. The Fund may also invest in foreign currency forward exchange contracts, which are also derivatives, in connection with its investments in foreign securities. The Fund may use derivative instruments for a variety of purposes, including hedging, risk management, portfolio management or to earn income. As a result, the use of derivatives had a material effect on the Fund's performance during the period.
4
Morgan Stanley Institutional Fund, Inc.
Annual Report — December 31, 2018
Investment Overview (unaudited) (cont'd)
Multi-Asset Portfolio
• Global bonds were up slightly on a total return basis in local currency terms 2018 (J.P. Morgan Global Government Bond Index, +1%), but fell –0.7% in USD terms (also total return). However, U.S. Treasury yields rose during the year in response to strong fiscal stimulus-driven growth and signals from the Fed and ECB — until late in the year — that monetary policy would continue to tighten. The Fed delivered four rate hikes during the year and revised upward its projected path of rates. The U.S. 10-year yield rose during the first three quarters by +66 basis points (bps) to 3.06%, then retraced half of this in the fourth quarter, ending the year back down at 2.68% — the lowest level since January, amid a flight to quality assets and signals of a more dovish Fed in response to weakening economic data. The U.S. 2-year Treasury yield rose +60 bps during the year to 2.49%, flattening the 2-year to 10-year yield curve to just 20 bps. The flattening yield curve caused concern among many market participants, as yield curve inversion has historically been a precursor to recession. Safe German bond yields fell (German 10-year bund yield –19 bps for the year), on weaker economic data in the region and risk-off flows in response to political uncertainty in Italy and concerns around the fallout from Brexit. Italian yields spiked up 73 bps to 2.74%. Most risky spreads widened, with U.S. high yield particularly hard hit in the fourth quarter when spreads increased by 210 bps to end the year at 5.26% (Bloomberg Barclays U.S. High Yield Index option-adjusted spreads, +183 bps for the full year). Emerging market external bond spreads widened 124 bps during the year, as currency devaluations in the second and third quarters stoked higher inflation, prompting many central banks to hike rates amid slowing growth (J.P. Morgan EMBI Global Index, USD).
• The U.S. dollar rose 4.4% in 2018, pushed up by increasing interest rate differentials relative to most trading partners as well as investor flight to safe-haven assets amid an intensifying trade war between the U.S. and China. In emerging markets, Fed rate hikes, appreciation in the U.S. dollar and concerns over trade protectionism tipped the most vulnerable EM economies, such as those with large current account deficits like Argentina and Turkey, into crisis, and caused contagion to spread more broadly
in EM in the second and third quarters of the year. Many EM currencies sold off sharply, and although some losses were mitigated in the fourth quarter, for the full year the J.P. Morgan Emerging Market Currency Index was down –10.7%. The Argentine peso (–51%) was the worst performing currency despite securing a financing deal from the International Monetary Fund aimed at stemming foreign exchange weakness. The Turkish lira fell –28% as investors grew concerned over President Erdogan's increasingly authoritarian control over monetary policy, confrontations with the U.S. and the potential for lack of fiscal discipline under his leadership following his electoral win. The Brazilian real fell –17% on concerns over lack of political will to implement fiscal reforms and a truckers strike over rising fuel prices which disrupted economic activity. The contagion spread to South Africa and Russia, where currencies fell roughly –14% and 17%, respectively. One notable exception was the Mexican peso, which ended the year flat, helped in part by a relief rally on reduced uncertainty after Andres Manuel Lopez Obrador, known as AMLO, won the presidential election, and the U.S. and Mexico agreed on a revised trade deal (the U.S-Mexico-Canada Agreement) to replace the North American Free Trade Agreement, which left many of the original agreement's key provisions intact. The Japanese yen was the only major currency to strengthen versus the U.S. dollar (+2.8%) as a result of safe-haven inflows.
• Commodities fell –13.8% in 2018 (S&P GSCI Total Return Index in USD), driven by oil and industrial commodities falling –20% (Brent, copper). During the first three quarters of the year, oil rose nearly 16% on strong global growth, Venezuela's production collapse, U.S. sanctions on Iranian oil and bottlenecks in U.S. shale. However during the fourth quarter, Brent oil fell by –35% amid falling demand forecasts and oversupply concerns, as Saudi Arabia and Russia agreed to raise production and the U.S. announced waivers for importers of sanctioned Iranian oil. The price of copper fell throughout the year on trade-war fears, weakening Chinese data, and the stronger dollar.
• Positions within equities detracted from performance. Contributors during the period included short positions in Chinese equities
5
Morgan Stanley Institutional Fund, Inc.
Annual Report — December 31, 2018
Investment Overview (unaudited) (cont'd)
Multi-Asset Portfolio
(H-shares), as well as luxury goods and global machinery stocks, all relative to global equities. In addition, a long position in U.S. volatility (beta hedged) and a short position in emerging market equities relative to developed market equities also contributed to performance. These gains were offset by losses from long positions in U.S. consumer finance stocks relative to U.S. equites and Japanese equities relative to U.S. equities. In addition, our short positions in U.S. cyclical vs. U.S. defensive equities, Australian banks relative to developed market banks and global equities and Canadian banks relative to global equities all detracted from performance.
• Positions within fixed income contributed to performance. Contributors included directional long positions in Brazilian 3-year bonds, U.S. 10-year and 30-year Treasuries and Argentine 1-year USD bonds. Detractors during the period included long positions in U.S. 10-year TIPS (Treasury inflation-protected securities), South African 10-year bonds and Argentine 10-year bonds.
• Positions within commodities (implemented via commodity futures) had a positive impact on performance, as a short position in copper and a long position in gold both contributed.
• Currency positions (implemented via currency forwards and futures) negatively impacted performance. Short positions in the euro and in the Australian dollar, both relative to the U.S. dollar, contributed to performance. These gains were offset by losses from a short position in the Japanese yen relative to the U.S. dollar, as well as long positions in the Swedish krona relative to the euro, the Turkish lira and the Argentine peso (with the latter two both relative to emerging market currencies).
Management Strategies(v)
• As of December 31, 2018, the Fund's net equity exposure was 5.8%, net fixed income exposure was 35.2% (34.1% in U.S. 10-year Treasury duration-equivalent exposure) and net commodities exposure was 4.1%.(vi)
• Going into 2019, we expect global growth to slow, led down by the U.S. and China, and are neutral
global equities, modestly long bonds (primarily in U.S. Treasuries and TIPS), and short cyclical vs. defensive equities. As U.S. growth slows and converges with the rest of the world, we favor non-U.S. assets (equities, currencies) and are long gold. We are bearish on China-sensitive assets.
• After a 2018 in which the era of Free Money came to an end as the Fed raised the price of money from zero contributing to massive underperformance of equity markets relative to the real economy and profits, we expect a pause in the Fed's rate hiking cycle, a modest rebound in risky assets and a stabilization in equity market multiples in the first half of the year. By the second half, we expect the focus will shift from equity multiple compression (following 2018's –24% compression in U.S. P/E multiples) to earnings growth disappointments as a likely 2020 recession approaches.
• We are neutral global equities, despite slightly oversold conditions and cheap valuations (12.9x forward earnings are 6-7% cheap to our measure of fair value), given a deteriorating growth/inflation tradeoff and falling profits.(vii) We expect global gross domestic product growth to slow from the 2017 peak of 3.5% (and the current 2.9% pace) to 2.4% in the next 12 months, dragged down by the U.S. and China, while the rest of the world stabilizes.(viii) We expect modestly higher inflation globally, with U.S. core inflation rising +20 bps to 2.1% by end-2019.(viii) Europe and Japan core inflation will likely rise by a similar magnitude, albeit from lower levels (1% and 0.4%, respectively), and inflation in EM will remain mixed (low and stable in China and Brazil; rising in Europe, Middle East, Africa; falling in Argentina and Turkey).
(v) Source: Morgan Stanley Investment Management (MSIM) Global Multi-Asset Team analysis; market data sourced from Bloomberg; consensus estimates sourced from Thomson Reuters I/B/E/S.
(vi) The Fund seeks to achieve a consistent level of positive absolute returns while controlling downside portfolio risk. The Fund seeks to achieve this objective by taking long and short positions (often in the form of paired or hedged trades) in a range of equity and equity related securities of any market capitalization, bonds, currencies and commodities, which can result in negative net exposures. As the Fund's primary benchmark (the Bank of America Merrill Lynch U.S. Dollar 1-month LIBID Average Index) represents cash, the Fund will maintain, from time to time, significant exposure to a risk-free asset class.
(vii) Source: MSIM Global Multi Asset Team analysis; IBES.
(viii) Source: MSIM Global Multi Asset Team estimates.
6
Morgan Stanley Institutional Fund, Inc.
Annual Report — December 31, 2018
Investment Overview (unaudited) (cont'd)
Multi-Asset Portfolio
• We believe U.S. exceptionalism is coming to an end. In the last decade, better growth, more generous policy and beneficial stock market composition (e.g. more tech/internet and less banks/commodities) helped U.S. equities outperform global equities by 150%, resulting in U.S. stocks trading at a 40% premium to the rest of the world and the U.S. dollar trading 7% above its long-term average real effective exchange rate. But the winners of one decade are rarely the winners of the next, and we expect that the U.S. will "catch down" to the rest of the world, with U.S. economic growth slowing from 3.25% over the last three quarters to a 1.5% pace (similar to Europe and below emerging markets ex-China at 3-3.5%) by the end of 2019 as fiscal stimulus ends, financial conditions tighten and the strong dollar impacts net trade. We are short U.S. equities relative to the rest of the world and short the dollar vs. G-10 currencies and emerging currencies.
• We believe China bumpy landing risks are underappreciated and underpriced by markets. Chinese growth slowed over the last two to three quarters, and we expect this to continue as policy is constrained by existing economic imbalances. Investors are confident in the Chinese government's ability to achieve its policy objectives based on the success of this framework in 2008-09, 2011-2012 and 2015-16. But because of the irreconcilability of China's multiple policy objectives (growth above 6-6.5%, a stable currency, contained financial risks/leverage and no housing bubble), the government's easing campaign, which started in July 2018, has been much more modest than the prior three easing cycles. In addition, the effectiveness of policy easing is likely to be much reduced compared to prior episodes, given China's current debt levels (private non-financial debt of 206%, greater than any emerging and most developed countries).(ix) Eventually, Chinese policymakers will need to ease more aggressively, but this will occur after a deeper and longer slowdown than most expect. As a result, we are maintaining a cautious stance on Chinese stocks, the renminbi and developed market stocks most sensitive to Chinese growth and the currency, such
as luxury goods and elevator stocks. In emerging markets ex-China, we expect growth to rebound as Brazil, South Africa, Turkey and Argentina stabilize or exit recessions.
• In fixed income, we are modestly long U.S. Treasuries, given our expectation for slowing growth and a Fed pause. Treasuries are slightly cheap to fair value based on our model: U.S. 10-year yields, at 2.72%, are above fair value of 2.51% today and expected fair value of 2.36% by year-end 2019. Investor sentiment is neutral — having recently moved out of extreme oversold levels.
• In commodities, we are long gold (and gold mining stocks), which tends to outperform when real rates fall and the U.S. dollar weakens. Real rates are +50 bps, and an extended Fed pause could cause markets to begin to price in the possibility of a return to zero or even negative real rates. This would be very supportive of further upside for gold, particularly after a deep and multiyear bear market. In addition, a weaker dollar helps gold, as it typically means miners' costs are higher and global demand is stronger. We also expect supply-side dynamics to be supportive of the gold price over the next five years, as mine supply declines from multiple years of underinvestment.
(ix) Source: MSIM Global Multi Asset Team analysis; Bank for International Settlements.
7
Morgan Stanley Institutional Fund, Inc.
Annual Report — December 31, 2018
Investment Overview (unaudited) (cont'd)
Multi-Asset Portfolio
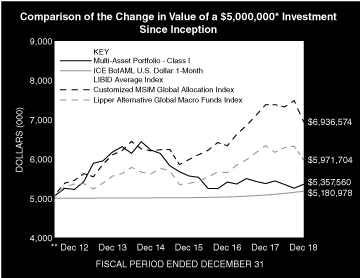
* Minimum Investment for Class I shares
** Commenced Operations on June 22, 2012.
In accordance with SEC regulations, the Fund's performance shown assumes that all recurring fees (including management fees) were deducted and all dividends and distributions were reinvested. The performance of Class A, L, C and IS shares will vary from the performance of Class I shares based upon their different inception dates and will be negatively impacted by additional fees assessed to those classes (if applicable).
Performance Compared to the ICE BofAML U.S. Dollar 1-Month LIBID Average Index(1), the Customized MSIM Global Allocation Index(2) and the Lipper Alternative Global Macro Funds Index(3)
| | | Period Ended December 31, 2018
Total Returns(4) | |
| | | | | Average Annual | |
| | | One
Year | | Five
Years | | Ten
Years | | Since
Inception(8) | |
Fund — Class I Shares
w/o sales charges(5) | | | –0.32 | % | | | –2.81 | % | | | — | | | | 1.06 | % | |
Fund — Class A Shares
w/o sales charges(5) | | | –0.59 | | | | –3.14 | | | | — | | | | 0.74 | | |
Fund — Class A Shares with
maximum 5.25% sales charges(5) | | | –5.81 | | | | –4.17 | | | | — | | | | –0.08 | | |
Fund — Class L Shares
w/o sales charges(5) | | | –1.04 | | | | –3.59 | | | | — | | | | 0.26 | | |
Fund — Class C Shares
w/o sales charges(6) | | | –1.48 | | | | — | | | | — | | | | –4.44 | | |
Fund — Class C Shares with
maximum 1.00% deferred
sales charges(6) | | | –2.45 | | | | — | | | | — | | | | –4.44 | | |
Fund — Class IS Shares
w/o sales charges(7) | | | –0.28 | | | | — | | | | — | | | | –3.00 | | |
ICE BofAML U.S. Dollar 1-Month
LIBID Average Index | | | 1.91 | | | | 0.68 | | | | — | | | | 0.55 | | |
Customized MSIM Global
Allocation Index | | | –6.00 | | | | 2.58 | | | | — | | | | 5.14 | | |
Lipper Alternative Global Macro
Funds Index | | | –5.78 | | | | 1.42 | | | | — | | | | 2.76 | | |
Performance data quoted represents past performance, which is no guarantee of future results, and current performance may be lower or higher than the figures shown. Performance assumes that all dividends and distributions, if any, were reinvested. For the most recent month-end performance figures, please visit www.morganstanley.com/im/shareholderreports. Investment return and principal value will fluctuate so that Fund shares, when redeemed, may be worth more or less than their original cost. Total returns do not reflect the deduction of taxes that a shareholder would pay on Fund distributions or the redemption of Fund shares. Performance of share classes will vary due to difference in sales charges and expenses.
(1) The ICE BofAML(Intercontinental Exchange Bank of America Merrill Lynch) U.S. Dollar 1-Month LIBID Average Index tracks the performance of a basket of synthetic assets paying LIBID to a stated maturity. The index purchases a new instrument each day, priced at par, having exactly its stated maturity and with a coupon equal to that day's fixing rate. All issues are held to maturity. Therefore, each day the index is comprised of a basket of securities. The index is not marked to market. The returns of the index represent the accrued income generated by the equally weighted average of all the coupons in the basket for a given day. The Index is unmanaged and its returns do not include any sales charges or fees. Such costs would lower performance. It is not possible to invest directly in an index.
8
Morgan Stanley Institutional Fund, Inc.
Annual Report — December 31, 2018
Investment Overview (unaudited) (cont'd)
Multi-Asset Portfolio
(2) The Customized MSIM Global Allocation Index is a performance linked benchmark comprised of 60% MSCI All Country World Index and 40% Bloomberg Barclays Global Aggregate Index for periods after May 31, 2017. Prior to May 31, 2017, the Customized MSIM Global Allocation Index consisted of 60% MSCI All Country World Index (benchmark that measures the equity market performance of developed and emerging markets), 30% Bloomberg Barclays Global Aggregate Index (benchmark that provides a broadbased measure of the global investment grade fixed-rate debt markets), 5% S&P GSCI Light Energy Index (benchmark for investment performance in the energy commodity market), and 5% ICE BofAML U.S. Dollar 1-Month LIBID Average Index (benchmark that tracks the performance of a basket of synthetic assets paying LIBID to a stated maturity). The Index is unmanaged and its returns do not include any sales charges or fees. Such costs would lower performance. It is not possible to invest directly in an index.
(3) The Lipper Alternative Global Macro Funds Index is an equally weighted performance index of the largest qualifying funds (based on net assets) in the Lipper Alternative Global Macro Funds classification. The Index, which is adjusted for capital gains distributions and income dividends, is unmanaged and should not be considered an investment. There are currently 30 funds represented in this Index. As of the date of this report, the Fund is in the Lipper Alternative Global Macro Funds classification.
(4) Total returns for the Fund reflect fees waived and expenses reimbursed, if applicable, by Morgan Stanley Investment Management Inc. (the "Adviser"). Without such waivers and reimbursements, total returns would have been lower.
(5) Commenced operations on June 22, 2012.
(6) Commenced offering on April 30, 2015.
(7) Commenced offering on May 29, 2015.
(8) For comparative purposes, average annual since inception returns listed for the Indexes refer to the inception date of Class I of the Fund, not the inception of the Index.
9
Morgan Stanley Institutional Fund, Inc.
Annual Report — December 31, 2018
Consolidated Portfolio of Investments
Multi-Asset Portfolio
| | | Shares | | Value
(000) | |
Common Stocks (9.1%) | |
Australia (0.1%) | |
Evolution Mining Ltd. | | | 2,355 | | | $ | 6 | | |
Goodman Group REIT | | | 33 | | | | — | @ | |
Independence Group NL | | | 957 | | | | 3 | | |
Newcrest Mining Ltd. | | | 1,552 | | | | 24 | | |
Northern Star Resources Ltd. | | | 940 | | | | 6 | | |
Regis Resources Ltd. | | | 967 | | | | 3 | | |
Resolute Mining Ltd. | | | 1,840 | | | | 2 | | |
Saracen Mineral Holdings Ltd. (a) | | | 1,416 | | | | 3 | | |
St. Barbara Ltd. | | | 1,045 | | | | 3 | | |
Stockland REIT | | | 70 | | | | — | @ | |
| | | | 50 | | |
Austria (0.3%) | |
Erste Group Bank AG (a) | | | 66 | | | | 2 | | |
Raiffeisen Bank International AG | | | 5,132 | | | | 131 | | |
| | | | 133 | | |
Canada (0.4%) | |
Agnico Eagle Mines Ltd. | | | 371 | | | | 15 | | |
Alamos Gold, Inc., Class A | | | 655 | | | | 2 | | |
Asanko Gold, Inc. (a) | | | 430 | | | | — | @ | |
B2Gold Corp. (a) | | | 1,669 | | | | 5 | | |
Barrick Gold Corp. | | | 1,797 | | | | 24 | | |
Centerra Gold, Inc. (a) | | | 409 | | | | 2 | | |
Detour Gold Corp. (a) | | | 356 | | | | 3 | | |
Eldorado Gold Corp. (a) | | | 351 | | | | 1 | | |
Endeavour Mining Corp. (a) | | | 149 | | | | 2 | | |
First Majestic Silver Corp. (a) | | | 328 | | | | 2 | | |
Fortuna Silver Mines, Inc. (a) | | | 374 | | | | 1 | | |
Franco-Nevada Corp. | | | 402 | | | | 28 | | |
Goldcorp, Inc. | | | 1,635 | | | | 16 | | |
Guyana Goldfields, Inc. (a) | | | 422 | | | | 1 | | |
IAMGOLD Corp. (a) | | | 945 | | | | 4 | | |
Kinross Gold Corp. (a) | | | 2,231 | | | | 7 | | |
Kirkland Lake Gold Ltd. | | | 375 | | | | 10 | | |
New Gold, Inc. (a) | | | 1,307 | | | | 1 | | |
OceanaGold Corp. | | | 1,073 | | | | 4 | | |
Osisko Gold Royalties Ltd. | | | 250 | | | | 2 | | |
Pan American Silver Corp. | | | 333 | | | | 5 | | |
Sandstorm Gold Ltd. (a) | | | 355 | | | | 2 | | |
SEMAFO, Inc. (a) | | | 560 | | | | 1 | | |
SSR Mining, Inc. (a) | | | 233 | | | | 3 | | |
Tahoe Resources, Inc. (a) | | | 750 | | | | 3 | | |
Torex Gold Resources, Inc. (a) | | | 117 | | | | 1 | | |
Wheaton Precious Metals Corp. | | | 854 | | | | 17 | | |
Yamana Gold, Inc. | | | 1,744 | | | | 4 | | |
| | | | 166 | | |
China (0.0%) | |
Zhaojin Mining Industry Co., Ltd. H Shares (b) | | | 2,157 | | | | 2 | | |
Zijin Mining Group Co., Ltd. H Shares (b) | | | 9,944 | | | | 4 | | |
| | | | 6 | | |
| | | Shares | | Value
(000) | |
Denmark (0.0%) | |
Danske Bank A/S | | | 212 | | | $ | 4 | | |
Germany (0.0%) | |
Commerzbank AG (a) | | | 222 | | | | 2 | | |
Hong Kong (0.0%) | |
Hanergy Thin Film Power Group Ltd. (a)(c)(d)
(acquisition cost — $1,231; acquired 4/10/15) | | | 178,000 | | | | 8 | | |
Italy (0.1%) | |
Intesa Sanpaolo SpA | | | 4,054 | | | | 9 | | |
Mediobanca Banca di Credito Finanziario SpA | | | 137 | | | | 1 | | |
UniCredit SpA | | | 563 | | | | 7 | | |
| | | | 17 | | |
Japan (0.1%) | |
Aozora Bank Ltd. | | | 24 | | | | 1 | | |
Bank of Kyoto Ltd. (The) | | | 11 | | | | — | @ | |
Chiba Bank Ltd. (The) | | | 125 | | | | 1 | | |
Concordia Financial Group Ltd. | | | 126 | | | | 1 | | |
Fukuoka Financial Group, Inc. | | | 30 | | | | 1 | | |
Japan Post Bank Co., Ltd. | | | 84 | | | | 1 | | |
Mebuki Financial Group, Inc. | | | 170 | | | | — | @ | |
Mizuho Financial Group, Inc. | | | 6,811 | | | | 11 | | |
Resona Holdings, Inc. | | | 531 | | | | 3 | | |
Seven Bank Ltd. | | | 123 | | | | — | @ | |
Shinsei Bank Ltd. | | | 34 | | | | — | @ | |
Shizuoka Bank Ltd. (The) | | | 93 | | | | 1 | | |
Sumitomo Mitsui Financial Group, Inc. | | | 451 | | | | 15 | | |
Sumitomo Mitsui Trust Holdings, Inc. | | | 68 | | | | 2 | | |
Suruga Bank Ltd. | | | 34 | | | | — | @ | |
Yamaguchi Financial Group, Inc. | | | 41 | | | | — | @ | |
| | | | 37 | | |
Norway (0.0%) | |
DNB ASA | | | 274 | | | | 4 | | |
Peru (0.0%) | |
Cia de Minas Buenaventura SA ADR | | | 339 | | | | 6 | | |
Poland (2.0%) | |
Alior Bank SA (a) | | | 2,152 | | | | 30 | | |
Bank Handlowy w Warszawie SA | | | 733 | | | | 14 | | |
Bank Millennium SA (a) | | | 12,275 | | | | 29 | | |
Bank Polska Kasa Opieki SA | | | 10,200 | | | | 297 | | |
mBank SA | | | 276 | | | | 31 | | |
Powszechna Kasa Oszczednosci Bank Polski SA | | | 35,810 | | | | 377 | | |
Santander Bank Polska SA | | | 920 | | | | 89 | | |
| | | | 867 | | |
South Africa (0.0%) | |
AngloGold Ashanti Ltd. | | | 604 | | | | 7 | | |
Gold Fields Ltd. | | | 1,410 | | | | 5 | | |
Harmony Gold Mining Co. Ltd. (a) | | | 630 | | | | 1 | | |
Sibanye Gold Ltd. (a) | | | 2,416 | | | | 2 | | |
| | | | 15 | | |
The accompanying notes are an integral part of the consolidated financial statements.
10
Morgan Stanley Institutional Fund, Inc.
Annual Report — December 31, 2018
Consolidated Portfolio of Investments (cont'd)
Multi-Asset Portfolio
| | | Shares | | Value
(000) | |
Sweden (0.1%) | |
Nordea Bank Abp | | | 852 | | | $ | 7 | | |
Skandinaviska Enskilda Banken AB, Class A | | | 360 | | | | 3 | | |
Svenska Handelsbanken AB, Class A | | | 429 | | | | 5 | | |
Swedbank AB, Class A | | | 254 | | | | 6 | | |
| | | | 21 | | |
United Kingdom (0.0%) | |
Centamin PLC | | | 2,207 | | | | 3 | | |
Randgold Resources Ltd. | | | 148 | | | | 12 | | |
| | | | 15 | | |
United States (6.0%) | |
Capital One Financial Corp. | | | 5,375 | | | | 406 | | |
Coeur Mining, Inc. (a) | | | 398 | | | | 2 | | |
Discover Financial Services | | | 7,065 | | | | 417 | | |
DR Horton, Inc. | | | 4,132 | | | | 143 | | |
Eagle Materials, Inc. | | | 549 | | | | 33 | | |
Fidelity National Financial, Inc. | | | 3,161 | | | | 99 | | |
First American Financial Corp. | | | 1,303 | | | | 58 | | |
Hecla Mining Co. | | | 849 | | | | 2 | | |
KB Home | | | 629 | | | | 12 | | |
Lennar Corp., Class A | | | 3,301 | | | | 129 | | |
Louisiana-Pacific Corp. | | | 1,665 | | | | 37 | | |
M/I Homes, Inc. (a) | | | 250 | | | | 5 | | |
Martin Marietta Materials, Inc. | | | 657 | | | | 113 | | |
Masco Corp. | | | 3,556 | | | | 104 | | |
McEwen Mining, Inc. | | | 408 | | | | 1 | | |
MDC Holdings, Inc. | | | 403 | | | | 11 | | |
Meritage Homes Corp. (a) | | | 342 | | | | 13 | | |
MGIC Investment Corp. (a) | | | 4,341 | | | | 45 | | |
Mohawk Industries, Inc. (a) | | | 672 | | | | 79 | | |
Newmont Mining Corp. | | | 1,007 | | | | 35 | | |
NVR, Inc. (a) | | | 41 | | | | 100 | | |
Owens Corning | | | 1,273 | | | | 56 | | |
Pulte Group, Inc. | | | 2,952 | | | | 77 | | |
Royal Gold, Inc. | | | 137 | | | | 12 | | |
Scotts Miracle-Gro Co. (The), Class A | | | 482 | | | | 30 | | |
Skyline Champion Corp. | | | 201 | | | | 3 | | |
Stewart Information Services Corp. | | | 186 | | | | 8 | | |
Synchrony Financial | | | 14,644 | | | | 344 | | |
Toll Brothers, Inc. | | | 1,682 | | | | 55 | | |
Universal Forest Products, Inc. | | | 469 | | | | 12 | | |
Vulcan Materials Co. | | | 1,501 | | | | 148 | | |
Watsco, Inc. | | | 386 | | | | 54 | | |
| | | | 2,643 | | |
Total Common Stocks (Cost $4,512) | | | 3,994 | | |
| | | Face
Amount
(000) | | Value
(000) | |
Fixed Income Securities (39.9%) | |
Sovereign (20.6%) | |
Argentina (8.7%) | |
Argentine Republic Government International Bond, | |
5.88%, 1/11/28 | | $ | 1,272 | | | $ | 919 | | |
6.25%, 4/22/19 | | | 2,892 | | | | 2,922 | | |
| | | | 3,841 | | |
Greece (7.2%) | |
Hellenic Republic Government Bond, | |
3.75%, 1/30/28 | | EUR | 2,883 | | | | 3,158 | | |
Portugal (4.7%) | |
Portugal Obrigacoes do Tesouro OT, | |
2.88%, 7/21/26 (e) | | | 811 | | | | 1,030 | | |
4.13%, 4/14/27 (e) | | | 749 | | | | 1,031 | | |
| | | | 2,061 | | |
Total Sovereign (Cost $8,905) | | | 9,060 | | |
U.S. Treasury Security (19.3%) | |
United States (19.3%) | |
U.S. Treasury Note
0.50%, 1/15/28 (Cost $8,668) | | $ | 8,923 | | | | 8,521 | | |
Total Fixed Income Securities (Cost $17,573) | | | 17,581 | | |
| | | Shares | | | |
Short-Term Investments (44.1%) | |
Investment Companies (25.0%) | |
iPATH S&P 500 VIX Short-Term Futures ETN | | | 11,746 | | | | 551 | | |
Morgan Stanley Institutional Liquidity
Funds — Government Portfolio —
Institutional Class (See Note G) | | | 10,466,781 | | | | 10,467 | | |
Total Investment Companies (Cost $8,905) | | | 11,018 | | |
| | | Face
Amount
(000) | | | |
U.S. Treasury Security (19.1%) | |
U.S. Treasury Bill,
2.38%, 3/21/19 (Cost $8,443) (f)(g) | | | 8,486 | | | | 8,443 | | |
Total Short-Term Investments (Cost $19,415) | | | 19,461 | | |
Total Investments (93.1%) (Cost $41,500) (h)(i)(j) | | | 41,036 | | |
Other Assets in Excess of Liabilities (6.9%) | | | 3,037 | | |
Net Assets (100.0%) | | $ | 44,073 | | |
Country assignments and aggregations are based generally on third party vendor classifications and information, and may be different from the assignments and aggregations under the policies set forth in the Fund's prospectus and/or statement of additional information relating to geographic classifications.
(a) Non-income producing security.
(b) Security trades on the Hong Kong exchange.
(c) Security has been deemed illiquid at December 31, 2018.
(d) At December 31, 2018, the Fund held a fair valued security valued at approximately $8,000, representing less than 0.05% of net assets. This security has been fair valued as determined in good faith under procedures established by and under the general supervision of the Company's Directors.
The accompanying notes are an integral part of the consolidated financial statements.
11
Morgan Stanley Institutional Fund, Inc.
Annual Report — December 31, 2018
Consolidated Portfolio of Investments (cont'd)
Multi-Asset Portfolio
(e) 144A security — Certain conditions for public sale may exist. Unless otherwise noted, these securities are deemed to be liquid.
(f) Rate shown is the yield to maturity at December 31, 2018.
(g) All or a portion of the security was pledged to cover margin requirements for swap agreements.
(h) The approximate fair value and percentage of net assets, $1,171,000 and 2.7%, respectively, represent the securities that have been fair valued under the fair valuation policy for international investments as described in Note A-1 within the Notes to the Consolidated Financial Statements.
(i) Securities are available for collateral in connection with open foreign currency forward exchange contracts, futures contracts and swap agreements.
(j) At December 31, 2018, the aggregate cost for federal income tax purposes is approximately $42,598,000. The aggregate gross unrealized appreciation is approximately $210,000 and the aggregate gross unrealized depreciation is approximately $1,667,000, resulting in net unrealized depreciation of approximately $1,457,000.
@ Value is less than $500.
ADR American Depositary Receipt.
ETN Exchange Traded Note.
REIT Real Estate Investment Trust.
Foreign Currency Forward Exchange Contracts:
The Fund had the following foreign currency forward exchange contracts open at December 31, 2018:
Counterparty | | Contracts to
Deliver
(000) | | In Exchange
For
(000) | | Delivery
Date | | Unrealized
Appreciation
(Depreciation)
(000) | |
BNP Paribas SA | | ARS | 5,774 | | | $ | 143 | | | 1/24/19 | | $ | (6 | ) | |
BNP Paribas SA | | ARS | 2,403 | | | $ | 61 | | | 1/24/19 | | | (1 | ) | |
BNP Paribas SA | | ARS | 6,413 | | | $ | 160 | | | 1/24/19 | | | (5 | ) | |
BNP Paribas SA | | ARS | 12,076 | | | $ | 260 | | | 1/24/19 | | | (51 | ) | |
BNP Paribas SA | | $ | 246 | | | ARS | 10,464 | | | 1/24/19 | | | 24 | | |
BNP Paribas SA | | $ | 32 | | | ARS | 1,271 | | | 1/24/19 | | | — | @ | |
BNP Paribas SA | | $ | 336 | | | ARS | 14,370 | | | 1/24/19 | | | 35 | | |
BNP Paribas SA | | $ | 225 | | | ARS | 9,995 | | | 1/24/19 | | | 33 | | |
BNP Paribas SA | | $ | 172 | | | ARS | 5,538 | | | 1/24/19 | | | (29 | ) | |
BNP Paribas SA | | $ | 68 | | | ARS | 3,257 | | | 1/24/19 | | | 16 | | |
BNP Paribas SA | | $ | 907 | | | ARS | 29,222 | | | 1/24/19 | | | (154 | ) | |
JPMorgan Chase Bank NA | | $ | 169 | | | ARS | 7,039 | | | 1/24/19 | | | 12 | | |
Bank of America NA | | CNH | 197 | | | $ | 29 | | | 3/14/19 | | | (— | @) | |
Bank of America NA | | CNH | 542 | | | $ | 79 | | | 3/14/19 | | | (— | @) | |
Bank of America NA | | ILS | 309 | | | $ | 83 | | | 3/14/19 | | | (— | @) | |
Bank of America NA | | $ | 284 | | | PLN | 1,068 | | | 3/14/19 | | | 2 | | |
Bank of Montreal | | CAD | 91 | | | $ | 68 | | | 3/14/19 | | | 1 | | |
Bank of Montreal | | $ | 284 | | | EUR | 248 | | | 3/14/19 | | | 2 | | |
Bank of Montreal | | $ | 62 | | | GBP | 49 | | | 3/14/19 | | | 1 | | |
Bank of Montreal | | $ | 56 | | | HUF | 15,892 | | | 3/14/19 | | | 1 | | |
Bank of Montreal | | $ | 362 | | | JPY | 40,513 | | | 3/14/19 | | | 9 | | |
Bank of New York Mellon | | $ | 5 | | | GBP | 4 | | | 3/14/19 | | | — | @ | |
Barclays Bank PLC | | $ | 4,490 | | | GBP | 3,540 | | | 3/14/19 | | | 37 | | |
Barclays Bank PLC | | $ | 327 | | | JPY | 36,557 | | | 3/14/19 | | | 8 | | |
Barclays Bank PLC | | $ | 414 | | | SGD | 567 | | | 3/14/19 | | | 2 | | |
BNP Paribas SA | | CAD | 240 | | | $ | 177 | | | 3/14/19 | | | — | @ | |
BNP Paribas SA | | CAD | 506 | | | $ | 377 | | | 3/14/19 | | | 6 | | |
BNP Paribas SA | | $ | 88 | | | CAD | 120 | | | 3/14/19 | | | (— | @) | |
BNP Paribas SA | | $ | 332 | | | RUB | 22,228 | | | 3/14/19 | | | (15 | ) | |
BNP Paribas SA | | $ | 31 | | | RUB | 2,153 | | | 3/14/19 | | | (— | @) | |
BNP Paribas SA | | $ | 338 | | | TWD | 10,334 | | | 3/14/19 | | | — | @ | |
Citibank NA | | CLP | 51,338 | | | $ | 75 | | | 3/14/19 | | | 1 | | |
Citibank NA | | CZK | 2,210 | | | $ | 98 | | | 3/14/19 | | | (1 | ) | |
Citibank NA | | $ | 2,247 | | | EUR | 1,963 | | | 3/14/19 | | | 15 | | |
Citibank NA | | $ | 508 | | | GBP | 401 | | | 3/14/19 | | | 4 | | |
Citibank NA | | $ | 292 | | | JPY | 32,690 | | | 3/14/19 | | | 7 | | |
Citibank NA | | $ | 615 | | | KRW | 690,183 | | | 3/14/19 | | | 5 | | |
Citibank NA | | $ | 296 | | | THB | 9,656 | | | 3/14/19 | | | 2 | | |
Commonwealth Bank of Australia | | $ | 747 | | | GBP | 589 | | | 3/14/19 | | | 6 | | |
Goldman Sachs International | | AUD | 262 | | | $ | 185 | | | 3/14/19 | | | (— | @) | |
Goldman Sachs International | | EUR | 261 | | | $ | 299 | | | 3/14/19 | | | (1 | ) | |
Goldman Sachs International | | HKD | 487 | | | $ | 62 | | | 3/14/19 | | | — | @ | |
Goldman Sachs International | | JPY | 5,029 | | | $ | 45 | | | 3/14/19 | | | (1 | ) | |
Goldman Sachs International | | $ | 100 | | | ARS | 4,228 | | | 3/14/19 | | | 3 | | |
The accompanying notes are an integral part of the consolidated financial statements.
12
Morgan Stanley Institutional Fund, Inc.
Annual Report — December 31, 2018
Consolidated Portfolio of Investments (cont'd)
Multi-Asset Portfolio
Foreign Currency Forward Exchange Contracts (cont'd):
Counterparty | | Contracts to
Deliver
(000) | | In Exchange
For
(000) | | Delivery
Date | | Unrealized
Appreciation
(Depreciation)
(000) | |
Goldman Sachs International | | $ | 37 | | | ARS | 1,554 | | | 3/14/19 | | $ | — | @ | |
Goldman Sachs International | | $ | 106 | | | AUD | 148 | | | 3/14/19 | | | (2 | ) | |
Goldman Sachs International | | $ | 190 | | | BRL | 742 | | | 3/14/19 | | | — | @ | |
Goldman Sachs International | | $ | 610 | | | EUR | 530 | | | 3/14/19 | | | 1 | | |
Goldman Sachs International | | $ | 62 | | | EUR | 54 | | | 3/14/19 | | | — | @ | |
Goldman Sachs International | | $ | 52 | | | GBP | 41 | | | 3/14/19 | | | — | @ | |
Goldman Sachs International | | $ | 16 | | | HUF | 4,594 | | | 3/14/19 | | | — | @ | |
Goldman Sachs International | | $ | 186 | | | IDR | 2,731,888 | | | 3/14/19 | | | 2 | | |
Goldman Sachs International | | $ | 388 | | | JPY | 43,411 | | | 3/14/19 | | | 10 | | |
Goldman Sachs International | | $ | 248 | | | JPY | 27,242 | | | 3/14/19 | | | 2 | | |
Goldman Sachs International | | ZAR | 4,192 | | | $ | 291 | | | 3/14/19 | | | 2 | | |
JPMorgan Chase Bank NA | | PHP | 92,820 | | | $ | 1,755 | | | 3/14/19 | | | 1 | | |
JPMorgan Chase Bank NA | | $ | 83 | | | CHF | 82 | | | 3/14/19 | | | 1 | | |
JPMorgan Chase Bank NA | | $ | 80 | | | GBP | 63 | | | 3/14/19 | | | — | @ | |
JPMorgan Chase Bank NA | | $ | 136 | | | INR | 9,809 | | | 3/14/19 | | | 4 | | |
JPMorgan Chase Bank NA | | $ | 105 | | | JPY | 11,690 | | | 3/14/19 | | | 3 | | |
JPMorgan Chase Bank NA | | $ | 747 | | | MXN | 15,232 | | | 3/14/19 | | | 20 | | |
JPMorgan Chase Bank NA | | ZAR | 459 | | | $ | 32 | | | 3/14/19 | | | — | @ | |
JPMorgan Chase Bank NA | | ZAR | 4,852 | | | $ | 336 | | | 3/14/19 | | | 2 | | |
UBS AG | | DKK | 99 | | | $ | 15 | | | 3/14/19 | | | (— | @) | |
UBS AG | | $ | 35 | | | CHF | 35 | | | 3/14/19 | | | — | @ | |
UBS AG | | $ | 182 | | | EUR | 158 | | | 3/14/19 | | | (— | @) | |
UBS AG | | $ | 673 | | | EUR | 588 | | | 3/14/19 | | | 5 | | |
UBS AG | | $ | 78 | | | GBP | 61 | | | 3/14/19 | | | (— | @) | |
UBS AG | | $ | 981 | | | GBP | 773 | | | 3/14/19 | | | 8 | | |
UBS AG | | $ | 163 | | | JPY | 18,264 | | | 3/14/19 | | | 4 | | |
UBS AG | | $ | 127 | | | SEK | 1,142 | | | 3/14/19 | | | 3 | | |
UBS AG | | $ | 184 | | | TRY | 1,031 | | | 3/14/19 | | | 4 | | |
Goldman Sachs International | | BRL | 785 | | | $ | 204 | | | 5/16/19 | | | 4 | | |
Goldman Sachs International | | BRL | 364 | | | $ | 91 | | | 5/16/19 | | | (2 | ) | |
Goldman Sachs International | | BRL | 11,319 | | | $ | 2,928 | | | 5/16/19 | | | 36 | | |
Goldman Sachs International | | BRL | 11,461 | | | $ | 2,960 | | | 5/16/19 | | | 33 | | |
Goldman Sachs International | | BRL | 30,687 | | | $ | 7,949 | | | 5/16/19 | | | 111 | | |
Goldman Sachs International | | $ | 1,384 | | | BRL | 5,841 | | | 5/16/19 | | | 108 | | |
Goldman Sachs International | | $ | 2,074 | | | BRL | 8,833 | | | 5/16/19 | | | 182 | | |
Goldman Sachs International | | $ | 145 | | | BRL | 614 | | | 5/16/19 | | | 11 | | |
Goldman Sachs International | | $ | 3,136 | | | BRL | 12,128 | | | 5/16/19 | | | (39 | ) | |
Goldman Sachs International | | $ | 262 | | | BRL | 1,013 | | | 5/16/19 | | | (4 | ) | |
Goldman Sachs International | | $ | 2,142 | | | BRL | 8,166 | | | 5/16/19 | | | (56 | ) | |
Goldman Sachs International | | $ | 48 | | | BRL | 196 | | | 5/16/19 | | | 2 | | |
Goldman Sachs International | | $ | 2,076 | | | BRL | 7,809 | | | 5/16/19 | | | (82 | ) | |
Goldman Sachs International | | $ | 138 | | | BRL | 517 | | | 5/16/19 | | | (6 | ) | |
Goldman Sachs International | | $ | 2,458 | | | BRL | 9,433 | | | 5/16/19 | | | (49 | ) | |
JPMorgan Chase Bank NA | | CNH | 609 | | | $ | 89 | | | 6/20/19 | | | — | @ | |
JPMorgan Chase Bank NA | | CNH | 1,669 | | | $ | 249 | | | 6/20/19 | | | 6 | | |
JPMorgan Chase Bank NA | | CNH | 41,081 | | | $ | 6,158 | | | 6/20/19 | | | 178 | | |
JPMorgan Chase Bank NA | | CNH | 694 | | | $ | 100 | | | 6/20/19 | | | (1 | ) | |
JPMorgan Chase Bank NA | | $ | 191 | | | CNH | 1,316 | | | 6/20/19 | | | 1 | | |
JPMorgan Chase Bank NA | | $ | 6,102 | | | CNH | 42,737 | | | 6/20/19 | | | 119 | | |
JPMorgan Chase Bank NA | | $ | 1,478 | | | CNH | 10,306 | | | 10/17/19 | | | 22 | | |
JPMorgan Chase Bank NA | | $ | 210 | | | CNY | 1,447 | | | 10/17/19 | | | (— | @) | |
JPMorgan Chase Bank NA | | CNH | 634 | | | $ | 90 | | | 10/17/19 | | | (2 | ) | |
JPMorgan Chase Bank NA | | CNH | 42,737 | | | $ | 6,082 | | | 10/17/19 | | | (138 | ) | |
JPMorgan Chase Bank NA | | CNH | 65,625 | | | $ | 9,352 | | | 10/17/19 | | | (199 | ) | |
| | | | | | | | | $ | 273 | | |
The accompanying notes are an integral part of the consolidated financial statements.
13
Morgan Stanley Institutional Fund, Inc.
Annual Report — December 31, 2018
Consolidated Portfolio of Investments (cont'd)
Multi-Asset Portfolio
Futures Contracts:
The Fund had the following futures contracts open at December 31, 2018:
| | | Number
of
Contracts | | Expiration
Date | | Notional Amount
(000) | | Value
(000) | | Unrealized
Appreciation
(Depreciation)
(000) | |
Long: | |
100 oz Gold Future (United States) | | | 14 | | | Feb-19 | | $ | 1 | | | $ | 1,794 | | | $ | 73 | | |
Euro Stoxx 50 (Germany) | | | 95 | | | Mar-19 | | | 1 | | | | 3,237 | | | | (88 | ) | |
MSCI Emerging Market E Mini (United States) | | | 68 | | | Mar-19 | | | 3 | | | | 3,287 | | | | (77 | ) | |
NIKKEI 225 Index (Japan) | | | 20 | | | Mar-19 | | | 10 | | | | 1,808 | | | | (100 | ) | |
U.S. Treasury 10 yr. Ultra Long Bond (United States) | | | 33 | | | Mar-19 | | | 3,300 | | | | 4,292 | | | | 139 | | |
U.S. Treasury Ultra Bond (United States) | | | 6 | | | Mar-19 | | | 600 | | | | 964 | | | | 51 | | |
Short: | |
Euro FX Currency (United States) | | | 70 | | | Mar-19 | | | (8,750 | ) | | | (10,082 | ) | | | (87 | ) | |
Euro OAT (Germany) | | | 4 | | | Mar-19 | | | (400 | ) | | | (691 | ) | | | — | @ | |
German Euro BONO (Germany) | | | 2 | | | Mar-19 | | | (200 | ) | | | (331 | ) | | | (3 | ) | |
German Euro BTP (Germany) | | | 20 | | | Mar-19 | | | (2,000 | ) | | | (3,748 | ) | | | (28 | ) | |
German Euro BTP (Germany) | | | 19 | | | Mar-19 | | | (1,900 | ) | | | (2,783 | ) | | | (100 | ) | |
S&P 500 E Mini Index (United States) | | | 12 | | | Mar-19 | | | (1 | ) | | | (1,503 | ) | | | (4 | ) | |
| | | | | | | | | | | $ | (224 | ) | |
Interest Rate Swap Agreements:
The Fund had the following interest rate swap agreements open at December 31, 2018:
Swap Counterparty | | Floating
Rate
Index | | Pay/Receive
Floating Rate | | Fixed
Rate | | Payment
Frequency
Paid/
Received | | Maturity
Date | | Notional
Amount
(000) | | Value
(000) | | Upfront
Payment
Paid
(000) | | Unrealized
Appreciation
(Depreciation)
(000) | |
Morgan Stanley &
Co. LLC* | | 3 Month JIBAR | | Pay | | | 8.68 | % | | Quarterly/Quarterly | | 10/26/28 | | $ | 2,515 | | | $ | 7 | | | $ | — | | | $ | 7 | | |
Morgan Stanley &
Co. LLC* | | 3 Month JIBAR | | Pay | | | 7.88 | | | Quarterly/Quarterly | | 1/4/28 | | | 13,965 | | | | (12 | ) | | | — | | | | (12 | ) | |
Morgan Stanley &
Co. LLC* | | 3 Month JIBAR | | Pay | | | 7.83 | | | Quarterly/Quarterly | | 1/19/28 | | | 8,511 | | | | (10 | ) | | | — | | | | (10 | ) | |
Morgan Stanley &
Co. LLC* | | 3 Month JIBAR | | Pay | | | 7.81 | | | Quarterly/Quarterly | | 1/24/28 | | | 15,889 | | | | (20 | ) | | | — | | | | (20 | ) | |
Morgan Stanley &
Co. LLC* | | 3 Month JIBAR | | Pay | | | 7.71 | | | Quarterly/Quarterly | | 4/26/28 | | | 8,642 | | | | (16 | ) | | | — | | | | (16 | ) | |
| | | | | | | | | | | | | | | $ | (51 | ) | | $ | — | | | $ | (51 | ) | |
Total Return Swap Agreements:
The Fund had the following total return swap agreements open at December 31, 2018:
Swap Counterparty | | Index | | Pay/Receive
Total Return
of Referenced
Index | | Floating
Rate | | Payment
Frequency | | Maturity
Date | | Notional
Amount
(000) | | Value
(000) | | Upfront
Payment
Paid
(000) | | Unrealized
Appreciation
(Depreciation)
(000) | |
Barclays Bank PLC | | Barclays Canada
Banks Index†† | |
Pay | | 3 Month CDOR
plus 0.00% | |
Quarterly | |
5/8/19 | | CAD | 273 | | | $ | (2 | ) | | $ | — | | | $ | (2 | ) | |
Barclays Bank PLC | | Barclays Canada
Banks Index†† | | Pay | | 3 Month CDOR
plus 0.00% | | Quarterly | | 5/8/19 | | | 1,779 | | | | 51 | | | | — | | | | 51 | | |
Barclays Bank PLC | | Barclays Canada
Banks Index†† | | Pay | | 3 Month CDOR
plus 0.00% | | Quarterly | | 5/8/19 | | | 126 | | | | 6 | | | | — | | | | 6 | | |
Barclays Bank PLC | | Barclays Canada
Banks Index†† | | Pay | | 3 Month CDOR
plus 0.00% | | Quarterly | | 5/8/19 | | | 1,627 | | | | 76 | | | | — | | | | 76 | | |
Barclays Bank PLC | | Barclays Canada
Banks Index†† | | Pay | | 3 Month CDOR
plus 0.00% | | Quarterly | | 5/8/19 | | | 169 | | | | 8 | | | | — | | | | 8 | | |
Barclays Bank PLC | | Barclays Custom Short
Elevators Index†† | | Pay | | 3 Month USD
LIBOR plus 0.25% | | Quarterly | | 3/6/19 | | $ | 362 | | | | 19 | | | | — | | | | 19 | | |
Barclays Bank PLC | | Barclays Custom Short
Elevators Index†† | | Pay | | 3 Month USD
LIBOR plus 0.25% | | Quarterly | | 3/6/19 | | | 124 | | | | 7 | | | | — | | | | 7 | | |
The accompanying notes are an integral part of the consolidated financial statements.
14
Morgan Stanley Institutional Fund, Inc.
Annual Report — December 31, 2018
Consolidated Portfolio of Investments (cont'd)
Multi-Asset Portfolio
Total Return Swap Agreements (cont'd):
Swap Counterparty | | Index | | Pay/Receive
Total Return
of Referenced
Index | | Floating
Rate | | Payment
Frequency | | Maturity
Date | | Notional
Amount
(000) | | Value
(000) | | Upfront
Payment
Paid
(000) | | Unrealized
Appreciation
(Depreciation)
(000) | |
Barclays Bank PLC | | Barclays Custom Short
Elevators Index†† | | Pay | | 3 Month USD
LIBOR plus 0.25% | | Quarterly | | 3/6/19 | | $ | 237 | | | $ | 13 | | | $ | — | | | $ | 13 | | |
Barclays Bank PLC | | Barclays Canada Banks
Index†† | | Pay | | 3 Month CDOR
plus 0.00% | | Quarterly | | 5/8/19 | | CAD | 280 | | | | 13 | | | | — | | | | 13 | | |
BNP Paribas SA | | Barclays Elevators
Index†† | | Pay | | 3 Month USD
LIBOR plus 0.27% | | Quarterly | | 5/1/19 | | $ | 88 | | | | (2 | ) | | | — | | | | (2 | ) | |
BNP Paribas SA | | Barclays Elevators
Index†† | | Pay | | 3 Month USD
LIBOR plus 0.27% | | Quarterly | | 5/1/19 | | | 352 | | | | 10 | | | | — | | | | 10 | | |
BNP Paribas SA | | Barclays Elevators
Index†† | | Pay | | 3 Month USD
LIBOR plus 0.27% | | Quarterly | | 5/1/19 | | | 427 | | | | 12 | | | | — | | | | 12 | | |
BNP Paribas SA | | Barclays Elevators
Index†† | | Pay | | 3 Month USD
LIBOR plus 0.20% | | Quarterly | | 5/1/19 | | | 1,263 | | | | 36 | | | | — | | | | 36 | | |
BNP Paribas SA | | Barclays Elevators
Index†† | | Pay | | 3 Month USD
LIBOR plus 0.03% | | Quarterly | | 5/1/19 | | | 273 | | | | 8 | | | | — | | | | 8 | | |
BNP Paribas SA | | Barclays Elevators
Index†† | | Pay | | 3 Month USD
LIBOR plus 0.03% | | Quarterly | | 5/1/19 | | | 501 | | | | 14 | | | | — | | | | 14 | | |
Barclays Bank PLC | | Barclays Custom Short
Elevators Index†† | | Pay | | 3 Month USD
LIBOR plus 0.25% | | Quarterly | | 3/6/19 | | | 52 | | | | 3 | | | | — | | | | 3 | | |
BNP Paribas SA | | Alerian MLP Total Return
Index | | Receive | | 3 Month USD
LIBOR plus 0.47% | | Quarterly | | 5/30/19 | | | 88 | | | | (8 | ) | | | — | | | | (8 | ) | |
BNP Paribas SA | | Alerian MLP Total Return
Index | | Receive | | 3 Month USD
LIBOR plus 0.47% | | Quarterly | | 5/30/19 | | | 330 | | | | (30 | ) | | | — | | | | (30 | ) | |
BNP Paribas SA | | MSCI U.S. Banks Gross
Total Return Index | | Pay | | 3 Month USD
LIBOR plus 0.14% | | Quarterly | | 6/14/19 | | | 54 | | | | 2 | | | | — | | | | 2 | | |
BNP Paribas SA | | MSCI U.S. Banks Gross
Total Return Index | | Pay | | 3 Month USD
LIBOR plus 0.14% | | Quarterly | | 6/14/19 | | | 357 | | | | 16 | | | | — | | | | 16 | | |
BNP Paribas SA | | MSCI U.S. Banks Gross
Total Return Index | | Pay | | 3 Month USD
LIBOR plus 0.14% | | Quarterly | | 6/14/19 | | | 191 | | | | 8 | | | | — | | | | 8 | | |
BNP Paribas SA | | MSCI U.S. Banks Gross
Total Return Index | | Pay | | 3 Month USD
LIBOR plus 0.14% | | Quarterly | | 6/14/19 | | | 272 | | | | 11 | | | | — | | | | 11 | | |
BNP Paribas SA | | MSCI U.S. Banks Gross
Total Return Index | | Pay | | 3 Month USD
LIBOR plus 0.14% | | Quarterly | | 6/14/19 | | | 136 | | | | 6 | | | | — | | | | 6 | | |
BNP Paribas SA | | MSCI U.S. Banks Gross
Total Return Index | | Pay | | 3 Month USD
LIBOR plus 0.14% | | Quarterly | | 6/14/19 | | | 205 | | | | 9 | | | | — | | | | 9 | | |
Goldman Sachs & Co. | | MSCI China Gross
Total Return Index | | Pay | | 3 Month USD
LIBOR plus 0.10% | | Quarterly | | 11/14/19 | | | 792 | | | | 6 | | | | — | | | | 6 | | |
Goldman Sachs & Co. | | MSCI China Gross
Total Return Index | | Pay | | 3 Month USD
LIBOR plus 0.10% | | Quarterly | | 11/14/19 | | | 629 | | | | 19 | | | | — | | | | 19 | | |
JPMorgan Chase
Bank NA | | Alerian MLP
Total Return Index | | Receive | | 3 Month USD
LIBOR plus 0.48% | | Quarterly | | 5/30/19 | | | 502 | | | | (45 | ) | | | — | | | | (45 | ) | |
JPMorgan Chase
Bank, NA | | JPM Custom Long U.S.
Defensives Index†† | | Receive | | 3 Month USD
LIBOR plus 0.55% | | Quarterly | | 11/20/19 | | | 122 | | | | 1 | | | | — | | | | 1 | | |
JPMorgan Chase
Bank, NA | | JPM Custom Long U.S.
Defensives Index†† | | Receive | | 3 Month USD
LIBOR plus 0.55% | | Quarterly | | 11/20/19 | | | 50 | | | | (2) | | | | — | | | | (2) | | |
JPMorgan Chase
Bank, NA | | JPM Custom Long U.S.
Defensives Index†† | | Receive | | 3 Month USD
LIBOR plus 0.55% | | Quarterly | | 11/20/19 | | | 691 | | | | (40 | ) | | | — | | | | (40 | ) | |
JPMorgan Chase
Bank, NA | | JPM Custom Short U.S.
Cyclicals Index†† | | Pay | | 3 Month USD
LIBOR plus 0.38% | | Quarterly | | 11/20/19 | | | 147 | | | | (5 | ) | | | — | | | | (5 | ) | |
JPMorgan Chase
Bank, NA | | JPM Custom Short U.S.
Cyclicals Index†† | | Pay | | 3 Month USD
LIBOR plus 0.38% | | Quarterly | | 11/20/19 | | | 50 | | | | 3 | | | | — | | | | 3 | | |
JPMorgan Chase
Bank, NA | | JPM Custom Short U.S.
Cyclicals Index†† | | Pay | | 3 Month USD
LIBOR plus 0.38% | | Quarterly | | 11/20/19 | | | 701 | | | | 64 | | | | — | | | | 64 | | |
| | | | | | | | | | | | | | | $ | 287 | | | $ | — | | | $ | 287 | | |
†† See tables below for details of the equity basket holdings underlying the swap.
The accompanying notes are an integral part of the consolidated financial statements.
15
Morgan Stanley Institutional Fund, Inc.
Annual Report — December 31, 2018
Consolidated Portfolio of Investments (cont'd)
Multi-Asset Portfolio
The following table represents the equity basket holdings underlying the total return swap with Barclays Canada Banks Index as of December 31, 2018:
Security Description | | Shares | | Value
(000) | | Index Weight | |
Barclays Canada Banks Index | |
Bank of Montreal | | | 649 | | | $ | 42 | | | | 12.47 | % | |
Bank of Nova Scotia (The) | | | 1,199 | | | | 60 | | | | 17.56 | | |
Canadian Imperial Bank of Commerce | | | 436 | | | | 33 | | | | 9.54 | | |
National Bank of Canada | | | 340 | | | | 14 | | | | 4.10 | | |
Royal Bank of Canada | | | 1,458 | | | | 100 | | | | 29.32 | | |
Toronto-Dominion Bank (The) | | | 1,849 | | | | 92 | | | | 27.01 | | |
Total | | | | $ | 341 | | | | 100.00 | % | |
The following table represents the equity basket holdings underlying the total return swap with Barclays Custom Short Elevators Index as of December 31, 2018:
Security Description | | Shares | | Value
(000) | | Index Weight | |
Barclays Custom Short Elevators Index | |
Fujitec Co., Ltd. | | | 27,700 | | | $ | 298 | | | | 2.09 | % | |
Kone Oyj | | | 157,078 | | | | 7,490 | | | | 52.48 | | |
Schindler Holding AG | | | 31,545 | | | | 6,249 | | | | 43.79 | | |
Yungtay Engineering Co., Ltd. | | | 121,000 | | | | 234 | | | | 1.64 | | |
Total | | | | $ | 14,271 | | | | 100.00 | % | |
The following table represents the equity basket holdings underlying the total return swap with Barclays Elevators Index as of December 31, 2018:
Security Description | | Shares | | Value
(000) | | Index Weight | |
Barclays Elevators Index | |
Brunello Cucinelli SpA | | | 94 | | | $ | 3 | | | | 0.40 | % | |
Burberry Group PLC | | | 1,174 | | | | 26 | | | | 3.21 | | |
Christian Dior SE | | | 65 | | | | 25 | | | | 3.05 | | |
Cie Financiere Richemont SA | | | 1,578 | | | | 101 | | | | 12.49 | | |
Hermes International | | | 87 | | | | 48 | | | | 5.97 | | |
Hugo Boss AG | | | 194 | | | | 12 | | | | 1.48 | | |
Kering SA | | | 347 | | | | 164 | | | | 20.22 | | |
LVMH Moet Hennessy Louis Vuitton SE | | | 1,046 | | | | 309 | | | | 38.20 | | |
Moncler SpA | | | 700 | | | | 23 | | | | 2.86 | | |
Puma SE | | | 29 | | | | 14 | | | | 1.75 | | |
Salvatore Ferragamo SpA | | | 465 | | | | 9 | | | | 1.16 | | |
Swatch Group AG (The) | | | 151 | | | | 44 | | | | 5.43 | | |
Tapestry, Inc. | | | 782 | | | | 26 | | | | 3.25 | | |
Tod's SpA | | | 91 | | | | 4 | | | | 0.53 | | |
Total | | | | $ | 808 | | | | 100.00 | % | |
The following table represents the equity basket holdings underlying the total return swap with JPM Custom Long U.S. Defensives Index as of December 31, 2018:
Security Description | | Shares | | Value
(000) | | Index Weight | |
JPM Custom Long U.S. Defensives Index | |
Abbott Laboratories | | | 25,376 | | | $ | 1,427 | | | | 14.41 | % | |
AbbVie, Inc. | | | 38,194 | | | | 1,090 | | | | 11.01 | | |
AES Corp. | | | 3,581 | | | | 329 | | | | 3.32 | | |
Agilent Technologies, Inc. | | | 1,641 | | | | 285 | | | | 2.88 | | |
Alexion Pharmaceuticals, Inc. | | | 2,174 | | | | 281 | | | | 2.84 | | |
Align Technology, Inc. | | | 5,391 | | | | 255 | | | | 2.58 | | |
The accompanying notes are an integral part of the consolidated financial statements.
16
Morgan Stanley Institutional Fund, Inc.
Annual Report — December 31, 2018
Consolidated Portfolio of Investments (cont'd)
Multi-Asset Portfolio
Security Description | | Shares | | Value
(000) | | Index Weight | |
JPM Custom Long U.S. Defensives Index (cont'd) | |
Allergan PLC | | | 2,006 | | | $ | 222 | | | | 2.24 | % | |
Alliant Energy Corp. | | | 2,454 | | | | 212 | | | | 2.14 | | |
Altria Group, Inc. | | | 4,834 | | | | 211 | | | | 2.13 | | |
Ameren Corp. | | | 783 | | | | 195 | | | | 1.97 | | |
American Electric Power Co., Inc. | | | 2,056 | | | | 192 | | | | 1.94 | | |
American Water Works Co., Inc. | | | 2,215 | | | | 169 | | | | 1.71 | | |
AmerisourceBergen Corp. | | | 2,253 | | | | 161 | | | | 1.63 | | |
Amgen, Inc. | | | 3,504 | | | | 154 | | | | 1.56 | | |
Anthem, Inc. | | | 3,366 | | | | 152 | | | | 1.53 | | |
Archer-Daniels-Midland Co. | | | 2,181 | | | | 146 | | | | 1.47 | | |
AT&T, Inc. | | | 2,694 | | | | 133 | | | | 1.34 | | |
Baxter International, Inc. | | | 1,724 | | | | 129 | | | | 1.30 | | |
Becton Dickinson and Co. | | | 616 | | | | 125 | | | | 1.27 | | |
Biogen, Inc. | | | 1,291 | | | | 119 | | | | 1.20 | | |
Boston Scientific Corp. | | | 591 | | | | 115 | | | | 1.16 | | |
Bristol-Myers Squibb Co. | | | 1,653 | | | | 108 | | | | 1.09 | | |
Brown-Forman Corp. | | | 1,407 | | | | 102 | | | | 1.03 | | |
Campbell Soup Co. | | | 1,097 | | | | 100 | | | | 1.01 | | |
Cardinal Health, Inc. | | | 880 | | | | 95 | | | | 0.96 | | |
Celgene Corp. | | | 1,774 | | | | 92 | | | | 0.93 | | |
Centene Corp. | | | 6,044 | | | | 92 | | | | 0.93 | | |
CenterPoint Energy, Inc. | | | 785 | | | | 91 | | | | 0.92 | | |
CenturyLink, Inc. | | | 1,780 | | | | 88 | | | | 0.89 | | |
Cerner Corp. | | | 2,117 | | | | 85 | | | | 0.86 | | |
Church & Dwight Co., Inc. | | | 1,219 | | | | 83 | | | | 0.84 | | |
Cigna Corp. | | | 1,086 | | | | 83 | | | | 0.84 | | |
Clorox Co. (The) | | | 1,106 | | | | 77 | | | | 0.78 | | |
CMS Energy Corp. | | | 1,237 | | | | 74 | | | | 0.75 | | |
Coca-Cola Co. (The) | | | 324 | | | | 73 | | | | 0.74 | | |
Colgate-Palmolive Co. | | | 1,111 | | | | 72 | | | | 0.73 | | |
Conagra Brands, Inc. | | | 629 | | | | 69 | | | | 0.70 | | |
Consolidated Edison, Inc. | | | 1,328 | | | | 69 | | | | 0.70 | | |
Constellation Brands, Inc. | | | 2,395 | | | | 68 | | | | 0.69 | | |
Cooper Cos, Inc. (The) | | | 1,058 | | | | 66 | | | | 0.67 | | |
Costco Wholesale Corp. | | | 1,142 | | | | 65 | | | | 0.65 | | |
Coty, Inc. | | | 318 | | | | 60 | | | | 0.61 | | |
CVS Health Corp. | | | 1,558 | | | | 59 | | | | 0.59 | | |
Danaher Corp. | | | 625 | | | | 57 | | | | 0.57 | | |
DaVita, Inc. | | | 496 | | | | 57 | | | | 0.57 | | |
Dentsply Sirona, Inc. | | | 213 | | | | 56 | | | | 0.57 | | |
Dominion Energy, Inc. | | | 851 | | | | 56 | | | | 0.56 | | |
DTE Energy Co. | | | 629 | | | | 54 | | | | 0.55 | | |
Duke Energy Corp. | | | 171 | | | | 51 | | | | 0.52 | | |
Edison International | | | 495 | | | | 51 | | | | 0.52 | | |
Edwards Lifesciences Corp. | | | 989 | | | | 49 | | | | 0.50 | | |
Eli Lilly & Co. | | | 214 | | | | 48 | | | | 0.49 | | |
Entergy Corp. | | | 91 | | | | 44 | | | | 0.44 | | |
Estee Lauder Cos, Inc. (The) | | | 682 | | | | 43 | | | | 0.43 | | |
Eversource Energy | | | 1,798 | | | | 43 | | | | 0.43 | | |
Exelon Corp. | | | 1,511 | | | | 43 | | | | 0.43 | | |
FirstEnergy Corp. | | | 1,054 | | | | 42 | | | | 0.42 | | |
General Mills, Inc. | | | 261 | | | | 41 | | | | 0.41 | | |
Gilead Sciences, Inc. | | | 314 | | | | 41 | | | | 0.41 | | |
HCA Healthcare, Inc. | | | 634 | | | | 41 | | | | 0.41 | | |
Henry Schein, Inc. | | | 1,111 | | | | 39 | | | | 0.40 | | |
The accompanying notes are an integral part of the consolidated financial statements.
17
Morgan Stanley Institutional Fund, Inc.
Annual Report — December 31, 2018
Consolidated Portfolio of Investments (cont'd)
Multi-Asset Portfolio
Security Description | | Shares | | Value
(000) | | Index Weight | |
JPM Custom Long U.S. Defensives Index (cont'd) | |
Hershey Co. (The) | | | 241 | | | $ | 39 | | | | 0.39 | % | |
Hologic, Inc. | | | 271 | | | | 36 | | | | 0.37 | | |
Hormel Foods Corp. | | | 838 | | | | 36 | | | | 0.36 | | |
Humana, Inc. | | | 118 | | | | 35 | | | | 0.36 | | |
IDEXX Laboratories, Inc. | | | 1,260 | | | | 35 | | | | 0.35 | | |
Illumina, Inc. | | | 810 | | | | 34 | | | | 0.35 | | |
Incyte Corp. | | | 398 | | | | 34 | | | | 0.34 | | |
Intuitive Surgical, Inc. | | | 204 | | | | 34 | | | | 0.34 | | |
IQVIA Holdings, Inc. | | | 117 | | | | 34 | | | | 0.34 | | |
JM Smucker Co. (The) | | | 2,315 | | | | 33 | | | | 0.34 | | |
Johnson & Johnson | | | 391 | | | | 33 | | | | 0.34 | | |
Kellogg Co. | | | 790 | | | | 32 | | | | 0.33 | | |
Keurig Dr. Pepper, Inc. | | | 810 | | | | 32 | | | | 0.32 | | |
Kimberly-Clark Corp. | | | 234 | | | | 29 | | | | 0.29 | | |
Kraft Heinz Co. (The) | | | 1,143 | | | | 29 | | | | 0.29 | | |
Kroger Co. (The) | | | 582 | | | | 29 | | | | 0.29 | | |
Laboratory Corporation of America Holdings | | | 181 | | | | 28 | | | | 0.28 | | |
McCormick & Co., Inc. | | | 406 | | | | 27 | | | | 0.27 | | |
McKesson Corp. | | | 171 | | | | 26 | | | | 0.26 | | |
Medtronic PLC | | | 501 | | | | 24 | | | | 0.24 | | |
Merck & Co., Inc. | | | 167 | | | | 23 | | | | 0.23 | | |
Mettler-Toledo International, Inc. | | | 62 | | | | 23 | | | | 0.23 | | |
Molson Coors Brewing Co. | | | 350 | | | | 23 | | | | 0.23 | | |
Mondelez International, Inc. | | | 406 | | | | 22 | | | | 0.22 | | |
Monster Beverage Corp. | | | 198 | | | | 21 | | | | 0.21 | | |
Mylan N.V. | | | 349 | | | | 20 | | | | 0.20 | | |
NextEra Energy, Inc. | | | 170 | | | | 19 | | | | 0.19 | | |
NiSource, Inc. | | | 181 | | | | 18 | | | | 0.18 | | |
NRG Energy, Inc. | | | 260 | | | | 18 | | | | 0.18 | | |
Patterson Cos, Inc. | | | 164 | | | | 17 | | | | 0.17 | | |
PepsiCo, Inc. | | | 344 | | | | 16 | | | | 0.17 | | |
PerkinElmer, Inc. | | | 379 | | | | 16 | | | | 0.16 | | |
Perrigo Co., PLC | | | 140 | | | | 16 | | | | 0.16 | | |
Pfizer, Inc. | | | 160 | | | | 15 | | | | 0.15 | | |
PG&E Corp. | | | 259 | | | | 15 | | | | 0.15 | | |
Philip Morris International, Inc. | | | 123 | | | | 14 | | | | 0.14 | | |
Pinnacle West Capital Corp. | | | 255 | | | | 13 | | | | 0.14 | | |
PPL Corp. | | | 71 | | | | 13 | | | | 0.13 | | |
Procter & Gamble Co. (The) | | | 115 | | | | 13 | | | | 0.13 | | |
Public Service Enterprise Group, Inc. | | | 584 | | | | 12 | | | | 0.13 | | |
Quest Diagnostics, Inc. | | | 65 | | | | 12 | | | | 0.12 | | |
Regeneron Pharmaceuticals, Inc. | | | 58 | | | | 12 | | | | 0.12 | | |
ResMed, Inc. | | | 434 | | | | 12 | | | | 0.12 | | |
SCANA Corp. | | | 21 | | | | 12 | | | | 0.12 | | |
Sempra Energy | | | 256 | | | | 11 | | | | 0.12 | | |
Southern Co. (The) | | | 82 | | | | 10 | | | | 0.10 | | |
Stryker Corp. | | | 40 | | | | 10 | | | | 0.10 | | |
Sysco Corp. | | | 129 | | | | 10 | | | | 0.10 | | |
Thermo Fisher Scientific, Inc. | | | 131 | | | | 10 | | | | 0.10 | | |
Tyson Foods, Inc. | | | 227 | | | | 9 | | | | 0.09 | | |
UnitedHealth Group, Inc. | | | 110 | | | | 9 | | | | 0.09 | | |
Universal Health Services, Inc. | | | 272 | | | | 9 | | | | 0.09 | | |
Varian Medical Systems, Inc. | | | 138 | | | | 9 | | | | 0.09 | | |
Verizon Communications, Inc. | | | 72 | | | | 8 | | | | 0.08 | | |
Vertex Pharmaceuticals, Inc. | | | 74 | | | | 8 | | | | 0.08 | | |
The accompanying notes are an integral part of the consolidated financial statements.
18
Morgan Stanley Institutional Fund, Inc.
Annual Report — December 31, 2018
Consolidated Portfolio of Investments (cont'd)
Multi-Asset Portfolio
Security Description | | Shares | | Value
(000) | | Index Weight | |
JPM Custom Long U.S. Defensives Index (cont'd) | |
Walgreens Boots Alliance, Inc. | | | 89 | | | $ | 7 | | | | 0.07 | % | |
Walmart, Inc. | | | 186 | | | | 7 | | | | 0.07 | | |
Waters Corp. | | | 255 | | | | 7 | | | | 0.07 | | |
WEC Energy Group, Inc. | | | 124 | | | | 6 | | | | 0.06 | | |
Xcel Energy, Inc. | | | 662 | | | | 4 | | | | 0.04 | | |
Zimmer Biomet Holdings, Inc. | | | 107 | | | | 4 | | | | 0.04 | | |
Zoetis, Inc. | | | 67 | | | | 1 | | | | 0.01 | | |
Total | | | | $ | 9,902 | | | | 100.00 | % | |
The following table represents the equity basket holdings underlying the total return swap with JPM Custom Short U.S. Cyclicals Index as of December 31, 2018:
Security Description | | Shares | | Value
(000) | | Index Weight | |
JPM Custom Short U.S. Cyclicals Index | |
3M Co. | | | 390 | | | $ | 586 | | | | 6.20 | % | |
Accenture PLC | | | 9,605 | | | | 514 | | | | 5.44 | | |
Activision Blizzard, Inc. | | | 2,392 | | | | 377 | | | | 3.99 | | |
Acuity Brands, Inc. | | | 3,567 | | | | 362 | | | | 3.83 | | |
Adobe Systems, Inc. | | | 648 | | | | 209 | | | | 2.21 | | |
Advance Auto Parts, Inc. | | | 1,154 | | | | 198 | | | | 2.10 | | |
Advanced Micro Devices, Inc. | | | 1,511 | | | | 166 | | | | 1.76 | | |
Air Products & Chemicals, Inc. | | | 1,072 | | | | 158 | | | | 1.67 | | |
Akamai Technologies, Inc. | | | 4,605 | | | | 157 | | | | 1.66 | | |
Alaska Air Group, Inc. | | | 140 | | | | 145 | | | | 1.53 | | |
Albemarle Corp. | | | 138 | | | | 144 | | | | 1.52 | | |
Allegion PLC | | | 1,098 | | | | 144 | | | | 1.52 | | |
Alliance Data Systems Corp. | | | 897 | | | | 144 | | | | 1.52 | | |
Alphabet, Inc. | | | 793 | | | | 141 | | | | 1.49 | | |
Alphabet, Inc. | | | 338 | | | | 133 | | | | 1.41 | | |
Amazon.com, Inc. | | | 696 | | | | 133 | | | | 1.41 | | |
American Airlines Group, Inc. | | | 934 | | | | 129 | | | | 1.37 | | |
AMETEK, Inc. | | | 889 | | | | 117 | | | | 1.24 | | |
Amphenol Corp. | | | 423 | | | | 113 | | | | 1.20 | | |
Analog Devices, Inc. | | | 847 | | | | 112 | | | | 1.19 | | |
ANSYS, Inc. | | | 1,336 | | | | 111 | | | | 1.18 | | |
AO Smith Corp. | | | 1,056 | | | | 108 | | | | 1.14 | | |
Apergy Corp. | | | 2,176 | | | | 102 | | | | 1.08 | | |
Apple, Inc. | | | 2,316 | | | | 100 | | | | 1.06 | | |
Applied Materials, Inc. | | | 1,286 | | | | 95 | | | | 1.01 | | |
Aptiv PLC | | | 867 | | | | 92 | | | | 0.98 | | |
Arconic, Inc. | | | 1,414 | | | | 91 | | | | 0.96 | | |
Autodesk, Inc. | | | 690 | | | | 88 | | | | 0.93 | | |
Automatic Data Processing, Inc. | | | 48 | | | | 83 | | | | 0.88 | | |
AutoZone, Inc. | | | 432 | | | | 81 | | | | 0.86 | | |
Avery Dennison Corp. | | | 804 | | | | 78 | | | | 0.83 | | |
Ball Corp. | | | 10,102 | | | | 76 | | | | 0.81 | | |
Best Buy Co., Inc. | | | 292 | | | | 76 | | | | 0.81 | | |
Boeing Co. (The) | | | 827 | | | | 76 | | | | 0.81 | | |
Booking Holdings, Inc. | | | 2,195 | | | | 76 | | | | 0.81 | | |
BorgWarner, Inc. | | | 1,700 | | | | 69 | | | | 0.73 | | |
Broadcom, Inc. | | | 1,315 | | | | 68 | | | | 0.72 | | |
Cadence Design Systems, Inc. | | | 1,448 | | | | 67 | | | | 0.70 | | |
Capri Holdings, Ltd. | | | 1,066 | | | | 66 | | | | 0.70 | | |
CarMax, Inc. | | | 1,399 | | | | 63 | | | | 0.67 | | |
Carnival Corp. | | | 5,539 | | | | 57 | | | | 0.60 | | |
Caterpillar, Inc. | | | 197 | | | | 56 | | | | 0.59 | | |
The accompanying notes are an integral part of the consolidated financial statements.
19
Morgan Stanley Institutional Fund, Inc.
Annual Report — December 31, 2018
Consolidated Portfolio of Investments (cont'd)
Multi-Asset Portfolio
Security Description | | Shares | | Value
(000) | | Index Weight | |
JPM Custom Short U.S. Cyclicals Index (cont'd) | |
CBS Corp. | | | 1,246 | | | $ | 56 | | | | 0.59 | % | |
CF Industries Holdings, Inc. | | | 373 | | | | 56 | | | | 0.59 | | |
CH Robinson Worldwide, Inc. | | | 545 | | | | 54 | | | | 0.57 | | |
Charter Communications, Inc. | | | 339 | | | | 52 | | | | 0.55 | | |
Chipotle Mexican Grill, Inc. | | | 229 | | | | 52 | | | | 0.55 | | |
Cintas Corp. | | | 325 | | | | 51 | | | | 0.54 | | |
Cisco Systems, Inc. | | | 336 | | | | 50 | | | | 0.53 | | |
Citrix Systems, Inc. | | | 203 | | | | 50 | | | | 0.53 | | |
Cognizant Technology Solutions Corp. | | | 1,030 | | | | 50 | | | | 0.52 | | |
Comcast Corp. | | | 188 | | | | 48 | | | | 0.51 | | |
Corning, Inc. | | | 288 | | | | 46 | | | | 0.49 | | |
CSX Corp. | | | 361 | | | | 46 | | | | 0.48 | | |
Cummins, Inc. | | | 401 | | | | 46 | | | | 0.48 | | |
Darden Restaurants, Inc. | | | 747 | | | | 45 | | | | 0.47 | | |
Deere & Co. | | | 259 | | | | 45 | | | | 0.47 | | |
Delphi Technologies PLC | | | 523 | | | | 44 | | | | 0.47 | | |
Delta Air Lines, Inc. | | | 325 | | | | 44 | | | | 0.46 | | |
Discovery, Inc. | | | 596 | | | | 44 | | | | 0.46 | | |
Discovery, Inc. | | | 459 | | | | 43 | | | | 0.46 | | |
DISH Network Corp. | | | 316 | | | | 43 | | | | 0.46 | | |
Dollar General Corp. | | | 1,284 | | | | 43 | | | | 0.45 | | |
Dollar Tree, Inc. | | | 1,445 | | | | 42 | | | | 0.45 | | |
Dover Corp. | | | 472 | | | | 42 | | | | 0.44 | | |
DowDuPont, Inc. | | | 960 | | | | 42 | | | | 0.44 | | |
DR Horton, Inc. | | | 552 | | | | 41 | | | | 0.43 | | |
DXC Technology Co. | | | 286 | | | | 40 | | | | 0.43 | | |
Eastman Chemical Co. | | | 1,046 | | | | 39 | | | | 0.42 | | |
Eaton Corp., PLC | | | 684 | | | | 39 | | | | 0.41 | | |
eBay, Inc. | | | 777 | | | | 39 | | | | 0.41 | | |
Ecolab, Inc. | | | 278 | | | | 37 | | | | 0.39 | | |
Electronic Arts, Inc. | | | 519 | | | | 36 | | | | 0.38 | | |
Emerson Electric Co. | | | 535 | | | | 35 | | | | 0.37 | | |
Equifax, Inc. | | | 455 | | | | 35 | | | | 0.37 | | |
Expedia Group, Inc. | | | 306 | | | | 33 | | | | 0.35 | | |
Expeditors International of Washington, Inc. | | | 364 | | | | 33 | | | | 0.35 | | |
F5 Networks, Inc. | | | 388 | | | | 32 | | | | 0.34 | | |
Facebook, Inc. | | | 1,088 | | | | 32 | | | | 0.34 | | |
Fastenal Co. | | | 119 | | | | 32 | | | | 0.34 | | |
FedEx Corp. | | | 381 | | | | 32 | | | | 0.34 | | |
Fidelity National Information Services, Inc. | | | 338 | | | | 31 | | | | 0.33 | | |
Fiserv, Inc. | | | 642 | | | | 30 | | | | 0.32 | | |
FLIR Systems, Inc. | | | 86 | | | | 30 | | | | 0.31 | | |
Flowserve Corp. | | | 3,829 | | | | 29 | | | | 0.31 | | |
Fluor Corp. | | | 255 | | | | 28 | | | | 0.29 | | |
FMC Corp. | | | 782 | | | | 27 | | | | 0.29 | | |
Foot Locker, Inc. | | | 206 | | | | 27 | | | | 0.29 | | |
Ford Motor Co. | | | 296 | | | | 27 | | | | 0.29 | | |
Fortive Corp. | | | 302 | | | | 25 | | | | 0.27 | | |
Fortune Brands Home & Security, Inc. | | | 184 | | | | 25 | | | | 0.26 | | |
Freeport-McMoRan, Inc. | | | 356 | | | | 24 | | | | 0.25 | | |
Gap, Inc. (The) | | | 410 | | | | 23 | | | | 0.25 | | |
Garmin Ltd. | | | 155 | | | | 23 | | | | 0.24 | | |
Garrett Motion, Inc. | | | 320 | | | | 23 | | | | 0.24 | | |
Gartner, Inc. | | | 27 | | | | 23 | | | | 0.24 | | |
General Dynamics Corp. | | | 150 | | | | 23 | | | | 0.24 | | |
General Electric Co. | | | 113 | | | | 22 | | | | 0.24 | | |
General Motors Co. | | | 179 | | | | 21 | | | | 0.23 | | |
The accompanying notes are an integral part of the consolidated financial statements.
20
Morgan Stanley Institutional Fund, Inc.
Annual Report — December 31, 2018
Consolidated Portfolio of Investments (cont'd)
Multi-Asset Portfolio
Security Description | | Shares | | Value
(000) | | Index Weight | |
JPM Custom Short U.S. Cyclicals Index (cont'd) | |
Genuine Parts Co. | | | 232 | | | $ | 21 | | | | 0.22 | % | |
Global Payments, Inc. | | | 430 | | | | 21 | | | | 0.22 | | |
Goodyear Tire & Rubber Co. (The) | | | 424 | | | | 20 | | | | 0.22 | | |
H&R Block, Inc. | | | 181 | | | | 20 | | | | 0.21 | | |
Hanesbrands, Inc. | | | 399 | | | | 20 | | | | 0.21 | | |
Harley-Davidson, Inc. | | | 267 | | | | 19 | | | | 0.20 | | |
Harris Corp. | | | 56 | | | | 19 | | | | 0.20 | | |
Hasbro, Inc. | | | 269 | | | | 18 | | | | 0.19 | | |
Hewlett Packard Enterprise Co. | | | 336 | | | | 18 | | | | 0.19 | | |
Hilton Worldwide Holdings, Inc. | | | 274 | | | | 17 | | | | 0.18 | | |
Home Depot, Inc. (The) | | | 61 | | | | 17 | | | | 0.18 | | |
Honeywell International, Inc. | | | 100 | | | | 17 | | | | 0.18 | | |
HP, Inc. | | | 226 | | | | 17 | | | | 0.18 | | |
IHS Markit Ltd. | | | 168 | | | | 16 | | | | 0.17 | | |
Illinois Tool Works, Inc. | | | 516 | | | | 16 | | | | 0.17 | | |
Ingersoll-Rand PLC | | | 350 | | | | 16 | | | | 0.17 | | |
Intel Corp. | | | 506 | | | | 16 | | | | 0.17 | | |
International Business Machines Corp. | | | 494 | | | | 16 | | | | 0.17 | | |
International Flavors & Fragrances, Inc. | | | 261 | | | | 16 | | | | 0.17 | | |
International Paper Co. | | | 774 | | | | 16 | | | | 0.17 | | |
Interpublic Group of Cos, Inc. (The) | | | 91 | | | | 16 | | | | 0.17 | | |
Intuit, Inc. | | | 154 | | | | 16 | | | | 0.17 | | |
Jacobs Engineering Group, Inc. | | | 356 | | | | 16 | | | | 0.16 | | |
JB Hunt Transport Services, Inc. | | | 170 | | | | 15 | | | | 0.15 | | |
Johnson Controls International PLC | | | 82 | | | | 14 | | | | 0.15 | | |
Juniper Networks, Inc. | | | 211 | | | | 14 | | | | 0.15 | | |
Kansas City Southern | | | 200 | | | | 14 | | | | 0.15 | | |
KLA-Tencor Corp. | | | 194 | | | | 14 | | | | 0.15 | | |
Kohl's Corp. | | | 309 | | | | 14 | | | | 0.15 | | |
L Brands, Inc. | | | 210 | | | | 14 | | | | 0.15 | | |
L3 Technologies, Inc. | | | 57 | | | | 14 | | | | 0.15 | | |
Lam Research Corp. | | | 144 | | | | 14 | | | | 0.15 | | |
Leggett & Platt, Inc. | | | 164 | | | | 14 | | | | 0.15 | | |
Lennar Corp. | | | 260 | | | | 14 | | | | 0.15 | | |
Lennar Corp. | | | 120 | | | | 14 | | | | 0.14 | | |
LKQ Corp. | | | 102 | | | | 13 | | | | 0.14 | | |
Lockheed Martin Corp. | | | 140 | | | | 13 | | | | 0.14 | | |
Lowe's Cos, Inc. | | | 461 | | | | 13 | | | | 0.14 | | |
LyondellBasell Industries N.V. | | | 182 | | | | 13 | | | | 0.14 | | |
Macy's, Inc. | | | 418 | | | | 13 | | | | 0.13 | | |
Marriott International (The) | | | 164 | | | | 12 | | | | 0.13 | | |
Martin Marietta Materials, Inc. | | | 507 | | | | 12 | | | | 0.13 | | |
Masco Corp. | | | 123 | | | | 12 | | | | 0.13 | | |
Mastercard, Inc. | | | 123 | | | | 12 | | | | 0.12 | | |
Mattel, Inc. | | | 333 | | | | 12 | | | | 0.12 | | |
McDonald's Corp. | | | 141 | | | | 11 | | | | 0.12 | | |
MGM Resorts International | | | 72 | | | | 11 | | | | 0.12 | | |
Microchip Technology, Inc. | | | 143 | | | | 11 | | | | 0.12 | | |
Micron Technology, Inc. | | | 179 | | | | 11 | | | | 0.12 | | |
Microsoft Corp. | | | 165 | | | | 11 | | | | 0.12 | | |
Mohawk Industries, Inc. | | | 372 | | | | 11 | | | | 0.12 | | |
Mosaic Co. (The) | | | 25 | | | | 11 | | | | 0.11 | | |
Motorola Solutions, Inc. | | | 124 | | | | 10 | | | | 0.11 | | |
NetApp, Inc. | | | 75 | | | | 10 | | | | 0.11 | | |
Netflix, Inc. | | | 99 | | | | 10 | | | | 0.11 | | |
Newell Brands, Inc. | | | 761 | | | | 10 | | | | 0.11 | | |
Newmont Mining Corp. | | | 115 | | | | 10 | | | | 0.10 | | |
The accompanying notes are an integral part of the consolidated financial statements.
21
Morgan Stanley Institutional Fund, Inc.
Annual Report — December 31, 2018
Consolidated Portfolio of Investments (cont'd)
Multi-Asset Portfolio
Security Description | | Shares | | Value
(000) | | Index Weight | |
JPM Custom Short U.S. Cyclicals Index (cont'd) | |
News Corp. | | | 67 | | | $ | 10 | | | | 0.10 | % | |
News Corp. | | | 148 | | | | 10 | | | | 0.10 | | |
Nielsen Holdings PLC | | | 277 | | | | 9 | | | | 0.10 | | |
NIKE, Inc. | | | 100 | | | | 9 | | | | 0.10 | | |
Nordstrom, Inc. | | | 392 | | | | 9 | | | | 0.10 | | |
Norfolk Southern Corp. | | | 111 | | | | 9 | | | | 0.10 | | |
Northrop Grumman Corp. | | | 480 | | | | 9 | | | | 0.09 | | |
Norwegian Cruise Line Holdings Ltd. | | | 298 | | | | 9 | | | | 0.09 | | |
Nucor Corp. | | | 345 | | | | 9 | | | | 0.09 | | |
nVent Electric PLC | | | 111 | | | | 9 | | | | 0.09 | | |
NVIDIA Corp. | | | 144 | | | | 9 | | | | 0.09 | | |
Omnicom Group, Inc. | | | 75 | | | | 9 | | | | 0.09 | | |
Oracle Corp. | | | 147 | | | | 8 | | | | 0.09 | | |
O'Reilly Automotive, Inc. | | | 493 | | | | 8 | | | | 0.09 | | |
PACCAR, Inc. | | | 140 | | | | 8 | | | | 0.09 | | |
Packaging Corp. of America | | | 100 | | | | 8 | | | | 0.09 | | |
Parker-Hannifin Corp. | | | 385 | | | | 8 | | | | 0.08 | | |
Paychex, Inc. | | | 199 | | | | 8 | | | | 0.08 | | |
PayPal Holdings, Inc. | | | 108 | | | | 8 | | | | 0.08 | | |
Pentair PLC | | | 78 | | | | 8 | | | | 0.08 | | |
Perspecta, Inc. | | | 71 | | | | 8 | | | | 0.08 | | |
PPG Industries, Inc. | | | 125 | | | | 7 | | | | 0.08 | | |
PulteGroup, Inc. | | | 55 | | | | 7 | | | | 0.08 | | |
PVH Corp. | | | 174 | | | | 7 | | | | 0.08 | | |
Qorvo, Inc. | | | 71 | | | | 7 | | | | 0.08 | | |
QUALCOMM, Inc. | | | 171 | | | | 7 | | | | 0.08 | | |
Quanta Services, Inc. | | | 193 | | | | 7 | | | | 0.08 | | |
Ralph Lauren Corp. | | | 62 | | | | 7 | | | | 0.08 | | |
Raytheon Co. | | | 302 | | | | 7 | | | | 0.08 | | |
Red Hat, Inc. | | | 272 | | | | 7 | | | | 0.07 | | |
Republic Services, Inc. | | | 76 | | | | 7 | | | | 0.07 | | |
Resideo Technologies, Inc. | | | 132 | | | | 7 | | | | 0.07 | | |
Robert Half International, Inc. | | | 109 | | | | 7 | | | | 0.07 | | |
Rockwell Automation, Inc. | | | 373 | | | | 7 | | | | 0.07 | | |
Roper Technologies, Inc. | | | 67 | | | | 7 | | | | 0.07 | | |
Ross Stores, Inc. | | | 180 | | | | 7 | | | | 0.07 | | |
Royal Caribbean Cruises Ltd. | | | 194 | | | | 7 | | | | 0.07 | | |
salesforce.com, Inc. | | | 73 | | | | 7 | | | | 0.07 | | |
Seagate Technology PLC | | | 121 | | | | 6 | | | | 0.07 | | |
Sealed Air Corp. | | | 78 | | | | 6 | | | | 0.07 | | |
Sherwin-Williams Co. (The) | | | 244 | | | | 6 | | | | 0.07 | | |
Signet Jewelers Ltd. | | | 40 | | | | 6 | | | | 0.06 | | |
Skyworks Solutions, Inc. | | | 70 | | | | 6 | | | | 0.06 | | |
Snap-on, Inc. | | | 152 | | | | 6 | | | | 0.06 | | |
Southwest Airlines Co. | | | 106 | | | | 6 | | | | 0.06 | | |
Stanley Black & Decker, Inc. | | | 167 | | | | 6 | | | | 0.06 | | |
Starbucks Corp. | | | 85 | | | | 6 | | | | 0.06 | | |
Stericycle, Inc. | | | 130 | | | | 6 | | | | 0.06 | | |
Symantec Corp. | | | 49 | | | | 6 | | | | 0.06 | | |
Synopsys, Inc. | | | 148 | | | | 6 | | | | 0.06 | | |
Tapestry, Inc. | | | 54 | | | | 6 | | | | 0.06 | | |
Target Corp. | | | 39 | | | | 6 | | | | 0.06 | | |
TE Connectivity Ltd. | | | 223 | | | | 6 | | | | 0.06 | | |
Texas Instruments, Inc. | | | 215 | | | | 6 | | | | 0.06 | | |
Textron, Inc. | | | 285 | | | | 5 | | | | 0.06 | | |
Tiffany & Co. | | | 42 | | | | 5 | | | | 0.06 | | |
TJX Cos, Inc. (The) | | | 114 | | | | 5 | | | | 0.06 | | |
The accompanying notes are an integral part of the consolidated financial statements.
22
Morgan Stanley Institutional Fund, Inc.
Annual Report — December 31, 2018
Consolidated Portfolio of Investments (cont'd)
Multi-Asset Portfolio
Security Description | | Shares | | Value
(000) | | Index Weight | |
JPM Custom Short U.S. Cyclicals Index (cont'd) | |
Total System Services, Inc. | | | 176 | | | $ | 5 | | | | 0.06 | % | |
Tractor Supply Co. | | | 163 | | | | 5 | | | | 0.06 | | |
TransDigm Group, Inc. | | | 205 | | | | 5 | | | | 0.06 | | |
TripAdvisor, Inc. | | | 133 | | | | 5 | | | | 0.05 | | |
Twenty-First Century Fox, Inc. | | | 137 | | | | 5 | | | | 0.05 | | |
Twenty-First Century Fox, Inc. | | | 246 | | | | 5 | | | | 0.05 | | |
Ulta Beauty, Inc. | | | 79 | | | | 5 | | | | 0.05 | | |
Under Armour, Inc. | | | 176 | | | | 5 | | | | 0.05 | | |
Under Armour, Inc. | | | 29 | | | | 5 | | | | 0.05 | | |
Union Pacific Corp. | | | 130 | | | | 5 | | | | 0.05 | | |
United Continental Holdings, Inc. | | | 199 | | | | 5 | | | | 0.05 | | |
United Parcel Service, Inc. | | | 101 | | | | 5 | | | | 0.05 | | |
United Rentals, Inc. | | | 357 | | | | 4 | | | | 0.05 | | |
United Technologies Corp. | | | 193 | | | | 4 | | | | 0.05 | | |
VeriSign, Inc. | | | 374 | | | | 4 | | | | 0.04 | | |
Verisk Analytics, Inc. | | | 151 | | | | 4 | | | | 0.04 | | |
VF Corp. | | | 100 | | | | 4 | | | | 0.04 | | |
Viacom, Inc. | | | 215 | | | | 4 | | | | 0.04 | | |
Visa, Inc. | | | 101 | | | | 4 | | | | 0.04 | | |
Vulcan Materials Co. | | | 59 | | | | 4 | | | | 0.04 | | |
Walt Disney Co. (The) | | | 336 | | | | 3 | | | | 0.04 | | |
Waste Management, Inc. | | | 22 | | | | 3 | | | | 0.03 | | |
Western Digital Corp. | | | 181 | | | | 3 | | | | 0.03 | | |
Western Union Co. (The) | | | 148 | | | | 3 | | | | 0.03 | | |
WestRock Co. | | | 182 | | | | 3 | | | | 0.03 | | |
Whirlpool Corp. | | | 64 | | | | 3 | | | | 0.03 | | |
WW Grainger, Inc. | | | 91 | | | | 2 | | | | 0.03 | | |
Wyndham Destinations, Inc. | | | 99 | | | | 2 | | | | 0.02 | | |
Wyndham Hotels & Resorts, Inc. | | | 59 | | | | 2 | | | | 0.02 | | |
Wynn Resorts Ltd. | | | 119 | | | | 1 | | | | 0.01 | | |
Xerox Corp. | | | 87 | | | | 1 | | | | 0.01 | | |
Xilinx, Inc. | | | 66 | | | | 1 | | | | 0.01 | | |
Xylem, Inc. (NY) | | | 89 | | | | 1 | | | | 0.01 | | |
Yum! Brands, Inc. | | | 4 | | | | — | @ | | | — | @@ | |
Total | | | | $ | 9,448 | | | | 100.00 | % | |
@ Value is less than $500.
@@ Index weight is less than 0.005%.
* Cleared swap agreement, the broker is Morgan Stanley & Co. LLC.
CDOR Canadian Dealer Offered Rate.
JIBAR Johannesburg Interbank Agreed Rate.
LIBOR London Interbank Offered Rate.
ARS — Argentine Peso
AUD — Australian Dollar
BRL — Brazilian Real
CAD — Canadian Dollar
CHF — Swiss Franc
CLP — Chilean Peso
CNH — Chinese Yuan Renminbi Offshore
CNY — Chinese Yuan Renminbi
CZK — Czech Koruna
DKK — Danish Krone
EUR — Euro
GBP — British Pound
HKD — Hong Kong Dollar
HUF — Hungarian Forint
IDR — Indonesian Rupiah
ILS — Israeli Shekel
INR — Indian Rupee
JPY — Japanese Yen
KRW — South Korean Won
MXN — Mexican Peso
PHP — Philippine Peso
PLN — Polish Zloty
RUB — Russian Ruble
SEK — Swedish Krona
SGD — Singapore Dollar
THB — Thai Baht
TRY — Turkish Lira
TWD — Taiwan Dollar
USD — United States Dollar
ZAR — South African Rand
The accompanying notes are an integral part of the consolidated financial statements.
23
Morgan Stanley Institutional Fund, Inc.
Annual Report — December 31, 2018
Consolidated Portfolio of Investments (cont'd)
Multi-Asset Portfolio
Portfolio Composition
Classification | | Percentage of
Total Investments | |
Short-Term Investments | | | 47.4 | % | |
Sovereign | | | 22.1 | | |
U.S. Treasury Security | | | 20.8 | | |
Common Stocks | | | 9.7 | | |
Total Investments | | | 100.0 | %** | |
** Does not include open long/short futures contracts with a value of approximately $34,520,000 and net unrealized depreciation of approximately $224,000. Does not include open foreign currency forward exchange contracts with net unrealized appreciation of approximately $273,000 and does not include open swap agreements with net unrealized appreciation of approximately $236,000.
The accompanying notes are an integral part of the consolidated financial statements.
24
Morgan Stanley Institutional Fund, Inc.
Annual Report — December 31, 2018
Consolidated Statement of Assets and Liabilities | | December 31, 2018
(000) | |
Assets: | |
Investments in Securities of Unaffiliated Issuers, at Value (Cost $31,033) | | $ | 30,569 | | |
Investment in Security of Affiliated Issuer, at Value (Cost $10,467) | | | 10,467 | | |
Total Investments in Securities, at Value (Cost $41,500) | | | 41,036 | | |
Foreign Currency, at Value (Cost $277) | | | 268 | | |
Cash | | | 14 | | |
Receivable for Investments Sold | | | 2,074 | | |
Unrealized Appreciation on Foreign Currency Forward Exchange Contracts | | | 1,117 | | |
Receivable for Variation Margin on Futures Contracts | | | 1,009 | | |
Unrealized Appreciation on Swap Agreements | | | 421 | | |
Interest Receivable | | | 242 | | |
Tax Reclaim Receivable | | | 57 | | |
Receivable for Swap Agreements Termination | | | 44 | | |
Due from Adviser | | | 30 | | |
Receivable from Affiliate | | | 19 | | |
Dividends Receivable | | | 1 | | |
Other Assets | | | 34 | | |
Total Assets | | | 46,352 | | |
Liabilities: | |
Due to Broker | | | 880 | | |
Unrealized Depreciation on Foreign Currency Forward Exchange Contracts | | | 844 | | |
Payable for Variation Margin on Swap Agreements | | | 159 | | |
Unrealized Depreciation on Swap Agreements | | | 134 | | |
Payable for Professional Fees | | | 86 | | |
Payable to Bank | | | 56 | | |
Payable for Custodian Fees | | | 40 | | |
Payable for Fund Shares Redeemed | | | 34 | | |
Payable for Transfer Agency Fees — Class I | | | 8 | | |
Payable for Transfer Agency Fees — Class A | | | 3 | | |
Payable for Transfer Agency Fees — Class L | | | 1 | | |
Payable for Transfer Agency Fees — Class C | | | 1 | | |
Payable for Transfer Agency Fees — Class IS | | | — | @ | |
Payable for Investments Purchased | | | 9 | | |
Payable for Sub Transfer Agency Fees — Class I | | | 4 | | |
Payable for Sub Transfer Agency Fees — Class A | | | — | @ | |
Payable for Sub Transfer Agency Fees — Class L | | | — | @ | |
Payable for Sub Transfer Agency Fees — Class C | | | — | @ | |
Payable for Administration Fees | | | 3 | | |
Payable for Shareholder Services Fees — Class A | | | 1 | | |
Payable for Distribution and Shareholder Services Fees — Class L | | | 1 | | |
Payable for Distribution and Shareholder Services Fees — Class C | | | — | @ | |
Other Liabilities | | | 15 | | |
Total Liabilities | | | 2,279 | | |
Net Assets | | $ | 44,073 | | |
Net Assets Consist of: | |
Paid-in-Capital | | $ | 129,595 | | |
Total Accumulated Loss | | | (85,522 | ) | |
Net Assets | | $ | 44,073 | | |
The accompanying notes are an integral part of the consolidated financial statements.
25
Morgan Stanley Institutional Fund, Inc.
Annual Report — December 31, 2018
Consolidated Statement of Assets and Liabilities (cont'd) | | December 31, 2018
(000) | |
CLASS I: | |
Net Assets | | $ | 38,254 | | |
| Shares Outstanding $0.001 par value shares of beneficial interest (unlimited shares authorized) (not in 000's) | | | 4,091,452 | | |
Net Asset Value, Offering and Redemption Price Per Share | | $ | 9.35 | | |
CLASS A: | |
Net Assets | | $ | 3,392 | | |
| Shares Outstanding $0.001 par value shares of beneficial interest (unlimited shares authorized) (not in 000's) | | | 365,905 | | |
Net Asset Value, Redemption Price Per Share | | $ | 9.27 | | |
Maximum Sales Load | | | 5.25 | % | |
Maximum Sales Charge | | $ | 0.51 | | |
Maximum Offering Price Per Share | | $ | 9.78 | | |
CLASS L: | |
Net Assets | | $ | 2,291 | | |
| Shares Outstanding $0.001 par value shares of beneficial interest (unlimited shares authorized) (not in 000's) | | | 250,094 | | |
Net Asset Value, Offering and Redemption Price Per Share | | $ | 9.16 | | |
CLASS C: | |
Net Assets | | $ | 128 | | |
| Shares Outstanding $0.001 par value shares of beneficial interest (unlimited shares authorized) (not in 000's) | | | 14,284 | | |
Net Asset Value, Offering and Redemption Price Per Share | | $ | 8.99 | | |
CLASS IS: | |
Net Assets | | $ | 8 | | |
| Shares Outstanding $0.001 par value shares of beneficial interest (unlimited shares authorized) (not in 000's) | | | 902 | | |
Net Asset Value, Offering and Redemption Price Per Share | | $ | 9.34 | | |
@ Amount is less than $500.
The accompanying notes are an integral part of the consolidated financial statements.
26
Morgan Stanley Institutional Fund, Inc.
Annual Report — December 31, 2018
Consolidated Statement of Operations | | Year Ended
December 31, 2018
(000) | |
Investment Income: | |
Interest from Securities of Unaffiliated Issuers | | $ | 812 | | |
Dividends from Securities of Unaffiliated Issuers (Net of $33 of Foreign Taxes Withheld) | | | 273 | | |
Dividends from Security of Affiliated Issuer (Note G) | | | 221 | | |
Total Investment Income | | | 1,306 | | |
Expenses: | |
Advisory Fees (Note B) | | | 480 | | |
Custodian Fees (Note F) | | | 175 | | |
Professional Fees | | | 148 | | |
Registration Fees | | | 69 | | |
Administration Fees (Note C) | | | 45 | | |
Shareholder Services Fees — Class A (Note D) | | | 9 | | |
Distribution and Shareholder Services Fees — Class L (Note D) | | | 21 | | |
Distribution and Shareholder Services Fees — Class C (Note D) | | | 1 | | |
Transfer Agency Fees — Class I (Note E) | | | 17 | | |
Transfer Agency Fees — Class A (Note E) | | | 7 | | |
Transfer Agency Fees — Class L (Note E) | | | 2 | | |
Transfer Agency Fees — Class C (Note E) | | | 2 | | |
Transfer Agency Fees — Class IS (Note E) | | | 2 | | |
Shareholder Reporting Fees | | | 20 | | |
Sub Transfer Agency Fees — Class I | | | 15 | | |
Sub Transfer Agency Fees — Class A | | | 2 | | |
Sub Transfer Agency Fees — Class L | | | 1 | | |
Sub Transfer Agency Fees — Class C | | | — | @ | |
Pricing Fees | | | 12 | | |
Directors' Fees and Expenses | | | 5 | | |
Other Expenses | | | 17 | | |
Total Expenses | | | 1,050 | | |
Waiver of Advisory Fees (Note B) | | | (366 | ) | |
Reimbursement of Class Specific Expenses — Class I (Note B) | | | (16 | ) | |
Reimbursement of Class Specific Expenses — Class A (Note B) | | | (4 | ) | |
Reimbursement of Class Specific Expenses — Class C (Note B) | | | (2 | ) | |
Reimbursement of Class Specific Expenses — Class IS (Note B) | | | (2 | ) | |
Rebate from Morgan Stanley Affiliate (Note G) | | | (22 | ) | |
Net Expenses | | | 638 | | |
Net Investment Income | | | 668 | | |
Realized Gain: | |
Investments Sold (Net of $42 of Capital Gain Country Tax) | | | 1,861 | | |
Foreign Currency Forward Exchange Contracts | | | 1,095 | | |
Foreign Currency Translation | | | 43 | | |
Futures Contracts | | | 350 | | |
Swap Agreements | | | 20 | | |
Net Realized Gain | | | 3,369 | | |
Change in Unrealized Appreciation (Depreciation): | |
Investments | | | (4,893 | ) | |
Foreign Currency Forward Exchange Contracts | | | 140 | | |
Foreign Currency Translation | | | (19 | ) | |
Futures Contracts | | | 221 | | |
Swap Agreements | | | 137 | | |
Net Change in Unrealized Appreciation (Depreciation) | | | (4,414 | ) | |
Net Realized Gain and Change in Unrealized Appreciation (Depreciation) | | | (1,045 | ) | |
Net Decrease in Net Assets Resulting from Operations | | $ | (377 | ) | |
@ Amount is less than $500.
The accompanying notes are an integral part of the consolidated financial statements.
27
Morgan Stanley Institutional Fund, Inc.
Annual Report — December 31, 2018
Consolidated Statements of Changes in Net Assets | | Year Ended
December 31, 2018
(000) | | Year Ended
December 31, 2017
(000) | |
Increase (Decrease) in Net Assets: | |
Operations: | |
Net Investment Income | | $ | 668 | | | $ | 1,693 | | |
Net Realized Gain (Loss) | | | 3,369 | | | | (5,316 | ) | |
Net Change in Unrealized Appreciation (Depreciation) | | | (4,414 | ) | | | 3,009 | | |
Net Decrease in Net Assets Resulting from Operations | | | (377 | ) | | | (614 | ) | |
Dividends and Distributions to Shareholders: | |
Class I | | | (1,067 | ) | | | — | | |
Class A | | | (84 | ) | | | — | | |
Class L | | | (46 | ) | | | — | | |
Class C | | | (2 | ) | | | — | | |
Class IS | | | (— | @) | | | — | | |
Total Dividends and Distributions to Shareholders | | | (1,199 | ) | | | — | | |
Capital Share Transactions:(1) | |
Class I: | |
Subscribed | | | 2,079 | | | | 22,279 | | |
Distributions Reinvested | | | 1,067 | | | | — | | |
Redeemed | | | (28,660 | ) | | | (66,426 | ) | |
Class A: | |
Subscribed | | | 326 | | | | 597 | | |
Distributions Reinvested | | | 71 | | | | — | | |
Redeemed | | | (694 | ) | | | (9,586 | ) | |
Class L: | |
Distributions Reinvested | | | 46 | | | | — | | |
Redeemed | | | (916 | ) | | | (3,027 | ) | |
Class C: | |
Subscribed | | | 48 | | | | 55 | | |
Distributions Reinvested | | | 2 | | | | — | | |
Redeemed | | | (44 | ) | | | (198 | ) | |
Net Decrease in Net Assets Resulting from Capital Share Transactions | | | (26,675 | ) | | | (56,306 | ) | |
Total Decrease in Net Assets | | | (28,251 | ) | | | (56,920 | ) | |
Net Assets: | |
Beginning of Period | | | 72,324 | | | | 129,244 | | |
End of Period | | $ | 44,073 | | | $ | 72,324 | † | |
(1) Capital Share Transactions: | |
Class I: | |
Shares Subscribed | | | 214 | | | | 2,289 | | |
Shares Issued on Distributions Reinvested | | | 114 | | | | — | | |
Shares Redeemed | | | (2,991 | ) | | | (6,816 | ) | |
Net Decrease in Class I Shares Outstanding | | | (2,663 | ) | | | (4,527 | ) | |
Class A: | |
Shares Subscribed | | | 34 | | | | 62 | | |
Shares Issued on Distributions Reinvested | | | 8 | | | | — | | |
Shares Redeemed | | | (73 | ) | | | (999 | ) | |
Net Decrease in Class A Shares Outstanding | | | (31 | ) | | | (937 | ) | |
Class L: | |
Shares Issued on Distributions Reinvested | | | 5 | | | | — | | |
Shares Redeemed | | | (99 | ) | | | (319 | ) | |
Net Decrease in Class L Shares Outstanding | | | (94 | ) | | | (319 | ) | |
Class C: | |
Shares Subscribed | | | 5 | | | | 6 | | |
Shares Issued on Distributions Reinvested | | | — | @@ | | | — | | |
Shares Redeemed | | | (5 | ) | | | (21 | ) | |
Net Increase (Decrease) in Class C Shares Outstanding | | | — | @@ | | | (15 | ) | |
@ Amount is less than $500.
@@ Amount is less than 500 shares.
† Accumulated Net Investment Loss for the year ended December 31, 2017 was $(97).
The accompanying notes are an integral part of the consolidated financial statements.
28
Morgan Stanley Institutional Fund, Inc.
Annual Report — December 31, 2018
Consolidated Financial Highlights
Multi-Asset Portfolio
| | | Class I | |
| | | Year Ended December 31, | |
Selected Per Share Data and Ratios | | 2018 | | 2017 | | 2016(1) | | 2015(2) | | 2014(2) | |
Net Asset Value, Beginning of Period | | $ | 9.65 | | | $ | 9.72 | | | $ | 10.17 | | | $ | 11.55 | | | $ | 11.68 | | |
Income (Loss) from Investment Operations: | |
Net Investment Income (Loss)(3) | | | 0.11 | | | | 0.19 | | | | 0.03 | | | | 0.07 | | | | (0.02 | ) | |
Net Realized and Unrealized Gain (Loss) | | | (0.14 | ) | | | (0.26 | ) | | | (0.31 | ) | | | (1.29 | ) | | | 0.11 | | |
Total from Investment Operations | | | (0.03 | ) | | | (0.07 | ) | | | (0.28 | ) | | | (1.22 | ) | | | 0.09 | | |
Distributions from and/or in Excess of: | |
Net Investment Income | | | (0.27 | ) | | | — | | | | (0.17 | ) | | | (0.16 | ) | | | (0.22 | ) | |
Net Realized Gain | | | — | | | | — | | | | — | | | | — | | | | (0.00 | )(4) | |
Total Distributions | | | (0.27 | ) | | | — | | | | (0.17 | ) | | | (0.16 | ) | | | (0.22 | ) | |
Net Asset Value, End of Period | | $ | 9.35 | | | $ | 9.65 | | | $ | 9.72 | | | $ | 10.17 | | | $ | 11.55 | | |
Total Return(5) | | | (0.32 | )% | | | (0.72 | )% | | | (2.75 | )% | | | (10.60 | )% | | | 0.77 | % | |
Ratios and Supplemental Data: | |
Net Assets, End of Period (Thousands) | | $ | 38,254 | | | $ | 65,156 | | | $ | 109,692 | | | $ | 280,423 | | | $ | 495,419 | | |
Ratio of Expenses to Average Net Assets(7) | | | 1.06 | %(6) | | | 1.03 | %(6) | | | 1.04 | %(6) | | | 1.05 | %(6) | | | 1.01 | %(6) | |
Ratio of Net Investment Income (Loss) to Average Net Assets(7) | | | 1.17 | %(6) | | | 1.91 | %(6) | | | 0.35 | %(6) | | | 0.60 | %(6) | | | (0.14 | )%(6) | |
Ratio of Rebate from Morgan Stanley Affiliates to Average Net Assets | | | 0.04 | % | | | 0.07 | % | | | 0.06 | % | | | 0.04 | % | | | 0.09 | % | |
Portfolio Turnover Rate | | | 187 | % | | | 386 | % | | | 353 | % | | | 355 | % | | | 264 | % | |
(7) Supplemental Information on the Ratios to Average Net Assets: | |
Ratios Before Expense Limitation: | |
Expenses to Average Net Assets | | | 1.78 | % | | | 1.44 | % | | | 1.25 | % | | | 1.14 | % | | | 1.21 | % | |
Net Investment Income (Loss) to Average Net Assets | | | 0.45 | % | | | 1.50 | % | | | 0.14 | % | | | 0.51 | % | | | (0.34 | )% | |
(1) Reflects prior period Custodian out-of-pocket expenses that were reimbursed in September 2016. The amount of the reimbursement was immaterial on a per share basis and did not impact the total return of Class I shares. The Ratio of Expenses to Average Net Assets and the Ratio of Net Investment Income to Average Net Assets would be unchanged as the reimbursement of Custodian fees was offset against expense waivers/reimbursements with no impact to net expenses or net investment income.
(2) Not consolidated.
(3) Per share amount is based on average shares outstanding.
(4) Amount is less than $0.005 per share.
(5) Calculated based on the net asset value as of the last business day of the period.
(6) The Ratios of Expenses and Net Investment Income (Loss) reflect the rebate of certain Fund expenses in connection with the investments in Morgan Stanley affiliates during the period. The effect of the rebate on the ratios is disclosed in the above table as "Ratio of Rebate from Morgan Stanley Affiliates to Average Net Assets."
The accompanying notes are an integral part of the consolidated financial statements.
29
Morgan Stanley Institutional Fund, Inc.
Annual Report — December 31, 2018
Consolidated Financial Highlights
Multi-Asset Portfolio
| | | Class A | |
| | | Year Ended December 31, | |
Selected Per Share Data and Ratios | | 2018 | | 2017 | | 2016(1) | | 2015(2) | | 2014(2) | |
Net Asset Value, Beginning of Period | | $ | 9.54 | | | $ | 9.68 | | | $ | 10.09 | | | $ | 11.50 | | | $ | 11.63 | | |
Income (Loss) from Investment Operations: | |
Net Investment Income (Loss)(3) | | | 0.15 | | | | 0.14 | | | | (0.00 | )(4) | | | 0.03 | | | | (0.05 | ) | |
Net Realized and Unrealized Gain (Loss) | | | (0.19 | ) | | | (0.28 | ) | | | (0.31 | ) | | | (1.28 | ) | | | 0.11 | | |
Total from Investment Operations | | | (0.04 | ) | | | (0.14 | ) | | | (0.31 | ) | | | (1.25 | ) | | | 0.06 | | |
Distributions from and/or in Excess of: | |
Net Investment Income | | | (0.23 | ) | | | — | | | | (0.10 | ) | | | (0.16 | ) | | | (0.19 | ) | |
Net Realized Gain | | | — | | | | — | | | | — | | | | — | | | | (0.00 | )(4) | |
Total Distributions | | | (0.23 | ) | | | — | | | | (0.10 | ) | | | (0.16 | ) | | | (0.19 | ) | |
Net Asset Value, End of Period | | $ | 9.27 | | | $ | 9.54 | | | $ | 9.68 | | | $ | 10.09 | | | $ | 11.50 | | |
Total Return(5) | | | (0.59 | )% | | | (1.24 | )% | | | (2.94 | )% | | | (11.00 | )% | | | 0.55 | % | |
Ratios and Supplemental Data: | |
Net Assets, End of Period (Thousands) | | $ | 3,392 | | | $ | 3,791 | | | $ | 12,914 | | | $ | 29,123 | | | $ | 54,771 | | |
Ratio of Expenses to Average Net Assets(7) | | | 1.41 | %(6) | | | 1.38 | %(6) | | | 1.39 | %(6) | | | 1.37 | %(6) | | | 1.30 | %(6) | |
Ratio of Net Investment Income (Loss) to Average Net Assets(7) | | | 1.64 | %(6) | | | 1.46 | %(6) | | | (0.01 | )%(6) | | | 0.27 | %(6) | | | (0.43 | )%(6) | |
Ratio of Rebate from Morgan Stanley Affiliates to Average Net Assets | | | 0.04 | % | | | 0.07 | % | | | 0.06 | % | | | 0.04 | % | | | 0.09 | % | |
Portfolio Turnover Rate | | | 187 | % | | | 386 | % | | | 353 | % | | | 355 | % | | | 264 | % | |
(7) Supplemental Information on the Ratios to Average Net Assets: | |
Ratios Before Expense Limitation: | |
Expenses to Average Net Assets | | | 2.21 | % | | | 1.76 | % | | | 1.59 | % | | | 1.47 | % | | | 1.46 | % | |
Net Investment Income (Loss) to Average Net Assets | | | 0.84 | % | | | 1.08 | % | | | (0.21 | )% | | | 0.17 | % | | | (0.59 | )% | |
(1) Reflects prior period Custodian out-of-pocket expenses that were reimbursed in September 2016. The amount of the reimbursement was immaterial on a per share basis and did not impact the total return of Class A shares. The Ratio of Expenses to Average Net Assets and the Ratio of Net Investment Loss to Average Net Assets would be unchanged as the reimbursement of Custodian fees was offset against expense waivers/reimbursements with no impact to net expenses or net investment loss.
(2) Not consolidated.
(3) Per share amount is based on average shares outstanding.
(4) Amount is less than $0.005 per share.
(5) Calculated based on the net asset value which does not reflect sales charges, if applicable, as of the last business day of the period.
(6) The Ratios of Expenses and Net Investment Income (Loss) reflect the rebate of certain Fund expenses in connection with the investments in Morgan Stanley affiliates during the period. The effect of the rebate on the ratios is disclosed in the above table as "Ratio of Rebate from Morgan Stanley Affiliates to Average Net Assets."
The accompanying notes are an integral part of the consolidated financial statements.
30
Morgan Stanley Institutional Fund, Inc.
Annual Report — December 31, 2018
Consolidated Financial Highlights
Multi-Asset Portfolio
| | | Class L | |
| | | Year Ended December 31, | |
Selected Per Share Data and Ratios | | 2018 | | 2017 | | 2016(1) | | 2015(2) | | 2014(2) | |
Net Asset Value, Beginning of Period | | $ | 9.44 | | | $ | 9.60 | | | $ | 9.94 | | | $ | 11.39 | | | $ | 11.53 | | |
Income (Loss) from Investment Operations: | |
Net Investment Income (Loss)(3) | | | 0.08 | | | | 0.10 | | | | (0.04 | ) | | | (0.02 | ) | | | (0.10 | ) | |
Net Realized and Unrealized Gain (Loss) | | | (0.18 | ) | | | (0.26 | ) | | | (0.30 | ) | | | (1.27 | ) | | | 0.10 | | |
Total from Investment Operations | | | (0.10 | ) | | | (0.16 | ) | | | (0.34 | ) | | | (1.29 | ) | | | (0.00 | )(4) | |
Distributions from and/or in Excess of: | |
Net Investment Income | | | (0.18 | ) | | | — | | | | — | | | | (0.16 | ) | | | (0.14 | ) | |
Net Realized Gain | | | — | | | | — | | | | — | | | | — | | | | (0.00 | )(4) | |
Total Distributions | | | (0.18 | ) | | | — | | | | — | | | | (0.16 | ) | | | (0.14 | ) | |
Net Asset Value, End of Period | | $ | 9.16 | | | $ | 9.44 | | | $ | 9.60 | | | $ | 9.94 | | | $ | 11.39 | | |
Total Return(5) | | | (1.04 | )% | | | (1.67 | )% | | | (3.42 | )% | | | (11.37 | )% | | | 0.02 | % | |
Ratios and Supplemental Data: | |
Net Assets, End of Period (Thousands) | | $ | 2,291 | | | $ | 3,242 | | | $ | 6,357 | | | $ | 14,443 | | | $ | 41,253 | | |
Ratio of Expenses to Average Net Assets(7) | | | 1.88 | %(6) | | | 1.86 | %(6) | | | 1.85 | %(6) | | | 1.85 | %(6) | | | 1.77 | %(6) | |
Ratio of Net Investment Income (Loss) to Average Net Assets(7) | | | 0.83 | %(6) | | | 1.09 | %(6) | | | (0.43 | )%(6) | | | (0.18 | )%(6) | | | (0.90 | )%(6) | |
Ratio of Rebate from Morgan Stanley Affiliates to Average Net Assets | | | 0.04 | % | | | 0.07 | % | | | 0.06 | % | | | 0.04 | % | | | 0.09 | % | |
Portfolio Turnover Rate | | | 187 | % | | | 386 | % | | | 353 | % | | | 355 | % | | | 264 | % | |
(7) Supplemental Information on the Ratios to Average Net Assets: | |
Ratios Before Expense Limitation: | |
Expenses to Average Net Assets | | | 2.57 | % | | | 2.24 | % | | | 2.02 | % | | | 1.92 | % | | | 1.93 | % | |
Net Investment Income (Loss) to Average Net Assets | | | 0.14 | % | | | 0.71 | % | | | (0.60 | )% | | | (0.25 | )% | | | (1.06 | )% | |
(1) Reflects prior period Custodian out-of-pocket expenses that were reimbursed in September 2016. The amount of the reimbursement was immaterial on a per share basis and did not impact the total return of Class L shares. The Ratio of Expenses to Average Net Assets and the Ratio of Net Investment Loss to Average Net Assets would be unchanged as the reimbursement of Custodian fees was offset against expense waivers/reimbursements with no impact to net expenses or net investment loss.
(2) Not consolidated.
(3) Per share amount is based on average shares outstanding.
(4) Amount is less than $0.005 per share.
(5) Calculated based on the net asset value as of the last business day of the period.
(6) The Ratios of Expenses and Net Investment Income (Loss) reflect the rebate of certain Fund expenses in connection with the investments in Morgan Stanley affiliates during the period. The effect of the rebate on the ratios is disclosed in the above table as "Ratio of Rebate from Morgan Stanley Affiliates to Average Net Assets."
The accompanying notes are an integral part of the consolidated financial statements.
31
Morgan Stanley Institutional Fund, Inc.
Annual Report — December 31, 2018
Consolidated Financial Highlights
Multi-Asset Portfolio
| | | Class C | |
| | | Year Ended December 31, | | Period from
April 30, 2015(2) to | |
Selected Per Share Data and Ratios | | 2018 | | 2017 | | 2016(1) | | December 31, 2015(3) | |
Net Asset Value, Beginning of Period | | $ | 9.28 | | | $ | 9.47 | | | $ | 9.93 | | | $ | 11.09 | | |
Income (Loss) from Investment Operations: | |
Net Investment Income (Loss)(4) | | | 0.13 | | | | 0.07 | | | | (0.09 | ) | | | (0.07 | ) | |
Net Realized and Unrealized Loss | | | (0.25 | ) | | | (0.26 | ) | | | (0.28 | ) | | | (0.93 | ) | |
Total from Investment Operations | | | (0.12 | ) | | | (0.19 | ) | | | (0.37 | ) | | | (1.00 | ) | |
Distributions from and/or in Excess of: | |
Net Investment Income | | | (0.17 | ) | | | — | | | | (0.09 | ) | | | (0.16 | ) | |
Net Asset Value, End of Period | | $ | 8.99 | | | $ | 9.28 | | | $ | 9.47 | | | $ | 9.93 | | |
Total Return(5) | | | (1.48 | )% | | | (1.90 | )% | | | (3.70 | )% | | | (9.07 | )%(7) | |
Ratios and Supplemental Data: | |
Net Assets, End of Period (Thousands) | | $ | 128 | | | $ | 126 | | | $ | 272 | | | $ | 420 | | |
Ratio of Expenses to Average Net Assets(9) | | | 2.16 | %(6) | | | 2.13 | %(6) | | | 2.14 | %(6) | | | 2.17 | %(6)(8) | |
Ratio of Net Investment Income (Loss) to Average Net Assets(9) | | | 1.39 | %(6) | | | 0.70 | %(6) | | | (0.95 | )%(6) | | | (1.07 | )%(6)(8) | |
Ratio of Rebate from Morgan Stanley Affiliates to Average Net Assets | | | 0.04 | % | | | 0.07 | % | | | 0.06 | % | | | 0.03 | %(8) | |
Portfolio Turnover Rate | | | 187 | % | | | 386 | % | | | 353 | % | | | 355 | % | |
(9) Supplemental Information on the Ratios to Average Net Assets: | |
Ratios Before Expense Limitation: | |
Expenses to Average Net Assets | | | 4.57 | % | | | 3.67 | % | | | 2.88 | % | | | 2.59 | %(8) | |
Net Investment Loss to Average Net Assets | | | (1.02 | )% | | | (0.84 | )% | | | (1.69 | )% | | | (1.49 | )%(8) | |
(1) Reflects prior period Custodian out-of-pocket expenses that were reimbursed in September 2016. The amount of the reimbursement was immaterial on a per share basis and did not impact the total return of Class C shares. The Ratio of Expenses to Average Net Assets and the Ratio of Net Investment Loss to Average Net Assets would be unchanged as the reimbursement of Custodian fees was offset against expense waivers/reimbursements with no impact to net expenses or net investment loss.
(2) Commencement of offering.
(3) Not consolidated.
(4) Per share amount is based on average shares outstanding.
(5) Calculated based on the net asset value which does not reflect sales charges, if applicable, as of the last business day of the period.
(6) The Ratios of Expenses and Net Investment Income (Loss) reflect the rebate of certain Fund expenses in connection with the investments in Morgan Stanley affiliates during the period. The effect of the rebate on the ratios is disclosed in the above table as "Ratio of Rebate from Morgan Stanley Affiliates to Average Net Assets."
(7) Not annualized.
(8) Annualized.
The accompanying notes are an integral part of the consolidated financial statements.
32
Morgan Stanley Institutional Fund, Inc.
Annual Report — December 31, 2018
Consolidated Financial Highlights
Multi-Asset Portfolio
| | | Class IS | |
| | | Year Ended December 31, | | Period from
May 29, 2015(2) to | |
Selected Per Share Data and Ratios | | 2018 | | 2017 | | 2016(1) | | December 31, 2015(3) | |
Net Asset Value, Beginning of Period | | $ | 9.65 | | | $ | 9.72 | | | $ | 10.17 | | | $ | 11.09 | | |
Income (Loss) from Investment Operations: | |
Net Investment Income(4) | | | 0.22 | | | | 0.25 | | | | 0.13 | | | | 0.01 | | |
Net Realized and Unrealized Loss | | | (0.26 | ) | | | (0.32 | ) | | | (0.41 | ) | | | (0.77 | ) | |
Total from Investment Operations | | | 0.04 | | | | (0.07 | ) | | | (0.28 | ) | | | (0.76 | ) | |
Distributions from and/or in Excess of: | |
Net Investment Income | | | (0.27 | ) | | | — | | | | (0.17 | ) | | | (0.16 | ) | |
Net Asset Value, End of Period | | $ | 9.34 | | | $ | 9.65 | | | $ | 9.72 | | | $ | 10.17 | | |
Total Return(5) | | | (0.28 | )% | | | (0.82 | )% | | | (2.65 | )% | | | (6.89 | )%(7) | |
Ratios and Supplemental Data: | |
Net Assets, End of Period (Thousands) | | $ | 8 | | | $ | 9 | | | $ | 9 | | | $ | 9 | | |
Ratio of Expenses to Average Net Assets(9) | | | 1.03 | %(6) | | | 1.01 | %(6) | | | 1.01 | %(6) | | | 1.04 | %(6)(8) | |
Ratio of Net Investment Income to Average Net Assets(9) | | | 2.31 | %(6) | | | 2.53 | %(6) | | | 1.36 | %(6) | | | 0.23 | %(6)(8) | |
Ratio of Rebate from Morgan Stanley Affiliates to Average Net Assets | | | 0.04 | % | | �� | 0.06 | % | | | 0.06 | % | | | 0.03 | %(8) | |
Portfolio Turnover Rate | | | 187 | % | | | 386 | % | | | 353 | % | | | 355 | % | |
(9) Supplemental Information on the Ratios to Average Net Assets: | |
Ratios Before Expense Limitation: | |
Expenses to Average Net Assets | | | 24.87 | % | | | 22.88 | % | | | 22.77 | % | | | 17.31 | %(8) | |
Net Investment Loss to Average Net Assets | | | (21.53 | )% | | | (19.34 | )% | | | (20.40 | )% | | | (16.04 | )%(8) | |
(1) Reflects prior period Custodian out-of-pocket expenses that were reimbursed in September 2016. The amount of the reimbursement was immaterial on a per share basis and did not impact the total return of Class IS shares. The Ratio of Expenses to Average Net Assets and the Ratio of Net Investment Income to Average Net Assets would be unchanged as the reimbursement of Custodian fees was offset against expense waivers/reimbursements with no impact to net expenses or net investment income.
(2) Commencement of Offering.
(3) Not consolidated.
(4) Per share amount is based on average shares outstanding.
(5) Calculated based on the net asset value as of the last business day of the period.
(6) The Ratios of Expenses and Net Investment Income reflect the rebate of certain Fund expenses in connection with the investments in Morgan Stanley affiliates during the period. The effect of the rebate on the ratios is disclosed in the above table as "Ratio of Rebate from Morgan Stanley Affiliates to Average Net Assets."
(7) Not annualized.
(8) Annualized.
The accompanying notes are an integral part of the consolidated financial statements.
33
Morgan Stanley Institutional Fund, Inc.
Annual Report — December 31, 2018
Notes to Consolidated Financial Statements
Morgan Stanley Institutional Fund, Inc. (the "Company") is registered under the Investment Company Act of 1940, as amended (the "Act"), as an open-end management investment company. The Company is comprised of thirty separate, active, diversified and non-diversified funds (individually referred to as a "Fund", collectively as the "Funds"). The Company applies investment company accounting and reporting guidance.
The accompanying consolidated financial statements relate to the Multi-Asset Portfolio. The Fund seeks total return. The Fund's ("Adviser"), Morgan Stanley Investment Management Inc., seeks to achieve this objective with an emphasis on positive absolute return and controlling downside portfolio risk.
The Fund offers five classes of shares — Class I, Class A, Class L, Class C and Class IS. On April 30, 2015, the Fund suspended offering of Class L shares. Existing Class L shareholders may invest through reinvestment of dividends and distributions.
A. Significant Accounting Policies: The following significant accounting policies are in conformity with U.S. generally accepted accounting principles ("GAAP"). Such policies are consistently followed by the Company in the preparation of its consolidated financial statements. GAAP may require management to make estimates and assumptions that affect the reported amounts and disclosures in the consolidated financial statements. Actual results may differ from those estimates.
The Fund may, consistent with its principal investment strategies, invest up to 25% of its total assets in a wholly-owned subsidiary of the Fund organized as a company under the laws of the Cayman Islands, Multi-Asset Cayman Portfolio, Ltd. (the "Subsidiary"). The Subsidiary may invest, directly or indirectly through the use of derivatives, in securities, commodities, commodity-related instruments and other investments, primarily futures, swaps and notes. The Fund is the sole shareholder of the Subsidiary, and it is not currently expected that shares of the Subsidiary will be sold or offered to other investors. The consolidated portfolio of investments and consolidated financial statements include the positions and accounts of the Fund and the Subsidiary. All intercompany accounts and transactions of the Fund and the Subsidiary have been eliminated in consolidation. As of December 31, 2018, the Subsidiary represented approximately $6,909,000 or approximately 15.7% of the total assets of the Fund.
Investments in the Subsidiary are expected to provide the Fund with exposure to the commodity markets within the limitations of Subchapter M of the Code and recent Internal
Revenue Service ("IRS") revenue rulings, which require that a mutual fund receive no more than ten percent of its gross income from such investments in order to receive favorable tax treatment as a regulated investment company ("RIC"). Tax treatment of the income received from the Subsidiary may potentially be affected by changes in legislation, regulations or other legally binding authority, which could affect the character, timing and amount of the Fund's taxable income and distributions. If such changes occur, the Fund may need to significantly change its investment strategy and recognize unrealized gains in order to remain qualified for taxation as a RIC, which could adversely affect the Fund.
In August 2018, the Financial Accounting Standards Board ("FASB") issued Accounting Standards Update ("ASU") 2018-13, Fair Value Measurement (Topic 820) — Disclosures Framework — Changes to Disclosure Requirements of Fair Value Measurement ("ASU 2018-13") which introduces new fair value disclosure requirements as well as eliminates and modifies certain existing fair value disclosure requirements. ASU 2018-13 would be effective for fiscal years beginning after December 15, 2019 and for interim periods within those fiscal years; however, management has elected to early adopt ASU 2018-13 effective with the current reporting period as permitted by the standard. The impact of the Fund's adoption was limited to changes in the Fund's consolidated financial statement disclosures regarding fair value, primarily those disclosures related to transfers between levels of the fair value hierarchy and disclosure of the range and weighted average used to develop significant unobservable inputs for Level 3 fair value measurements, when applicable.
1. Security Valuation: (1) An equity portfolio security listed or traded on an exchange is valued at its latest reported sales price (or at the exchange official closing price if such exchange reports an official closing price), and if there were no sales on a given day and if there is no official exchange closing price for that day, the security is valued at the mean between the last reported bid and asked prices if such bid and asked prices are available on the relevant exchanges. Listed equity securities not traded on the valuation date with no reported bid and asked prices available on the exchange are valued at the mean between the current bid and asked prices obtained from one or more reputable brokers or dealers. In cases where a security is traded on more than one exchange, the security is valued on the exchange designated as the primary market; (2) all other equity portfolio securities for which over-the-counter ("OTC") market quotations are readily available are valued at the latest reported sales price
34
Morgan Stanley Institutional Fund, Inc.
Annual Report — December 31, 2018
Notes to Consolidated Financial Statements (cont'd)
(or at the market official closing price if such market reports an official closing price), and if there was no trading in the security on a given day and if there is no official closing price from relevant markets for that day, the security is valued at the mean between the last reported bid and asked prices if such bid and asked prices are available on the relevant markets. An unlisted equity security that does not trade on the valuation date and for which bid and asked prices from the relevant markets are unavailable is valued at the mean between the current bid and asked prices obtained from one or more reputable brokers or dealers; (3) certain portfolio securities may be valued by an outside pricing service/vendor approved by the Company's Board of Directors (the "Directors"). The pricing service/vendor may employ a pricing model that takes into account, among other things, bids, yield spreads and/or other market data and specific security characteristics. Alternatively, if a valuation is not available from an outside pricing service/vendor, and the security trades on an exchange, the security may be valued at its latest reported sale price (or at the exchange official closing price if such exchange reports an official closing price), prior to the time when assets are valued. If there are no sales on a given day and if there is no official exchange closing price for that day, the security is valued at the mean between the last reported bid and asked prices if such bid and asked prices are available in the relevant exchanges; (4) futures are valued at the settlement price on the exchange on which they trade or, if a settlement price is unavailable, at the last sale price on the exchange; (5) OTC swaps may be valued by an outside pricing service approved by the Directors or quotes from a broker or dealer. Swaps cleared on a clearinghouse or exchange may be valued using the closing price provided by the clearinghouse or exchange; (6) when market quotations are not readily available, including circumstances under which the Adviser determines that the closing price, last sale price or the mean between the last reported bid and asked prices are not reflective of a security's market value, portfolio securities are valued at their fair value as determined in good faith under procedures established by and under the general supervision of the Directors. Occasionally, developments affecting the closing prices of securities and other assets may occur between the times at which valuations of such securities are determined (that is, close of the foreign market on which the securities trade) and the close of business of the New York Stock Exchange ("NYSE"). If developments occur during such periods that are expected to materially affect the value of such securities, such valuations may be adjusted to reflect
the estimated fair value of such securities as of the close of the NYSE, as determined in good faith by the Directors or by the Adviser using a pricing service and/or procedures approved by the Directors; (7) quotations of foreign portfolio securities, other assets and liabilities and forward contracts stated in foreign currency are translated into U.S. dollar equivalents at the prevailing market rates prior to the close of the NYSE; and (8) investments in mutual funds, including the Morgan Stanley Institutional Liquidity Funds, are valued at the net asset value ("NAV") as of the close of each business day.
The Directors have responsibility for determining in good faith the fair value of the investments, and the Directors may appoint others, such as the Company's Adviser or a valuation committee, to assist the Directors in determining fair value and to make the actual calculations pursuant to the fair valuation methodologies previously approved by the Directors. Under procedures approved by the Directors, the Company's Adviser has formed a Valuation Committee whose members are approved by the Directors. The Valuation Committee provides administration and oversight of the Company's valuation policies and procedures, which are reviewed at least annually by the Directors. These procedures allow the Company to utilize independent pricing services, quotations from securities and financial instrument dealers and other market sources to determine fair value.
2. Fair Value Measurement: FASB Accounting Standards CodificationTM ("ASC") 820, "Fair Value Measurement" ("ASC 820"), defines fair value as the value that the Fund would receive to sell an investment or pay to transfer a liability in a timely transaction with an independent buyer in the principal market, or in the absence of a principal market, the most advantageous market for the investment or liability. ASC 820 establishes a three-tier hierarchy to distinguish between (1) inputs that reflect the assumptions market participants would use in valuing an asset or liability developed based on market data obtained from sources independent of the reporting entity (observable inputs) and (2) inputs that reflect the reporting entity's own assumptions about the assumptions market participants would use in valuing an asset or liability developed based on the best information available in the circumstances (unobservable inputs) and to establish classification of fair value measurements for disclosure purposes. Various inputs are used in determining the value of
35
Morgan Stanley Institutional Fund, Inc.
Annual Report — December 31, 2018
Notes to Consolidated Financial Statements (cont'd)
the Fund's investments. The inputs are summarized in the three broad levels listed below:
• Level 1 – unadjusted quoted prices in active markets for identical investments
• Level 2 – other significant observable inputs (including quoted prices for similar investments, interest rates, prepayment speeds, credit risk, etc.)
• Level 3 – significant unobservable inputs including the Fund's own assumptions in determining the fair value of investments. Factors considered in making this determination may include, but are not limited to, information obtained by contacting the issuer, analysts, or the appropriate stock exchange (for exchange-traded securities), analysis of the issuer's financial statements or other available documents and, if necessary, available information concerning other securities in similar circumstances
The inputs or methodology used for valuing securities are not necessarily an indication of the risk associated with investing in those securities and the determination of the significance of a particular input to the fair value measurement in its entirety requires judgment and considers factors specific to each security.
The following is a summary of the inputs used to value the Fund's investments as of December 31, 2018:
Investment Type | | Level 1
Unadjusted
quoted
prices
(000) | | Level 2
Other
significant
observable
inputs
(000) | | Level 3
Significant
unobservable
inputs
(000) | | Total
(000) | |
Assets: | |
Common Stocks | |
Banks | | $ | — | | | $ | 1,085 | | | $ | — | | | $ | 1,085 | | |
Building Products | | | 172 | | | | — | | | | — | | | | 172 | | |
Chemicals | | | 30 | | | | — | | | | — | | | | 30 | | |
Construction Materials | | | 294 | | | | — | | | | — | | | | 294 | | |
Consumer Finance | | | 1,167 | | | | — | | | | — | | | | 1,167 | | |
Equity Real Estate
Investment Trusts
(REITs) | | | — | | | | — | @ | | | — | | | | — | @ | |
Household Durables | | | 627 | | | | — | | | | — | | | | 627 | | |
Insurance | | | 165 | | | | — | | | | — | | | | 165 | | |
Metals & Mining | | | 224 | | | | 86 | | | | — | | | | 310 | | |
Paper & Forest Products | | | 37 | | | | — | | | | — | | | | 37 | | |
Semiconductors &
Semiconductor
Equipment | | | — | | | | — | | | | 8 | | | | 8 | | |
Thrifts & Mortgage
Finance | | | 45 | | | | — | | | | — | | | | 45 | | |
Trading Companies &
Distributors | | | 54 | | | | — | | | | — | | | | 54 | | |
Total Common Stocks | | | 2,815 | | | | 1,171 | | | | 8 | | | | 3,994 | | |
Investment Type | | Level 1
Unadjusted
quoted
prices
(000) | | Level 2
Other
significant
observable
inputs
(000) | | Level 3
Significant
unobservable
inputs
(000) | | Total
(000) | |
Fixed Income Securities | |
Sovereign | | $ | — | | | $ | 9,060 | | | $ | — | | | $ | 9,060 | | |
U.S. Treasury Security | | | — | | | | 8,521 | | | | — | | | | 8,521 | | |
Total Fixed Income
Securities | | | — | | | | 17,581 | | | | — | | | | 17,581 | | |
Short-Term Investments | |
Investment Company | | | 11,018 | | | | — | | | | — | | | | 11,018 | | |
U.S. Treasury Security | | | — | | | | 8,443 | | | | — | | | | 8,443 | | |
Total Short-Term
Investments | | | 11,018 | | | | 8,443 | | | | — | | | | 19,461 | | |
Foreign Currency Forward
Exchange Contracts | | | — | | | | 1,117 | | | | — | | | | 1,117 | | |
Futures Contracts | | | 263 | | | | — | | | | — | | | | 263 | | |
Interest Rate Swap
Agreement | | | — | | | | 7 | | | | — | | | | 7 | | |
Total Return Swap
Agreements | | | — | | | | 421 | | | | — | | | | 421 | | |
Total Assets | | | 14,096 | | | | 28,740 | | | | 8 | | | | 42,844 | | |
Liabilities: | |
Foreign Currency Forward
Exchange Contracts | | | — | | | | (844 | ) | | | — | | | | (844 | ) | |
Futures Contracts | | | (487 | ) | | | — | | | | — | | | | (487 | ) | |
Interest Rate Swap
Agreements | | | — | | | | (58 | ) | | | — | | | | (58 | ) | |
Total Return Swap
Agreements | | | — | | | | (134 | ) | | | — | | | | (134 | ) | |
Total Liabilities | | | (487 | ) | | | (1,036 | ) | | | — | | | | (1,523 | ) | |
Total | | $ | 13,609 | | | $ | 27,704 | | | $ | 8 | | | $ | 41,321 | | |
@ Value is less than $500.
Transfers between investment levels may occur as the markets fluctuate and/or the availability of data used in an investment's valuation changes.
Following is a reconciliation of investments in which significant unobservable inputs (Level 3) were used in determining fair value:
| | | Common
Stock
(000) | |
Beginning Balance | | $ | 1 | | |
Purchases | | | — | | |
Sales | | | — | | |
Amortization of discount | | | — | | |
Transfers in | | | — | | |
Transfers out | | | — | | |
Corporate actions | | | — | | |
Change in unrealized appreciation | | | 7 | | |
Realized (losses) | | | — | | |
Ending Balance | | $ | 8 | | |
Net change in unrealized (depreciation) from investments
still held as of December 31, 2018 | | $ | 7 | | |
36
Morgan Stanley Institutional Fund, Inc.
Annual Report — December 31, 2018
Notes to Consolidated Financial Statements (cont'd)
The following table presents additional information about valuation techniques and inputs used for investments that are measured at fair value and categorized within Level 3 as of December 31, 2018.
| | | Fair Value at
December 31, 2018
(000) | | Valuation
Technique | | Unobservable
Input | | Amount | | Impact to
Valuation from an
Increase in Input†† | |
Semiconductors & Semiconductor
Equipment | |
Common Stock | | $ | 8 | | | Book Value | | Book Value | | $ | 0.050 | | | Increase | |
†† Represents the expected directional change in the fair value of the Level 3 investments that would result from an increase in the corresponding input. A decrease to the unobservable input would have the opposite effect. Significant changes in these inputs could result in significantly higher or lower fair value measurements.
3. Foreign Currency Translation and Foreign Investments: The books and records of the Fund are maintained in U.S. dollars. Foreign currency amounts are translated into U.S. dollars as follows:
– investments, other assets and liabilities at the prevailing rate of exchange on the valuation date;
– investment transactions and investment income at the prevailing rates of exchange on the dates of such transactions.
Although the net assets of the Fund are presented at the foreign exchange rates and market values at the close of the period, the Fund does not isolate that portion of the results of operations arising as a result of changes in the foreign exchange rates from the fluctuations arising from changes in the market prices of securities held at period end. Similarly, the Fund does not isolate the effect of changes in foreign exchange rates from the fluctuations arising from changes in the market prices of securities sold during the period. Accordingly, realized and unrealized foreign currency gains (losses) on investments in securities are included in the reported net realized and unrealized gains (losses) on investment transactions and balances. However, pursuant to U.S. federal income tax regulations, gains and losses from certain foreign currency transactions and the foreign currency portion of gains and losses realized on sales and maturities of foreign denominated debt securities are treated as ordinary income for U.S. federal income tax purposes.
Net realized gains (losses) on foreign currency transactions represent net foreign exchange gains (losses) from foreign currency forward exchange contracts, disposition of foreign currencies, currency gains (losses) realized between the trade and settlement dates on securities transactions, and the difference between the amount of investment
income and foreign withholding taxes recorded on the Fund's books and the U.S. dollar equivalent amounts actually received or paid. Net unrealized currency gains (losses) from valuing foreign currency denominated assets and liabilities at period end exchange rates are reflected as a component of unrealized appreciation (depreciation) in the Consolidated Statement of Assets and Liabilities. The change in unrealized currency gains (losses) on foreign currency translations for the period is reflected in the Consolidated Statement of Operations.
Foreign security and currency transactions may involve certain considerations and risks not typically associated with those of U.S. dollar denominated transactions as a result of, among other factors, fluctuations of exchange rates in relation to the U.S. dollar, the possibility of lower levels of governmental supervision and regulation of foreign securities markets and the possibility of political or economic instability.
Governmental approval for foreign investments may be required in advance of making an investment under certain circumstances in some countries, and the extent of foreign investments in domestic companies may be subject to limitation in other countries. Foreign ownership limitations also may be imposed by the charters of individual companies to prevent, among other concerns, violations of foreign investment limitations. As a result, an additional class of shares (identified as "Foreign" in the Consolidated Portfolio of Investments) may be created and offered for investment. The "local" and "foreign shares" market values may differ. In the absence of trading of the foreign shares in such markets, the Fund values the foreign shares at the closing exchange price of the local shares.
37
Morgan Stanley Institutional Fund, Inc.
Annual Report — December 31, 2018
Notes to Consolidated Financial Statements (cont'd)
4. Derivatives: The Fund may, but is not required to, use derivative instruments for a variety of purposes, including hedging, risk management, portfolio management or to earn income. Derivatives are financial instruments whose value is based, in part, on the value of an underlying asset, interest rate, index or financial instrument. Prevailing interest rates and volatility levels, among other things, also affect the value of derivative instruments. A derivative instrument often has risks similar to its underlying asset and may have additional risks, including imperfect correlation between the value of the derivative and the underlying asset, risks of default by the counterparty to certain transactions, magnification of losses incurred due to changes in the market value of the securities, instruments, indices or interest rates to which the derivative instrument relates, risks that the transactions may not be liquid and risks arising from margin requirements. The use of derivatives involves risks that are different from, and possibly greater than, the risks associated with other portfolio investments. Derivatives may involve the use of highly specialized instruments that require investment techniques and risk analyses different from those associated with other portfolio investments. All of the Fund's holdings, including derivative instruments, are marked-to-market each day with the change in value reflected in unrealized appreciation (depreciation). Upon disposition, a realized gain or loss is recognized.
Certain derivative transactions may give rise to a form of leverage. Leverage magnifies the potential for gain and the risk of loss. Leverage associated with derivative transactions may cause the Fund to liquidate portfolio positions when it may not be advantageous to do so to satisfy its obligations or to meet earmarking or segregation requirements, pursuant to applicable Securities and Exchange Commission ("SEC") rules and regulations, or may cause the Fund to be more volatile than if the Fund had not been leveraged. Although the Adviser seeks to use derivatives to further the Fund's investment objectives, there is no assurance that the use of derivatives will achieve this result.
Following is a description of the derivative instruments and techniques that the Fund used during the period and their associated risks:
Foreign Currency Forward Exchange Contracts: In connection with its investments in foreign securities, the Fund also entered into contracts with banks, brokers or
dealers to purchase or sell securities or foreign currencies at a future date. A foreign currency forward exchange contract ("currency contract") is a negotiated agreement between the contracting parties to exchange a specified amount of currency at a specified future time at a specified rate. The rate can be higher or lower than the spot rate between the currencies that are the subject of the contract. Currency contracts may be used to protect against uncertainty in the level of future foreign currency exchange rates or to gain or modify exposure to a particular currency. To the extent hedged by the use of currency contracts, the precise matching of the currency contract amounts and the value of the securities involved will not generally be possible because the future value of such securities in foreign currencies will change as a consequence of market movements in the value of those securities between the date on which the contract is entered into and the date it matures. Furthermore, such transactions may reduce or preclude the opportunity for gain if the value of the currency should move in the direction opposite to the position taken. There is additional risk to the extent that currency contracts create exposure to currencies in which the Fund's securities are not denominated. Unanticipated changes in currency prices may result in poorer overall performance for the Fund than if it had not entered into such contracts. The use of currency contracts involves the risk of loss from the insolvency or bankruptcy of the counterparty to the contract or the failure of the counterparty to make payments or otherwise comply with the terms of the contract. A currency contract is marked-to-market daily and the change in market value is recorded by the Fund as unrealized gain or loss. The Fund records realized gains (losses) when the currency contract is closed equal to the difference between the value of the currency contract at the time it was opened and the value at the time it was closed.
Futures: A futures contract is a standardized, exchange-traded agreement to buy or sell a specific quantity of an underlying asset, reference rate or index at a specific price at a specific future time. The value of a futures contract tends to increase and decrease in tandem with the value of the underlying instrument. Depending on the terms of the particular contract, futures contracts are settled through either physical delivery of the underlying instrument on the settlement date or by payment of a
38
Morgan Stanley Institutional Fund, Inc.
Annual Report — December 31, 2018
Notes to Consolidated Financial Statements (cont'd)
cash settlement amount on the settlement date. During the period the futures contract is open, payments are received from or made to the broker based upon changes in the value of the contract (the variation margin). A decision as to whether, when and how to use futures contracts involves the exercise of skill and judgment and even a well-conceived futures transaction may be unsuccessful because of market behavior or unexpected events. In addition to the derivatives risks discussed above, the prices of futures contracts can be highly volatile, using futures contracts can lower total return and the potential loss from futures contracts can exceed the Fund's initial investment in such contracts. No assurance can be given that a liquid market will exist for any particular futures contract at any particular time. There is also the risk of loss by the Fund of margin deposits in the event of bankruptcy of a broker with which the Fund has open positions in the futures contract.
Swaps: The Fund may enter into OTC swap contracts or cleared swap transactions. A swap contract is an agreement between two parties pursuant to which the parties exchange payments at specified dates on the basis of a specified notional amount, with the payments calculated by reference to specified securities, indices, reference rates, currencies or other instruments. Typically swap agreements provide that when the period payment dates for both parties are the same, the payments are made on a net basis (i.e., the two payment streams are netted out, with only the net amount paid by one party to the other). The Fund's obligations or rights under a swap contract entered into on a net basis will generally be equal only to the net amount to be paid or received under the agreement, based on the relative values of the positions held by each party. Cleared swap transactions may help reduce counterparty credit risk. In a cleared swap, the Fund's ultimate counterparty is a clearinghouse rather than a swap dealer, bank or other financial institution. OTC swap agreements are not entered into or traded on exchanges and often there is no central clearing or guaranty function for OTC swaps. These OTC swaps are often subject to credit risk or the risk of default or non-performance by the counterparty. Both OTC and cleared swaps could result in losses if interest rates, foreign currency exchange rates or other factors are not correctly anticipated by the Fund or if the reference index, security or investments do not perform as expected. During the period swap agreements are open,
payments are received from or made to the clearinghouse or counterparty based upon changes in the value of the contract (variation margin). The Dodd-Frank Wall Street Reform and Consumer Protection Act and related regulatory developments require the clearing and exchange-trading of certain standardized swap transactions. Mandatory exchange-trading and clearing is occurring on a phased-in basis.
The Fund's use of swaps during the period included those based on the credit of an underlying security commonly referred to as "credit default swaps." The Fund may be either the buyer or seller in a credit default swap. Where the Fund is the buyer of a credit default swap contract, it would typically be entitled to receive the par (or other agreed-upon) value of a referenced debt obligation from the counterparty to the contract only in the event of a default or similar event by the issuer of the debt obligation. If no default occurs, the Fund would have paid to the counterparty a periodic stream of payments over the term of the contract and received no benefit from the contract. When the Fund is the seller of a credit default swap contract, it typically receives the stream of payments but is obligated to pay an amount equal to the par (or other agreed-upon) value of a referenced debt obligation upon the default or similar event by the issuer of the referenced debt obligation. The use of credit default swaps could result in losses to the Fund if the Adviser fails to correctly evaluate the creditworthiness of the issuer of the referenced debt obligation.
If the Fund is a seller of protection and a credit event occurs, as defined under the terms of that particular swap agreement, the Fund will either (i) pay to the buyer of protection an amount equal to the notional amount of the swap agreement and take delivery of the referenced obligation, other deliverable obligations or underlying securities comprising the referenced index or (ii) pay a net settlement amount in the form of cash or securities equal to the notional amount of the swap agreement less the recovery value of the referenced obligation or underlying securities comprising the referenced index. If the Fund is a buyer of protection and a credit event occurs, as defined under the terms of that particular swap agreement, the Fund will either (i) receive from the seller of protection an amount equal to the notional amount of the swap agreement and deliver the referenced obligation, other deliverable obligations
39
Morgan Stanley Institutional Fund, Inc.
Annual Report — December 31, 2018
Notes to Consolidated Financial Statements (cont'd)
or underlying securities comprising the referenced index or (ii) receive a net settlement amount in the form of cash or securities equal to the notional amount of the swap agreement less the recovery value of the referenced obligation or underlying securities comprising the referenced index. Recovery values are estimated by market makers considering either industry standard recovery rates or entity specific factors and considerations until a credit event occurs. If a credit event has occurred, the recovery value is determined by a facilitated auction whereby a minimum number of allowable broker bids, together with a specified valuation method, are used to calculate the settlement value. The Fund's maximum risk of loss from counterparty risk, either as the protection seller or as the protection buyer, is the fair value of the swap agreement.
The current credit rating of each individual issuer is included in the table following the Consolidated Portfolio of Investments and serves as an indicator of the current status of the payment/performance risk of the credit derivative. Alternatively, for credit default swaps on an index of credits, the quoted market prices and current values serve as an indicator of the current status of the payment/performance risk of the credit derivative. Generally, lower credit ratings and increasing market values, in absolute terms, represent a deterioration of the credit and a greater likelihood of an adverse credit event of the issuer.
When the Fund has an unrealized loss on a swap agreement, the Fund has instructed the custodian to pledge cash or liquid securities as collateral with a value approximately equal to the amount of the unrealized loss. Collateral pledges are monitored and subsequently adjusted if and when the swap valuations fluctuate. If applicable, cash collateral is included with "Due from (to) Broker" in the Consolidated Statement of Assets and Liabilities.
Upfront payments paid or received by the Fund will be reflected as an asset or liability, respectively, in the Consolidated Statement of Assets and Liabilities.
FASB ASC 815, "Derivatives and Hedging" ("ASC 815"), is intended to improve financial reporting about derivative instruments by requiring enhanced disclosures to enable investors to better understand how and why the Fund uses derivative instruments, how these derivative instruments are accounted for and their effects on the Fund's financial position and results of operations.
The following tables set forth the fair value of the Fund's derivative contracts by primary risk exposure as of December 31, 2018:
| | | Asset Derivatives
Consolidated
Statement of Assets and
Liabilities Location | | Primary Risk
Exposure | | Value
(000) | |
Foreign Currency Forward
Exchange Contracts
| | Unrealized Appreciation on
Foreign Currency Forward
Exchange Contracts | |
Currency Risk | | $ | 1,117 | | |
Futures Contracts | | Variation Margin on
Futures Contracts | |
Commodity Risk | | | 73 | (a) | |
Futures Contracts | | Variation Margin on
Futures Contracts | |
Interest Rate Risk | | | 190 | (a) | |
Swap Agreements | | Unrealized Appreciation on
Swap Agreements | |
Equity Risk | | | 421 | | |
Swap Agreement | | Variation Margin on
Swap Agreement | |
Interest Rate Risk | | | 7 | (a) | |
Total | | | | | | $ | 1,808 | | |
| | | Liability Derivatives
Consolidated
Statement of Assets and
Liabilities Location | | Primary Risk
Exposure | | Value
(000) | |
Foreign Currency Forward
Exchange Contracts
| | Unrealized Depreciation on
Foreign Currency Forward
Exchange Contracts | |
Currency Risk | | $ | (844 | ) | |
Futures Contracts | | Variation Margin on
Futures Contracts | |
Currency Risk | | | (87 | )(a) | |
Futures Contracts | | Variation Margin on
Futures Contracts | |
Equity Risk | | | (269 | )(a) | |
Futures Contracts | | Variation Margin on
Futures Contracts | |
Interest Rate Risk | | | (131 | )(a) | |
Swap Agreements | | Unrealized Depreciation on
Swap Agreements | |
Equity Risk | | | (134 | ) | |
Swap Agreements | | Variation Margin on
Swap Agreements | |
Interest Rate Risk | | | (58 | )(a) | |
Total | | | | | | $ | (1,523 | ) | |
(a) This amount represents the cumulative appreciation (depreciation) as reported in the Consolidated Portfolio of Investments. The Consolidated Statement of Assets and Liabilities only reflects the current day's net variation margin.
The following tables set forth by primary risk exposure the Fund's realized gains (losses) and change in unrealized appreciation (depreciation) by type of derivative contract for the year ended December 31, 2018 in accordance with ASC 815:
Realized Gain (Loss) | |
Primary Risk Exposure | | Derivative Type | | Value
(000) | |
Currency Risk | | Foreign Currency Forward
Exchange Contracts | | $ | 1,095 | | |
Commodity Risk | | Futures Contracts | | | 271 | | |
Currency Risk | | Futures Contracts | | | 593 | | |
Equity Risk | | Futures Contracts | | | (111 | ) | |
Interest Rate Risk | | Futures Contracts | | | (403 | ) | |
Equity Risk | | Swap Agreements | | | (365 | ) | |
Interest Rate Risk | | Swap Agreements | | | 385 | | |
| | | Total | | $ | 1,465 | | |
40
Morgan Stanley Institutional Fund, Inc.
Annual Report — December 31, 2018
Notes to Consolidated Financial Statements (cont'd)
Change in Unrealized Appreciation (Depreciation) | |
Primary Risk Exposure | | Derivative Type | | Value
(000) | |
Currency Risk | | Foreign Currency Forward
Exchange Contracts | | $ | 140 | | |
Commodity Risk | | Futures Contracts | | | 374 | | |
Currency Risk | | Futures Contracts | | | 157 | | |
Equity Risk | | Futures Contracts | | | (296 | ) | |
Interest Rate Risk | | Futures Contracts | | | (14 | ) | |
Equity Risk | | Swap Agreements | | | 757 | | |
Interest Rate Risk | | Swap Agreements | | | (620 | ) | |
| | | Total | | $ | 498 | | |
At December 31, 2018, the Fund's derivative assets and liabilities are as follows:
Gross Amounts of Assets and Liabilities Presented in the
Consolidated Statement of Assets and Liabilities | |
Derivatives(b) | | Assets(c)
(000) | | Liabilities(c)
(000) | |
Foreign Currency Forward Exchange Contracts | | $ | 1,117 | | | $ | (844 | ) | |
Swap Agreements | | | 421 | | | | (134 | ) | |
Total | | $ | 1,538 | | | $ | (978 | ) | |
(b) Excludes exchange-traded derivatives.
(c) Absent an event of default or early termination, OTC derivative assets and liabilities are presented gross and not offset in the Consolidated Statement of Assets and Liabilities.
The Fund typically enters into International Swaps and Derivatives Association, Inc. Master Agreements ("ISDA Master Agreements") or similar master agreements (collectively, "Master Agreements") with its contract counterparties for certain OTC derivatives in order to, among other things, reduce its credit risk to counterparties. ISDA Master Agreements include provisions for general obligations, representations, collateral and events of default or termination. Under an ISDA Master Agreement, the Fund typically may offset with the counterparty certain OTC derivative financial instruments' payables and/or receivables with collateral held and/or posted and create one single net payment (close-out netting) in the event of default, termination and/or potential deterioration in the credit quality of the counterparty. Various Master Agreements govern the terms of certain transactions with counterparties, including transactions such as swap, forward, repurchase and reverse repurchase agreements. These Master Agreements typically attempt to reduce the counterparty risk associated with such transactions by specifying credit protection mechanisms and providing standardization that improves legal certainty. Cross-termination provisions under Master Agreements typically provide that a default in connection with one transaction between the Fund and a counterparty gives the non-defaulting party the right to terminate any other transactions in place
with the defaulting party to create one single net payment due to/due from the defaulting party and may be a feature in certain Master Agreements. In the event the Fund exercises its right to terminate a Master Agreement after a counterparty experiences a termination event as defined in the Master Agreement, the return of collateral with market value in excess of the Fund's net liability may be delayed or denied.
The following table presents derivative financial instruments that are subject to enforceable netting arrangements as of December 31, 2018:
Gross Amounts Not Offset in the Consolidated Statement of Assets and Liabilities | |
Counterparty | | Gross Asset
Derivatives
Presented in the
Consolidated
Statement of
Assets and
Liabilities
(000) | | Financial
Instrument
(000) | | Collateral
Received(d)
(000) | | Net Amount
(not less
than $0)
(000) | |
Bank of America NA | | $ | 2 | | | $ | (— | @) | | $ | — | | | $ | 2 | | |
Bank of Montreal | | | 14 | | | | — | | | | — | | | | 14 | | |
Bank of New York Mellon | | | — | @ | | | — | | | | — | | | | — | @ | |
Barclays Bank PLC | | | 227 | | | | (2 | ) | | | (225 | ) | | | 0 | | |
BNP Paribas SA | | | 262 | | | | (154 | ) | | | (108 | ) | | | 0 | | |
Citibank NA | | | 34 | | | | (1 | ) | | | — | | | | 33 | | |
Commonwealth Bank of
Australia | | | 6 | | | | — | | | | — | | | | 6 | | |
Goldman Sachs
International | | | 532 | | | | (242 | ) | | | (290 | ) | | | 0 | | |
JPMorgan Chase
Bank NA | | | 437 | | | | (408 | ) | | | — | | | | 29 | | |
UBS AG | | | 24 | | | | (— | @) | | | — | | | | 24 | | |
Total | | $ | 1,538 | | | $ | (807 | ) | | $ | (623 | ) | | $ | 108 | | |
Gross Amounts Not Offset in the Consolidated Statement of Assets and Liabilities | |
Counterparty | | Gross Liability
Derivatives
Presented in the
Statement of
Assets and
Liabilities
(000) | | Financial
Instrument
(000) | | Collateral
Pledged(d)
(000) | | Consolidated
Net Amount
(not less
than $0)
(000) | |
Bank of America NA | | $ | — | @ | | $ | (— | @) | | $ | — | | | $ | 0 | | |
Barclays Bank PLC | | | 2 | | | | (2 | ) | | | — | | | | 0 | | |
BNP Paribas SA | | | 301 | | | | (154 | ) | | | (147 | ) | | | 0 | | |
Citibank NA | | | 1 | | | | (1 | ) | | | — | | | | 0 | | |
Goldman Sachs
International | | | 242 | | | | (242 | ) | | | — | | | | 0 | | |
JPMorgan Chase
Bank NA | | | 432 | | | | (408 | ) | | | — | | | | 24 | | |
UBS AG | | | — | @ | | | (— | @) | | | — | | | | 0 | | |
Total | | $ | 978 | | | $ | (807 | ) | | $ | (147 | ) | | $ | 24 | | |
@ Value is less than $500.
(d) In some instances, the actual collateral received or pledged may be more than the amount shown here due to overcollateralization.
41
Morgan Stanley Institutional Fund, Inc.
Annual Report — December 31, 2018
Notes to Consolidated Financial Statements (cont'd)
For the year ended December 31, 2018, the approximate average monthly amount outstanding for each derivative type is as follows:
Foreign Currency Forward Exchange Contracts: | |
Average monthly principal amount | | $ | 133,302,000 | | |
Futures Contracts: | |
Average monthly notional value | | $ | 73,774,000 | | |
Swap Agreements: | |
Average monthly notional amount | | $ | 66,298,000 | | |
5. Indemnifications: The Company enters into contracts that contain a variety of indemnifications. The Company's maximum exposure under these arrangements is unknown. However, the Company has not had prior claims or losses pursuant to these contracts and expects the risk of loss to be remote.
6. Dividends and Distributions to Shareholders: Dividends and distributions to shareholders are recorded on the ex-dividend date. Dividends from net investment income, if any, are declared and paid annually. Net realized capital gains, if any, are distributed at least annually.
7. Security Transactions, Income and Expenses: Security transactions are accounted for on the trade date (date the order to buy or sell is executed). Realized gains and losses on the sale of investment securities are determined on the specific identified cost method. Dividend income and other distributions are recorded on the ex-dividend date (except for certain foreign dividends which may be recorded as soon as the Fund is informed of such dividends) net of applicable withholding taxes. Interest income is recognized on the accrual basis except where collection is in doubt. Discounts are accreted and premiums are amortized over the life of the respective securities. Most expenses of the Company can be directly attributed to a particular Fund. Expenses which cannot be directly attributed are apportioned among the Funds based upon relative net assets or other appropriate methods. Income, expenses (other than class specific expenses — distribution and shareholder services, transfer agency and sub transfer agency fees) and realized and unrealized gains or losses are allocated to each class of shares based upon their relative net assets.
The Fund owns shares of real estate investment trusts ("REITs") which report information on the source of their distributions annually in the following calendar year. A portion of distributions received from REITs during the year is estimated to be a return of capital and is recorded as a reduction of their cost.
B. Advisory Fees: The Adviser, a wholly-owned subsidiary of Morgan Stanley, provides the Fund with advisory services under the terms of an Investment Advisory Agreement, paid quarterly, at the annual rate based on the daily net assets as follows:
First $750
million | | Next $750
million | | Over $1.5
billion | |
| | 0.85 | % | | | 0.80 | % | | | 0.75 | % | |
For the year ended December 31, 2018, the advisory fee rate (net of waiver/rebate) was equivalent to an annual effective rate of 0.16% of the Fund's average daily net assets.
The Adviser has agreed to reduce its advisory fee and/or reimburse the Fund so that total annual portfolio operating expenses, excluding certain investment related expenses, taxes, interest and other extraordinary expenses (including litigation), will not exceed 1.10% for Class I shares, 1.45% for Class A shares, 1.95% for Class L shares, 2.20% for Class C shares and 1.07% for Class IS shares. The fee waivers and/or expense reimbursements will continue for at least one year from the date of the Fund's prospectus or until such time as the Directors act to discontinue all or a portion of such waivers and/or reimbursements when they deem such action is appropriate. For the year ended December 31, 2018, approximately $366,000 of advisory fees were waived and approximately $24,000 of other expenses were reimbursed by the Adviser pursuant to this arrangement.
The Adviser provides investment advisory services to the Subsidiary pursuant to the Subsidiary Investment Management Agreement (the "Agreement"). Under the Agreement, the Subsidiary will pay the Adviser at the end of each fiscal quarter, calculated by applying a quarterly rate, based on the annual rate of 0.05%, to the average daily net assets of the Subsidiary.
The Adviser has agreed to waive its advisory fees by the amount of advisory fees it receives from the Subsidiary.
C. Administration Fees: The Adviser also serves as Administrator to the Company and provides administrative services pursuant to an Administration Agreement for an annual fee, accrued daily and paid monthly, of 0.08% of the Fund's average daily net assets.
Under a Sub-Administration Agreement between the Administrator and State Street Bank and Trust Company ("State Street"), State Street provides certain administrative services to the Company. For such services, the Administrator pays State Street a portion of the fee the Administrator receives from the Fund.
42
Morgan Stanley Institutional Fund, Inc.
Annual Report — December 31, 2018
Notes to Consolidated Financial Statements (cont'd)
D. Distribution and Shareholder Services Fees: Morgan Stanley Distribution, Inc. ("MSDI" or the "Distributor"), a wholly-owned subsidiary of the Adviser and an indirect subsidiary of Morgan Stanley, serves as the Company's Distributor of Fund shares pursuant to a Distribution Agreement. The Company has adopted a Shareholder Services Plan with respect to Class A shares pursuant to Rule 12b-1 under the Act. Under the Shareholder Services Plan, the Fund pays the Distributor a shareholder services fee, accrued daily and paid monthly, at an annual rate of 0.25% of the Fund's average daily net assets attributable to Class A shares.
The Company has adopted a Distribution and Shareholder Services Plan with respect to Class L shares pursuant to Rule 12b-1 under the Act. Under the Distribution and Shareholder Services Plan, the Fund pays the Distributor a distribution fee, accrued daily and paid monthly, at an annual rate of 0.50% and a shareholder services fee, accrued daily and paid monthly, at an annual rate of 0.25% of the Fund's average daily net assets attributable to Class L shares.
The Company has adopted a Distribution and Shareholder Services Plan with respect to Class C shares pursuant to Rule 12b-1 under the Act. Under the Distribution and Shareholder Services Plan, the Fund pays the Distributor a distribution fee, accrued daily and paid monthly, at an annual rate of 0.75% and a shareholder services fee, accrued daily and paid monthly, at an annual rate of 0.25% of the Fund's average daily net assets attributable to Class C shares.
The distribution and shareholder services fees are used to support the expenses associated with servicing and maintaining accounts. The Distributor may compensate other parties for providing shareholder support services to investors who purchase Class A, Class L and Class C shares.
E. Dividend Disbursing and Transfer Agent: The Company's dividend disbursing and transfer agent is DST Asset Manager Solutions, Inc. ("DST"). Pursuant to a Transfer Agency Agreement, the Company pays DST a fee based on the number of classes, accounts and transactions relating to the Funds of the Company.
F. Custodian Fees: State Street (the "Custodian") also serves as Custodian for the Company in accordance with a Custodian Agreement. The Custodian holds cash, securities and other assets of the Company as required by the Act. Custody fees are payable monthly based on assets held in custody, investment
purchases and sales activity and account maintenance fees, plus reimbursement for certain out-of-pocket expenses.
G. Security Transactions and Transactions with Affiliates: For the year ended December 31, 2018, purchases and sales of investment securities for the Fund, other than long-term U.S. Government securities and short-term investments were approximately $44,051,000 and $64,945,000, respectively. For the year ended December 31, 2018, purchases and sales of long-term U.S. Government securities were approximately $15,184,000 and $7,126,000, respectively.
The Fund invests in the Institutional Class of the Morgan Stanley Institutional Liquidity Funds — Government Portfolio (the "Liquidity Funds"), an open-end management investment company managed by the Adviser. Advisory fees paid by the Fund are reduced by an amount equal to its pro-rata share of the advisory and administration fees paid by the Fund due to its investment in the Liquidity Funds. For the year ended December 31, 2018, advisory fees paid were reduced by approximately $22,000 relating to the Fund's investment in the Liquidity Funds.
A summary of the Fund's transactions in shares of affiliated investments during the year ended December 31, 2018 is as follows:
Affiliated
Investment
Company | | Value
December 31,
2017
(000) | | Purchases
at Cost
(000) | | Proceeds
from Sales
(000) | | Dividend
Income
(000) | |
Liquidity Funds | | $ | 28,990 | | | $ | 87,411 | | | $ | 105,934 | | | $ | 221 | | |
Affiliated
Investment
Company (cont'd) | | Realized
Gain (Loss)
(000) | | Change in
Unrealized
Appreciation
(Depreciation)
(000) | | Value
December 31,
2018
(000) | |
Liquidity Funds | | $ | — | | | $ | — | | | $ | 10,467 | | |
The Fund is permitted to purchase and sell securities ("cross-trade") from and to other Morgan Stanley funds as well as other funds and client accounts for which the Adviser or an affiliate of the Adviser serves as investment adviser, pursuant to procedures approved by the Directors in compliance with Rule 17a-7 under the Act (the "Rule"). Each cross-trade is executed at the current market price in compliance with provisions of the Rule. For the year ended December 31, 2018, the Fund did not engage in any cross-trade transactions.
The Fund has an unfunded Deferred Compensation Plan (the "Compensation Plan"), which allows each independent Director to defer payment of all, or a portion, of the fees he or she receives for serving on the Board of Directors. Each eligible
43
Morgan Stanley Institutional Fund, Inc.
Annual Report — December 31, 2018
Notes to Consolidated Financial Statements (cont'd)
Director generally may elect to have the deferred amounts credited with a return equal to the total return on one or more of the Morgan Stanley funds that are offered as investment options under the Compensation Plan. Appreciation/depreciation and distributions received from these investments are recorded with an offsetting increase/decrease in the deferred compensation obligation and do not affect the NAV of the Fund.
H. Federal Income Taxes: It is the Fund's intention to continue to qualify as a regulated investment company and distribute all of its taxable and tax-exempt income. Accordingly, no provision for Federal income taxes is required in the financial statements.
The Fund may be subject to taxes imposed by countries in which it invests. Such taxes are generally based on income and/or capital gains earned or repatriated. Taxes are accrued based on net investment income, net realized gains and net unrealized appreciation as such income and/or gains are earned. Taxes may also be based on transactions in foreign currency and are accrued based on the value of investments denominated in such currency.
FASB ASC 740-10, "Income Taxes — Overall", sets forth a minimum threshold for financial statement recognition of the benefit of a tax position taken or expected to be taken in a tax return. Management has concluded there are no significant uncertain tax positions that would require recognition in the financial statements. If applicable, the Fund recognizes interest accrued related to unrecognized tax benefits in "Interest Expense" and penalties in "Other Expenses" in the Statement of Operations. The Fund files tax returns with the U.S. Internal Revenue Service, New York and various states. Generally, each of the tax years in the four-year period ended December 31, 2018 remains subject to examination by taxing authorities.
The tax character of distributions paid may differ from the character of distributions for GAAP purposes due to short-term capital gains being treated as ordinary income for tax purposes. The tax character of distributions paid during fiscal years 2018 and 2017 was as follows:
2018
Distributions
Paid From: | | 2017
Distributions
Paid From: | |
Ordinary
Income
(000) | | Long-Term
Capital Gain
(000) | | Ordinary
Income
(000) | | Long-Term
Capital Gain
(000) | |
| $ | 1,199 | | | $ | — | | | $ | — | | | $ | — | | |
The amount and character of income and gains to be distributed are determined in accordance with income tax regulations which may differ from GAAP. These book/tax differences are either considered temporary or permanent in nature.
Temporary differences are primarily due to differing book and tax treatments in the timing of the recognition of gains (losses) on certain investment transactions and the timing of the deductibility of certain expenses.
Permanent differences, primarily due to a net operating loss, resulted in the following reclassifications among the components of net assets at December 31, 2018:
Total
Accumulated
Loss
(000) | | Paid-in-
Capital
(000) | |
| $ | 1 | | | $ | (1 | ) | |
At December 31, 2018, the components of distributable earnings for the Fund on a tax basis were as follows:
Undistributed
Ordinary
Income
(000) | | Undistributed
Long-Term
Capital Gain
(000) | |
| $ | 806 | | | $ | — | | |
At December 31, 2018, the Fund had available for federal income tax purposes unused short-term and long-term capital losses of approximately $84,638,000 and $790,000 respectively that do not have an expiration date.
To the extent that capital loss carryforwards are used to offset any future capital gains realized, no capital gains tax liability will be incurred by the Fund for gains realized and not distributed. To the extent that capital gains are offset, such gains will not be distributed to the shareholders.
During the year ended December 31, 2018, the Fund utilized capital loss carryforwards for U. S. federal income tax purposes of approximately $2,507,000.
I. Credit Facility: The Company and other Morgan Stanley funds participated in a $150,000,000 committed, unsecured revolving line of credit facility (the "Facility") with State Street. This Facility is to be used for temporary emergency purposes or funding of shareholder redemption requests. The interest rate on borrowings is based on the federal funds rate or 1 month LIBOR rate plus a spread. The Facility also has a commitment fee of 0.25% per annum based on the unused portion of the Facility. During the year ended December 31, 2018, the Fund did not have any borrowings under the Facility.
44
Morgan Stanley Institutional Fund, Inc.
Annual Report — December 31, 2018
Notes to Consolidated Financial Statements (cont'd)
J. Other: At December 31, 2018, the Fund had record owners of 10% or greater. Investment activities of these shareholders could have a material impact on the Fund. The aggregate percentage of such owners was 86.2%.
K. Accounting Pronouncement: In March 2017, FASB issued an Accounting Standard Update, ASU 2017-08, Receivables-Nonrefundable Fees and Other Costs (Subtopic 310-20), Premium Amortization on Purchased Callable Debt Securities ("ASU 2017-08") which amends the amortization period for certain purchased callable debt securities held at a premium, shortening such period to the earliest call date. ASU 2017-08 does not require any accounting change for debt securities held at a discount; the discount continues to be accreted to maturity. ASU 2017-08 is effective for fiscal years, and interim periods within those fiscal years, beginning after December 15, 2018. At this time, management is evaluating the implications of these changes on the financial statements.
45
Morgan Stanley Institutional Fund, Inc.
Annual Report — December 31, 2018
Report of Independent Registered Public Accounting Firm
To the Shareholders and Board of Directors of
Morgan Stanley Institutional Fund, Inc. —
Multi-Asset Portfolio
Opinion on the Financial Statements
We have audited the accompanying consolidated statement of assets and liabilities of Multi-Asset Portfolio (the "Fund") (one of the funds constituting the Morgan Stanley Institutional Fund, Inc. (the "Company")), including the consolidated portfolio of investments, as of December 31, 2018, and the related consolidated statement of operations for the year then ended, the consolidated statements of changes in net assets for each of the two years in the period then ended, the consolidated financial highlights for each of the five years in the period then ended and the related notes (collectively referred to as the "consolidated financial statements"). In our opinion, the consolidated financial statements present fairly, in all material respects, the financial position of Multi-Asset Portfolio (one of the funds constituting Morgan Stanley Institutional Fund, Inc.) at December 31, 2018, the consolidated results of its operations for the year then ended, the consolidated changes in its net assets for each of the two years in the period then ended and its consolidated financial highlights for each of the five years in the period then ended, in conformity with U.S. generally accepted accounting principles.
Basis for Opinion
These consolidated financial statements are the responsibility of the Company's management. Our responsibility is to express an opinion on the Fund's consolidated financial statements based on our audits. We are a public accounting firm registered with the Public Company Accounting Oversight Board (United States) ("PCAOB") and are required to be independent with respect to the Company in accordance with the U.S. federal securities law and the applicable rules and regulations of the Securities and Exchange Commission and the PCAOB.
We conducted our audits in accordance with the standards of the PCAOB. Those standards require that we plan and perform the audit to obtain reasonable assurance about whether the financial statements are free of material misstatement, whether due to error or fraud. The Company is not required to have, nor were we engaged to perform, an audit of the Company's internal control over financial reporting. As part of our audits, we are required to obtain an understanding of internal control over financial reporting, but not for the purpose of expressing an opinion on the effectiveness of the Company's internal control over financial reporting. Accordingly, we express no such opinion.
Our audits included performing procedures to assess the risks of material misstatement of the financial statements, whether due to error or fraud, and performing procedures that respond to those risks. Such procedures included examining, on a test basis, evidence regarding the amounts and disclosures in the financial statements. Our procedures included confirmation of securities owned as of December 31, 2018 by correspondence with the custodian and others or by other appropriate auditing procedures where replies from others were not received. Our audits also included evaluating the accounting principles used and significant estimates made by management, as well as evaluating the overall presentation of the financial statements. We believe that our audits provide a reasonable basis for our opinion.

We have served as the auditor of one or more Morgan Stanley investment companies since 2000.
Boston, Massachusetts
February 26, 2019
46
Morgan Stanley Institutional Fund, Inc.
Annual Report — December 31, 2018
Federal Tax Notice (unaudited)
For federal income tax purposes, the following information is furnished with respect to the distributions paid by the Fund during its taxable year ended December 31, 2018. For corporate shareholders 2.6% of the dividends qualified for the dividends received deduction.
In January, the Fund provides tax information to shareholders for the preceding calendar year.
47
Morgan Stanley Institutional Fund, Inc.
Annual Report — December 31, 2018
Privacy Notice (unaudited)
MORGAN STANLEY INVESTMENT MANAGEMENT INC.
AN IMPORTANT NOTICE CONCERNING OUR U.S. PRIVACY POLICY
We are required by federal law to provide you with a copy of our privacy policy annually. This policy applies to current and former individual investors in funds managed or sponsored by Morgan Stanley Investment Management Inc. ("MSIM") as well as current and former individual clients of MSIM. This policy is not applicable to partnerships, corporations, trusts or other non-individual clients or investors. Please note that we may amend this policy at any time, and will inform you of any changes as required by law.
WE RESPECT YOUR PRIVACY
We appreciate that you have provided us with your personal financial information. We strive to maintain the privacy of such information while we help you achieve your financial objectives. This Notice describes what non-public personal information we collect about you, why we collect it, when we may share it with others and how certain others may use it. It discusses the steps you may take to limit our sharing of certain information about you to affiliated companies in the Morgan Stanley family of companies ("other Morgan Stanley companies"). It also discloses how you may limit use of certain shared information for marketing purposes by other Morgan Stanley branded companies. Throughout this policy, we refer to the non-public information that personally identifies you or your accounts as "personal information."
1. WHAT PERSONAL INFORMATION DO WE COLLECT ABOUT YOU?
We obtain personal information from applications and other forms you submit to us, from your dealings with us, from consumer reporting agencies, from our Web sites and from third parties and other sources.
For example:
• We may collect information such as your name, address, e-mail address, telephone/fax numbers, assets, income and investment objectives through subscription documents, applications and other forms you submit to us.
• We may obtain information about account balances, your use of account(s) and the types of products and services you prefer to receive from us through your dealings and transactions with us and other sources.
• We may obtain information about your creditworthiness and credit history from consumer reporting agencies.
• We may collect background information from and through third-party vendors to verify representations you have made and to comply with various regulatory requirements.
• If you interact with us through our public and private Web sites, we may collect information that you provide directly through online communications (such as an e-mail address). We may also collect information about your Internet service provider, your domain name, your computer's operating system and Web browser, your use of our Web sites and your product and service preferences, through the use of "cookies." Please consult the Terms of Use of these sites for more details.
2. WHEN DO WE DISCLOSE PERSONAL INFORMATION WE COLLECT ABOUT YOU?
We may disclose personal information we collect about you to other Morgan Stanley companies and to non-affiliated third parties.
a. Information We Disclose to Other Morgan Stanley Companies.
We may disclose personal information to other Morgan Stanley companies for a variety of reasons, including to manage your account(s) effectively, to service and process your transactions, to let you know about products and services offered by us and other Morgan Stanley companies, to manage our business, and as otherwise required or permitted by law. Offers for products and services from other Morgan Stanley companies are developed under conditions designed to safeguard your personal information.
48
Morgan Stanley Institutional Fund, Inc.
Annual Report — December 31, 2018
Privacy Notice (unaudited) (cont'd)
b. Information We Disclose to Non-affiliated Third Parties.
We do not disclose personal information that we collect about you to non-affiliated third parties except to those who provide marketing services on our behalf, to financial institutions with whom we have joint marketing agreements, and as otherwise required or permitted by law. For example, we may disclose personal information to non-affiliated third parties for servicing and processing transactions, to offer our own products and services, to protect against fraud, for institutional risk control, to respond to judicial process or to perform services on our behalf. When we share personal information with a non-affiliated third party, they are required to limit their use of personal information to the particular purpose for which it was shared and they are not allowed to share personal information with others except to fulfill that limited purpose or as may be permitted or required by law.
3. HOW DO WE PROTECT THE SECURITY AND CONFIDENTIALITY OF PERSONAL INFORMATION WE COLLECT ABOUT YOU?
We maintain physical, electronic and procedural security measures to help safeguard the personal information we collect about you. We have internal policies governing the proper handling of client information. Third parties that provide support or marketing services on our behalf may also receive personal information, and we require them to adhere to confidentiality standards with respect to such information.
4. HOW CAN YOU LIMIT THE SHARING OF CERTAIN TYPES OF PERSONAL INFORMATION WITH OTHER MORGAN STANLEY COMPANIES?
We offer you choices as to whether we share with other Morgan Stanley companies the personal information that was collected to determine your eligibility for products and services you request ("eligibility information"). Eligibility information does not include your identification information or personal information pertaining to our transactions or experiences with you. Please note that, even if you direct us not to share eligibility information with other Morgan Stanley companies ("opt-out"), we may still share personal information, including eligibility information, with those companies in circumstances excluded from the opt-out under applicable law, such as to process transactions or to service your account.
5. HOW CAN YOU LIMIT THE USE OF CERTAIN TYPES OF PERSONAL INFORMATION BY OTHER MORGAN STANLEY COMPANIES FOR MARKETING?
By following the opt-out instructions in Section 6 below, you may limit other Morgan Stanley branded companies from marketing their products or services to you based on personal information we disclose to them. This information may include, for example, your income and account history with us. Please note that, even if you choose to limit Other Morgan Stanley Companies from using personal information about you that we may share with them for marketing their products and services to you, Other Morgan Stanley Companies may use your personal information that they obtain from us to market to you in circumstances permitted by law, such as if the Other Morgan Stanley Company has its own relationship with you.
6. HOW CAN YOU SEND US AN OPT-OUT INSTRUCTION?
If you wish to limit our sharing of eligibility information about you with other Morgan Stanley companies or other Morgan Stanley companies' use of personal information for marketing purposes, as described in this notice, you may do so by:
• Calling us at (800) 548-7786
Monday–Friday between 8a.m. and 6p.m.(EST)
• Writing to us at the following address:
DST Asset Manager Solutions, Inc.
c/o Privacy Coordinator
P.O. Box 219804
Kansas City, Missouri 64121
49
Morgan Stanley Institutional Fund, Inc.
Annual Report — December 31, 2018
Privacy Notice (unaudited) (cont'd)
Your written request should include your name, address, telephone number and account number(s) to which the opt-out applies and whether you are opting out with respect to sharing of eligibility information (Section 4 above), or if information used for Marketing (Section 5 above) or both. Written opt-out requests should not be sent with any other correspondence. In order to process your request, we require that the request be provided by you directly and not through a third party.
Your opt-out preference will remain in effect with respect to this policy (as it may be amended) until you notify us otherwise. If you have a joint account, your direction for us not to share this information with other Morgan Stanley companies and for those other Morgan Stanley companies not to use your personal information for marketing will be applied to all account holders on that account. Please understand that if you limit our sharing or our affiliated companies' use of personal information, you and any joint account holder(s) may not receive information about Morgan Stanley products and services, including products or services that could help you manage your financial resources and achieve your investment objectives.
7. WHAT IF AN AFFILIATED COMPANY BECOMES A NON-AFFILIATED THIRD PARTY?
If, at any time in the future, an affiliated company becomes a non-affiliated third party, further disclosures of personal information made to the former affiliated company will be limited to those described in Section 2(b) above relating to non-affiliated third parties. If you elected under Section 6 to limit disclosures we make to affiliated companies, or use of personal information by affiliated companies, your election will not apply to use by any former affiliated company of your personal information in their possession once it becomes a non-affiliated third party.
SPECIAL NOTICE TO RESIDENTS OF VERMONT
The following section supplements our policy with respect to our individual clients who have a Vermont address and supersedes anything to the contrary in the above policy with respect to those clients only.
The state of Vermont requires financial institutions to obtain your consent prior to sharing personal information that they collect about you with affiliated companies and non-affiliated third parties other than in certain limited circumstances. Except as permitted by law, we will not share personal information we collect about you with non-affiliated third parties or other Morgan Stanley companies unless you provide us with your written consent to share such information ("opt-in").
If you wish to receive offers for investment products and services offered by or through other Morgan Stanley companies, please notify us in writing at the following address:
DST Asset Manager Solutions, Inc.
c/o Privacy Coordinator
P.O. Box 219804
Kansas City, Missouri 64121
Your authorization should include your name, address, telephone number and account number(s) to which the opt-in applies and should not be sent with any other correspondence. In order to process your authorization, we require that the authorization be provided by you directly and not through a third party.
SPECIAL NOTICE TO RESIDENTS OF CALIFORNIA
The following section supplements our policy with respect to our individual clients who have a California address and supersedes anything to the contrary in the above policy with respect to those clients only.
In response to a California law, if your account has a California home address, your personal information will not be disclosed to non-affiliated third parties except as permitted by applicable California law, and we will limit sharing such information with our affiliates to comply with California privacy laws that apply to us.
50
Morgan Stanley Institutional Fund, Inc.
Annual Report — December 31, 2018
Director and Officer Information (unaudited)
Independent Directors:
Name, Age and Address of
Independent Director | | Position(s)
Held with
Registrant | | Length of Time
Served* | | Principal Occupation(s) During Past 5 Years
and Other Relevant Professional Experience | | Number of
Portfolios in
Fund Complex
Overseen by
Independent
Director** | | Other Directorships
Held by Independent
Director*** | |
Frank L. Bowman (74)
c/o Perkins Coie LLP
Counsel to the Independent
Directors
30 Rockefeller Plaza
New York, NY 10112 | | Director | | Since
August
2006 | | President, Strategic Decisions, LLC (consulting) (since February 2009); Director or Trustee of various Morgan Stanley Funds (since August 2006); Chairperson of the Compliance and Insurance Committee (since October 2015); formerly, Chairperson of the Insurance Sub-Committee of the Compliance and Insurance Committee (2007-2015); served as President and Chief Executive Officer of the Nuclear Energy Institute (policy organization) (February 2005-November 2008); retired as Admiral, U.S. Navy after serving over 38 years on active duty including 8 years as Director of the Naval Nuclear Propulsion Program in the Department of the Navy and the U.S. Department of Energy (1996-2004); served as Chief of Naval Personnel (July 1994-September 1996) and on the Joint Staff as Director of Political Military Affairs (June 1992-July 1994); knighted as Honorary Knight Commander of the Most Excellent Order of the British Empire; awarded the Officier de l'Orde National du Mérite by the French Government; elected to the National Academy of Engineering (2009). | | | 82 | | | Director of BP p.l.c.; Director of Naval and Nuclear Technologies LLP; Director Emeritus of the Armed Services YMCA; Member of the National Security Advisory Council of the Center for U.S. Global Engagement and a member of the CNA Military Advisory Board; Trustee of Fairhaven United Methodist Church; Member of the Board of Advisors of the Dolphin Scholarship Foundation; and Director of other various non-profit organizations. | |
Kathleen A. Dennis (65)
c/o Perkins Coie LLP
Counsel to the Independent Directors
30 Rockefeller Plaza
New York, NY 10112 | | Director | | Since
August
2006 | | President, Cedarwood Associates (mutual fund and investment management consulting) (since July 2006); Chairperson of the Liquidity and Alternatives Sub-Committee of the Investment Committee (since October 2006) and Director or Trustee of various Morgan Stanley Funds (since August 2006); formerly, Senior Managing Director of Victory Capital Management (1993-2006). | | | 82 | | | Director of various non-profit organizations. | |
Nancy C. Everett (63)
c/o Perkins Coie LLP
Counsel to the Independent Directors
30 Rockefeller Plaza
New York, NY 10112 | | Director | | Since
January
2015 | | Chief Executive Officer, Virginia Commonwealth University Investment Company (since November 2015); Owner, OBIR, LLC (institutional investment management consulting) (since June 2014); formerly, Managing Director, BlackRock Inc. (February 2011-December 2013); and Chief Executive Officer, General Motors Asset Management (a/k/a Promark Global Advisors, Inc.) (June 2005-May 2010). | | | 83 | | | Formerly, Member of Virginia Commonwealth University School of Business Foundation (2005-2016); Member of Virginia Commonwealth University Board of Visitors (2013-2015); Member of Committee on Directors for Emerging Markets Growth Fund, Inc. (2007-2010); Chairperson of Performance Equity Management, LLC (2006-2010); and Chairperson, GMAM Absolute Return Strategies Fund, LLC (2006-2010). | |
51
Morgan Stanley Institutional Fund, Inc.
Annual Report — December 31, 2018
Director and Officer Information (unaudited) (cont'd)
Independent Directors: (cont'd)
Name, Age and Address of
Independent Director | | Position(s)
Held with
Registrant | | Length of Time
Served* | | Principal Occupation(s) During Past 5 Years
and Other Relevant Professional Experience | | Number of
Portfolios in
Fund Complex
Overseen by
Independent
Director** | | Other Directorships
Held by Independent
Director*** | |
Jakki L. Haussler (61)
c/o Perkins Coie LLP
Counsel to the Independent Directors
30 Rockefeller Plaza
New York, NY 10112 | | Director | | Since
January
2015 | | Chairman and Chief Executive Officer, Opus Capital Group (since January 1996); formerly, Director, Capvest Venture Fund, LP (May 2000-December 2011); Partner, Adena Ventures, LP (July 1999-December 2010); Director, The Victory Funds (February 2005-July 2008). | | | 83 | | | Director of Service Corporation International and Member, Audit Committee and Investment Committee; Director of Cincinnati Bell Inc. and Member, Audit Committee and Governance and Nominating Committee; Chairman of Northern Kentucky University Member Investment Committee; Member of Chase College of Law Transactional Law Practice Center Board of Advisors; Director of Best Transport; Director of Chase College of Law Board of Visitors; formerly, Member, University of Cincinnati Foundation Investment Committee; Member, Miami University Board of Visitors (2008-2011); Trustee of Victory Funds (2005-2008) and Chairman, Investment Committee (2007-2008) and Member, Service Provider Committee (2005-2008). | |
Dr. Manuel H. Johnson (69)
c/o Johnson Smick
International, Inc.
220 I Street, NE — Suite 200
Washington, D.C. 20002 | | Director | | Since
July
1991 | | Senior Partner, Johnson Smick International, Inc. (consulting firm); Chairperson of the Investment Committee (since October 2006) and Director or Trustee of various Morgan Stanley Funds (since July 1991); Co-Chairman and a founder of the Group of Seven Council (G7C) (international economic commission); formerly, Chairperson of the Audit Committee (July 1991-September 2006), Vice Chairman of the Board of Governors of the Federal Reserve System and Assistant Secretary of the U.S. Treasury. | | | 82 | | | Director of NVR, Inc. (home construction). | |
Joseph J. Kearns (76)
c/o Perkins Coie LLP
Counsel to the Independent
Directors
30 Rockfeller Plaza
New York, NY 10112 | | Director | | Since
August
1994 | | Senior Adviser, Kearns & Associates LLC (investment consulting); Chairperson of the Audit Committee (since October 2006) and Director or Trustee of various Morgan Stanley Funds (since August 1994); formerly, Deputy Chairperson of the Audit Committee (July 2003-September 2006) and Chairperson of the Audit Committee of various Morgan Stanley Funds (since August 1994); CFO of the J. Paul Getty Trust. | | | 83 | | | Prior to August 10, 2016, Director of Electro Rent Corporation (equipment leasing); Prior to December 31, 2013, Director of The Ford Family Foundation. | |
52
Morgan Stanley Institutional Fund, Inc.
Annual Report — December 31, 2018
Director and Officer Information (unaudited) (cont'd)
Independent Directors: (cont'd)
Name, Age and Address of
Independent Director | | Position(s)
Held with
Registrant | | Length of Time
Served* | | Principal Occupation(s) During Past 5 Years
and Other Relevant Professional Experience | | Number of
Portfolios in
Fund Complex
Overseen by
Independent
Director** | | Other Directorships
Held by Independent
Director*** | |
Michael F. Klein (60)
c/o Perkins Coie LLP
Counsel to the Independent Directors
30 Rockefeller Plaza
New York, NY 10112 | | Director | | Since
August
2006 | | Managing Director, Aetos Alternatives Management, LP (since March 2000); Co-President, Aetos Alternatives Management, LP (since January 2004) and Co-Chief Executive Officer of Aetos Alternatives Management, LP (since August 2013); Chairperson of the Fixed Income Sub-Committee of the Investment Committee (since October 2006) and Director or Trustee of various Morgan Stanley Funds (since August 2006); formerly, Managing Director, Morgan Stanley & Co. Inc. and Morgan Stanley Dean Witter Investment Management and President, various Morgan Stanley Funds (June 1998-March 2000): Principal, Morgan Stanley & Co. Inc. and Morgan Stanley Dean Witter Investment Management (August 1997-December 1999). | | | 82 | | | Director of certain investment funds managed or sponsored by Aetos Alternatives Management, LP; Director of Sanitized AG and Sanitized Marketing AG (specialty chemicals). | |
Patricia Maleski (58)
c/o Perkins Coie LLP
Counsel to the Independent Directors
30 Rockefeller Plaza
New York, NY 10112 | | Director | | Since
January
2017 | | Managing Director, JPMorgan Asset Management (2004-2016); Oversight and Control Head of Fiduciary and Conflicts of Interest Program (2015-2016); Chief Control Officer-Global Asset Management (2013-2015); President, JPMorgan Funds (2010-2013); Chief Administrative Officer (2004-2013); various other positions including Treasurer and Board Liaison (since 2001). | | | 83 | | | None. | |
Michael E. Nugent (82)
522 Fifth Avenue
New York, NY 10036 | | Chair of the Board and Director | | Chair of the Boards since July 2006 and Director since July 1991 | | Chair of the Boards of various Morgan Stanley Funds (since July 2006); Chairperson of the Closed-End Fund Committee (since June 2012) Governance Committee (since January 2019) and Director or Trustee of various Morgan Stanley Funds (since July 1991); formerly, Chairperson of the Insurance Committee (until July 2006); General Partner, Triumph Capital, L.P. (private investment partnership) (1988-2013). | | | 82 | | | None. | |
W. Allen Reed (71)
c/o Perkins Coie LLP
Counsel to the Independent Directors
30 Rockefeller Plaza
New York, NY 10112 | | Director | | Since
August
2006 | | Chairperson of the Equity Sub-Committee of the Investment Committee (since October 2006) and Director or Trustee of various Morgan Stanley Funds (since August 2006); formerly, President and CEO of General Motors Asset Management; Chairman and Chief Executive Officer of the GM Trust Bank and Corporate Vice President of General Motors Corporation (August 1994-December 2005). | | | 82 | | | Director of Legg Mason, Inc.; formerly, Director of the Auburn University Foundation (2010-2015). | |
Fergus Reid (86)****
c/o Joe Pietryka, Inc.
85 Charles Colman Blvd.
Pawling, NY 12564 | | Director | | Since
June
1992 | | Chairman, Joe Pietryka, Inc.; Chairperson of the Governance Committee and Director or Trustee of various Morgan Stanley Funds (since June 1992). | | | 83 | | | Formerly, Trustee and Director of certain investment companies in the JP Morgan Fund Complex managed by JP Morgan Investment Management Inc. (1987-2012). | |
* This is the earliest date the Director began serving the Morgan Stanley Funds. Each Director serves an indefinite term, until his or her successor is elected.
** The Fund Complex includes (as of December 31, 2018) all open-end and closed-end funds (including all of their portfolios) advised by Morgan Stanley Investment Management Inc. (the "Adviser") and any funds that have an adviser that is an affiliated person of the Adviser (including, but not limited to, Morgan Stanley AIP GP LP).
*** This includes any directorships at public companies and registered investment companies held by the Director at any time during the past five years.
**** Effective date of retirement is December 31, 2018.
53
Morgan Stanley Institutional Fund, Inc.
Annual Report — December 31, 2018
Director and Officer Information (unaudited) (cont'd)
Executive Officers:
Name, Age and Address of Executive Officer | | Position(s) Held
with
Registrant | | Length of
Time Served* | | Principal Occupation(s) During Past 5 Years | |
John H. Gernon (55)
522 Fifth Avenue
New York, NY 10036 | | President and Principal Executive Officer | | Since
September
2013 | | President and Principal Executive Officer of the Equity and Fixed Income Funds and the Morgan Stanley AIP Funds (since September 2013) and the Liquidity Funds and various money market funds (since May 2014) in the Fund Complex; Managing Director of the Adviser; Head of Product (since 2006). | |
Timothy J. Knierim (59)
522 Fifth Avenue
New York, NY 10036 | | Chief Compliance Officer | | Since
December
2016 | | Managing Director of the Adviser and various entities affiliated with the Adviser; Chief Compliance Officer of various Morgan Stanley Funds and the Adviser (since December 2016) and Chief Compliance Officer of Morgan Stanley AIP GP LP (since 2014). Formerly, Managing Director and Deputy Chief Compliance Officer of the Adviser (2014-2016); and formerly, Chief Compliance Officer of Prudential Investment Management, Inc. (2007-2014). | |
Francis J. Smith (53)
522 Fifth Avenue
New York, NY 10036 | | Treasurer and Principal Financial Officer | | Treasurer since July 2003 and Principal Financial Officer since September 2002 | | Managing Director of the Adviser and various entities affiliated with the Adviser; Treasurer (since July 2003) and Principal Financial Officer of various Morgan Stanley Funds (since September 2002). | |
Mary E. Mullin (51)
522 Fifth Avenue
New York, NY 10036 | | Secretary | | Since
June
1999 | | Managing Director of the Adviser; Secretary of various Morgan Stanley Funds (since June 1999). | |
Michael J. Key (39)
522 Fifth Avenue
New York, NY 10036 | | Vice President | | Since
June
2017 | | Vice President of the Equity and Fixed Income Funds, Liquidity Funds, various money market funds and the Morgan Stanley AIP Funds in the Fund Complex (since June 2017); Executive Director of the Adviser; Head of Product Development for Equity and Fixed Income Funds (since August 2013). | |
* This is the earliest date the officer began serving the Morgan Stanley Funds. Each officer serves a one-year term, until his or her successor is elected and qualifies.
54
Morgan Stanley Institutional Fund, Inc.
Annual Report — December 31, 2018
Adviser and Administrator
Morgan Stanley Investment Management Inc.
522 Fifth Avenue
New York, New York 10036
Distributor
Morgan Stanley Distribution, Inc.
522 Fifth Avenue
New York, New York 10036
Dividend Disbursing and Transfer Agent
DST Asset Manager Solutions, Inc.
2000 Crown Colony Drive
Quincy, Massachusetts 02169
Custodian
State Street Bank and Trust Company
One Lincoln Street
Boston, Massachusetts 02111
Legal Counsel
Dechert LLP
1095 Avenue of the Americas
New York, New York 10036
Counsel to the Independent Directors
Perkins Coie LLP
30 Rockefeller Plaza
New York, New York 10112
Independent Registered Public Accounting Firm
Ernst & Young LLP
200 Clarendon Street
Boston, Massachusetts 02116
Reporting to Shareholders
Each Morgan Stanley fund provides a complete schedule of portfolio holdings in its semi-annual and the annual reports within 60 days of the end of the fund's second and fourth fiscal quarters. The semi-annual and annual reports are filed electronically with the Securities and Exchange Commission ("SEC") on Form N-CSRS and Form N-CSR, respectively. Morgan Stanley also delivers the semi-annual and annual reports to fund shareholders and makes these reports available on its public website, www.morganstanley.com/im/shareholderreports. Each Morgan Stanley fund also files a complete schedule of portfolio holdings with the SEC for the fund's first and third fiscal quarters on Form N-Q. Morgan Stanley does not deliver the reports for the first and third fiscal quarters to shareholders, nor are the reports posted to the Morgan Stanley public website. You may, however, obtain the Form N-Q filings (as well as the Form N-CSR and N-CSRS filings) by accessing the SEC's website, www.sec.gov. You can also request copies of these materials, upon payment of a duplicating fee, by electronic request at the SEC's email address (publicinfo@sec.gov).
Proxy Voting Policies and Procedures and Proxy Voting Record
You may obtain a copy of the Company's Proxy Voting Policy and Procedures and information regarding how the Company voted proxies relating to portfolio securities during the most recent twelve-month period ended June 30, without charge, upon request, by calling toll free 1 (800) 548-7786 or by visiting our website at www.morganstanley.com/im/shareholderreports. This information is also available on the SEC's website at www.sec.gov.
This report is authorized for distribution only when preceded or accompanied by a prospectus or summary prospectus of the applicable Fund of Morgan Stanley Institutional Fund, Inc., which describes in detail the Fund's investment policies, risks, fees and expenses. Please read the prospectus carefully before you invest or send money. For additional information, including information regarding the investments comprising the Fund, please visit our website at www.morganstanley.com/im/shareholderreports or call toll free 1 (800) 548-7786.
55
Printed in U.S.A.
This Report has been prepared for shareholders and may be distributed to others only if preceded or accompanied by a current prospectus.
Morgan Stanley Investment Management Inc.
522 Fifth Avenue
New York, New York 10036
© 2019 Morgan Stanley. Morgan Stanley Distribution, Inc.

IFIMAANN
2404103 EXP. 02.29.20

Morgan Stanley Institutional Fund, Inc.
Real Assets Portfolio
Annual Report
December 31, 2018
Beginning on January 1, 2021, as permitted by regulations adopted by the Securities and Exchange Commission ("SEC"), paper copies of the Fund's Annual and Semi-Annual Reports to Shareholders ("Shareholder Reports") will no longer be sent by mail, unless you specifically request paper copies of the Shareholder Reports from the Fund or from your financial intermediary, such as a broker-dealer or a bank. Instead, the Shareholder Reports will be made available on the Fund's website, https://www.morganstanley.com/im/shareholderreports and you will be notified by mail each time a Shareholder Report is posted and provided with a website link to access the Shareholder Report. If you already elected to receive Shareholder Reports electronically, you will not be affected by this change and you need not take any action. You may elect to receive Shareholder Reports and other communications from the Fund electronically anytime by contacting your financial intermediary or, if you are a direct investor, please follow the instructions on the envelope.
Beginning on January 1, 2019, you may elect to receive all future Shareholder Reports in paper free of charge. If you invest through a financial intermediary, you can contact your financial intermediary to request that you continue to receive paper copies of your Shareholder Reports. If you invest directly with the Fund, please follow the instructions on the envelope to let the Fund know you wish to continue receiving paper copies of your Shareholder Reports. Your election to receive Shareholder Reports in paper will apply to all funds held in your account if you invest through your financial intermediary or all funds held with the fund complex if you invest directly with a fund.

Morgan Stanley Institutional Fund, Inc.
Annual Report — December 31, 2018
Shareholders' Letter | | | 2 | | |
Expense Example | | | 3 | | |
Investment Overview | | | 4 | | |
Portfolio of Investments | | | 7 | | |
Statement of Assets and Liabilities | | | 12 | | |
Statement of Operations | | | 13 | | |
Statement of Changes in Net Assets | | | 14 | | |
Financial Highlights | | | 15 | | |
Notes to Financial Statements | | | 19 | | |
Report of Independent Registered Public Accounting Firm | | | 28 | | |
Federal Tax Notice | | | 29 | | |
Privacy Notice | | | 30 | | |
Director and Officer Information | | | 33 | | |
This report is authorized for distribution only when preceded or accompanied by a prospectus or summary prospectus of the applicable Fund of Morgan Stanley Institutional Fund, Inc. To receive a prospectus and/or statement of additional information (SAI), which contains more complete information such as investment objectives, charges, expenses, policies for voting proxies, risk considerations and describes in detail each of the Fund's investment policies to the prospective investor, please call toll free 1 (800) 548-7786. Please read the prospectuses carefully before you invest or send money.
Additionally, you can access information about the Fund, including performance, characteristics and investment team commentary, through Morgan Stanley Investment Management's website: www.morganstanley.com/im/shareholderreports.
Market forecasts provided in this report may not necessarily come to pass. There is no guarantee that any sectors mentioned will continue to perform as discussed herein or that securities in such sectors will be held by the Fund in the future. There is no assurance that a fund will achieve its investment objective. Funds are subject to market risk, which is the possibility that market values of securities owned by the Fund will decline and, therefore, the value of the Fund's shares may be less than what you paid for them. Accordingly, you can lose money investing in this Fund. Please see the prospectus for more complete information on investment risks.
1
Morgan Stanley Institutional Fund, Inc.
Annual Report — December 31, 2018
Shareholders' Letter (unaudited)
Dear Shareholders,
We are pleased to provide this Annual report, in which you will learn how your investment in Real Assets Portfolio (the "Fund") performed during the period beginning June 18, 2018 (when the Fund commenced operations) and ended December 31, 2018.
Morgan Stanley Investment Management is a client-centric, investor-led organization. Our global presence, intellectual capital, and breadth of products and services enable us to partner with investors to meet the evolving challenges of today's financial markets. We aim to deliver superior investment service and to empower our clients to make the informed decisions that help them reach their investment goals.
As always, we thank you for selecting Morgan Stanley Investment Management, and look forward to working with you in the months and years ahead.
Sincerely,

John H. Gernon
President and Principal Executive Officer
January 2019
2
Morgan Stanley Institutional Fund, Inc.
Annual Report — December 31, 2018
Expense Example (unaudited)
Real Assets Portfolio
As a shareholder of the Fund, you incur two types of costs: (1) transactional costs; and (2) ongoing costs, which may include advisory fees, administration fees, distribution and shareholder services fees and other Fund expenses. This example is intended to help you understand your ongoing costs (in dollars) of investing in the Fund and to compare these costs with the ongoing costs of investing in other mutual funds.
This example is based on an investment of $1,000 invested at the beginning of the six-month period ended December 31, 2018 and held for the entire six-month period.
Actual Expenses
The table below provides information about actual account values and actual expenses. You may use the information in this table, together with the amount you invested, to estimate the expenses that you paid over the period. Simply divide your account value by $1,000 (for example, an $8,600 account value divided by $1,000 = 8.6), then multiply the result by the number in the table under the heading entitled "Actual Expenses Paid During Period" to estimate the expenses you paid on your account during this period.
Hypothetical Example for Comparison Purposes
The table below provides information about hypothetical account values and hypothetical expenses based on the Fund's actual expense ratio and an assumed rate of return of 5% per year before expenses, which is not the Fund's actual return. The hypothetical account values and expenses may not be used to estimate the actual ending account balance or expenses you paid for the period. You may use this information to compare the ongoing costs of investing in the Fund and other funds. To do so, compare this 5% hypothetical example with the 5% hypothetical examples that appear in the shareholder reports of the other funds.
Please note that the expenses shown in the table are meant to highlight your ongoing costs only and do not reflect any transactional costs, such as sales charges (loads). Therefore, the information for each class in the table is useful in comparing ongoing costs only, and will not help you determine the relative total costs of owning different funds. In addition, if these transactional costs were included, your costs would have been higher.
| | | Beginning
Account
Value
7/1/18 | | Actual Ending
Account
Value
12/31/18 | | Hypothetical
Ending Account
Value | | Actual
Expenses
Paid
During
Period* | | Hypothetical
Expenses Paid
During Period* | | Net
Expense
Ratio
During
Period** | |
Real Assets Portfolio Class I | | $ | 1,000.00 | | | $ | 933.00 | | | $ | 1,021.37 | | | $ | 3.70 | | | $ | 3.87 | | | | 0.76 | % | |
Real Assets Portfolio Class A | | | 1,000.00 | | | | 931.00 | | | | 1,019.46 | | | | 5.55 | | | | 5.80 | | | | 1.14 | | |
Real Assets Portfolio Class C | | | 1,000.00 | | | | 928.20 | | | | 1,015.68 | | | | 9.19 | | | | 9.60 | | | | 1.89 | | |
Real Assets Portfolio Class IS | | | 1,000.00 | | | | 933.10 | | | | 1,021.48 | | | | 3.61 | | | | 3.77 | | | | 0.74 | | |
* Expenses are calculated using each Fund Class' annualized net expense ratio (as disclosed), multiplied by the average account value over the period and multiplied by 184/365 (to reflect the most recent one-half year period).
** Annualized.
3
Morgan Stanley Institutional Fund, Inc.
Annual Report — December 31, 2018
Investment Overview (unaudited)
Real Assets Portfolio
The Fund seeks total return, targeted to be in excess of inflation, through capital appreciation and current income.
Performance
For the since inception period from June 18, 2018 through December 31, 2018, the Fund's Class I shares had a total return based on net asset value and reinvestment of distributions per share of –6.70%, net of fees. The Fund's Class I shares outperformed the Fund's benchmark, the MSCI World Net Index (the "Index"), which returned –10.62%, and underperformed the MSIF Real Assets Benchmark Blend Index, which returned –4.85%.
Factors Affecting Performance
• Global equities fell –10.62% (as measured by the Index) since fund inception, amid declining central bank liquidity and slowing global growth. After a negative first quarter of 2018, in which markets were weighed down by rising rates and inflation as well as increasing protectionism, global equities steadily rallied during the second and third quarters, propelled by strong U.S. earnings and economic growth. Global equities sold off again sharply in the fourth quarter on renewed concerns over rising rates and geopolitical tensions (Brexit, Italy and U.S.-China trade regulations), now combined with slowing growth data in the U.S. and China. On a sector basis, energy and materials underperformed. Crude oil plummeted more than 30% in the fourth quarter due to a combination of fundamental and macro factors. Iranian export sanctions were not as bad as markets expected. U.S. producers maintained supply at a high level. Industrial metals were not immune to this weak macro environment as their prices suffered from concerns over international trade tensions and dollar strength.
• The broad-based sell-off in general equity markets also negatively impacted global real estate securities. Overall, global real estate share prices have largely been driven by macro themes, central bank policies and investor preference for market segments with more defensive characteristics, as opposed to valuations and fundamentals. This has resulted in pockets of the global listed property market trading at premium valuations relative to their peers due to their perceived defensive characteristics. Despite
transactional evidence continuing to demonstrate strength in asset values, there was significant negative investor sentiment towards key market segments resulting in very wide discounts to net asset values (NAVs).
• After lagging global equity markets for the first three quarters of the year, global infrastructure securities demonstrated their relative resilience during the equity market downturn experienced in the fourth quarter of 2018. Still, global infrastructure securities were not wholly immune from general financial market concerns.
• The global inflation-linked bond market is dominated by U.K. gilt linkers and U.S. Treasury inflation protected securities (TIPS). In 2018, real yields in the U.K. fell from already depressed levels as the probability of a hard Brexit increased. The fall in U.K. real yields generated most of the outperformance in the market. On the other side of the Atlantic, U.S. real yields rose dramatically, crossing 1% after a long time as U.S. underlying growth dynamics improved and leading indicators kept printing strong numbers. The rise in U.S. real yields offset some of the performance from U.K. linkers with the market in aggregate generating mildly positive returns. Going into 2019, we expect U.K. real yields to drift higher as hard Brexit concerns dissipate and the probability of re-elections, a second referendum and an extension of Brexit negotiation increases. U.S. real yields may remain range-bound, but we expect them to drift slightly higher from current levels.
Management Strategies
• The Fund is comprised of independently managed sub-portfolios for each real asset class with an asset allocation that aims to optimize the balance between return potential and risk across the publicly traded real asset categories. Across the underlying real asset categories, the investment approach combines a top-down process with bottom-up stock selection, with each team providing bottom-up insight into their specialist areas, determining sub-sector and regional preferences within listed real assets.
4
Morgan Stanley Institutional Fund, Inc.
Annual Report — December 31, 2018
Investment Overview (unaudited) (cont'd)
Real Assets Portfolio
• Going into 2019, we are overweight global infrastructure and global inflation-linked bonds while underweighting global real estate and neutral to the inflation-sensitive basket. We think inflation-linked bonds and global infrastructure are attractive as we see inflationary pressure from the core basket tilted to the upside and strong fundamentals and earnings from the companies.
• Within fixed income, the portfolio is overweight linkers in peripheral Europe as we expect the European Central Bank to remain dovish for a considerable period of time. We are underweight French linkers as the growth dynamics and technicals do not appear to be appealing. We are overweight Australia and New Zealand linkers as a hedge to a global slowdown and underweight U.S. TIPS as we expect real rates to drift higher.
• Within global infrastructure, our research currently leads us to an overweighting to a group of companies in the toll roads, electricity transmission & distribution, diversified and European regulated utilities sectors, and an underweighting to companies in the gas distribution utilities, communications, gas midstream, pipeline companies, water, ports and airports sectors. Finally, we have an out-of-benchmark position in renewables. In terms of outlook for 2019, we enter the year more constructive on the asset class, given the magnitude of declines in 2018. While we acknowledge there are wide ranges in valuations within individual subsectors and the asset class is not universally cheap, we believe there are many instances where the market has overreacted to recent top-down or company-specific developments. In particular, energy infrastructure and certain areas of transportation are notable given the very healthy fundamental environment. Also, renewable assets in the listed equity space continue to trade at steep discounts relative to where assets trade in the private markets, as evidenced by the robust private-market transaction activity (renewables remained greater than half the private market infrastructure transactions in 2018 according to Prequin). In 2019, we view the prospects for healthy cash flow and dividend growth for the asset class overall as sound.
• Within global real estate, while there are pockets of the listed property market that are trading at premium valuations relative to peers due to their perceived defensive characteristics, the public markets appear to be pricing in prospective asset value declines in select sectors despite transactional evidence continuing to demonstrate strength in asset values. This significant negative investor sentiment has resulted in very wide discounts such that many of the stocks are offering a large buffer to this risk in key market segments, including NYC office, Hong Kong commercial property companies, U.S. and Continental Europe high-quality retail, the U.K. Majors and London office specialists, and U.S. central business district office and hotels. While some overall discount may be warranted given the latter phase of the property and valuation cycle, certain market segments are exceptionally discounted and offer opportunistic valuations. As a result, we believe there is an opportunity for active management to take advantage of wider than typical valuation disparities on a global basis, particularly within the U.S.
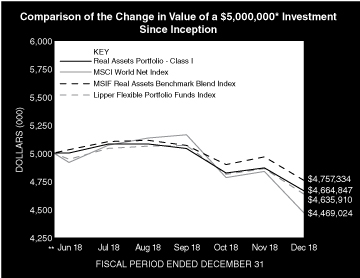
* Minimum Investment for Class I shares
** Commenced Operations on June 18, 2018.
In accordance with SEC regulations, the Fund's performance shown assumes that all recurring fees (including management fees) were deducted and all dividends and distributions were reinvested. The performance of Class A, C and IS shares will vary from the performance of Class I shares and will be negatively impacted by additional fees assessed to those classes (if applicable).
5
Morgan Stanley Institutional Fund, Inc.
Annual Report — December 31, 2018
Investment Overview (unaudited) (cont'd)
Real Assets Portfolio
Performance Compared to the MSCI World Net Index(1), the MSIF Real Assets Benchmark Blend Index(2) and the Lipper Flexible Portfolio Funds Index(3)
| | | Period Ended December 31, 2018
Total Returns(4) | |
| | | One
Year | | Five
Years | | Ten
Years | | Since
Inception(6) | |
Fund — Class I Shares
w/o sales charges(5) | | | — | | | | — | | | | — | | | | –6.70 | % | |
Fund — Class A Shares
w/o sales charges(5) | | | — | | | | — | | | | — | | | | –6.90 | | |
Fund — Class A Shares with
maximum 5.25% sales charges(5) | | | — | | | | — | | | | — | | | | –11.76 | | |
Fund — Class C Shares
w/o sales charges(5) | | | — | | | | — | | | | — | | | | –7.27 | | |
Fund — Class C Shares with
maximum 1.00% deferred
sales charges(5) | | | — | | | | — | | | | — | | | | –8.18 | | |
Fund — Class IS Shares
w/o sales charges(5) | | | — | | | | — | | | | — | | | | –6.69 | | |
MSCI World Net Index | | | — | | | | — | | | | — | | | | –10.62 | | |
MSIF Real Assets Benchmark
Blend Index | | | — | | | | — | | | | — | | | | –4.85 | | |
Lipper Flexible Portfolio Funds Index | | | — | | | | — | | | | — | | | | –7.28 | | |
Performance data quoted represents past performance, which is no guarantee of future results, and current performance may be lower or higher than the figures shown. Performance assumes that all dividends and distributions, if any, were reinvested. For the most recent month-end performance figures, please visit www.morganstanley.com/im/shareholderreports. Investment return and principal value will fluctuate so that Fund shares, when redeemed, may be worth more or less than their original cost. Returns for periods less than one year are not annualized. Total returns do not reflect the deduction of taxes that a shareholder would pay on Fund distributions or the redemption of Fund shares. Performance of share classes will vary due to difference in sales charges and expenses.
(1) The MSCI World Net Index is a free float-adjusted market capitalization weighted index designed to measure the equity market performance of developed markets. The term "free float" represents the portion of shares outstanding that are deemed to be available for purchase in the public equity markets by investors. The MSCI World Net Index currently consists of 23 developed market country indices. The performance of the Index is listed in US dollars and assumes reinvestment of net dividends. Net total return indices reinvest dividends after the deduction of withholding taxes, using (for international indices) a tax rate applicable to non-resident institutional investors who do not benefit from double taxation treaties. The Index is unmanaged and its returns do not include any sales charges or fees. Such costs would lower performance. It is not possible to invest directly in an index.
(2) The MSIF Real Assets Benchmark Blend Index is comprised of 25% MSCI World Net Index (benchmark that measures the equity market performance of developed markets), 25% Dow Jones Brookfield Global Infrastructure IndexSM (benchmark that measures the stock performance of companies that exhibit strong infrastructure characteristics), 25% FTSE EPRA Nareit Developed Real Estate Net Total Return Index (a global market capitalization weighted index composed of listed real estate securities in the North American, European and Asian real estate markets) and 25% Bloomberg Barclays Global Inflation-Linked Hedged USD Index (measures the performance of investment-grade, government
inflation linked debt from 12 different developed market countries. Investability is a key criterion for inclusion of markets in this index, and it is designed to include only those markets in which a global government linker fund is likely and able to invest). The Index is unmanaged and its returns do not include any sales charges or fees. Such costs would lower performance. It is not possible to invest directly in an index.
(3) The Lipper Flexible Portfolio Funds Index is an equally weighted performance index of the largest qualifying funds (based on net assets) in the Lipper Flexible Portfolio Funds classification. The Index, which is adjusted for capital gains distributions and income dividends, is unmanaged and should not be considered an investment. There are currently 30 funds represented in this Index. As of the date of this report, the Fund is in the Lipper Flexible Portfolio Funds classification.
(4) Total returns for the Fund reflect fees waived and expenses reimbursed, if applicable, by Morgan Stanley Investment Management Inc. (the "Adviser"). Without such waivers and reimbursements, total returns would have been lower.
(5) Commenced operations on June 18, 2018.
(6) For comparative purposes, average annual since inception returns listed for the Indexes refer to the inception date of the Fund, not the inception of the Index.
6
Morgan Stanley Institutional Fund, Inc.
Annual Report — December 31, 2018
Portfolio of Investments
Real Assets Portfolio
| | | Shares | | Value
(000) | |
Common Stocks (69.1%) | |
Australia (2.8%) | |
APA Group | | | 2,347 | | | $ | 14 | | |
Atlas Arteria Ltd. | | | 5,781 | | | | 26 | | |
BHP Group Ltd. | | | 985 | | | | 24 | | |
Coles Group Ltd. (a) | | | 898 | | | | 7 | | |
GPT Group (The) REIT | | | 2,144 | | | | 8 | | |
Origin Energy Ltd. (a) | | | 2,284 | | | | 10 | | |
Scentre Group REIT | | | 5,970 | | | | 16 | | |
Spark Infrastructure Group | | | 10,882 | | | | 17 | | |
Sydney Airport | | | 7,327 | | | | 35 | | |
Transurban Group | | | 8,864 | | | | 73 | | |
Wesfarmers Ltd. | | | 898 | | | | 20 | | |
| | | | 250 | | |
Austria (0.2%) | |
voestalpine AG | | | 580 | | | | 17 | | |
Belgium (0.2%) | |
Ageas | | | 459 | | | | 21 | | |
Canada (5.2%) | |
Bank of Nova Scotia (The) | | | 507 | | | | 25 | | |
Enbridge, Inc. | | | 4,962 | | | | 154 | | |
Finning International, Inc. | | | 754 | | | | 13 | | |
Hydro One Ltd. | | | 5,691 | | | | 84 | | |
National Bank of Canada | | | 724 | | | | 30 | | |
Pembina Pipeline Corp. | | | 1,594 | | | | 47 | | |
RioCan Real Estate Investment Trust REIT | | | 338 | | | | 6 | | |
Royal Bank of Canada | | | 346 | | | | 24 | | |
Toronto-Dominion Bank (The) | | | 420 | | | | 21 | | |
TransCanada Corp. | | | 1,874 | | | | 67 | | |
| | | | 471 | | |
China (0.4%) | |
China Gas Holdings Ltd. (b) | | | 1,664 | | | | 6 | | |
China Overseas Land & Investment Ltd. (b) | | | 4,074 | | | | 14 | | |
ENN Energy Holdings Ltd. (b) | | | 2,352 | | | | 21 | | |
| | | | 41 | | |
Denmark (0.5%) | |
Carlsberg A/S Series B | | | 409 | | | | 44 | | |
Finland (0.3%) | |
Citycon Oyj | | | 3,056 | | | | 6 | | |
Nokian Renkaat Oyj | | | 752 | | | | 23 | | |
| | | | 29 | | |
France (3.8%) | |
Aeroports de Paris (ADP) | | | 90 | | | | 17 | | |
CNP Assurances | | | 764 | | | | 16 | | |
Credit Agricole SA | | | 1,471 | | | | 16 | | |
Eurofins Scientific | | | 34 | | | | 13 | | |
Gecina SA REIT | | | 142 | | | | 18 | | |
Getlink SE | | | 3,533 | | | | 47 | | |
ICADE REIT | | | 55 | | | | 4 | | |
Klepierre SA REIT | | | 2,614 | | | | 80 | | |
| | | Shares | | Value
(000) | |
SEB SA | | | 122 | | | $ | 16 | | |
Unibail-Rodamco-Westfield REIT | | | 173 | | | | 27 | | |
Vinci SA | | | 1,103 | | | | 91 | | |
| | | | 345 | | |
Germany (0.7%) | |
BASF SE | | | 466 | | | | 32 | | |
Fraport AG Frankfurt Airport Services Worldwide | | | 80 | | | | 6 | | |
Volkswagen AG (Preference) | | | 158 | | | | 25 | | |
| | | | 63 | | |
Hong Kong (5.0%) | |
China Everbright International Ltd. | | | 8,943 | | | | 8 | | |
CK Asset Holdings Ltd. | | | 785 | | | | 6 | | |
Galaxy Entertainment Group Ltd. | | | 2,922 | | | | 18 | | |
Hongkong Land Holdings Ltd. | | | 21,895 | | | | 138 | | |
Hysan Development Co., Ltd. | | | 5,494 | | | | 26 | | |
Link REIT | | | 1,962 | | | | 20 | | |
New World Development Co., Ltd. | | | 7,064 | | | | 9 | | |
Sun Hung Kai Properties Ltd. | | | 10,494 | | | | 149 | | |
Swire Properties Ltd. | | | 20,651 | | | | 72 | | |
Wharf Real Estate Investment Co., Ltd. | | | 1,661 | | | | 10 | | |
| | | | 456 | | |
India (0.3%) | |
Azure Power Global Ltd. (a) | | | 2,667 | | | | 24 | | |
Ireland (0.1%) | |
Green REIT PLC | | | 6,231 | | | | 10 | | |
Italy (0.5%) | |
Atlantia SpA | | | 802 | | | | 16 | | |
Italgas SpA | | | 2,250 | | | | 13 | | |
Snam SpA | | | 3,156 | | | | 14 | | |
| | | | 43 | | |
Japan (3.1%) | |
GLP J-REIT | | | 4 | | | | 4 | | |
Hikari Tsushin, Inc. | | | 92 | | | | 14 | | |
ITOCHU Corp. | | | 1,429 | | | | 24 | | |
Japan Tobacco, Inc. | | | 806 | | | | 19 | | |
JXTG Holdings, Inc. | | | 3,088 | | | | 16 | | |
Mitsubishi Corp. | | | 1,007 | | | | 28 | | |
Mitsubishi Estate Co., Ltd. | | | 2,421 | | | | 38 | | |
Mitsui & Co., Ltd. | | | 1,101 | | | | 17 | | |
Mitsui Fudosan Co., Ltd. | | | 1,333 | | | | 30 | | |
Nippon Building Fund, Inc. REIT | | | 2 | | | | 13 | | |
Panasonic Corp. | | | 1,315 | | | | 12 | | |
Shiseido Co., Ltd. | | | 205 | | | | 13 | | |
Sumitomo Corp. | | | 1,379 | | | | 19 | | |
Sumitomo Mitsui Financial Group, Inc. | | | 1,028 | | | | 34 | | |
| | | | 281 | | |
Mexico (1.7%) | |
Promotora y Operadora de Infraestructura
SAB de CV | | | 15,905 | | | | 152 | | |
The accompanying notes are an integral part of the financial statements.
7
Morgan Stanley Institutional Fund, Inc.
Annual Report — December 31, 2018
Portfolio of Investments (cont'd)
Real Assets Portfolio
| | | Shares | | Value
(000) | |
Netherlands (0.8%) | |
Eurocommercial Properties N.V. CVA REIT | | | 826 | | | $ | 26 | | |
Koninklijke DSM N.V. | | | 215 | | | | 17 | | |
Koninklijke Vopak N.V. | | | 650 | | | | 29 | | |
| | | | 72 | | |
New Zealand (0.3%) | |
Auckland International Airport Ltd. | | | 5,471 | | | | 26 | | |
Norway (0.4%) | |
DNB ASA | | | 1,131 | | | | 18 | | |
Equinor ASA | | | 1,027 | | | | 22 | | |
| | | | 40 | | |
Singapore (0.0%) | |
UOL Group Ltd. | | | 458 | | | | 2 | | |
Spain (2.7%) | |
Aena SME SA | | | 106 | | | | 16 | | |
Atlantica Yield PLC | | | 6,837 | | | | 134 | | |
Ferrovial SA | | | 1,672 | | | | 34 | | |
Inmobiliaria Colonial Socimi SA REIT | | | 129 | | | | 1 | | |
Merlin Properties Socimi SA REIT | | | 1,239 | | | | 15 | | |
Red Electrica Corp., SA | | | 1,013 | | | | 23 | | |
Repsol SA | | | 1,468 | | | | 24 | | |
| | | | 247 | | |
Sweden (0.1%) | |
Hufvudstaden AB, Class A | | | 502 | | | | 8 | | |
Switzerland (0.6%) | |
Barry Callebaut AG (Registered) (Registered) | | | 9 | | | | 14 | | |
Clariant AG (Registered) (Registered) (a) | | | 724 | | | | 13 | | |
Flughafen Zurich AG (Registered) (Registered) | | | 45 | | | | 8 | | |
Sika AG (Registered) | | | 121 | | | | 15 | | |
| | | | 50 | | |
United Kingdom (6.7%) | |
British Land Co., PLC (The) REIT | | | 5,872 | | | | 40 | | |
Derwent London PLC REIT | | | 1,058 | | | | 38 | | |
Diageo PLC | | | 608 | | | | 22 | | |
GlaxoSmithKline PLC | | | 999 | | | | 19 | | |
Great Portland Estates PLC REIT | | | 6,342 | | | | 53 | | |
Hammerson PLC REIT | | | 1,319 | | | | 6 | | |
HSBC Holdings PLC | | | 2,444 | | | | 20 | | |
John Laing Group PLC | | | 17,826 | | | | 75 | | |
Land Securities Group PLC REIT | | | 6,478 | | | | 67 | | |
National Grid PLC | | | 10,897 | | | | 105 | | |
Pennon Group PLC | | | 1,843 | | | | 16 | | |
Royal Dutch Shell PLC, Class A | | | 682 | | | | 20 | | |
Severn Trent PLC | | | 1,855 | | | | 43 | | |
Standard Chartered PLC | | | 2,781 | | | | 22 | | |
United Utilities Group PLC | | | 4,907 | | | | 46 | | |
Urban & Civic PLC | | | 1,557 | | | | 5 | | |
Weir Group PLC (The) | | | 808 | | | | 13 | | |
| | | | 610 | | |
| | | Shares | | Value
(000) | |
United States (32.7%) | |
AbbVie, Inc. | | | 195 | | | $ | 18 | | |
Accenture PLC, Class A | | | 174 | | | | 25 | | |
Agilent Technologies, Inc. | | | 330 | | | | 22 | | |
Alphabet, Inc., Class C (a) | | | 43 | | | | 45 | | |
Amazon.com, Inc. (a) | | | 31 | | | | 47 | | |
American Homes 4 Rent, Class A REIT | | | 243 | | | | 5 | | |
American Tower Corp. REIT | | | 1,048 | | | | 166 | | |
American Water Works Co., Inc. | | | 567 | | | | 51 | | |
Amphenol Corp., Class A | | | 460 | | | | 37 | | |
Analog Devices, Inc. | | | 283 | | | | 24 | | |
Anthem, Inc. | | | 70 | | | | 18 | | |
Apartment Investment & Management Co., Class A REIT | | | 187 | | | | 8 | | |
Apple, Inc. | | | 300 | | | | 47 | | |
AT&T, Inc. | | | 732 | | | | 21 | | |
Atmos Energy Corp. | | | 542 | | | | 50 | | |
AvalonBay Communities, Inc. REIT | | | 228 | | | | 40 | | |
Boston Properties, Inc. REIT | | | 627 | | | | 71 | | |
Boston Scientific Corp. (a) | | | 932 | | | | 33 | | |
Brixmor Property Group, Inc. REIT | | | 2,046 | | | | 30 | | |
Brookfield Property REIT, Inc., Class A REIT | | | 123 | | | | 2 | | |
Camden Property Trust REIT | | | 120 | | | | 11 | | |
CBS Corp., Class B | | | 342 | | | | 15 | | |
Charles Schwab Corp. (The) | | | 271 | | | | 11 | | |
Charter Communications, Inc., Class A (a) | | | 58 | | | | 17 | | |
Cheniere Energy, Inc. (a) | | | 654 | | | | 39 | | |
Chevron Corp. | | | 248 | | | | 27 | | |
Cigna Corp. (a) | | | 102 | | | | 19 | | |
Columbia Property Trust, Inc. REIT | | | 126 | | | | 2 | | |
Comerica, Inc. | | | 233 | | | | 16 | | |
Consolidated Edison, Inc. | | | 589 | | | | 45 | | |
Cooper Cos., Inc. (The) | | | 103 | | | | 26 | | |
Crown Castle International Corp. REIT | | | 1,052 | | | | 114 | | |
CVS Health Corp. | | | 112 | | | | 7 | | |
Edison International | | | 853 | | | | 48 | | |
Equity Residential REIT | | | 527 | | | | 35 | | |
Essex Property Trust, Inc. REIT | | | 52 | | | | 13 | | |
Estee Lauder Cos., Inc. (The), Class A | | | 147 | | | | 19 | | |
Eversource Energy | | | 751 | | | | 49 | | |
Facebook, Inc., Class A (a) | | | 95 | | | | 12 | | |
Federal Realty Investment Trust REIT | | | 49 | | | | 6 | | |
Freeport-McMoRan, Inc. | | | 889 | | | | 9 | | |
Gilead Sciences, Inc. | | | 249 | | | | 16 | | |
Goldman Sachs Group, Inc. (The) | | | 116 | | | | 19 | | |
Halliburton Co. | | | 634 | | | | 17 | | |
Harris Corp. | | | 175 | | | | 24 | | |
HCP, Inc. REIT | | | 213 | | | | 6 | | |
Healthcare Realty Trust, Inc. REIT | | | 228 | | | | 6 | | |
Host Hotels & Resorts, Inc. REIT | | | 2,822 | | | | 47 | | |
Hudson Pacific Properties, Inc. REIT | | | 502 | | | | 15 | | |
International Business Machines Corp. | | | 315 | | | | 36 | | |
The accompanying notes are an integral part of the financial statements.
8
Morgan Stanley Institutional Fund, Inc.
Annual Report — December 31, 2018
Portfolio of Investments (cont'd)
Real Assets Portfolio
| | | Shares | | Value
(000) | |
United States (cont'd) | |
Intuit, Inc. | | | 121 | | | $ | 24 | | |
JB Hunt Transport Services, Inc. | | | 216 | | | | 20 | | |
JBG SMITH Properties REIT | | | 259 | | | | 9 | | |
Johnson & Johnson | | | 149 | | | | 19 | | |
JPMorgan Chase & Co. | | | 235 | | | | 23 | | |
Kimco Realty Corp. REIT | | | 472 | | | | 7 | | |
Kinder Morgan, Inc. | | | 4,961 | | | | 76 | | |
Lincoln National Corp. | | | 296 | | | | 15 | | |
LyondellBasell Industries N.V., Class A | | | 271 | | | | 23 | | |
Macerich Co. (The) REIT | | | 1,626 | | | | 70 | | |
Mack-Cali Realty Corp. REIT | | | 1,585 | | | | 31 | | |
Martin Marietta Materials, Inc. | | | 80 | | | | 14 | | |
Mastercard, Inc., Class A | | | 145 | | | | 27 | | |
Merck & Co., Inc. | | | 335 | | | | 26 | | |
Microsoft Corp. | | | 516 | | | | 52 | | |
Mid-America Apartment Communities, Inc. REIT | | | 47 | | | | 4 | | |
Netflix, Inc. (a) | | | 37 | | | | 10 | | |
NiSource, Inc. | | | 811 | | | | 21 | | |
Norfolk Southern Corp. | | | 126 | | | | 19 | | |
Northern Trust Corp. | | | 201 | | | | 17 | | |
NVIDIA Corp. | | | 47 | | | | 6 | | |
Paramount Group, Inc. REIT | | | 763 | | | | 10 | | |
PepsiCo, Inc. | | | 251 | | | | 28 | | |
Pfizer, Inc. | | | 920 | | | | 40 | | |
PG&E Corp. (a) | | | 1,353 | | | | 32 | | |
Phillips 66 | | | 171 | | | | 15 | | |
ProLogis, Inc. REIT | | | 173 | | | | 10 | | |
Prudential Financial, Inc. | | | 205 | | | | 17 | | |
Public Storage REIT | | | 17 | | | | 3 | | |
QTS Realty Trust, Inc., Class A REIT | | | 110 | | | | 4 | | |
QUALCOMM, Inc. | | | 296 | | | | 17 | | |
Regency Centers Corp. REIT | | | 542 | | | | 32 | | |
RLJ Lodging Trust REIT | | | 1,364 | | | | 22 | | |
salesforce.com, Inc. (a) | | | 237 | | | | 32 | | |
SBA Communications Corp. REIT (a) | | | 211 | | | | 34 | | |
SEI Investments Co. | | | 350 | | | | 16 | | |
Sempra Energy | | | 698 | | | | 76 | | |
Simon Property Group, Inc. REIT | | | 727 | | | | 122 | | |
SL Green Realty Corp. REIT | | | 1,329 | | | | 105 | | |
Sunstone Hotel Investors, Inc. REIT | | | 132 | | | | 2 | | |
Targa Resources Corp. | | | 322 | | | | 12 | | |
Textron, Inc. | | | 346 | | | | 16 | | |
Thermo Fisher Scientific, Inc. | | | 105 | | | | 23 | | |
United Technologies Corp. | | | 63 | | | | 7 | | |
UnitedHealth Group, Inc. | | | 106 | | | | 26 | | |
Verizon Communications, Inc. | | | 578 | | | | 32 | | |
VMware, Inc., Class A | | | 89 | | | | 12 | | |
Vornado Realty Trust REIT | | | 1,345 | | | | 83 | | |
Walt Disney Co. (The) | | | 234 | | | | 26 | | |
Westlake Chemical Corp. | | | 206 | | | | 14 | | |
| | | Shares | | Value
(000) | |
Williams Cos., Inc. (The) | | | 2,317 | | | $ | 51 | | |
Xylem, Inc. | | | 263 | | | | 18 | | |
Yum! Brands, Inc. | | | 258 | | | | 24 | | |
| | | | 2,960 | | |
Total Common Stocks (Cost $6,927) | | | 6,262 | | |
| | | No. of
Rights | | | |
Rights (0.0%) | |
Spain (0.0%) | |
| Repsol SA, expires 1/14/19 (a) (Cost $1) | | | 1,468 | | | | 1 | | |
| | | Face
Amount
(000) | | | |
Sovereign (16.3%) | |
Australia (0.4%) | |
Australia Government Bond, | |
0.75%, 11/21/27 | | AUD | 55 | | | | 40 | | |
Canada (0.4%) | |
Canadian Government Real Return Bond, | |
1.25%, 12/1/47 | | CAD | 20 | | | | 16 | | |
3.00%, 12/1/36 | | | 23 | | | | 24 | | |
| | | | 40 | | |
France (2.4%) | |
French Republic Government Bond OAT, | |
0.10%, 7/25/47 (c) | | EUR | 11 | | | | 14 | | |
1.10%, 7/25/22 | | | 68 | | | | 84 | | |
1.85%, 7/25/27 | | | 39 | | | | 54 | | |
2.25%, 7/25/20 | | | 11 | | | | 14 | | |
3.15%, 7/25/32 | | | 33 | | | | 57 | | |
| | | | 223 | | |
Germany (0.8%) | |
Deutsche Bundesrepublik Inflation Linked Bond, | |
0.10%, 4/15/26 — 4/15/46 | | | 54 | | | | 69 | | |
Italy (1.7%) | |
Italy Buoni Poliennali Del Tesoro, | |
0.10%, 5/15/22 (c) | | | 67 | | | | 75 | | |
1.30%, 5/15/28 (c) | | | 55 | | | | 60 | | |
2.55%, 9/15/41 (c) | | | 14 | | | | 17 | | |
| | | | 152 | | |
Japan (0.9%) | |
Japanese Government CPI Linked Bond, | |
0.10%, 9/10/24 | | JPY | 8,712 | | | | 81 | | |
New Zealand (0.3%) | |
New Zealand Government Inflation Linked Bond, | |
3.00%, 9/20/30 | | NZD | 32 | | | | 27 | | |
Spain (0.9%) | |
Spain Government Inflation Linked Bond, | |
0.65%, 11/30/27 (c) | | EUR | 12 | | | | 15 | | |
1.80%, 11/30/24 (c) | | | 50 | | | | 65 | | |
| | | | 80 | | |
The accompanying notes are an integral part of the financial statements.
9
Morgan Stanley Institutional Fund, Inc.
Annual Report — December 31, 2018
Portfolio of Investments (cont'd)
Real Assets Portfolio
| | | Face
Amount
(000) | | Value
(000) | |
United Kingdom (8.5%) | |
United Kingdom Gilt Inflation Linked, | |
0.13%, 11/22/36 | | GBP | 55 | | | $ | 97 | | |
0.25%, 3/22/52 | | | 43 | | | | 97 | | |
0.38%, 3/22/62 | | | 45 | | | | 119 | | |
0.63%, 11/22/42 | | | 40 | | | | 85 | | |
0.75%, 11/22/47 | | | 51 | | | | 118 | | |
1.25%, 11/22/27 — 11/22/32 | | | 97 | | | | 171 | | |
1.88%, 11/22/22 | | | 54 | | | | 80 | | |
| | | | 767 | | |
Total Sovereign (Cost $1,526) | | | 1,479 | | |
U.S. Treasury Securities (11.2%) | |
United States (11.2%) | |
U.S. Treasury Notes, | |
0.13%, 4/15/20 — 7/15/24 | | $ | 609 | | | | 590 | | |
0.38%, 1/15/27 | | | 195 | | | | 185 | | |
0.75%, 2/15/42 | | | 60 | | | | 55 | | |
1.00%, 2/15/46 | | | 78 | | | | 74 | | |
1.38%, 1/15/20 | | | 23 | | | | 23 | | |
3.88%, 4/15/29 | | | 68 | | | | 86 | | |
Total U.S. Treasury Securities (Cost $1,034) | | | 1,013 | | |
| | | Shares | | | |
Short-Term Investment (3.4%) | |
Investment Company (3.4%) | |
Morgan Stanley Institutional Liquidity
Funds — Treasury Portfolio —
Institutional Class (See Note G)
(Cost $307) | | | 307,149 | | | $ | 307 | | |
Total Investments (100.0%)
(Cost $9,795) (d)(e)(f) | | | 9,062 | | |
Liabilities in Excess of Other Assets (0.0%) (g) | | | (2 | ) | |
Net Assets (100.0%) | | $ | 9,060 | | |
Country assignments and aggregations are based generally on third party vendor classifications and information, and may be different from the assignments and aggregations under the policies set forth in the Fund's prospectus and/or statement of additional information relating to geographic classifications.
(a) Non-income producing security.
(b) Security trades on the Hong Kong exchange.
(c) 144A security — Certain conditions for public sale may exist. Unless otherwise noted, these securities are deemed to be liquid.
(d) Securities are available for collateral in connection with open foreign currency forward exchange contracts.
(e) The approximate fair value and percentage of net assets, $2,042,000 and 22.5%, respectively, represent the securities that have been fair valued under the fair valuation policy for international investments as described in Note A-1 within the Notes to Financial Statements.
(f) At December 31, 2018, the aggregate cost for federal income tax purposes is approximately $9,838,000. The aggregate gross unrealized appreciation is approximately $104,000 and the aggregate gross unrealized depreciation is approximately $888,000, resulting in net unrealized depreciation of approximately $784,000.
(g) Amount is less than 0.05%.
CVA Certificaten Van Aandelen.
OAT Obligations Assimilables du Trésor (French Treasury Obligation).
REIT Real Estate Investment Trust.
Foreign Currency Forward Exchange Contracts:
The Fund had the following foreign currency forward exchange contracts open at December 31, 2018:
Counterparty | | Contracts to
Deliver
(000) | | In Exchange
For
(000) | | Delivery
Date | | Unrealized
Appreciation
(Depreciation)
(000) | |
Australia and New Zealand Banking Group | | NZD | 36 | | | $ | 24 | | | 3/28/19 | | $ | (— | @) | |
BNP Paribas SA | | EUR | 457 | | | $ | 525 | | | 3/28/19 | | | (2 | ) | |
BNP Paribas SA | | EUR | 2 | | | $ | 2 | | | 3/28/19 | | | (— | @) | |
BNP Paribas SA | | GBP | 20 | | | $ | 26 | | | 3/28/19 | | | — | @ | |
Citibank NA | | CAD | 54 | | | $ | 40 | | | 3/28/19 | | | 1 | | |
JPMorgan Chase Bank NA | | JPY | 9,068 | | | $ | 82 | | | 3/28/19 | | | (1 | ) | |
Royal Bank of Canada | | GBP | 585 | | | $ | 742 | | | 3/28/19 | | | (6 | ) | |
UBS AG | | AUD | 55 | | | $ | 39 | | | 3/28/19 | | | — | @ | |
| | | | | | | | | $ | (8 | ) | |
The accompanying notes are an integral part of the financial statements.
10
Morgan Stanley Institutional Fund, Inc.
Annual Report — December 31, 2018
Portfolio of Investments (cont'd)
Real Assets Portfolio
@ — Amount less than $500.
AUD — Australian Dollar
CAD — Canadian Dollar
EUR — Euro
GBP — British Pound
JPY — Japanese Yen
NZD — New Zealand Dollar
Portfolio Composition
Classification | | Percentage of
Total Investments | |
Other* | | | 42.6 | % | |
Equity Real Estate Investment Trusts (REITs) | | | 17.4 | | |
Sovereign | | | 16.3 | | |
U.S. Treasury Securities | | | 11.2 | | |
Oil, Gas & Consumable Fuels | | | 6.9 | | |
Real Estate Management & Development | | | 5.6 | | |
Total Investments | | | 100.0 | %** | |
* Industries and/or investment types representing less than 5% of total investments.
** Does not include open foreign currency forward exchange contracts with net unrealized depreciation of approximately $8,000.
The accompanying notes are an integral part of the financial statements.
11
Morgan Stanley Institutional Fund, Inc.
Annual Report — December 31, 2018
Statement of Assets and Liabilities | | December 31, 2018
(000) | |
Assets: | |
Investments in Securities of Unaffiliated Issuers, at Value (Cost $9,488) | | $ | 8,755 | | |
Investment in Security of Affiliated Issuer, at Value (Cost $307) | | | 307 | | |
Total Investments in Securities, at Value (Cost $9,795) | | | 9,062 | | |
Foreign Currency, at Value (Cost $35) | | | 35 | | |
Cash | | | 2 | | |
Due from Adviser | | | 96 | | |
Prepaid Offering Costs | | | 81 | | |
Receivable for Investments Sold | | | 24 | | |
Dividends Receivable | | | 19 | | |
Interest Receivable | | | 4 | | |
Unrealized Appreciation on Foreign Currency Forward Exchange Contract | | | 1 | | |
Tax Reclaim Receivable | | | — | @ | |
Receivable from Affiliate | | | — | @ | |
Other Assets | | | 3 | | |
Total Assets | | | 9,327 | | |
Liabilities: | |
Payable for Offering Costs | | | 152 | | |
Payable for Professional Fees | | | 69 | | |
Payable for Investments Purchased | | | 20 | | |
Unrealized Depreciation on Foreign Currency Forward Exchange Contracts | | | 9 | | |
Payable for Custodian Fees | | | 8 | | |
Payable for Transfer Agency Fees — Class I | | | 1 | | |
Payable for Transfer Agency Fees — Class A | | | 1 | | |
Payable for Transfer Agency Fees — Class C | | | 1 | | |
Payable for Transfer Agency Fees — Class IS | | | 1 | | |
Payable for Administration Fees | | | 1 | | |
Payable for Shareholder Services Fees — Class A | | | — | @ | |
Payable for Distribution and Shareholder Services Fees — Class C | | | — | @ | |
Other Liabilities | | | 4 | | |
Total Liabilities | | | 267 | | |
Net Assets | | $ | 9,060 | | |
Net Assets Consist of: | |
Paid-in-Capital | | $ | 9,944 | | |
Total Accumulated Loss | | | (884 | ) | |
Net Assets | | $ | 9,060 | | |
CLASS I: | |
Net Assets | | $ | 9,033 | | |
| Shares Outstanding $0.001 par value shares of beneficial interest (unlimited shares authorized) (not in 000's) | | | 997,000 | | |
Net Asset Value, Offering and Redemption Price Per Share | | $ | 9.06 | | |
CLASS A: | |
Net Assets | | $ | 9 | | |
| Shares Outstanding $0.001 par value shares of beneficial interest (unlimited shares authorized) (not in 000's) | | | 1,000 | | |
Net Asset Value, Redemption Price Per Share | | $ | 9.06 | | |
Maximum Sales Load | | | 5.25 | % | |
Maximum Sales Charge | | $ | 0.50 | | |
Maximum Offering Price Per Share | | $ | 9.56 | | |
CLASS C: | |
Net Assets | | $ | 9 | | |
| Shares Outstanding $0.001 par value shares of beneficial interest (unlimited shares authorized) (not in 000's) | | | 1,000 | | |
Net Asset Value, Offering and Redemption Price Per Share | | $ | 9.06 | | |
CLASS IS: | |
Net Assets | | $ | 9 | | |
| Shares Outstanding $0.001 par value shares of beneficial interest (unlimited shares authorized) (not in 000's) | | | 1,000 | | |
Net Asset Value, Offering and Redemption Price Per Share | | $ | 9.06 | | |
@ Amount is less than $500.
The accompanying notes are an integral part of the financial statements.
12
Morgan Stanley Institutional Fund, Inc.
Annual Report — December 31, 2018
Statement of Operations | | Period from
June 18, 2018^ to
December 31, 2018
(000) | |
Investment Income: | |
Dividends from Securities of Unaffiliated Issuers (Net of $7 of Foreign Taxes Withheld) | | $ | 132 | | |
Interest from Securities of Unaffiliated Issuers (Net of $—@ of Foreign Taxes Withheld) | | | 25 | | |
Non-Cash Dividends from Securities of Unaffiliated Issuers | | | 13 | | |
Dividends from Security of Affiliated Issuer (Note G) | | | 3 | | |
Total Investment Income | | | 173 | | |
Expenses: | |
Offering Costs | | | 95 | | |
Professional Fees | | | 84 | | |
Advisory Fees (Note B) | | | 32 | | |
Custodian Fees (Note F) | | | 20 | | |
Shareholder Reporting Fees | | | 10 | | |
Pricing Fees | | | 5 | | |
Administration Fees (Note C) | | | 4 | | |
Transfer Agency Fees — Class I (Note E) | | | 1 | | |
Transfer Agency Fees — Class A (Note E) | | | 1 | | |
Transfer Agency Fees — Class C (Note E) | | | 1 | | |
Transfer Agency Fees — Class IS (Note E) | | | 1 | | |
Shareholder Services Fees — Class A (Note D) | | | — | @ | |
Distribution and Shareholder Services Fees — Class C (Note D) | | | — | @ | |
Directors' Fees and Expenses | | | — | @ | |
Registration Fees | | | — | @ | |
Other Expenses | | | 1 | | |
Total Expenses | | | 255 | | |
Expenses Reimbursed by Adviser (Note B) | | | (179 | ) | |
Waiver of Advisory Fees (Note B) | | | (32 | ) | |
Reimbursement of Class Specific Expenses — Class A (Note B) | | | (1 | ) | |
Reimbursement of Class Specific Expenses — Class C (Note B) | | | (1 | ) | |
Reimbursement of Class Specific Expenses — Class IS (Note B) | | | (1 | ) | |
Rebate from Morgan Stanley Affiliate (Note G) | | | (— | @) | |
Net Expenses | | | 41 | | |
Net Investment Income | | | 132 | | |
Realized Gain (Loss): | |
Investments Sold | | | (112 | ) | |
Foreign Currency Forward Exchange Contracts | | | 62 | | |
Foreign Currency Translation | | | (2 | ) | |
Net Realized Loss | | | (52 | ) | |
Change in Unrealized Appreciation (Depreciation): | |
Investments | | | (731 | ) | |
Foreign Currency Forward Exchange Contracts | | | (8 | ) | |
Foreign Currency Translation | | | — | @ | |
Net Change in Unrealized Appreciation (Depreciation) | | | (739 | ) | |
Net Realized Loss and Change in Unrealized Appreciation (Depreciation) | | | (791 | ) | |
Net Decrease in Net Assets Resulting from Operations | | $ | (659 | ) | |
^ Commencement of Operations.
@ Amount is less than $500.
The accompanying notes are an integral part of the financial statements.
13
Morgan Stanley Institutional Fund, Inc.
Annual Report — December 31, 2018
Statement of Changes in Net Assets | | Period from
June 18, 2018^ to
December 31, 2018
(000) | |
Increase (Decrease) in Net Assets: | |
Operations: | |
Net Investment Income | | $ | 132 | | |
Net Realized Loss | | | (52 | ) | |
Net Change in Unrealized Appreciation (Depreciation) | | | (739 | ) | |
Net Decrease in Net Assets Resulting from Operations | | | (659 | ) | |
Dividends and Distributions to Shareholders: | |
Class I | | | (225 | ) | |
Class A | | | (— | @) | |
Class C | | | (— | @) | |
Class IS | | | (— | @) | |
| Paid-in-Capital | |
Class I | | | (56 | ) | |
Class A | | | (— | @) | |
Class C | | | (— | @) | |
Class IS | | | (— | @) | |
Total Dividends and Distributions to Shareholders | | | (281 | ) | |
Capital Share Transactions:(1) | |
Class I: | |
Subscribed | | | 9,970 | | |
Class A: | |
Subscribed | | | 10 | | |
Class C: | |
Subscribed | | | 10 | | |
Class IS: | |
Subscribed | | | 10 | | |
Net Increase in Net Assets Resulting from Capital Share Transactions | | | 10,000 | | |
Total Increase in Net Assets | | | 9,060 | | |
Net Assets: | |
Beginning of Period | | | — | | |
End of Period | | $ | 9,060 | | |
(1) Capital Share Transactions: | |
Class I: | |
Shares Subscribed | | | 997 | | |
Class A: | |
Shares Subscribed | | | 1 | | |
Class C: | |
Shares Subscribed | | | 1 | | |
Class IS: | |
Shares Subscribed | | | 1 | | |
^ Commencement of Operations.
@ Amount is less than $500.
The accompanying notes are an integral part of the financial statements.
14
Morgan Stanley Institutional Fund, Inc.
Annual Report — December 31, 2018
Financial Highlights
Real Assets Portfolio
| | | Class I | |
Selected Per Share Data and Ratios | | Period from
June 18, 2018(1) to
December 31, 2018 | |
Net Asset Value, Beginning of Period | | $ | 10.00 | | |
Income (Loss) from Investment Operations: | |
Net Investment Income(2) | | | 0.13 | | |
Net Realized and Unrealized Loss | | | (0.79 | ) | |
Total from Investment Operations | | | (0.66 | ) | |
Distributions from and/or in Excess of: | |
Net Investment Income | | | (0.22 | ) | |
Paid-in-Capital | | | (0.06 | ) | |
Total Distributions | | | (0.28 | ) | |
Net Asset Value, End of Period | | $ | 9.06 | | |
Total Return(3) | | | (6.70 | )%(5) | |
Ratios and Supplemental Data: | |
Net Assets, End of Period (Thousands) | | $ | 9,033 | | |
Ratio of Expenses to Average Net Assets(7) | | | 0.76 | (4)(6) | |
Ratio of Net Investment Income to Average Net Assets(7) | | | 2.52 | (4)(6) | |
Ratio of Rebate from Morgan Stanley Affiliates to Average Net Assets | | | 0.01 | %(6) | |
Portfolio Turnover Rate | | | 26 | %(5) | |
(7) Supplemental Information on the Ratios to Average Net Assets: | |
Ratios Before Expense Limitation: | |
Expenses to Average Net Assets | | | 4.76 | %(6) | |
Net Investment Loss to Average Net Assets | | | (1.48 | )%(6) | |
(1) Commencement of Operations.
(2) Per share amount is based on average shares outstanding.
(3) Calculated based on the net asset value as of the last business day of the period.
(4) The Ratios of Expenses and Net Investment Income reflect the rebate of certain Fund expenses in connection with the investments in Morgan Stanley affiliates during the period. The effect of the rebate on the ratios is disclosed in the above table as "Ratio of Rebate from Morgan Stanley Affiliates to Average Net Assets."
(5) Not annualized.
(6) Annualized.
The accompanying notes are an integral part of the financial statements.
15
Morgan Stanley Institutional Fund, Inc.
Annual Report — December 31, 2018
Financial Highlights
Real Assets Portfolio
| | | Class A | |
Selected Per Share Data and Ratios | | Period from
June 18, 2018(1) to
December 31, 2018 | |
Net Asset Value, Beginning of Period | | $ | 10.00 | | |
Income (Loss) from Investment Operations: | |
Net Investment Income(2) | | | 0.11 | | |
Net Realized and Unrealized Loss | | | (0.79 | ) | |
Total from Investment Operations | | | (0.68 | ) | |
Distributions from and/or in Excess of: | |
Net Investment Income | | | (0.20 | ) | |
Paid-in-Capital | | | (0.06 | ) | |
Total Distributions | | | (0.26 | ) | |
Net Asset Value, End of Period | | $ | 9.06 | | |
Total Return(3) | | | (6.90 | )%(5) | |
Ratios and Supplemental Data: | |
Net Assets, End of Period (Thousands) | | $ | 9 | | |
Ratio of Expenses to Average Net Assets(7) | | | 1.14 | %(4)(6) | |
Ratio of Net Investment Income to Average Net Assets(7) | | | 2.18 | %(4)(6) | |
Ratio of Rebate from Morgan Stanley Affiliates to Average Net Assets | | | 0.01 | %(6) | |
Portfolio Turnover Rate | | | 26 | %(5) | |
(7) Supplemental Information on the Ratios to Average Net Assets: | |
Ratios Before Expense Limitation: | |
Expenses to Average Net Assets | | | 22.79 | %(6) | |
Net Investment Loss to Average Net Assets | | | (19.47 | )%(6) | |
(1) Commencement of Operations.
(2) Per share amount is based on average shares outstanding.
(3) Calculated based on the net asset value which does not reflect sales charges, if applicable, as of the last business day of the period.
(4) The Ratios of Expenses and Net Investment Income reflect the rebate of certain Fund expenses in connection with the investments in Morgan Stanley affiliates during the period. The effect of the rebate on the ratios is disclosed in the above table as "Ratio of Rebate from Morgan Stanley Affiliates to Average Net Assets."
(5) Not annualized.
(6) Annualized.
The accompanying notes are an integral part of the financial statements.
16
Morgan Stanley Institutional Fund, Inc.
Annual Report — December 31, 2018
Financial Highlights
Real Assets Portfolio
| | | Class C | |
Selected Per Share Data and Ratios | | Period from
June 18, 2018(1) to
December 31, 2018 | |
Net Asset Value, Beginning of Period | | $ | 10.00 | | |
Income (Loss) from Investment Operations: | |
Net Investment Income(2) | | | 0.07 | | |
Net Realized and Unrealized Loss | | | (0.79 | ) | |
Total from Investment Operations | | | (0.72 | ) | |
Distributions from and/or in Excess of: | |
Net Investment Income | | | (0.16 | ) | |
Paid-in-Capital | | | (0.06 | ) | |
Total Distributions | | | (0.22 | ) | |
Net Asset Value, End of Period | | $ | 9.06 | | |
Total Return(3) | | | (7.27 | )%(5) | |
Ratios and Supplemental Data: | |
Net Assets, End of Period (Thousands) | | $ | 9 | | |
Ratio of Expenses to Average Net Assets(7) | | | 1.89 | %(4)(6) | |
Ratio of Net Investment Income to Average Net Assets(7) | | | 1.37 | %(4)(6) | |
Ratio of Rebate from Morgan Stanley Affiliates to Average Net Assets | | | 0.01 | %(6) | |
Portfolio Turnover Rate | | | 26 | %(5) | |
(7) Supplemental Information on the Ratios to Average Net Assets: | |
Ratios Before Expense Limitation: | |
Expenses to Average Net Assets | | | 23.55 | %(6) | |
Net Investment Loss to Average Net Assets | | | (20.29 | )%(6) | |
(1) Commencement of Operations.
(2) Per share amount is based on average shares outstanding.
(3) Calculated based on the net asset value which does not reflect sales charges, if applicable, as of the last business day of the period.
(4) The Ratios of Expenses and Net Investment Income reflect the rebate of certain Fund expenses in connection with the investments in Morgan Stanley affiliates during the period. The effect of the rebate on the ratios is disclosed in the above table as "Ratio of Rebate from Morgan Stanley Affiliates to Average Net Assets."
(5) Not annualized.
(6) Annualized.
The accompanying notes are an integral part of the financial statements.
17
Morgan Stanley Institutional Fund, Inc.
Annual Report — December 31, 2018
Financial Highlights
Real Assets Portfolio
| | | Class IS | |
Selected Per Share Data and Ratios | | Period from
June 18, 2018(1) to
December 31, 2018 | |
Net Asset Value, Beginning of Period | | $ | 10.00 | | |
Income (Loss) from Investment Operations: | |
Net Investment Income(2) | | | 0.13 | | |
Net Realized and Unrealized Loss | | | (0.79 | ) | |
Total from Investment Operations | | | (0.66 | ) | |
Distributions from and/or in Excess of: | |
Net Investment Income | | | (0.22 | ) | |
Paid-in-Capital | | | (0.06 | ) | |
Total Distributions | | | (0.28 | ) | |
Net Asset Value, End of Period | | $ | 9.06 | | |
Total Return(3) | | | (6.69 | )%(5) | |
Ratios and Supplemental Data: | |
Net Assets, End of Period (Thousands) | | $ | 9 | | |
Ratio of Expenses to Average Net Assets(7) | | | 0.74 | %(4)(6) | |
Ratio of Net Investment Income to Average Net Assets(7) | | | 2.53 | %(4)(6) | |
Ratio of Rebate from Morgan Stanley Affiliates to Average Net Assets | | | 0.01 | %(6) | |
Portfolio Turnover Rate | | | 26 | %(5) | |
(7) Supplemental Information on the Ratios to Average Net Assets: | |
Ratios Before Expense Limitation: | |
Expenses to Average Net Assets | | | 22.53 | %(6) | |
Net Investment Loss to Average Net Assets | | | (19.26 | )%(6) | |
(1) Commencement of Operations.
(2) Per share amount is based on average shares outstanding.
(3) Calculated based on the net asset value as of the last business day of the period.
(4) The Ratios of Expenses and Net Investment Income reflect the rebate of certain Fund expenses in connection with the investments in Morgan Stanley affiliates during the period. The effect of the rebate on the ratios is disclosed in the above table as "Ratio of Rebate from Morgan Stanley Affiliates to Average Net Assets."
(5) Not annualized.
(6) Annualized.
The accompanying notes are an integral part of the financial statements.
18
Morgan Stanley Institutional Fund, Inc.
Annual Report — December 31, 2018
Notes to Financial Statements
Morgan Stanley Institutional Fund, Inc. (the "Company") is registered under the Investment Company Act of 1940, as amended (the "Act"), as an open-end management investment company. The Company is comprised of thirty separate, active, diversified and non-diversified funds (individually referred to as a "Fund", collectively as the "Funds"). The Company applies investment company accounting and reporting guidance.
The accompanying financial statements relate to the Real Assets Portfolio. The Fund seeks total return, targeted to be in excess of inflatio, through capital appreciation and current income.
The Fund commenced operations on June 18, 2018 and offers four classes of shares — Class I, Class A, Class C and Class IS.
A. Significant Accounting Policies: The following significant accounting policies are in conformity with U.S. generally accepted accounting principles ("GAAP"). Such policies are consistently followed by the Company in the preparation of its financial statements. GAAP may require management to make estimates and assumptions that affect the reported amounts and disclosures in the financial statements. Actual results may differ from those estimates.
In August 2018, the Financial Accounting Standards Board ("FASB") issued Accounting Standards Update ("ASU") 2018-13, Fair Value Measurement (Topic 820) — Disclosures Framework — Changes to Disclosure Requirements of Fair Value Measurement ("ASU 2018-13") which introduces new fair value disclosure requirements as well as eliminates and modifies certain existing fair value disclosure requirements. ASU 2018-13 would be effective for fiscal years beginning after December 15, 2019 and for interim periods within those fiscal years; however, management has elected to early adopt ASU 2018-13 effective with the current reporting period as permitted by the standard. The impact of the Fund's adoption was limited to changes in the Fund's financial statement disclosures regarding fair value, primarily those disclosures related to transfers between levels of the fair value hierarchy and disclosure of the range and weighted average used to develop significant unobservable inputs for Level 3 fair value measurements, when applicable.
1. Security Valuation: (1) An equity portfolio security listed or traded on an exchange is valued at its latest reported sales price (or at the exchange official closing price if such exchange reports an official closing price), and if there were no sales on a given day and if there is no official exchange closing price for that day, the security is valued
at the mean between the last reported bid and asked prices if such bid and asked prices are available on the relevant exchanges. Listed equity securities not traded on the valuation date with no reported bid and asked prices available on the exchange are valued at the mean between the current bid and asked prices obtained from one or more reputable brokers or dealers. In cases where a security is traded on more than one exchange, the security is valued on the exchange designated as the primary market; (2) all other equity portfolio securities for which over-the-counter ("OTC") market quotations are readily available are valued at the latest reported sales price (or at the market official closing price if such market reports an official closing price), and if there was no trading in the security on a given day and if there is no official closing price from relevant markets for that day, the security is valued at the mean between the last reported bid and asked prices if such bid and asked prices are available on the relevant markets. An unlisted equity security that does not trade on the valuation date and for which bid and asked prices from the relevant markets are unavailable is valued at the mean between the current bid and asked prices obtained from one or more reputable brokers or dealers; (3) certain portfolio securities may be valued by an outside pricing service/vendor approved by the Company's Board of Directors (the "Directors"). The pricing service/vendor may employ a pricing model that takes into account, among other things, bids, yield spreads and/or other market data and specific security characteristics. Alternatively, if a valuation is not available from an outside pricing service/vendor, and the security trades on an exchange, the security may be valued at its latest reported sale price (or at the exchange official closing price if such exchange reports an official closing price), prior to the time when assets are valued. If there are no sales on a given day and if there is no official exchange closing price for that day, the security is valued at the mean between the last reported bid and asked prices if such bid and asked prices are available in the relevant exchanges; (4) when market quotations are not readily available, including circumstances under which Morgan Stanley Investment Management Inc. (the "Adviser") or Morgan Stanley Investment Management Limited ("MSIM Limited") and Morgan Stanley Investment Management Company ("MSIM Company") (together, the "Sub-Advisers"), each a wholly-owned subsidiary of Morgan Stanley, determine that the closing price, last sale price or the mean between the last reported bid and asked
19
Morgan Stanley Institutional Fund, Inc.
Annual Report — December 31, 2018
Notes to Financial Statements (cont'd)
prices are not reflective of a security's market value, portfolio securities are valued at their fair value as determined in good faith under procedures established by and under the general supervision of the Directors. Occasionally, developments affecting the closing prices of securities and other assets may occur between the times at which valuations of such securities are determined (that is, close of the foreign market on which the securities trade) and the close of business of the New York Stock Exchange ("NYSE"). If developments occur during such periods that are expected to materially affect the value of such securities, such valuations may be adjusted to reflect the estimated fair value of such securities as of the close of the NYSE, as determined in good faith by the Directors or by the Adviser using a pricing service and/or procedures approved by the Directors; (5) quotations of foreign portfolio securities, other assets and liabilities and forward contracts stated in foreign currency are translated into U.S. dollar equivalents at the prevailing market rates prior to the close of the NYSE; and (6) investments in mutual funds, including the Morgan Stanley Institutional Liquidity Funds, are valued at the net asset value ("NAV") as of the close of each business day.
The Directors have responsibility for determining in good faith the fair value of the investments, and the Directors may appoint others, such as the Company's Adviser or a valuation committee, to assist the Directors in determining fair value and to make the actual calculations pursuant to the fair valuation methodologies previously approved by the Directors. Under procedures approved by the Directors, the Company's Adviser has formed a Valuation Committee whose members are approved by the Directors. The Valuation Committee provides administration and oversight of the Company's valuation policies and procedures, which are reviewed at least annually by the Directors. These procedures allow the Company to utilize independent pricing services, quotations from securities and financial instrument dealers and other market sources to determine fair value.
The Fund invests a significant portion of its assets in securities of real estate investment trusts ("REITs"). The market's perception of prospective declines in private real estate values and other financial assets may result in increased volatility of market prices that can negatively impact the valuation of certain issuers held by the Fund.
2. Fair Value Measurement: FASB Accounting Standards CodificationTM ("ASC") 820, "Fair Value
Measurement" ("ASC 820"), defines fair value as the value that the Fund would receive to sell an investment or pay to transfer a liability in a timely transaction with an independent buyer in the principal market, or in the absence of a principal market, the most advantageous market for the investment or liability. ASC 820 establishes a three-tier hierarchy to distinguish between (1) inputs that reflect the assumptions market participants would use in valuing an asset or liability developed based on market data obtained from sources independent of the reporting entity (observable inputs) and (2) inputs that reflect the reporting entity's own assumptions about the assumptions market participants would use in valuing an asset or liability developed based on the best information available in the circumstances (unobservable inputs) and to establish classification of fair value measurements for disclosure purposes. Various inputs are used in determining the value of the Fund's investments. The inputs are summarized in the three broad levels listed below:
• Level 1 – unadjusted quoted prices in active markets for identical investments
• Level 2 – other significant observable inputs (including quoted prices for similar investments, interest rates, prepayment speeds, credit risk, etc.)
• Level 3 – significant unobservable inputs including the Fund's own assumptions in determining the fair value of investments. Factors considered in making this determination may include, but are not limited to, information obtained by contacting the issuer, analysts, or the appropriate stock exchange (for exchange-traded securities), analysis of the issuer's financial statements or other available documents and, if necessary, available information concerning other securities in similar circumstances
The inputs or methodology used for valuing securities are not necessarily an indication of the risk associated with investing in those securities and the determination of the significance of a particular input to the fair value measurement in its entirety requires judgment and considers factors specific to each security.
20
Morgan Stanley Institutional Fund, Inc.
Annual Report — December 31, 2018
Notes to Financial Statements (cont'd)
The following is a summary of the inputs used to value the Fund's investments as of December 31, 2018:
Investment Type | | Level 1
Unadjusted
quoted
prices
(000) | | Level 2
Other
significant
observable
inputs
(000) | | Level 3
Significant
unobservable
inputs
(000) | | Total
(000) | |
Assets: | |
Common Stocks | |
Aerospace & Defense | | $ | 47 | | | $ | — | | | $ | — | | | $ | 47 | | |
Auto Components | | | — | | | | 23 | | | | — | | | | 23 | | |
Automobiles | | | — | | | | 25 | | | | — | | | | 25 | | |
Banks | | | 139 | | | | 110 | | | | — | | | | 249 | | |
Beverages | | | 28 | | | | 66 | | | | — | | | | 94 | | |
Biotechnology | | | 34 | | | | — | | | | — | | | | 34 | | |
Capital Markets | | | 63 | | | | — | | | | — | | | | 63 | | |
Chemicals | | | 37 | | | | 77 | | | | — | | | | 114 | | |
Commercial Services &
Supplies | | | — | | | | 8 | | | | — | | | | 8 | | |
Construction & Engineering | | | — | | | | 200 | | | | — | | | | 200 | | |
Construction Materials | | | 14 | | | | — | | | | — | | | | 14 | | |
Diversified
Telecommunication
Services | | | 53 | | | | — | | | | — | | | | 53 | | |
Electric Utilities | | | 213 | | | | 40 | | | | — | | | | 253 | | |
Electronic Equipment,
Instruments &
Components | | | 37 | | | | — | | | | — | | | | 37 | | |
Energy Equipment &
Services | | | 17 | | | | — | | | | — | | | | 17 | | |
Entertainment | | | 36 | | | | — | | | | — | | | | 36 | | |
Equity Real Estate
Investment
Trusts (REITs) | | | 1,131 | | | | 446 | | | | — | | | | 1,577 | | |
Food & Staples Retailing | | | 7 | | | | — | | | | — | | | | 7 | | |
Food Products | | | — | | | | 14 | | | | — | | | | 14 | | |
Gas Utilities | | | 50 | | | | 54 | | | | — | | | | 104 | | |
Health Care Equipment &
Supplies | | | 59 | | | | — | | | | — | | | | 59 | | |
Health Care Providers &
Services | | | 70 | | | | — | | | | — | | | | 70 | | |
Hotels, Restaurants &
Leisure | | | 24 | | | | 18 | | | | — | | | | 42 | | |
Household Durables | | | — | | | | 28 | | | | — | | | | 28 | | |
Independent Power &
Renewable Electricity
Producers | | | 158 | | | | — | | | | — | | | | 158 | | |
Information Technology
Services | | | 88 | | | | — | | | | — | | | | 88 | | |
Insurance | | | 32 | | | | 37 | | | �� | — | | | | 69 | | |
Interactive Media &
Services | | | 57 | | | | — | | | | — | | | | 57 | | |
Internet &
Direct Marketing Retail | | | 47 | | | | — | | | | — | | | | 47 | | |
Life Sciences Tools &
Services | | | 45 | | | | 13 | | | | — | | | | 58 | | |
Machinery | | | 18 | | | | 13 | | | | — | | | | 31 | | |
Media | | | 32 | | | | — | | | | — | | | | 32 | | |
Metals & Mining | | | 9 | | | | 41 | | | | — | | | | 50 | | |
Multi-Line Retail | | | — | | | | 20 | | | | — | | | | 20 | | |
Multi-Utilities | | | 142 | | | | 105 | | | | — | | | | 247 | | |
Oil, Gas &
Consumable Fuels | | | 488 | | | | 135 | | | | — | | | | 623 | | |
Personal Products | | | 19 | | | | 13 | | | | — | | | | 32 | | |
Pharmaceuticals | | | 85 | | | | 19 | | | | — | | | | 104 | | |
Investment Type | | Level 1
Unadjusted
quoted
prices
(000) | | Level 2
Other
significant
observable
inputs
(000) | | Level 3
Significant
unobservable
inputs
(000) | | Total
(000) | |
Common Stocks (cont'd) | |
Real Estate Management &
Development | | $ | — | | | $ | 513 | | | $ | — | | | $ | 513 | | |
Road & Rail | | | 39 | | | | — | | | | — | | | | 39 | | |
Semiconductors &
Semiconductor
Equipment | | | 47 | | | | — | | | | — | | | | 47 | | |
Software | | | 120 | | | | — | | | | — | | | | 120 | | |
Specialty Retail | | | — | | | | 14 | | | | — | | | | 14 | | |
Tech Hardware, Storage &
Peripherals | | | 47 | | | | — | | | | — | | | | 47 | | |
Tobacco | | | — | | | | 19 | | | | — | | | | 19 | | |
Trading Companies &
Distributors | | | 13 | | | | 88 | | | | — | | | | 101 | | |
Transportation
Infrastructure | | | 152 | | | | 270 | | | | — | | | | 422 | | |
Water Utilities | | | 51 | | | | 105 | | | | — | | | | 156 | | |
Total Common Stocks | | | 3,748 | | | | 2,514 | | | | — | | | | 6,262 | | |
Rights | | | 1 | | | | — | | | | — | | | | 1 | | |
Sovereign | | | — | | | | 1,479 | | | | — | | | | 1,479 | | |
U.S. Treasury Securities | | | — | | | | 1,013 | | | | — | | | | 1,013 | | |
Short-Term Investment | |
Investment Company | | | 307 | | | | — | | | | — | | | | 307 | | |
Foreign Currency Forward
Exchange Contract | | | | | | | 1 | | | | | | | | 1 | | |
Total Assets | | | 4,056 | | | | 5,007 | | | | — | | | | 9,063 | | |
Liabilities: | |
Foreign Currency Forward
Exchange Contracts | | | — | | | | (9 | ) | | | — | | | | (9 | ) | |
Total | | $ | 4,056 | | | $ | 4,998 | | | $ | — | | | $ | 9,054 | | |
Transfers between investment levels may occur as the markets fluctuate and/or the availability of data used in an investment's valuation changes.
3. Foreign Currency Translation and Foreign Investments: The books and records of the Fund are maintained in U.S. dollars. Foreign currency amounts are translated into U.S. dollars as follows:
– investments, other assets and liabilities at the prevailing rate of exchange on the valuation date;
– investment transactions and investment income at the prevailing rates of exchange on the dates of such transactions.
Although the net assets of the Fund are presented at the foreign exchange rates and market values at the close of the period, the Fund does not isolate that portion of the results of operations arising as a result of changes in the foreign exchange rates from the fluctuations arising from changes in the market prices of securities held at period end. Similarly, the Fund does not isolate the
21
Morgan Stanley Institutional Fund, Inc.
Annual Report — December 31, 2018
Notes to Financial Statements (cont'd)
effect of changes in foreign exchange rates from the fluctuations arising from changes in the market prices of securities sold during the period. Accordingly, realized and unrealized foreign currency gains (losses) on investments in securities are included in the reported net realized and unrealized gains (losses) on investment transactions and balances. However, pursuant to U.S. federal income tax regulations, gains and losses from certain foreign currency transactions and the foreign currency portion of gains and losses realized on sales and maturities of foreign denominated debt securities are treated as ordinary income for U.S. federal income tax purposes.
Net realized gains (losses) on foreign currency transactions represent net foreign exchange gains (losses) from foreign currency forward exchange contracts, disposition of foreign currencies, currency gains (losses) realized between the trade and settlement dates on securities transactions, and the difference between the amount of investment income and foreign withholding taxes recorded on the Fund's books and the U.S. dollar equivalent amounts actually received or paid. Net unrealized currency gains (losses) from valuing foreign currency denominated assets and liabilities at period end exchange rates are reflected as a component of unrealized appreciation (depreciation) in the Statement of Assets and Liabilities. The change in unrealized currency gains (losses) on foreign currency translations for the period is reflected in the Statement of Operations.
Foreign security and currency transactions may involve certain considerations and risks not typically associated with those of U.S. dollar denominated transactions as a result of, among other factors, fluctuations of exchange rates in relation to the U.S. dollar, the possibility of lower levels of governmental supervision and regulation of foreign securities markets and the possibility of political or economic instability.
Governmental approval for foreign investments may be required in advance of making an investment under certain circumstances in some countries, and the extent of foreign investments in domestic companies may be subject to limitation in other countries. Foreign ownership limitations also may be imposed by the charters of individual companies to prevent, among other concerns, violations of foreign investment limitations. As a result, an additional class of shares (identified as "Foreign" in the Portfolio of Investments) may be created and offered
for investment. The "local" and "foreign shares" market values may differ. In the absence of trading of the foreign shares in such markets, the Fund values the foreign shares at the closing exchange price of the local shares.
4. Derivatives: The Fund may, but is not required to, use derivative instruments for a variety of purposes, including hedging, risk management, portfolio management or to earn income. Derivatives are financial instruments whose value is based, in part, on the value of an underlying asset, interest rate, index or financial instrument. Prevailing interest rates and volatility levels, among other things, also affect the value of derivative instruments. A derivative instrument often has risks similar to its underlying asset and may have additional risks, including imperfect correlation between the value of the derivative and the underlying asset, risks of default by the counterparty to certain transactions, magnification of losses incurred due to changes in the market value of the securities, instruments, indices or interest rates to which the derivative instrument relates, risks that the transactions may not be liquid and risks arising from margin requirements. The use of derivatives involves risks that are different from, and possibly greater than, the risks associated with other portfolio investments. Derivatives may involve the use of highly specialized instruments that require investment techniques and risk analyses different from those associated with other portfolio investments. All of the Fund's holdings, including derivative instruments, are marked-to-market each day with the change in value reflected in unrealized appreciation (depreciation). Upon disposition, a realized gain or loss is recognized.
Certain derivative transactions may give rise to a form of leverage. Leverage magnifies the potential for gain and the risk of loss. Leverage associated with derivative transactions may cause the Fund to liquidate portfolio positions when it may not be advantageous to do so to satisfy its obligations or to meet earmarking or segregation requirements, pursuant to applicable Securities and Exchange Commission rules and regulations, or may cause the Fund to be more volatile than if the Fund had not been leveraged. Although the Adviser and/or Sub-Advisers seek to use derivatives to further the Fund's investment objectives, there is no assurance that the use of derivatives will achieve this result.
22
Morgan Stanley Institutional Fund, Inc.
Annual Report — December 31, 2018
Notes to Financial Statements (cont'd)
Following is a description of the derivative instruments and techniques that the Fund used during the period and their associated risks:
Foreign Currency Forward Exchange Contracts: In connection with its investments in foreign securities, the Fund also entered into contracts with banks, brokers or dealers to purchase or sell securities or foreign currencies at a future date. A foreign currency forward exchange contract ("currency contract") is a negotiated agreement between the contracting parties to exchange a specified amount of currency at a specified future time at a specified rate. The rate can be higher or lower than the spot rate between the currencies that are the subject of the contract. Currency contracts may be used to protect against uncertainty in the level of future foreign currency exchange rates or to gain or modify exposure to a particular currency. To the extent hedged by the use of currency contracts, the precise matching of the currency contract amounts and the value of the securities involved will not generally be possible because the future value of such securities in foreign currencies will change as a consequence of market movements in the value of those securities between the date on which the contract is entered into and the date it matures. Furthermore, such transactions may reduce or preclude the opportunity for gain if the value of the currency should move in the direction opposite to the position taken. There is additional risk to the extent that currency contracts create exposure to currencies in which the Fund's securities are not denominated. Unanticipated changes in currency prices may result in poorer overall performance for the Fund than if it had not entered into such contracts. The use of currency contracts involves the risk of loss from the insolvency or bankruptcy of the counterparty to the contract or the failure of the counterparty to make payments or otherwise comply with the terms of the contract. A currency contract is marked-to-market daily and the change in market value is recorded by the Fund as unrealized gain or loss. The Fund records realized gains (losses) when the currency contract is closed equal to the difference between the value of the currency contract at the time it was opened and the value at the time it was closed.
FASB ASC 815, "Derivatives and Hedging" ("ASC 815") is intended to improve financial reporting about derivative instruments by requiring enhanced disclosures to enable investors to better understand how and why the Funds use derivative instruments, how these derivative
instruments are accounted for and their effects on a Fund's financial position and results of operations.
The following table sets forth the fair value of the Fund's derivative contracts by primary risk exposure as of December 31, 2018:
| | | Asset Derivatives
Statement of Assets and
Liabilities Location | | Primary Risk
Exposure | | Value
(000) | |
Foreign Currency
Forward Exchange
Contract | | Unrealized Appreciation on
Foreign Currency Forward
Exchange Contract | | Currency Risk | | $ | 1 | | |
| | | Liability Derivatives
Statement of Assets and
Liabilities Location | | Primary Risk
Exposure | | Value
(000) | |
Foreign Currency
Forward Exchange
Contracts | | Unrealized Depreciation on
Foreign Currency Forward
Exchange Contracts | | Currency Risk | | $ | (9 | ) | |
The following tables set forth by primary risk exposure the Fund's realized gain(loss) and change in unrealized appreciation (depreciation) by type of derivative contract for the period ended December 31, 2018 in accordance with ASC 815:
Realized Gain (Loss) | |
Primary Risk Exposure | | Derivative Type | | Value
(000) | |
Currency Risk
| | Foreign Currency
Forward Exchange Contracts | | $ | 62 | | |
Change in Unrealized Appreciation (Depreciation) | |
Primary Risk Exposure | | Derivative Type | | Value
(000) | |
Currency Risk
| | Foreign Currency
Forward Exchange Contracts | | $ | (8 | ) | |
At December 31, 2018, the Fund's derivative assets and liabilities are as follows:
Gross Amounts of Assets and Liabilities
Presented in the Statement of Assets and Liabilities | |
Derivatives | | Assets(a)
(000) | | Liabilities(a)
(000) | |
Foreign Currency
Forward Exchange Contracts | | $ | 1 | | | $ | (9 | ) | |
(a) Absent an event of default or early termination, OTC derivative assets and liabilities are presented gross and not offset in the Statement of Assets and Liabilities.
The Fund typically enters into International Swaps and Derivatives Association, Inc. Master Agreements ("ISDA Master Agreements") or similar master agreements (collectively, "Master Agreements") with its contract counterparties for certain OTC derivatives in order to, among other things, reduce its credit risk to counterparties. ISDA Master Agreements include provisions for general obligations, representations, collateral and events of default or termination. Under an ISDA Master Agreement, the Fund typically may offset with the counterparty certain OTC derivative financial instruments' payables and/or receivables
23
Morgan Stanley Institutional Fund, Inc.
Annual Report — December 31, 2018
Notes to Financial Statements (cont'd)
with collateral held and/or posted and create one single net payment (close-out netting) in the event of default, termination and/or potential deterioration in the credit quality of the counterparty. Various Master Agreements govern the terms of certain transactions with counterparties, including transactions such as swap, forward, repurchase and reverse repurchase agreements. These Master Agreements typically attempt to reduce the counterparty risk associated with such transactions by specifying credit protection mechanisms and providing standardization that improves legal certainty. Cross-termination provisions under Master Agreements typically provide that a default in connection with one transaction between the Fund and a counterparty gives the non-defaulting party the right to terminate any other transactions in place with the defaulting party to create one single net payment due to/due from the defaulting party and may be a feature in certain Master Agreements. In the event the Fund exercises its right to terminate a Master Agreement after a counterparty experiences a termination event as defined in the Master Agreement, the return of collateral with market value in excess of the Fund's net liability may be delayed or denied.
The following tables present derivative financial instruments that are subject to enforceable netting arrangements as of December 31, 2018:
Gross Amounts Not Offset in the Statement of Assets and Liabilities | |
Counterparty | | Gross Asset
Derivatives
Presented in the
Statement of
Assets and
Liabilities
(000) | | Financial
Instrument
(000) | | Collateral
Received
(000) | | Net Amount
(not less
than $0)
(000) | |
BNP Paribas SA | | $ | — | @ | | $ | (— | @) | | $ | — | | | $ | 0 | | |
Citibank NA | | | 1 | | | | — | | | | — | | | | 1 | | |
UBS AG | | | — | @ | | | — | | | | — | | | | — | @ | |
Total | | $ | 1 | | | $ | (— | @) | | $ | — | | | $ | 1 | | |
Gross Amounts Not Offset in the Statement of Assets and Liabilities | |
Counterparty | | Gross Liability
Derivatives
Presented in the
Statement of
Assets and
Liabilities
(000) | | Financial
Instrument
(000) | | Collateral
Pledged
(000) | | Net Amount
(not less
than $0)
(000) | |
Australia and New
Zealand Banking Group | | $ | — | @ | | $ | — | | | $ | — | | | $ | — | @ | |
BNP Paribas SA | | | 2 | | | | (— | @) | | | — | | | | 2 | | |
JPMorgan Chase Bank NA | | | 1 | | | | — | | | | — | | | | 1 | | |
Royal Bank of Canada | | | 6 | | | | — | | | | — | | | | 6 | | |
Total | | $ | 9 | | | $( | — | @) | | $ | — | | | $ | 9 | | |
For the period ended December 31, 2018, the approximate average monthly amount outstanding for each derivative type is as follows:
Foreign Currency Forward Exchange Contracts: | |
| Average monthly principal amount | | $ | 1,895,000 | | |
5. Indemnifications: The Company enters into contracts that contain a variety of indemnifications. The Company's maximum exposure under these arrangements is unknown. However, the Company has not had prior claims or losses pursuant to these contracts and expects the risk of loss to be remote.
6. Dividends and Distributions to Shareholders: Dividends and distributions to shareholders are recorded on the ex-dividend date. Dividends from net investment income, if any, are declared and paid quarterly. Net realized capital gains, if any, are distributed at least annually.
7. Security Transactions, Income and Expenses: Security transactions are accounted for on the trade date (date the order to buy or sell is executed). Realized gains and losses on the sale of investment securities are determined on the specific identified cost method. Dividend income and other distributions are recorded on the ex-dividend date (except for certain foreign dividends which may be recorded as soon as the Fund is informed of such dividends) net of applicable withholding taxes. Interest income is recognized on the accrual basis except where collection is in doubt. Discounts are accreted and premiums are amortized over the life of the respective securities. Most expenses of the Company can be directly attributed to a particular Fund. Expenses which cannot be directly attributed are apportioned among the Funds based upon relative net assets or other appropriate methods. Income, expenses (other than class specific expenses — distribution and shareholder services, transfer agency and sub transfer agency fees) and realized and unrealized gains or losses are allocated to each class of shares based upon their relative net assets.
The Fund owns shares of REITs which report information on the source of their distributions annually in the following calendar year. A portion of distributions received from REITs during the year is estimated to be a return of capital and is recorded as a reduction of their cost.
B. Advisory/Sub-Advisory Fees: The Adviser, a wholly-owned subsidiary of Morgan Stanley, provides the Fund with advisory services under the terms of an Investment Advisory
24
Morgan Stanley Institutional Fund, Inc.
Annual Report — December 31, 2018
Notes to Financial Statements (cont'd)
Agreement, paid quarterly, at the annual rate based on the daily net assets as follows:
First $1
billion | | Over $1
billion | |
| | 0.60 | % | | | 0.55 | % | |
For the period ended December 31, 2018, the advisory fee rate (net of waiver/rebate) was equivalent to an annual effective rate of 0.00% of the Fund's average daily net assets.
The Adviser has agreed to reduce its advisory fee and/or reimburse the Fund so that total annual portfolio operating expenses, excluding certain investment related expenses, taxes, interest and other extraordinary expenses (including litigation), will not exceed 0.80% for Class I shares, 1.15% for Class A shares, 1.90% for Class C shares and 0.75% for Class IS shares. The fee waivers and/or expense reimbursements will continue for at least one year from the date of the Fund's prospectus or until such time that the Directors act to discontinue all or a portion of such waivers or reimbursements when they deem such action is appropriate. For the period ended December 31, 2018, approximately $32,000 of advisory fees were waived and approximately $182,000 of other expenses were reimbursed by the Adviser pursuant to this arrangement.
The Adviser has entered into Sub-Advisory Agreements with the Sub-Advisers, each a wholly-owned subsidiary of Morgan Stanley. The Sub-Advisers provide the Fund with advisory services subject to the overall supervision of the Adviser and the Company's Officers and Directors. The Adviser pays the Sub-Advisers on a monthly basis a portion of the net advisory fees the Adviser receives from the Fund.
C. Administration Fees: The Adviser also serves as Administrator to the Company and provides administrative services pursuant to an Administration Agreement for an annual fee, accrued daily and paid monthly, of 0.08% of the Fund's average daily net assets.
Under a Sub-Administration Agreement between the Administrator and State Street Bank and Trust Company ("State Street"), State Street provides certain administrative services to the Company. For such services, the Administrator pays State Street a portion of the fee the Administrator receives from the Fund.
D. Distribution and Shareholder Services Fees: Morgan Stanley Distribution, Inc. ("MSDI" or the "Distributor"), a wholly-owned subsidiary of the Adviser and an indirect subsidiary of Morgan Stanley, serves as the Company's Distributor of Fund shares pursuant to a Distribution Agreement. The Company has adopted a Shareholder Services Plan with respect to Class A shares pursuant to Rule 12b-1 under the
Act. Under the Shareholder Services Plan, the Fund pays the Distributor a shareholder services fee, accrued daily and paid monthly, at an annual rate of 0.25% of the Fund's average daily net assets attributable to Class A shares.
The Company has adopted a Distribution and Shareholder Services Plan with respect to Class C shares pursuant to Rule 12b-1 under the Act. Under the Distribution and Shareholder Services Plan, the Fund pays the Distributor a distribution fee, accrued daily and paid monthly, at an annual rate of 0.75% and a shareholder services fee, accrued daily and paid monthly, at an annual rate of 0.25% of the Fund's average daily net assets attributable to Class C shares.
The distribution and shareholder services fees are used to support the expenses associated with servicing and maintaining accounts. The Distributor may compensate other parties for providing shareholder support services to investors who purchase Class A and Class C shares.
E. Dividend Disbursing and Transfer Agent: The Company's dividend disbursing and transfer agent is DST Asset Manager Solutions, Inc. ("DST"). Pursuant to a Transfer Agency Agreement, the Company pays DST a fee based on the number of classes, accounts and transactions relating to the Funds of the Company.
F. Custodian Fees: State Street (the "Custodian") also serves as Custodian for the Company in accordance with a Custodian Agreement. The Custodian holds cash, securities and other assets of the Company as required by the Act. Custody fees are payable monthly based on assets held in custody, investment purchases and sales activity and account maintenance fees, plus reimbursement for certain out-of-pocket expenses.
G. Security Transactions and Transactions with Affiliates: For the period ended December 31, 2018, purchases and sales of investment securities for the Fund, other than long-term U.S. Government securities and short-term investments, were approximately $11,044,000 and $2,447,000, respectively. For the period ended December 31, 2018, purchases and sales of long-term U.S. Government securities were approximately $1,088,000 and $42,000, respectively.
The Fund invests in the Institutional Class of the Morgan Stanley Institutional Liquidity Funds — Treasury Portfolio (the "Liquidity Funds"), an open-end management investment company managed by the Adviser. Advisory fees paid by the Fund are reduced by an amount equal to its pro-rata share of the advisory and administration fees paid by the Fund due to its investment in the Liquidity Funds. For the period ended
25
Morgan Stanley Institutional Fund, Inc.
Annual Report — December 31, 2018
Notes to Financial Statements (cont'd)
December 31, 2018, advisory fees paid were reduced by less than $500 relating to the Fund's investment in the Liquidity Funds.
A summary of the Fund's transactions in shares of affiliated investments during the period ended December 31, 2018 is as follows:
Affiliated
Investment
Company | | Value
June 18,
2018
(000) | | Purchases
at Cost
(000) | | Proceeds
from Sales
(000) | | Dividend
Income
(000) | |
Liquidity Funds | | $ | — | | | $ | 10,853 | | | $ | 10,546 | | | $ | 3 | | |
Affiliated
Investment
Company (cont'd) | | Realized
Gain (Loss)
(000) | | Change in
Unrealized
Appreciation
(Depreciation)
(000) | | Value
December 31,
2018
(000) | |
Liquidity Funds | | $ | — | | | $ | — | | | $ | 307 | | |
The Fund is permitted to purchase and sell securities ("cross-trade") from and to other Morgan Stanley Funds as well as other funds and client accounts for which the Adviser or an affiliate of the Adviser serves as investment adviser, pursuant to procedures approved by the Directors in compliance with Rule 17a-7 under the Act (the "Rule"). Each cross-trade is executed at the current market price in compliance with provisions of the Rule. For the period ended December 31, 2018, the Fund did not engage in any cross-trade transactions.
The Fund has an unfunded Deferred Compensation Plan (the "Compensation Plan"), which allows each independent Director to defer payment of all, or a portion, of the fees he or she receives for serving on the Board of Directors. Each eligible Director generally may elect to have the deferred amounts credited with a return equal to the total return on one or more of the Morgan Stanley funds that are offered as investment options under the Compensation Plan. Appreciation/depreciation and distributions received from these investments are recorded with an offsetting increase/decrease in the deferred compensation obligation and do not affect the NAV of the Fund.
H. Federal Income Taxes: It is the Fund's intention to continue to qualify as a regulated investment company and distribute all of its taxable and tax-exempt income. Accordingly, no provision for Federal income taxes is required in the financial statements.
The Fund may be subject to taxes imposed by countries in which it invests. Such taxes are generally based on income and/or capital gains earned or repatriated. Taxes are accrued based on net investment income, net realized gains and net unrealized appreciation as such income and/or gains are earned. Taxes may also be based on transactions in foreign currency
and are accrued based on the value of investments denominated in such currency.
FASB ASC 740-10, "Income Taxes — Overall", sets forth a minimum threshold for financial statement recognition of the benefit of a tax position taken or expected to be taken in a tax return. Management has concluded there are no significant uncertain tax positions that would require recognition in the financial statements. If applicable, the Fund recognizes interest accrued related to unrecognized tax benefits in "Interest Expense" and penalties in "Other Expenses" in the Statement of Operations. The Fund files tax returns with the U.S. Internal Revenue Service, New York and various states.
The tax character of distributions paid may differ from the character of distributions for GAAP purposes due to short-term capital gains being treated as ordinary income for tax purposes. The tax character of distributions paid during fiscal 2018 was as follows:
| | | 2018 Distributions Paid From: | |
| | | Ordinary
Income
(000) | | Paid-in-
Capital
(000) | |
| | | | | $ | 225 | | | $ | 56 | | |
The amount and character of income and gains to be distributed are determined in accordance with income tax regulations which may differ from GAAP. These book/tax differences are either considered temporary or permanent in nature.
Temporary differences are primarily due to differing book and tax treatments in the timing of the recognition of gains (losses) on certain investment transactions and the timing of the deductibility of certain expenses.
The Fund had no permanent differences causing reclassifications among the components of net assets for the year ended December 31, 2018.
At December 31, 2018, the Fund had no distributable earnings on a tax basis.
At December 31, 2018, the Fund had available for federal income tax purposes unused short-term capital losses of approximately $61,000 that do not have an expiration date.
To the extent that capital loss carryforwards are used to offset any future capital gains realized, no capital gains tax liability will be incurred by the Fund for gains realized and not distributed. To the extent that capital gains are offset, such gains will not be distributed to the shareholders.
I. Credit Facility: The Company and other Morgan Stanley funds participated in a $150,000,000 committed, unsecured
26
Morgan Stanley Institutional Fund, Inc.
Annual Report — December 31, 2018
Notes to Financial Statements (cont'd)
revolving line of credit facility (the "Facility") with State Street. This Facility is to be used for temporary emergency purposes or funding of shareholder redemption requests. The interest rate on borrowings is based on the federal funds rate or 1 month LIBOR rate plus a spread. The Facility also has a commitment fee of 0.25% per annum based on the unused portion of the Facility. During the period ended December 31, 2018, the Fund did not have any borrowings under the Facility.
J. Other: At December 31, 2018, the Fund did not have record owners of 10% or greater.
K. Accounting Pronouncement: In March 2017, FASB issued an Accounting Standard Update, ASU 2017-08, Receivables-Nonrefundable Fees and Other Costs (Subtopic 310-20), Premium Amortization on Purchased Callable Debt Securities ("ASU 2017-08") which amends the amortization period for certain purchased callable debt securities held at a premium, shortening such period to the earliest call date. ASU 2017-08 does not require any accounting change for debt securities held at a discount; the discount continues to be accreted to maturity. ASU 2017-08 is effective for fiscal years, and interim periods within those fiscal years, beginning after December 15, 2018. At this time, management is evaluating the implications of these changes on the financial statements.
27
Morgan Stanley Institutional Fund, Inc.
Annual Report — December 31, 2018
Report of Independent Registered Public Accounting Firm
To the Shareholders and Board of Directors of
Morgan Stanley Institutional Fund, Inc. —
Real Assets Portfolio
Opinion on the Financial Statements
We have audited the accompanying statement of assets and liabilities of Real Assets Portfolio (the "Fund") (one of the funds constituting the Morgan Stanley Institutional Fund, Inc. (the "Company")), including the portfolio of investments, as of December 31, 2018, and the related statements of operations and changes in net assets and the financial highlights for the period from June 18, 2018 (commencement of operations) through December 31, 2018 and the related notes (collectively referred to as the "financial statements"). In our opinion, the financial statements present fairly, in all material respects, the financial position of Real Assets Portfolio (one of the funds constituting Morgan Stanley Institutional Fund, Inc.) at December 31, 2018, the results of its operations and the changes in its net assets and its financial highlights for the period from June 18, 2018 (commencement of operations) through December 31, 2018, in conformity with U.S. generally accepted accounting principles.
Basis for Opinion
These financial statements are the responsibility of the Company's management. Our responsibility is to express an opinion on the Fund's financial statements based on our audit. We are a public accounting firm registered with the Public Company Accounting Oversight Board (United States) ("PCAOB") and are required to be independent with respect to the Company in accordance with the U.S. federal securities law and the applicable rules and regulations of the Securities and Exchange Commission and the PCAOB.
We conducted our audit in accordance with the standards of the PCAOB. Those standards require that we plan and perform the audit to obtain reasonable assurance about whether the financial statements are free of material misstatement, whether due to error or fraud. The Company is not required to have, nor were we engaged to perform, an audit of the Company's internal control over financial reporting. As part of our audit, we are required to obtain an understanding of internal control over financial reporting, but not for the purpose of expressing an opinion on the effectiveness of the Company's internal control over financial reporting. Accordingly, we express no such opinion.
Our audit included performing procedures to assess the risks of material misstatement of the financial statements, whether due to error or fraud, and performing procedures that respond to those risks. Such procedures included examining, on a test basis, evidence regarding the amounts and disclosures in the financial statements. Our procedures included confirmation of securities owned as of December 31, 2018 by correspondence with the custodian and others or by other appropriate auditing procedures where replies from others were not received. Our audit also included evaluating the accounting principles used and significant estimates made by management, as well as evaluating the overall presentation of the financial statements. We believe that our audit provides a reasonable basis for our opinion.

We have served as the auditor of one or more Morgan Stanley investment companies since 2000.
Boston, Massachusetts
February 26, 2019
28
Morgan Stanley Institutional Fund, Inc.
Annual Report — December 31, 2018
Federal Tax Notice (unaudited)
For federal income tax purposes, the following information is furnished with respect to the distributions paid by the Fund during its taxable year ended December 31, 2018. For corporate shareholders, 8.2% of the dividends qualified for the dividends received deduction.
For federal income tax purposes, the following information is furnished with respect to the Fund's earnings for its taxable year ended December 31, 2018. When distributed, certain earnings may be subject to a maximum tax rate of 15% as provided for the Jobs and Growth Tax Relief Reconciliation Act of 2003. The Fund designated up to a maximum of approximately $72,000 as taxable at this lower rate.
The Fund intends to pass through foreign tax credits of approximately $6,000 and has derived net income from sources within foreign countries amounting to approximately $72,000.
In January, the Fund provides tax information to shareholders for the preceding calendar year.
29
Morgan Stanley Institutional Fund, Inc.
Annual Report — December 31, 2018
Privacy Notice (unaudited)
MORGAN STANLEY INVESTMENT MANAGEMENT INC.
AN IMPORTANT NOTICE CONCERNING OUR U.S. PRIVACY POLICY
We are required by federal law to provide you with a copy of our privacy policy annually. This policy applies to current and former individual investors in funds managed or sponsored by Morgan Stanley Investment Management Inc. ("MSIM") as well as current and former individual clients of MSIM. This policy is not applicable to partnerships, corporations, trusts or other non-individual clients or investors. Please note that we may amend this policy at any time, and will inform you of any changes as required by law.
WE RESPECT YOUR PRIVACY
We appreciate that you have provided us with your personal financial information. We strive to maintain the privacy of such information while we help you achieve your financial objectives. This Notice describes what non-public personal information we collect about you, why we collect it, when we may share it with others and how certain others may use it. It discusses the steps you may take to limit our sharing of certain information about you to affiliated companies in the Morgan Stanley family of companies ("other Morgan Stanley companies"). It also discloses how you may limit use of certain shared information for marketing purposes by other Morgan Stanley branded companies. Throughout this policy, we refer to the non-public information that personally identifies you or your accounts as "personal information."
1. WHAT PERSONAL INFORMATION DO WE COLLECT ABOUT YOU?
We obtain personal information from applications and other forms you submit to us, from your dealings with us, from consumer reporting agencies, from our Web sites and from third parties and other sources.
For example:
• We may collect information such as your name, address, e-mail address, telephone/fax numbers, assets, income and investment objectives through subscription documents, applications and other forms you submit to us.
• We may obtain information about account balances, your use of account(s) and the types of products and services you prefer to receive from us through your dealings and transactions with us and other sources.
• We may obtain information about your creditworthiness and credit history from consumer reporting agencies.
• We may collect background information from and through third-party vendors to verify representations you have made and to comply with various regulatory requirements.
• If you interact with us through our public and private Web sites, we may collect information that you provide directly through online communications (such as an e-mail address). We may also collect information about your Internet service provider, your domain name, your computer's operating system and Web browser, your use of our Web sites and your product and service preferences, through the use of "cookies." Please consult the Terms of Use of these sites for more details.
2. WHEN DO WE DISCLOSE PERSONAL INFORMATION WE COLLECT ABOUT YOU?
We may disclose personal information we collect about you to other Morgan Stanley companies and to non-affiliated third parties.
a. Information We Disclose to Other Morgan Stanley Companies.
We may disclose personal information to other Morgan Stanley companies for a variety of reasons, including to manage your account(s) effectively, to service and process your transactions, to let you know about products and services offered by us and other Morgan Stanley companies, to manage our business, and as otherwise required or permitted by law. Offers for products and services from other Morgan Stanley companies are developed under conditions designed to safeguard your personal information.
30
Morgan Stanley Institutional Fund, Inc.
Annual Report — December 31, 2018
Privacy Notice (unaudited) (cont'd)
b. Information We Disclose to Non-affiliated Third Parties.
We do not disclose personal information that we collect about you to non-affiliated third parties except to those who provide marketing services on our behalf, to financial institutions with whom we have joint marketing agreements, and as otherwise required or permitted by law. For example, we may disclose personal information to non-affiliated third parties for servicing and processing transactions, to offer our own products and services, to protect against fraud, for institutional risk control, to respond to judicial process or to perform services on our behalf. When we share personal information with a non-affiliated third party, they are required to limit their use of personal information to the particular purpose for which it was shared and they are not allowed to share personal information with others except to fulfill that limited purpose or as may be permitted or required by law.
3. HOW DO WE PROTECT THE SECURITY AND CONFIDENTIALITY OF PERSONAL INFORMATION WE COLLECT ABOUT YOU?
We maintain physical, electronic and procedural security measures to help safeguard the personal information we collect about you. We have internal policies governing the proper handling of client information. Third parties that provide support or marketing services on our behalf may also receive personal information, and we require them to adhere to confidentiality standards with respect to such information.
4. HOW CAN YOU LIMIT THE SHARING OF CERTAIN TYPES OF PERSONAL INFORMATION WITH OTHER MORGAN STANLEY COMPANIES?
We offer you choices as to whether we share with other Morgan Stanley companies the personal information that was collected to determine your eligibility for products and services you request ("eligibility information"). Eligibility information does not include your identification information or personal information pertaining to our transactions or experiences with you. Please note that, even if you direct us not to share eligibility information with other Morgan Stanley companies ("opt-out"), we may still share personal information, including eligibility information, with those companies in circumstances excluded from the opt-out under applicable law, such as to process transactions or to service your account.
5. HOW CAN YOU LIMIT THE USE OF CERTAIN TYPES OF PERSONAL INFORMATION BY OTHER MORGAN STANLEY COMPANIES FOR MARKETING?
By following the opt-out instructions in Section 6 below, you may limit other Morgan Stanley branded companies from marketing their products or services to you based on personal information we disclose to them. This information may include, for example, your income and account history with us. Please note that, even if you choose to limit Other Morgan Stanley Companies from using personal information about you that we may share with them for marketing their products and services to you, Other Morgan Stanley Companies may use your personal information that they obtain from us to market to you in circumstances permitted by law, such as if the Other Morgan Stanley Company has its own relationship with you.
6. HOW CAN YOU SEND US AN OPT-OUT INSTRUCTION?
If you wish to limit our sharing of eligibility information about you with other Morgan Stanley companies or other Morgan Stanley companies' use of personal information for marketing purposes, as described in this notice, you may do so by:
• Calling us at (800) 548-7786
Monday–Friday between 8a.m. and 6p.m.(EST)
• Writing to us at the following address:
DST Asset Manager Solutions, Inc.
c/o Privacy Coordinator
P.O. Box 219804
Kansas City, Missouri 64121
31
Morgan Stanley Institutional Fund, Inc.
Annual Report — December 31, 2018
Privacy Notice (unaudited) (cont'd)
Your written request should include your name, address, telephone number and account number(s) to which the opt-out applies and whether you are opting out with respect to sharing of eligibility information (Section 4 above), or if information used for Marketing (Section 5 above) or both. Written opt-out requests should not be sent with any other correspondence. In order to process your request, we require that the request be provided by you directly and not through a third party.
Your opt-out preference will remain in effect with respect to this policy (as it may be amended) until you notify us otherwise. If you have a joint account, your direction for us not to share this information with other Morgan Stanley companies and for those other Morgan Stanley companies not to use your personal information for marketing will be applied to all account holders on that account. Please understand that if you limit our sharing or our affiliated companies' use of personal information, you and any joint account holder(s) may not receive information about Morgan Stanley products and services, including products or services that could help you manage your financial resources and achieve your investment objectives.
7. WHAT IF AN AFFILIATED COMPANY BECOMES A NON-AFFILIATED THIRD PARTY?
If, at any time in the future, an affiliated company becomes a non-affiliated third party, further disclosures of personal information made to the former affiliated company will be limited to those described in Section 2(b) above relating to non-affiliated third parties. If you elected under Section 6 to limit disclosures we make to affiliated companies, or use of personal information by affiliated companies, your election will not apply to use by any former affiliated company of your personal information in their possession once it becomes a non-affiliated third party.
SPECIAL NOTICE TO RESIDENTS OF VERMONT
The following section supplements our Policy with respect to our individual clients who have a Vermont address and supersedes anything to the contrary in the above Policy with respect to those clients only.
The state of Vermont requires financial institutions to obtain your consent prior to sharing personal information that they collect about you with affiliated companies and non-affiliated third parties other than in certain limited circumstances. Except as permitted by law, we will not share personal information we collect about you with non-affiliated third parties or other Morgan Stanley companies unless you provide us with your written consent to share such information ("opt-in").
If you wish to receive offers for investment products and services offered by or through other Morgan Stanley companies, please notify us in writing at the following address:
DST Asset Manager Solutions, Inc.
c/o Privacy Coordinator
P.O. Box 219804
Kansas City, Missouri 64121
Your authorization should include your name, address, telephone number and account number(s) to which the opt-in applies and should not be sent with any other correspondence. In order to process your authorization, we require that the authorization be provided by you directly and not through a third party.
SPECIAL NOTICE TO RESIDENTS OF CALIFORNIA
The following section supplements our Policy with respect to our individual clients who have a California address and supersedes anything to the contrary in the above Policy with respect to those clients only.
In response to a California law, if your account has a California home address, your personal information will not be disclosed to non-affiliated third parties except as permitted by applicable California law, and we will limit sharing such information with our affiliates to comply with California privacy laws that apply to us.
32
Morgan Stanley Institutional Fund, Inc.
Annual Report — December 31, 2018
Director and Officer Information (unaudited)
Independent Directors:
Name, Age and Address of
Independent Director | | Position(s)
Held with
Registrant | | Length of Time
Served* | | Principal Occupation(s) During Past 5 Years
and Other Relevant Professional Experience | | Number of
Portfolios in
Fund Complex
Overseen by
Independent
Director** | | Other Directorships
Held by Independent
Director*** | |
Frank L. Bowman (74)
c/o Perkins Coie LLP
Counsel to the Independent
Directors
30 Rockefeller Plaza
New York, NY 10112 | | Director | | Since
August
2006 | | President, Strategic Decisions, LLC (consulting) (since February 2009); Director or Trustee of various Morgan Stanley Funds (since August 2006); Chairperson of the Compliance and Insurance Committee (since October 2015); formerly, Chairperson of the Insurance Sub-Committee of the Compliance and Insurance Committee (2007-2015); served as President and Chief Executive Officer of the Nuclear Energy Institute (policy organization) (February 2005-November 2008); retired as Admiral, U.S. Navy after serving over 38 years on active duty including 8 years as Director of the Naval Nuclear Propulsion Program in the Department of the Navy and the U.S. Department of Energy (1996-2004); served as Chief of Naval Personnel (July 1994-September 1996) and on the Joint Staff as Director of Political Military Affairs (June 1992-July 1994); knighted as Honorary Knight Commander of the Most Excellent Order of the British Empire; awarded the Officier de l'Orde National du Mérite by the French Government; elected to the National Academy of Engineering (2009). | | | 82 | | | Director of BP p.l.c.; Director of Naval and Nuclear Technologies LLP; Director Emeritus of the Armed Services YMCA; Member of the National Security Advisory Council of the Center for U.S. Global Engagement and a member of the CNA Military Advisory Board; Trustee of Fairhaven United Methodist Church; Member of the Board of Advisors of the Dolphin Scholarship Foundation; and Director of other various non-profit organizations. | |
Kathleen A. Dennis (65)
c/o Perkins Coie LLP
Counsel to the Independent Directors
30 Rockefeller Plaza
New York, NY 10112 | | Director | | Since
August
2006 | | President, Cedarwood Associates (mutual fund and investment management consulting) (since July 2006); Chairperson of the Liquidity and Alternatives Sub-Committee of the Investment Committee (since October 2006) and Director or Trustee of various Morgan Stanley Funds (since August 2006); formerly, Senior Managing Director of Victory Capital Management (1993-2006). | | | 82 | | | Director of various non-profit organizations. | |
Nancy C. Everett (63)
c/o Perkins Coie LLP
Counsel to the Independent Directors
30 Rockefeller Plaza
New York, NY 10112 | | Director | | Since
January
2015 | | Chief Executive Officer, Virginia Commonwealth University Investment Company (since November 2015); Owner, OBIR, LLC (institutional investment management consulting) (since June 2014); formerly, Managing Director, BlackRock Inc. (February 2011-December 2013); and Chief Executive Officer, General Motors Asset Management (a/k/a Promark Global Advisors, Inc.) (June 2005-May 2010). | | | 83 | | | Formerly, Member of Virginia Commonwealth University School of Business Foundation (2005-2016); Member of Virginia Commonwealth University Board of Visitors (2013-2015); Member of Committee on Directors for Emerging Markets Growth Fund, Inc. (2007-2010); Chairperson of Performance Equity Management, LLC (2006-2010); and Chairperson, GMAM Absolute Return Strategies Fund, LLC (2006-2010). | |
33
Morgan Stanley Institutional Fund, Inc.
Annual Report — December 31, 2018
Director and Officer Information (unaudited) (cont'd)
Independent Directors: (cont'd)
Name, Age and Address of
Independent Director | | Position(s)
Held with
Registrant | | Length of Time
Served* | | Principal Occupation(s) During Past 5 Years
and Other Relevant Professional Experience | | Number of
Portfolios in
Fund Complex
Overseen by
Independent
Director** | | Other Directorships
Held by Independent
Director*** | |
Jakki L. Haussler (61)
c/o Perkins Coie LLP
Counsel to the Independent Directors
30 Rockefeller Plaza
New York, NY 10112 | | Director | | Since
January
2015 | | Chairman and Chief Executive Officer, Opus Capital Group (since January 1996); formerly, Director, Capvest Venture Fund, LP (May 2000-December 2011); Partner, Adena Ventures, LP (July 1999-December 2010); Director, The Victory Funds (February 2005-July 2008). | | | 83 | | | Director of Service Corporation International and Member, Audit Committee and Investment Committee; Director of Cincinnati Bell Inc. and Member, Audit Committee and Governance and Nominating Committee; Chairman of Northern Kentucky University Member Investment Committee; Member of Chase College of Law Transactional Law Practice Center Board of Advisors; Director of Best Transport; Director of Chase College of Law Board of Visitors; formerly, Member, University of Cincinnati Foundation Investment Committee; Member, Miami University Board of Visitors (2008-2011); Trustee of Victory Funds (2005-2008) and Chairman, Investment Committee (2007-2008) and Member, Service Provider Committee (2005-2008). | |
Dr. Manuel H. Johnson (69)
c/o Johnson Smick
International, Inc.
220 I Street, NE — Suite 200
Washington, D.C. 20002 | | Director | | Since
July
1991 | | Senior Partner, Johnson Smick International, Inc. (consulting firm); Chairperson of the Investment Committee (since October 2006) and Director or Trustee of various Morgan Stanley Funds (since July 1991); Co-Chairman and a founder of the Group of Seven Council (G7C) (international economic commission); formerly, Chairperson of the Audit Committee (July 1991-September 2006), Vice Chairman of the Board of Governors of the Federal Reserve System and Assistant Secretary of the U.S. Treasury. | | | 82 | | | Director of NVR, Inc. (home construction). | |
Joseph J. Kearns (76)
c/o Perkins Coie LLP
Counsel to the Independent Directors
30 Rockefeller Plaza
New York, NY 10112 | | Director | | Since
August
1994 | | Senior Adviser, Kearns & Associates LLC (investment consulting); Chairperson of the Audit Committee (since October 2006) and Director or Trustee of various Morgan Stanley Funds (since August 1994); formerly, Deputy Chairperson of the Audit Committee (July 2003-September 2006) and Chairperson of the Audit Committee of various Morgan Stanley Funds (since August 1994); CFO of the J. Paul Getty Trust. | | | 83 | | | Prior to August 10, 2016, Director of Electro Rent Corporation (equipment leasing); Prior to December 31, 2013, Director of The Ford Family Foundation. | |
34
Morgan Stanley Institutional Fund, Inc.
Annual Report — December 31, 2018
Director and Officer Information (unaudited) (cont'd)
Independent Directors: (cont'd)
Name, Age and Address of
Independent Director | | Position(s)
Held with
Registrant | | Length of Time
Served* | | Principal Occupation(s) During Past 5 Years
and Other Relevant Professional Experience | | Number of
Portfolios in
Fund Complex
Overseen by
Independent
Director** | | Other Directorships
Held by Independent
Director*** | |
Michael F. Klein (60)
c/o Perkins Coie LLP
Counsel to the Independent Directors
30 Rockefeller Plaza
New York, NY 10112 | | Director | | Since
August
2006 | | Managing Director, Aetos Alternatives Management, LP (since March 2000); Co-President, Aetos Alternatives Management, LP (since January 2004) and Co-Chief Executive Officer of Aetos Alternatives Management, LP (since August 2013); Chairperson of the Fixed Income Sub-Committee of the Investment Committee (since October 2006) and Director or Trustee of various Morgan Stanley Funds (since August 2006); formerly, Managing Director, Morgan Stanley & Co. Inc. and Morgan Stanley Dean Witter Investment Management and President, various Morgan Stanley Funds (June 1998-March 2000); Principal, Morgan Stanley & Co. Inc. and Morgan Stanley Dean Witter Investment Management (August 1997-December 1999). | | | 82 | | | Director of certain investment funds managed or sponsored by Aetos Alternatives Management, LP; Director of Sanitized AG and Sanitized Marketing AG (specialty chemicals). | |
Patricia Maleski (58)
c/o Perkins Coie LLP
Counsel to the Independent Directors
30 Rockefeller Plaza
New York, NY 10112 | | Director | | Since
January
2017 | | Managing Director, JPMorgan Asset Management (2004-2016); Oversight and Control Head of Fiduciary and Conflicts of Interest Program (2015-2016); Chief Control Officer-Global Asset Management (2013-2015); President, JPMorgan Funds (2010-2013); Chief Administrative Officer (2004-2013); various other positions including Treasurer and Board Liaison (since 2001). | | | 83 | | | None. | |
Michael E. Nugent (82)
522 Fifth Avenue
New York, NY 10036 | | Chair of the Board and Director | | Chair of the Boards since July 2006 and Director since July 1991 | | Chair of the Boards of various Morgan Stanley Funds (since July 2006); Chairperson of the Closed-End Fund Committee (since June 2012) Governance Committee (since January 2019) and Director or Trustee of various Morgan Stanley Funds (since July 1991); formerly, Chairperson of the Insurance Committee (until July 2006); General Partner, Triumph Capital, L.P. (private investment partnership) (1988-2013). | | | 82 | | | None. | |
W. Allen Reed (71)
c/o Perkins Coie LLP
Counsel to the Independent Directors
30 Rockefeller Plaza
New York, NY 10112 | | Director | | Since
August
2006 | | Chairperson of the Equity Sub-Committee of the Investment Committee (since October 2006) and Director or Trustee of various Morgan Stanley Funds (since August 2006); formerly, President and CEO of General Motors Asset Management; Chairman and Chief Executive Officer of the GM Trust Bank and Corporate Vice President of General Motors Corporation (August 1994-December 2005). | | | 82 | | | Director of Legg Mason, Inc.; formerly, Director of the Auburn University Foundation (2010-2015). | |
Fergus Reid (86)****
c/o Joe Pietryka, Inc.
85 Charles Colman Blvd.
Pawling, NY 12564 | | Director | | Since
June
1992 | | Chairman, Joe Pietryka, Inc.; Chairperson of the Governance Committee and Director or Trustee of various Morgan Stanley Funds (since June 1992). | | | 83 | | | Formerly, Trustee and Director of certain investment companies in the JP Morgan Fund Complex managed by JP Morgan Investment Management Inc. (1987-2012). | |
* This is the earliest date the Director began serving the Morgan Stanley Funds. Each Director serves an indefinite term, until his or her successor is elected.
** The Fund Complex includes (as of December 31, 2018) all open-end and closed-end funds (including all of their portfolios) advised by Morgan Stanley Investment Management Inc. (the "Adviser") and any funds that have an adviser that is an affiliated person of the Adviser (including, but not limited to, Morgan Stanley AIP GP LP).
*** This includes any directorships at public companies and registered investment companies held by the Director at any time during the past five years.
**** Effective date of retirement is December 31, 2018.
35
Morgan Stanley Institutional Fund, Inc.
Annual Report — December 31, 2018
Director and Officer Information (unaudited) (cont'd)
Executive Officers:
Name, Age and Address of Executive Officer | | Position(s) Held
with
Registrant | | Length of Time
Served* | | Principal Occupation(s) During Past 5 Years | |
John H. Gernon (55)
522 Fifth Avenue
New York, NY 10036 | | President and Principal Executive Officer | | Since
September
2013 | | President and Principal Executive Officer of the Equity and Fixed Income Funds and the Morgan Stanley AIP Funds (since September 2013) and the Liquidity Funds and various money market funds (since May 2014) in the Fund Complex; Managing Director of the Adviser; Head of Product (since 2006). | |
Timothy J. Knierim (59)
522 Fifth Avenue
New York, NY 10036 | | Chief Compliance Officer | | Since
December
2016 | | Managing Director of the Adviser and various entities affiliated with the Adviser; Chief Compliance Officer of various Morgan Stanley Funds and the Adviser (since December 2016) and Chief Compliance Officer of Morgan Stanley AIP GP LP (since 2014). Formerly, Managing Director and Deputy Chief Compliance Officer of the Adviser (2014-2016); and formerly, Chief Compliance Officer of Prudential Investment Management, Inc. (2007-2014). | |
Francis J. Smith (53)
522 Fifth Avenue
New York, NY 10036 | | Treasurer and Principal Financial Officer | | Treasurer since July 2003 and Principal Financial Officer since September 2002 | | Managing Director of the Adviser and various entities affiliated with the Adviser; Treasurer (since July 2003) and Principal Financial Officer of various Morgan Stanley Funds (since September 2002). | |
Mary E. Mullin (51)
522 Fifth Avenue
New York, NY 10036 | | Secretary | | Since
June
1999 | | Managing Director of the Adviser; Secretary of various Morgan Stanley Funds (since June 1999). | |
Michael J. Key (39)
522 Fifth Avenue
New York, NY 10036 | | Vice President | | Since
June
2017 | | Vice President of the Equity and Fixed Income Funds, Liquidity Funds, various money market funds and the Morgan Stanley AIP Funds in the Fund Complex (since June 2017); Executive Director of the Adviser; Head of Product Development for Equity and Fixed Income Funds (since August 2013). | |
* This is the earliest date the officer began serving the Morgan Stanley Funds. Each officer serves a one-year term, until his or her successor is elected and qualifies.
36
Morgan Stanley Institutional Fund, Inc.
Annual Report — December 31, 2018
Adviser and Administrator
Morgan Stanley Investment Management Inc.
522 Fifth Avenue
New York, New York 10036
Sub-Advisers
Morgan Stanley Investment Management Limited
25 Cabot Square, Canary Wharf
London, E14 4QA, England
Morgan Stanley Investment Management Company
23 Church Street
16-01 Capital Square, Singapore 049481
Distributor
Morgan Stanley Distribution, Inc.
522 Fifth Avenue
New York, New York 10036
Dividend Disbursing and Transfer Agent
DST Asset Manager Solutions, Inc.
2000 Crown Colony Drive
Quincy, Massachusetts 02169
Custodian
State Street Bank and Trust Company
One Lincoln Street
Boston, Massachusetts 02111
Legal Counsel
Dechert LLP
1095 Avenue of the Americas
New York, New York 10036
Counsel to the Independent Directors
Perkins Coie LLP
30 Rockefeller Plaza
New York, New York 10112
Independent Registered Public Accounting Firm
Ernst & Young LLP
200 Clarendon Street
Boston, Massachusetts 02116
Reporting to Shareholders
Each Morgan Stanley fund provides a complete schedule of portfolio holdings in its semi-annual and the annual reports within 60 days of the end of the fund's second and fourth fiscal quarters. The semi-annual and annual reports are filed electronically with the Securities and Exchange Commission ("SEC") on Form N-CSRS and Form N-CSR, respectively. Morgan Stanley also delivers the semi-annual and annual reports to fund shareholders and makes these reports available on its public website, www.morganstanley.com/im/shareholderreports. Each Morgan Stanley fund also files a complete schedule of portfolio holdings with the SEC for the fund's first and third fiscal quarters on Form N-Q. Morgan Stanley does not deliver the reports for the first and third fiscal quarters to shareholders, nor are the reports posted to the Morgan Stanley public website. You may, however, obtain the Form N-Q filings (as well as the Form N-CSR and N-CSRS filings) by accessing the SEC's website, www.sec.gov. You can also request copies of these materials, upon payment of a duplicating fee, by electronic request at the SEC's email address (publicinfo@sec.gov).
Proxy Voting Policies and Procedures and Proxy Voting Record
You may obtain a copy of the Company's Proxy Voting Policy and Procedures and information regarding how the Company voted proxies relating to portfolio securities during the most recent twelve-month period ended June 30, without charge, upon request, by calling toll free 1 (800) 548-7786 or by visiting our website at www.morganstanley.com/im/shareholderreports. This information is also available on the SEC's website at www.sec.gov.
This report is authorized for distribution only when preceded or accompanied by a prospectus or summary prospectus of the applicable Fund of Morgan Stanley Institutional Fund, Inc., which describes in detail the Fund's investment policies, risks, fees and expenses. Please read the prospectus carefully before you invest or send money. For additional information, including information regarding the investments comprising the Fund, please visit our website at www.morganstanley.com/im/shareholderreports or call toll free 1 (800) 548-7786.
37
Printed in U.S.A.
This Report has been prepared for shareholders and may be distributed to others only if preceded or accompanied by a current prospectus.
Morgan Stanley Investment Management Inc.
522 Fifth Avenue
New York, New York 10036
© 2019 Morgan Stanley. Morgan Stanley Distribution, Inc.

IFIRAANN
2403599 EXP. 02.29.20

Morgan Stanley Institutional Fund, Inc.
Small Company Growth Portfolio
Annual Report
December 31, 2018
Beginning on January 1, 2021, as permitted by regulations adopted by the Securities and Exchange Commission ("SEC"), paper copies of the Fund's Annual and Semi-Annual Reports to Shareholders ("Shareholder Reports") will no longer be sent by mail, unless you specifically request paper copies of the Shareholder Reports from the Fund or from your financial intermediary, such as a broker-dealer or a bank. Instead, the Shareholder Reports will be made available on the Fund's website, https://www.morganstanley.com/im/shareholderreports and you will be notified by mail each time a Shareholder Report is posted and provided with a website link to access the Shareholder Report. If you already elected to receive Shareholder Reports electronically, you will not be affected by this change and you need not take any action. You may elect to receive Shareholder Reports and other communications from the Fund electronically anytime by contacting your financial intermediary or, if you are a direct investor, please follow the instructions on the envelope.
Beginning on January 1, 2019, you may elect to receive all future Shareholder Reports in paper free of charge. If you invest through a financial intermediary, you can contact your financial intermediary to request that you continue to receive paper copies of your Shareholder Reports. If you invest directly with the Fund, please follow the instructions on the envelope to let the Fund know you wish to continue receiving paper copies of your Shareholder Reports. Your election to receive Shareholder Reports in paper will apply to all funds held in your account if you invest through your financial intermediary or all funds held with the fund complex if you invest directly with a fund.

Morgan Stanley Institutional Fund, Inc.
Annual Report — December 31, 2018
Shareholders' Letter | | | 2 | | |
Expense Example | | | 3 | | |
Investment Overview | | | 4 | | |
Portfolio of Investments | | | 6 | | |
Statement of Assets and Liabilities | | | 9 | | |
Statement of Operations | | | 11 | | |
Statements of Changes in Net Assets | | | 12 | | |
Financial Highlights | | | 14 | | |
Notes to Financial Statements | | | 19 | | |
Report of Independent Registered Public Accounting Firm | | | 29 | | |
Federal Tax Notice | | | 30 | | |
Privacy Notice | | | 31 | | |
Director and Officer Information | | | 34 | | |
This report is authorized for distribution only when preceded or accompanied by a prospectus or summary prospectus of the applicable Fund of Morgan Stanley Institutional Fund, Inc. To receive a prospectus and/or statement of additional information (SAI), which contains more complete information such as investment objectives, charges, expenses, policies for voting proxies, risk considerations and describes in detail each of the Fund's investment policies to the prospective investor, please call toll free 1 (800) 548-7786. Please read the prospectuses carefully before you invest or send money.
Additionally, you can access information about the Fund, including performance, characteristics and investment team commentary, through Morgan Stanley Investment Management's website: www.morganstanley.com/im/shareholderreports.
Market forecasts provided in this report may not necessarily come to pass. There is no guarantee that any sectors mentioned will continue to perform as discussed herein or that securities in such sectors will be held by the Fund in the future. There is no assurance that a fund will achieve its investment objective. Funds are subject to market risk, which is the possibility that market values of securities owned by the Fund will decline and, therefore, the value of the Fund's shares may be less than what you paid for them. Accordingly, you can lose money investing in this Fund. Please see the prospectus for more complete information on investment risks.
1
Morgan Stanley Institutional Fund, Inc.
Annual Report — December 31, 2018
Shareholders' Letter (unaudited)
Dear Shareholders,
We are pleased to provide this Annual report, in which you will learn how your investment in Small Company Growth Portfolio (the "Fund") performed during the latest twelve-month period.
Morgan Stanley Investment Management is a client-centric, investor-led organization. Our global presence, intellectual capital, and breadth of products and services enable us to partner with investors to meet the evolving challenges of today's financial markets. We aim to deliver superior investment service and to empower our clients to make the informed decisions that help them reach their investment goals.
As always, we thank you for selecting Morgan Stanley Investment Management, and look forward to working with you in the months and years ahead.
Sincerely,

John H. Gernon
President and Principal Executive Officer
January 2019
2
Morgan Stanley Institutional Fund, Inc.
Annual Report — December 31, 2018
Expense Example (unaudited)
Small Company Growth Portfolio
As a shareholder of the Fund, you incur two types of costs: (1) transactional costs, including redemption fees; and (2) ongoing costs, which may include advisory fees, administration fees, distribution and shareholder services fees and other Fund expenses. This example is intended to help you understand your ongoing costs (in dollars) of investing in the Fund and to compare these costs with the ongoing costs of investing in other mutual funds.
This example is based on an investment of $1,000 invested at the beginning of the six-month period ended December 31, 2018 and held for the entire six-month period.
Actual Expenses
The table below provides information about actual account values and actual expenses. You may use the information in this table, together with the amount you invested, to estimate the expenses that you paid over the period. Simply divide your account value by $1,000 (for example, an $8,600 account value divided by $1,000 = 8.6), then multiply the result by the number in the table under the heading entitled "Actual Expenses Paid During Period" to estimate the expenses you paid on your account during this period.
Hypothetical Example for Comparison Purposes
The table below provides information about hypothetical account values and hypothetical expenses based on the Fund's actual expense ratio and an assumed rate of return of 5% per year before expenses, which is not the Fund's actual return. The hypothetical account values and expenses may not be used to estimate the actual ending account balance or expenses you paid for the period. You may use this information to compare the ongoing costs of investing in the Fund and other funds. To do so, compare this 5% hypothetical example with the 5% hypothetical examples that appear in the shareholder reports of the other funds.
Please note that the expenses shown in the table are meant to highlight your ongoing costs only and do not reflect any transactional costs, such as sales charges (loads) and redemption fees. Therefore, the information for each class in the table is useful in comparing ongoing costs only, and will not help you determine the relative total costs of owning different funds. In addition, if these transactional costs were included, your costs would have been higher.
| | | Beginning
Account
Value
7/1/18 | | Actual Ending
Account
Value
12/31/18 | | Hypothetical
Ending Account
Value | | Actual
Expenses
Paid
During
Period* | | Hypothetical
Expenses Paid
During Period* | | Net
Expense
Ratio
During
Period** | |
Small Company Growth Portfolio Class I | | $ | 1,000.00 | | | $ | 862.80 | | | $ | 1,020.37 | | | $ | 4.51 | | | $ | 4.89 | | | | 0.96 | % | |
Small Company Growth Portfolio Class A | | | 1,000.00 | | | | 861.30 | | | | 1,019.16 | | | | 5.63 | | | | 6.11 | | | | 1.20 | | |
Small Company Growth Portfolio Class L | | | 1,000.00 | | | | 859.20 | | | | 1,015.93 | | | | 8.62 | | | | 9.35 | | | | 1.84 | | |
Small Company Growth Portfolio Class C | | | 1,000.00 | | | | 857.70 | | | | 1,014.67 | | | | 9.79 | | | | 10.61 | | | | 2.09 | | |
Small Company Growth Portfolio Class IS | | | 1,000.00 | | | | 862.90 | | | | 1,020.57 | | | | 4.32 | | | | 4.69 | | | | 0.92 | | |
* Expenses are calculated using each Fund Class' annualized net expense ratio (as disclosed), multiplied by the average account value over the period and multiplied by 184/365 (to reflect the most recent one-half year period).
** Annualized.
3
Morgan Stanley Institutional Fund, Inc.
Annual Report — December 31, 2018
Investment Overview (unaudited)
Small Company Growth Portfolio
The Fund seeks long-term capital appreciation by investing primarily in growth-oriented equity securities of small capitalization companies.
Performance
For the fiscal year ended December 31, 2018, the Fund's Class I shares had a total return based on net asset value and reinvestment of distributions per share of 0.29%, net of fees. The Fund's Class I shares outperformed the Fund's benchmark, the Russell 2000® Growth Index (the "Index"), which returned –9.31%.
Factors Affecting Performance
• U.S. stocks ended the year with a loss, as anxiety over rising downside risks overwhelmed positive fundamental data. While most other major world economies were slowing, the U.S. economy accelerated in 2018. A tight labor market and rising wages supported consumer spending and confidence. Corporate earnings and revenues were robust, aided by tailwinds from tax cuts and deregulation. However, looming risks from geopolitical uncertainties, especially U.S.-China trade relations, and tightening financial conditions began to take a toll on investor sentiment and corporate earnings outlooks. Market volatility increased markedly from 2017's historically low levels, with especially sharp price swings in February, October and December 2018.
• Within the Index, information technology, consumer staples and utilities were the best-performing sectors and the only three sectors with positive returns for the year. The energy, materials and industrials sectors were the weakest performers.
• The long-term investment horizon and conviction-weighted investment approach embraced by the team since 1998 can result in periods of performance deviation from the benchmark and peers. In this reporting period, the Fund's relative outperformance resulted from favorable stock selection and sector allocations.
• Stock selection in information technology and health care drove most of the Fund's relative performance. Several of the portfolio's software-as-a-service holdings were among the top
contributors in the information technology sector and across the portfolio, including a provider of a proprietary cloud identity access management solution that facilitates secure access to software applications, data and IT systems and a provider of cloud-based software to help enterprises optimize their spending budgets. In the health care sector, top contributors included a leading provider of health savings account solutions and a health care payment solutions provider. An overweight to the information technology sector and no exposure to the energy sector also contributed positively to relative results.
• The main detractors were our stock selections in consumer discretionary, industrials and financials. In consumer discretionary, an online home goods and apparel seller was the largest drag on performance both in the sector and across the whole portfolio. The industrials sector was dampened by the weak performance of an administrator of consumer-directed benefits, while the Fund's financials stocks suffered widespread declines.
Management Strategies
• There were no changes to our bottom-up investment process during the period. We continued to look for high-quality growth companies that we believe have these attributes: sustainable competitive advantages, above-average business visibility, rising return on invested capital, strong free cash flow generation and a favorable risk/reward profile. We find these companies through intense fundamental research. Our emphasis is on secular growth, and as a result short-term market events are not as meaningful in the stock selection process.
4
Morgan Stanley Institutional Fund, Inc.
Annual Report — December 31, 2018
Investment Overview (unaudited) (cont'd)
Small Company Growth Portfolio
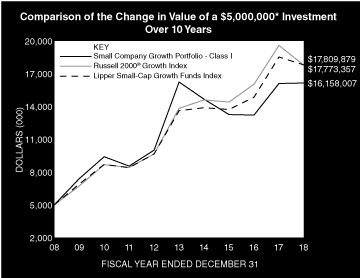
* Minimum Investment for Class I shares
In accordance with SEC regulations, the Fund's performance shown assumes that all recurring fees (including management fees) were deducted and all dividends and distributions were reinvested. The performance of Class A, L, C and IS shares will vary from the performance of Class I shares based upon their different inception dates and will be negatively impacted by additional fees assessed to those classes (if applicable).
Performance Compared to the Russell 2000® Growth Index(1) and the Lipper Small-Cap Growth Funds Index(2)
| | | Period Ended December 31, 2018
Total Returns(3) | |
| | | | | Average Annual | |
| | | One
Year | | Five
Years | | Ten
Years | | Since
Inception(9) | |
Fund — Class I Shares
w/o sales charges(4) | | | 0.29 | % | | | –0.11 | % | | | 12.45 | % | | | 10.18 | % | |
Fund — Class A Shares
w/o sales charges(5) | | | 0.02 | | | | –0.42 | | | | 12.12 | | | | 9.05 | | |
Fund — Class A Shares with
maximum 5.25% sales charges(5) | | | –5.25 | | | | –1.48 | | | | 11.51 | | | | 8.79 | | |
Fund — Class L Shares
w/o sales charges(6) | | | –0.58 | | | | –0.93 | | | | — | | | | 7.91 | | |
Fund — Class C Shares
w/o sales charges(8) | | | –0.78 | | | | — | | | | — | | | | 2.22 | | |
Fund — Class C Shares with
maximum 1.00% deferred
sales charges(8) | | | –1.62 | | | | — | | | | — | | | | 2.22 | | |
Fund — Class IS Shares
w/o sales charges(7) | | | 0.38 | | | | –0.01 | | | | — | | | | 2.91 | | |
Russell 2000® Growth Index | | | –9.31 | | | | 5.13 | | | | 13.52 | | | | 7.54 | | |
Lipper Small-Cap Growth Funds Index | | | –3.93 | | | | 5.51 | | | | 13.55 | | | | 9.02 | | |
Performance data quoted represents past performance, which is no guarantee of future results, and current performance may be lower or higher than the figures shown. Performance assumes that all dividends and distributions, if any, were reinvested. For the most recent month-end performance figures, please visit www.morganstanley.com/im/shareholderreports. Investment return and principal value will fluctuate so that Fund shares, when redeemed, may be worth more or less than their original cost. Total returns do not reflect the deduction of taxes that a shareholder would pay on Fund distributions or the redemption of Fund shares. Performance of share classes will vary due to difference in sales charges and expenses.
(1) The Russell 2000® Growth Index measures the performance of the small-cap growth segment of the U.S. equity universe. It includes those Russell 2000® Index companies with higher price-to-book ratios and higher forecasted growth values. The Russell 2000® Index is a subset of the Russell 3000® Index representing approximately 10% of the total market capitalization of that index. It includes approximately 2,000 of the smallest securities based on a combination of their market capitalization and current index membership. The Index is unmanaged and its returns do not include any sales charges or fees. Such costs would lower performance. It is not possible to invest directly in an index.
(2) The Lipper Small-Cap Growth Funds Index is an equally weighted performance index of the largest qualifying funds (based on net assets) in the Lipper Small-Cap Growth Funds classification. The Index, which is adjusted for capital gains distributions and income dividends, is unmanaged and should not be considered an investment. There are currently 30 funds represented in this Index. As of the date of this report, the Fund is in the Lipper Small-Cap Growth Funds classification.
(3) Total returns for the Fund reflect fees waived and expenses reimbursed, if applicable, by Morgan Stanley Investment Management Inc. (the "Adviser"). Without such waivers and reimbursements, total returns would have been lower.
(4) Commenced operations on November 1, 1989.
(5) Commenced offering on January 2, 1996.
(6) Commenced offering on November 11, 2011.
(7) Commenced offering on September 13, 2013.
(8) Commenced offering on May 31, 2017.
(9) For comparative purposes, average annual since inception returns listed for the Indexes refer to the inception date of Class I of the Fund, not the inception of the Index.
5
Morgan Stanley Institutional Fund, Inc.
Annual Report — December 31, 2018
Portfolio of Investments
Small Company Growth Portfolio
| | | Shares | | Value
(000) | |
Common Stocks (93.9%) | |
Banks (1.1%) | |
Metro Bank PLC (United Kingdom) (a) | | | 104,068 | | | $ | 2,245 | | |
Biotechnology (1.2%) | |
Agios Pharmaceuticals, Inc. (a) | | | 9,713 | | | | 448 | | |
Bellicum Pharmaceuticals, Inc. (a) | | | 68,425 | | | | 200 | | |
Editas Medicine, Inc. (a) | | | 46,728 | | | | 1,063 | | |
Intellia Therapeutics, Inc. (a) | | | 44,315 | | | | 605 | | |
Intrexon Corp. (a)(b) | | | 32,888 | | | | 215 | | |
| | | | 2,531 | | |
Construction Materials (1.3%) | |
Eagle Materials, Inc. | | | 45,510 | | | | 2,777 | | |
Diversified Consumer Services (1.5%) | |
Chegg, Inc. (a) | | | 109,191 | | | | 3,103 | | |
Health Care Equipment & Supplies (5.3%) | |
Penumbra, Inc. (a) | | | 81,425 | | | | 9,950 | | |
Quotient Ltd. (Jersey) (a)(b) | | | 171,919 | | | | 1,052 | | |
| | | | 11,002 | | |
Health Care Providers & Services (8.8%) | |
Guardant Health, Inc. (a)(b) | | | 198,300 | | | | 7,454 | | |
HealthEquity, Inc. (a) | | | 180,908 | | | | 10,791 | | |
| | | | 18,245 | | |
Health Care Technology (8.0%) | |
athenahealth, Inc. (a) | | | 86,193 | | | | 11,371 | | |
Inspire Medical Systems, Inc. (a) | | | 121,555 | | | | 5,136 | | |
| | | | 16,507 | | |
Hotels, Restaurants & Leisure (1.3%) | |
Shake Shack, Inc., Class A (a) | | | 60,900 | | | | 2,766 | | |
Information Technology Services (15.9%) | |
GTT Communications, Inc. (a)(b) | | | 200,715 | | | | 4,749 | | |
LiveRamp Holdings, Inc. (a)(b) | | | 175,291 | | | | 6,772 | | |
MongoDB, Inc. (a)(b) | | | 141,990 | | | | 11,890 | | |
Okta, Inc. (a) | | | 99,262 | | | | 6,333 | | |
Wix.com Ltd. (Israel) (a) | | | 35,200 | | | | 3,180 | | |
| | | | 32,924 | | |
Insurance (1.5%) | |
Trupanion, Inc. (a)(b) | | | 120,454 | | | | 3,067 | | |
Interactive Media & Services (3.9%) | |
Eventbrite, Inc., Class A (a) | | | 76,142 | | | | 2,117 | | |
Yelp, Inc. (a) | | | 169,674 | | | | 5,937 | | |
| | | | 8,054 | | |
Internet & Direct Marketing Retail (7.0%) | |
Etsy, Inc. (a) | | | 117,015 | | | | 5,566 | | |
MakeMyTrip Ltd. (a) | | | 136,967 | | | | 3,333 | | |
Overstock.com, Inc. (a)(b) | | | 220,638 | | | | 2,996 | | |
Stamps.com, Inc. (a) | | | 16,513 | | | | 2,570 | | |
| | | | 14,465 | | |
Life Sciences Tools & Services (1.1%) | |
NanoString Technologies, Inc. (a) | | | 159,137 | | | | 2,360 | | |
| | | Shares | | Value
(000) | |
Pharmaceuticals (1.0%) | |
Intersect ENT, Inc. (a) | | | 71,313 | | | $ | 2,010 | | |
Professional Services (4.1%) | |
Upwork, Inc. (a)(b) | | | 205,424 | | | | 3,720 | | |
WageWorks, Inc. (a) | | | 173,323 | | | | 4,708 | | |
| | | | 8,428 | | |
Real Estate Management & Development (1.3%) | |
Redfin Corp. (a)(b) | | | 187,513 | | | | 2,700 | | |
Software (21.9%) | |
Appfolio, Inc., Class A (a) | | | 55,672 | | | | 3,297 | | |
Avalara, Inc. (a)(b) | | | 110,970 | | | | 3,457 | | |
Coupa Software, Inc. (a) | | | 244,310 | | | | 15,358 | | |
Elastic N.V. (a)(b) | | | 109,180 | | | | 7,804 | | |
Ellie Mae, Inc. (a)(b) | | | 48,735 | | | | 3,062 | | |
Smartsheet, Inc., Class A (a) | | | 128,009 | | | | 3,182 | | |
SVMK, Inc. (a)(b) | | | 191,547 | | | | 2,350 | | |
Workiva, Inc. (a) | | | 92,612 | | | | 3,324 | | |
Xero Ltd. (New Zealand) (a) | | | 119,788 | | | | 3,530 | | |
| | | | 45,364 | | |
Specialty Retail (2.1%) | |
Carvana Co. (a)(b) | | | 133,649 | | | | 4,372 | | |
Textiles, Apparel & Luxury Goods (1.6%) | |
Brunello Cucinelli SpA (Italy) | | | 96,643 | | | | 3,321 | | |
Thrifts & Mortgage Finance (2.6%) | |
LendingTree, Inc. (a) | | | 24,343 | | | | 5,345 | | |
Trading Companies & Distributors (1.4%) | |
Watsco, Inc. | | | 21,252 | | | | 2,957 | | |
Total Common Stocks (Cost $194,720) | | | 194,543 | | |
Preferred Stocks (7.0%) | |
Health Care Technology (4.0%) | |
Grand Rounds, Inc. Series B (a)(c)(d)(e)
(acquisition cost — $3,362;
acquired 7/3/14) | | | 3,269,139 | | | | 8,271 | | |
Software (3.0%) | |
DOMO, Inc. Series D (a) | | | 170,314 | | | | 3,343 | | |
Lookout, Inc. Series F (a)(c)(d)(e)
(acquisition cost — $13,476;
acquired 6/17/14) | | | 1,179,743 | | | | 2,879 | | |
| | | | 6,222 | | |
Total Preferred Stocks (Cost $27,397) | | | 14,493 | | |
Short-Term Investments (15.6%) | |
Securities held as Collateral on Loaned Securities (15.3%) | |
Investment Company (12.5%) | |
Morgan Stanley Institutional Liquidity
Funds — Treasury Securities Portfolio —
Institutional Class (See Note G) | | | 25,915,930 | | | | 25,916 | | |
The accompanying notes are an integral part of the financial statements.
6
Morgan Stanley Institutional Fund, Inc.
Annual Report — December 31, 2018
Portfolio of Investments (cont'd)
Small Company Growth Portfolio
| | | Face
Amount
(000) | | Value
(000) | |
Repurchase Agreements (2.8%) | |
Barclays Capital, Inc., (2.90%,
dated 12/31/18, due 01/02/19;
proceeds $1,958; fully collateralized
by a U.S. Government obligation;
2.50% due 05/15/24; valued at $1,997) | | $ | 1,957 | | | $ | 1,957 | | |
HSBC Securities USA, Inc., (2.95%,
dated 12/31/18, due 01/02/19;
proceeds $3,967; fully collateralized
by U.S. Government obligations;
0.00% - 2.75% due 01/31/19 - 02/15/42;
valued at $4,046) | | | 3,967 | | | | 3,967 | | |
| | | | 5,924 | | |
Total Securities held as Collateral on Loaned
Securities (Cost $31,840) | | | 31,840 | | |
| | | Shares | | | |
Investment Company (0.3%) | |
Morgan Stanley Institutional Liquidity
Funds — Treasury Securities Portfolio —
Institutional Class (See Note G)
(Cost $565) | | | 564,706 | | | | 565 | | |
Total Short-Term Investments (Cost $32,405) | | | 32,405 | | |
Total Investments Excluding Purchased
Options (116.6%) (Cost $254,522) | | | | | 241,441 | | |
Total Purchased Options Outstanding (0.0%)
(Cost $870) | | | 160 | | |
Total Investments (116.6%) (Cost $255,392)
Including $53,519 of Securities Loaned (f) | | | 241,601 | | |
Liabilities in Excess of Other Assets (–16.6%) | | | (34,466 | ) | |
Net Assets (100.0%) | | $ | 207,135 | | |
(a) Non-income producing security.
(b) All or a portion of this security was on loan at December 31, 2018.
(c) Security has been deemed illiquid at December 31, 2018.
(d) Security cannot be offered for public resale without first being registered under the Securities Act of 1933 and related rules ("restricted security"). Acquisition date represents the day on which an enforceable right to acquire such security is obtained and is presented along with related cost in the security description. The Fund has registration rights for certain restricted securities. Any costs related to such registration are borne by the issuer. The aggregate value of restricted securities (excluding 144A holdings) at December 31, 2018 amounts to approximately $11,150,000 and represents 5.4% of net assets.
(e) At December 31, 2018, the Fund held fair valued securities valued at approximately $11,150,000, representing 5.4% of net assets. These securities have been fair valued as determined in good faith under procedures established by and under the general supervision of the Company's Directors.
(f) At December 31, 2018, the aggregate cost for federal income tax purposes is approximately $259,262,000. The aggregate gross unrealized appreciation is approximately $35,225,000 and the aggregate gross unrealized depreciation is approximately $52,886,000, resulting in net unrealized depreciation of approximately $17,661,000.
Call Options Purchased:
The Fund had the following call options purchased open at December 31, 2018:
Counterparty | | Description | | Strike
Price | | Expiration
Date | | Number of
Contracts | | Notional
Amount
(000) | | Value
(000) | | Premiums
Paid
(000) | | Unrealized
Depreciation
(000) | |
Royal Bank of Scotland | | USD/CNH | | CNH | 7.16 | | | Jan-19 | | | 67,676,212 | | | | 67,676 | | | $ | 7 | | | $ | 294 | | | $ | (287 | ) | |
Royal Bank of Scotland | | USD/CNH | | CNH | 7.78 | | | Jul-19 | | | 61,460,957 | | | | 61,461 | | | | 66 | | | | 299 | | | | (233 | ) | |
Royal Bank of Scotland | | USD/CNH | | CNH | 8.00 | | | Oct-19 | | | 47,079,506 | | | | 47,080 | | | | 87 | | | | 277 | | | | (190 | ) | |
| | | | | | | | | | | | | $ | 160 | | | $ | 870 | | | $ | (710 | ) | |
CNH Chinese Yuan Renminbi Offshore
USD United States Dollar
The accompanying notes are an integral part of the financial statements.
7
Morgan Stanley Institutional Fund, Inc.
Annual Report — December 31, 2018
Portfolio of Investments (cont'd)
Small Company Growth Portfolio
Portfolio Composition*
Classification | | Percentage of
Total Investments | |
Other** | | | 27.0 | % | |
Software | | | 24.6 | | |
Information Technology Services | | | 15.7 | | |
Health Care Technology | | | 11.8 | | |
Health Care Providers & Services | | | 8.7 | | |
Internet & Direct Marketing Retail | | | 6.9 | | |
Health Care Equipment & Supplies | | | 5.3 | | |
Total Investments | | | 100.0 | % | |
* Percentages indicated are based upon total investments (excluding Securities held as Collateral on Loaned Securities) as of December 31, 2018.
** Industries and/or investment types representing less than 5% of total investments.
The accompanying notes are an integral part of the financial statements.
8
Morgan Stanley Institutional Fund, Inc.
Annual Report — December 31, 2018
Small Company Growth Portfolio
Statement of Assets and Liabilities | | December 31, 2018
(000) | |
Assets: | |
Investments in Securities of Unaffiliated Issuers, at Value(1) (Cost $228,911) | | $ | 215,120 | | |
Investment in Security of Affiliated Issuer, at Value (Cost $26,481) | | | 26,481 | | |
Total Investments in Securities, at Value (Cost $255,392) | | | 241,601 | | |
Foreign Currency, at Value (Cost $1) | | | 1 | | |
Cash from Securities Lending | | | 196 | | |
Receivable for Fund Shares Sold | | | 405 | | |
Receivable from Securities Lending Income | | | 94 | | |
Receivable from Affiliate | | | 6 | | |
Dividends Receivable | | | 5 | | |
Other Assets | | | 90 | | |
Total Assets | | | 242,398 | | |
Liabilities: | |
Collateral on Securities Loaned, at Value | | | 32,036 | | |
Payable for Fund Shares Redeemed | | | 2,243 | | |
Payable for Advisory Fees | | | 444 | | |
Due to Broker | | | 330 | | |
Payable for Professional Fees | | | 79 | | |
Payable for Sub Transfer Agency Fees — Class I | | | 16 | | |
Payable for Sub Transfer Agency Fees — Class A | | | 8 | | |
Payable for Sub Transfer Agency Fees — Class L | | | — | @ | |
Payable for Sub Transfer Agency Fees — Class C | | | — | @ | |
Payable for Directors' Fees and Expenses | | | 20 | | |
Payable for Administration Fees | | | 15 | | |
Payable for Transfer Agency Fees — Class I | | | 4 | | |
Payable for Transfer Agency Fees — Class A | | | 4 | | |
Payable for Transfer Agency Fees — Class L | | | 1 | | |
Payable for Transfer Agency Fees — Class C | | | 1 | | |
Payable for Transfer Agency Fees — Class IS | | | 1 | | |
Payable for Shareholder Services Fees — Class A | | | 8 | | |
Payable for Distribution and Shareholder Services Fees — Class L | | | 1 | | |
Payable for Distribution and Shareholder Services Fees — Class C | | | — | @ | |
Payable for Custodian Fees | | | 5 | | |
Other Liabilities | | | 47 | | |
Total Liabilities | | | 35,263 | | |
Net Assets | | $ | 207,135 | | |
Net Assets Consist of: | |
Paid-in-Capital | | $ | 224,621 | | |
| Total Accumulated Loss | | | (17,486 | ) | |
Net Assets | | $ | 207,135 | | |
The accompanying notes are an integral part of the financial statements.
9
Morgan Stanley Institutional Fund, Inc.
Annual Report — December 31, 2018
Small Company Growth Portfolio
Statement of Assets and Liabilities (cont'd) | | December 31, 2018
(000) | |
CLASS I: | |
Net Assets | | $ | 60,777 | | |
| Shares Outstanding $0.001 par value shares of beneficial interest (unlimited shares authorized) (not in 000's) | | | 6,315,208 | | |
Net Asset Value, Offering and Redemption Price Per Share | | $ | 9.62 | | |
CLASS A: | |
Net Assets | | $ | 34,166 | | |
| Shares Outstanding $0.001 par value shares of beneficial interest (unlimited shares authorized) (not in 000's) | | | 4,447,674 | | |
Net Asset Value, Redemption Price Per Share | | $ | 7.68 | | |
Maximum Sales Load | | | 5.25 | % | |
Maximum Sales Charge | | $ | 0.43 | | |
Maximum Offering Price Per Share | | $ | 8.11 | | |
CLASS L: | |
Net Assets | | $ | 1,157 | | |
| Shares Outstanding $0.001 par value shares of beneficial interest (unlimited shares authorized) (not in 000's) | | | 162,968 | | |
Net Asset Value, Offering and Redemption Price Per Share | | $ | 7.10 | | |
CLASS C: | |
Net Assets | | $ | 116 | | |
| Shares Outstanding $0.001 par value shares of beneficial interest (unlimited shares authorized) (not in 000's) | | | 15,360 | | |
Net Asset Value, Offering and Redemption Price Per Share | | $ | 7.55 | | |
CLASS IS: | |
Net Assets | | $ | 110,919 | | |
| Shares Outstanding $0.001 par value shares of beneficial interest (unlimited shares authorized) (not in 000's) | | | 11,449,133 | | |
Net Asset Value, Offering and Redemption Price Per Share | | $ | 9.69 | | |
(1) Including:
Securities on Loan, at Value: | | $ | 53,519 | | |
@ Amount is less than $500.
The accompanying notes are an integral part of the financial statements.
10
Morgan Stanley Institutional Fund, Inc.
Annual Report — December 31, 2018
Small Company Growth Portfolio
Statement of Operations | | Year Ended
December 31, 2018
(000) | |
Investment Income: | |
Income from Securities Loaned — Net | | $ | 1,099 | | |
Dividends from Securities of Unaffiliated Issuers (Net of $4 of Foreign Taxes Withheld) | | | 319 | | |
Dividends from Security of Affiliated Issuer (Note G) | | | 176 | | |
Total Investment Income | | | 1,594 | | |
Expenses: | |
Advisory Fees (Note B) | | | 2,581 | | |
Administration Fees (Note C) | | | 224 | | |
Professional Fees | | | 139 | | |
Shareholder Services Fees — Class A (Note D) | | | 104 | | |
Distribution and Shareholder Services Fees — Class L (Note D) | | | 10 | | |
Distribution and Shareholder Services Fees — Class C (Note D) | | | 1 | | |
Sub Transfer Agency Fees — Class I | | | 62 | | |
Sub Transfer Agency Fees — Class A | | | 22 | | |
Sub Transfer Agency Fees — Class L | | | (— | @) | |
Sub Transfer Agency Fees — Class C | | | — | @ | |
Registration Fees | | | 63 | | |
Shareholder Reporting Fees | | | 42 | | |
Transfer Agency Fees — Class I (Note E) | | | 8 | | |
Transfer Agency Fees — Class A (Note E) | | | 11 | | |
Transfer Agency Fees — Class L (Note E) | | | 3 | | |
Transfer Agency Fees — Class C (Note E) | | | 2 | | |
Transfer Agency Fees — Class IS (Note E) | | | 4 | | |
Custodian Fees (Note F) | | | 15 | | |
Directors' Fees and Expenses | | | 11 | | |
Pricing Fees | | | 3 | | |
Other Expenses | | | 44 | | |
Expenses Before Non Operating Expenses | | | 3,349 | | |
Bank Overdraft Expense | | | 4 | | |
Total Expenses | | | 3,353 | | |
Waiver of Advisory Fees (Note B) | | | (505 | ) | |
Rebate from Morgan Stanley Affiliate (Note G) | | | (20 | ) | |
Reimbursement of Class Specific Expenses — Class L (Note B) | | | (1 | ) | |
Reimbursement of Class Specific Expenses — Class C (Note B) | | | (2 | ) | |
Reimbursement of Class Specific Expenses — Class IS (Note B) | | | (4 | ) | |
Net Expenses | | | 2,821 | | |
Net Investment Loss | | | (1,227 | ) | |
Realized Gain (Loss): | |
Investments Sold | | | 49,966 | | |
Foreign Currency Translation | | | (6 | ) | |
Net Realized Gain | | | 49,960 | | |
Change in Unrealized Appreciation (Depreciation): | |
Investments | | | (38,830 | ) | |
Foreign Currency Translation | | | — | @ | |
Net Change in Unrealized Appreciation (Depreciation) | | | (38,830 | ) | |
Net Realized Gain and Change in Unrealized Appreciation (Depreciation) | | | 11,131 | | |
Net Increase in Net Assets Resulting from Operations | | $ | 9,903 | | |
@ Amount is less than $500.
The accompanying notes are an integral part of the financial statements.
11
Morgan Stanley Institutional Fund, Inc.
Annual Report — December 31, 2018
Small Company Growth Portfolio
Statements of Changes in Net Assets | | Year Ended
December 31, 2018
(000) | | Year Ended
December 31, 2017
(000) | |
Increase (Decrease) in Net Assets: | |
Operations: | |
Net Investment Loss | | $ | (1,227 | ) | | $ | (3,951 | ) | |
Net Realized Gain | | | 49,960 | | | | 171,671 | | |
Net Change in Unrealized Appreciation (Depreciation) | | | (38,830 | ) | | | (62,911 | ) | |
Net Increase in Net Assets Resulting from Operations | | | 9,903 | | | | 104,809 | | |
Dividends and Distributions to Shareholders: | |
Class I | | | (7,933 | ) | | | (66,031 | )* | |
Class A | | | (5,688 | ) | | | (18,203 | )* | |
Class L | | | (196 | ) | | | (589 | )* | |
Class C | | | (18 | ) | | | (4 | )* | |
Class IS | | | (14,165 | ) | | | (51,397 | )* | |
Total Dividends and Distributions to Shareholders | | | (28,000 | ) | | | (136,224 | ) | |
Capital Share Transactions:(1) | |
Class I: | |
Subscribed | | | 32,971 | | | | 47,817 | | |
Distributions Reinvested | | | 7,923 | | | | 65,879 | | |
Redeemed | | | (124,369 | ) | | | (259,329 | ) | |
Class A: | |
Subscribed | | | 6,959 | | | | 5,601 | | |
Distributions Reinvested | | | 5,498 | | | | 18,092 | | |
Redeemed | | | (13,251 | ) | | | (64,607 | ) | |
Class L: | |
Distributions Reinvested | | | 195 | | | | 586 | | |
Redeemed | | | (164 | ) | | | (504 | ) | |
Class C: | |
Subscribed | | | 145 | | | | 33 | ** | |
Distributions Reinvested | | | 17 | | | | — | | |
Redeemed | | | (37 | ) | | | — | | |
Class IS: | |
Subscribed | | | 31,218 | | | | 60,649 | | |
Distributions Reinvested | | | 14,160 | | | | 50,949 | | |
Redeemed | | | (48,990 | ) | | | (337,736 | ) | |
Net Decrease in Net Assets Resulting from Capital Share Transactions | | | (87,725 | ) | | | (412,570 | ) | |
Redemption Fees | | | 6 | | | | 17 | | |
Total Decrease in Net Assets | | | (105,816 | ) | | | (443,968 | ) | |
Net Assets: | |
Beginning of Period | | | 312,951 | | | | 756,919 | | |
End of Period | | $ | 207,135 | | | $ | 312,951 | † | |
The accompanying notes are an integral part of the financial statements.
12
Morgan Stanley Institutional Fund, Inc.
Annual Report — December 31, 2018
Small Company Growth Portfolio
Statements of Changes in Net Assets (cont'd) | | Year Ended
December 31, 2018
(000) | | Year Ended
December 31, 2017
(000) | |
(1) Capital Share Transactions: | |
Class I: | |
Shares Subscribed | | | 2,843 | | | | 3,416 | | |
Shares Issued on Distributions Reinvested | | | 780 | | | | 5,619 | | |
Shares Redeemed | | | (10,329 | ) | | | (19,091 | ) | |
Net Decrease in Class I Shares Outstanding | | | (6,706 | ) | | | (10,056 | ) | |
Class A: | |
Shares Subscribed | | | 695 | | | | 454 | | |
Shares Issued on Distributions Reinvested | | | 678 | | | | 1,855 | | |
Shares Redeemed | | | (1,434 | ) | | | (5,295 | ) | |
Net Decrease in Class A Shares Outstanding | | | (61 | ) | | | (2,986 | ) | |
Class L: | |
Shares Issued on Distributions Reinvested | | | 26 | | | | 64 | | |
Shares Redeemed | | | (18 | ) | | | (43 | ) | |
Net Increase in Class L Shares Outstanding | | | 8 | | | | 21 | | |
Class C: | |
Shares Subscribed | | | 14 | | | | 3 | ** | |
Shares Issued on Distributions Reinvested | | | 2 | | | | — | | |
Shares Redeemed | | | (4 | ) | | | — | | |
Net Increase in Class C Shares Outstanding | | | 12 | | | | 3 | | |
Class IS: | |
Shares Subscribed | | | 2,514 | | | | 4,289 | | |
Shares Issued on Distributions Reinvested | | | 1,384 | | | | 4,361 | | |
Shares Redeemed | | | (4,233 | ) | | | (24,070 | ) | |
Net Decrease in Class IS Shares Outstanding | | | (335 | ) | | | (15,420 | ) | |
The following information was previously reported in the December 31, 2017 financial statements. The distribution information for the year ended December 31, 2017 presented on the Statements of Changes in Net Assets is presented for comparative purposes to the December 31, 2018 financial statements, which conform to the SEC Final Rule on Disclosure Update and Simplification which was effective November 5, 2018.
* Dividends and Distributions to Shareholders for the year ended December 31, 2017 were as follows:
Class I: | |
Net Realized Gain | | $ | (66,031 | ) | |
Class A: | |
Net Realized Gain | | $ | (18,203 | ) | |
Class L: | |
Net Realized Gain | | $ | (589 | ) | |
Class C: | |
Net Realized Gain | | $ | (4 | ) | |
Class IS: | |
Net Realized Gain | | $ | (51,397 | ) | |
† Accumulated Net Investment Loss for the year ended December 31, 2017 was $(77).
** For the period May 31, 2017 through December 31, 2017.
The accompanying notes are an integral part of the financial statements.
13
Morgan Stanley Institutional Fund, Inc.
Annual Report — December 31, 2018
Financial Highlights
Small Company Growth Portfolio
| | | Class I | |
| | | Year Ended December 31, | |
Selected Per Share Data and Ratios | | 2018 | | 2017 | | 2016(1) | | 2015 | | 2014 | |
Net Asset Value, Beginning of Period | | $ | 10.90 | | | $ | 13.26 | | | $ | 13.75 | | | $ | 16.50 | | | $ | 20.55 | | |
Income (Loss) from Investment Operations: | |
Net Investment Income (Loss)(2) | | | (0.05 | ) | | | (0.11 | ) | | | 0.00 | (3) | | | (0.05 | ) | | | (0.06 | ) | |
Net Realized and Unrealized Gain (Loss) | | | 0.16 | | | | 2.91 | | | | (0.05 | ) | | | (1.51 | ) | | | (2.04 | ) | |
Total from Investment Operations | | | 0.11 | | | | 2.80 | | | | (0.05 | ) | | | (1.56 | ) | | | (2.10 | ) | |
Distributions from and/or in Excess of: | |
Net Realized Gain | | | (1.39 | ) | | | (5.16 | ) | | | (0.44 | ) | | | (1.19 | ) | | | (1.95 | ) | |
Redemption Fees | | | 0.00 | (3) | | | 0.00 | (3) | | | 0.00 | (3) | | | 0.00 | (3) | | | 0.00 | (3) | |
Net Asset Value, End of Period | | $ | 9.62 | | | $ | 10.90 | | | $ | 13.26 | | | $ | 13.75 | | | $ | 16.50 | | |
Total Return(4) | | | 0.29 | % | | | 21.87 | % | | | (0.35 | )% | | | (9.58 | )% | | | (9.68 | )% | |
Ratios and Supplemental Data: | |
Net Assets, End of Period (Thousands) | | $ | 60,777 | | | $ | 141,954 | | | $ | 305,945 | | | $ | 718,386 | | | $ | 1,156,812 | | |
Ratio of Expenses to Average Net Assets(8) | | | 0.98 | %(5) | | | 0.99 | %(5) | | | 1.02 | %(5)(6) | | | 1.05 | %(5) | | | 1.05 | %(5) | |
Ratio of Expenses to Average Net Assets Excluding Non Operating Expenses | | | 0.98 | %(5) | | | 0.99 | %(5) | | | N/A | | | | N/A | | | | N/A | | |
Ratio of Net Investment Income (Loss) to Average Net Assets(8) | | | (0.41 | )%(5) | | | (0.77 | )%(5) | | | 0.02 | %(5) | | | (0.29 | )%(5) | | | (0.34 | )%(5) | |
Ratio of Rebate from Morgan Stanley Affiliates to Average Net Assets | | | 0.01 | % | | | 0.01 | % | | | 0.00 | %(7) | | | 0.00 | %(7) | | | 0.00 | %(7) | |
Portfolio Turnover Rate | | | 79 | % | | | 97 | % | | | 51 | % | | | 42 | % | | | 53 | % | |
(8) Supplemental Information on the Ratios to Average Net Assets: | |
Ratios Before Expense Limitation: | |
Expenses to Average Net Assets | | | 1.17 | % | | | 1.20 | % | | | 1.17 | % | | | 1.11 | % | | | 1.13 | % | |
Net Investment Loss to Average Net Assets | | | (0.60 | )% | | | (0.98 | )% | | | (0.13 | )% | | | (0.35 | )% | | | (0.42 | )% | |
(1) Reflects prior period Custodian out-of-pocket expenses that were reimbursed in September 2016. The amount of the reimbursement was immaterial on a per share basis and did not impact the total return of Class I shares. The Ratio of Expenses to Average Net Assets and the Ratio of Net Investment Income to Average Net Assets would be unchanged as the reimbursement of Custodian fees was offset against expense waivers/reimbursements with no impact to net expenses or net investment income.
(2) Per share amount is based on average shares outstanding.
(3) Amount is less than $0.005 per share.
(4) Calculated based on the net asset value as of the last business day of the period.
(5) The Ratios of Expenses and Net Investment Income (Loss) reflect the rebate of certain Fund expenses in connection with the investments in Morgan Stanley affiliates during the period. The effect of the rebate on the ratios is disclosed in the above table as "Ratio of Rebate from Morgan Stanley Affiliates to Average Net Assets."
(6) Effective July 1, 2016, the Adviser has agreed to limit the ratio of expenses to average net assets to the maximum ratio of 1.00% for Class I shares. Prior to July 1, 2016, the maximum ratio was 1.05% for Class I shares.
(7) Amount is less than 0.005%.
The accompanying notes are an integral part of the financial statements.
14
Morgan Stanley Institutional Fund, Inc.
Annual Report — December 31, 2018
Financial Highlights
Small Company Growth Portfolio
| | | Class A | |
| | | Year Ended December 31, | |
Selected Per Share Data and Ratios | | 2018 | | 2017 | | 2016(1) | | 2015 | | 2014 | |
Net Asset Value, Beginning of Period | | $ | 8.99 | | | $ | 11.72 | | | $ | 12.25 | | | $ | 14.89 | | | $ | 18.83 | | |
Income (Loss) from Investment Operations: | |
Net Investment Loss(2) | | | (0.07 | ) | | | (0.14 | ) | | | (0.04 | ) | | | (0.09 | ) | | | (0.11 | ) | |
Net Realized and Unrealized Gain (Loss) | | | 0.15 | | | | 2.57 | | | | (0.05 | ) | | | (1.36 | ) | | | (1.88 | ) | |
Total from Investment Operations | | | 0.08 | | | | 2.43 | | | | (0.09 | ) | | | (1.45 | ) | | | (1.99 | ) | |
Distributions from and/or in Excess of: | |
Net Realized Gain | | | (1.39 | ) | | | (5.16 | ) | | | (0.44 | ) | | | (1.19 | ) | | | (1.95 | ) | |
Redemption Fees | | | 0.00 | (3) | | | 0.00 | (3) | | | 0.00 | (3) | | | 0.00 | (3) | | | 0.00 | (3) | |
Net Asset Value, End of Period | | $ | 7.68 | | | $ | 8.99 | | | $ | 11.72 | | | $ | 12.25 | | | $ | 14.89 | | |
Total Return(4) | | | 0.02 | % | | | 21.57 | % | | | (0.73 | )% | | | (9.88 | )% | | | (9.98 | )% | |
Ratios and Supplemental Data: | |
Net Assets, End of Period (Thousands) | | $ | 34,166 | | | $ | 40,531 | | | $ | 87,864 | | | $ | 136,621 | | | $ | 186,307 | | |
Ratio of Expenses to Average Net Assets(8) | | | 1.25 | %(5) | | | 1.34 | %(5) | | | 1.37 | %(5)(6) | | | 1.37 | %(5) | | | 1.38 | %(5) | |
Ratio of Expenses to Average Net Assets Excluding Non Operating Expenses | | | 1.25 | %(5) | | | 1.34 | %(5) | | | N/A | | | | N/A | | | | N/A | | |
Ratio of Net Investment Loss to Average Net Assets(8) | | | (0.69 | )%(5) | | | (1.12 | )%(5) | | | (0.35 | )%(5) | | | (0.61 | )%(5) | | | (0.67 | )%(5) | |
Ratio of Rebate from Morgan Stanley Affiliates to Average Net Assets | | | 0.01 | % | | | 0.01 | % | | | 0.00 | %(7) | | | 0.00 | %(7) | | | 0.00 | %(7) | |
Portfolio Turnover Rate | | | 79 | % | | | 97 | % | | | 51 | % | | | 42 | % | | | 53 | % | |
(8) Supplemental Information on the Ratios to Average Net Assets: | |
Ratios Before Expense Limitation: | |
Expenses to Average Net Assets | | | 1.44 | % | | | 1.51 | % | | | 1.45 | % | | | 1.38 | % | | | N/A | | |
Net Investment Loss to Average Net Assets | | | (0.88 | )% | | | (1.29 | )% | | | (0.43 | )% | | | (0.62 | )% | | | N/A | | |
(1) Reflects prior period Custodian out-of-pocket expenses that were reimbursed in September 2016. The amount of the reimbursement was immaterial on a per share basis and did not impact the total return of Class A shares. The Ratio of Expenses to Average Net Assets and the Ratio of Net Investment Loss to Average Net Assets would be unchanged as the reimbursement of Custodian fees was offset against expense waivers/reimbursements with no impact to net expenses or net investment loss.
(2) Per share amount is based on average shares outstanding.
(3) Amount is less than $0.005 per share.
(4) Calculated based on the net asset value which does not reflect sales charges, if applicable, as of the last business day of the period.
(5) The Ratios of Expenses and Net Investment Loss reflect the rebate of certain Fund expenses in connection with the investments in Morgan Stanley affiliates during the period. The effect of the rebate on the ratios is disclosed in the above table as "Ratio of Rebate from Morgan Stanley Affiliates to Average Net Assets."
(6) Effective July 1, 2016, the Adviser has agreed to limit the ratio of expenses to average net assets to the maximum ratio of 1.35% for Class A shares. Prior to July 1, 2016, the maximum ratio was 1.40% for Class A shares.
(7) Amount is less than 0.005%.
The accompanying notes are an integral part of the financial statements.
15
Morgan Stanley Institutional Fund, Inc.
Annual Report — December 31, 2018
Financial Highlights
Small Company Growth Portfolio
| | | Class L | |
| | | Year Ended December 31, | |
Selected Per Share Data and Ratios | | 2018 | | 2017 | | 2016(1) | | 2015 | | 2014 | |
Net Asset Value, Beginning of Period | | $ | 8.46 | | | $ | 11.34 | | | $ | 11.92 | | | $ | 14.60 | | | $ | 18.60 | | |
Income (Loss) from Investment Operations: | |
Net Investment Loss(2) | | | (0.11 | ) | | | (0.19 | ) | | | (0.10 | ) | | | (0.16 | ) | | | (0.19 | ) | |
Net Realized and Unrealized Gain (Loss) | | | 0.14 | | | | 2.47 | | | | (0.04 | ) | | | (1.33 | ) | | | (1.86 | ) | |
Total from Investment Operations | | | 0.03 | | | | 2.28 | | | | (0.14 | ) | | | (1.49 | ) | | | (2.05 | ) | |
Distributions from and/or in Excess of: | |
Net Realized Gain | | | (1.39 | ) | | | (5.16 | ) | | | (0.44 | ) | | | (1.19 | ) | | | (1.95 | ) | |
Redemption Fees | | | 0.00 | (3) | | | 0.00 | (3) | | | 0.00 | (3) | | | 0.00 | (3) | | | 0.00 | (3) | |
Net Asset Value, End of Period | | $ | 7.10 | | | $ | 8.46 | | | $ | 11.34 | | | $ | 11.92 | | | $ | 14.60 | | |
Total Return(4) | | | (0.58 | )% | | | 20.95 | % | | | (1.17 | )% | | | (10.36 | )% | | | (10.43 | )% | |
Ratios and Supplemental Data: | |
Net Assets, End of Period (Thousands) | | $ | 1,157 | | | $ | 1,310 | | | $ | 1,524 | | | $ | 1,874 | | | $ | 2,370 | | |
Ratio of Expenses to Average Net Assets(8) | | | 1.84 | %(5) | | | 1.84 | %(5) | | | 1.87 | %(5)(6) | | | 1.90 | %(5) | | | 1.90 | %(5) | |
Ratio of Expenses to Average Net Assets Excluding Non Operating Expenses | | | 1.84 | %(5) | | | 1.84 | %(5) | | | N/A | | | | N/A | | | | N/A | | |
Ratio of Net Investment Loss to Average Net Assets(8) | | | (1.28 | )%(5) | | | (1.61 | )%(5) | | | (0.88 | )%(5) | | | (1.33 | )%(5) | | | (1.16 | )%(5) | |
Ratio of Rebate from Morgan Stanley Affiliates to Average Net Assets | | | 0.01 | % | | | 0.01 | % | | | 0.00 | %(7) | | | 0.00 | %(7) | | | 0.00 | %(7) | |
Portfolio Turnover Rate | | | 79 | % | | | 97 | % | | | 51 | % | | | 42 | % | | | 53 | % | |
(8) Supplemental Information on the Ratios to Average Net Assets: | |
Ratios Before Expense Limitation: | |
Expenses to Average Net Assets | | | 2.07 | % | | | 2.27 | % | | | 2.21 | % | | | 2.10 | % | | | 2.02 | % | |
Net Investment Loss to Average Net Assets | | | (1.51 | )% | | | (2.04 | )% | | | (1.22 | )% | | | (1.34 | )% | | | (1.28 | )% | |
(1) Reflects prior period Custodian out-of-pocket expenses that were reimbursed in September 2016. The amount of the reimbursement was immaterial on a per share basis and did not impact the total return of Class L shares. The Ratio of Expenses to Average Net Assets and the Ratio of Net Investment Loss to Average Net Assets would be unchanged as the reimbursement of Custodian fees was offset against expense waivers/reimbursements with no impact to net expenses or net investment loss.
(2) Per share amount is based on average shares outstanding.
(3) Amount is less than $0.005 per share.
(4) Calculated based on the net asset value as of the last business day of the period.
(5) The Ratios of Expenses and Net Investment Loss reflect the rebate of certain Fund expenses in connection with the investments in Morgan Stanley affiliates during the period. The effect of the rebate on the ratios is disclosed in the above table as "Ratio of Rebate from Morgan Stanley Affiliates to Average Net Assets."
(6) Effective July 1, 2016, the Adviser has agreed to limit the ratio of expenses to average net assets to the maximum ratio of 1.85% for Class L shares. Prior to July 1, 2016, the maximum ratio was 1.90% for Class L shares.
(7) Amount is less than 0.005%.
The accompanying notes are an integral part of the financial statements.
16
Morgan Stanley Institutional Fund, Inc.
Annual Report — December 31, 2018
Financial Highlights
Small Company Growth Portfolio
| | | Class C | |
Selected Per Share Data and Ratios | | Year Ended
December 31, 2018 | | Period from
May 31, 2017(1) to
December 31, 2017 | |
Net Asset Value, Beginning of Period | | $ | 8.93 | | | $ | 13.59 | | |
Income (Loss) from Investment Operations: | |
Net Investment Loss(2) | | | (0.03 | ) | | | (0.13 | ) | |
Net Realized and Unrealized Gain | | | 0.04 | | | | 0.63 | | |
Total from Investment Operations | | | 0.01 | | | | 0.50 | | |
Distributions from and/or in Excess of: | |
Net Realized Gain | | | (1.39 | ) | | | (5.16 | ) | |
Redemption Fees | | | 0.00 | (3) | | | 0.00 | (3) | |
Net Asset Value, End of Period | | $ | 7.55 | | | $ | 8.93 | | |
Total Return(4) | | | (0.78 | )% | | | 4.36 | %(7) | |
Ratios and Supplemental Data: | |
Net Assets, End of Period (Thousands) | | $ | 116 | | | $ | 30 | | |
Ratio of Expenses to Average Net Assets(9) | | | 2.09 | %(5) | | | 2.10 | %(5)(8) | |
Ratio of Expenses to Average Net Assets Excluding Non Operating Expenses | | | 2.09 | %(5) | | | 2.10 | %(5)(8) | |
Ratio of Net Investment Loss to Average Net Assets(9) | | | (1.50 | )%(5) | | | (1.82 | )%(5)(8) | |
Ratio of Rebate from Morgan Stanley Affiliates to Average Net Assets | | | 0.01 | % | | | 0.00 | %(6)(8) | |
Portfolio Turnover Rate | | | 79 | % | | | 97 | % | |
(9) Supplemental Information on the Ratios to Average Net Assets: | |
Ratios Before Expense Limitation: | |
Expenses to Average Net Assets | | | 4.73 | % | | | 21.29 | %(8) | |
Net Investment Loss to Average Net Assets | | | (4.14 | )% | | | (21.01 | )%(8) | |
(1) Commencement of Offering.
(2) Per share amount is based on average shares outstanding.
(3) Amount is less than $0.005 per share.
(4) Calculated based on the net asset value which does not reflect sales charges, if applicable, as of the last business day of the period.
(5) The Ratios of Expenses and Net Investment Loss reflect the rebate of certain Fund expenses in connection with the investments in Morgan Stanley affiliates during the period. The effect of the rebate on the ratios is disclosed in the above table as "Ratio of Rebate from Morgan Stanley Affiliates to Average Net Assets."
(6) Amount is less than 0.005%.
(7) Not annualized.
(8) Annualized.
The accompanying notes are an integral part of the financial statements.
17
Morgan Stanley Institutional Fund, Inc.
Annual Report — December 31, 2018
Financial Highlights
Small Company Growth Portfolio
| | | Class IS | |
| | | Year Ended December 31, | |
Selected Per Share Data and Ratios | | 2018 | | 2017 | | 2016(1) | | 2015 | | 2014 | |
Net Asset Value, Beginning of Period | | $ | 10.96 | | | $ | 13.29 | | | $ | 13.77 | | | $ | 16.51 | | | $ | 20.55 | | |
Income (Loss) from Investment Operations: | |
Net Investment Income (Loss)(2) | | | (0.04 | ) | | | (0.10 | ) | | | 0.01 | | | | (0.03 | ) | | | (0.03 | ) | |
Net Realized and Unrealized Gain (Loss) | | | 0.16 | | | | 2.93 | | | | (0.05 | ) | | | (1.52 | ) | | | (2.06 | ) | |
Total from Investment Operations | | | 0.12 | | | | 2.83 | | | | (0.04 | ) | | | (1.55 | ) | | | (2.09 | ) | |
Distributions from and/or in Excess of: | |
Net Realized Gain | | | (1.39 | ) | | | (5.16 | ) | | | (0.44 | ) | | | (1.19 | ) | | | (1.95 | ) | |
Redemption Fees | | | 0.00 | (3) | | | 0.00 | (3) | | | 0.00 | (3) | | | 0.00 | (3) | | | 0.00 | (3) | |
Net Asset Value, End of Period | | $ | 9.69 | | | $ | 10.96 | | | $ | 13.29 | | | $ | 13.77 | | | $ | 16.51 | | |
Total Return(4) | | | 0.38 | % | | | 22.08 | % | | | (0.28 | )% | | | (9.52 | )% | | | (9.63 | )% | |
Ratios and Supplemental Data: | |
Net Assets, End of Period (Thousands) | | $ | 110,919 | | | $ | 129,126 | | | $ | 361,586 | | | $ | 660,134 | | | $ | 671,885 | | |
Ratio of Expenses to Average Net Assets(8) | | | 0.92 | %(5) | | | 0.92 | %(5) | | | 0.95 | %(5)(6) | | | 0.98 | %(5) | | | 0.97 | %(5) | |
Ratio of Expenses to Average Net Assets Excluding Non Operating Expenses | | | 0.92 | %(5) | | | 0.92 | %(5) | | | N/A | | | | N/A | | | | N/A | | |
Ratio of Net Investment Income (Loss) to Average Net Assets(8) | | | (0.36 | )%(5) | | | (0.71 | )%(5) | | | 0.08 | %(5) | | | (0.21 | )%(5) | | | (0.17 | )%(5) | |
Ratio of Rebate from Morgan Stanley Affiliates to Average Net Assets | | | 0.01 | % | | | 0.01 | % | | | 0.00 | %(7) | | | 0.00 | %(7) | | | 0.00 | %(7) | |
Portfolio Turnover Rate | | | 79 | % | | | 97 | % | | | 51 | % | | | 42 | % | | | 53 | % | |
(8) Supplemental Information on the Ratios to Average Net Assets: | |
Ratios Before Expense Limitation: | |
Expenses to Average Net Assets | | | 1.11 | % | | | 1.09 | % | | | 1.03 | % | | | 0.99 | % | | | 0.98 | % | |
Net Investment Loss to Average Net Assets | | | (0.55 | )% | | | (0.88 | )% | | | (0.00 | )%(7) | | | (0.22 | )% | | | (0.18 | )% | |
(1) Reflects prior period Custodian out-of-pocket expenses that were reimbursed in September 2016. The amount of the reimbursement was immaterial on a per share basis and did not impact the total return of Class IS shares. The Ratio of Expenses to Average Net Assets and the Ratio of Net Investment Income to Average Net Assets would be unchanged as the reimbursement of Custodian fees was offset against expense waivers/reimbursements with no impact to net expenses or net investment income.
(2) Per share amount is based on average shares outstanding.
(3) Amount is less than $0.005 per share.
(4) Calculated based on the net asset value as of the last business day of the period.
(5) The Ratios of Expenses and Net Investment Income (Loss) reflect the rebate of certain Fund expenses in connection with the investments in Morgan Stanley affiliates during the period. The effect of the rebate on the ratios is disclosed in the above table as "Ratio of Rebate from Morgan Stanley Affiliates to Average Net Assets."
(6) Effective July 1, 2016, the Adviser has agreed to limit the ratio of expenses to average net assets to the maximum ratio of 0.93% for Class IS shares. Prior to July 1, 2016, the maximum ratio was 0.98% for Class IS shares.
(7) Amount is less than 0.005%.
The accompanying notes are an integral part of the financial statements.
18
Morgan Stanley Institutional Fund, Inc.
Annual Report — December 31, 2018
Notes to Financial Statements
Morgan Stanley Institutional Fund, Inc. (the "Company") is registered under the Investment Company Act of 1940, as amended (the "Act"), as an open-end management investment company. The Company is comprised of thirty separate, active, diversified and non-diversified funds (individually referred to as a "Fund", collectively as the "Funds"). The Company applies investment company accounting and reporting guidance.
The accompanying financial statements relate to the Small Company Growth Portfolio. The Fund seeks long-term capital appreciation by investing primarily in growth-oriented equity securities of small capitalization companies.
The Fund offers five classes of shares — Class I, Class A, Class L, Class C and Class IS. The Fund suspended offering of Class L shares. Existing Class L shareholders may invest through reinvestment of dividends and distributions.
A. Significant Accounting Policies: The following significant accounting policies are in conformity with U.S. generally accepted accounting principles ("GAAP"). Such policies are consistently followed by the Company in the preparation of its financial statements. GAAP may require management to make estimates and assumptions that affect the reported amounts and disclosures in the financial statements. Actual results may differ from those estimates.
In August 2018, the Financial Accounting Standards Board ("FASB") issued Accounting Standards Update ("ASU") 2018-13, Fair Value Measurement (Topic 820) — Disclosures Framework — Changes to Disclosure Requirements of Fair Value Measurement ("ASU 2018-13") which introduces new fair value disclosure requirements as well as eliminates and modifies certain existing fair value disclosure requirements. ASU 2018-13 would be effective for fiscal years beginning after December 15, 2019 and for interim periods within those fiscal years; however, management has elected to early adopt ASU 2018-13 effective with the current reporting period as permitted by the standard. The impact of the Fund's adoption was limited to changes in the Fund's financial statement disclosures regarding fair value, primarily those disclosures related to transfers between levels of the fair value hierarchy and disclosure of the range and weighted average used to develop significant unobservable inputs for Level 3 fair value measurements, when applicable.
1. Security Valuation: (1) An equity portfolio security listed or traded on an exchange is valued at its latest reported sales price (or at the exchange official closing price if such exchange reports an official closing price), and if
there were no sales on a given day and if there is no official exchange closing price for that day, the security is valued at the mean between the last reported bid and asked prices if such bid and asked prices are available on the relevant exchanges. Listed equity securities not traded on the valuation date with no reported bid and asked prices available on the exchange are valued at the mean between the current bid and asked prices obtained from one or more reputable brokers or dealers. In cases where a security is traded on more than one exchange, the security is valued on the exchange designated as the primary market; (2) all other equity portfolio securities for which over-the-counter ("OTC") market quotations are readily available are valued at the latest reported sales price (or at the market official closing price if such market reports an official closing price), and if there was no trading in the security on a given day and if there is no official closing price from relevant markets for that day, the security is valued at the mean between the last reported bid and asked prices if such bid and asked prices are available on the relevant markets. An unlisted equity security that does not trade on the valuation date and for which bid and asked prices from the relevant markets are unavailable is valued at the mean between the current bid and asked prices obtained from one or more reputable brokers or dealers; (3) certain portfolio securities may be valued by an outside pricing service/vendor approved by the Company's Board of Directors (the "Directors"). The pricing service/vendor may employ a pricing model that takes into account, among other things, bids, yield spreads and/or other market data and specific security characteristics. Alternatively, if a valuation is not available from an outside pricing service/vendor, and the security trades on an exchange, the security may be valued at its latest reported sale price (or at the exchange official closing price if such exchange reports an official closing price), prior to the time when assets are valued. If there are no sales on a given day and if there is no official exchange closing price for that day, the security is valued at the mean between the last reported bid and asked prices if such bid and asked prices are available in the relevant exchanges; (4) listed options are valued at the last reported sales price on the exchange on which they are listed (or at the exchange official closing price if such exchange reports an official closing price). If an official closing price or last reported sales price is unavailable, the listed option should be fair valued at the mean between its latest bid and ask prices. Unlisted options are valued at the
19
Morgan Stanley Institutional Fund, Inc.
Annual Report — December 31, 2018
Notes to Financial Statements (cont'd)
mean between their latest bid and ask prices from a broker/dealer or valued by a pricing service/vendor; (5) when market quotations are not readily available, including circumstances under which Morgan Stanley Investment Management Inc. (the "Adviser") determines that the closing price, last sale price or the mean between the last reported bid and asked prices are not reflective of a security's market value, portfolio securities are valued at their fair value as determined in good faith under procedures established by and under the general supervision of the Directors. Occasionally, developments affecting the closing prices of securities and other assets may occur between the times at which valuations of such securities are determined (that is, close of the foreign market on which the securities trade) and the close of business of the New York Stock Exchange ("NYSE"). If developments occur during such periods that are expected to materially affect the value of such securities, such valuations may be adjusted to reflect the estimated fair value of such securities as of the close of the NYSE, as determined in good faith by the Directors or by the Adviser using a pricing service and/or procedures approved by the Directors; (6) quotations of foreign portfolio securities, other assets and liabilities and forward contracts stated in foreign currency are translated into U.S. dollar equivalents at the prevailing market rates prior to the close of the NYSE; and (7) investments in mutual funds, including the Morgan Stanley Institutional Liquidity Funds, are valued at the net asset value ("NAV") as of the close of each business day.
The Directors have responsibility for determining in good faith the fair value of the investments, and the Directors may appoint others, such as the Company's Adviser or a valuation committee, to assist the Directors in determining fair value and to make the actual calculations pursuant to the fair valuation methodologies previously approved by the Directors. Under procedures approved by the Directors, the Company's Adviser has formed a Valuation Committee whose members are approved by the Directors. The Valuation Committee provides administration and oversight of the Company's valuation policies and procedures, which are reviewed at least annually by the Directors. These procedures allow the Company to utilize independent pricing services, quotations from securities and financial instrument dealers and other market sources to determine fair value.
2. Fair Value Measurement: FASB Accounting Standards CodificationTM ("ASC") 820, "Fair Value Measurement" ("ASC 820"), defines fair value as the value that the Fund would receive to sell an investment or pay to transfer a liability in a timely transaction with an independent buyer in the principal market, or in the absence of a principal market, the most advantageous market for the investment or liability. ASC 820 establishes a three-tier hierarchy to distinguish between (1) inputs that reflect the assumptions market participants would use in valuing an asset or liability developed based on market data obtained from sources independent of the reporting entity (observable inputs) and (2) inputs that reflect the reporting entity's own assumptions about the assumptions market participants would use in valuing an asset or liability developed based on the best information available in the circumstances (unobservable inputs) and to establish classification of fair value measurements for disclosure purposes. Various inputs are used in determining the value of the Fund's investments. The inputs are summarized in the three broad levels listed below:
• Level 1 – unadjusted quoted prices in active markets for identical investments
• Level 2 – other significant observable inputs (including quoted prices for similar investments, interest rates, prepayment speeds, credit risk, etc.)
• Level 3 – significant unobservable inputs including the Fund's own assumptions in determining the fair value of investments. Factors considered in making this determination may include, but are not limited to, information obtained by contacting the issuer, analysts, or the appropriate stock exchange (for exchange-traded securities), analysis of the issuer's financial statements or other available documents and, if necessary, available information concerning other securities in similar circumstances
The inputs or methodology used for valuing securities are not necessarily an indication of the risk associated with investing in those securities and the determination of the significance of a particular input to the fair value measurement in its entirety requires judgment and considers factors specific to each security.
20
Morgan Stanley Institutional Fund, Inc.
Annual Report — December 31, 2018
Notes to Financial Statements (cont'd)
The following is a summary of the inputs used to value the Fund's investments as of December 31, 2018:
Investment Type | | Level 1
Unadjusted
quoted
prices
(000) | | Level 2
Other
significant
observable
inputs
(000) | | Level 3
Significant
unobservable
inputs
(000) | | Total
(000) | |
Assets: | |
Common Stocks | |
Banks | | $ | — | | | $ | 2,245 | | | $ | — | | | $ | 2,245 | | |
Biotechnology | | | 2,531 | | | | — | | | | — | | | | 2,531 | | |
Construction Materials | | | 2,777 | | | | — | | | | — | | | | 2,777 | | |
Diversified Consumer
Services | | | 3,103 | | | | — | | | | — | | | | 3,103 | | |
Health Care Equipment &
Supplies | | | 11,002 | | | | — | | | | — | | | | 11,002 | | |
Health Care Providers &
Services | | | 18,245 | | | | — | | | | — | | | | 18,245 | | |
Health Care Technology | | | 16,507 | | | | — | | | | — | | | | 16,507 | | |
Hotels, Restaurants &
Leisure | | | 2,766 | | | | — | | | | — | | | | 2,766 | | |
Information Technology
Services | | | 32,924 | | | | — | | | | — | | | | 32,924 | | |
Insurance | | | 3,067 | | | | — | | | | — | | | | 3,067 | | |
Interactive Media &
Services | | | 8,054 | | | | — | | | | — | | | | 8,054 | | |
Internet & Direct
Marketing Retail | | | 14,465 | | | | — | | | | — | | | | 14,465 | | |
Life Sciences Tools &
Services | | | 2,360 | | | | — | | | | — | | | | 2,360 | | |
Pharmaceuticals | | | 2,010 | | | | — | | | | — | | | | 2,010 | | |
Professional Services | | | 8,428 | | | | — | | | | — | | | | 8,428 | | |
Real Estate
Management &
Development | | | 2,700 | | | | — | | | | — | | | | 2,700 | | |
Software | | | 41,834 | | | | 3,530 | | | | — | | | | 45,364 | | |
Specialty Retail | | | 4,372 | | | | — | | | | — | | | | 4,372 | | |
Textiles, Apparel &
Luxury Goods | | | — | | | | 3,321 | | | | — | | | | 3,321 | | |
Thrifts & Mortgage
Finance | | | 5,345 | | | | — | | | | — | | | | 5,345 | | |
Trading Companies &
Distributors | | | 2,957 | | | | — | | | | — | | | | 2,957 | | |
Total Common Stocks | | | 185,447 | | | | 9,096 | | | | — | | | | 194,543 | | |
Investment Type | | Level 1
Unadjusted
quoted
prices
(000) | | Level 2
Other
significant
observable
inputs
(000) | | Level 3
Significant
unobservable
inputs
(000) | | Total
(000) | |
Preferred Stocks | |
Health Care Technology | | $ | — | | | $ | — | | | $ | 8,271 | | | $ | 8,271 | | |
Software | | | — | | | | 3,343 | | | | 2,879 | | | | 6,222 | | |
Total Preferred Stocks | | | — | | | | 3,343 | | | | 11,150 | | | | 14,493 | | |
Call Option Purchased | | | — | | | | 160 | | | | — | | | | 160 | | |
Short-Term Investments | |
Investment Company | | | 26,481 | | | | — | | | | — | | | | 26,481 | | |
Repurchase Agreements | | | — | | | | 5,924 | | | | — | | | | 5,924 | | |
Total Short-Term
Investments | | | 26,481 | | | | 5,924 | | | | — | | | | 32,405 | | |
Total Assets | | $ | 211,928 | | | $ | 18,523 | | | $ | 11,150 | | | $ | 241,601 | | |
Transfers between investment levels may occur as the markets fluctuate and/or the availability of data used in an investment's valuation changes.
Following is a reconciliation of investments in which significant unobservable inputs (Level 3) were used in determining fair value:
| | | Preferred
Stocks
(000) | |
Beginning Balance | | $ | 17,828 | | |
Purchases | | | — | | |
Sales | | | (3,428 | ) | |
Amortization of discount | | | — | | |
Transfers in | | | — | | |
Transfers out | | | — | | |
Corporate actions | | | (10,559 | ) | |
Change in unrealized appreciation (depreciation) | | | 7,715 | | |
Realized gains (losses) | | | (406 | ) | |
Ending Balance | | $ | 11,150 | | |
Net change in unrealized appreciation (depreciation) from
investments still held as of December 31, 2018 | | $ | 3,004 | | |
The following table presents additional information about valuation techniques and inputs used for investments that are measured at fair value and categorized within Level 3 as of December 31, 2018. Various valuation techniques were used in the valuation of certain investments and weighted based on the level of significance. The Fund calculated the weighted averages of the unobservable inputs relative to each investment's fair value as of December 31, 2018.
| | | Fair Value at
December 31, 2018
(000) | | Valuation
Technique | | Unobservable
Input | | Amount or Range/
Weighted Average | | Impact to
Valuation from an
Increase in Input†† | |
Preferred Stocks | | $ | 11,150 | | | Discounted
Cash Flow | | Weighted Average
Cost of Capital | | 15.5%–19.5%/17.02% | | Decrease | |
| | | | | | | Perpetual Growth Rate | | 3.0%–4.0%/3.50% | | Increase | |
| | | | | Market Comparable
Companies | | Enterprise
Value/Revenue | | 0.7x–9.7x/7.07x | | Increase | |
| | | | | | | Discount for Lack
of Marketability | | 20.00% | | Decrease | |
| | | | | Comparable
Transactions | | Enterprise
Value/Revenue | | 2.3x–4.9x/3.30x | | Increase | |
†† Represents the expected directional change in the fair value of the Level 3 investments that would result from an increase in the corresponding input. A decrease to the unobservable input would have the opposite effect. Significant changes in these inputs could result in significantly higher or lower fair value measurements.
21
Morgan Stanley Institutional Fund, Inc.
Annual Report — December 31, 2018
Notes to Financial Statements (cont'd)
3. Repurchase Agreements: The Fund may enter into repurchase agreements under which the Fund lends cash and takes possession of securities with an agreement that the counterparty will repurchase such securities. In connection with transactions in repurchase agreements, a bank as custodian for the Fund takes possession of the underlying securities which are held as collateral, with a market value at least equal to the amount of the repurchase transaction, including principal and accrued interest. To the extent that any repurchase transaction exceeds one business day, the value of the collateral is marked-to-market on a daily basis to determine that the value of the collateral does not decrease below the repurchase price plus accrued interest as earned. If such a decrease occurs, additional collateral will be requested and, when received, will be added to the account to maintain full collateralization. In the event of default on the obligation to repurchase, the Fund has the right to liquidate the collateral and apply the proceeds in satisfaction of the obligation. In the event of default or bankruptcy by the counterparty to the agreement, realization of the collateral proceeds may be subject to cost and delays. The Fund, along with other affiliated investment companies, may utilize a joint trading account for the purpose of entering into repurchase agreements.
4. Foreign Currency Translation and Foreign Investments: The books and records of the Fund are maintained in U.S. dollars. Foreign currency amounts are translated into U.S. dollars as follows:
– investments, other assets and liabilities at the prevailing rate of exchange on the valuation date;
– investment transactions and investment income at the prevailing rates of exchange on the dates of such transactions.
Although the net assets of the Fund are presented at the foreign exchange rates and market values at the close of the period, the Fund does not isolate that portion of the results of operations arising as a result of changes in the foreign exchange rates from the fluctuations arising from changes in the market prices of securities held at period end. Similarly, the Fund does not isolate the effect of changes in foreign exchange rates from the fluctuations arising from changes in the market prices of securities sold during the period. Accordingly, realized and unrealized foreign currency gains (losses) on investments in securities are included in the reported net realized and unrealized gains (losses) on investment transactions and balances. However, pursuant to U.S.
federal income tax regulations, gains and losses from certain foreign currency transactions and the foreign currency portion of gains and losses realized on sales and maturities of foreign denominated debt securities are treated as ordinary income for U.S. federal income tax purposes.
Net realized gains (losses) on foreign currency transactions represent net foreign exchange gains (losses) from foreign currency forward exchange contracts, disposition of foreign currencies, currency gains (losses) realized between the trade and settlement dates on securities transactions, and the difference between the amount of investment income and foreign withholding taxes recorded on the Fund's books and the U.S. dollar equivalent amounts actually received or paid. Net unrealized currency gains (losses) from valuing foreign currency denominated assets and liabilities at period end exchange rates are reflected as a component of unrealized appreciation (depreciation) in the Statement of Assets and Liabilities. The change in unrealized currency gains (losses) on foreign currency translations for the period is reflected in the Statement of Operations.
Foreign security and currency transactions may involve certain considerations and risks not typically associated with those of U.S. dollar denominated transactions as a result of, among other factors, fluctuations of exchange rates in relation to the U.S. dollar, the possibility of lower levels of governmental supervision and regulation of foreign securities markets and the possibility of political or economic instability.
Governmental approval for foreign investments may be required in advance of making an investment under certain circumstances in some countries, and the extent of foreign investments in domestic companies may be subject to limitation in other countries. Foreign ownership limitations also may be imposed by the charters of individual companies to prevent, among other concerns, violations of foreign investment limitations. As a result, an additional class of shares (identified as "Foreign" in the Portfolio of Investments) may be created and offered for investment. The "local" and "foreign shares" market values may differ. In the absence of trading of the foreign shares in such markets, the Fund values the foreign shares at the closing exchange price of the local shares.
5. Derivatives: The Fund may, but is not required to, use derivative instruments for a variety of purposes, including hedging, risk management, portfolio management or to earn income. Derivatives are financial instruments whose
22
Morgan Stanley Institutional Fund, Inc.
Annual Report — December 31, 2018
Notes to Financial Statements (cont'd)
value is based, in part, on the value of an underlying asset, interest rate, index or financial instrument. Prevailing interest rates and volatility levels, among other things, also affect the value of derivative instruments. A derivative instrument often has risks similar to its underlying asset and may have additional risks, including imperfect correlation between the value of the derivative and the underlying asset, risks of default by the counterparty to certain transactions, magnification of losses incurred due to changes in the market value of the securities, instruments, indices or interest rates to which the derivative instrument relates, risks that the transactions may not be liquid and risks arising from margin requirements. The use of derivatives involves risks that are different from, and possibly greater than, the risks associated with other portfolio investments. Derivatives may involve the use of highly specialized instruments that require investment techniques and risk analyses different from those associated with other portfolio investments. All of the Fund's holdings, including derivative instruments, are marked-to-market each day with the change in value reflected in unrealized appreciation (depreciation). Upon disposition, a realized gain or loss is recognized.
Certain derivative transactions may give rise to a form of leverage. Leverage magnifies the potential for gain and the risk of loss. Leverage associated with derivative transactions may cause the Fund to liquidate portfolio positions when it may not be advantageous to do so to satisfy its obligations or to meet earmarking or segregation requirements, pursuant to applicable Securities and Exchange Commission ("SEC") rules and regulations, or may cause the Fund to be more volatile than if the Fund had not been leveraged. Although the Adviser seeks to use derivatives to further the Fund's investment objectives, there is no assurance that the use of derivatives will achieve this result.
Following is a description of the derivative instruments and techniques that the Fund used during the period and their associated risks:
Options: With respect to options, the Fund is subject to equity risk, interest rate risk and foreign currency exchange risk in the normal course of pursuing its investment objectives. If the Fund buys an option, it buys a legal contract giving it the right to buy or sell a specific amount
of the underlying instrument or foreign currency, or futures contract on the underlying instrument or foreign currency, at an agreed-upon price during a period of time or on a specified date typically in exchange for a premium paid by the Fund. The Fund may purchase and/or sell put and call options. Purchasing call options tends to increase the Fund's exposure to the underlying (or similar) instrument. Purchasing put options tends to decrease the Fund's exposure to the underlying (or similar) instrument. When entering into purchased option contracts, the Fund bears the risk of interest or exchange rates or securities prices moving unexpectedly, in which case, the Fund may not achieve the anticipated benefits of the purchased option contracts; however the risk of loss is limited to the premium paid. Purchased options are reported as part of "Total Investments in Securities" in the Statement of Assets and Liabilities. Premiums paid for purchasing options which expired are treated as realized losses. If the Fund sells an option, it sells to another party the right to buy from or sell to the Fund a specific amount of the underlying instrument or foreign currency, or futures contract on the underlying instrument or foreign currency, at an agreed-upon price during a period of time or on a specified date typically in exchange for a premium received by the Fund. When options are purchased OTC, the Fund bears the risk that the counterparty that wrote the option will be unable or unwilling to perform its obligations under the option contract. Options may also be illiquid and the Fund may have difficulty closing out its position. A decision as to whether, when and how to use options involves the exercise of skill and judgment and even a well-conceived option transaction may be unsuccessful because of market behavior or unexpected events. The prices of options can be highly volatile and the use of options can lower total returns.
FASB ASC 815, "Derivatives and Hedging" ("ASC 815"), is intended to improve financial reporting about derivative instruments by requiring enhanced disclosures to enable investors to better understand how and why the Fund uses derivative instruments, how these derivative instruments are accounted for and their effects on the Fund's financial position and results of operations.
23
Morgan Stanley Institutional Fund, Inc.
Annual Report — December 31, 2018
Notes to Financial Statements (cont'd)
The following table sets forth the fair value of the Fund's derivative contracts by primary risk exposure as of December 31, 2018:
| | | Asset Derivatives
Statement of Assets and
Liabilities Location | | Primary Risk
Exposure | | Value
(000) | |
Purchased Options | | Investments, at Value
(Purchased Options) | | Currency Risk | | $ | 160 | (a) | |
(a) Amounts are included in Investments in Securities in the Statement of Assets and Liabilities.
The following tables set forth by primary risk exposure the Fund's realized gains (losses) and change in unrealized appreciation (depreciation) by type of derivative contract for the year ended December 31, 2018 in accordance with ASC 815:
Realized Gain (Loss) | |
Primary Risk Exposure | | Derivative Type | | Value
(000) | |
Currency Risk | | Investments
(Purchased Options) | | $ | (832 | )(b) | |
(b) Amounts are included in Investments Sold in the Statement of Operations.
Change in Unrealized Appreciation (Depreciation) | |
Primary Risk Exposure | | Derivative Type | | Value
(000) | |
Currency Risk | | Investments
(Purchased Options) | | $ | (1 | )(c) | |
(c) Amounts are included in Investments in the Statement of Operations.
At December 31, 2018, the Fund's derivative assets and liabilities are as follows:
Gross Amounts of Assets and Liabilities
Presented in the Statement of Assets and Liabilities | |
Derivatives | | Assets(d)
(000) | | Liabilities(d)
(000) | |
Purchased Options | | $ | 160 | (a) | | $ | — | | |
(a) Amounts are included in Investments in Securities in the Statement of Assets and Liabilities.
(d) Absent an event of default or early termination, OTC derivative assets and liabilities are presented gross and not offset in the Statement of Assets and Liabilities.
The Fund typically enters into International Swaps and Derivatives Association, Inc. Master Agreements ("ISDA Master Agreements") or similar master agreements (collectively, "Master Agreements") with its contract counterparties for certain OTC derivatives in order to, among other things, reduce its credit risk to counterparties. ISDA Master Agreements include provisions for general obligations, representations, collateral and events of default or termination. Under an ISDA Master Agreement, the Fund typically may offset with the counterparty certain OTC derivative financial
instruments' payables and/or receivables with collateral held and/or posted and create one single net payment (close-out netting) in the event of default, termination and/or potential deterioration in the credit quality of the counterparty. Various Master Agreements govern the terms of certain transactions with counterparties, including transactions such as swap, forward, repurchase and reverse repurchase agreements. These Master Agreements typically attempt to reduce the counterparty risk associated with such transactions by specifying credit protection mechanisms and providing standardization that improves legal certainty. Cross-termination provisions under Master Agreements typically provide that a default in connection with one transaction between the Fund and a counterparty gives the non-defaulting party the right to terminate any other transactions in place with the defaulting party to create one single net payment due to/due from the defaulting party and may be a feature in certain Master Agreements. In the event the Fund exercises its right to terminate a Master Agreement after a counterparty experiences a termination event as defined in the Master Agreement, the return of collateral with market value in excess of the Fund's net liability may be delayed or denied.
The following table presents derivative financial instruments that are subject to enforceable netting arrangements as of December 31, 2018:
Gross Amounts Not Offset in the Statement of Assets and Liabilities | |
Counterparty | | Gross Asset
Derivatives
Presented in the
Statement of
Assets and
Liabilities
(000) | | Financial
Instrument
(000) | | Collateral
Received(e)
(000) | | Net Amount
(not less
than $0)
(000) | |
Royal Bank of Scotland | | | 160 | (a) | | $ | — | | | $ | (160 | ) | | $ | 0 | | |
(a) Amounts are included in Investments in Securities in the Statement of Assets and Liabilities.
(e) In some instances, the actual collateral received may be more than the amount shown here due to overcollateralization.
For the year ended December 31, 2018, the approximate average monthly amount outstanding for each derivative type is as follows:
Purchased Options: | |
Average monthly notional amount | | | 238,881,000 | | |
6. Securities Lending: The Fund lends securities to qualified financial institutions, such as broker-dealers, to earn
24
Morgan Stanley Institutional Fund, Inc.
Annual Report — December 31, 2018
Notes to Financial Statements (cont'd)
additional income. Any increase or decrease in the fair value of the securities loaned that might occur and any interest earned or dividends declared on those securities during the term of the loan would remain in the Fund. The Fund would receive cash or securities as collateral in an amount equal to or exceeding 100% of the current fair value of the loaned securities. The collateral is marked-to-market daily by State Street Bank and Trust Company ("State Street"), the securities lending agent, to ensure that a minimum of 100% collateral coverage is maintained.
Based on pre-established guidelines, the securities lending agent invests any cash collateral that is received in an affiliated money market portfolio and repurchase agreements. Securities lending income is generated from the earnings on the invested collateral and borrowing fees, less any rebates owed to the borrowers and compensation to the lending agent, and is recorded as "Income from Securities Loaned — Net" in the Fund's Statement of Operations. Risks in securities lending transactions are that a borrower may not provide additional collateral when required or return the securities when due, and that the value of the short-term investments will be less than the amount of cash collateral plus any rebate that is required to be returned to the borrower.
The Fund has the right under the securities lending agreement to recover the securities from the borrower on demand.
The following table presents financial instruments that are subject to enforceable netting arrangements as of December 31, 2018:
Gross Amounts Not Offset in the Statement of Assets and Liabilities | |
Gross Asset
Amounts
Presented in the
Statement of
Assets and
Liabilities
(000) | | Financial
Instrument
(000) | | Collateral
Received
(000) | | Net Amount
(not less
than $0)
(000) | |
| $ | 53,519 | (f) | | $ | — | | | $ | (53,519 | )(g)(h) | | $ | 0 | | |
(f) Represents market value of loaned securities at year end.
(g) The Fund received cash collateral of approximately $32,036,000, of which approximately $31,840,000 was subsequently invested in Repurchase Agreements and Morgan Stanley Institutional Liquidity Funds as reported in the Portfolio of Investments. As of December 31, 2018, there was uninvested cash of approximately $196,000, which is not reflected in the Portfolio of Investments. In addition, the Fund received non-cash collateral of approximately $22,249,000 in the form of U.S. Government obligations, which the Fund cannot sell or repledge, and accordingly are not reflected in the Portfolio of Investments.
(h) The actual collateral received is greater than the amount shown here due to overcollateralization.
FASB ASC 860, "Transfers & Servicing: Repurchase-to-Maturity Transactions, Repurchase Financings, and Disclosures", is intended to provide increased transparency about the types of collateral pledged in securities lending transactions and other similar transactions that are accounted for as secured borrowing.
The following table displays a breakdown of transactions accounted for as secured borrowings, the gross obligations by class of collateral pledged and the remaining contractual maturity of those transactions as of December 31, 2018:
Remaining Contractual Maturity of the Agreements | |
| | | Overnight and
Continuous
(000) | | <30 days
(000) | | Between
30 &
90 days
(000) | | >90 days
(000) | | Total
(000) | |
Securities Lending
Transactions | |
Common Stocks | | $ | 32,036 | | | $ | — | | | $ | — | | | $ | — | | | $ | 32,036 | | |
Total Borrowings | | $ | 32,036 | | | $ | — | | | $ | — | | | $ | — | | | $ | 32,036 | | |
Gross amount of
recognized liabilities
for securities lending
transactions | | | | | | | | | | $ | 32,036 | | |
7. Restricted Securities: The Fund invests in unregistered or otherwise restricted securities. The term "restricted securities" refers to securities that are unregistered or are held by control persons of the issuer and securities that are subject to contractual restrictions on their resale. As a result, restricted securities may be more difficult to value and the Fund may have difficulty disposing of such assets either in a timely manner or for a reasonable price. In order to dispose of an unregistered security, the Fund, where it has contractual rights to do so, may have to cause such security to be registered. A considerable period may elapse between the time the decision is made to sell the security and the time the security is registered so that the Fund can sell it. Contractual restrictions on the resale of securities vary in length and scope and are generally the result of a negotiation between the issuer and the acquirer of the securities. The Fund would, in either case, bear market risks during that period. Restricted securities are identified in the Portfolio of Investments.
8. Redemption Fees: The Fund will assess a 2% redemption fee on Class I shares, Class A shares, Class L shares, Class C shares and Class IS shares, which is paid directly
25
Morgan Stanley Institutional Fund, Inc.
Annual Report — December 31, 2018
Notes to Financial Statements (cont'd)
to the Fund, for shares redeemed or exchanged within thirty days of purchase, subject to certain exceptions. The redemption fee is designed to protect the Fund and its remaining shareholders from the effects of short-term trading. These fees, if any, are included in the Statements of Changes in Net Assets.
9. Indemnifications: The Company enters into contracts that contain a variety of indemnifications. The Company's maximum exposure under these arrangements is unknown. However, the Company has not had prior claims or losses pursuant to these contracts and expects the risk of loss to be remote.
10. Dividends and Distributions to Shareholders: Dividends and distributions to shareholders are recorded on the ex-dividend date. Dividends from net investment income, if any, are declared and paid annually. Net realized capital gains, if any, are distributed at least annually.
11. Security Transactions, Income and Expenses: Security transactions are accounted for on the trade date (date the order to buy or sell is executed). Realized gains and losses on the sale of investment securities are determined on the specific identified cost method. Dividend income and other distributions are recorded on the ex-dividend date (except for certain foreign dividends which may be recorded as soon as the Fund is informed of such dividends) net of applicable withholding taxes. Interest income is recognized on the accrual basis except where collection is in doubt. Discounts are accreted and premiums are amortized over the life of the respective securities. Most expenses of the Company can be directly attributed to a particular Fund. Expenses which cannot be directly attributed are apportioned among the Funds based upon relative net assets or other appropriate methods. Income, expenses (other than class specific expenses — distribution and shareholder services, transfer agency and sub transfer agency fees) and realized and unrealized gains or losses are allocated to each class of shares based upon their relative net assets.
B. Advisory Fees: The Adviser, a wholly-owned subsidiary of Morgan Stanley, provides the Fund with advisory services under the terms of an Investment Advisory Agreement, paid quarterly, at the annual rate based on the daily net assets as follows:
First $1
billion | | Next $500
million | | Next $500
million | | Over $2
billion | |
| | 0.92 | % | | | 0.85 | % | | | 0.80 | % | | | 0.75 | % | |
For the year ended December 31, 2018, the advisory fee rate (net of waiver/rebate) was equivalent to an annual effective rate of 0.73% of the Fund's average daily net assets.
The Adviser has agreed to reduce its advisory fee and/or reimburse the Fund so that total annual portfolio operating expenses, excluding certain investment related expenses, taxes, interest and other extraordinary expenses (including litigation), will not exceed 1.00% for Class I shares, 1.35% for Class A shares, 1.85% for Class L shares, 2.10% for Class C shares and 0.93% for Class IS shares. The fee waivers and/or expense reimbursements will continue for at least one year from the date of the Fund's prospectus or until such time as the Directors act to discontinue all or a portion of such waivers and/or reimbursements when they deem such action is appropriate. For the year ended December 31, 2018, approximately $505,000 of advisory fees were waived and approximately $7,000 of other expenses were reimbursed by the Adviser pursuant to this arrangement.
C. Administration Fees: The Adviser also serves as Administrator to the Company and provides administrative services pursuant to an Administration Agreement for an annual fee, accrued daily and paid monthly, of 0.08% of the Fund's average daily net assets.
Under a Sub-Administration Agreement between the Administrator and State Street, State Street provides certain administrative services to the Company. For such services, the Administrator pays State Street a portion of the fee the Administrator receives from the Fund.
D. Distribution and Shareholder Services Fees: Morgan Stanley Distribution, Inc. ("MSDI" or the "Distributor"), a wholly-owned subsidiary of the Adviser and an indirect subsidiary of Morgan Stanley, serves as the Company's Distributor of Fund shares pursuant to a Distribution Agreement. The Company has adopted a Shareholder Services Plan with respect to Class A shares pursuant to Rule 12b-1 under the Act. Under the Shareholder Services Plan, the Fund pays the Distributor a shareholder services fee, accrued daily and paid monthly, at an annual rate of 0.25% of the Fund's average daily net assets attributable to Class A shares.
The Company has adopted a Distribution and Shareholder Services Plan with respect to Class L shares pursuant to Rule 12b-1 under the Act. Under the Distribution and Shareholder Services Plan, the Fund pays the Distributor a distribution fee, accrued daily and paid monthly, at an annual rate of 0.50% and a shareholder services fee, accrued daily and paid
26
Morgan Stanley Institutional Fund, Inc.
Annual Report — December 31, 2018
Notes to Financial Statements (cont'd)
monthly, at an annual rate of 0.25% of the Fund's average daily net assets attributable to Class L shares.
The Company has adopted a Distribution and Shareholder Services Plan with respect to Class C shares pursuant to Rule 12b-1 under the Act. Under the Distribution and Shareholder Services Plan, the Fund pays the Distributor a distribution fee, accrued daily and paid monthly, at an annual rate of 0.75% and a shareholder services fee, accrued daily and paid monthly, at an annual rate of 0.25% of the Fund's average daily net assets attributable to Class C shares.
The distribution and shareholder services fees are used to support the expenses associated with servicing and maintaining accounts. The Distributor may compensate other parties for providing shareholder support services to investors who purchase Class A, Class L and Class C shares.
E. Dividend Disbursing and Transfer Agent: The Company's dividend disbursing and transfer agent is DST Asset Manager Solutions, Inc. ("DST"). Pursuant to a Transfer Agency Agreement, the Company pays DST a fee based on the number of classes, accounts and transactions relating to the Funds of the Company.
F. Custodian Fees: State Street (the "Custodian") also serves as Custodian for the Company in accordance with a Custodian Agreement. The Custodian holds cash, securities and other assets of the Company as required by the Act. Custody fees are payable monthly based on assets held in custody, investment purchases and sales activity and account maintenance fees, plus reimbursement for certain out-of-pocket expenses.
G. Security Transactions and Transactions with Affiliates: For the year ended December 31, 2018, purchases and sales of investment securities for the Fund, other than long-term U.S. Government securities and short-term investments were approximately $211,748,000 and $341,796,000, respectively. There were no purchases and sales of long-term U.S. Government securities for the year ended December 31, 2018.
The Fund invests in the Institutional Class of the Morgan Stanley Institutional Liquidity Funds — Treasury Securities Portfolio (the "Liquidity Funds"), an open-end management investment company managed by the Adviser, both directly and as a portion of the securities held as collateral on loaned securities. Advisory fees paid by the Fund are reduced by an
amount equal to its pro-rata share of the advisory and administration fees paid by the Fund due to its investment in the Liquidity Funds. For the year ended December 31, 2018, advisory fees paid were reduced by approximately $20,000 relating to the Fund's investment in the Liquidity Funds.
A summary of the Fund's transactions in shares of affiliated investments during the year ended December 31, 2018 is as follows:
Affiliated
Investment
Company | | Value
December 31,
2017
(000) | | Purchases
at Cost
(000) | | Proceeds
from Sales
(000) | | Dividend
Income
(000) | |
Liquidity Funds | | $ | 38,053 | | | $ | 193,893 | | | $ | 205,465 | | | $ | 176 | | |
Affiliated
Investment
Company (cont'd) | | Realized
Gain
(Loss)
(000) | | Change in
Unrealized
Appreciation
(Depreciation)
(000) | | Value
December 31,
2018
(000) | |
Liquidity Funds | | $ | — | | | $ | — | | | $ | 26,481 | | |
During the year ended December 31, 2018, the Fund incurred approximately $1,000 in brokerage commissions with Morgan Stanley & Co. LLC, an affiliate of the Adviser/Administrator and Distributor, for portfolio transactions executed on behalf of the Fund.
The Fund is permitted to purchase and sell securities ("cross-trade") from and to other Morgan Stanley Funds as well as other funds and client accounts for which the Adviser or an affiliate of the Adviser serves as investment adviser, pursuant to procedures approved by the Directors in compliance with Rule 17a-7 under the Act (the "Rule"). Each cross-trade is executed at the current market price in compliance with provisions of the Rule. For the year ended December 31, 2018, the Fund engaged in cross-trade sales of approximately $4,502,000, which resulted in net realized gains of approximately $1,669,000.
The Fund has an unfunded Deferred Compensation Plan (the "Compensation Plan"), which allows each independent Director to defer payment of all, or a portion, of the fees he or she receives for serving on the Board of Directors. Each eligible Director generally may elect to have the deferred amounts credited with a return equal to the total return on one or more of the Morgan Stanley funds that are offered as investment options under the Compensation Plan. Appreciation/depreciation and distributions received from these investments are recorded with an offsetting increase/decrease in the deferred compensation obligation and do not affect the NAV of the Fund.
27
Morgan Stanley Institutional Fund, Inc.
Annual Report — December 31, 2018
Notes to Financial Statements (cont'd)
H. Federal Income Taxes: It is the Fund's intention to continue to qualify as a regulated investment company and distribute all of its taxable and tax-exempt income. Accordingly, no provision for Federal income taxes is required in the financial statements.
The Fund may be subject to taxes imposed by countries in which it invests. Such taxes are generally based on income and/or capital gains earned or repatriated. Taxes are accrued based on net investment income, net realized gains and net unrealized appreciation as such income and/or gains are earned. Taxes may also be based on transactions in foreign currency and are accrued based on the value of investments denominated in such currency.
FASB ASC 740-10, "Income Taxes — Overall", sets forth a minimum threshold for financial statement recognition of the benefit of a tax position taken or expected to be taken in a tax return. Management has concluded there are no significant uncertain tax positions that would require recognition in the financial statements. If applicable, the Fund recognizes interest accrued related to unrecognized tax benefits in "Interest Expense" and penalties in "Other Expenses" in the Statement of Operations. The Fund files tax returns with the U.S. Internal Revenue Service, New York and various states. Generally, each of the tax years in the four-year period ended December 31, 2018 remains subject to examination by taxing authorities.
The tax character of distributions paid may differ from the character of distributions for GAAP purposes due to short-term capital gains being treated as ordinary income for tax purposes. The tax character of distributions paid during fiscal years 2018 and 2017 was as follows:
2018
Distributions
Paid From: | | 2017
Distributions
Paid From: | |
Ordinary
Income
(000) | | Long-Term
Capital Gain
(000) | | Ordinary
Income
(000) | | Long-Term
Capital Gain
(000) | |
| $ | 9,040 | | | $ | 18,960 | | | $ | 27,098 | | | $ | 109,125 | | |
The amount and character of income and gains to be distributed are determined in accordance with income tax regulations which may differ from GAAP. These book/tax differences are either considered temporary or permanent in nature.
Temporary differences are primarily due to differing book and tax treatments in the timing of the recognition of gains (losses) on certain investment transactions and the timing of the deductibility of certain expenses.
Permanent differences, primarily due to equalization debits, resulted in the following reclassifications among the components of net assets at December 31, 2018:
Total
Accumulated
Loss
(000) | | Paid-in-
Capital
(000) | |
| $ | (7,162 | ) | | $ | 7,162 | | |
At December 31, 2018, the components of distributable earnings for the Fund on a tax basis were as follows:
Undistributed
Ordinary
Income
(000) | | Undistributed
Long-Term
Capital Gain
(000) | |
| $ | — | | | $ | 201 | | |
I. Credit Facility: The Company and other Morgan Stanley funds participated in a $150,000,000 committed, unsecured revolving line of credit facility (the "Facility") with State Street. This Facility is to be used for temporary emergency purposes or funding of shareholder redemption requests. The interest rate on borrowings is based on the federal funds rate or 1 month LIBOR rate plus a spread. The Facility also has a commitment fee of 0.25% per annum based on the unused portion of the Facility. During the year ended December 31, 2018, the Fund did not have any borrowings under the Facility.
J. Other: At December 31, 2018, the Fund had record owners of 10% or greater. Investment activities of these shareholders could have a material impact on the Fund. The aggregate percentage of such owners was 52.9%.
28
Morgan Stanley Institutional Fund, Inc.
Annual Report — December 31, 2018
Report of Independent Registered Public Accounting Firm
To the Shareholders and Board of Directors of
Morgan Stanley Institutional Fund, Inc. —
Small Company Growth Portfolio
Opinion on the Financial Statements
We have audited the accompanying statement of assets and liabilities of Small Company Growth Portfolio (the "Fund") (one of the funds constituting the Morgan Stanley Institutional Fund, Inc. (the "Company")), including the portfolio of investments, as of December 31, 2018, and the related statement of operations for the year then ended, the statements of changes in net assets for each of the two years in the period then ended, the financial highlights for each of the five years in the period then ended and the related notes (collectively referred to as the "financial statements"). In our opinion, the financial statements present fairly, in all material respects, the financial position of Small Company Growth Portfolio (one of the funds constituting Morgan Stanley Institutional Fund, Inc.) at December 31, 2018, the results of its operations for the year then ended, the changes in its net assets for each of the two years in the period then ended and its financial highlights for each of the five years in the period then ended, in conformity with U.S. generally accepted accounting principles.
Basis for Opinion
These financial statements are the responsibility of the Company's management. Our responsibility is to express an opinion on the Fund's financial statements based on our audits. We are a public accounting firm registered with the Public Company Accounting Oversight Board (United States) ("PCAOB") and are required to be independent with respect to the Company in accordance with the U.S. federal securities law and the applicable rules and regulations of the Securities and Exchange Commission and the PCAOB.
We conducted our audits in accordance with the standards of the PCAOB. Those standards require that we plan and perform the audit to obtain reasonable assurance about whether the financial statements are free of material misstatement, whether due to error or fraud. The Company is not required to have, nor were we engaged to perform, an audit of the Company's internal control over financial reporting. As part of our audits, we are required to obtain an understanding of internal control over financial reporting, but not for the purpose of expressing an opinion on the effectiveness of the Company's internal control over financial reporting. Accordingly, we express no such opinion.
Our audits included performing procedures to assess the risks of material misstatement of the financial statements, whether due to error or fraud, and performing procedures that respond to those risks. Such procedures included examining, on a test basis, evidence regarding the amounts and disclosures in the financial statements. Our procedures included confirmation of securities owned as of December 31, 2018 by correspondence with the custodian and others or by other appropriate auditing procedures where replies from others were not received. Our audits also included evaluating the accounting principles used and significant estimates made by management, as well as evaluating the overall presentation of the financial statements. We believe that our audits provide a reasonable basis for our opinion.

We have served as the auditor of one or more Morgan Stanley investment companies since 2000.
Boston, Massachusetts
February 26, 2019
29
Morgan Stanley Institutional Fund, Inc.
Annual Report — December 31, 2018
Federal Tax Notice (unaudited)
For federal income tax purposes, the following information is furnished with respect to the distributions paid by the Fund during its taxable year ended December 31, 2018. For corporate shareholders, 3.3% of the dividends qualified for the dividends received deduction.
The Fund designated and paid approximately $18,960,000 as a long-term capital gain distribution.
For federal income tax purposes, the following information is furnished with respect to the Fund's earnings for its taxable year ended December 31, 2018. When distributed, certain earnings may be subject to a maximum tax rate of 15% as provided for by the Jobs and Growth Tax Relief Reconciliation Act of 2003. The Fund designated up to a maximum of approximately $318,000 as taxable at this lower rate.
In January, the Fund provides tax information to shareholders for the preceding calendar year.
30
Morgan Stanley Institutional Fund, Inc.
Annual Report — December 31, 2018
Privacy Notice (unaudited)
MORGAN STANLEY INVESTMENT MANAGEMENT INC.
AN IMPORTANT NOTICE CONCERNING OUR U.S. PRIVACY POLICY
We are required by federal law to provide you with a copy of our privacy policy annually. This policy applies to current and former individual investors in funds managed or sponsored by Morgan Stanley Investment Management Inc. ("MSIM") as well as current and former individual clients of MSIM. This policy is not applicable to partnerships, corporations, trusts or other non-individual clients or investors. Please note that we may amend this policy at any time, and will inform you of any changes as required by law.
WE RESPECT YOUR PRIVACY
We appreciate that you have provided us with your personal financial information. We strive to maintain the privacy of such information while we help you achieve your financial objectives. This Notice describes what non-public personal information we collect about you, why we collect it, when we may share it with others and how certain others may use it. It discusses the steps you may take to limit our sharing of certain information about you to affiliated companies in the Morgan Stanley family of companies ("other Morgan Stanley companies"). It also discloses how you may limit use of certain shared information for marketing purposes by other Morgan Stanley branded companies. Throughout this policy, we refer to the non-public information that personally identifies you or your accounts as "personal information.''
1. WHAT PERSONAL INFORMATION DO WE COLLECT ABOUT YOU?
We obtain personal information from applications and other forms you submit to us, from your dealings with us, from consumer reporting agencies, from our Web sites and from third parties and other sources.
For example:
• We may collect information such as your name, address, e-mail address, telephone/fax numbers, assets, income and investment objectives through subscription documents, applications and other forms you submit to us.
• We may obtain information about account balances, your use of account(s) and the types of products and services you prefer to receive from us through your dealings and transactions with us and other sources.
• We may obtain information about your creditworthiness and credit history from consumer reporting agencies.
• We may collect background information from and through third-party vendors to verify representations you have made and to comply with various regulatory requirements.
• If you interact with us through our public and private Web sites, we may collect information that you provide directly through online communications (such as an e-mail address). We may also collect information about your Internet service provider, your domain name, your computer's operating system and Web browser, your use of our Web sites and your product and service preferences, through the use of "cookies." Please consult the Terms of Use of these sites for more details.
2. WHEN DO WE DISCLOSE PERSONAL INFORMATION WE COLLECT ABOUT YOU?
We may disclose personal information we collect about you to other Morgan Stanley companies and to non-affiliated third parties.
a. Information We Disclose to Other Morgan Stanley Companies.
We may disclose personal information to other Morgan Stanley companies for a variety of reasons, including to manage your account(s) effectively, to service and process your transactions, to let you know about products and services offered by us and other Morgan Stanley companies, to manage our business, and as otherwise required or permitted by law. Offers for products and services from other Morgan Stanley companies are developed under conditions designed to safeguard your personal information.
31
Morgan Stanley Institutional Fund, Inc.
Annual Report — December 31, 2018
Privacy Notice (unaudited) (cont'd)
b. Information We Disclose to Non-affiliated Third Parties.
We do not disclose personal information that we collect about you to non-affiliated third parties except to those who provide marketing services on our behalf, to financial institutions with whom we have joint marketing agreements, and as otherwise required or permitted by law. For example, we may disclose personal information to non-affiliated third parties for servicing and processing transactions, to offer our own products and services, to protect against fraud, for institutional risk control, to respond to judicial process or to perform services on our behalf. When we share personal information with a non-affiliated third party, they are required to limit their use of personal information to the particular purpose for which it was shared and they are not allowed to share personal information with others except to fulfill that limited purpose or as may be permitted or required by law.
3. HOW DO WE PROTECT THE SECURITY AND CONFIDENTIALITY OF PERSONAL INFORMATION WE COLLECT ABOUT YOU?
We maintain physical, electronic and procedural security measures to help safeguard the personal information we collect about you. We have internal policies governing the proper handling of client information. Third parties that provide support or marketing services on our behalf may also receive personal information, and we require them to adhere to confidentiality standards with respect to such information.
4. HOW CAN YOU LIMIT THE SHARING OF CERTAIN TYPES OF PERSONAL INFORMATION WITH OTHER MORGAN STANLEY COMPANIES?
We offer you choices as to whether we share with other Morgan Stanley companies the personal information that was collected to determine your eligibility for products and services you request ("eligibility information"). Eligibility information does not include your identification information or personal information pertaining to our transactions or experiences with you. Please note that, even if you direct us not to share eligibility information with other Morgan Stanley companies ("opt-out"), we may still share personal information, including eligibility information, with those companies in circumstances excluded from the opt-out under applicable law, such as to process transactions or to service your account.
5. HOW CAN YOU LIMIT THE USE OF CERTAIN TYPES OF PERSONAL INFORMATION BY OTHER MORGAN STANLEY COMPANIES FOR MARKETING?
By following the opt-out instructions in Section 6 below, you may limit other Morgan Stanley branded companies from marketing their products or services to you based on personal information we disclose to them. This information may include, for example, your income and account history with us. Please note that, even if you choose to limit Other Morgan Stanley Companies from using personal information about you that we may share with them for marketing their products and services to you, Other Morgan Stanley Companies may use your personal information that they obtain from us to market to you in circumstances permitted by law, such as if the Other Morgan Stanley Company has its own relationship with you.
6. HOW CAN YOU SEND US AN OPT-OUT INSTRUCTION?
If you wish to limit our sharing of eligibility information about you with other Morgan Stanley companies or other Morgan Stanley companies' use of personal information for marketing purposes, as described in this notice, you may do so by:
• Calling us at (800) 548-7786
Monday–Friday between 8a.m. and 6p.m.(EST)
• Writing to us at the following address:
DST Asset Manager Solutions, Inc.
c/o Privacy Coordinator
P.O. Box 219804
Kansas City, Missouri 64121
32
Morgan Stanley Institutional Fund, Inc.
Annual Report — December 31, 2018
Privacy Notice (unaudited) (cont'd)
Your written request should include your name, address, telephone number and account number(s) to which the opt-out applies and whether you are opting out with respect to sharing of eligibility information (Section 4 above), or if information used for Marketing (Section 5 above) or both. Written opt-out requests should not be sent with any other correspondence. In order to process your request, we require that the request be provided by you directly and not through a third party.
Your opt-out preference will remain in effect with respect to this policy (as it may be amended) until you notify us otherwise. If you have a joint account, your direction for us not to share this information with other Morgan Stanley companies and for those other Morgan Stanley companies not to use your personal information for marketing will be applied to all account holders on that account. Please understand that if you limit our sharing or our affiliated companies' use of personal information, you and any joint account holder(s) may not receive information about Morgan Stanley products and services, including products or services that could help you manage your financial resources and achieve your investment objectives.
7. WHAT IF AN AFFILIATED COMPANY BECOMES A NON-AFFILIATED THIRD PARTY?
If, at any time in the future, an affiliated company becomes a non-affiliated third party, further disclosures of personal information made to the former affiliated company will be limited to those described in Section 2(b) above relating to non-affiliated third parties. If you elected under Section 6 to limit disclosures we make to affiliated companies, or use of personal information by affiliated companies, your election will not apply to use by any former affiliated company of your personal information in their possession once it becomes a non-affiliated third party.
SPECIAL NOTICE TO RESIDENTS OF VERMONT
The following section supplements our policy with respect to our individual clients who have a Vermont address and supersedes anything to the contrary in the above policy with respect to those clients only.
The state of Vermont requires financial institutions to obtain your consent prior to sharing personal information that they collect about you with affiliated companies and non-affiliated third parties other than in certain limited circumstances. Except as permitted by law, we will not share personal information we collect about you with non-affiliated third parties or other Morgan Stanley companies unless you provide us with your written consent to share such information ("opt-in").
If you wish to receive offers for investment products and services offered by or through other Morgan Stanley companies, please notify us in writing at the following address:
DST Asset Manager Solutions, Inc.
c/o Privacy Coordinator
P.O. Box 219804
Kansas City, Missouri 64121
Your authorization should include your name, address, telephone number and account number(s) to which the opt-in applies and should not be sent with any other correspondence. In order to process your authorization, we require that the authorization be provided by you directly and not through a third party.
SPECIAL NOTICE TO RESIDENTS OF CALIFORNIA
The following section supplements our policy with respect to our individual clients who have a California address and supersedes anything to the contrary in the above policy with respect to those clients only.
In response to a California law, if your account has a California home address, your personal information will not be disclosed to non-affiliated third parties except as permitted by applicable California law, and we will limit sharing such information with our affiliates to comply with California privacy laws that apply to us.
33
Morgan Stanley Institutional Fund, Inc.
Annual Report — December 31, 2018
Director and Officer Information (unaudited)
Independent Directors:
Name, Age and Address of
Independent Director | | Position(s)
Held with
Registrant | | Length of Time
Served* | | Principal Occupation(s) During Past 5 Years
and Other Relevant Professional Experience | | Number of
Portfolios in
Fund Complex
Overseen by
Independent
Director** | | Other Directorships
Held by Independent
Director*** | |
Frank L. Bowman (74)
c/o Perkins Coie LLP
Counsel to the Independent
Directors
30 Rockefeller Plaza
New York, NY 10112 | | Director | | Since
August
2006 | | President, Strategic Decisions, LLC (consulting) (since February 2009); Director or Trustee of various Morgan Stanley Funds (since August 2006); Chairperson of the Compliance and Insurance Committee (since October 2015); formerly, Chairperson of the Insurance Sub-Committee of the Compliance and Insurance Committee (2007-2015); served as President and Chief Executive Officer of the Nuclear Energy Institute (policy organization) (February 2005-November 2008); retired as Admiral, U.S. Navy after serving over 38 years on active duty including 8 years as Director of the Naval Nuclear Propulsion Program in the Department of the Navy and the U.S. Department of Energy (1996-2004); served as Chief of Naval Personnel (July 1994-September 1996) and on the Joint Staff as Director of Political Military Affairs (June 1992-July 1994); knighted as Honorary Knight Commander of the Most Excellent Order of the British Empire; awarded the Officier de l'Orde National du Mérite by the French Government; elected to the National Academy of Engineering (2009). | | | 82 | | | Director of BP p.l.c.; Director of Naval and Nuclear Technologies LLP; Director Emeritus of the Armed Services YMCA; Member of the National Security Advisory Council of the Center for U.S. Global Engagement and a member of the CNA Military Advisory Board; Trustee of Fairhaven United Methodist Church; Member of the Board of Advisors of the Dolphin Scholarship Foundation; and Director of other various non-profit organizations. | |
Kathleen A. Dennis (65)
c/o Perkins Coie LLP
Counsel to the Independent Directors
30 Rockefeller Plaza
New York, NY 10112 | | Director | | Since
August
2006 | | President, Cedarwood Associates (mutual fund and investment management consulting) (since July 2006); Chairperson of the Liquidity and Alternatives Sub-Committee of the Investment Committee (since October 2006) and Director or Trustee of various Morgan Stanley Funds (since August 2006); formerly, Senior Managing Director of Victory Capital Management (1993-2006). | | | 82 | | | Director of various non-profit organizations. | |
Nancy C. Everett (63)
c/o Perkins Coie LLP
Counsel to the Independent Directors
30 Rockefeller Plaza
New York, NY 10112 | | Director | | Since
January
2015 | | Chief Executive Officer, Virginia Commonwealth University Investment Company (since November 2015); Owner, OBIR, LLC (institutional investment management consulting) (since June 2014); formerly, Managing Director, BlackRock Inc. (February 2011-December 2013); and Chief Executive Officer, General Motors Asset Management (a/k/a Promark Global Advisors, Inc.) (June 2005-May 2010). | | | 83 | | | Formerly, Member of Virginia Commonwealth University School of Business Foundation (2005-2016); Member of Virginia Commonwealth University Board of Visitors (2013-2015); Member of Committee on Directors for Emerging Markets Growth Fund, Inc. (2007-2010); Chairperson of Performance Equity Management, LLC (2006-2010); and Chairperson, GMAM Absolute Return Strategies Fund, LLC (2006-2010). | |
34
Morgan Stanley Institutional Fund, Inc.
Annual Report — December 31, 2018
Director and Officer Information (unaudited) (cont'd)
Independent Directors: (cont'd)
Name, Age and Address of
Independent Director | | Position(s)
Held with
Registrant | | Length of Time
Served* | | Principal Occupation(s) During Past 5 Years
and Other Relevant Professional Experience | | Number of
Portfolios in
Fund Complex
Overseen by
Independent
Director** | | Other Directorships
Held by Independent
Director*** | |
Jakki L. Haussler (61)
c/o Perkins Coie LLP
Counsel to the Independent Directors
30 Rockefeller Plaza
New York, NY 10112 | | Director | | Since
January
2015 | | Chairman and Chief Executive Officer, Opus Capital Group (since January 1996); formerly, Director, Capvest Venture Fund, LP (May 2000-December 2011); Partner, Adena Ventures, LP (July 1999-December 2010); Director, The Victory Funds (February 2005-July 2008). | | | 83 | | | Director of Service Corporation International and Member, Audit Committee and Investment Committee; Director of Cincinnati Bell Inc. and Member, Audit Committee and Governance and Nominating Committee; Chairman of Northern Kentucky University Member Investment Committee; Member of Chase College of Law Transactional Law Practice Center Board of Advisors; Director of Best Transport; Director of Chase College of Law Board of Visitors; formerly, Member, University of Cincinnati Foundation Investment Committee; Member, Miami University Board of Visitors (2008-2011); Trustee of Victory Funds(2005-2008) and Chairman, Investment Committee (2007-2008) and Member, Service Provider Committee (2005-2008). | |
Dr. Manuel H. Johnson (69)
c/o Johnson Smick
International, Inc.
220 I Street, NE — Suite 200
Washington, D.C. 20002 | | Director | | Since
July
1991 | | Senior Partner, Johnson Smick International, Inc. (consulting firm); Chairperson of the Investment Committee (since October 2006) and Director or Trustee of various Morgan Stanley Funds (since July 1991); Co-Chairman and a founder of the Group of Seven Council (G7C) (international economic commission); formerly, Chairperson of the Audit Committee (July 1991-September 2006), Vice Chairman of the Board of Governors of the Federal Reserve System and Assistant Secretary of the U.S. Treasury. | | | 82 | | | Director of NVR, Inc. (home construction). | |
Joseph J. Kearns (76)
c/o Perkins Coie LLP
Counsel to the Independent Directors
30 Rockefeller Plaza
New York, NY 10112 | | Director | | Since
August
1994 | | Senior Adviser, Kearns & Associates LLC (investment consulting); Chairperson of the Audit Committee (since October 2006) and Director or Trustee of various Morgan Stanley Funds (since August 1994); formerly, Deputy Chairperson of the Audit Committee (July 2003-September 2006) and Chairperson of the Audit Committee of various Morgan Stanley Funds (since August 1994); CFO of the J. Paul Getty Trust. | | | 83 | | | Prior to August 10, 2016, Director of Electro Rent Corporation (equipment leasing); Prior to December 31, 2013, Director of The Ford Family Foundation. | |
35
Morgan Stanley Institutional Fund, Inc.
Annual Report — December 31, 2018
Director and Officer Information (unaudited) (cont'd)
Independent Directors: (cont'd)
Name, Age and Address of
Independent Director | | Position(s)
Held with
Registrant | | Length of Time
Served* | | Principal Occupation(s) During Past 5 Years
and Other Relevant Professional Experience | | Number of
Portfolios in
Fund Complex
Overseen by
Independent
Director** | | Other Directorships
Held by Independent
Director*** | |
Michael F. Klein (60)
c/o Perkins Coie LLP
Counsel to the Independent Directors
30 Rockefeller Plaza
New York, NY 10112 | | Director | | Since
August
2006 | | Managing Director, Aetos Alternatives Management, LP (since March 2000); Co-President, Aetos Alternatives Management, LP (since January 2004) and Co-Chief Executive Officer of Aetos Alternatives Management, LP (since August 2013); Chairperson of the Fixed Income Sub-Committee of the Investment Committee (since October 2006) and Director or Trustee of various Morgan Stanley Funds (since August 2006); formerly, Managing Director, Morgan Stanley & Co. Inc. and Morgan Stanley Dean Witter Investment Management and President, various Morgan Stanley Funds (June 1998-March 2000); Principal, Morgan Stanley & Co. Inc. and Morgan Stanley Dean Witter Investment Management (August 1997-December 1999). | | | 82 | | | Director of certain investment funds managed or sponsored by Aetos Alternatives Management, LP; Director of Sanitized AG and Sanitized Marketing AG (specialty chemicals). | |
Patricia Maleski (58)
c/o Perkins Coie LLP
Counsel to the Independent Directors
30 Rockefeller Plaza
New York, NY 10112 | | Director | | Since
January
2017 | | Managing Director, JPMorgan Asset Management (2004-2016); Oversight and Control Head of Fiduciary and Conflicts of Interest Program (2015-2016); Chief Control Officer-Global Asset Management (2013-2015); President, JPMorgan Funds (2010-2013); Chief Administrative Officer (2004-2013); various other positions including Treasurer and Board Liaison (since 2001). | | | 83 | | | None. | |
Michael E. Nugent (82)
522 Fifth Avenue
New York, NY 10036 | | Chair of the Board and Director | | Chair of the Boards since July 2006 and Director since July 1991 | | Chair of the Boards of various Morgan Stanley Funds (since July 2006); Chairperson of the Closed-End Fund Committee (since June 2012) Governance Committee (since January 2019) and Director or Trustee of various Morgan Stanley Funds (since July 1991); formerly, Chairperson of the Insurance Committee (until July 2006); General Partner, Triumph Capital, L.P. (private investment partnership) (1988-2013). | | | 82 | | | None. | |
W. Allen Reed (71)
c/o Perkins Coie LLP
Counsel to the Independent Directors
30 Rockefeller Plaza
New York, NY 10112 | | Director | | Since
August
2006 | | Chairperson of the Equity Sub-Committee of the Investment Committee (since October 2006) and Director or Trustee of various Morgan Stanley Funds (since August 2006); formerly, President and CEO of General Motors Asset Management; Chairman and Chief Executive Officer of the GM Trust Bank and Corporate Vice President of General Motors Corporation (August 1994-December 2005). | | | 82 | | | Director of Legg Mason, Inc.; formerly, Director of the Auburn University Foundation (2010-2015). | |
Fergus Reid (86)****
c/o Joe Pietryka, Inc.
85 Charles Colman Blvd.
Pawling, NY 12564 | | Director | | Since
June
1992 | | Chairman, Joe Pietryka, Inc.; Chairperson of the Governance Committee and Director or Trustee of various Morgan Stanley Funds (since June 1992). | | | 83 | | | Formerly, Trustee and Director of certain investment companies in the JP Morgan Fund Complex managed by JP Morgan Investment Management Inc. (1987-2012). | |
* This is the earliest date the Director began serving the Morgan Stanley Funds. Each Director serves an indefinite term, until his or her successor is elected.
** The Fund Complex includes (as of December 31, 2018) all open-end and closed-end funds (including all of their portfolios) advised by Morgan Stanley Investment Management Inc. (the "Adviser") and any funds that have an adviser that is an affiliated person of the Adviser (including, but not limited to, Morgan Stanley AIP GP LP).
*** This includes any directorships at public companies and registered investment companies held by the Director at any time during the past five years.
**** Effective date of retirement is December 31, 2018.
36
Morgan Stanley Institutional Fund, Inc.
Annual Report — December 31, 2018
Director and Officer Information (unaudited) (cont'd)
Executive Officers:
Name, Age and Address of Executive Officer | | Position(s) Held
with
Registrant | | Length of Time
Served* | | Principal Occupation(s) During Past 5 Years | |
John H. Gernon (55)
522 Fifth Avenue
New York, NY 10036 | | President and Principal Executive Officer | | Since
September
2013 | | President and Principal Executive Officer of the Equity and Fixed Income Funds and the Morgan Stanley AIP Funds (since September 2013) and the Liquidity Funds and various money market funds (since May 2014) in the Fund Complex; Managing Director of the Adviser; Head of Product (since 2006). | |
Timothy J. Knierim (59)
522 Fifth Avenue
New York, NY 10036 | | Chief Compliance Officer | | Since
December
2016 | | Managing Director of the Adviser and various entities affiliated with the Adviser; Chief Compliance Officer of various Morgan Stanley Funds and the Adviser (since December 2016) and Chief Compliance Officer of Morgan Stanley AIP GP LP (since 2014). Formerly, Managing Director and Deputy Chief Compliance Officer of the Adviser (2014-2016); and formerly, Chief Compliance Officer of Prudential Investment Management, Inc. (2007-2014). | |
Francis J. Smith (53)
522 Fifth Avenue
New York, NY 10036 | | Treasurer and Principal Financial Officer | | Treasurer since July 2003 and Principal Financial Officer since September 2002 | | Managing Director of the Adviser and various entities affiliated with the Adviser; Treasurer (since July 2003) and Principal Financial Officer of various Morgan Stanley Funds (since September 2002). | |
Mary E. Mullin (51)
522 Fifth Avenue
New York, NY 10036 | | Secretary | | Since
June
1999 | | Managing Director of the Adviser; Secretary of various Morgan Stanley Funds (since June 1999). | |
Michael J. Key (39)
522 Fifth Avenue
New York, NY 10036 | | Vice President | | Since
June
2017 | | Vice President of the Equity and Fixed Income Funds, Liquidity Funds, various money market funds and the Morgan Stanley AIP Funds in the Fund Complex (since June 2017); Executive Director of the Adviser; Head of Product Development for Equity and Fixed Income Funds (since August 2013). | |
* This is the earliest date the officer began serving the Morgan Stanley Funds. Each officer serves a one-year term, until his or her successor is elected and qualifies.
37
Morgan Stanley Institutional Fund, Inc.
Annual Report — December 31, 2018
Adviser and Administrator
Morgan Stanley Investment Management Inc.
522 Fifth Avenue
New York, New York 10036
Distributor
Morgan Stanley Distribution, Inc.
522 Fifth Avenue
New York, New York 10036
Dividend Disbursing and Transfer Agent
DST Asset Manager Solutions, Inc.
2000 Crown Colony Drive
Quincy, Massachusetts 02169
Custodian
State Street Bank and Trust Company
One Lincoln Street
Boston, Massachusetts 02111
Legal Counsel
Dechert LLP
1095 Avenue of the Americas
New York, New York 10036
Counsel to the Independent Directors
Perkins Coie LLP
30 Rockefeller Plaza
New York, New York 10112
Independent Registered Public Accounting Firm
Ernst & Young LLP
200 Clarendon Street
Boston, Massachusetts 02116
Reporting to Shareholders
Each Morgan Stanley fund provides a complete schedule of portfolio holdings in its semi-annual and the annual reports within 60 days of the end of the fund's second and fourth fiscal quarters. The semi-annual and annual reports are filed electronically with the Securities and Exchange Commission ("SEC") on Form N-CSRS and Form N-CSR, respectively. Morgan Stanley also delivers the semi-annual and annual reports to fund shareholders and makes these reports available on its public website, www.morganstanley.com/im/shareholderreports. Each Morgan Stanley fund also files a complete schedule of portfolio holdings with the SEC for the fund's first and third fiscal quarters on Form N-Q. Morgan Stanley does not deliver the reports for the first and third fiscal quarters to shareholders, nor are the reports posted to the Morgan Stanley public website. You may, however, obtain the Form N-Q filings (as well as the Form N-CSR and N-CSRS filings) by accessing the SEC's website, www.sec.gov. You can also request copies of these materials, upon payment of a duplicating fee, by electronic request at the SEC's email address (publicinfo@sec.gov).
Proxy Voting Policies and Procedures and Proxy Voting Record
You may obtain a copy of the Company's Proxy Voting Policy and Procedures and information regarding how the Company voted proxies relating to portfolio securities during the most recent twelve-month period ended June 30, without charge, upon request, by calling toll free 1 (800) 548-7786 or by visiting our website at www.morganstanley.com/im/shareholderreports. This information is also available on the SEC's website at www.sec.gov.
This report is authorized for distribution only when preceded or accompanied by a prospectus or summary prospectus of the applicable Fund of Morgan Stanley Institutional Fund, Inc., which describes in detail the Fund's investment policies, risks, fees and expenses. Please read the prospectus carefully before you invest or send money. For additional information, including information regarding the investments comprising the Fund, please visit our website at www.morganstanley.com/im/shareholderreports or call toll free 1 (800) 548-7786.
38
Printed in U.S.A.
This Report has been prepared for shareholders and may be distributed to others only if preceded or accompanied by a current prospectus.
Morgan Stanley Investment Management Inc.
522 Fifth Avenue
New York, New York 10036
© 2019 Morgan Stanley. Morgan Stanley Distribution, Inc.

IFISCGANN
2398617 EXP. 02.29.20

Morgan Stanley Institutional Fund, Inc.
US Core Portfolio
Annual Report
December 31, 2018
Beginning on January 1, 2021, as permitted by regulations adopted by the Securities and Exchange Commission ("SEC"), paper copies of the Fund's Annual and Semi-Annual Reports to Shareholders ("Shareholder Reports") will no longer be sent by mail, unless you specifically request paper copies of the Shareholder Reports from the Fund or from your financial intermediary, such as a broker-dealer or a bank. Instead, the Shareholder Reports will be made available on the Fund's website, https://www.morganstanley.com/im/shareholderreports and you will be notified by mail each time a Shareholder Report is posted and provided with a website link to access the Shareholder Report. If you already elected to receive Shareholder Reports electronically, you will not be affected by this change and you need not take any action. You may elect to receive Shareholder Reports and other communications from the Fund electronically anytime by contacting your financial intermediary or, if you are a direct investor, please follow the instructions on the envelope.
Beginning on January 1, 2019, you may elect to receive all future Shareholder Reports in paper free of charge. If you invest through a financial intermediary, you can contact your financial intermediary to request that you continue to receive paper copies of your Shareholder Reports. If you invest directly with the Fund, please follow the instructions on the envelope to let the Fund know you wish to continue receiving paper copies of your Shareholder Reports. Your election to receive Shareholder Reports in paper will apply to all funds held in your account if you invest through your financial intermediary or all funds held with the fund complex if you invest directly with a fund.

Morgan Stanley Institutional Fund, Inc.
Annual Report — December 31, 2018
Shareholders' Letter | | | 2 | | |
Expense Example | | | 3 | | |
Investment Overview | | | 4 | | |
Portfolio of Investments | | | 6 | | |
Statement of Assets and Liabilities | | | 7 | | |
Statement of Operations | | | 8 | | |
Statements of Changes in Net Assets | | | 9 | | |
Financial Highlights | | | 11 | | |
Notes to Financial Statements | | | 15 | | |
Report of Independent Registered Public Accounting Firm | | | 20 | | |
Federal Tax Notice | | | 21 | | |
Privacy Notice | | | 22 | | |
Director and Officer Information | | | 25 | | |
This report is authorized for distribution only when preceded or accompanied by a prospectus or summary prospectus of the applicable Fund of Morgan Stanley Institutional Fund, Inc. To receive a prospectus and/or statement of additional information (SAI), which contains more complete information such as investment objectives, charges, expenses, policies for voting proxies, risk considerations and describes in detail each of the Fund's investment policies to the prospective investor, please call toll free 1 (800) 548-7786. Please read the prospectuses carefully before you invest or send money.
Additionally, you can access information about the Fund, including performance, characteristics and investment team commentary, through Morgan Stanley Investment Management's website: www.morganstanley.com/im/shareholderreports.
Market forecasts provided in this report may not necessarily come to pass. There is no guarantee that any sectors mentioned will continue to perform as discussed herein or that securities in such sectors will be held by the Fund in the future. There is no assurance that a fund will achieve its investment objective. Funds are subject to market risk, which is the possibility that market values of securities owned by the Fund will decline and, therefore, the value of the Fund's shares may be less than what you paid for them. Accordingly, you can lose money investing in this Fund. Please see the prospectus for more complete information on investment risks.
1
Morgan Stanley Institutional Fund, Inc.
Annual Report — December 31, 2018
Shareholders' Letter (unaudited)
Dear Shareholders,
We are pleased to provide this Annual report, in which you will learn how your investment in US Core Portfolio (the "Fund") performed during the latest twelve-month period.
Morgan Stanley Investment Management is a client-centric, investor-led organization. Our global presence, intellectual capital, and breadth of products and services enable us to partner with investors to meet the evolving challenges of today's financial markets. We aim to deliver superior investment service and to empower our clients to make the informed decisions that help them reach their investment goals.
As always, we thank you for selecting Morgan Stanley Investment Management, and look forward to working with you in the months and years ahead.
Sincerely,

John H. Gernon
President and Principal Executive Officer
January 2019
2
Morgan Stanley Institutional Fund, Inc.
Annual Report — December 31, 2018
Expense Example (unaudited)
US Core Portfolio
As a shareholder of the Fund, you incur two types of costs: (1) transactional costs; and (2) ongoing costs, which may include advisory fees, administration fees, distribution and shareholder services fees and other Fund expenses. This example is intended to help you understand your ongoing costs (in dollars) of investing in the Fund and to compare these costs with the ongoing costs of investing in other mutual funds.
This example is based on an investment of $1,000 invested at the beginning of the six-month period ended December 31, 2018 and held for the entire six-month period.
Actual Expenses
The table below provides information about actual account values and actual expenses. You may use the information in this table, together with the amount you invested, to estimate the expenses that you paid over the period. Simply divide your account value by $1,000 (for example, an $8,600 account value divided by $1,000 = 8.6), then multiply the result by the number in the table under the heading entitled "Actual Expenses Paid During Period" to estimate the expenses you paid on your account during this period.
Hypothetical Example for Comparison Purposes
The table below provides information about hypothetical account values and hypothetical expenses based on the Fund's actual expense ratio and an assumed rate of return of 5% per year before expenses, which is not the Fund's actual return. The hypothetical account values and expenses may not be used to estimate the actual ending account balance or expenses you paid for the period. You may use this information to compare the ongoing costs of investing in the Fund and other funds. To do so, compare this 5% hypothetical example with the 5% hypothetical examples that appear in the shareholder reports of the other funds.
Please note that the expenses shown in the table are meant to highlight your ongoing costs only and do not reflect any transactional costs, such as sales charges (loads). Therefore, the information for each class in the table is useful in comparing ongoing costs only, and will not help you determine the relative total costs of owning different funds. In addition, if these transactional costs were included, your costs would have been higher.
| | | Beginning
Account
Value
7/1/18 | | Actual Ending
Account
Value
12/31/18 | | Hypothetical
Ending Account
Value | | Actual
Expenses
Paid
During
Period* | | Hypothetical
Expenses Paid
During Period* | | Net
Expense
Ratio
During
Period** | |
US Core Portfolio Class I | | $ | 1,000.00 | | | $ | 892.90 | | | $ | 1,021.22 | | | $ | 3.77 | | | $ | 4.02 | | | | 0.79 | % | |
US Core Portfolio Class A | | | 1,000.00 | | | | 890.10 | | | | 1,019.41 | | | | 5.48 | | | | 5.85 | | | | 1.15 | | |
US Core Portfolio Class C | | | 1,000.00 | | | | 887.80 | | | | 1,015.63 | | | | 9.04 | | | | 9.65 | | | | 1.90 | | |
US Core Portfolio Class IS | | | 1,000.00 | | | | 892.50 | | | | 1,021.42 | | | | 3.58 | | | | 3.82 | | | | 0.75 | | |
* Expenses are calculated using each Fund Class' annualized net expense ratio (as disclosed), multiplied by the average account value over the period and multiplied by 184/365 (to reflect the most recent one-half year period).
** Annualized.
3
Morgan Stanley Institutional Fund, Inc.
Annual Report — December 31, 2018
Investment Overview (unaudited)
US Core Portfolio
The Fund seeks long-term capital appreciation.
Performance
For the fiscal year ended December 31, 2018, the Fund's Class I shares had a total return based on net asset value and reinvestment of distributions per share of –11.00%, net of fees. The Fund's Class I shares underperformed the Fund's benchmark, the S&P 500® Index (the "Index"), which returned –4.38%.
Factors Affecting Performance
• The volatility of relative performance of style and sectors has been extreme in 2018. Growth rocketed until late summer and then got crushed thereafter. Defensives were very out-of-favor while growth worked, and then they were the big winners thereafter. While from a strategic perspective, the team made many of the right calls about these extremes reverting, the speed of these swings was difficult to navigate from a portfolio implementation perspective, at least initially. Our models have an imbedded lag before adjusting factor weightings. This allows us to confirm persistence for a potential style rotation. The lag resulted in a gap in performance relative to the benchmark. However, though a painful year on both an absolute and relative basis, we are seeing signs as we enter 2019 that our models have begun to lock in what is working.
• Early in the year, through the first correction in February, the Fund outperformed the S&P 500® Index benchmark. The portfolio was overweight growth stocks, but the market's subsequent recovery was led by an extremely narrow group of mega-cap growth stocks, mostly the "FAANGs" (Facebook, Apple, Amazon, Netflix and Google). In spite of some exposure to those names, the portfolio was underweight versus a broader universe of growth exposures. Although that was correct positioning from a risk perspective, the lack of mega-cap tech exposure negatively impacted performance.
• By late summer, our quantitative models were signaling that the conditions underlying the significant outperformance of this group of mega-cap tech stocks, specifically that they were expensive and crowded — a dangerous combination, were setting up for a painful unwind. We further reduced exposure to technology, and this was a correct
decision, as mega-cap tech stocks sold off significantly in the fourth quarter.
• At the time when momentum growth stocks were expensive, both bond proxy stocks (high dividend-yielding) and value stocks were inexpensive and much unloved. The team made the decision to increase weightings in both areas.
• From a bond proxy perspective, the fact that this group was so inexpensive, while the momentum bucket was expensive, was a warning sign for a more defensive positioning to the Fund. There was too much euphoria for "hot" stocks. The team therefore increased exposure to both consumer staples and defensive health care names. This was another accurate call, as the market started to correct and the bond proxy stocks began to outperform.
• While increasing consumer staples was a decision that positively contributed to performance, the choice to not add uber-defensive positions in either utilities or telecommunications detracted. Traditionally, the team is not buyers of these sectors because they generally do not produce long-term winning stocks, which the team seeks to own. But with utilities being the best performing sector over the fourth quarter, the decision was very costly from a short-term performance perspective.
• In addition, the overreaction of financials and energy to recessionary fears made these value areas look attractive and we added to them. But increasing financials and energy negatively impacted performance in the reporting period. However, these areas have started to improve as recessionary fears have receded.
• Within stock selection, the largest detractors for the period were a financial services company, an international alcoholic beverage company impacted by potential for industry slowdown, a social media company, an industrial manufacturer that was impacted by trade concerns and a global investment bank. (These companies are all U.S.-based.)
• The Fund benefited the most from stock positions in a global payments and technology company, a leader in cloud infrastructure and digital workspace technology, a coffee company, a medical products manufacturer specializing in the dental industry, and a health care company specializing in
4
Morgan Stanley Institutional Fund, Inc.
Annual Report — December 31, 2018
Investment Overview (unaudited) (cont'd)
US Core Portfolio
inflammatory disorders and oncology. (These companies are all U.S.-based.)
Management Strategies
• There have been no changes to our investment process during the period. Applied Equity Advisors' investment process is comprised of two parts: a Factor Timing Engine and a Stock Selection Engine. The first step, the Factor Timing Engine, takes into account not only what market factors or areas of the market are in leadership, but also how much momentum a particular factor has, whether that factor is cheap or expensive, and whether the timing is right to be tilted toward that factor. The timing decision comes down to the team's judgment and our combined decades of experience in factor investing. The Stock Selection Engine begins its work once the desired factor positioning is understood. With regard to the Factor Timing Engine, investing in a particular area of the market that shows cheap historical valuation levels may not appear to be advantageous at first, but if chosen correctly, sticking with that investment often proves to be successful over the longer term. The result is a highly active portfolio of fundamentally attractive stocks which the team believes could benefit from what we have identified to be quantitative investment styles likely to outperform.
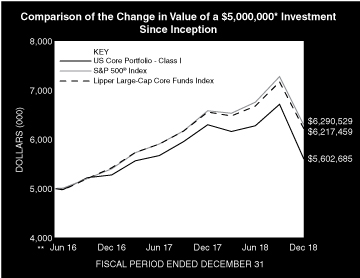
* Minimum Investment for Class I shares
** Commenced Operations on May 27, 2016.
In accordance with SEC regulations, the Fund's performance shown assumes that all recurring fees (including management fees) were deducted and all dividends and distributions were reinvested. The performance of Class A, C and IS shares will vary from the performance of Class I shares and will be negatively impacted by additional fees assessed to those classes (if applicable).
Performance Compared to the S&P 500® Index(1) and the Lipper Large-Cap Core Funds Index(2)
| | | Period Ended December 31, 2018
Total Returns(3) | |
| | | Average Annual | |
| | | One
Year | | Five
Years | | Ten
Years | | Since
Inception(5) | |
Fund — Class I Shares
w/o sales charges(4) | | | –11.00 | % | | | — | | | | — | | | | 4.48 | % | |
Fund — Class A Shares
w/o sales charges(4) | | | –11.35 | | | | — | | | | — | | | | 4.06 | | |
Fund — Class A Shares with
maximum 5.25% sales charges(4) | | | –16.03 | | | | — | | | | — | | | | 1.94 | | |
Fund — Class C Shares
w/o sales charges(4) | | | –11.94 | | | | — | | | | — | | | | 3.32 | | |
Fund — Class C Shares with
maximum 1.00% deferred sales
charges(4) | | | –12.81 | | | | — | | | | — | | | | 3.32 | | |
Fund — Class IS Shares
w/o sales charges(4) | | | –11.04 | | | | — | | | | — | | | | 4.48 | | |
S&P 500® Index | | | –4.38 | | | | — | | | | — | | | | 9.26 | | |
Lipper Large-Cap Core Funds Index | | | –5.13 | | | | — | | | | — | | | | 8.76 | | |
Performance data quoted represents past performance, which is no guarantee of future results, and current performance may be lower or higher than the figures shown. Performance assumes that all dividends and distributions, if any, were reinvested. For the most recent month-end performance figures, please visit www.morganstanley.com/im/shareholderreports. Investment return and principal value will fluctuate so that Fund shares, when redeemed, may be worth more or less than their original cost. Total returns do not reflect the deduction of taxes that a shareholder would pay on Fund distributions or the redemption of Fund shares. Performance of share classes will vary due to difference in sales charges and expenses.
(1) The Standard & Poor's 500® Index (S&P 500® Index) measures the performance of the large cap segment of the U.S. equities market, covering approximately 80% of the U.S. equities market. The Index includes 500 leading companies in leading industries of the U.S. economy. The Index is unmanaged and its returns do not include any sales charges or fees. Such costs would lower performance. It is not possible to invest directly in an index.
(2) The Lipper Large-Cap Core Funds Index is an equally weighted performance index of the largest qualifying funds (based on net assets) in the Lipper Large-Cap Core Funds classification. The Index, which is adjusted for capital gains distributions and income dividends, is unmanaged and should not be considered an investment. There are currently 30 funds represented in this Index. As of the date of this report, the Fund is in the Lipper Large-Cap Core Funds classification.
(3) Total returns for the Fund reflect fees waived and expenses reimbursed, if applicable, by Morgan Stanley Investment Management Inc. (the "Adviser"). Without such waivers and reimbursements, total returns would have been lower.
(4) Commenced operations on May 27, 2016.
(5) For comparative purposes, average annual since inception returns listed for the Indexes refer to the inception date of the Fund, not the inception of the Index.
5
Morgan Stanley Institutional Fund, Inc.
Annual Report — December 31, 2018
Portfolio of Investments
US Core Portfolio
| | | Shares | | Value
(000) | |
Common Stocks (98.8%) | |
Aerospace & Defense (3.6%) | |
Northrop Grumman Corp. | | | 1,605 | | | $ | 393 | | |
Banks (5.8%) | |
JPMorgan Chase & Co. | | | 6,450 | | | | 630 | | |
Beverages (8.8%) | |
Constellation Brands, Inc., Class A | | | 3,209 | | | | 516 | | |
Monster Beverage Corp. (a) | | | 9,094 | | | | 448 | | |
| | | | 964 | | |
Biotechnology (4.2%) | |
Amgen, Inc. | | | 2,351 | | | | 458 | | |
Capital Markets (6.0%) | |
Ameriprise Financial, Inc. | | | 1,997 | | | | 209 | | |
Goldman Sachs Group, Inc. (The) | | | 2,683 | | | | 448 | | |
| | | | 657 | | |
Chemicals (0.4%) | |
International Flavors & Fragrances, Inc. | | | 340 | | | | 46 | | |
Electrical Equipment (0.8%) | |
Emerson Electric Co. | | | 1,495 | | | | 89 | | |
Energy Equipment & Services (2.1%) | |
National Oilwell Varco, Inc. | | | 9,038 | | | | 232 | | |
Health Care Equipment & Supplies (5.6%) | |
Danaher Corp. | | | 5,943 | | | | 613 | | |
Health Care Providers & Services (8.0%) | |
Cigna Corp. (a) | | | 3,082 | | | | 585 | | |
CVS Health Corp. | | | 4,413 | | | | 289 | | |
| | | | 874 | | |
Hotels, Restaurants & Leisure (7.8%) | |
McDonald's Corp. | | | 2,171 | | | | 386 | | |
Starbucks Corp. | | | 7,243 | | | | 466 | | |
| | | | 852 | | |
Information Technology Services (8.1%) | |
Mastercard, Inc., Class A | | | 4,712 | | | | 889 | | |
Interactive Media & Services (2.8%) | |
Alphabet, Inc., Class A (a) | | | 288 | | | | 301 | | |
Machinery (3.5%) | |
Illinois Tool Works, Inc. | | | 2,986 | | | | 378 | | |
Media (0.6%) | |
Comcast Corp., Class A | | | 1,915 | | | | 65 | | |
Multi-Line Retail (1.5%) | |
Target Corp. | | | 2,515 | | | | 166 | | |
Oil, Gas & Consumable Fuels (6.7%) | |
Diamondback Energy, Inc. | | | 3,135 | | | | 291 | | |
Royal Dutch Shell PLC ADR (United Kingdom) | | | 7,626 | | | | 444 | | |
| | | | 735 | | |
Personal Products (6.6%) | |
Estee Lauder Cos., Inc. (The), Class A | | | 5,566 | | | | 724 | | |
| | | Shares | | Value
(000) | |
Software (10.7%) | |
Microsoft Corp. | | | 7,944 | | | $ | 807 | | |
VMware, Inc., Class A | | | 2,648 | | | | 363 | | |
| | | | 1,170 | | |
Tech Hardware, Storage & Peripherals (5.2%) | |
Apple, Inc. | | | 3,624 | | | | 572 | | |
Total Common Stocks (Cost $10,090) | | | 10,808 | | |
Short-Term Investment (3.1%) | |
Investment Company (3.1%) | |
Morgan Stanley Institutional Liquidity
Funds — Treasury Securities Portfolio —
Institutional Class (See Note G)
(Cost $341) | | | 341,324 | | | | 341 | | |
Total Investments (101.9%) (Cost $10,431) (b) | | | 11,149 | | |
Liabilities in Excess of Other Assets (–1.9%) | | | (210 | ) | |
| Net Assets (100.0%) | | $ | 10,939 | | |
(a) Non-income producing security.
(b) At December 31, 2018, the aggregate cost for federal income tax purposes is approximately $10,435,000. The aggregate gross unrealized appreciation is approximately $1,388,000 and the aggregate gross unrealized depreciation is approximately $674,000, resulting in net unrealized appreciation of approximately $714,000.
ADR American Depositary Receipt.
Portfolio Composition
Classification | | Percentage of
Total Investments | |
Other* | | | 22.1 | % | |
Software | | | 10.5 | | |
Beverages | | | 8.7 | | |
Information Technology Services | | | 8.0 | | |
Health Care Providers & Services | | | 7.8 | | |
Hotels, Restaurants & Leisure | | | 7.6 | | |
Oil, Gas & Consumable Fuels | | | 6.6 | | |
Personal Products | | | 6.5 | | |
Capital Markets | | | 5.9 | | |
Banks | | | 5.7 | | |
Health Care Equipment & Supplies | | | 5.5 | | |
Tech Hardware, Storage & Peripherals | | | 5.1 | | |
Total Investments | | | 100.0 | % | |
* Industries and/or investment types representing less than 5% of total investments.
The accompanying notes are an integral part of the financial statements.
6
Morgan Stanley Institutional Fund, Inc.
Annual Report — December 31, 2018
Statement of Assets and Liabilities | | December 31, 2018
(000) | |
Assets: | |
Investments in Securities of Unaffiliated Issuers, at Value (Cost $10,090) | | $ | 10,808 | | |
Investment in Security of Affiliated Issuer, at Value (Cost $341) | | | 341 | | |
Total Investments in Securities, at Value (Cost $10,431) | | | 11,149 | | |
Cash | | | 71 | | |
Receivable for Fund Shares Sold | | | 58 | | |
Due from Adviser | | | 38 | | |
Dividends Receivable | | | 5 | | |
Receivable from Affiliate | | | — | @ | |
Other Assets | | | 22 | | |
Total Assets | | | 11,343 | | |
Liabilities: | |
Payable for Fund Shares Redeemed | | | 332 | | |
Payable for Professional Fees | | | 59 | | |
Payable for Transfer Agency Fees — Class I | | | 1 | | |
Payable for Transfer Agency Fees — Class A | | | 1 | | |
Payable for Transfer Agency Fees — Class C | | | 1 | | |
Payable for Transfer Agency Fees — Class IS | | | — | @ | |
Payable for Shareholder Services Fees — Class A | | | — | @ | |
Payable for Distribution and Shareholder Services Fees — Class C | | | 1 | | |
Payable for Custodian Fees | | | 1 | | |
Payable for Administration Fees | | | 1 | | |
Payable for Sub Transfer Agency Fees — Class I | | | — | @ | |
Payable for Sub Transfer Agency Fees — Class A | | | — | @ | |
Payable for Sub Transfer Agency Fees — Class C | | | — | @ | |
Other Liabilities | | | 7 | | |
Total Liabilities | | | 404 | | |
Net Assets | | $ | 10,939 | | |
Net Assets Consist of: | |
Paid-in-Capital | | $ | 10,281 | | |
Total Distributable Earnings | | | 658 | | |
Net Assets | | $ | 10,939 | | |
CLASS I: | |
Net Assets | | $ | 7,532 | | |
| Shares Outstanding $0.001 par value shares of beneficial interest (unlimited shares authorized) (not in 000's) | | | 691,875 | | |
Net Asset Value, Offering and Redemption Price Per Share | | $ | 10.89 | | |
CLASS A: | |
Net Assets | | $ | 1,833 | | |
| Shares Outstanding $0.001 par value shares of beneficial interest (unlimited shares authorized) (not in 000's) | | | 168,687 | | |
Net Asset Value, Redemption Price Per Share | | $ | 10.86 | | |
Maximum Sales Load | | | 5.25 | % | |
Maximum Sales Charge | | $ | 0.60 | | |
Maximum Offering Price Per Share | | $ | 11.46 | | |
CLASS C: | |
Net Assets | | $ | 1,563 | | |
| Shares Outstanding $0.001 par value shares of beneficial interest (unlimited shares authorized) (not in 000's) | | | 146,084 | | |
Net Asset Value, Offering and Redemption Price Per Share | | $ | 10.70 | | |
CLASS IS: | |
Net Assets | | $ | 11 | | |
| Shares Outstanding $0.001 par value shares of beneficial interest (unlimited shares authorized) (not in 000's) | | | 1,000 | | |
Net Asset Value, Offering and Redemption Price Per Share | | $ | 10.88 | | |
@ Amount is less than $500.
The accompanying notes are an integral part of the financial statements.
7
Morgan Stanley Institutional Fund, Inc.
Annual Report — December 31, 2018
Statement of Operations | | Year Ended
December 31, 2018
(000) | |
Investment Income: | |
Dividends from Securities of Unaffiliated Issuers (Net of $2 of Foreign Taxes Withheld) | | $ | 210 | | |
Dividends from Security of Affiliated Issuer (Note G) | | | 2 | | |
Total Investment Income | | | 212 | | |
Expenses: | |
Professional Fees | | | 109 | | |
Advisory Fees (Note B) | | | 76 | | |
Registration Fees | | | 56 | | |
Shareholder Services Fees — Class A (Note D) | | | 5 | | |
Distribution and Shareholder Services Fees — Class C (Note D) | | | 18 | | |
Shareholder Reporting Fees | | | 13 | | |
Administration Fees (Note C) | | | 10 | | |
Transfer Agency Fees — Class I (Note E) | | | 2 | | |
Transfer Agency Fees — Class A (Note E) | | | 2 | | |
Transfer Agency Fees — Class C (Note E) | | | 2 | | |
Transfer Agency Fees — Class IS (Note E) | | | 2 | | |
Custodian Fees (Note F) | | | 6 | | |
Sub Transfer Agency Fees — Class I | | | 2 | | |
Sub Transfer Agency Fees — Class A | | | 1 | | |
Sub Transfer Agency Fees — Class C | | | 1 | | |
Directors' Fees and Expenses | | | 2 | | |
Pricing Fees | | | 2 | | |
Other Expenses | | | 12 | | |
Total Expenses | | | 323 | | |
Expenses Reimbursed by Adviser (Note B) | | | (117 | ) | |
Waiver of Advisory Fees (Note B) | | | (76 | ) | |
Reimbursement of Class Specific Expenses — Class A (Note B) | | | (— | @) | |
Reimbursement of Class Specific Expenses — Class C (Note B) | | | (— | @) | |
Reimbursement of Class Specific Expenses — Class IS (Note B) | | | (2 | ) | |
Rebate from Morgan Stanley Affiliate (Note G) | | | (— | @) | |
Net Expenses | | | 128 | | |
Net Investment Income | | | 84 | | |
Realized Gain: | |
Investments Sold | | | 298 | | |
Change in Unrealized Appreciation (Depreciation): | |
Investments | | | (1,769 | ) | |
Net Realized Gain and Change in Unrealized Appreciation (Depreciation) | | | (1,471 | ) | |
Net Decrease in Net Assets Resulting from Operations | | $ | (1,387 | ) | |
@ Amount is less than $500.
The accompanying notes are an integral part of the financial statements.
8
Morgan Stanley Institutional Fund, Inc.
Annual Report — December 31, 2018
Statements of Changes in Net Assets | | Year Ended
December 31, 2018
(000) | | Year Ended
December 31, 2017
(000) | |
Increase (Decrease) in Net Assets: | |
Operations: | |
Net Investment Income | | $ | 84 | | | $ | 53 | | |
Net Realized Gain (Loss) | | | 298 | | | | (195 | ) | |
Net Change in Unrealized Appreciation (Depreciation) | | | (1,769 | ) | | | 2,139 | | |
Net Increase (Decrease) in Net Assets Resulting from Operations | | | (1,387 | ) | | | 1,997 | | |
Dividends and Distributions to Shareholders: | |
Class I | | | (115 | ) | | | (34 | )* | |
Class A | | | (20 | ) | | | (1 | )* | |
Class C | | | (16 | ) | | | — | | |
Class IS | | | (— | @) | | | (— | @)* | |
Paid-in-Capital: | |
Class I | | | — | | | | (9 | ) | |
Class A | | | — | | | | (2 | ) | |
Class C | | | — | | | | — | | |
Class IS | | | — | | | | (— | @) | |
Total Dividends and Distributions to Shareholders | | | (151 | ) | | | (46 | ) | |
Capital Share Transactions:(1) | |
Class I: | |
Subscribed | | | 1,070 | | | | 408 | | |
Distributions Reinvested | | | 34 | | | | 13 | | |
Redeemed | | | (1,470 | ) | | | (173 | ) | |
Class A: | |
Subscribed | | | 503 | | | | 437 | | |
Distributions Reinvested | | | 19 | | | | 3 | | |
Redeemed | | | (315 | ) | | | (253 | ) | |
Class C: | |
Subscribed | | | 227 | | | | 254 | | |
Distributions Reinvested | | | 16 | | | | — | | |
Redeemed | | | (289 | ) | | | (65 | ) | |
Net Increase (Decrease) in Net Assets Resulting from Capital Share Transactions | | | (205 | ) | | | 624 | | |
Total Increase (Decrease) in Net Assets | | | (1,743 | ) | | | 2,575 | | |
Net Assets: | |
Beginning of Period | | | 12,682 | | | | 10,107 | | |
End of Period | | $ | 10,939 | | | $ | 12,682 | † | |
The accompanying notes are an integral part of the financial statements.
9
Morgan Stanley Institutional Fund, Inc.
Annual Report — December 31, 2018
Statements of Changes in Net Assets (cont'd) | | Year Ended
December 31, 2018
(000) | | Year Ended
December 31, 2017
(000) | |
(1) Capital Share Transactions: | |
Class I: | |
Shares Subscribed | | | 88 | | | | 37 | | |
Shares Issued on Distributions Reinvested | | | 3 | | | | 1 | | |
Shares Redeemed | | | (122 | ) | | | (15 | ) | |
Net Increase (Decrease) in Class I Shares Outstanding | | | (31 | ) | | | 23 | | |
Class A: | |
Shares Subscribed | | | 41 | | | | 39 | | |
Shares Issued on Distributions Reinvested | | | 2 | | | | — | @@ | |
Shares Redeemed | | | (26 | ) | | | (22 | ) | |
Net Increase in Class A Shares Outstanding | | | 17 | | | | 17 | | |
Class C: | |
Shares Subscribed | | | 20 | | | | 23 | | |
Shares Issued on Distributions Reinvested | | | 1 | | | | — | | |
Shares Redeemed | | | (24 | ) | | | (6 | ) | |
Net Increase (Decrease) in Class C Shares Outstanding | | | (3 | ) | | | 17 | | |
The following information was previously reported in the December 31, 2017 financial statements. The distribution information for the year ended December 31, 2017 presented on the Statements of Changes in Net Assets is presented for comparative purposes to the December 31, 2018 financial statements, which conform to the SEC Final Rule on Disclosure Update and Simplification which was effective November 5, 2018.
* Dividends and Distributions to Shareholders for the year ended December 31, 2017 were as follows:
Class I: | |
Net Investment Income | | $ | (34 | ) | |
Class A: | |
Net Investment Income | | $ | (1 | ) | |
Class IS: | |
Net Investment Income | | $ | (— | @) | |
† Distributions in Excess of Net Investment Income for the year ended December 31, 2017 was $(34).
@ Amount is less than $500.
@@ Amount is less than 500 shares.
The accompanying notes are an integral part of the financial statements.
10
Morgan Stanley Institutional Fund, Inc.
Annual Report — December 31, 2018
Financial Highlights
US Core Portfolio
| | | Class I | |
| | | Year Ended December 31, | | Period from
May 27, 2016(1) to | |
Selected Per Share Data and Ratios | | 2018 | | 2017 | | December 31, 2016 | |
Net Asset Value, Beginning of Period | | $ | 12.41 | | | $ | 10.45 | | | $ | 10.00 | | |
Income (Loss) from Investment Operations: | |
Net Investment Income(2) | | | 0.11 | | | | 0.08 | | | | 0.07 | | |
Net Realized and Unrealized Gain (Loss) | | | (1.47 | ) | | | 1.94 | | | | 0.48 | | |
Total from Investment Operations | | | (1.36 | ) | | | 2.02 | | | | 0.55 | | |
Distributions from and/or in Excess of: | |
Net Investment Income | | | (0.05 | ) | | | (0.05 | ) | | | (0.10 | ) | |
Net Realized Gain | | | (0.11 | ) | | | — | | | | — | | |
Paid-in-Capital | | | — | | | | (0.01 | ) | | | — | | |
Total Distributions | | | (0.16 | ) | | | (0.06 | ) | | | (0.10 | ) | |
Net Asset Value, End of Period | | $ | 10.89 | | | $ | 12.41 | | | $ | 10.45 | | |
Total Return(3) | | | (11.00 | )% | | | 19.33 | % | | | 5.50 | %(6) | |
Ratios and Supplemental Data: | |
Net Assets, End of Period (Thousands) | | $ | 7,532 | | | $ | 8,965 | | | $ | 7,314 | | |
Ratio of Expenses to Average Net Assets(8) | | | 0.80 | %(4) | | | 0.78 | %(4) | | | 0.77 | %(4)(7) | |
Ratio of Net Investment Income to Average Net Assets(8) | | | 0.86 | %(4) | | | 0.68 | %(4) | | | 1.12 | %(4)(7) | |
Ratio of Rebate from Morgan Stanley Affiliates to Average Net Assets | | | 0.00 | %(5) | | | 0.00 | %(5) | | | 0.00 | %(5)(7) | |
Portfolio Turnover Rate | | | 60 | % | | | 57 | % | | | 28 | %(6) | |
(8) Supplemental Information on the Ratios to Average Net Assets: | |
Ratios Before Expense Limitation: | |
Expenses to Average Net Assets | | | 2.31 | % | | | 2.78 | % | | | 3.62 | %(7) | |
Net Investment Loss to Average Net Assets | | | (0.65 | )% | | | (1.32 | )% | | | (1.73 | )%(7) | |
(1) Commencement of Operations.
(2) Per share amount is based on average shares outstanding.
(3) Calculated based on the net asset value as of the last business day of the period.
(4) The Ratios of Expenses and Net Investment Income reflect the rebate of certain Fund expenses in connection with the investments in Morgan Stanley affiliates during the period. The effect of the rebate on the ratios is disclosed in the above table as "Ratio of Rebate from Morgan Stanley Affiliates to Average Net Assets."
(5) Amount is less than 0.005%.
(6) Not annualized.
(7) Annualized.
The accompanying notes are an integral part of the financial statements.
11
Morgan Stanley Institutional Fund, Inc.
Annual Report — December 31, 2018
Financial Highlights
US Core Portfolio
| | | Class A | |
| | | Year Ended December 31, | | Period from
May 27, 2016(1) to | |
Selected Per Share Data and Ratios | | 2018 | | 2017 | | December 31, 2016 | |
Net Asset Value, Beginning of Period | | $ | 12.38 | | | $ | 10.44 | | | $ | 10.00 | | |
Income (Loss) from Investment Operations: | |
Net Investment Income(2) | | | 0.07 | | | | 0.04 | | | | 0.04 | | |
Net Realized and Unrealized Gain (Loss) | | | (1.47 | ) | | | 1.92 | | | | 0.49 | | |
Total from Investment Operations | | | (1.40 | ) | | | 1.96 | | | | 0.53 | | |
Distributions from and/or in Excess of: | |
Net Investment Income | | | (0.01 | ) | | | (0.01 | ) | | | (0.09 | ) | |
Net Realized Gain | | | (0.11 | ) | | | — | | | | — | | |
Paid-in-Capital | | | — | | | | (0.01 | ) | | | — | | |
Total Distributions | | | (0.12 | ) | | | (0.02 | ) | | | (0.09 | ) | |
Net Asset Value, End of Period | | $ | 10.86 | | | $ | 12.38 | | | $ | 10.44 | | |
Total Return(3) | | | (11.35 | )% | | | 18.80 | % | | | 5.30 | %(6) | |
Ratios and Supplemental Data: | |
Net Assets, End of Period (Thousands) | | $ | 1,833 | | | $ | 1,874 | | | $ | 1,406 | | |
Ratio of Expenses to Average Net Assets(8) | | | 1.15 | %(4) | | | 1.15 | %(4) | | | 1.15 | %(4)(7) | |
Ratio of Net Investment Income to Average Net Assets(8) | | | 0.55 | %(4) | | | 0.31 | %(4) | | | 0.66 | %(4)(7) | |
Ratio of Rebate from Morgan Stanley Affiliates to Average Net Assets | | | 0.00 | %(5) | | | 0.00 | %(5) | | | 0.00 | %(5)(7) | |
Portfolio Turnover Rate | | | 60 | % | | | 57 | % | | | 28 | %(6) | |
(8) Supplemental Information on the Ratios to Average Net Assets: | |
Ratios Before Expense Limitation: | |
Expenses to Average Net Assets | | | 2.68 | % | | | 3.23 | % | | | 4.12 | %(7) | |
Net Investment Loss to Average Net Assets | | | (0.98 | )% | | | (1.77 | )% | | | (2.31 | )%(7) | |
(1) Commencement of Operations.
(2) Per share amount is based on average shares outstanding.
(3) Calculated based on the net asset value which does not reflect sales charges, if applicable, as of the last business day of the period.
(4) The Ratios of Expenses and Net Investment Income reflect the rebate of certain Fund expenses in connection with the investments in Morgan Stanley affiliates during the period. The effect of the rebate on the ratios is disclosed in the above table as "Ratio of Rebate from Morgan Stanley Affiliates to Average Net Assets."
(5) Amount is less than 0.005%.
(6) Not annualized.
(7) Annualized.
The accompanying notes are an integral part of the financial statements.
12
Morgan Stanley Institutional Fund, Inc.
Annual Report — December 31, 2018
Financial Highlights
US Core Portfolio
| | | Class C | |
| | | Year Ended December 31, | | Period from
May 27, 2016(1) to | |
Selected Per Share Data and Ratios | | 2018 | | 2017 | | December 31, 2016 | |
Net Asset Value, Beginning of Period | | $ | 12.28 | | | $ | 10.41 | | | $ | 10.00 | | |
Income (Loss) from Investment Operations: | |
Net Investment Loss(2) | | | (0.03 | ) | | | (0.05 | ) | | | (0.00 | )(3) | |
Net Realized and Unrealized Gain (Loss) | | | (1.44 | ) | | | 1.92 | | | | 0.48 | | |
Total from Investment Operations | | | (1.47 | ) | | | 1.87 | | | | 0.48 | | |
Distributions from and/or in Excess of: | |
Net Investment Income | | | — | | | | — | | | | (0.07 | ) | |
Net Realized Gain | | | (0.11 | ) | | | — | | | | — | | |
Total Distributions | | | (0.11 | ) | | | — | | | | (0.07 | ) | |
Net Asset Value, End of Period | | $ | 10.70 | | | $ | 12.28 | | | $ | 10.41 | | |
Total Return(4) | | | (11.94 | )% | | | 17.96 | % | | | 4.79 | %(7) | |
Ratios and Supplemental Data: | |
Net Assets, End of Period (Thousands) | | $ | 1,563 | | | $ | 1,831 | | | $ | 1,377 | | |
Ratio of Expenses to Average Net Assets(9) | | | 1.90 | %(5) | | | 1.90 | %(5) | | | 1.90 | %(5)(8) | |
Ratio of Net Investment Loss to Average Net Assets(9) | | | (0.22 | )%(5) | | | (0.43 | )%(5) | | | (0.05 | )%(5)(8) | |
Ratio of Rebate from Morgan Stanley Affiliates to Average Net Assets | | | 0.00 | %(6) | | | 0.00 | %(6) | | | 0.00 | %(6)(8) | |
Portfolio Turnover Rate | | | 60 | % | | | 57 | % | | | 28 | %(7) | |
(9) Supplemental Information on the Ratios to Average Net Assets: | |
Ratios Before Expense Limitation: | |
Expenses to Average Net Assets | | | 3.44 | % | | | 3.94 | % | | | 4.99 | %(8) | |
Net Investment Loss to Average Net Assets | | | (1.76 | )% | | | (2.47 | )% | | | (3.14 | )%(8) | |
(1) Commencement of Operations.
(2) Per share amount is based on average shares outstanding.
(3) Amount is less than $0.005 per share.
(4) Calculated based on the net asset value which does not reflect sales charges, if applicable, as of the last business day of the period.
(5) The Ratios of Expenses and Net Investment Loss reflect the rebate of certain Fund expenses in connection with the investments in Morgan Stanley affiliates during the period. The effect of the rebate on the ratios is disclosed in the above table as "Ratio of Rebate from Morgan Stanley Affiliates to Average Net Assets."
(6) Amount is less than 0.005%.
(7) Not annualized.
(8) Annualized.
The accompanying notes are an integral part of the financial statements.
13
Morgan Stanley Institutional Fund, Inc.
Annual Report — December 31, 2018
Financial Highlights
US Core Portfolio
| | | Class IS | |
| | | Year Ended December 31, | | Period from
May 27, 2016(1) to | |
Selected Per Share Data and Ratios | | 2018 | | 2017 | | December 31, 2016 | |
Net Asset Value, Beginning of Period | | $ | 12.41 | | | $ | 10.45 | | | $ | 10.00 | | |
Income (Loss) from Investment Operations: | |
Net Investment Income(2) | | | 0.12 | | | | 0.08 | | | | 0.07 | | |
Net Realized and Unrealized Gain (Loss) | | | (1.48 | ) | | | 1.94 | | | | 0.48 | | |
Total from Investment Operations | | | (1.36 | ) | | | 2.02 | | | | 0.55 | | |
Distributions from and/or in Excess of: | |
Net Investment Income | | | (0.06 | ) | | | (0.01 | ) | | | (0.10 | ) | |
Net Realized Gain | | | (0.11 | ) | | | — | | | | — | | |
Paid-in-Capital | | | — | | | | (0.05 | ) | | | — | | |
Total Distributions | | | (0.17 | ) | | | (0.06 | ) | | | (0.10 | ) | |
Net Asset Value, End of Period | | $ | 10.88 | | | $ | 12.41 | | | $ | 10.45 | | |
Total Return(3) | | | (11.04 | )% | | | 19.37 | % | | | 5.52 | %(6) | |
Ratios and Supplemental Data: | |
Net Assets, End of Period (Thousands) | | $ | 11 | | | $ | 12 | | | $ | 10 | | |
Ratio of Expenses to Average Net Assets(8) | | | 0.75 | %(4) | | | 0.75 | %(4) | | | 0.75 | %(4)(7) | |
Ratio of Net Investment Income to Average Net Assets(8) | | | 0.92 | %(4) | | | 0.71 | %(4) | | | 1.17 | %(4)(7) | |
Ratio of Rebate from Morgan Stanley Affiliates to Average Net Assets | | | 0.00 | %(5) | | | 0.00 | %(5) | | | 0.00 | %(5)(7) | |
Portfolio Turnover Rate | | | 60 | % | | | 57 | % | | | 28 | %(6) | |
(8) Supplemental Information on the Ratios to Average Net Assets: | |
Ratios Before Expense Limitation: | |
Expenses to Average Net Assets | | | 16.44 | % | | | 19.96 | % | | | 19.22 | %(7) | |
Net Investment Loss to Average Net Assets | | | (14.77 | )% | | | (18.50 | )% | | | (17.30 | )%(7) | |
(1) Commencement of Operations.
(2) Per share amount is based on average shares outstanding.
(3) Calculated based on the net asset value as of the last business day of the period.
(4) The Ratios of Expenses and Net Investment Income reflect the rebate of certain Fund expenses in connection with the investments in Morgan Stanley affiliates during the period. The effect of the rebate on the ratios is disclosed in the above table as "Ratio of Rebate from Morgan Stanley Affiliates to Average Net Assets."
(5) Amount is less than 0.005%.
(6) Not annualized.
(7) Annualized.
The accompanying notes are an integral part of the financial statements.
14
Morgan Stanley Institutional Fund, Inc.
Annual Report — December 31, 2018
Notes to Financial Statements
Morgan Stanley Institutional Fund, Inc. (the "Company") is registered under the Investment Company Act of 1940, as amended (the "Act"), as an open-end management investment company. The Company is comprised of thirty separate, active, diversified and non-diversified funds (individually referred to as a "Fund", collectively as the "Funds"). The Company applies investment company accounting and reporting guidance.
The accompanying financial statements relate to the US Core Portfolio. The Fund seeks long-term capital appreciation.
The Fund offers four classes of shares — Class I, Class A, Class C and Class IS.
A. Significant Accounting Policies: The following significant accounting policies are in conformity with U.S. generally accepted accounting principles ("GAAP"). Such policies are consistently followed by the Company in the preparation of its financial statements. GAAP may require management to make estimates and assumptions that affect the reported amounts and disclosures in the financial statements. Actual results may differ from those estimates.
In August 2018, the Financial Accounting Standards Board ("FASB") issued Accounting Standards Update ("ASU") 2018-13, Fair Value Measurement (Topic 820) — Disclosures Framework — Changes to Disclosure Requirements of Fair Value Measurement ("ASU 2018-13") which introduces new fair value disclosure requirements as well as eliminates and modifies certain existing fair value disclosure requirements. ASU 2018-13 would be effective for fiscal years beginning after December 15, 2019 and for interim periods within those fiscal years; however, management has elected to early adopt ASU 2018-13 effective with the current reporting period as permitted by the standard. The impact of the Fund's adoption was limited to changes in the Fund's financial statement disclosures regarding fair value, primarily those disclosures related to transfers between levels of the fair value hierarchy and disclosure of the range and weighted average used to develop significant unobservable inputs for Level 3 fair value measurements, when applicable.
1. Security Valuation: (1) An equity portfolio security listed or traded on an exchange is valued at its latest reported sales price (or at the exchange official closing price if such exchange reports an official closing price), and if there were no sales on a given day and if there is no official exchange closing price for that day, the security is valued
at the mean between the last reported bid and asked prices if such bid and asked prices are available on the relevant exchanges. Listed equity securities not traded on the valuation date with no reported bid and asked prices available on the exchange are valued at the mean between the current bid and asked prices obtained from one or more reputable brokers or dealers. In cases where a security is traded on more than one exchange, the security is valued on the exchange designated as the primary market; (2) all other equity portfolio securities for which over-the-counter ("OTC") market quotations are readily available are valued at the latest reported sales price (or at the market official closing price if such market reports an official closing price), and if there was no trading in the security on a given day and if there is no official closing price from relevant markets for that day, the security is valued at the mean between the last reported bid and asked prices if such bid and asked prices are available on the relevant markets. An unlisted equity security that does not trade on the valuation date and for which bid and asked prices from the relevant markets are unavailable is valued at the mean between the current bid and asked prices obtained from one or more reputable brokers or dealers; (3) certain portfolio securities may be valued by an outside pricing service/vendor approved by the Company's Board of Directors (the "Directors"). The pricing service/vendor may employ a pricing model that takes into account, among other things, bids, yield spreads and/or other market data and specific security characteristics. Alternatively, if a valuation is not available from an outside pricing service/vendor, and the security trades on an exchange, the security may be valued at its latest reported sale price (or at the exchange official closing price if such exchange reports an official closing price), prior to the time when assets are valued. If there are no sales on a given day and if there is no official exchange closing price for that day, the security is valued at the mean between the last reported bid and asked prices if such bid and asked prices are available in the relevant exchanges; (4) when market quotations are not readily available, including circumstances under which Morgan Stanley Investment Management Inc. (the "Adviser") determines that the closing price, last sale price or the mean between the last reported bid and asked prices are not reflective of a security's market value, portfolio securities are valued at their fair value as determined in good
15
Morgan Stanley Institutional Fund, Inc.
Annual Report — December 31, 2018
Notes to Financial Statements (cont'd)
faith under procedures established by and under the general supervision of the Directors. Occasionally, developments affecting the closing prices of securities and other assets may occur between the times at which valuations of such securities are determined (that is, close of the foreign market on which the securities trade) and the close of business of the New York Stock Exchange ("NYSE"). If developments occur during such periods that are expected to materially affect the value of such securities, such valuations may be adjusted to reflect the estimated fair value of such securities as of the close of the NYSE, as determined in good faith by the Directors or by the Adviser using a pricing service and/or procedures approved by the Directors; and (5) investments in mutual funds, including the Morgan Stanley Institutional Liquidity Funds, are valued at the net asset value ("NAV") as of the close of each business day.
The Directors have responsibility for determining in good faith the fair value of the investments, and the Directors may appoint others, such as the Company's Adviser or a valuation committee, to assist the Directors in determining fair value and to make the actual calculations pursuant to the fair valuation methodologies previously approved by the Directors. Under procedures approved by the Directors, the Company's Adviser has formed a Valuation Committee whose members are approved by the Directors. The Valuation Committee provides administration and oversight of the Company's valuation policies and procedures, which are reviewed at least annually by the Directors. These procedures allow the Company to utilize independent pricing services, quotations from securities and financial instrument dealers and other market sources to determine fair value.
2. Fair Value Measurement: FASB Accounting Standards CodificationTM ("ASC") 820, "Fair Value Measurement" ("ASC 820"), defines fair value as the value that the Fund would receive to sell an investment or pay to transfer a liability in a timely transaction with an independent buyer in the principal market, or in the absence of a principal market, the most advantageous market for the
investment or liability. ASC 820 establishes a three-tier hierarchy to distinguish between (1) inputs that reflect the assumptions market participants would use in valuing an asset or liability developed based on market data obtained from sources independent of the reporting entity (observable inputs) and (2) inputs that reflect the reporting entity's own assumptions about the assumptions market participants would use in valuing an asset or liability developed based on the best information available in the circumstances (unobservable inputs) and to establish classification of fair value measurements for disclosure purposes. Various inputs are used in determining the value of the Fund's investments. The inputs are summarized in the three broad levels listed below:
• Level 1 – unadjusted quoted prices in active markets for identical investments
• Level 2 – other significant observable inputs (including quoted prices for similar investments, interest rates, prepayment speeds, credit risk, etc.)
• Level 3 – significant unobservable inputs including the Fund's own assumptions in determining the fair value of investments. Factors considered in making this determination may include, but are not limited to, information obtained by contacting the issuer, analysts, or the appropriate stock exchange (for exchange-traded securities), analysis of the issuer's financial statements or other available documents and, if necessary, available information concerning other securities in similar circumstances
The inputs or methodology used for valuing securities are not necessarily an indication of the risk associated with investing in those securities and the determination of the significance of a particular input to the fair value measurement in its entirety requires judgment and considers factors specific to each security.
16
Morgan Stanley Institutional Fund, Inc.
Annual Report — December 31, 2018
Notes to Financial Statements (cont'd)
The following is a summary of the inputs used to value the Fund's investments as of December 31, 2018:
Investment Type | | Level 1
Unadjusted
quoted
prices
(000) | | Level 2
Other
significant
observable
inputs
(000) | | Level 3
Significant
unobservable
inputs
(000) | | Total
(000) | |
Assets: | |
Common Stocks | |
Aerospace & Defense | | $ | 393 | | | $ | — | | | $ | — | | | $ | 393 | | |
Banks | | | 630 | | | | — | | | | — | | | | 630 | | |
Beverages | | | 964 | | | | — | | | | — | | | | 964 | | |
Biotechnology | | | 458 | | | | — | | | | — | | | | 458 | | |
Capital Markets | | | 657 | | | | — | | | | — | | | | 657 | | |
Chemicals | | | 46 | | | | — | | | | — | | | | 46 | | |
Electrical Equipment | | | 89 | | | | — | | | | — | | | | 89 | | |
Energy Equipment &
Services | | | 232 | | | | — | | | | — | | | | 232 | | |
Health Care
Equipment & Supplies | | | 613 | | | | — | | | | — | | | | 613 | | |
Health Care
Providers & Services | | | 874 | | | | — | | | | — | | | | 874 | | |
Hotels, Restaurants &
Leisure | | | 852 | | | | — | | | | — | | | | 852 | | |
Information Technology
Services | | | 889 | | | | — | | | | — | | | | 889 | | |
Interactive Media &
Services | | | 301 | | | | — | | | | — | | | | 301 | | |
Machinery | | | 378 | | | | — | | | | — | | | | 378 | | |
Media | | | 65 | | | | — | | | | — | | | | 65 | | |
Multi-Line Retail | | | 166 | | | | — | | | | — | | | | 166 | | |
Oil, Gas & Consumable
Fuels | | | 735 | | | | — | | | | — | | | | 735 | | |
Personal Products | | | 724 | | | | — | | | | — | | | | 724 | | |
Software | | | 1,170 | | | | — | | | | — | | | | 1,170 | | |
Tech Hardware,
Storage & Peripherals | | | 572 | | | | — | | | | — | | | | 572 | | |
Total Common Stocks | | | 10,808 | | | | — | | | | — | | | | 10,808 | | |
Short-Term Investment | |
Investment Company | | | 341 | | | | — | | | | — | | | | 341 | | |
Total Assets | | $ | 11,149 | | | $ | — | | | $ | — | | | $ | 11,149 | | |
Transfers between investment levels may occur as the markets fluctuate and/or the availability of data used in an investment's valuation changes.
3. Indemnifications: The Company enters into contracts that contain a variety of indemnifications. The Company's maximum exposure under these arrangements is unknown. However, the Company has not had prior claims or losses pursuant to these contracts and expects the risk of loss to be remote.
4. Dividends and Distributions to Shareholders: Dividends and distributions to shareholders are recorded on the ex-dividend date. Dividends from net investment income, if any, are declared and paid annually. Net realized capital gains, if any, are distributed at least annually.
5. Security Transactions, Income and Expenses: Security transactions are accounted for on the trade date (date the order to buy or sell is executed). Realized gains and losses on the sale of investment securities are determined on the specific identified cost method. Dividend income and other distributions are recorded on the ex-dividend date (except for certain foreign dividends which may be recorded as soon as the Fund is informed of such dividends) net of applicable withholding taxes. Interest income is recognized on the accrual basis except where collection is in doubt. Discounts are accreted and premiums are amortized over the life of the respective securities. Most expenses of the Company can be directly attributed to a particular Fund. Expenses which cannot be directly attributed are apportioned among the Funds based upon relative net assets or other appropriate methods. Income, expenses (other than class specific expenses — distribution and shareholder services, transfer agency and sub transfer agency fees) and realized and unrealized gains or losses are allocated to each class of shares based upon their relative net assets.
B. Advisory Fees: The Adviser, a wholly-owned subsidiary of Morgan Stanley, provides the Fund with advisory services under the terms of an Investment Advisory Agreement, paid quarterly, at the annual rate based on the daily net assets as follows:
First $750
million | | Next $750
million | | Over $1.5
billion | |
| | 0.60 | % | | | 0.55 | % | | | 0.50 | % | |
For the year ended December 31, 2018, the advisory fee rate (net of waiver/rebate) was equivalent to an annual effective rate of 0.00% of the Fund's average daily net assets.
The Adviser has agreed to reduce its advisory fee and/or reimburse the Fund so that total annual portfolio operating expenses, excluding certain investment related expenses, taxes, interest and other extraordinary expenses (including litigation), will not exceed 0.80% for Class I shares, 1.15% for Class A shares, 1.90% for Class C shares and 0.75% for Class IS shares. The fee waivers and/or expense reimbursements will continue for at least one year from the date of the Fund's prospectus or until such time as the Directors act to discontinue all or a portion of such waivers and/or reimbursements when they deem such action is appropriate. For the year ended December 31, 2018, approximately $76,000 of advisory fees were waived and approximately $119,000 of other expenses were reimbursed by the Adviser pursuant to this arrangement.
17
Morgan Stanley Institutional Fund, Inc.
Annual Report — December 31, 2018
Notes to Financial Statements (cont'd)
C. Administration Fees: The Adviser also serves as Administrator to the Company and provides administrative services pursuant to an Administration Agreement for an annual fee, accrued daily and paid monthly, of 0.08% of the Fund's average daily net assets.
Under a Sub-Administration Agreement between the Administrator and State Street Bank and Trust Company ("State Street"), State Street provides certain administrative services to the Company. For such services, the Administrator pays State Street a portion of the fee the Administrator receives from the Fund.
D. Distribution and Shareholder Services Fees: Morgan Stanley Distribution, Inc. ("MSDI" or the "Distributor"), a wholly-owned subsidiary of the Adviser and an indirect subsidiary of Morgan Stanley, serves as the Company's Distributor of Fund shares pursuant to a Distribution Agreement. The Company has adopted a Shareholder Services Plan with respect to Class A shares pursuant to Rule 12b-1 under the Act. Under the Shareholder Services Plan, the Fund pays the Distributor a shareholder services fee, accrued daily and paid monthly, at an annual rate of 0.25% of the Fund's average daily net assets attributable to Class A shares.
The Company has adopted a Distribution and Shareholder Services Plan with respect to Class C shares pursuant to Rule 12b-1 under the Act. Under the Distribution and Shareholder Services Plan, the Fund pays the Distributor a distribution fee, accrued daily and paid monthly, at an annual rate of 0.75% and a shareholder services fee, accrued daily and paid monthly, at an annual rate of 0.25% of the Fund's average daily net assets attributable to Class C shares.
The distribution and shareholder services fees are used to support the expenses associated with servicing and maintaining accounts. The Distributor may compensate other parties for providing shareholder support services to investors who purchase Class A and Class C shares.
E. Dividend Disbursing and Transfer Agent: The Company's dividend disbursing and transfer agent is DST Asset Manager Solutions, Inc. ("DST"). Pursuant to a Transfer Agency Agreement, the Company pays DST a fee based on the number of classes, accounts and transactions relating to the Funds of the Company.
F. Custodian Fees: State Street (the "Custodian") also serves as Custodian for the Company in accordance with a Custodian Agreement. The Custodian holds cash, securities and other assets of the Company as required by the Act.
Custody fees are payable monthly based on assets held in custody, investment purchases and sales activity and account maintenance fees, plus reimbursement for certain out-of-pocket expenses.
G. Security Transactions and Transactions with Affiliates: For the year ended December 31, 2018, purchases and sales of investment securities for the Fund, other than long-term U.S. Government securities and short-term investments were approximately $7,534,000 and $7,750,000, respectively. There were no purchases and sales of long-term U.S. Government securities for the year ended December 31, 2018.
The Fund invests in the Institutional Class of the Morgan Stanley Institutional Liquidity Funds — Treasury Securities Portfolio (the "Liquidity Funds"), an open-end management investment company managed by the Adviser. Advisory fees paid by the Fund are reduced by an amount equal to its pro-rata share of the advisory and administration fees paid by the Fund due to its investment in the Liquidity Funds. For the year ended December 31, 2018, advisory fees paid were reduced by less than $500 relating to the Fund's investment in the Liquidity Funds.
A summary of the Fund's transactions in shares of affiliated investments during the year ended December 31, 2018 is as follows:
Affiliated
Investment
Company | | Value
December 31,
2017
(000) | | Purchases
at Cost
(000) | | Proceeds
from Sales
(000) | | Dividend
Income
(000) | |
Liquidity Funds | | $ | 179 | | | $ | 2,393 | | | $ | 2,231 | | | $ | 2 | | |
Affiliated
Investment
Company (cont'd) | | Realized
Gain (Loss)
(000) | | Change in
Unrealized
Appreciation
(Depreciation)
(000) | | Value
December 31,
2018
(000) | |
Liquidity Funds | | $ | — | | | $ | — | | | $ | 341 | | |
The Fund is permitted to purchase and sell securities ("cross-trade") from and to other Morgan Stanley funds as well as other funds and client accounts for which the Adviser or an affiliate of the Adviser serves as investment adviser, pursuant to procedures approved by the Directors in compliance with Rule 17a-7 under the Act (the "Rule"). Each cross-trade is executed at the current market price in compliance with provisions of the Rule. For the year ended December 31, 2018, the Fund did not engage in any cross-trade transactions.
The Fund has an unfunded Deferred Compensation Plan (the "Compensation Plan"), which allows each independent Director to defer payment of all, or a portion, of the fees he or she
18
Morgan Stanley Institutional Fund, Inc.
Annual Report — December 31, 2018
Notes to Financial Statements (cont'd)
receives for serving on the Board of Directors. Each eligible Director generally may elect to have the deferred amounts credited with a return equal to the total return on one or more of the Morgan Stanley funds that are offered as investment options under the Compensation Plan. Appreciation/depreciation and distributions received from these investments are recorded with an offsetting increase/decrease in the deferred compensation obligation and do not affect the NAV of the Fund.
H. Federal Income Taxes: It is the Fund's intention to continue to qualify as a regulated investment company and distribute all of its taxable and tax-exempt income. Accordingly, no provision for federal income taxes is required in the financial statements.
The Fund may be subject to taxes imposed by countries in which it invests. Such taxes are generally based on income and/or capital gains earned or repatriated. Taxes are accrued based on net investment income, net realized gains and net unrealized appreciation as such income and/or gains are earned. Taxes may also be based on transactions in foreign currency and are accrued based on the value of investments denominated in such currency.
FASB ASC 740-10, "Income Taxes — Overall", sets forth a minimum threshold for financial statement recognition of the benefit of a tax position taken or expected to be taken in a tax return. Management has concluded there are no significant uncertain tax positions that would require recognition in the financial statements. If applicable, the Fund recognizes interest accrued related to unrecognized tax benefits in "Interest Expense" and penalties in "Other Expenses" in the Statement of Operations. The Fund files tax returns with the U.S. Internal Revenue Service, New York and various states. Generally, each of the tax years in the three-year period ended December 31, 2018 remains subject to examination by taxing authorities.
The tax character of distributions paid may differ from the character of distributions for GAAP purposes due to short-term capital gains being treated as ordinary income for tax purposes. The tax character of distributions paid during fiscal years 2018 and 2017 was as follows:
2018
Distributions
Paid From: | | 2017
Distributions
Paid From: | |
Ordinary
Income
(000) | | Long-Term
Capital
Gain
(000) | | Ordinary
Income
(000) | | Paid-in-
Capital
(000) | |
| $ | 40 | | | $ | 111 | | | $ | 35 | | | $ | 11 | | |
The amount and character of income and gains to be distributed are determined in accordance with income tax regulations which may differ from GAAP. These book/tax differences are either considered temporary or permanent in nature.
Temporary differences are primarily due to differing book and tax treatments in the timing of the recognition of gains (losses) on certain investment transactions and the timing of the deductibility of certain expenses.
Permanent differences, primarily due to a dividend redesignation, resulted in the following reclassifications among the components of net assets at December 31, 2018:
Total
Distributable
Earnings
(000) | | Paid-in-
Capital
(000) | |
| $ | (1 | ) | | $ | 1 | | |
At December 31, 2018, the components of distributable earnings for the Fund on a tax basis were as follows:
Undistributed
Ordinary
Income
(000) | | Undistributed
Long-Term
Capital Gain
(000) | |
| $ | 41 | | | $ | — | | |
During the year ended December 31, 2018, the Fund utilized capital loss carryforwards for U. S. federal income tax purposes of approximately $249,000.
Qualified late year losses are capital losses and specified ordinary losses, including currency losses, incurred after October 31 but within the taxable year that, if elected, are deemed to arise on the first day of the Fund's next taxable year. For the year ended December 31, 2018, the Fund intends to defer to January 1, 2019 for U.S. federal income tax purposes the following losses:
Qualified
Late Year
Ordinary
Losses
(000) | | Post-October
Capital
Losses
(000) | |
| $ | — | | | $ | 67 | | |
I. Credit Facility: The Company and other Morgan Stanley funds participated in a $150,000,000 committed, unsecured revolving line of credit facility (the "Facility") with State Street. This Facility is to be used for temporary emergency purposes or funding of shareholder redemption requests. The interest rate on borrowings is based on the federal funds rate or 1 month LIBOR rate plus a spread. The Facility also has a commitment fee of 0.25% per annum based on the unused portion of the Facility. During the year ended December 31, 2018, the Fund did not have any borrowings under the Facility.
J. Other: At December 31, 2018, the Fund had record owners of 10% or greater. Investment activities of these shareholders could have a material impact on the Fund. The aggregate percentage of such owners was 49.1%.
19
Morgan Stanley Institutional Fund, Inc.
Annual Report — December 31, 2018
Report of Independent Registered Public Accounting Firm
To the Shareholders and Board of Directors of
Morgan Stanley Institutional Fund, Inc. —
US Core Portfolio
Opinion on the Financial Statements
We have audited the accompanying statement of assets and liabilities of US Core Portfolio (the "Fund") (one of the funds constituting the Morgan Stanley Institutional Fund, Inc. (the "Company")), including the portfolio of investments, as of December 31, 2018, and the related statement of operations for the year then ended, the statements of changes in net assets for each of the two years in the period then ended and the financial highlights for each of the two years in the period then ended and the period from May 27, 2016 (commencement of operations) through December 31, 2016 and the related notes (collectively referred to as the "financial statements"). In our opinion, the financial statements present fairly, in all material respects, the financial position of US Core Portfolio (one of the funds constituting Morgan Stanley Institutional Fund, Inc.) at December 31, 2018, the results of its operations for the year then ended and the changes in its net assets for each of the two years in the period then ended and its financial highlights for each of the two years in the period then ended and the period from May 27, 2016 (commencement of operations) through December 31, 2016, in conformity with U.S. generally accepted accounting principles.
Basis for Opinion
These financial statements are the responsibility of the Company's management. Our responsibility is to express an opinion on the Fund's financial statements based on our audits. We are a public accounting firm registered with the Public Company Accounting Oversight Board (United States) ("PCAOB") and are required to be independent with respect to the Company in accordance with the U.S. federal securities law and the applicable rules and regulations of the Securities and Exchange Commission and the PCAOB.
We conducted our audits in accordance with the standards of the PCAOB. Those standards require that we plan and perform the audit to obtain reasonable assurance about whether the financial statements are free of material misstatement, whether due to error or fraud. The Company is not required to have, nor were we engaged to perform, an audit of the Company's internal control over financial reporting. As part of our audits, we are required to obtain an understanding of internal control over financial reporting, but not for the purpose of expressing an opinion on the effectiveness of the Company's internal control over financial reporting. Accordingly, we express no such opinion.
Our audits included performing procedures to assess the risks of material misstatement of the financial statements, whether due to error or fraud, and performing procedures that respond to those risks. Such procedures included examining, on a test basis, evidence regarding the amounts and disclosures in the financial statements. Our procedures included confirmation of securities owned as of December 31, 2018 by correspondence with the custodian and others or by other appropriate auditing procedures where replies from others were not received. Our audits also included evaluating the accounting principles used and significant estimates made by management, as well as evaluating the overall presentation of the financial statements. We believe that our audits provide a reasonable basis for our opinion.

We have served as the auditor of one or more Morgan Stanley investment companies since 2000.
Boston, Massachusetts
February 26, 2019
20
Morgan Stanley Institutional Fund, Inc.
Annual Report — December 31, 2018
Federal Tax Notice (unaudited)
For federal income tax purposes, the following information is furnished with respect to the distributions paid by the Fund during its taxable year ended December 31, 2018. For corporate shareholders, 100.0% of the dividends qualified for the dividends received deduction.
The Fund designated and paid approximately $111,000 as a long-term capital gain distribution.
For federal income tax purposes, the following information is furnished with respect to the Fund's earnings for its taxable year ended December 31, 2018. When distributed, certain earnings may be subject to a maximum tax rate of 15% as provided for by the Jobs and Growth Tax Relief Reconciliation Act of 2003. The Fund designated up to a maximum of approximately $40,000 as taxable at this lower rate.
In January, the Fund provides tax information to shareholders for the preceding calendar year.
21
Morgan Stanley Institutional Fund, Inc.
Annual Report — December 31, 2018
Privacy Notice (unaudited)
MORGAN STANLEY INVESTMENT MANAGEMENT INC.
AN IMPORTANT NOTICE CONCERNING OUR U.S. PRIVACY POLICY
We are required by federal law to provide you with a copy of our privacy policy annually. This policy applies to current and former individual investors in funds managed or sponsored by Morgan Stanley Investment Management Inc. ("MSIM") as well as current and former individual clients of MSIM. This policy is not applicable to partnerships, corporations, trusts or other non-individual clients or investors. Please note that we may amend this policy at any time, and will inform you of any changes as required by law.
WE RESPECT YOUR PRIVACY
We appreciate that you have provided us with your personal financial information. We strive to maintain the privacy of such information while we help you achieve your financial objectives. This Notice describes what non-public personal information we collect about you, why we collect it, when we may share it with others and how certain others may use it. It discusses the steps you may take to limit our sharing of certain information about you to affiliated companies in the Morgan Stanley family of companies ("other Morgan Stanley companies"). It also discloses how you may limit use of certain shared information for marketing purposes by other Morgan Stanley branded companies. Throughout this policy, we refer to the non-public information that personally identifies you or your accounts as "personal information."
1. WHAT PERSONAL INFORMATION DO WE COLLECT ABOUT YOU?
We obtain personal information from applications and other forms you submit to us, from your dealings with us, from consumer reporting agencies, from our Web sites and from third parties and other sources.
For example:
• We may collect information such as your name, address, e-mail address, telephone/fax numbers, assets, income and investment objectives through subscription documents, applications and other forms you submit to us.
• We may obtain information about account balances, your use of account(s) and the types of products and services you prefer to receive from us through your dealings and transactions with us and other sources.
• We may obtain information about your creditworthiness and credit history from consumer reporting agencies.
• We may collect background information from and through third-party vendors to verify representations you have made and to comply with various regulatory requirements.
• If you interact with us through our public and private Web sites, we may collect information that you provide directly through online communications (such as an e-mail address). We may also collect information about your Internet service provider, your domain name, your computer's operating system and Web browser, your use of our Web sites and your product and service preferences, through the use of "cookies." Please consult the Terms of Use of these sites for more details.
2. WHEN DO WE DISCLOSE PERSONAL INFORMATION WE COLLECT ABOUT YOU?
We may disclose personal information we collect about you to other Morgan Stanley companies and to non-affiliated third parties.
a. Information We Disclose to Other Morgan Stanley Companies.
We may disclose personal information to other Morgan Stanley companies for a variety of reasons, including to manage your account(s) effectively, to service and process your transactions, to let you know about products and services offered by us and other Morgan Stanley companies, to manage our business, and as otherwise required or permitted by law. Offers for products and services from other Morgan Stanley companies are developed under conditions designed to safeguard your personal information.
22
Morgan Stanley Institutional Fund, Inc.
Annual Report — December 31, 2018
Privacy Notice (unaudited) (cont'd)
b. Information We Disclose to Non-affiliated Third Parties.
We do not disclose personal information that we collect about you to non-affiliated third parties except to those who provide marketing services on our behalf, to financial institutions with whom we have joint marketing agreements, and as otherwise required or permitted by law. For example, we may disclose personal information to non-affiliated third parties for servicing and processing transactions, to offer our own products and services, to protect against fraud, for institutional risk control, to respond to judicial process or to perform services on our behalf. When we share personal information with a non-affiliated third party, they are required to limit their use of personal information to the particular purpose for which it was shared and they are not allowed to share personal information with others except to fulfill that limited purpose or as may be permitted or required by law.
3. HOW DO WE PROTECT THE SECURITY AND CONFIDENTIALITY OF PERSONAL INFORMATION WE COLLECT ABOUT YOU?
We maintain physical, electronic and procedural security measures to help safeguard the personal information we collect about you. We have internal policies governing the proper handling of client information. Third parties that provide support or marketing services on our behalf may also receive personal information, and we require them to adhere to confidentiality standards with respect to such information.
4. HOW CAN YOU LIMIT THE SHARING OF CERTAIN TYPES OF PERSONAL INFORMATION WITH OTHER MORGAN STANLEY COMPANIES?
We offer you choices as to whether we share with other Morgan Stanley companies the personal information that was collected to determine your eligibility for products and services you request ("eligibility information"). Eligibility information does not include your identification information or personal information pertaining to our transactions or experiences with you. Please note that, even if you direct us not to share eligibility information with other Morgan Stanley companies ("opt-out"), we may still share personal information, including eligibility information, with those companies in circumstances excluded from the opt-out under applicable law, such as to process transactions or to service your account.
5. HOW CAN YOU LIMIT THE USE OF CERTAIN TYPES OF PERSONAL INFORMATION BY OTHER MORGAN STANLEY COMPANIES FOR MARKETING?
By following the opt-out instructions in Section 6 below, you may limit other Morgan Stanley branded companies from marketing their products or services to you based on personal information we disclose to them. This information may include, for example, your income and account history with us. Please note that, even if you choose to limit Other Morgan Stanley Companies from using personal information about you that we may share with them for marketing their products and services to you, Other Morgan Stanley Companies may use your personal information that they obtain from us to market to you in circumstances permitted by law, such as if the Other Morgan Stanley Company has its own relationship with you.
6. HOW CAN YOU SEND US AN OPT-OUT INSTRUCTION?
If you wish to limit our sharing of eligibility information about you with other Morgan Stanley companies or other Morgan Stanley companies' use of personal information for marketing purposes, as described in this notice, you may do so by:
• Calling us at (800) 548-7786
Monday–Friday between 8a.m. and 6p.m.(EST)
• Writing to us at the following address:
DST Asset Manager Solutions, Inc.
c/o Privacy Coordinator
P.O. Box 219804
Kansas City, Missouri 64121
23
Morgan Stanley Institutional Fund, Inc.
Annual Report — December 31, 2018
Privacy Notice (unaudited) (cont'd)
Your written request should include your name, address, telephone number and account number(s) to which the opt-out applies and whether you are opting out with respect to sharing of eligibility information (Section 4 above), or if information used for Marketing (Section 5 above) or both. Written opt-out requests should not be sent with any other correspondence. In order to process your request, we require that the request be provided by you directly and not through a third party.
Your opt-out preference will remain in effect with respect to this policy (as it may be amended) until you notify us otherwise. If you have a joint account, your direction for us not to share this information with other Morgan Stanley companies and for those other Morgan Stanley companies not to use your personal information for marketing will be applied to all account holders on that account. Please understand that if you limit our sharing or our affiliated companies' use of personal information, you and any joint account holder(s) may not receive information about Morgan Stanley products and services, including products or services that could help you manage your financial resources and achieve your investment objectives.
7. WHAT IF AN AFFILIATED COMPANY BECOMES A NON-AFFILIATED THIRD PARTY?
If, at any time in the future, an affiliated company becomes a non-affiliated third party, further disclosures of personal information made to the former affiliated company will be limited to those described in Section 2(b) above relating to non-affiliated third parties. If you elected under Section 6 to limit disclosures we make to affiliated companies, or use of personal information by affiliated companies, your election will not apply to use by any former affiliated company of your personal information in their possession once it becomes a non-affiliated third party.
SPECIAL NOTICE TO RESIDENTS OF VERMONT
The following section supplements our policy with respect to our individual clients who have a Vermont address and supersedes anything to the contrary in the above policy with respect to those clients only.
The state of Vermont requires financial institutions to obtain your consent prior to sharing personal information that they collect about you with affiliated companies and non-affiliated third parties other than in certain limited circumstances. Except as permitted by law, we will not share personal information we collect about you with non-affiliated third parties or other Morgan Stanley companies unless you provide us with your written consent to share such information ("opt-in").
If you wish to receive offers for investment products and services offered by or through other Morgan Stanley companies, please notify us in writing at the following address:
DST Asset Manager Solutions, Inc.
c/o Privacy Coordinator
P.O. Box 219804
Kansas City, Missouri 64121
Your authorization should include your name, address, telephone number and account number(s) to which the opt-in applies and should not be sent with any other correspondence. In order to process your authorization, we require that the authorization be provided by you directly and not through a third party.
SPECIAL NOTICE TO RESIDENTS OF CALIFORNIA
The following section supplements our policy with respect to our individual clients who have a California address and supersedes anything to the contrary in the above policy with respect to those clients only.
In response to a California law, if your account has a California home address, your personal information will not be disclosed to non-affiliated third parties except as permitted by applicable California law, and we will limit sharing such information with our affiliates to comply with California privacy laws that apply to us.
24
Morgan Stanley Institutional Fund, Inc.
Annual Report — December 31, 2018
Director and Officer Information (unaudited)
Independent Directors:
Name, Age and Address of
Independent Director | | Position(s)
Held with
Registrant | | Length of Time
Served* | | Principal Occupation(s) During Past 5 Years
and Other Relevant Professional Experience | | Number of
Portfolios in
Fund Complex
Overseen by
Independent
Director** | | Other Directorships
Held by Independent
Director*** | |
Frank L. Bowman (74)
c/o Perkins Coie LLP
Counsel to the Independent
Directors
30 Rockefeller Plaza
New York, NY 10112 | | Director | | Since
August
2006 | | President, Strategic Decisions, LLC (consulting) (since February 2009); Director or Trustee of various Morgan Stanley Funds (since August 2006); Chairperson of the Compliance and Insurance Committee (since October 2015); formerly, Chairperson of the Insurance Sub-Committee of the Compliance and Insurance Committee (2007-2015); served as President and Chief Executive Officer of the Nuclear Energy Institute (policy organization) (February 2005-November 2008); retired as Admiral, U.S. Navy after serving over 38 years on active duty including 8 years as Director of the Naval Nuclear Propulsion Program in the Department of the Navy and the U.S. Department of Energy (1996-2004); served as Chief of Naval Personnel (July 1994-September 1996) and on the Joint Staff as Director of Political Military Affairs (June 1992-July 1994); knighted as Honorary Knight Commander of the Most Excellent Order of the British Empire; awarded the Officier de l'Orde National du Mérite by the French Government; elected to the National Academy of Engineering (2009). | | | 82 | | | Director of BP p.l.c.; Director of Naval and Nuclear Technologies LLP; Director Emeritus of the Armed Services YMCA; Member of the National Security Advisory Council of the Center for U.S. Global Engagement and a member of the CNA Military Advisory Board; Trustee of Fairhaven United Methodist Church; Member of the Board of Advisors of the Dolphin Scholarship Foundation; and Director of other various non-profit organizations. | |
Kathleen A. Dennis (65)
c/o Perkins Coie LLP
Counsel to the Independent Directors
30 Rockefeller Plaza
New York, NY 10112 | | Director | | Since
August
2006 | | President, Cedarwood Associates (mutual fund and investment management consulting) (since July 2006); Chairperson of the Liquidity and Alternatives Sub-Committee of the Investment Committee (since October 2006) and Director or Trustee of various Morgan Stanley Funds (since August 2006); formerly, Senior Managing Director of Victory Capital Management (1993-2006). | | | 82 | | | Director of various non-profit organizations. | |
Nancy C. Everett (63)
c/o Perkins Coie LLP
Counsel to the Independent Directors
30 Rockefeller Plaza
New York, NY 10112 | | Director | | Since
January
2015 | | Chief Executive Officer, Virginia Commonwealth University Investment Company (since November 2015); Owner, OBIR, LLC (institutional investment management consulting) (since June 2014); formerly, Managing Director, BlackRock Inc. (February 2011-December 2013); and Chief Executive Officer, General Motors Asset Management (a/k/a Promark Global Advisors, Inc.) (June 2005-May 2010). | | | 83 | | | Formerly, Member of Virginia Commonwealth University School of Business Foundation (2005-2016); Member of Virginia Commonwealth University Board of Visitors (2013-2015); Member of Committee on Directors for Emerging Markets Growth Fund, Inc. (2007-2010); Chairperson of Performance Equity Management, LLC (2006-2010); and Chairperson, GMAM Absolute Return Strategies Fund, LLC (2006-2010). | |
25
Morgan Stanley Institutional Fund, Inc.
Annual Report — December 31, 2018
Director and Officer Information (unaudited) (cont'd)
Independent Directors: (cont'd)
Name, Age and Address of
Independent Director | | Position(s)
Held with
Registrant | | Length of Time
Served* | | Principal Occupation(s) During Past 5 Years
and Other Relevant Professional Experience | | Number of
Portfolios in
Fund Complex
Overseen by
Independent
Director** | | Other Directorships
Held by Independent
Director*** | |
Jakki L. Haussler (61)
c/o Perkins Coie LLP
Counsel to the Independent Directors
30 Rockefeller Plaza
New York, NY 10112 | | Director | | Since
January
2015 | | Chairman and Chief Executive Officer, Opus Capital Group (since January 1996); formerly, Director, Capvest Venture Fund, LP (May 2000-December 2011); Partner, Adena Ventures, LP (July 1999-December 2010); Director, The Victory Funds (February 2005-July 2008). | | | 83 | | | Director of Service Corporation International and Member, Audit Committee and Investment Committee; Director of Cincinnati Bell Inc. and Member, Audit Committee and Governance and Nominating Committee; Chairman of Northern Kentucky University Member Investment Committee; Member of Chase College of Law Transactional Law Practice Center Board of Advisors; Director of Best Transport; Director of Chase College of Law Board of Visitors; formerly, Member, University of Cincinnati Foundation Investment Committee; Member, Miami University Board of Visitors (2008-2011); Trustee of Victory Funds (2005-2008) and Chairman, Investment Committee (2007-2008) and Member, Service Provider Committee (2005-2008). | |
Dr. Manuel H. Johnson (69)
c/o Johnson Smick
International, Inc.
220 I Street, NE — Suite 200
Washington, D.C. 20002 | | Director | | Since
July
1991 | | Senior Partner, Johnson Smick International, Inc. (consulting firm); Chairperson of the Investment Committee (since October 2006) and Director or Trustee of various Morgan Stanley Funds (since July 1991); Co-Chairman and a founder of the Group of Seven Council (G7C) (international economic commission); formerly, Chairperson of the Audit Committee (July 1991-September 2006), Vice Chairman of the Board of Governors of the Federal Reserve System and Assistant Secretary of the U.S. Treasury. | | | 82 | | | Director of NVR, Inc. (home construction). | |
Joseph J. Kearns (76)
c/o Perkins Coie LLP
Counsel to the Independent Directors
30 Rockefeller Plaza
New York, NY 10112 | | Director | | Since
August
1994 | | Senior Adviser, Kearns & Associates LLC (investment consulting); Chairperson of the Audit Committee (since October 2006) and Director or Trustee of various Morgan Stanley Funds (since August 1994); formerly, Deputy Chairperson of the Audit Committee (July 2003-September 2006) and Chairperson of the Audit Committee of various Morgan Stanley Funds (since August 1994); CFO of the J. Paul Getty Trust. | | | 83 | | | Prior to August 10, 2016, Director of Electro Rent Corporation (equipment leasing); Prior to December 31, 2013, Director of The Ford Family Foundation. | |
26
Morgan Stanley Institutional Fund, Inc.
Annual Report — December 31, 2018
Director and Officer Information (unaudited) (cont'd)
Independent Directors: (cont'd)
Name, Age and Address of
Independent Director | | Position(s)
Held with
Registrant | | Length of Time
Served* | | Principal Occupation(s) During Past 5 Years
and Other Relevant Professional Experience | | Number of
Portfolios in
Fund Complex
Overseen by
Independent
Director** | | Other Directorships
Held by Independent
Director*** | |
Michael F. Klein (60)
c/o Perkins Coie LLP
Counsel to the Independent Directors
30 Rockefeller Plaza
New York, NY 10112 | | Director | | Since
August
2006 | | Managing Director, Aetos Alternatives Management, LP (since March 2000); Co-President, Aetos Alternatives Management, LP (since January 2004) and Co-Chief Executive Officer of Aetos Alternatives Management, LP (since August 2013); Chairperson of the Fixed Income Sub-Committee of the Investment Committee (since October 2006) and Director or Trustee of various Morgan Stanley Funds (since August 2006); formerly, Managing Director, Morgan Stanley & Co. Inc. and Morgan Stanley Dean Witter Investment Management and President, various Morgan Stanley Funds (June 1998-March 2000); Principal, Morgan Stanley & Co. Inc. and Morgan Stanley Dean Witter Investment Management (August 1997-December 1999). | | | 82 | | | Director of certain investment funds managed or sponsored by Aetos Alternatives Management, LP; Director of Sanitized AG and Sanitized Marketing AG (specialty chemicals). | |
Patricia Maleski (58)
c/o Perkins Coie LLP
Counsel to the Independent Directors
30 Rockefeller Plaza
New York, NY 10112 | | Director | | Since
January
2017 | | Managing Director, JPMorgan Asset Management (2004-2016); Oversight and Control Head of Fiduciary and Conflicts of Interest Program (2015-2016); Chief Control Officer-Global Asset Management (2013-2015); President, JPMorgan Funds (2010-2013); Chief Administrative Officer (2004-2013); various other positions including Treasurer and Board Liaison (since 2001). | | | 83 | | | None. | |
Michael E. Nugent (82)
522 Fifth Avenue
New York, NY 10036 | | Chair of the Board and Director | | Chair of the Boards since July 2006 and Director since July 1991 | | Chair of the Boards of various Morgan Stanley Funds (since July 2006); Chairperson of the Closed-End Fund Committee (since June 2012) Governance Committee (since January 2019) and Director or Trustee of various Morgan Stanley Funds (since July 1991); formerly, Chairperson of the Insurance Committee (until July 2006); General Partner, Triumph Capital, L.P. (private investment partnership) (1988-2013). | | | 82 | | | None. | |
W. Allen Reed (71)
c/o Perkins Coie LLP
Counsel to the Independent Directors
30 Rockefeller Plaza
New York, NY 10112 | | Director | | Since
August
2006 | | Chairperson of the Equity Sub-Committee of the Investment Committee (since October 2006) and Director or Trustee of various Morgan Stanley Funds (since August 2006); formerly, President and CEO of General Motors Asset Management; Chairman and Chief Executive Officer of the GM Trust Bank and Corporate Vice President of General Motors Corporation (August 1994-December 2005). | | | 82 | | | Director of Legg Mason, Inc.; formerly, Director of the Auburn University Foundation (2010-2015). | |
Fergus Reid (86)****
c/o Joe Pietryka, Inc.
85 Charles Colman Blvd.
Pawling, NY 12564 | | Director | | Since
June
1992 | | Chairman, Joe Pietryka, Inc.; Chairperson of the Governance Committee and Director or Trustee of various Morgan Stanley Funds (since June 1992). | | | 83 | | | Formerly, Trustee and Director of certain investment companies in the JP Morgan Fund Complex managed by JP Morgan Investment Management Inc. (1987-2012). | |
* This is the earliest date the Director began serving the Morgan Stanley Funds. Each Director serves an indefinite term, until his or her successor is elected.
** The Fund Complex includes (as of December 31, 2018) all open-end and closed-end funds (including all of their portfolios) advised by Morgan Stanley Investment Management Inc. (the "Adviser") and any funds that have an adviser that is an affiliated person of the Adviser (including, but not limited to, Morgan Stanley AIP GP LP).
*** This includes any directorships at public companies and registered investment companies held by the Director at any time during the past five years.
**** Effective date of retirement is December 31, 2018.
27
Morgan Stanley Institutional Fund, Inc.
Annual Report — December 31, 2018
Director and Officer Information (unaudited) (cont'd)
Executive Officers:
Name, Age and Address of Executive Officer | | Position(s) Held
with
Registrant | | Length of Time
Served* | | Principal Occupation(s) During Past 5 Years | |
John H. Gernon (55)
522 Fifth Avenue
New York, NY 10036 | | President and Principal Executive Officer | | Since
September
2013 | | President and Principal Executive Officer of the Equity and Fixed Income Funds and the Morgan Stanley AIP Funds (since September 2013) and the Liquidity Funds and various money market funds (since May 2014) in the Fund Complex; Managing Director of the Adviser; Head of Product (since 2006). | |
Timothy J. Knierim (59)
522 Fifth Avenue
New York, NY 10036 | | Chief Compliance Officer | | Since
December
2016 | | Managing Director of the Adviser and various entities affiliated with the Adviser; Chief Compliance Officer of various Morgan Stanley Funds and the Adviser (since December 2016) and Chief Compliance Officer of Morgan Stanley AIP GP LP (since 2014). Formerly, Managing Director and Deputy Chief Compliance Officer of the Adviser (2014-2016); and formerly, Chief Compliance Officer of Prudential Investment Management, Inc. (2007-2014). | |
Francis J. Smith (53)
522 Fifth Avenue
New York, NY 10036 | | Treasurer and Principal Financial Officer | | Treasurer since July 2003 and Principal Financial Officer since September 2002 | | Managing Director of the Adviser and various entities affiliated with the Adviser; Treasurer (since July 2003) and Principal Financial Officer of various Morgan Stanley Funds (since September 2002). | |
Mary E. Mullin (51)
522 Fifth Avenue
New York, NY 10036 | | Secretary | | Since
June
1999 | | Managing Director of the Adviser; Secretary of various Morgan Stanley Funds (since June 1999). | |
Michael J. Key (39)
522 Fifth Avenue
New York, NY 10036 | | Vice President | | Since
June
2017 | | Vice President of the Equity and Fixed Income Funds, Liquidity Funds, various money market funds and the Morgan Stanley AIP Funds in the Fund Complex (since June 2017); Executive Director of the Adviser; Head of Product Development for Equity and Fixed Income Funds (since August 2013). | |
* This is the earliest date the officer began serving the Morgan Stanley Funds. Each officer serves a one-year term, until his or her successor is elected and qualifies.
28
Morgan Stanley Institutional Fund, Inc.
Annual Report — December 31, 2018
Adviser and Administrator
Morgan Stanley Investment Management Inc.
522 Fifth Avenue
New York, New York 10036
Distributor
Morgan Stanley Distribution, Inc.
522 Fifth Avenue
New York, New York 10036
Dividend Disbursing and Transfer Agent
DST Asset Manager Solutions, Inc.
2000 Crown Colony Drive
Quincy, Massachusetts 02169
Custodian
State Street Bank and Trust Company
One Lincoln Street
Boston, Massachusetts 02111
Legal Counsel
Dechert LLP
1095 Avenue of the Americas
New York, New York 10036
Counsel to the Independent Directors
Perkins Coie LLP
30 Rockefeller Plaza
New York, New York 10112
Independent Registered Public Accounting Firm
Ernst & Young LLP
200 Clarendon Street
Boston, Massachusetts 02116
Reporting to Shareholders
Each Morgan Stanley fund provides a complete schedule of portfolio holdings in its semi-annual and the annual reports within 60 days of the end of the fund's second and fourth fiscal quarters. The semi-annual and annual reports are filed electronically with the Securities and Exchange Commission ("SEC") on Form N-CSRS and Form N-CSR, respectively. Morgan Stanley also delivers the semi-annual and annual reports to fund shareholders and makes these reports available on its public website, www.morganstanley.com/im/shareholderreports. Each Morgan Stanley fund also files a complete schedule of portfolio holdings with the SEC for the fund's first and third fiscal quarters on Form N-Q. Morgan Stanley does not deliver the reports for the first and third fiscal quarters to shareholders, nor are the reports posted to the Morgan Stanley public website. You may, however, obtain the Form N-Q filings (as well as the Form N-CSR and N-CSRS filings) by accessing the SEC's website, www.sec.gov. You can also request copies of these materials, upon payment of a duplicating fee, by electronic request at the SEC's email address (publicinfo@sec.gov).
Proxy Voting Policies and Procedures and Proxy Voting Record
You may obtain a copy of the Company's Proxy Voting Policy and Procedures and information regarding how the Company voted proxies relating to portfolio securities during the most recent twelve-month period ended June 30, without charge, upon request, by calling toll free 1 (800) 548-7786 or by visiting our website at www.morganstanley.com/im/shareholderreports. This information is also available on the SEC's website at www.sec.gov.
This report is authorized for distribution only when preceded or accompanied by a prospectus or summary prospectus of the applicable Fund of Morgan Stanley Institutional Fund, Inc., which describes in detail the Fund's investment policies, risks, fees and expenses. Please read the prospectus carefully before you invest or send money. For additional information, including information regarding the investments comprising the Fund, please visit our website at www.morganstanley.com/im/shareholderreports or call toll free 1 (800) 548-7786.
29
Printed in U.S.A.
This Report has been prepared for shareholders and may be distributed to others only if preceded or accompanied by a current prospectus.
Morgan Stanley Investment Management Inc.
522 Fifth Avenue
New York, New York 10036
© 2019 Morgan Stanley. Morgan Stanley Distribution, Inc.

IFIUSCPANN
2403519 EXP. 02.29.20

Morgan Stanley Institutional Fund, Inc.
U.S. Real Estate Portfolio
Annual Report
December 31, 2018
Beginning on January 1, 2021, as permitted by regulations adopted by the Securities and Exchange Commission ("SEC"), paper copies of the Fund's Annual and Semi-Annual Reports to Shareholders ("Shareholder Reports") will no longer be sent by mail, unless you specifically request paper copies of the Shareholder Reports from the Fund or from your financial intermediary, such as a broker-dealer or a bank. Instead, the Shareholder Reports will be made available on the Fund's website, https://www.morganstanley.com/im/shareholderreports and you will be notified by mail each time a Shareholder Report is posted and provided with a website link to access the Shareholder Report. If you already elected to receive Shareholder Reports electronically, you will not be affected by this change and you need not take any action. You may elect to receive Shareholder Reports and other communications from the Fund electronically anytime by contacting your financial intermediary or, if you are a direct investor, please follow the instructions on the envelope.
Beginning on January 1, 2019, you may elect to receive all future Shareholder Reports in paper free of charge. If you invest through a financial intermediary, you can contact your financial intermediary to request that you continue to receive paper copies of your Shareholder Reports. If you invest directly with the Fund, please follow the instructions on the envelope to let the Fund know you wish to continue receiving paper copies of your Shareholder Reports. Your election to receive Shareholder Reports in paper will apply to all funds held in your account if you invest through your financial intermediary or all funds held with the fund complex if you invest directly with a fund.

Morgan Stanley Institutional Fund, Inc.
Annual Report — December 31, 2018
Shareholders' Letter | | | 2 | | |
Expense Example | | | 3 | | |
Investment Overview | | | 4 | | |
Portfolio of Investments | | | 7 | | |
Statement of Assets and Liabilities | | | 9 | | |
Statement of Operations | | | 11 | | |
Statements of Changes in Net Assets | | | 12 | | |
Financial Highlights | | | 14 | | |
Notes to Financial Statements | | | 20 | | |
Report of Independent Registered Public Accounting Firm | | | 27 | | |
Federal Tax Notice | | | 28 | | |
Privacy Notice | | | 29 | | |
Director and Officer Information | | | 32 | | |
This report is authorized for distribution only when preceded or accompanied by a prospectus or summary prospectus of the applicable Fund of Morgan Stanley Institutional Fund, Inc. To receive a prospectus and/or statement of additional information (SAI), which contains more complete information such as investment objectives, charges, expenses, policies for voting proxies, risk considerations and describes in detail each of the Fund's investment policies to the prospective investor, please call toll free 1 (800) 548-7786. Please read the prospectuses carefully before you invest or send money.
Additionally, you can access information about the Fund, including performance, characteristics and investment team commentary, through Morgan Stanley Investment Management's website: www.morganstanley.com/im/shareholderreports.
Market forecasts provided in this report may not necessarily come to pass. There is no guarantee that any sectors mentioned will continue to perform as discussed herein or that securities in such sectors will be held by the Fund in the future. There is no assurance that a fund will achieve its investment objective. Funds are subject to market risk, which is the possibility that market values of securities owned by the Fund will decline and, therefore, the value of the Fund's shares may be less than what you paid for them. Accordingly, you can lose money investing in this Fund. Please see the prospectus for more complete information on investment risks.
1
Morgan Stanley Institutional Fund, Inc.
Annual Report — December 31, 2018
Shareholders' Letter (unaudited)
Dear Shareholders,
We are pleased to provide this Annual report, in which you will learn how your investment in U.S. Real Estate Portfolio (the "Fund") performed during the latest twelve-month period.
Morgan Stanley Investment Management is a client-centric, investor-led organization. Our global presence, intellectual capital, and breadth of products and services enable us to partner with investors to meet the evolving challenges of today's financial markets. We aim to deliver superior investment service and to empower our clients to make the informed decisions that help them reach their investment goals.
As always, we thank you for selecting Morgan Stanley Investment Management, and look forward to working with you in the months and years ahead.
Sincerely,

John H. Gernon
President and Principal Executive Officer
January 2019
2
Morgan Stanley Institutional Fund, Inc.
Annual Report — December 31, 2018
Expense Example (unaudited)
U.S. Real Estate Portfolio
As a shareholder of the Fund, you incur two types of costs: (1) transactional costs; and (2) ongoing costs, which may include advisory fees, administration fees, distribution and shareholder services fees and other Fund expenses. This example is intended to help you understand your ongoing costs (in dollars) of investing in the Fund and to compare these costs with the ongoing costs of investing in other mutual funds.
This example is based on an investment of $1,000 invested at the beginning of the six-month period ended December 31, 2018 and held for the entire six-month period.
Actual Expenses
The table below provides information about actual account values and actual expenses. You may use the information in this table, together with the amount you invested, to estimate the expenses that you paid over the period. Simply divide your account value by $1,000 (for example, an $8,600 account value divided by $1,000 = 8.6), then multiply the result by the number in the table under the heading entitled "Actual Expenses Paid During Period" to estimate the expenses you paid on your account during this period.
Hypothetical Example for Comparison Purposes
The table below provides information about hypothetical account values and hypothetical expenses based on the Fund's actual expense ratio and an assumed rate of return of 5% per year before expenses, which is not the Fund's actual return. The hypothetical account values and expenses may not be used to estimate the actual ending account balance or expenses you paid for the period. You may use this information to compare the ongoing costs of investing in the Fund and other funds. To do so, compare this 5% hypothetical example with the 5% hypothetical examples that appear in the shareholder reports of the other funds.
Please note that the expenses shown in the table are meant to highlight your ongoing costs only and do not reflect any transactional costs, such as sales charges (loads). Therefore, the information for each class in the table is useful in comparing ongoing costs only, and will not help you determine the relative total costs of owning different funds. In addition, if these transactional costs were included, your costs would have been higher.
| | | Beginning
Account
Value
7/1/18 | | Actual Ending
Account
Value
12/31/18 | | Hypothetical
Ending Account
Value | | Actual
Expenses
Paid
During
Period* | | Hypothetical
Expenses Paid
During Period* | | Net
Expense
Ratio
During
Period** | |
U.S. Real Estate Portfolio Class I | | $ | 1,000.00 | | | $ | 915.60 | | | $ | 1,020.72 | | | $ | 4.30 | | | $ | 4.53 | | | | 0.89 | % | |
U.S. Real Estate Portfolio Class A | | | 1,000.00 | | | | 914.90 | | | | 1,019.36 | | | | 5.60 | | | | 5.90 | | | | 1.16 | | |
U.S. Real Estate Portfolio Class L | | | 1,000.00 | | | | 912.30 | | | | 1,016.53 | | | | 8.29 | | | | 8.74 | | | | 1.72 | | |
U.S. Real Estate Portfolio Class C | | | 1,000.00 | | | | 910.80 | | | | 1,015.12 | | | | 9.63 | | | | 10.16 | | | | 2.00 | | |
U.S. Real Estate Portfolio Class IS | | | 1,000.00 | | | | 916.10 | | | | 1,021.02 | | | | 4.01 | | | | 4.23 | | | | 0.83 | | |
U.S. Real Estate Portfolio Class IR | | | 1,000.00 | | | | 916.00 | | | | 1,020.97 | | | | 4.06 | | | | 4.28 | | | | 0.84 | | |
* Expenses are calculated using each Fund Class' annualized net expense ratio (as disclosed), multiplied by the average account value over the period and multiplied by 184/365 (to reflect the most recent one-half year period).
** Annualized.
3
Morgan Stanley Institutional Fund, Inc.
Annual Report — December 31, 2018
Investment Overview (unaudited)
U.S. Real Estate Portfolio
The Fund seeks to provide above average current income and long-term capital appreciation by investing primarily in equity securities of companies in the U.S. real estate industry, including real estate investment trusts ("REITs").
Performance
For the fiscal year ended December 31, 2018, the Fund's Class I shares had a total return based on net asset value and reinvestment of distributions per share of –8.44%, net of fees. The Fund's Class I shares underperformed against the Fund's benchmark, the FTSE Nareit Equity REITs Index (the "Index"), which returned –4.62%, and underperformed the S&P 500® Index, which returned –4.38%.
Factors Affecting Performance
• The REIT market declined 4.62% in the 12-month period ending December 31, 2018, as measured by the Index. There was significant volatility over the period. REITs experienced a sell-off in the first quarter on rising interest rates, but recovered in the second quarter on the emergence of several REIT take-private announcements aggregating nearly $30 billion.(i) The REIT sector then experienced a sell-off in the fourth quarter, which coincided with the sell-off in the broader equity market driven by a variety of macro concerns including a prospective economic slowdown, impact of higher interest rates and U.S.-Sino trade tension. It is notable that the 10-year U.S. Treasury bond yield fell to 2.7% after starting the fourth quarter above 3.0%. However, this movement was unable to support REIT share prices in most sectors, aside from those being viewed as defensive.
• Within real estate, there exists an enormous disparity in relative valuations among market segments with significant negative sentiment and share price weakness towards key market segments resulting in very wide discounts to net asset values (NAVs), which included NYC office, high-quality retail and central business district (CBD) office and hotels, while market segments trading at premiums due to being viewed as defensive (e.g., health care and net lease assets) experienced share gains for the period.
• Among the major sectors, the apartment sector outperformed the Index, while the office and retail sectors underperformed. The apartment sector outperformed the Index as it appeared to be viewed
as a more defensive sector in a negative environment. The retail sector lagged as both the shopping centers and malls underperformed in the period. In the office sector, both the primary CBD and secondary CBD/suburban REITs underperformed the Index. The health care REITs outperformed the Index for the full year, posting positive returns. The strength appeared to be due to an investor perception that it serves as a more defensive sector in a weaker economic environment, despite the companies facing supply challenges in the senior housing business. The net lease sector also outperformed due to being viewed as more defensive. The data center sector underperformed the Index as its performance appeared to be negatively impacted by the weakness in technology stocks in the latter part of the year. The hotel sector underperformed as investors' expectations for a weakening economy in the latter part of the year weighed significantly on the stocks.
• The Fund underperformed the Index for the period due to top-down sector allocation. From a bottom-up perspective, the Fund achieved favorable stock selection in the diversified, hotel and shopping center sectors; this was partially offset by less favorable stock selection in the primary CBD office and health care sectors. From a top-down perspective, the underweight to the data center and diversified sectors contributed to relative performance. This was more than offset by the overweight to the primary CBD office sector, which is facing significant negative investor sentiment, and the underweight to the net lease and health care sectors, which benefited from investor preference for sectors viewed as defensive.
Management Strategies
• We have maintained our core investment philosophy as a real estate value investor. This results in the ownership of stocks whose share prices provide real estate exposure at the best valuation relative to their underlying asset values. We continue to focus on relative implied valuations as a key metric. Our company-specific research leads us to an overweighting in the Fund to a group of companies that are focused in the ownership of NYC office assets as well as high-quality retail and CBD office assets and a number of out-of-favor
(i) Source: Morgan Stanley Investment Management as of December 31, 2018
4
Morgan Stanley Institutional Fund, Inc.
Annual Report — December 31, 2018
Investment Overview (unaudited) (cont'd)
U.S. Real Estate Portfolio
companies, and an underweighting to companies concentrated in the ownership of health care, data center and net lease assets.
• Our outlook for the REIT market is based on two key factors: private market pricing for underlying real estate assets and public market pricing for the securities. The overall REIT market ended the year trading at a 5% discount to NAVs; however, there exists an enormous disparity in valuations among the sectors with various segments trading at significant discounted valuations.(i) We see the most attractive value in the owners of NYC office assets. We also see attractive value in high-quality retail, CBD office, hotel and apartment stocks. These companies provide exposure to high-quality core assets at significant discounted valuations.
(i) Source: Morgan Stanley Investment Management as of December 31, 2018
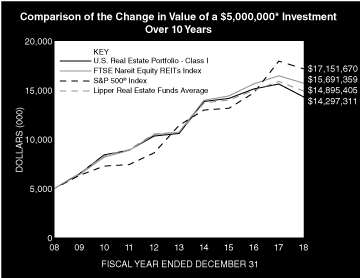
* Minimum Investment for Class I shares
In accordance with SEC regulations, the Fund's performance shown assumes that all recurring fees (including management fees) were deducted and all dividends and distributions were reinvested. The performance of Class A, L, C, IS and IR shares will vary from the performance of Class I shares based upon their different inception dates and will be negatively impacted by additional fees assessed to those classes (if applicable).
5
Morgan Stanley Institutional Fund, Inc.
Annual Report — December 31, 2018
Investment Overview (unaudited) (cont'd)
U.S. Real Estate Portfolio
Performance Compared to the FTSE Nareit Equity REITs Index(1), the S&P 500® Index(2) and the Lipper Real Estate Funds Average(3)
| | | Period Ended December 31, 2018
Total Returns(4) | |
| | | | | Average Annual | |
| | | One
Year | | Five
Years | | Ten
Years | | Since
Inception(11) | |
Fund — Class I Shares
w/o sales charges(5) | | | –8.44 | % | | | 6.20 | % | | | 11.08 | % | | | 11.00 | % | |
Fund — Class A Shares
w/o sales charges(6) | | | –8.71 | | | | 5.87 | | | | 10.76 | | | | 10.17 | | |
Fund — Class A Shares with
maximum 5.25% sales charges(6) | | | –13.52 | | | | 4.73 | | | | 10.17 | | | | 9.91 | | |
Fund — Class L Shares
w/o sales charges(7) | | | –9.16 | | | | 5.32 | | | | — | | | | 6.22 | | |
Fund — Class C Shares
w/o sales charges(9) | | | –9.47 | | | | — | | | | — | | | | 0.11 | | |
Fund — Class C Shares with
maximum 1.00% deferred
sales charges(9) | | | –10.18 | | | | — | | | | — | | | | 0.11 | | |
Fund — Class IS Shares
w/o sales charges(8) | | | –8.36 | | | | 6.28 | | | | — | | | | 5.97 | | |
Fund — Class IR Shares
w/o sales charges(10) | | | — | | | | — | | | | — | | | | –5.73 | | |
FTSE Nareit Equity REITs Index | | | –4.62 | | | | 7.90 | | | | 12.12 | | | | 10.09 | | |
S&P 500® Index | | | –4.38 | | | | 8.49 | | | | 13.12 | | | | 9.17 | | |
Lipper Real Estate Funds Average | | | –6.16 | | | | 6.77 | | | | 11.55 | | | | 10.15 | | |
Performance data quoted represents past performance, which is no guarantee of future results, and current performance may be lower or higher than the figures shown. Performance assumes that all dividends and distributions, if any, were reinvested. For the most recent month-end performance figures, please visit www.morganstanley.com/im/shareholderreports. Investment return and principal value will fluctuate so that Fund shares, when redeemed, may be worth more or less than their original cost. Returns for period less than one year are not annualized. Total returns do not reflect the deduction of taxes that a shareholder would pay on Fund distributions or the redemption of Fund shares. Performance of share classes will vary due to difference in sales charges and expenses.
(1) The FTSE Nareit (National Association of Real Estate Investment Trusts) Equity REITs Index is free float-adjusted market capitalization weighted index of tax-qualified REITs listed on the New York Stock Exchange, NYSE Amex and the NASDAQ National Market Systems. Effective December 20, 2010, the FTSE Nareit Equity REITs Index will not include "Timber REITs". The Index is unmanaged and its returns do not include any sales charges or fees. Such costs would lower performance. It is not possible to invest directly in an index.
(2) The Standard & Poor's 500® Index (S&P 500® Index) measures the performance of the large cap segment of the U.S. equities market, covering approximately 80% of the U.S. equities market. The Index includes 500 leading companies in leading industries of the U.S. economy. The Index is unmanaged and its returns do not include any sales charges or fees. Such costs would lower performance. It is not possible to invest directly in an index.
(3) The Lipper Real Estate Funds Average tracks the performance of all funds in the Lipper Real Estate Funds classification. The Average, which is adjusted for capital gains distributions and income dividends, is unmanaged and should not be considered an investment. As of the date of this report, the Fund is in the Lipper Real Estate Funds classification.
(4) Total returns for the Fund reflect fees waived and expenses reimbursed, if applicable, by Morgan Stanley Investment Management Inc. (the "Adviser"). Without such waivers and reimbursements, total returns would have been lower.
(5) Commenced operations on February 24, 1995.
(6) Commenced offering on January 2, 1996.
(7) Commenced offering on November 11, 2011.
(8) Commenced offering on September 13, 2013.
(9) Commenced offering on April 30, 2015.
(10) Commenced offering on June 15, 2018.
(11) For comparative purposes, average annual since inception returns listed for the Indexes refer to the inception date of Class I of the Fund, not the inception of the Index.
6
Morgan Stanley Institutional Fund, Inc.
Annual Report — December 31, 2018
Portfolio of Investments
U.S. Real Estate Portfolio
| | | Shares | | Value
(000) | |
Common Stocks (99.7%) | |
Apartments (15.1%) | |
American Campus Communities, Inc. REIT | | | 51,320 | | | $ | 2,124 | | |
Apartment Investment & Management Co.,
Class A REIT | | | 40,790 | | | | 1,790 | | |
AvalonBay Communities, Inc. REIT | | | 64,936 | | | | 11,302 | | |
Camden Property Trust REIT | | | 55,383 | | | | 4,877 | | |
Equity Residential REIT | | | 123,881 | | | | 8,177 | | |
Essex Property Trust, Inc. REIT | | | 14,553 | | | | 3,569 | | |
Mid-America Apartment Communities, Inc. REIT | | | 30,662 | | | | 2,934 | | |
UDR, Inc. REIT | | | 49,771 | | | | 1,972 | | |
| | | | 36,745 | | |
Data Centers (2.7%) | |
Digital Realty Trust, Inc. REIT | | | 35,730 | | | | 3,807 | | |
QTS Realty Trust, Inc., Class A REIT | | | 75,195 | | | | 2,786 | | |
| | | | 6,593 | | |
Diversified (4.8%) | |
JBG SMITH Properties REIT | | | 48,914 | | | | 1,703 | | |
Lexington Realty Trust REIT | | | 96,250 | | | | 790 | | |
Vornado Realty Trust REIT | | | 148,204 | | | | 9,193 | | |
| | | | 11,686 | | |
Health Care (6.4%) | |
HCP, Inc. REIT | | | 49,087 | | | | 1,371 | | |
Healthcare Realty Trust, Inc. REIT | | | 220,824 | | | | 6,280 | | |
Healthcare Trust of America, Inc., Class A REIT | | | 73,574 | | | | 1,862 | | |
Ventas, Inc. REIT | | | 47,199 | | | | 2,766 | | |
Welltower, Inc. REIT | | | 49,559 | | | | 3,440 | | |
| | | | 15,719 | | |
Industrial (5.7%) | |
Duke Realty Corp. REIT | | | 24,185 | | | | 626 | | |
Exeter Industrial Value Fund, LP (a)(b)(c)(d) | | | 7,905,000 | | | | 552 | | |
ProLogis, Inc. REIT | | | 215,859 | | | | 12,675 | | |
| | | | 13,853 | | |
Lodging/Resorts (9.7%) | |
Chesapeake Lodging Trust REIT | | | 120,524 | | | | 2,935 | | |
DiamondRock Hospitality Co. REIT | | | 217,758 | | | | 1,977 | | |
Host Hotels & Resorts, Inc. REIT | | | 696,598 | | | | 11,612 | | |
RLJ Lodging Trust REIT | | | 341,413 | | | | 5,599 | | |
Sunstone Hotel Investors, Inc. REIT | | | 124,620 | | | | 1,622 | | |
| | | | 23,745 | | |
Office (25.1%) | |
Alexandria Real Estate Equities, Inc. REIT | | | 22,697 | | | | 2,615 | | |
Boston Properties, Inc. REIT | | | 140,473 | | | | 15,810 | | |
Brandywine Realty Trust REIT | | | 122,761 | | | | 1,580 | | |
Columbia Property Trust, Inc. REIT | | | 169,346 | | | | 3,277 | | |
Corporate Office Properties Trust REIT | | | 57,356 | | | | 1,206 | | |
Cousins Properties, Inc. REIT | | | 168,205 | | | | 1,329 | | |
Empire State Realty Trust, Inc., Class A REIT | | | 59,900 | | | | 852 | | |
Hudson Pacific Properties, Inc. REIT | | | 145,964 | | | | 4,242 | | |
Kilroy Realty Corp. REIT | | | 25,075 | | | | 1,577 | | |
Mack-Cali Realty Corp. REIT | | | 187,843 | | | | 3,680 | | |
| | | Shares | | Value
(000) | |
Paramount Group, Inc. REIT | | | 460,747 | | | $ | 5,787 | | |
SL Green Realty Corp. REIT | | | 231,181 | | | | 18,282 | | |
Tier REIT, Inc. REIT | | | 54,634 | | | | 1,127 | | |
| | | | 61,364 | | |
Regional Malls (14.2%) | |
Macerich Co. (The) REIT | | | 218,268 | | | | 9,446 | | |
Simon Property Group, Inc. REIT | | | 150,157 | | | | 25,225 | | |
| | | | 34,671 | | |
Self Storage (5.0%) | |
CubeSmart REIT | | | 121,589 | | | | 3,489 | | |
Extra Space Storage, Inc. REIT | | | 26,010 | | | | 2,353 | | |
Life Storage, Inc. REIT | | | 12,799 | | | | 1,190 | | |
Public Storage REIT | | | 25,309 | | | | 5,123 | | |
| | | | 12,155 | | |
Shopping Centers (6.6%) | |
Brixmor Property Group, Inc. REIT | | | 442,006 | | | | 6,493 | | |
Kimco Realty Corp. REIT | | | 56,687 | | | | 830 | | |
Regency Centers Corp. REIT | | | 148,006 | | | | 8,685 | | |
| | | | 16,008 | | |
Single Family Homes (3.3%) | |
American Homes 4 Rent, Class A REIT | | | 231,256 | | | | 4,591 | | |
Invitation Homes, Inc. REIT | | | 178,942 | | | | 3,593 | | |
| | | | 8,184 | | |
Specialty (1.1%) | |
Gaming and Leisure Properties, Inc. REIT | | | 83,575 | | | | 2,700 | | |
Total Investments (99.7%) (Cost $213,371) (e) | | | 243,423 | | |
Other Assets in Excess of Liabilities (0.3%) | | | 651 | | |
Net Assets (100.0%) | | $ | 244,074 | | |
(a) At December 31, 2018, the Fund held a fair valued security valued at $552,000, representing 0.2% of net assets. This security has been fair valued as determined in good faith under procedures established by and under the general supervision of the Company's Directors.
(b) Security has been deemed illiquid at December 31, 2018.
(c) Non-income producing security.
(d) Restricted security valued at fair value and not registered under the Securities Act of 1933. Exeter Industrial Value Fund, LP was acquired between 11/07 — 4/11 and has a current cost basis of approximately $0. At December 31, 2018, this security had an aggregate market value of approximately $552,000, representing 0.2% of net assets.
(e) At December 31, 2018, the aggregate cost for federal income tax purposes is approximately $217,227,000. The aggregate gross unrealized appreciation is approximately $42,192,000 and the aggregate gross unrealized depreciation is approximately $15,996,000, resulting in net unrealized appreciation of approximately $26,196,000.
REIT Real Estate Investment Trust.
The accompanying notes are an integral part of the financial statements.
7
Morgan Stanley Institutional Fund, Inc.
Annual Report — December 31, 2018
Portfolio of Investments (cont'd)
U.S. Real Estate Portfolio
Portfolio Composition
Classification | | Percentage of
Total Investments | |
Office | | | 25.2 | % | |
Apartments | | | 15.1 | | |
Regional Malls | | | 14.2 | | |
Other* | | | 12.0 | | |
Lodging/Resorts | | | 9.7 | | |
Shopping Centers | | | 6.6 | | |
Health Care | | | 6.5 | | |
Industrial | | | 5.7 | | |
Self Storage | | | 5.0 | | |
Total Investments | | | 100.0 | % | |
* Industries and/or investment types representing less than 5% of total investments.
The accompanying notes are an integral part of the financial statements.
8
Morgan Stanley Institutional Fund, Inc.
Annual Report — December 31, 2018
U.S. Real Estate Portfolio
Statement of Assets and Liabilities | | December 31, 2018
(000) | |
Assets: | |
Investments in Securities of Unaffiliated Issuers, at Value (Cost $213,371) | | $ | 243,423 | | |
Receivable for Investments Sold | | | 1,412 | | |
Dividends Receivable | | | 1,336 | | |
Receivable for Fund Shares Sold | | | 483 | | |
Receivable from Affiliate | | | 2 | | |
Other Assets | | | 84 | | |
Total Assets | | | 246,740 | | |
Liabilities: | |
Payable for Fund Shares Redeemed | | | 1,642 | | |
Payable for Advisory Fees | | | 428 | | |
Payable for Investments Purchased | | | 240 | | |
Bank Overdraft | | | 106 | | |
Payable for Sub Transfer Agency Fees — Class I | | | 55 | | |
Payable for Sub Transfer Agency Fees — Class A | | | 5 | | |
Payable for Sub Transfer Agency Fees — Class L | | | — | @ | |
Payable for Professional Fees | | | 50 | | |
Payable for Directors' Fees and Expenses | | | 36 | | |
Payable for Transfer Agency Fees — Class I | | | 9 | | |
Payable for Transfer Agency Fees — Class A | | | 4 | | |
Payable for Transfer Agency Fees — Class L | | | 1 | | |
Payable for Transfer Agency Fees — Class C | | | 1 | | |
Payable for Transfer Agency Fees — Class IS | | | 9 | | |
Payable for Transfer Agency Fees — Class IR | | | — | @ | |
Payable for Administration Fees | | | 19 | | |
Payable for Shareholder Services Fees — Class A | | | 8 | | |
Payable for Distribution and Shareholder Services Fees — Class L | | | 1 | | |
Payable for Distribution and Shareholder Services Fees — Class C | | | — | @ | |
Payable for Custodian Fees | | | 7 | | |
Other Liabilities | | | 45 | | |
Total Liabilities | | | 2,666 | | |
Net Assets | | $ | 244,074 | | |
Net Assets Consist of: | |
Paid-in-Capital | | $ | 209,994 | | |
Total Distributable Earnings | | | 34,080 | | |
Net Assets | | $ | 244,074 | | |
The accompanying notes are an integral part of the financial statements.
9
Morgan Stanley Institutional Fund, Inc.
Annual Report — December 31, 2018
U.S. Real Estate Portfolio
Statement of Assets and Liabilities (cont'd) | | December 31, 2018
(000) | |
CLASS I: | |
Net Assets | | $ | 177,690 | | |
| Shares Outstanding $0.001 par value shares of beneficial interest (unlimited shares authorized) (not in 000's) | | | 16,425,217 | | |
Net Asset Value, Offering and Redemption Price Per Share | | $ | 10.82 | | |
CLASS A: | |
Net Assets | | $ | 34,459 | | |
| Shares Outstanding $0.001 par value shares of beneficial interest (unlimited shares authorized) (not in 000's) | | | 3,321,161 | | |
Net Asset Value, Redemption Price Per Share | | $ | 10.38 | | |
Maximum Sales Load | | | 5.25 | % | |
Maximum Sales Charge | | $ | 0.58 | | |
Maximum Offering Price Per Share | | $ | 10.96 | | |
CLASS L: | |
Net Assets | | $ | 2,057 | | |
| Shares Outstanding $0.001 par value shares of beneficial interest (unlimited shares authorized) (not in 000's) | | | 198,474 | | |
Net Asset Value, Offering and Redemption Price Per Share | | $ | 10.37 | | |
CLASS C: | |
Net Assets | | $ | 338 | | |
| Shares Outstanding $0.001 par value shares of beneficial interest (unlimited shares authorized) (not in 000's) | | | 32,762 | | |
Net Asset Value, Offering and Redemption Price Per Share | | $ | 10.31 | | |
CLASS IS: | |
Net Assets | | $ | 29,523 | | |
| Shares Outstanding $0.001 par value shares of beneficial interest (unlimited shares authorized) (not in 000's) | | | 2,729,533 | | |
Net Asset Value, Offering and Redemption Price Per Share | | $ | 10.82 | | |
CLASS IR: | |
Net Assets | | $ | 7 | | |
| Shares Outstanding $0.001 par value shares of beneficial interest (unlimited shares authorized) (not in 000's) | | | 678 | | |
Net Asset Value, Offering and Redemption Price Per Share | | $ | 10.82 | | |
@ Amount is less than $500.
The accompanying notes are an integral part of the financial statements.
10
Morgan Stanley Institutional Fund, Inc.
Annual Report — December 31, 2018
U.S. Real Estate Portfolio
Statement of Operations | | Year Ended
December 31, 2018
(000) | |
Investment Income: | |
Dividends from Securities of Unaffiliated Issuers | | $ | 12,325 | | |
Dividends from Security of Affiliated Issuer (Note G) | | | 40 | | |
Total Investment Income | | | 12,365 | | |
Expenses: | |
Advisory Fees (Note B) | | | 2,864 | | |
Administration Fees (Note C) | | | 302 | | |
Sub Transfer Agency Fees — Class I | | | 203 | | |
Sub Transfer Agency Fees — Class A | | | 43 | | |
Sub Transfer Agency Fees — Class L | | | 1 | | |
Sub Transfer Agency Fees — Class C | | | — | @ | |
Shareholder Services Fees — Class A (Note D) | | | 108 | | |
Distribution and Shareholder Services Fees — Class L (Note D) | | | 19 | | |
Distribution and Shareholder Services Fees — Class C (Note D) | | | 3 | | |
Professional Fees | | | 118 | | |
Registration Fees | | | 91 | | |
Transfer Agency Fees — Class I (Note E) | | | 23 | | |
Transfer Agency Fees — Class A (Note E) | | | 12 | | |
Transfer Agency Fees — Class L (Note E) | | | 3 | | |
Transfer Agency Fees — Class C (Note E) | | | 2 | | |
Transfer Agency Fees — Class IS (Note E) | | | 28 | | |
Transfer Agency Fees — Class IR (Note E) | | | 1 | | |
Shareholder Reporting Fees | | | 56 | | |
Custodian Fees (Note F) | | | 26 | | |
Directors' Fees and Expenses | | | 15 | | |
Pricing Fees | | | 4 | | |
Other Expenses | | | 30 | | |
Expenses Before Non Operating Expenses | | | 3,952 | | |
Bank Overdraft Expense | | | 5 | | |
Total Expenses | | | 3,957 | | |
Waiver of Advisory Fees (Note B) | | | (148 | ) | |
Reimbursement of Class Specific Expenses — Class I (Note B) | | | (68 | ) | |
Reimbursement of Class Specific Expenses — Class L (Note B) | | | (— | @) | |
Reimbursement of Class Specific Expenses — Class C (Note B) | | | (2 | ) | |
Reimbursement of Class Specific Expenses — Class IS (Note B) | | | (28 | ) | |
Reimbursement of Class Specific Expenses — Class IR (Note B) | | | (1 | ) | |
Rebate from Morgan Stanley Affiliate (Note G) | | | (4 | ) | |
Net Expenses | | | 3,706 | | |
Net Investment Income | | | 8,659 | | |
Realized Gain (Loss): | |
Investments Sold | | | 69,053 | | |
Foreign Currency Translation | | | (— | @) | |
Net Realized Gain | | | 69,053 | | |
Change in Unrealized Appreciation (Depreciation): | |
Investments | | | (115,506 | ) | |
Foreign Currency Translation | | | — | @ | |
Net Change in Unrealized Appreciation (Depreciation) | | | (115,506 | ) | |
Net Realized Gain and Change in Unrealized Appreciation (Depreciation) | | | (46,453 | ) | |
Net Decrease in Net Assets Resulting from Operations | | $ | (37,794 | ) | |
@ Amount is less than $500.
The accompanying notes are an integral part of the financial statements.
11
Morgan Stanley Institutional Fund, Inc.
Annual Report — December 31, 2018
U.S. Real Estate Portfolio
Statements of Changes in Net Assets | | Year Ended
December 31, 2018
(000) | | Year Ended
December 31, 2017
(000) | |
Increase (Decrease) in Net Assets: | |
Operations: | |
Net Investment Income | | $ | 8,659 | | | $ | 15,026 | | |
Net Realized Gain | | | 69,053 | | | | 87,966 | | |
Net Change in Unrealized Appreciation (Depreciation) | | | (115,506 | ) | | | (85,277 | ) | |
Net Increase (Decrease) in Net Assets Resulting from Operations | | | (37,794 | ) | | | 17,715 | | |
Dividends and Distributions to Shareholders: | |
Class I | | | (53,011 | ) | | | (51,233 | )* | |
Class A | | | (9,885 | ) | | | (8,565 | )* | |
Class L | | | (588 | ) | | | (407 | )* | |
Class C | | | (65 | ) | | | (67 | )* | |
Class IS | | | (9,183 | ) | | | (28,635 | )* | |
Class IR | | | (2 | ) | | | — | | |
Total Dividends and Distributions to Shareholders | | | (72,734 | ) | | | (88,907 | ) | |
Capital Share Transactions:(1) | |
Class I: | |
Subscribed | | | 35,741 | | | | 45,913 | | |
Distributions Reinvested | | | 52,679 | | | | 50,421 | | |
Redeemed | | | (167,839 | ) | | | (218,674 | ) | |
Class A: | |
Subscribed | | | 3,936 | | | | 7,511 | | |
Distributions Reinvested | | | 9,810 | | | | 8,510 | | |
Redeemed | | | (21,113 | ) | | | (29,361 | ) | |
Class L: | |
Exchanged | | | — | @ | | | — | | |
Distributions Reinvested | | | 582 | | | | 401 | | |
Redeemed | | | (487 | ) | | | (738 | ) | |
Class C: | |
Subscribed | | | 146 | | | | 179 | | |
Distributions Reinvested | | | 63 | | | | 66 | | |
Redeemed | | | (258 | ) | | | (131 | ) | |
Class IS: | |
Subscribed | | | 24,616 | | | | 83,171 | | |
Distributions Reinvested | | | 8,461 | | | | 6,283 | | |
Redeemed | | | (178,831 | ) | | | (65,710 | ) | |
Class IR: | |
Subscribed | | | 10 | (a) | | | — | | |
Net Decrease in Net Assets Resulting from Capital Share Transactions | | | (232,484 | ) | | | (112,159 | ) | |
Total Decrease in Net Assets | | | (343,012 | ) | | | (183,351 | ) | |
Net Assets: | |
Beginning of Period | | | 587,086 | | | | 770,437 | | |
End of Period | | $ | 244,074 | | | $ | 587,086 | † | |
The accompanying notes are an integral part of the financial statements.
12
Morgan Stanley Institutional Fund, Inc.
Annual Report — December 31, 2018
U.S. Real Estate Portfolio
Statements of Changes in Net Assets (cont'd) | | Year Ended
December 31, 2018
(000) | | Year Ended
December 31, 2017
(000) | |
(1) Capital Share Transactions: | |
Class I: | |
Shares Subscribed | | | 2,593 | | | | 2,733 | | |
Shares Issued on Distributions Reinvested | | | 4,178 | | | | 3,289 | | |
Shares Redeemed | | | (12,108 | ) | | | (13,016 | ) | |
Net Decrease in Class I Shares Outstanding | | | (5,337 | ) | | | (6,994 | ) | |
Class A: | |
Shares Subscribed | | | 289 | | | | 457 | | |
Shares Issued on Distributions Reinvested | | | 810 | | | | 574 | | |
Shares Redeemed | | | (1,549 | ) | | | (1,805 | ) | |
Net Decrease in Class A Shares Outstanding | | | (450 | ) | | | (774 | ) | |
Class L: | |
Shares Exchanged | | | — | @@ | | | — | | |
Shares Issued on Distributions Reinvested | | | 48 | | | | 28 | | |
Shares Redeemed | | | (39 | ) | | | (46 | ) | |
Net Increase (Decrease) in Class L Shares Outstanding | | | 9 | | | | (18 | ) | |
Class C: | |
Shares Subscribed | | | 13 | | | | 11 | | |
Shares Issued on Distributions Reinvested | | | 5 | | | | 4 | | |
Shares Redeemed | | | (18 | ) | | | (8 | ) | |
Net Increase (Decrease) in Class C Shares Outstanding | | | (— | @@) | | | 7 | | |
Class IS: | |
Shares Subscribed | | | 1,731 | | | | 5,043 | | |
Shares Issued on Distributions Reinvested | | | 668 | | | | 410 | | |
Shares Redeemed | | | (12,564 | ) | | | (3,914 | ) | |
Net Increase (Decrease) in Class IS Shares Outstanding | | | (10,165 | ) | | | 1,539 | | |
Class IR: | |
Shares Subscribed | | | 1 | (a) | | | — | | |
(a) For the period June 15, 2018 through December 31, 2018.
@ Amount is less than $500.
@@ Amount is less than 500 shares.
The following information was previously reported in the December 31, 2017 financial statements. The distribution information for the year ended December 31, 2017 presented on the Statements of Changes in Net Assets is presented for comparative purposes to the December 31, 2018 financial statements, which conform to the SEC Final Rule on Disclosure Update and Simplification which was effective November 5, 2018.
* Dividends and Distributions to Shareholders for the year ended December 31, 2017 were as follows:
Class I: | |
Net Investment Income | | $ | (6,074 | ) | |
Net Realized Gain | | $ | (45,159 | ) | |
Class A: | |
Net Investment Income | | $ | (767 | ) | |
Net Realized Gain | | $ | (7,798 | ) | |
Class L: | |
Net Investment Income | | $ | (21 | ) | |
Net Realized Gain | | $ | (386 | ) | |
Class C: | |
Net Investment Income | | $ | (2 | ) | |
Net Realized Gain | | $ | (65 | ) | |
Class IS: | |
Net Investment Income | | $ | (3,208 | ) | |
Net Realized Gain | | $ | (25,427 | ) | |
† Accumulated Undistributed Net Investment Income for the year ended December 31, 2017 was $4,593.
The accompanying notes are an integral part of the financial statements.
13
Morgan Stanley Institutional Fund, Inc.
Annual Report — December 31, 2018
Financial Highlights
U.S. Real Estate Portfolio
| | | Class I | |
| | | Year Ended December 31, | |
Selected Per Share Data and Ratios | | 2018 | | 2017 | | 2016(1) | | 2015 | | 2014 | |
Net Asset Value, Beginning of Period | | $ | 15.24 | | | $ | 17.21 | | | $ | 17.86 | | | $ | 20.48 | | | $ | 16.55 | | |
Income (Loss) from Investment Operations: | |
Net Investment Income(2) | | | 0.34 | | | | 0.37 | | | | 0.31 | | | | 0.32 | | | | 0.36 | | |
Net Realized and Unrealized Gain (Loss) | | | (1.33 | ) | | | 0.16 | | | | 0.91 | | | | 0.10 | | | | 4.66 | | |
Total from Investment Operations | | | (0.99 | ) | | | 0.53 | | | | 1.22 | | | | 0.42 | | | | 5.02 | | |
Distributions from and/or in Excess of: | |
Net Investment Income | | | (0.34 | ) | | | (0.26 | ) | | | (0.38 | ) | | | (0.26 | ) | | | (0.35 | ) | |
Net Realized Gain | | | (3.09 | ) | | | (2.24 | ) | | | (1.49 | ) | | | (2.78 | ) | | | (0.74 | ) | |
Total Distributions | | | (3.43 | ) | | | (2.50 | ) | | | (1.87 | ) | | | (3.04 | ) | | | (1.09 | ) | |
Net Asset Value, End of Period | | $ | 10.82 | | | $ | 15.24 | | | $ | 17.21 | | | $ | 17.86 | | | $ | 20.48 | | |
Total Return(3) | | | (8.44 | )% | | | 3.31 | % | | | 6.79 | % | | | 2.27 | % | | | 30.74 | % | |
Ratios and Supplemental Data: | |
Net Assets, End of Period (Thousands) | | $ | 177,690 | | | $ | 331,637 | | | $ | 494,967 | | | $ | 625,999 | | | $ | 948,311 | | |
Ratio of Expenses to Average Net Assets(7) | | | 0.95 | %(4)(5) | | | 1.00 | %(4) | | | 1.00 | %(4) | | | 0.98 | %(4) | | | 0.95 | %(4) | |
Ratio of Expenses to Average Net Assets Excluding Non Operating Expenses | | | 0.95 | %(4) | | | 1.00 | %(4) | | | N/A | | | | 0.98 | %(4) | | | 0.94 | %(4) | |
Ratio of Net Investment Income to Average Net Assets(7) | | | 2.44 | %(4) | | | 2.19 | %(4) | | | 1.73 | %(4) | | | 1.61 | %(4) | | | 1.90 | %(4) | |
Ratio of Rebate from Morgan Stanley Affiliates to Average Net Assets | | | 0.00 | %(6) | | | 0.00 | %(6) | | | 0.00 | %(6) | | | 0.00 | %(6) | | | 0.00 | %(6) | |
Portfolio Turnover Rate | | | 39 | % | | | 43 | % | | | 24 | % | | | 24 | % | | | 25 | % | |
(7) Supplemental Information on the Ratios to Average Net Assets: | |
Ratios Before Expense Limitation: | |
Expenses to Average Net Assets | | | 1.02 | % | | | 1.02 | % | | | 1.02 | % | | | N/A | | | | N/A | | |
Net Investment Income to Average Net Assets | | | 2.37 | % | | | 2.17 | % | | | 1.71 | % | | | N/A | | | | N/A | | |
(1) Reflects prior period Custodian out-of-pocket expenses that were reimbursed in September 2016. The amount of the reimbursement was immaterial on a per share basis and did not impact the total return of Class I shares. The Ratio of Expenses to Average Net Assets and the Ratio of Net Investment Income to Average Net Assets would be unchanged as the reimbursement of Custodian fees was offset against expense waivers/reimbursements with no impact to net expenses or net investment income.
(2) Per share amount is based on average shares outstanding.
(3) Calculated based on the net asset value as of the last business day of the period.
(4) The Ratios of Expenses and Net Investment Income reflect the rebate of certain Fund expenses in connection with the investments in Morgan Stanley affiliates during the period. The effect of the rebate on the ratios is disclosed in the above table as "Ratio of Rebate from Morgan Stanley Affiliates to Average Net Assets."
(5) Effective July 1, 2018, the Adviser has agreed to limit the ratio of expenses to average net assets to the maximum ratio of 0.90% for Class I shares. Prior to July 1, 2018, the maximum ratio was 1.00% for Class I shares.
(6) Amount is less than 0.005%.
The accompanying notes are an integral part of the financial statements.
14
Morgan Stanley Institutional Fund, Inc.
Annual Report — December 31, 2018
Financial Highlights
U.S. Real Estate Portfolio
| | | Class A | |
| | | Year Ended December 31, | |
Selected Per Share Data and Ratios | | 2018 | | 2017 | | 2016(1) | | 2015 | | 2014 | |
Net Asset Value, Beginning of Period | | $ | 14.76 | | | $ | 16.74 | | | $ | 17.42 | | | $ | 20.04 | | | $ | 16.21 | | |
Income (Loss) from Investment Operations: | |
Net Investment Income(2) | | | 0.29 | | | | 0.31 | | | | 0.24 | | | | 0.28 | | | | 0.29 | | |
Net Realized and Unrealized Gain (Loss) | | | (1.28 | ) | | | 0.15 | | | | 0.89 | | | | 0.08 | | | | 4.56 | | |
Total from Investment Operations | | | (0.99 | ) | | | 0.46 | | | | 1.13 | | | | 0.42 | | | | 4.85 | | |
Distributions from and/or in Excess of: | |
Net Investment Income | | | (0.30 | ) | | | (0.20 | ) | | | (0.32 | ) | | | (0.20 | ) | | | (0.28 | ) | |
Net Realized Gain | | | (3.09 | ) | | | (2.24 | ) | | | (1.49 | ) | | | (2.78 | ) | | | (0.74 | ) | |
Total Distributions | | | (3.39 | ) | | | (2.44 | ) | | | (1.81 | ) | | | (2.98 | ) | | | (1.02 | ) | |
Net Asset Value, End of Period | | $ | 10.38 | | | $ | 14.76 | | | $ | 16.74 | | | $ | 17.42 | | | $ | 20.04 | | |
Total Return(3) | | | (8.71 | )% | | | 2.98 | % | | | 6.47 | % | | | 2.01 | % | | | 30.28 | % | |
Ratios and Supplemental Data: | |
Net Assets, End of Period (Thousands) | | $ | 34,459 | | | $ | 55,640 | | | $ | 76,082 | | | $ | 87,462 | | | $ | 107,441 | | |
Ratio of Expenses to Average Net Assets(7) | | | 1.26 | %(4)(5) | | | 1.34 | %(4) | | | 1.29 | %(4) | | | 1.28 | %(4) | | | 1.31 | %(4) | |
Ratio of Expenses to Average Net Assets Excluding Non Operating Expenses | | | 1.26 | %(4) | | | 1.34 | %(4) | | | N/A | | | | 1.28 | %(4) | | | 1.30 | %(4) | |
Ratio of Net Investment Income to Average Net Assets(7) | | | 2.14 | %(4) | | | 1.87 | %(4) | | | 1.37 | %(4) | | | 1.43 | %(4) | | | 1.54 | %(4) | |
Ratio of Rebate from Morgan Stanley Affiliates to Average Net Assets | | | 0.00 | %(6) | | | 0.00 | %(6) | | | 0.00 | %(6) | | | 0.00 | %(6) | | | 0.00 | %(6) | |
Portfolio Turnover Rate | | | 39 | % | | | 43 | % | | | 24 | % | | | 24 | % | | | 25 | % | |
(7) Supplemental Information on the Ratios to Average Net Assets: | |
Ratios Before Expense Limitation: | |
Expenses to Average Net Assets | | | 1.30 | % | | | N/A | | | | 1.30 | % | | | N/A | | | | N/A | | |
Net Investment Income to Average Net Assets | | | 2.10 | % | | | N/A | | | | 1.36 | % | | | N/A | | | | N/A | | |
(1) Reflects prior period Custodian out-of-pocket expenses that were reimbursed in September 2016. The amount of the reimbursement was immaterial on a per share basis and did not impact the total return of Class A shares. The Ratio of Expenses to Average Net Assets would have been less than 0.005% higher and the Ratio of Net Investment Income to Average Net Assets would have been less than 0.005% lower had the Custodian not reimbursed the Fund.
(2) Per share amount is based on average shares outstanding.
(3) Calculated based on the net asset value which does not reflect sales charges, if applicable, as of the last business day of the period.
(4) The Ratios of Expenses and Net Investment Income reflect the rebate of certain Fund expenses in connection with the investments in Morgan Stanley affiliates during the period. The effect of the rebate on the ratios is disclosed in the above table as "Ratio of Rebate from Morgan Stanley Affiliates to Average Net Assets."
(5) Effective July 1, 2018, the Adviser has agreed to limit the ratio of expenses to average net assets to the maximum ratio of 1.25% for Class A shares. Prior to July 1, 2018, the maximum ratio was 1.35% for Class A shares.
(6) Amount is less than 0.005%.
The accompanying notes are an integral part of the financial statements.
15
Morgan Stanley Institutional Fund, Inc.
Annual Report — December 31, 2018
Financial Highlights
U.S. Real Estate Portfolio
| | | Class L | |
| | | Year Ended December 31, | |
Selected Per Share Data and Ratios | | 2018 | | 2017 | | 2016(1) | | 2015 | | 2014 | |
Net Asset Value, Beginning of Period | | $ | 14.74 | | | $ | 16.73 | | | $ | 17.41 | | | $ | 20.03 | | | $ | 16.20 | | |
Income (Loss) from Investment Operations: | |
Net Investment Income(2) | | | 0.23 | | | | 0.22 | | | | 0.15 | | | | 0.21 | | | | 0.20 | | |
Net Realized and Unrealized Gain (Loss) | | | (1.28 | ) | | | 0.15 | | | | 0.89 | | | | 0.04 | | | | 4.56 | | |
Total from Investment Operations | | | (1.05 | ) | | | 0.37 | | | | 1.04 | | | | 0.25 | | | | 4.76 | | |
Distributions from and/or in Excess of: | |
Net Investment Income | | | (0.23 | ) | | | (0.12 | ) | | | (0.23 | ) | | | (0.09 | ) | | | (0.19 | ) | |
Net Realized Gain | | | (3.09 | ) | | | (2.24 | ) | | | (1.49 | ) | | | (2.78 | ) | | | (0.74 | ) | |
Total Distributions | | | (3.32 | ) | | | (2.36 | ) | | | (1.72 | ) | | | (2.87 | ) | | | (0.93 | ) | |
Net Asset Value, End of Period | | $ | 10.37 | | | $ | 14.74 | | | $ | 16.73 | | | $ | 17.41 | | | $ | 20.03 | | |
Total Return(3) | | | (9.16 | )% | | | 2.37 | % | | | 5.91 | % | | | 1.44 | % | | | 29.68 | % | |
Ratios and Supplemental Data: | |
Net Assets, End of Period (Thousands) | | $ | 2,057 | | | $ | 2,787 | | | $ | 3,471 | | | $ | 3,993 | | | $ | 4,919 | | |
Ratio of Expenses to Average Net Assets(7) | | | 1.79 | %(4)(5) | | | 1.85 | %(4) | | | 1.84 | %(4) | | | 1.82 | %(4) | | | 1.79 | %(4) | |
Ratio of Expenses to Average Net Assets Excluding Non Operating Expenses | | | 1.79 | %(4) | | | 1.85 | %(4) | | | N/A | | | | 1.81 | %(4) | | | 1.78 | %(4) | |
Ratio of Net Investment Income to Average Net Assets(7) | | | 1.71 | %(4) | | | 1.37 | %(4) | | | 0.84 | %(4) | | | 1.08 | %(4) | | | 1.06 | %(4) | |
Ratio of Rebate from Morgan Stanley Affiliates to Average Net Assets | | | 0.00 | %(6) | | | 0.00 | %(6) | | | 0.00 | %(6) | | | 0.00 | %(6) | | | 0.00 | %(6) | |
Portfolio Turnover Rate | | | 39 | % | | | 43 | % | | | 24 | % | | | 24 | % | | | 25 | % | |
(7) Supplemental Information on the Ratios to Average Net Assets: | |
Ratios Before Expense Limitation: | |
Expenses to Average Net Assets | | | 1.84 | % | | | 1.89 | % | | | 1.84 | % | | | N/A | | | | N/A | | |
Net Investment Income to Average Net Assets | | | 1.66 | % | | | 1.33 | % | | | 0.84 | % | | | N/A | | | | N/A | | |
(1) Reflects prior period Custodian out-of-pocket expenses that were reimbursed in September 2016. The amount of the reimbursement was immaterial on a per share basis and did not impact the total return of Class L shares. The Ratio of Expenses to Average Net Assets would have been less than 0.005% higher and the Ratio of Net Investment Income to Average Net Assets would have been less than 0.005% lower had the Custodian not reimbursed the Fund.
(2) Per share amount is based on average shares outstanding.
(3) Calculated based on the net asset value as of the last business day of the period.
(4) The Ratios of Expenses and Net Investment Income reflect the rebate of certain Fund expenses in connection with the investments in Morgan Stanley affiliates during the period. The effect of the rebate on the ratios is disclosed in the above table as "Ratio of Rebate from Morgan Stanley Affiliates to Average Net Assets."
(5) Effective July 1, 2018, the Adviser has agreed to limit the ratio of expenses to average net assets to the maximum ratio of 1.75% for Class L shares. Prior to July 1, 2018, the maximum ratio was 1.85% for Class L shares.
(6) Amount is less than 0.005%.
The accompanying notes are an integral part of the financial statements.
16
Morgan Stanley Institutional Fund, Inc.
Annual Report — December 31, 2018
Financial Highlights
U.S. Real Estate Portfolio
| | | Class C | |
| | | Year Ended December 31, | | Period from
April 30, 2015(2) to | |
Selected Per Share Data and Ratios | | 2018 | | 2017 | | 2016(1) | | December 31, 2015 | |
Net Asset Value, Beginning of Period | | $ | 14.68 | | | $ | 16.67 | | | $ | 17.36 | | | $ | 19.73 | | |
Income (Loss) from Investment Operations: | |
Net Investment Income(3) | | | 0.19 | | | | 0.20 | | | | 0.13 | | | | 0.18 | | |
Net Realized and Unrealized Gain (Loss) | | | (1.29 | ) | | | 0.13 | | | | 0.87 | | | | 0.31 | | |
Total from Investment Operations | | | (1.10 | ) | | | 0.33 | | | | 1.00 | | | | 0.49 | | |
Distributions from and/or in Excess of: | |
Net Investment Income | | | (0.18 | ) | | | (0.08 | ) | | | (0.20 | ) | | | (0.08 | ) | |
Net Realized Gain | | | (3.09 | ) | | | (2.24 | ) | | | (1.49 | ) | | | (2.78 | ) | |
Total Distributions | | | (3.27 | ) | | | (2.32 | ) | | | (1.69 | ) | | | (2.86 | ) | |
Net Asset Value, End of Period | | $ | 10.31 | | | $ | 14.68 | | | $ | 16.67 | | | $ | 17.36 | | |
Total Return(4) | | | (9.47 | )% | | | 2.14 | % | | | 5.72 | % | | | 2.70 | %(8) | |
Ratios and Supplemental Data: | |
Net Assets, End of Period (Thousands) | | $ | 338 | | | $ | 486 | | | $ | 427 | | | $ | 91 | | |
Ratio of Expenses to Average Net Assets(10) | | | 2.05 | %(5)(6) | | | 2.10 | %(5) | | | 2.10 | %(5) | | | 2.10 | %(5)(9) | |
Ratio of Expenses to Average Net Assets Excluding Non Operating Expenses | | | 2.05 | %(5) | | | 2.10 | %(5) | | | N/A | | | | 2.10 | %(5)(9) | |
Ratio of Net Investment Income to Average Net Assets(10) | | | 1.39 | %(5) | | | 1.21 | %(5) | | | 0.73 | %(5) | | | 1.44 | %(5)(9) | |
Ratio of Rebate from Morgan Stanley Affiliates to Average Net Assets | | | 0.00 | %(7) | | | 0.00 | %(7) | | | 0.00 | %(7) | | | 0.00 | %(7)(9) | |
Portfolio Turnover Rate | | | 39 | % | | | 43 | % | | | 24 | % | | | 24 | % | |
(10) Supplemental Information on the Ratios to Average Net Assets: | |
Ratios Before Expense Limitation: | |
Expenses to Average Net Assets | | | 2.75 | % | | | 2.46 | % | | | 3.13 | % | | | 5.89 | %(9) | |
Net Investment Income (Loss) to Average Net Assets | | | 0.69 | % | | | 0.85 | % | | | (0.30 | )% | | | (2.35 | )%(9) | |
(1) Reflects prior period Custodian out-of-pocket expenses that were reimbursed in September 2016. The amount of the reimbursement was immaterial on a per share basis and did not impact the total return of Class C shares. The Ratio of Expenses to Average Net Assets and the Ratio of Net Investment Income to Average Net Assets would be unchanged as the reimbursement of Custodian fees was offset against expense waivers/reimbursements with no impact to net expenses or net investment income.
(2) Commencement of Offering.
(3) Per share amount is based on average shares outstanding.
(4) Calculated based on the net asset value which does not reflect sales charges, if applicable, as of the last business day of the period.
(5) The Ratios of Expenses and Net Investment Income reflect the rebate of certain Fund expenses in connection with the investments in Morgan Stanley affiliates during the period. The effect of the rebate on the ratios is disclosed in the above table as "Ratio of Rebate from Morgan Stanley Affiliates to Average Net Assets."
(6) Effective July 1, 2018, the Adviser has agreed to limit the ratio of expenses to average net assets to the maximum ratio of 2.00% for Class C shares. Prior to July 1, 2018, the maximum ratio was 2.10% for Class C shares.
(7) Amount is less than 0.005%.
(8) Not annualized.
(9) Annualized.
The accompanying notes are an integral part of the financial statements.
17
Morgan Stanley Institutional Fund, Inc.
Annual Report — December 31, 2018
Financial Highlights
U.S. Real Estate Portfolio
| | | Class IS | |
| | | Year Ended December 31, | |
Selected Per Share Data and Ratios | | 2018 | | 2017 | | 2016(1) | | 2015 | | 2014 | |
Net Asset Value, Beginning of Period | | $ | 15.24 | | | $ | 17.22 | | | $ | 17.86 | | | $ | 20.48 | | | $ | 16.55 | | |
Income (Loss) from Investment Operations: | |
Net Investment Income(2) | | | 0.28 | | | | 0.39 | | | | 0.33 | | | | 0.36 | | | | 0.38 | | |
Net Realized and Unrealized Gain (Loss) | | | (1.26 | ) | | | 0.14 | | | | 0.92 | | | | 0.08 | | | | 4.65 | | |
Total from Investment Operations | | | (0.98 | ) | | | 0.53 | | | | 1.25 | | | | 0.44 | | | | 5.03 | | |
Distributions from and/or in Excess of: | |
Net Investment Income | | | (0.35 | ) | | | (0.27 | ) | | | (0.40 | ) | | | (0.28 | ) | | | (0.36 | ) | |
Net Realized Gain | | | (3.09 | ) | | | (2.24 | ) | | | (1.49 | ) | | | (2.78 | ) | | | (0.74 | ) | |
Total Distributions | | | (3.44 | ) | | | (2.51 | ) | | | (1.89 | ) | | | (3.06 | ) | | | (1.10 | ) | |
Net Asset Value, End of Period | | $ | 10.82 | | | $ | 15.24 | | | $ | 17.22 | | | $ | 17.86 | | | $ | 20.48 | | |
Total Return(3) | | | (8.36 | )% | | | 3.32 | % | | | 6.96 | % | | | 2.36 | % | | | 30.82 | % | |
Ratios and Supplemental Data: | |
Net Assets, End of Period (Thousands) | | $ | 29,523 | | | $ | 196,536 | | | $ | 195,490 | | | $ | 141,670 | | | $ | 12 | | |
Ratio of Expenses to Average Net Assets(7) | | | 0.91 | %(4)(5) | | | 0.93 | %(4) | | | 0.89 | %(4) | | | 0.90 | %(4) | | | 0.89 | %(4) | |
Ratio of Expenses to Average Net Assets Excluding Non Operating Expenses | | | 0.91 | %(4) | | | 0.93 | %(4) | | | N/A | | | | 0.90 | %(4) | | | 0.88 | %(4) | |
Ratio of Net Investment Income to Average Net Assets(7) | | | 1.98 | %(4) | | | 2.33 | %(4) | | | 1.79 | %(4) | | | 1.81 | %(4) | | | 1.96 | %(4) | |
Ratio of Rebate from Morgan Stanley Affiliates to Average Net Assets | | | 0.00 | %(6) | | | 0.00 | %(6) | | | 0.00 | %(6) | | | 0.00 | %(6) | | | 0.00 | %(6) | |
Portfolio Turnover Rate | | | 39 | % | | | 43 | % | | | 24 | % | | | 24 | % | | | 25 | % | |
(7) Supplemental Information on the Ratios to Average Net Assets: | |
Ratios Before Expense Limitation: | |
Expenses to Average Net Assets | | | 0.97 | % | | | N/A | | | | 0.90 | % | | | 0.90 | % | | | 20.21 | % | |
Net Investment Income (Loss) to Average Net Assets | | | 1.92 | % | | | N/A | | | | 1.78 | % | | | 1.81 | % | | | (17.36 | )% | |
(1) Reflects prior period Custodian out-of-pocket expenses that were reimbursed in September 2016. The amount of the reimbursement was immaterial on a per share basis and did not impact the total return of Class IS shares. The Ratio of Expenses to Average Net Assets would have been less than 0.005% higher and the Ratio of Net Investment Income to Average Net Assets would have been less than 0.005% lower had the Custodian not reimbursed the Fund.
(2) Per share amount is based on average shares outstanding.
(3) Calculated based on the net asset value as of the last business day of the period.
(4) The Ratios of Expenses and Net Investment Income reflect the rebate of certain Fund expenses in connection with the investments in Morgan Stanley affiliates during the period. The effect of the rebate on the ratios is disclosed in the above table as "Ratio of Rebate from Morgan Stanley Affiliates to Average Net Assets."
(5) Effective July 1, 2018, the Adviser has agreed to limit the ratio of expenses to average net assets to the maximum ratio of 0.83% for Class IS shares. Prior to July 1, 2018, the maximum ratio was 0.93% for Class IS shares.
(6) Amount is less than 0.005%.
The accompanying notes are an integral part of the financial statements.
18
Morgan Stanley Institutional Fund, Inc.
Annual Report — December 31, 2018
Financial Highlights
U.S. Real Estate Portfolio
| | | Class IR | |
| Selected Per Share Data and Ratios | | Period from
June 15, 2018(1) to
December 31, 2018 | |
Net Asset Value, Beginning of Period | | $ | 14.74 | | |
Income (Loss) from Investment Operations: | |
Net Investment Income(2) | | | 0.43 | | |
Net Realized and Unrealized Loss | | | (0.98 | ) | |
Total from Investment Operations | | | (0.55 | ) | |
Distributions from and/or in Excess of: | |
Net Investment Income | | | (0.28 | ) | |
Net Realized Gain | | | (3.09 | ) | |
Total Distributions | | | (3.37 | ) | |
Net Asset Value, End of Period | | $ | 10.82 | | |
Total Return(3) | | | (5.73 | )%(7) | |
Ratios and Supplemental Data: | |
Net Assets, End of Period (Thousands) | | $ | 7 | | |
Ratio of Expenses to Average Net Assets(9) | | | 0.84 | %(4)(5)(8) | |
Ratio of Expenses to Average Net Assets Excluding Non Operating Expenses | | | 0.84 | %(4)(8) | |
Ratio of Net Investment Income to Average Net Assets(9) | | | 4.23 | %(4)(8) | |
Ratio of Rebate from Morgan Stanley Affiliates to Average Net Assets | | | 0.00 | %(6)(8) | |
Portfolio Turnover Rate | | | 39 | % | |
(9) Supplemental Information on the Ratios to Average Net Assets: | |
Ratios Before Expense Limitation: | |
Expenses to Average Net Assets | | | 19.12 | %(8) | |
Net Investment Loss to Average Net Assets | | | (14.05 | )%(8) | |
(1) Commencement of Offering.
(2) Per share amount is based on average shares outstanding.
(3) Calculated based on the net asset value as of the last business day of the period.
(4) The Ratios of Expenses and Net Investment Income reflect the rebate of certain Fund expenses in connection with the investments in Morgan Stanley affiliates during the period. The effect of the rebate on the ratios is disclosed in the above table as "Ratio of Rebate from Morgan Stanley Affiliates to Average Net Assets."
(5) Effective July 1, 2018, the Adviser has agreed to limit the ratio of expenses to average net assets to the maximum ratio of 0.83% for Class IR shares. Prior to July 1, 2018, the maximum ratio was 0.93% for Class IR shares.
(6) Amount is less than 0.005%.
(7) Not annualized.
(8) Annualized.
The accompanying notes are an integral part of the financial statements.
19
Morgan Stanley Institutional Fund, Inc.
Annual Report — December 31, 2018
Notes to Financial Statements
Morgan Stanley Institutional Fund, Inc. (the "Company") is registered under the Investment Company Act of 1940, as amended (the "Act"), as an open-end management investment company. The Company is comprised of thirty separate, active, diversified and non-diversified funds (individually referred to as a "Fund", collectively as the "Funds"). The Company applies investment company accounting and reporting guidance.
The accompanying financial statements relate to the U.S. Real Estate Portfolio. The Fund seeks to provide above average current income and long-term capital appreciation by investing primarily in equity securities of companies in the U.S. real estate industry, including real estate investment trusts ("REITs"). The Fund has a capital subscription commitment to an investee company for this same purpose, the details of which are disclosed in the Unfunded Commitments note.
The Fund offers six classes of shares — Class I, Class A, Class L, Class C, Class IS and Class IR. On April 30, 2015, the Fund suspended offering of Class L shares. Existing Class L shareholders may invest through reinvestment of dividends and distributions. On June 15, 2018, the Fund commenced offering Class IR shares.
A. Significant Accounting Policies: The following significant accounting policies are in conformity with U.S. generally accepted accounting principles ("GAAP"). Such policies are consistently followed by the Company in the preparation of its financial statements. GAAP may require management to make estimates and assumptions that affect the reported amounts and disclosures in the financial statements. Actual results may differ from those estimates.
In August 2018, the Financial Accounting Standards Board ("FASB") issued Accounting Standards Update ("ASU") 2018-13, Fair Value Measurement (Topic 820) — Disclosures Framework — Changes to Disclosure Requirements of Fair Value Measurement ("ASU 2018-13") which introduces new fair value disclosure requirements as well as eliminates and modifies certain existing fair value disclosure requirements. ASU 2018-13 would be effective for fiscal years beginning after December 15, 2019 and for interim periods within those fiscal years; however, management has elected to early adopt ASU 2018-13 effective with the current reporting period as permitted by the standard. The impact of the Fund's adoption was limited to changes in the Fund's financial statement disclosures regarding fair value, primarily those disclosures related to transfers between levels of the fair value hierarchy
and disclosure of the range and weighted average used to develop significant unobservable inputs for Level 3 fair value measurements, when applicable.
1. Security Valuation: (1) An equity portfolio security listed or traded on an exchange is valued at its latest reported sales price (or at the exchange official closing price if such exchange reports an official closing price), and if there were no sales on a given day and if there is no official exchange closing price for that day, the security is valued at the mean between the last reported bid and asked prices if such bid and asked prices are available on the relevant exchanges. Listed equity securities not traded on the valuation date with no reported bid and asked prices available on the exchange are valued at the mean between the current bid and asked prices obtained from one or more reputable brokers or dealers. In cases where a security is traded on more than one exchange, the security is valued on the exchange designated as the primary market; (2) all other equity portfolio securities for which over-the-counter ("OTC") market quotations are readily available are valued at the latest reported sales price (or at the market official closing price if such market reports an official closing price), and if there was no trading in the security on a given day and if there is no official closing price from relevant markets for that day, the security is valued at the mean between the last reported bid and asked prices if such bid and asked prices are available on the relevant markets. An unlisted equity security that does not trade on the valuation date and for which bid and asked prices from the relevant markets are unavailable is valued at the mean between the current bid and asked prices obtained from one or more reputable brokers or dealers; (3) certain portfolio securities may be valued by an outside pricing service/vendor approved by the Company's Board of Directors (the "Directors"). The pricing service/vendor may employ a pricing model that takes into account, among other things, bids, yield spreads and/or other market data and specific security characteristics. Alternatively, if a valuation is not available from an outside pricing service/vendor, and the security trades on an exchange, the security may be valued at its latest reported sale price (or at the exchange official closing price if such exchange reports an official closing price), prior to the time when assets are valued. If there are no sales on a given day and if there is no official exchange closing price for that day, the security is valued at the mean between the last reported bid and
20
Morgan Stanley Institutional Fund, Inc.
Annual Report — December 31, 2018
Notes to Financial Statements (cont'd)
asked prices if such bid and asked prices are available in the relevant exchanges; (4) when market quotations are not readily available, including circumstances under which Morgan Stanley Investment Management Inc. (the "Adviser") determines that the closing price, last sale price or the mean between the last reported bid and asked prices are not reflective of a security's market value, portfolio securities are valued at their fair value as determined in good faith under procedures established by and under the general supervision of the Directors. Occasionally, developments affecting the closing prices of securities and other assets may occur between the times at which valuations of such securities are determined (that is, close of the foreign market on which the securities trade) and the close of business of the New York Stock Exchange ("NYSE"). If developments occur during such periods that are expected to materially affect the value of such securities, such valuations may be adjusted to reflect the estimated fair value of such securities as of the close of the NYSE, as determined in good faith by the Directors or by the Adviser using a pricing service and/or procedures approved by the Directors; (5) quotations of foreign portfolio securities, other assets and liabilities and forward contracts stated in foreign currency are translated into U.S. dollar equivalents at the prevailing market rates prior to the close of the NYSE; and (6) investments in mutual funds, including the Morgan Stanley Institutional Liquidity Funds, are valued at the net asset value ("NAV") as of the close of each business day.
The Directors have responsibility for determining in good faith the fair value of the investments, and the Directors may appoint others, such as the Company's Adviser or a valuation committee, to assist the Directors in determining fair value and to make the actual calculations pursuant to the fair valuation methodologies previously approved by the Directors. Under procedures approved by the Directors, the Company's Adviser has formed a Valuation Committee whose members are approved by the Directors. The Valuation Committee provides administration and oversight of the Company's valuation policies and procedures, which are reviewed at least annually by the Directors. These procedures allow the Company to utilize independent pricing services, quotations from securities and financial instrument dealers and other market sources to determine fair value.
The Fund invests a significant portion of its assets in securities of REITs. The market's perception of prospective declines in private real estate values and other financial assets may result in increased volatility of market prices that can negatively impact the valuation of certain issuers held by the Fund.
2. Fair Value Measurement: FASB Accounting Standards CodificationTM ("ASC") 820, "Fair Value Measurement" ("ASC 820"), defines fair value as the value that the Fund would receive to sell an investment or pay to transfer a liability in a timely transaction with an independent buyer in the principal market, or in the absence of a principal market, the most advantageous market for the investment or liability. ASC 820 establishes a three-tier hierarchy to distinguish between (1) inputs that reflect the assumptions market participants would use in valuing an asset or liability developed based on market data obtained from sources independent of the reporting entity (observable inputs) and (2) inputs that reflect the reporting entity's own assumptions about the assumptions market participants would use in valuing an asset or liability developed based on the best information available in the circumstances (unobservable inputs) and to establish classification of fair value measurements for disclosure purposes. Various inputs are used in determining the value of the Fund's investments. The inputs are summarized in the three broad levels listed below:
• Level 1 – unadjusted quoted prices in active markets for identical investments
• Level 2 – other significant observable inputs (including quoted prices for similar investments, interest rates, prepayment speeds, credit risk, etc.)
• Level 3 – significant unobservable inputs including the Fund's own assumptions in determining the fair value of investments. Factors considered in making this determination may include, but are not limited to, information obtained by contacting the issuer, analysts, or the appropriate stock exchange (for exchange-traded securities), analysis of the issuer's financial statements or other available documents and, if necessary, available information concerning other securities in similar circumstances
21
Morgan Stanley Institutional Fund, Inc.
Annual Report — December 31, 2018
Notes to Financial Statements (cont'd)
The inputs or methodology used for valuing securities are not necessarily an indication of the risk associated with investing in those securities and the determination of the significance of a particular input to the fair value measurement in its entirety requires judgment and considers factors specific to each security.
The following is a summary of the inputs used to value the Fund's investments as of December 31, 2018:
Investment Type | | Level 1
Unadjusted
quoted
prices
(000) | | Level 2
Other
significant
observable
inputs
(000) | | Level 3
Significant
unobservable
inputs
(000) | | Total
(000) | |
Assets: | |
Common Stocks | |
Apartments | | $ | 36,745 | | | $ | — | | | $ | — | | | $ | 36,745 | | |
Data Centers | | | 6,593 | | | | — | | | | — | | | | 6,593 | | |
Diversified | | | 11,686 | | | | — | | | | — | | | | 11,686 | | |
Health Care | | | 15,719 | | | | — | | | | — | | | | 15,719 | | |
Industrial | | | 13,301 | | | | — | | | | 552 | | | | 13,853 | | |
Lodging/Resorts | | | 23,745 | | | | — | | | | — | | | | 23,745 | | |
Office | | | 61,364 | | | | — | | | | — | | | | 61,364 | | |
Regional Malls | | | 34,671 | | | | — | | | | — | | | | 34,671 | | |
Self Storage | | | 12,155 | | | | — | | | | — | | | | 12,155 | | |
Shopping Centers | | | 16,008 | | | | — | | | | — | | | | 16,008 | | |
Single Family Homes | | | 8,184 | | | | — | | | | — | | | | 8,184 | | |
Specialty | | | 2,700 | | | | — | | | | — | | | | 2,700 | | |
Total Common Stocks | | | 242,871 | | | | — | | | | 552 | | | | 243,423 | | |
Total Assets | | $ | 242,871 | | | $ | — | | | $ | 552 | | | $ | 243,423 | | |
Transfers between investment levels may occur as the markets fluctuate and/or the availability of data used in an investment's valuation changes.
Following is a reconciliation of investments in which significant unobservable inputs (Level 3) were used in determining fair value:
| | | Common
Stocks
(000) | |
Beginning Balance | | $ | 1,646 | | |
Purchases | | | — | | |
Sales | | | (891 | ) | |
Amortization of discount | | | — | | |
Transfers in | | | — | | |
Transfers out | | | — | | |
Corporate actions | | | — | | |
Change in unrealized appreciation (depreciation) | | | 1,401 | | |
Realized gains (losses) | | | (1,604 | ) | |
Ending Balance | | $ | 552 | | |
Net change in unrealized depreciation from investments
still held as of December 31, 2018 | | $ | (334 | ) | |
The following table presents additional information about valuation techniques and inputs used for investments that are measured at fair value and categorized within Level 3 as of December 31, 2018:
| | | Fair Value at
December 31,
2018
(000) | | Valuation
Technique | | Unobservable
Input | |
Common
Stock
| | $ | 552
| | | Reported Capital balance,
adjustments for NAV practical
expedient; including,
adjustments for subsequent
Capital Calls, Return of Capital
and Significant Market Changes
between last Capital Statement
and Valuation Date | | Adjusted Capital
Balance
| |
3. Foreign Currency Translation and Foreign Investments: The books and records of the Fund are maintained in U.S. dollars. Foreign currency amounts are translated into U.S. dollars as follows:
– investments, other assets and liabilities at the prevailing rate of exchange on the valuation date;
– investment transactions and investment income at the prevailing rates of exchange on the dates of such transactions.
Although the net assets of the Fund are presented at the foreign exchange rates and market values at the close of the period, the Fund does not isolate that portion of the results of operations arising as a result of changes in the foreign exchange rates from the fluctuations arising from changes in the market prices of securities held at period end. Similarly, the Fund does not isolate the effect of changes in foreign exchange rates from the fluctuations arising from changes in the market prices of securities sold during the period. Accordingly, realized and unrealized foreign currency gains (losses) on investments in securities are included in the reported net realized and unrealized gains (losses) on investment transactions and balances. However, pursuant to U.S. federal income tax regulations, gains and losses from certain foreign currency transactions and the foreign currency portion of gains and losses realized on sales and maturities of foreign denominated debt securities are treated as ordinary income for U.S. federal income tax purposes.
Net realized gains (losses) on foreign currency transactions represent net foreign exchange gains (losses) from foreign currency forward exchange contracts, disposition
22
Morgan Stanley Institutional Fund, Inc.
Annual Report — December 31, 2018
Notes to Financial Statements (cont'd)
of foreign currencies, currency gains (losses) realized between the trade and settlement dates on securities transactions, and the difference between the amount of investment income and foreign withholding taxes recorded on the Fund's books and the U.S. dollar equivalent amounts actually received or paid. Net unrealized currency gains (losses) from valuing foreign currency denominated assets and liabilities at period end exchange rates are reflected as a component of unrealized appreciation (depreciation) in the Statement of Assets and Liabilities. The change in unrealized currency gains (losses) on foreign currency translations for the period is reflected in the Statement of Operations.
Foreign security and currency transactions may involve certain considerations and risks not typically associated with those of U.S. dollar denominated transactions as a result of, among other factors, fluctuations of exchange rates in relation to the U.S. dollar, the possibility of lower levels of governmental supervision and regulation of foreign securities markets and the possibility of political or economic instability.
Governmental approval for foreign investments may be required in advance of making an investment under certain circumstances in some countries, and the extent of foreign investments in domestic companies may be subject to limitation in other countries. Foreign ownership limitations also may be imposed by the charters of individual companies to prevent, among other concerns, violations of foreign investment limitations. As a result, an additional class of shares (identified as "Foreign" in the Portfolio of Investments) may be created and offered for investment. The "local" and "foreign shares" market values may differ. In the absence of trading of the foreign shares in such markets, the Fund values the foreign shares at the closing exchange price of the local shares.
4. Unfunded Commitments: Subject to the terms of a Subscription Agreement between the Fund and Exeter Industrial Value Fund LP, the Fund has made a subscription commitment of $8,500,000 for which it will receive 8,500,000 shares of common stock. As of December 31, 2018, Exeter Industrial Value Fund LP has drawn down approximately $7,905,000, which represents 93.0% of the commitment.
5. Restricted Securities: The Fund invests in unregistered or otherwise restricted securities. The term
"restricted securities" refers to securities that are unregistered or are held by control persons of the issuer and securities that are subject to contractual restrictions on their resale. As a result, restricted securities may be more difficult to value and the Fund may have difficulty disposing of such assets either in a timely manner or for a reasonable price. In order to dispose of an unregistered security, the Fund, where it has contractual rights to do so, may have to cause such security to be registered. A considerable period may elapse between the time the decision is made to sell the security and the time the security is registered so that the Fund can sell it. Contractual restrictions on the resale of securities vary in length and scope and are generally the result of a negotiation between the issuer and the acquirer of the securities. The Fund would, in either case, bear market risks during that period. Restricted securities are identified in the Portfolio of Investments.
6. Indemnifications: The Company enters into contracts that contain a variety of indemnifications. The Company's maximum exposure under these arrangements is unknown. However, the Company has not had prior claims or losses pursuant to these contracts and expects the risk of loss to be remote.
7. Dividends and Distributions to Shareholders: Dividends and distributions to shareholders are recorded on the ex-dividend date. Dividends from net investment income, if any, are declared and paid quarterly. Net realized capital gains, if any, are distributed at least annually.
8. Security Transactions, Income and Expenses: Security transactions are accounted for on the trade date (date the order to buy or sell is executed). Realized gains and losses on the sale of investment securities are determined on the specific identified cost method. Dividend income and other distributions are recorded on the ex-dividend date (except for certain foreign dividends which may be recorded as soon as the Fund is informed of such dividends) net of applicable withholding taxes. Interest income is recognized on the accrual basis except where collection is in doubt. Discounts are accreted and premiums are amortized over the life of the respective securities. Most expenses of the Company can be directly attributed to a particular Fund. Expenses which cannot be directly attributed are apportioned among the Funds based upon relative net assets or other appropriate methods. Income, expenses (other than class specific expenses — distribution and shareholder services, transfer agency and sub transfer
23
Morgan Stanley Institutional Fund, Inc.
Annual Report — December 31, 2018
Notes to Financial Statements (cont'd)
agency fees) and realized and unrealized gains or losses are allocated to each class of shares based upon their relative net assets.
The Fund owns shares of REITs which report information on the source of their distributions annually in the following calendar year. A portion of distributions received from REITs during the year is estimated to be a return of capital and is recorded as a reduction of their cost.
B. Advisory Fees: The Adviser, a wholly-owned subsidiary of Morgan Stanley, provides the Fund with advisory services under the terms of an Investment Advisory Agreement, paid quarterly, at the annual rate based on the daily net assets as follows:
First $500
million | | Next $500
million | | Over $1
billion | |
| | 0.80 | % | | | 0.75 | % | | | 0.70 | % | |
Effective July 1, 2018, the Fund's annual rate based on the daily net assets is as follows:
First $500
million | | Next $500
million | | Over $1
billion | |
| | 0.70 | % | | | 0.65 | % | | | 0.60 | % | |
For the year ended December 31, 2018, the advisory fee rate (net of waiver/rebate) was equivalent to an annual effective rate of 0.72% of the Fund's average daily net assets.
The Adviser has agreed to reduce its advisory fee and/or reimburse the Fund so that total annual portfolio operating expenses, excluding certain investment related expenses, taxes, interest and other extraordinary expenses (including litigation), will not exceed 1.00% for Class I shares, 1.35% for Class A shares, 1.85% for Class L shares, 2.10% for Class C shares, 0.93% for Class IS shares and 0.93% for Class IR shares. Effective July 1, 2018, the Adviser has agreed to reduce its advisory fee and/or reimburse the Fund so that the total annual operating expenses will not exceed for 0.90% Class I shares, 1.25% for Class A shares, 1.75% for Class L shares, 2.00% for Class C shares, 0.83% for Class IS shares and 0.83% for Class IR shares. The fee waivers and/or expense reimbursements will continue for at least one year from the date of the Fund's prospectus or until such time as the Directors act to discontinue all or a portion of such waivers and/or reimbursements when they deem such action is appropriate. For the year ended December 31, 2018, approximately $148,000 of advisory fees were waived and approximately $99,000 of other expenses were reimbursed by the Adviser pursuant to this arrangement.
C. Administration Fees: The Adviser also serves as Administrator to the Company and provides administrative services pursuant to an Administration Agreement for an annual fee, accrued daily and paid monthly, of 0.08% of the Fund's average daily net assets.
Under a Sub-Administration Agreement between the Administrator and State Street Bank and Trust Company ("State Street"), State Street provides certain administrative services to the Company. For such services, the Administrator pays State Street a portion of the fee the Administrator receives from the Fund.
D. Distribution and Shareholder Services Fees: Morgan Stanley Distribution, Inc. ("MSDI" or the "Distributor"), a wholly-owned subsidiary of the Adviser and an indirect subsidiary of Morgan Stanley, serves as the Company's Distributor of Fund shares pursuant to a Distribution Agreement. The Company has adopted a Shareholder Services Plan with respect to Class A shares pursuant to Rule 12b-1 under the Act. Under the Shareholder Services Plan, the Fund pays the Distributor a shareholder services fee, accrued daily and paid monthly, at an annual rate of 0.25% of the Fund's average daily net assets attributable to Class A shares.
The Company has adopted a Distribution and Shareholder Services Plan with respect to Class L shares pursuant to Rule 12b-1 under the Act. Under the Distribution and Shareholder Services Plan, the Fund pays the Distributor a distribution fee, accrued daily and paid monthly, at an annual rate of 0.50% and a shareholder services fee, accrued daily and paid monthly, at an annual rate of 0.25% of the Fund's average daily net assets attributable to Class L shares.
The Company has adopted a Distribution and Shareholder Services Plan with respect to Class C shares pursuant to Rule 12b-1 under the Act. Under the Distribution and Shareholder Services Plan, the Fund pays the Distributor a distribution fee, accrued daily and paid monthly, at an annual rate of 0.75% and a shareholder services fee, accrued daily and paid monthly, at an annual rate of 0.25% of the Fund's average daily net assets attributable to Class C shares.
The distribution and shareholder services fees are used to support the expenses associated with servicing and maintaining accounts. The Distributor may compensate other parties for providing shareholder support services to investors who purchase Class A, Class L and Class C shares.
24
Morgan Stanley Institutional Fund, Inc.
Annual Report — December 31, 2018
Notes to Financial Statements (cont'd)
E. Dividend Disbursing and Transfer Agent: The Company's dividend disbursing and transfer agent is DST Asset Manager Solutions, Inc. ("DST"). Pursuant to a Transfer Agency Agreement, the Company pays DST a fee based on the number of classes, accounts and transactions relating to the Funds of the Company.
F. Custodian Fees: State Street (the "Custodian") also serves as Custodian for the Company in accordance with a Custodian Agreement. The Custodian holds cash, securities and other assets of the Company as required by the Act. Custody fees are payable monthly based on assets held in custody, investment purchases and sales activity and account maintenance fees, plus reimbursement for certain out-of-pocket expenses.
G. Security Transactions and Transactions with Affiliates: For the year ended December 31, 2018, purchases and sales of investment securities for the Fund, other than long-term U.S. Government securities and short-term investments were approximately $149,336,000 and $436,238,000, respectively. There were no purchases and sales of long-term U.S. Government securities for the year ended December 31, 2018.
The Fund invests in the Institutional Class of the Morgan Stanley Institutional Liquidity Funds — Treasury Portfolio (the "Liquidity Funds"), an open-end management investment company managed by the Adviser. Advisory fees paid by the Fund are reduced by an amount equal to its pro-rata share of the advisory and administration fees paid by the Fund due to its investment in the Liquidity Funds. For the year ended December 31, 2018, advisory fees paid were reduced by approximately $4,000 relating to the Fund's investment in the Liquidity Funds.
A summary of the Fund's transactions in shares of affiliated investments during the year ended December 31, 2018 is as follows:
Affiliated
Investment
Company | | Value
December 31,
2017
(000) | | Purchases
at Cost
(000) | | Proceeds
from Sales
(000) | | Dividend
Income
(000) | |
Liquidity Funds | | $ | 1,942 | | | $ | 90,742 | | | $ | 92,684 | | | $ | 40 | | |
Affiliated
Investment
Company (cont'd) | | Realized
Gain (Loss)
(000) | | Change in
Unrealized
Appreciation
(Depreciation)
(000) | | Value
December 31,
2018
(000) | |
Liquidity Funds | | $ | — | | | $ | — | | | $ | — | | |
The Fund is permitted to purchase and sell securities ("cross-trade") from and to other Morgan Stanley funds as well as
other funds and client accounts for which the Adviser or an affiliate of the Adviser serves as investment adviser, pursuant to procedures approved by the Directors in compliance with Rule 17a-7 under the Act (the "Rule"). Each cross-trade is executed at the current market price in compliance with provisions of the Rule. For the year ended December 31, 2018, the Fund did not engage in any cross-trade transactions.
The Fund has an unfunded Deferred Compensation Plan (the "Compensation Plan"), which allows each independent Director to defer payment of all, or a portion, of the fees he or she receives for serving on the Board of Directors. Each eligible Director generally may elect to have the deferred amounts credited with a return equal to the total return on one or more of the Morgan Stanley funds that are offered as investment options under the Compensation Plan. Appreciation/depreciation and distributions received from these investments are recorded with an offsetting increase/decrease in the deferred compensation obligation and do not affect the NAV of the Fund.
H. Federal Income Taxes: It is the Fund's intention to continue to qualify as a regulated investment company and distribute all of its taxable and tax-exempt income. Accordingly, no provision for federal income taxes is required in the financial statements.
The Fund may be subject to taxes imposed by countries in which it invests. Such taxes are generally based on income and/or capital gains earned or repatriated. Taxes are accrued based on net investment income, net realized gains and net unrealized appreciation as such income and/or gains are earned. Taxes may also be based on transactions in foreign currency and are accrued based on the value of investments denominated in such currency.
FASB ASC 740-10, "Income Taxes — Overall", sets forth a minimum threshold for financial statement recognition of the benefit of a tax position taken or expected to be taken in a tax return. Management has concluded there are no significant uncertain tax positions that would require recognition in the financial statements. If applicable, the Fund recognizes interest accrued related to unrecognized tax benefits in "Interest Expense" and penalties in "Other Expenses" in the Statement of Operations. The Fund files tax returns with the U.S. Internal Revenue Service, New York and various states. Generally, each of the tax years in the four-year period ended December 31, 2018 remains subject to examination by taxing authorities.
The tax character of distributions paid may differ from the character of distributions for GAAP purposes due to short-term
25
Morgan Stanley Institutional Fund, Inc.
Annual Report — December 31, 2018
Notes to Financial Statements (cont'd)
capital gains being treated as ordinary income for tax purposes. The tax character of distributions paid during fiscal years 2018 and 2017 was as follows:
2018
Distributions
Paid From: | | 2017
Distributions
Paid From: | |
Ordinary
Income
(000) | | Long-Term
Capital Gain
(000) | | Ordinary
Income
(000) | | Long-Term
Capital Gain
(000) | |
| $ | 9,631 | | | $ | 63,103 | | | $ | 10,843 | | | $ | 78,064 | | |
The amount and character of income and gains to be distributed are determined in accordance with income tax regulations which may differ from GAAP. These book/tax differences are either considered temporary or permanent in nature.
Temporary differences are primarily due to differing book and tax treatments in the timing of the recognition of gains (losses) on certain investment transactions and the timing of the deductibility of certain expenses.
Permanent differences, primarily due to equalization debits, resulted in the following reclassifications among the components of net assets at December 31, 2018:
Total
Distributable
Earnings
(000) | | Paid-in-
Capital
(000) | |
| $ | (18,017 | ) | | $ | 18,017 | | |
At December 31, 2018, the components of distributable earnings for the Fund on a tax basis were as follows:
Undistributed
Ordinary
Income
(000) | | Undistributed
Long-Term
Capital Gain
(000) | |
| $ | 2,333 | | | $ | 5,577 | | |
I. Credit Facility: The Company and other Morgan Stanley funds participated in a $150,000,000 committed, unsecured revolving line of credit facility (the "Facility") with State Street. This Facility is to be used for temporary emergency purposes or funding of shareholder redemption requests. The interest rate on borrowings is based on the federal funds rate or 1 month LIBOR rate plus a spread. The Facility also has a commitment fee of 0.25% per annum based on the unused portion of the Facility. During the year ended December 31, 2018, the Fund did not have any borrowings under the Facility.
J. Other: At December 31, 2018, the Fund had record owners of 10% or greater. Investment activities of these shareholders could have a material impact on the Fund. The aggregate percentage of such owners was 50.6%.
26
Morgan Stanley Institutional Fund, Inc.
Annual Report — December 31, 2018
Report of Independent Registered Public Accounting Firm
To the Shareholders and Board of Directors of
Morgan Stanley Institutional Fund, Inc. —
U.S. Real Estate Portfolio
Opinion on the Financial Statements
We have audited the accompanying statement of assets and liabilities of U.S. Real Estate Portfolio (the "Fund") (one of the funds constituting the Morgan Stanley Institutional Fund, Inc. (the "Company")), including the portfolio of investments, as of December 31, 2018, and the related statement of operations for the year then ended, the statements of changes in net assets for each of the two years in the period then ended, the financial highlights for each of the five years in the period then ended and the related notes (collectively referred to as the "financial statements"). In our opinion, the financial statements present fairly, in all material respects, the financial position of U.S. Real Estate Portfolio (one of the funds constituting Morgan Stanley Institutional Fund, Inc.) at December 31, 2018, the results of its operations for the year then ended, the changes in its net assets for each of the two years in the period then ended and its financial highlights for each of the five years in the period then ended, in conformity with U.S. generally accepted accounting principles.
Basis for Opinion
These financial statements are the responsibility of the Company's management. Our responsibility is to express an opinion on the Fund's financial statements based on our audits. We are a public accounting firm registered with the Public Company Accounting Oversight Board (United States) ("PCAOB") and are required to be independent with respect to the Company in accordance with the U.S. federal securities law and the applicable rules and regulations of the Securities and Exchange Commission and the PCAOB.
We conducted our audits in accordance with the standards of the PCAOB. Those standards require that we plan and perform the audit to obtain reasonable assurance about whether the financial statements are free of material misstatement, whether due to error or fraud. The Company is not required to have, nor were we engaged to perform, an audit of the Company's internal control over financial reporting. As part of our audits, we are required to obtain an understanding of internal control over financial reporting, but not for the purpose of expressing an opinion on the effectiveness of the Company's internal control over financial reporting. Accordingly, we express no such opinion.
Our audits included performing procedures to assess the risks of material misstatement of the financial statements, whether due to error or fraud, and performing procedures that respond to those risks. Such procedures included examining, on a test basis, evidence regarding the amounts and disclosures in the financial statements. Our procedures included confirmation of securities owned as of December 31, 2018 by correspondence with the custodian and others or by other appropriate auditing procedures where replies from others were not received. Our audits also included evaluating the accounting principles used and significant estimates made by management, as well as evaluating the overall presentation of the financial statements. We believe that our audits provide a reasonable basis for our opinion.

We have served as the auditor of one or more Morgan Stanley investment companies since 2000.
Boston, Massachusetts
February 26, 2019
27
Morgan Stanley Institutional Fund, Inc.
Annual Report — December 31, 2018
Federal Tax Notice (unaudited)
For federal income tax purposes, the following information is furnished with respect to the distributions paid by the Fund during its taxable year ended December 31, 2018. For corporate shareholders, 0.2% of the dividends qualified for the dividends received deduction.
The Fund designated and paid approximately $63,103,000 as a long-term capital gain distribution.
For federal income tax purposes, the following information is furnished with respect to the Fund's earnings for its taxable year ended December 31, 2018. When distributed, certain earnings may be subject to a maximum tax rate of 15% as provided for by the Jobs and Growth Tax Relief Reconciliation Act of 2003. The Fund designated up to a maximum of approximately $3,000 as taxable at this lower rate.
In January, the Fund provides tax information to shareholders for the preceding calendar year.
28
Morgan Stanley Institutional Fund, Inc.
Annual Report — December 31, 2018
Privacy Notice (unaudited)
MORGAN STANLEY INVESTMENT MANAGEMENT INC.
AN IMPORTANT NOTICE CONCERNING OUR U.S. PRIVACY POLICY
We are required by federal law to provide you with a copy of our privacy policy annually. This policy applies to current and former individual investors in funds managed or sponsored by Morgan Stanley Investment Management Inc. ("MSIM") as well as current and former individual clients of MSIM. This policy is not applicable to partnerships, corporations, trusts or other non-individual clients or investors. Please note that we may amend this policy at any time, and will inform you of any changes as required by law.
WE RESPECT YOUR PRIVACY
We appreciate that you have provided us with your personal financial information. We strive to maintain the privacy of such information while we help you achieve your financial objectives. This Notice describes what non-public personal information we collect about you, why we collect it, when we may share it with others and how certain others may use it. It discusses the steps you may take to limit our sharing of certain information about you to affiliated companies in the Morgan Stanley family of companies ("other Morgan Stanley companies"). It also discloses how you may limit use of certain shared information for marketing purposes by other Morgan Stanley branded companies. Throughout this policy, we refer to the non-public information that personally identifies you or your accounts as "personal information."
1. WHAT PERSONAL INFORMATION DO WE COLLECT ABOUT YOU?
We obtain personal information from applications and other forms you submit to us, from your dealings with us, from consumer reporting agencies, from our Web sites and from third parties and other sources.
For example:
• We may collect information such as your name, address, e-mail address, telephone/fax numbers, assets, income and investment objectives through subscription documents, applications and other forms you submit to us.
• We may obtain information about account balances, your use of account(s) and the types of products and services you prefer to receive from us through your dealings and transactions with us and other sources.
• We may obtain information about your creditworthiness and credit history from consumer reporting agencies.
• We may collect background information from and through third-party vendors to verify representations you have made and to comply with various regulatory requirements.
• If you interact with us through our public and private Web sites, we may collect information that you provide directly through online communications (such as an e-mail address). We may also collect information about your Internet service provider, your domain name, your computer's operating system and Web browser, your use of our Web sites and your product and service preferences, through the use of "cookies." Please consult the Terms of Use of these sites for more details.
2. WHEN DO WE DISCLOSE PERSONAL INFORMATION WE COLLECT ABOUT YOU?
We may disclose personal information we collect about you to other Morgan Stanley companies and to non-affiliated third parties.
a. Information We Disclose to Other Morgan Stanley Companies.
We may disclose personal information to other Morgan Stanley companies for a variety of reasons, including to manage your account(s) effectively, to service and process your transactions, to let you know about products and services offered by us and other Morgan Stanley companies, to manage our business, and as otherwise required or permitted by law. Offers for products and services from other Morgan Stanley companies are developed under conditions designed to safeguard your personal information.
29
Morgan Stanley Institutional Fund, Inc.
Annual Report — December 31, 2018
Privacy Notice (unaudited) (cont'd)
b. Information We Disclose to Non-affiliated Third Parties.
We do not disclose personal information that we collect about you to non-affiliated third parties except to those who provide marketing services on our behalf, to financial institutions with whom we have joint marketing agreements, and as otherwise required or permitted by law. For example, we may disclose personal information to non-affiliated third parties for servicing and processing transactions, to offer our own products and services, to protect against fraud, for institutional risk control, to respond to judicial process or to perform services on our behalf. When we share personal information with a non-affiliated third party, they are required to limit their use of personal information to the particular purpose for which it was shared and they are not allowed to share personal information with others except to fulfill that limited purpose or as may be permitted or required by law.
3. HOW DO WE PROTECT THE SECURITY AND CONFIDENTIALITY OF PERSONAL INFORMATION WE COLLECT ABOUT YOU?
We maintain physical, electronic and procedural security measures to help safeguard the personal information we collect about you. We have internal policies governing the proper handling of client information. Third parties that provide support or marketing services on our behalf may also receive personal information, and we require them to adhere to confidentiality standards with respect to such information.
4. HOW CAN YOU LIMIT THE SHARING OF CERTAIN TYPES OF PERSONAL INFORMATION WITH OTHER MORGAN STANLEY COMPANIES?
We offer you choices as to whether we share with other Morgan Stanley companies the personal information that was collected to determine your eligibility for products and services you request ("eligibility information"). Eligibility information does not include your identification information or personal information pertaining to our transactions or experiences with you. Please note that, even if you direct us not to share eligibility information with other Morgan Stanley companies ("opt-out"), we may still share personal information, including eligibility information, with those companies in circumstances excluded from the opt-out under applicable law, such as to process transactions or to service your account.
5. HOW CAN YOU LIMIT THE USE OF CERTAIN TYPES OF PERSONAL INFORMATION BY OTHER MORGAN STANLEY COMPANIES FOR MARKETING?
By following the opt-out instructions in Section 6 below, you may limit other Morgan Stanley branded companies from marketing their products or services to you based on personal information we disclose to them. This information may include, for example, your income and account history with us. Please note that, even if you choose to limit Other Morgan Stanley Companies from using personal information about you that we may share with them for marketing their products and services to you, Other Morgan Stanley Companies may use your personal information that they obtain from us to market to you in circumstances permitted by law, such as if the Other Morgan Stanley Company has its own relationship with you.
6. HOW CAN YOU SEND US AN OPT-OUT INSTRUCTION?
If you wish to limit our sharing of eligibility information about you with other Morgan Stanley companies or other Morgan Stanley companies' use of personal information for marketing purposes, as described in this notice, you may do so by:
• Calling us at (800) 548-7786
Monday–Friday between 8a.m. and 6p.m.(EST)
• Writing to us at the following address:
DST Asset Manager Solutions, Inc.
c/o Privacy Coordinator
P.O. Box 219804
Kansas City, Missouri 64121
30
Morgan Stanley Institutional Fund, Inc.
Annual Report — December 31, 2018
Privacy Notice (unaudited) (cont'd)
Your written request should include your name, address, telephone number and account number(s) to which the opt-out applies and whether you are opting out with respect to sharing of eligibility information (Section 4 above), or if information used for Marketing (Section 5 above) or both. Written opt-out requests should not be sent with any other correspondence. In order to process your request, we require that the request be provided by you directly and not through a third party.
Your opt-out preference will remain in effect with respect to this policy (as it may be amended) until you notify us otherwise. If you have a joint account, your direction for us not to share this information with other Morgan Stanley companies and for those other Morgan Stanley companies not to use your personal information for marketing will be applied to all account holders on that account. Please understand that if you limit our sharing or our affiliated companies' use of personal information, you and any joint account holder(s) may not receive information about Morgan Stanley products and services, including products or services that could help you manage your financial resources and achieve your investment objectives.
7. WHAT IF AN AFFILIATED COMPANY BECOMES A NON-AFFILIATED THIRD PARTY?
If, at any time in the future, an affiliated company becomes a non-affiliated third party, further disclosures of personal information made to the former affiliated company will be limited to those described in Section 2(b) above relating to non-affiliated third parties. If you elected under Section 6 to limit disclosures we make to affiliated companies, or use of personal information by affiliated companies, your election will not apply to use by any former affiliated company of your personal information in their possession once it becomes a non-affiliated third party.
SPECIAL NOTICE TO RESIDENTS OF VERMONT
The following section supplements our policy with respect to our individual clients who have a Vermont address and supersedes anything to the contrary in the above policy with respect to those clients only.
The state of Vermont requires financial institutions to obtain your consent prior to sharing personal information that they collect about you with affiliated companies and non-affiliated third parties other than in certain limited circumstances. Except as permitted by law, we will not share personal information we collect about you with non-affiliated third parties or other Morgan Stanley companies unless you provide us with your written consent to share such information ("opt-in").
If you wish to receive offers for investment products and services offered by or through other Morgan Stanley companies, please notify us in writing at the following address:
DST Asset Manager Solutions, Inc.
c/o Privacy Coordinator
P.O. Box 219804
Kansas City, Missouri 64121
Your authorization should include your name, address, telephone number and account number(s) to which the opt-in applies and should not be sent with any other correspondence. In order to process your authorization, we require that the authorization be provided by you directly and not through a third party.
SPECIAL NOTICE TO RESIDENTS OF CALIFORNIA
The following section supplements our policy with respect to our individual clients who have a California address and supersedes anything to the contrary in the above policy with respect to those clients only.
In response to a California law, if your account has a California home address, your personal information will not be disclosed to non-affiliated third parties except as permitted by applicable California law, and we will limit sharing such information with our affiliates to comply with California privacy laws that apply to us.
31
Morgan Stanley Institutional Fund, Inc.
Annual Report — December 31, 2018
Director and Officer Information (unaudited)
Independent Directors:
Name, Age and Address of
Independent Director | | Position(s)
Held with
Registrant | | Length of Time
Served* | | Principal Occupation(s) During Past 5 Years
and Other Relevant Professional Experience | | Number of
Portfolios in
Fund Complex
Overseen by
Independent
Director** | | Other Directorships
Held by Independent
Director*** | |
Frank L. Bowman (74)
c/o Perkins Coie LLP
Counsel to the Independent
Directors
30 Rockefeller Plaza
New York, NY 10112 | | Director | | Since
August
2006 | | President, Strategic Decisions, LLC (consulting) (since February 2009); Director or Trustee of various Morgan Stanley Funds (since August 2006); Chairperson of the Compliance and Insurance Committee (since October 2015); formerly, Chairperson of the Insurance Sub-Committee of the Compliance and Insurance Committee (2007-2015); served as President and Chief Executive Officer of the Nuclear Energy Institute (policy organization) (February 2005-November 2008); retired as Admiral, U.S. Navy after serving over 38 years on active duty including 8 years as Director of the Naval Nuclear Propulsion Program in the Department of the Navy and the U.S. Department of Energy (1996-2004); served as Chief of Naval Personnel (July 1994-September 1996) and on the Joint Staff as Director of Political Military Affairs (June 1992-July 1994); knighted as Honorary Knight Commander of the Most Excellent Order of the British Empire; awarded the Officier de l'Orde National du Mérite by the French Government; elected to the National Academy of Engineering (2009). | | | 82 | | | Director of BP p.l.c.; Director of Naval and Nuclear Technologies LLP; Director Emeritus of the Armed Services YMCA; Member of the National Security Advisory Council of the Center for U.S. Global Engagement and a member of the CNA Military Advisory Board; Trustee of Fairhaven United Methodist Church; Member of the Board of Advisors of the Dolphin Scholarship Foundation; and Director of other various non-profit organizations. | |
Kathleen A. Dennis (65)
c/o Perkins Coie LLP
Counsel to the Independent Directors
30 Rockefeller Plaza
New York, NY 10112 | | Director | | Since
August
2006 | | President, Cedarwood Associates (mutual fund and investment management consulting) (since July 2006); Chairperson of the Liquidity and Alternatives Sub-Committee of the Investment Committee (since October 2006) and Director or Trustee of various Morgan Stanley Funds (since August 2006); formerly, Senior Managing Director of Victory Capital Management (1993-2006). | | | 82 | | | Director of various non-profit organizations. | |
Nancy C. Everett (63)
c/o Perkins Coie LLP
Counsel to the Independent Directors
30 Rockefeller Plaza
New York, NY 10112 | | Director | | Since
January
2015 | | Chief Executive Officer, Virginia Commonwealth University Investment Company (since November 2015); Owner, OBIR, LLC (institutional investment management consulting) (since June 2014); formerly, Managing Director, BlackRock Inc. (February 2011-December 2013); and Chief Executive Officer, General Motors Asset Management (a/k/a Promark Global Advisors, Inc.) (June 2005-May 2010). | | | 83 | | | Formerly, Member of Virginia Commonwealth University School of Business Foundation (2005-2016); Member of Virginia Commonwealth University Board of Visitors (2013-2015); Member of Committee on Directors for Emerging Markets Growth Fund, Inc. (2007-2010); Chairperson of Performance Equity Management, LLC (2006-2010); and Chairperson, GMAM Absolute Return Strategies Fund, LLC (2006-2010). | |
32
Morgan Stanley Institutional Fund, Inc.
Annual Report — December 31, 2018
Director and Officer Information (unaudited) (cont'd)
Independent Directors: (cont'd)
Name, Age and Address of
Independent Director | | Position(s)
Held with
Registrant | | Length of Time
Served* | | Principal Occupation(s) During Past 5 Years
and Other Relevant Professional Experience | | Number of
Portfolios in
Fund Complex
Overseen by
Independent
Director** | | Other Directorships
Held by Independent
Director*** | |
Jakki L. Haussler (61)
c/o Perkins Coie LLP
Counsel to the Independent Directors
30 Rockefeller Plaza
New York, NY 10112 | | Director | | Since
January
2015 | | Chairman and Chief Executive Officer, Opus Capital Group (since January 1996); formerly, Director, Capvest Venture Fund, LP (May 2000-December 2011); Partner, Adena Ventures, LP (July 1999-December 2010); Director, The Victory Funds (February 2005-July 2008). | | | 83 | | | Director of Service Corporation International and Member, Audit Committee and Investment Committee; Director of Cincinnati Bell Inc. and Member, Audit Committee and Governance and Nominating Committee; Chairman of Northern Kentucky University Member Investment Committee; Member of Chase College of Law Transactional Law Practice Center Board of Advisors; Director of Best Transport; Director of Chase College of Law Board of Visitors; formerly, Member, University of Cincinnati Foundation Investment Committee; Member, Miami University Board of Visitors (2008-2011); Trustee of Victory Funds (2005-2008) and Chairman, Investment Committee (2007-2008) and Member, Service Provider Committee (2005-2008). | |
Dr. Manuel H. Johnson (69)
c/o Johnson Smick
International, Inc.
220 I Street, NE — Suite 200
Washington, D.C. 20002 | | Director | | Since
July
1991 | | Senior Partner, Johnson Smick International, Inc. (consulting firm); Chairperson of the Investment Committee (since October 2006) and Director or Trustee of various Morgan Stanley Funds (since July 1991); Co-Chairman and a founder of the Group of Seven Council (G7C) (international economic commission); formerly, Chairperson of the Audit Committee (July 1991-September 2006), Vice Chairman of the Board of Governors of the Federal Reserve System and Assistant Secretary of the U.S. Treasury. | | | 82 | | | Director of NVR, Inc. (home construction). | |
Joseph J. Kearns (76)
c/o Perkins Coie LLP
Counsel to the Independent Directors
30 Rockefeller Plaza
New York, NY 10112 | | Director | | Since
August
1994 | | Senior Adviser, Kearns & Associates LLC (investment consulting); Chairperson of the Audit Committee (since October 2006) and Director or Trustee of various Morgan Stanley Funds (since August 1994); formerly, Deputy Chairperson of the Audit Committee (July 2003-September 2006) and Chairperson of the Audit Committee of various Morgan Stanley Funds (since August 1994); CFO of the J. Paul Getty Trust. | | | 83 | | | Prior to August 10, 2016, Director of Electro Rent Corporation (equipment leasing); Prior to December 31, 2013, Director of The Ford Family Foundation. | |
33
Morgan Stanley Institutional Fund, Inc.
Annual Report — December 31, 2018
Director and Officer Information (unaudited) (cont'd)
Independent Directors: (cont'd)
Name, Age and Address of
Independent Director | | Position(s)
Held with
Registrant | | Length of Time
Served* | | Principal Occupation(s) During Past 5 Years
and Other Relevant Professional Experience | | Number of
Portfolios in
Fund Complex
Overseen by
Independent
Director** | | Other Directorships
Held by Independent
Director*** | |
Michael F. Klein (60)
c/o Perkins Coie LLP
Counsel to the Independent Directors
30 Rockefeller Plaza
New York, NY 10112 | | Director | | Since
August
2006 | | Managing Director, Aetos Alternatives Management, LP (since March 2000); Co-President, Aetos Alternatives Management, LP (since January 2004) and Co-Chief Executive Officer of Aetos Alternatives Management, LP (since August 2013); Chairperson of the Fixed Income Sub-Committee of the Investment Committee (since October 2006) and Director or Trustee of various Morgan Stanley Funds (since August 2006); formerly, Managing Director, Morgan Stanley & Co. Inc. and Morgan Stanley Dean Witter Investment Management and President, various Morgan Stanley Funds (June 1998-March 2000); Principal, Morgan Stanley & Co. Inc. and Morgan Stanley Dean Witter Investment Management (August 1997-December 1999). | | | 82 | | | Director of certain investment funds managed or sponsored by Aetos Alternatives Management, LP; Director of Sanitized AG and Sanitized Marketing AG (specialty chemicals). | |
Patricia Maleski (58)
c/o Perkins Coie LLP
Counsel to the Independent Directors
30 Rockefeller Plaza
New York, NY 10112 | | Director | | Since
January
2017 | | Managing Director, JPMorgan Asset Management (2004-2016); Oversight and Control Head of Fiduciary and Conflicts of Interest Program (2015-2016); Chief Control Officer-Global Asset Management (2013-2015); President, JPMorgan Funds (2010-2013); Chief Administrative Officer (2004-2013); various other positions including Treasurer and Board Liaison (since 2001). | | | 83 | | | None. | |
Michael E. Nugent (82)
522 Fifth Avenue
New York, NY 10036 | | Chair of the Board and Director | | Chair of the Boards since July 2006 and Director since July 1991 | | Chair of the Boards of various Morgan Stanley Funds (since July 2006); Chairperson of the Closed-End Fund Committee (since June 2012) Governance Committee (since January 2019) and Director or Trustee of various Morgan Stanley Funds (since July 1991); formerly, Chairperson of the Insurance Committee (until July 2006); General Partner, Triumph Capital, L.P. (private investment partnership) (1988-2013). | | | 82 | | | None. | |
W. Allen Reed (71)
c/o Perkins Coie LLP
Counsel to the Independent Directors
30 Rockefeller Plaza
New York, NY 10112 | | Director | | Since
August
2006 | | Chairperson of the Equity Sub-Committee of the Investment Committee (since October 2006) and Director or Trustee of various Morgan Stanley Funds (since August 2006); formerly, President and CEO of General Motors Asset Management; Chairman and Chief Executive Officer of the GM Trust Bank and Corporate Vice President of General Motors Corporation (August 1994-December 2005). | | | 82 | | | Director of Legg Mason, Inc.; formerly, Director of the Auburn University Foundation (2010-2015). | |
Fergus Reid (86)****
c/o Joe Pietryka, Inc.
85 Charles Colman Blvd.
Pawling, NY 12564 | | Director | | Since
June
1992 | | Chairman, Joe Pietryka, Inc.; Chairperson of the Governance Committee and Director or Trustee of various Morgan Stanley Funds (since June 1992). | | | 83 | | | Formerly, Trustee and Director of certain investment companies in the JP Morgan Fund Complex managed by JP Morgan Investment Management Inc. (1987-2012). | |
* This is the earliest date the Director began serving the Morgan Stanley Funds. Each Director serves an indefinite term, until his or her successor is elected.
** The Fund Complex includes (as of December 31, 2018) all open-end and closed-end funds (including all of their portfolios) advised by Morgan Stanley Investment Management Inc. (the "Adviser") and any funds that have an adviser that is an affiliated person of the Adviser (including, but not limited to, Morgan Stanley AIP GP LP).
*** This includes any directorships at public companies and registered investment companies held by the Director at any time during the past five years.
**** Effective date of retirement is December 31, 2018.
34
Morgan Stanley Institutional Fund, Inc.
Annual Report — December 31, 2018
Director and Officer Information (unaudited) (cont'd)
Executive Officers:
Name, Age and Address of Executive Officer | | Position(s) Held
with
Registrant | | Length of Time
Served* | | Principal Occupation(s) During Past 5 Years | |
John H. Gernon (55)
522 Fifth Avenue
New York, NY 10036 | | President and Principal Executive Officer | | Since
September
2013 | | President and Principal Executive Officer of the Equity and Fixed Income Funds and the Morgan Stanley AIP Funds (since September 2013) and the Liquidity Funds and various money market funds (since May 2014) in the Fund Complex; Managing Director of the Adviser; Head of Product (since 2006). | |
Timothy J. Knierim (59)
522 Fifth Avenue
New York, NY 10036 | | Chief Compliance Officer | | Since
December
2016 | | Managing Director of the Adviser and various entities affiliated with the Adviser; Chief Compliance Officer of various Morgan Stanley Funds and the Adviser (since December 2016) and Chief Compliance Officer of Morgan Stanley AIP GP LP (since 2014). Formerly, Managing Director and Deputy Chief Compliance Officer of the Adviser (2014-2016); and formerly, Chief Compliance Officer of Prudential Investment Management, Inc. (2007-2014). | |
Francis J. Smith (53)
522 Fifth Avenue
New York, NY 10036 | | Treasurer and Principal Financial Officer | | Treasurer since July 2003 and Principal Financial Officer since September 2002 | | Managing Director of the Adviser and various entities affiliated with the Adviser; Treasurer (since July 2003) and Principal Financial Officer of various Morgan Stanley Funds (since September 2002). | |
Mary E. Mullin (51)
522 Fifth Avenue
New York, NY 10036 | | Secretary | | Since
June
1999 | | Managing Director of the Adviser; Secretary of various Morgan Stanley Funds (since June 1999). | |
Michael J. Key (39)
522 Fifth Avenue
New York, NY 10036 | | Vice President | | Since
June
2017 | | Vice President of the Equity and Fixed Income Funds, Liquidity Funds, various money market funds and the Morgan Stanley AIP Funds in the Fund Complex (since June 2017); Executive Director of the Adviser; Head of Product Development for Equity and Fixed Income Funds (since August 2013). | |
* This is the earliest date the officer began serving the Morgan Stanley Funds. Each officer serves a one-year term, until his or her successor is elected and qualifies.
35
Morgan Stanley Institutional Fund, Inc.
Annual Report — December 31, 2018
Adviser and Administrator
Morgan Stanley Investment Management Inc.
522 Fifth Avenue
New York, New York 10036
Distributor
Morgan Stanley Distribution, Inc.
522 Fifth Avenue
New York, New York 10036
Dividend Disbursing and Transfer Agent
DST Asset Manager Solutions, Inc.
2000 Crown Colony Drive
Quincy, Massachusetts 02169
Custodian
State Street Bank and Trust Company
One Lincoln Street
Boston, Massachusetts 02111
Legal Counsel
Dechert LLP
1095 Avenue of the Americas
New York, New York 10036
Counsel to the Independent Directors
Perkins Coie LLP
30 Rockefeller Plaza
New York, New York 10112
Independent Registered Public Accounting Firm
Ernst & Young LLP
200 Clarendon Street
Boston, Massachusetts 02116
Reporting to Shareholders
Each Morgan Stanley fund provides a complete schedule of portfolio holdings in its semi-annual and the annual reports within 60 days of the end of the fund's second and fourth fiscal quarters. The semi-annual and annual reports are filed electronically with the Securities and Exchange Commission ("SEC") on Form N-CSRS and Form N-CSR, respectively. Morgan Stanley also delivers the semi-annual and annual reports to fund shareholders and makes these reports available on its public website, www.morganstanley.com/im/shareholderreports. Each Morgan Stanley fund also files a complete schedule of portfolio holdings with the SEC for the fund's first and third fiscal quarters on Form N-Q. Morgan Stanley does not deliver the reports for the first and third fiscal quarters to shareholders, nor are the reports posted to the Morgan Stanley public website. You may, however, obtain the Form N-Q filings (as well as the Form N-CSR and N-CSRS filings) by accessing the SEC's website, www.sec.gov. You can also request copies of these materials, upon payment of a duplicating fee, by electronic request at the SEC's email address (publicinfo@sec.gov).
Proxy Voting Policies and Procedures and Proxy Voting Record
You may obtain a copy of the Company's Proxy Voting Policy and Procedures and information regarding how the Company voted proxies relating to portfolio securities during the most recent twelve-month period ended June 30, without charge, upon request, by calling toll free 1 (800) 548-7786 or by visiting our website at www.morganstanley.com/im/shareholderreports. This information is also available on the SEC's website at www.sec.gov.
This report is authorized for distribution only when preceded or accompanied by a prospectus or summary prospectus of the applicable Fund of Morgan Stanley Institutional Fund, Inc., which describes in detail the Fund's investment policies, risks, fees and expenses. Please read the prospectus carefully before you invest or send money. For additional information, including information regarding the investments comprising the Fund, please visit our website at www.morganstanley.com/im/shareholderreports or call toll free 1 (800) 548-7786.
36
Printed in U.S.A.
This Report has been prepared for shareholders and may be distributed to others only if preceded or accompanied by a current prospectus.
Morgan Stanley Investment Management Inc.
522 Fifth Avenue
New York, New York 10036
© 2019 Morgan Stanley. Morgan Stanley Distribution, Inc.

IFIUSREAANN
2403544 EXP. 02.29.20

Morgan Stanley Institutional Fund, Inc.
Global Concentrated Portfolio
Annual Report
December 31, 2018
Beginning on January 1, 2021, as permitted by regulations adopted by the Securities and Exchange Commission ("SEC"), paper copies of the Fund's Annual and Semi-Annual Reports to Shareholders ("Shareholder Reports") will no longer be sent by mail, unless you specifically request paper copies of the Shareholder Reports from the Fund or from your financial intermediary, such as a broker-dealer or a bank. Instead, the Shareholder Reports will be made available on the Fund's website, https://www.morganstanley.com/im/shareholderreports and you will be notified by mail each time a Shareholder Report is posted and provided with a website link to access the Shareholder Report. If you already elected to receive Shareholder Reports electronically, you will not be affected by this change and you need not take any action. You may elect to receive Shareholder Reports and other communications from the Fund electronically anytime by contacting your financial intermediary or, if you are a direct investor, please follow the instructions on the envelope.
Beginning on January 1, 2019, you may elect to receive all future Shareholder Reports in paper free of charge. If you invest through a financial intermediary, you can contact your financial intermediary to request that you continue to receive paper copies of your Shareholder Reports. If you invest directly with the Fund, please follow the instructions on the envelope to let the Fund know you wish to continue receiving paper copies of your Shareholder Reports. Your election to receive Shareholder Reports in paper will apply to all funds held in your account if you invest through your financial intermediary or all funds held with the fund complex if you invest directly with a fund.

Morgan Stanley Institutional Fund, Inc.
Annual Report — December 31, 2018
Shareholders' Letter | | | 2 | | |
Expense Example | | | 3 | | |
Investment Overview | | | 4 | | |
Portfolio of Investments | | | 7 | | |
Statement of Assets and Liabilities | | | 8 | | |
Statement of Operations | | | 9 | | |
Statements of Changes in Net Assets | | | 10 | | |
Financial Highlights | | | 12 | | |
Notes to Financial Statements | | | 16 | | |
Report of Independent Registered Public Accounting Firm | | | 21 | | |
Federal Tax Notice | | | 22 | | |
Privacy Notice | | | 23 | | |
Director and Officer Information | | | 26 | | |
This report is authorized for distribution only when preceded or accompanied by a prospectus or summary prospectus of the applicable Fund of Morgan Stanley Institutional Fund, Inc. To receive a prospectus and/or statement of additional information (SAI), which contains more complete information such as investment objectives, charges, expenses, policies for voting proxies, risk considerations and describes in detail each of the Fund's investment policies to the prospective investor, please call toll free 1 (800) 548-7786. Please read the prospectuses carefully before you invest or send money.
Additionally, you can access information about the Fund, including performance, characteristics and investment team commentary, through Morgan Stanley Investment Management's website: www.morganstanley.com/im/shareholderreports.
Market forecasts provided in this report may not necessarily come to pass. There is no guarantee that any sectors mentioned will continue to perform as discussed herein or that securities in such sectors will be held by the Fund in the future. There is no assurance that a fund will achieve its investment objective. Funds are subject to market risk, which is the possibility that market values of securities owned by the Fund will decline and, therefore, the value of the Fund's shares may be less than what you paid for them. Accordingly, you can lose money investing in this Fund. Please see the prospectus for more complete information on investment risks.
1
Morgan Stanley Institutional Fund, Inc.
Annual Report — December 31, 2018
Shareholders' Letter (unaudited)
Dear Shareholders,
We are pleased to provide this Annual report, in which you will learn how your investment in Global Concentrated Portfolio (the "Fund") performed during the latest twelve-month period.
Morgan Stanley Investment Management is a client-centric, investor-led organization. Our global presence, intellectual capital, and breadth of products and services enable us to partner with investors to meet the evolving challenges of today's financial markets. We aim to deliver superior investment service and to empower our clients to make the informed decisions that help them reach their investment goals.
As always, we thank you for selecting Morgan Stanley Investment Management, and look forward to working with you in the months and years ahead.
Sincerely,

John H. Gernon
President and Principal Executive Officer
January 2019
2
Morgan Stanley Institutional Fund, Inc.
Annual Report — December 31, 2018
Expense Example (unaudited)
Global Concentrated Portfolio
As a shareholder of the Fund, you incur two types of costs: (1) transactional costs; and (2) ongoing costs, which may include advisory fees, administration fees, distribution and shareholder services fees and other Fund expenses. This example is intended to help you understand your ongoing costs (in dollars) of investing in the Fund and to compare these costs with the ongoing costs of investing in other mutual funds.
This example is based on an investment of $1,000 invested at the beginning of the six-month period ended December 31, 2018 and held for the entire six-month period.
Actual Expenses
The table below provides information about actual account values and actual expenses. You may use the information in this table, together with the amount you invested, to estimate the expenses that you paid over the period. Simply divide your account value by $1,000 (for example, an $8,600 account value divided by $1,000 = 8.6), then multiply the result by the number in the table under the heading entitled "Actual Expenses Paid During Period" to estimate the expenses you paid on your account during this period.
Hypothetical Example for Comparison Purposes
The table below provides information about hypothetical account values and hypothetical expenses based on the Fund's actual expense ratio and an assumed rate of return of 5% per year before expenses, which is not the Fund's actual return. The hypothetical account values and expenses may not be used to estimate the actual ending account balance or expenses you paid for the period. You may use this information to compare the ongoing costs of investing in the Fund and other funds. To do so, compare this 5% hypothetical example with the 5% hypothetical examples that appear in the shareholder reports of the other funds.
Please note that the expenses shown in the table are meant to highlight your ongoing costs only and do not reflect any transactional costs, such as sales charges (loads). Therefore, the information for each class in the table is useful in comparing ongoing costs only, and will not help you determine the relative total costs of owning different funds. In addition, if these transactional costs were included, your costs would have been higher.
| | | Beginning
Account
Value
7/1/18 | | Actual Ending
Account
Value
12/31/18 | | Hypothetical
Ending Account
Value | | Actual
Expenses
Paid
During
Period* | | Hypothetical
Expenses Paid
During Period* | | Net
Expense
Ratio
During
Period** | |
Global Concentrated Portfolio Class I | | $ | 1,000.00 | | | $ | 864.40 | | | $ | 1,020.11 | | | $ | 4.75 | | | $ | 5.14 | | | | 1.01 | % | |
Global Concentrated Portfolio Class A | | | 1,000.00 | | | | 862.80 | | | | 1,018.35 | | | | 6.39 | | | | 6.92 | | | | 1.36 | | |
Global Concentrated Portfolio Class C | | | 1,000.00 | | | | 859.80 | | | | 1,014.52 | | | | 9.94 | | | | 10.76 | | | | 2.12 | | |
Global Concentrated Portfolio Class IS | | | 1,000.00 | | | | 865.00 | | | | 1,020.42 | | | | 4.47 | | | | 4.84 | | | | 0.95 | | |
* Expenses are calculated using each Fund Class' annualized net expense ratio (as disclosed), multiplied by the average account value over the period and multiplied by 184/365 (to reflect the most recent one-half year period).
** Annualized.
3
Morgan Stanley Institutional Fund, Inc.
Annual Report — December 31, 2018
Investment Overview (unaudited)
Global Concentrated Portfolio
The Fund seeks long-term capital appreciation.
Performance
For the fiscal year ended December 31, 2018, the Fund's Class I shares had a total return based on net asset value and reinvestment of distributions per share of –14.61%, net of fees. The Fund's Class I shares underperformed the Fund's benchmark, the MSCI World Net Index (the "Index"), which returned –8.71%.
Factors Affecting Performance
• Investors should be aware that the challenging performance year from both an absolute and relative basis in 2018 followed a quite favorable year for the markets in 2017.
• The volatility of relative performance of style and sectors has been extreme in 2018. Growth rocketed until late summer and then got crushed thereafter. Defensives were very out-of-favor while growth worked, and then they were the big winners thereafter. While from a strategic perspective, the team made many of the right calls about these extremes reverting, the speed of these swings was difficult to navigate from a portfolio implementation perspective, at least initially. Our models have an imbedded lag before adjusting factor weightings. This allows us to confirm persistence for a potential style rotation. The lag resulted in a gap in performance relative to the benchmark. However, though a painful year on both an absolute and relative basis, we are seeing signs as we enter 2019 that our models have begun to lock in what is working.
• Early in the year, through the first correction in February, Global Concentrated outperformed the MSCI World Net Index benchmark. The portfolio was overweight in growth stocks, but the market's subsequent recovery was led by an extremely narrow group of mega-cap growth stocks, mostly the "FAANGs" (Facebook, Apple, Amazon, Netflix and Google). In spite of some exposure to those names, the portfolio was underweight versus a broader universe of growth exposures. Although that was correct positioning from a risk perspective, the lack of mega-cap tech exposure negatively impacted performance.
• By late summer, our quantitative models were signaling that the conditions underlying the significant outperformance of this group of mega-cap tech stocks, specifically that they were expensive and crowded — a dangerous combination, were setting up for a painful unwind. We further reduced exposure to technology, and this was a correct decision, as mega-cap tech stocks sold off significantly in the fourth quarter.
• At the time when momentum growth stocks were expensive, both bond proxy stocks (high dividend-yielding) and value stocks were inexpensive and much unloved. The team made the decision to increase weightings in both areas.
• From a bond proxy perspective, the fact that this group was so inexpensive, while the momentum bucket was expensive, was a warning sign for a more defensive positioning to Global Concentrated. There was too much euphoria for "hot" stocks. We increased exposure to both consumer staples and defensive health care names. This was an accurate call, as the market started to correct and the bond proxy stocks began to outperform.
• While increasing consumer staples was a decision that positively contributed to performance, the choice to not add uber-defensive positions in either utilities or telecommunications detracted. Traditionally, we are not buyers of these sectors because we believe they generally do not produce long-term winning stocks, which we seek to own. But with utilities being the best performing sector over the fourth quarter, the decision was very costly from a short-term performance perspective.
• In addition, the overreaction of financials and energy to recessionary fears made these value areas look attractive and we added to them. But, increasing financials and energy negatively impacted performance in the reporting period. However, these areas have started to improve as recessionary fears have receded.
• On a geographic basis, following the woeful underperformance of non-U.S. markets relative to the U.S. leading up to 2018, the team believed non-U.S. markets could see some reversion to the mean in 2018 and potentially outperform the U.S. for the year. However, this did not pan out,
4
Morgan Stanley Institutional Fund, Inc.
Annual Report — December 31, 2018
Investment Overview (unaudited) (cont'd)
Global Concentrated Portfolio
as once again, the non-U.S. developed markets underperformed the U.S., and the higher allocation outside the U.S. negatively impacted the Fund.
• Early in the year, we believed that emerging markets and Chinese technology stocks in particular were becoming extremely popular and expensive relative to their histories. We therefore reduced exposure to Asia technology. While that was the right call, the magnitude of the declines in this region still caused a drag on performance despite our reduced weighting.
• We began rebuilding this position by late summer, when our investment process highlighted the area as an opportunity again. This decision initially hurt performance, as Chinese technology stocks continued to decline, but the trend reversed late in the year, affirming the decision to increase the weighting. Given the historically low valuation levels these stocks achieved, we believe this positioning can potentially continue to work well into 2019, particularly if we see some trade resolution.
• The Fund began the year with a higher weighting in Europe, but later increased defensiveness here along with the same defensive repositioning in the U.S. That was a correct call, given the ongoing challenges in the European region, especially regarding Brexit. The Fund maintained a small value weighting, as the low valuation levels are quite attractive and we believe European equities are more fully pricing in a "bad Brexit" outcome than any sort of more positive agreement.
• The Fund's consistent underweight to Japan in 2018 was a positive contributor to performance. Not only do we struggle quantitatively to find factors that have persistence, but we also struggle to find specific stocks that persistently outperform. This poses a longer-term risk, and the team remained negative on the region.
• Within stock selection, the largest detractor for the period was a U.K.-based airline weighed down by issues surrounding Brexit, a U.S.-based international alcoholic beverage company impacted by potential for industry slowdown, and a U.S. based industrial manufacturer, impacted by trade concerns. Two other stocks weighed significantly on
performance, a Spanish bank with significant exposure to Latin America and a U.S. financial services company.
• The Fund benefited the most from stock positions in technology, most notably a U.S.-based global payments and technology company, a U.S.-based leader in cloud infrastructure and digital workspace technology, and a Chinese education and technology enterprise. Other top contributors to performance for the period were a U.S.-based coffee company and a U.K.-based global alcoholic beverage company.
Management Strategies
• There have been no changes to our investment process during the period. Applied Equity Advisors' investment process is comprised of two parts: a Factor Timing Engine and a Stock Selection Engine. The first step, the Factor Timing Engine, takes into account not only what market factors or areas of the market are in leadership, but also how much momentum a particular factor has, whether that factor is cheap or expensive, and whether the timing is right to be tilted toward that factor. The timing decision comes down to the team's judgment and our combined decades of experience in factor investing. The Stock Selection Engine begins its work once the desired factor positioning is understood. With regard to the Factor Timing Engine, investing in a particular area of the market that shows cheap historical valuation levels may not appear to be advantageous at first, but if chosen correctly, sticking with that investment often proves to be successful over the longer term. The result is a highly active portfolio of fundamentally attractive stocks which the team believes could benefit from what we have identified to be quantitative investment styles likely to outperform in each region.
5
Morgan Stanley Institutional Fund, Inc.
Annual Report — December 31, 2018
Investment Overview (unaudited) (cont'd)
Global Concentrated Portfolio
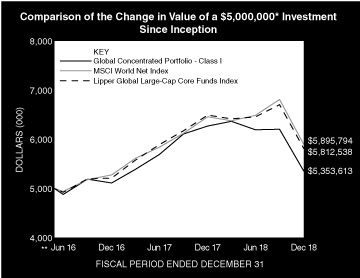
* Minimum Investment for Class I shares
** Commenced Operations on May 27, 2016.
In accordance with SEC regulations, the Fund's performance shown assumes that all recurring fees (including management fees) were deducted and all dividends and distributions were reinvested. The performance of Class A, C and IS shares will vary from the performance of Class I shares and will be negatively impacted by additional fees assessed to those classes (if applicable).
Performance Compared to the MSCI World Net Index(1) and the Lipper Global Large-Cap Core Funds Index(2)
| | | Period Ended December 31, 2018
Total Returns(3) | |
| | | | | Average Annual | |
| | | One
Year | | Five
Years | | Ten
Years | | Since
Inception(5) | |
Fund — Class I Shares
w/o sales charges(4) | | | –14.61 | % | | | — | | | | — | | | | 2.67 | % | |
Fund — Class A Shares
w/o sales charges(4) | | | –14.91 | | | | — | | | | — | | | | 2.29 | | |
Fund — Class A Shares with
maximum 5.25% sales charges(4) | | | –19.40 | | | | — | | | | — | | | | 0.20 | | |
Fund — Class C Shares
w/o sales charges(4) | | | –15.57 | | | | — | | | | — | | | | 1.54 | | |
Fund — Class C Shares with
maximum 1.00% deferred
sales charges(4) | | | –16.41 | | | | — | | | | — | | | | 1.54 | | |
Fund — Class IS Shares
w/o sales charges(4) | | | –14.55 | | | | — | | | | — | | | | 2.71 | | |
MSCI World Net Index | | | –8.71 | | | | — | | | | — | | | | 6.57 | | |
Lipper Global Large-Cap
Core Funds Index | | | –10.46 | | | | — | | | | — | | | | 5.98 | | |
Performance data quoted represents past performance, which is no guarantee of future results, and current performance may be lower or higher than the figures shown. Performance assumes that all dividends and distributions, if any, were reinvested. For the most recent month-end performance figures, please visit www.morganstanley.com/im/shareholderreports. Investment return and principal value will fluctuate so that Fund shares, when redeemed, may be worth more or less than their original cost. Total returns do not reflect the deduction of taxes that a shareholder would pay on Fund distributions or the redemption of Fund shares. Performance of share classes will vary due to difference in sales charges and expenses.
(1) The MSCI World Net Index is a free float-adjusted market capitalization weighted index designed to measure the equity market performance of developed markets. The term "free float" represents the portion of shares outstanding that are deemed to be available for purchase in the public equity markets by investors. The MSCI World Net Index currently consists of 23 developed market country indices. The performance of the Index is listed in US dollars and assumes reinvestment of net dividends. Net total return indices reinvest dividends after the deduction of withholding taxes, using (for international indices) a tax rate applicable to non-resident institutional investors who do not benefit from double taxation treaties. The Index is unmanaged and its returns do not include any sales charges or fees. Such costs would lower performance. It is not possible to invest directly in an index.
(2) The Lipper Global Large-Cap Core Funds Index is an equally weighted performance index of the largest qualifying funds (based on net assets) in the Lipper Global Large-Cap Core Funds classification. The Index, which is adjusted for capital gains distributions and income dividends, is unmanaged and should not be considered an investment. There are currently 10 funds represented in this Index. As of the date of this report, the Fund is in the Lipper Global Large-Cap Core Funds classification.
(3) Total returns for the Fund reflect fees waived and expenses reimbursed, if applicable, by Morgan Stanley Investment Management Inc. (the "Adviser"). Without such waivers and reimbursements, total returns would have been lower.
(4) Commenced operations on May 27, 2016.
(5) For comparative purposes, average annual since inception returns listed for the Indexes refer to the inception date of the Fund, not the inception of the Index.
6
Morgan Stanley Institutional Fund, Inc.
Annual Report — December 31, 2018
Portfolio of Investments
Global Concentrated Portfolio
| | | Shares | | Value
(000) | |
Common Stocks (98.5%) | |
China (14.5%) | |
Alibaba Group Holding Ltd. ADR (a) | | | 8,130 | | | $ | 1,115 | | |
Tencent Holdings Ltd. ADR | | | 30,660 | | | | 1,210 | | |
| | | | 2,325 | | |
Ireland (4.3%) | |
Ryanair Holdings PLC ADR (a) | | | 9,794 | | | | 699 | | |
Spain (2.6%) | |
Banco Santander SA ADR | | | 92,872 | | | | 416 | | |
Taiwan (3.4%) | |
Taiwan Semiconductor Manufacturing Co., Ltd. ADR | | | 14,624 | | | | 540 | | |
United Kingdom (19.0%) | |
Diageo PLC ADR | | | 9,953 | | | | 1,411 | | |
Royal Dutch Shell PLC ADR | | | 28,215 | | | | 1,644 | | |
| | | | 3,055 | | |
United States (54.7%) | |
Alphabet, Inc., Class A (a) | | | 462 | | | | 483 | | |
Amgen, Inc. | | | 1,905 | | | | 371 | | |
Constellation Brands, Inc., Class A | | | 2,646 | | | | 425 | | |
Estee Lauder Cos., Inc. (The), Class A | | | 5,354 | | | | 697 | | |
Goldman Sachs Group, Inc. (The) | | | 1,468 | | | | 245 | | |
International Flavors & Fragrances, Inc. | | | 3,512 | | | | 472 | | |
JPMorgan Chase & Co. | | | 11,104 | | | | 1,084 | | |
Mastercard, Inc., Class A | | | 8,076 | | | | 1,523 | | |
Microsoft Corp. | | | 6,961 | | | | 707 | | |
National Oilwell Varco, Inc. | | | 13,334 | | | | 343 | | |
Northern Trust Corp. | | | 9,325 | | | | 779 | | |
Starbucks Corp. | | | 11,634 | | | | 749 | | |
VMware, Inc., Class A | | | 6,555 | | | | 899 | | |
| | | | 8,777 | | |
Total Common Stocks (Cost $16,670) | | | 15,812 | | |
Short-Term Investment (0.2%) | |
Investment Company (0.2%) | |
Morgan Stanley Institutional Liquidity
Funds — Treasury Securities Portfolio —
Institutional Class (See Note G)
(Cost $28) | | | 28,446 | | | | 28 | | |
Total Investments (98.7%) (Cost $16,698) (b) | | | 15,840 | | |
Other Assets in Excess of Liabilities (1.3%) | | | 201 | | |
Net Assets (100.0%) | | $ | 16,041 | | |
Country assignments and aggregations are based generally on third party vendor classifications and information, and may be different from the assignments and aggregations under the policies set forth in the Fund's prospectus and/or statement of additional information relating to geographic classifications.
(a) Non-income producing security.
(b) At December 31, 2018, the aggregate cost for federal income tax purposes is approximately $16,837,000. The aggregate gross unrealized appreciation is approximately $684,000 and the aggregate gross unrealized depreciation is approximately $1,681,000, resulting in net unrealized depreciation of approximately $997,000.
ADR American Depositary Receipt.
Portfolio Composition
Classification | | Percentage of
Total Investments | |
Other* | | | 24.6 | % | |
Interactive Media & Services | | | 17.7 | | |
Beverages | | | 11.6 | | |
Oil, Gas & Consumable Fuels | | | 10.4 | | |
Software | | | 10.1 | | |
Information Technology Services | | | 9.6 | | |
Banks | | | 9.5 | | |
Capital Markets | | | 6.5 | | |
Total Investments | | | 100.0 | % | |
* Industries and/or investment types representing less than 5% of total investments.
The accompanying notes are an integral part of the financial statements.
7
Morgan Stanley Institutional Fund, Inc.
Annual Report — December 31, 2018
Global Concentrated Portfolio
Statement of Assets and Liabilities | | December 31, 2018
(000) | |
Assets: | |
Investments in Securities of Unaffiliated Issuers, at Value (Cost $16,670) | | $ | 15,812 | | |
Investment in Security of Affiliated Issuer, at Value (Cost $28) | | | 28 | | |
Total Investments in Securities, at Value (Cost $16,698) | | | 15,840 | | |
Cash | | | 175 | | |
Receivable for Fund Shares Sold | | | 67 | | |
Due from Adviser | | | 23 | | |
Dividends Receivable | | | 8 | | |
Tax Reclaim Receivable | | | 1 | | |
Receivable from Affiliate | | | — | @ | |
Other Assets | | | 24 | | |
Total Assets | | | 16,138 | | |
Liabilities: | |
Payable for Professional Fees | | | 65 | | |
Payable for Fund Shares Redeemed | | | 18 | | |
Payable for Shareholder Services Fees — Class A | | | — | @ | |
Payable for Distribution and Shareholder Services Fees — Class C | | | 2 | | |
Payable for Transfer Agency Fees — Class I | | | 1 | | |
Payable for Transfer Agency Fees — Class A | | | 1 | | |
Payable for Transfer Agency Fees — Class C | | | 1 | | |
Payable for Transfer Agency Fees — Class IS | | | — | @ | |
Payable for Sub Transfer Agency Fees — Class I | | | 1 | | |
Payable for Sub Transfer Agency Fees — Class A | | | — | @ | |
Payable for Sub Transfer Agency Fees — Class C | | | — | @ | |
Payable for Custodian Fees | | | 2 | | |
Payable for Administration Fees | | | 1 | | |
Other Liabilities | | | 5 | | |
Total Liabilities | | | 97 | | |
Net Assets | | $ | 16,041 | | |
Net Assets Consist of: | |
Paid-in-Capital | | $ | 17,567 | | |
Total Accumulated Loss | | | (1,526 | ) | |
Net Assets | | $ | 16,041 | | |
CLASS I: | |
Net Assets | | $ | 11,554 | | |
| Shares Outstanding $0.001 par value shares of beneficial interest (unlimited shares authorized) (not in 000's) | | | 1,097,095 | | |
Net Asset Value, Offering and Redemption Price Per Share | | $ | 10.53 | | |
CLASS A: | |
Net Assets | | $ | 2,213 | | |
| Shares Outstanding $0.001 par value shares of beneficial interest (unlimited shares authorized) (not in 000's) | | | 210,951 | | |
Net Asset Value, Redemption Price Per Share | | $ | 10.49 | | |
Maximum Sales Load | | | 5.25 | % | |
Maximum Sales Charge | | $ | 0.58 | | |
Maximum Offering Price Per Share | | $ | 11.07 | | |
CLASS C: | |
Net Assets | | $ | 2,263 | | |
| Shares Outstanding $0.001 par value shares of beneficial interest (unlimited shares authorized) (not in 000's) | | | 218,360 | | |
Net Asset Value, Offering and Redemption Price Per Share | | $ | 10.36 | | |
CLASS IS: | |
Net Assets | | $ | 11 | | |
| Shares Outstanding $0.001 par value shares of beneficial interest (unlimited shares authorized) (not in 000's) | | | 1,000 | | |
Net Asset Value, Offering and Redemption Price Per Share | | $ | 10.53 | | |
@ Amount is less than $500.
The accompanying notes are an integral part of the financial statements.
8
Morgan Stanley Institutional Fund, Inc.
Annual Report — December 31, 2018
Global Concentrated Portfolio
Statement of Operations | | Year Ended
December 31, 2018
(000) | |
Investment Income: | |
Dividends from Securities of Unaffiliated Issuers (Net of $26 of Foreign Taxes Withheld) | | $ | 451 | | |
Dividends from Security of Affiliated Issuer (Note G) | | | 7 | | |
Total Investment Income | | | 458 | | |
Expenses: | |
Advisory Fees (Note B) | | | 159 | | |
Professional Fees | | | 110 | | |
Registration Fees | | | 58 | | |
Shareholder Services Fees — Class A (Note D) | | | 6 | | |
Distribution and Shareholder Services Fees — Class C (Note D) | | | 26 | | |
Administration Fees (Note C) | | | 17 | | |
Shareholder Reporting Fees | | | 14 | | |
Sub Transfer Agency Fees — Class I | | | 9 | | |
Sub Transfer Agency Fees — Class A | | | 2 | | |
Sub Transfer Agency Fees — Class C | | | 2 | | |
Custodian Fees (Note F) | | | 10 | | |
Transfer Agency Fees — Class I (Note E) | | | 2 | | |
Transfer Agency Fees — Class A (Note E) | | | 2 | | |
Transfer Agency Fees — Class C (Note E) | | | 2 | | |
Transfer Agency Fees — Class IS (Note E) | | | 2 | | |
Directors' Fees and Expenses | | | 3 | | |
Pricing Fees | | | 2 | | |
Other Expenses | | | 17 | | |
Total Expenses | | | 443 | | |
Waiver of Advisory Fees (Note B) | | | (159 | ) | |
Expenses Reimbursed by Adviser (Note B) | | | (29 | ) | |
Reimbursement of Class Specific Expenses — Class I (Note B) | | | (3 | ) | |
Reimbursement of Class Specific Expenses — Class A (Note B) | | | (— | @) | |
Reimbursement of Class Specific Expenses — Class IS (Note B) | | | (2 | ) | |
Rebate from Morgan Stanley Affiliate (Note G) | | | (1 | ) | |
Net Expenses | | | 249 | | |
Net Investment Income | | | 209 | | |
Realized Loss: | |
Investments Sold | | | (585 | ) | |
Change in Unrealized Appreciation (Depreciation): | |
Investments | | | (3,093 | ) | |
Net Realized Loss and Change in Unrealized Appreciation (Depreciation) | | | (3,678 | ) | |
Net Decrease in Net Assets Resulting from Operations | | $ | (3,469 | ) | |
@ Amount is less than $500.
The accompanying notes are an integral part of the financial statements.
9
Morgan Stanley Institutional Fund, Inc.
Annual Report — December 31, 2018
Global Concentrated Portfolio
Statements of Changes in Net Assets | | Year Ended
December 31, 2018
(000) | | Year Ended
December 31, 2017
(000) | |
Increase (Decrease) in Net Assets: | |
Operations: | |
Net Investment Income (Loss) | | $ | 209 | | | $ | (2 | ) | |
Net Realized Gain (Loss) | | | (585 | ) | | | 36 | | |
Net Change in Unrealized Appreciation (Depreciation) | | | (3,093 | ) | | | 1,963 | | |
Net Increase (Decrease) in Net Assets Resulting from Operations | | | (3,469 | ) | | | 1,997 | | |
Dividends and Distributions to Shareholders: | |
Class I | | | (84 | ) | | | (18 | )* | |
Class A | | | (8 | ) | | | (2 | )* | |
Class C | | | — | @ | | | (3 | )* | |
Class IS | | | — | | | | — | @* | |
Total Dividends and Distributions to Shareholders | | | (92 | ) | | | (23 | ) | |
Paid-in-Capital: | |
Class I | | | — | | | | (9 | ) | |
Class IS | | | — | | | | (— | @) | |
Total Paid-in-Capital | | | — | | | | (9 | ) | |
Capital Share Transactions:(1) | |
Class I: | |
Subscribed | | | 9,706 | | | | 4,032 | | |
Distributions Reinvested | | | 47 | | | | 9 | | |
Redeemed | | | (7,354 | ) | | | (686 | ) | |
Class A: | |
Subscribed | | | 1,453 | | | | 891 | | |
Distributions Reinvested | | | 7 | | | | 2 | | |
Redeemed | | | (470 | ) | | | (216 | ) | |
Class C: | |
Subscribed | | | 1,750 | | | | 970 | | |
Distributions Reinvested | | | — | | | | 3 | | |
Redeemed | | | (757 | ) | | | (341 | ) | |
Net Increase in Net Assets Resulting from Capital Share Transactions | | | 4,382 | | | | 4,664 | | |
Total Increase in Net Assets | | | 821 | | | | 6,629 | | |
Net Assets: | |
Beginning of Period | | | 15,220 | | | | 8,591 | | |
End of Period | | $ | 16,041 | | | $ | 15,220 | † | |
The accompanying notes are an integral part of the financial statements.
10
Morgan Stanley Institutional Fund, Inc.
Annual Report — December 31, 2018
Global Concentrated Portfolio
Statements of Changes in Net Assets (cont'd) | | Year Ended
December 31, 2018
(000) | | Year Ended
December 31, 2017
(000) | |
(1) Capital Share Transactions: | |
Class I: | |
Shares Subscribed | | | 762 | | | | 331 | | |
Shares Issued on Distributions Reinvested | | | 4 | | | | 1 | | |
Shares Redeemed | | | (620 | ) | | | (62 | ) | |
Net Increase in Class I Shares Outstanding | | | 146 | | | | 270 | | |
Class A: | |
Shares Subscribed | | | 115 | | | | 77 | | |
Shares Issued on Distributions Reinvested | | | 1 | | | | — | @@ | |
Shares Redeemed | | | (40 | ) | | | (19 | ) | |
Net Increase in Class A Shares Outstanding | | | 76 | | | | 58 | | |
Class C: | |
Shares Subscribed | | | 141 | | | | 83 | | |
Shares Issued on Distributions Reinvested | | | — | | | | — | @@ | |
Shares Redeemed | | | (63 | ) | | | (29 | ) | |
Net Increase in Class C Shares Outstanding | | | 78 | | | | 54 | | |
The following information was previously reported in the December 31, 2017 financial statements. The distribution information for the year ended December 31, 2017 presented on the Statements of Changes in Net Assets is presented for comparative purposes to the December 31, 2018 financial statements, which conform to the SEC Final Rule on Disclosure Update and Simplification which was effective November 5, 2018.
* Distributions from and/or in Excess of Net Investment Income for the year ended December 31, 2017 were as follows:
Class I: | |
Net Investment Income | | $ | (18 | ) | |
Class A: | |
Net Investment Income | | $ | (2 | ) | |
Class C: | |
Net Investment Income | | $ | (3 | ) | |
Class IS: | |
Net Investment Income | | $ | (— | @) | |
† Distributions in Excess of Net Investment Income for the year ended December 31, 2017 was $(51).
@ Amount is less than $500.
@@ Amount is less than 500 shares.
The accompanying notes are an integral part of the financial statements.
11
Morgan Stanley Institutional Fund, Inc.
Annual Report — December 31, 2018
Financial Highlights
Global Concentrated Portfolio
| | | Class I | |
| | | Year Ended December 31, | | Period from
May 27, 2016(1) to | |
Selected Per Share Data and Ratios | | 2018 | | 2017 | | December 31, 2016 | |
Net Asset Value, Beginning of Period | | $ | 12.42 | | | $ | 10.16 | | | $ | 10.00 | | |
Income (Loss) from Investment Operations: | |
Net Investment Income(2) | | | 0.14 | | | | 0.02 | | | | 0.03 | | |
Net Realized and Unrealized Gain (Loss) | | | (1.95 | ) | | | 2.28 | | | | 0.19 | | |
Total from Investment Operations | | | (1.81 | ) | | | 2.30 | | | | 0.22 | | |
Distributions from and/or in Excess of: | |
Net Investment Income | | | (0.08 | ) | | | (0.03 | ) | | | (0.06 | ) | |
Paid-in-Capital | | | — | | | | (0.01 | ) | | | — | | |
Total Distributions | | | (0.08 | ) | | | (0.04 | ) | | | (0.06 | ) | |
Net Asset Value, End of Period | | $ | 10.53 | | | $ | 12.42 | | | $ | 10.16 | | |
Total Return(3) | | | (14.61 | )% | | | 22.64 | % | | | 2.24 | %(6) | |
Ratios and Supplemental Data: | |
Net Assets, End of Period (Thousands) | | $ | 11,554 | | | $ | 11,814 | | | $ | 6,922 | | |
Ratio of Expenses to Average Net Assets(8) | | | 1.00 | %(4) | | | 0.98 | %(4) | | | 0.97 | %(4)(7) | |
Ratio of Net Investment Income to Average Net Assets(8) | | | 1.13 | %(4) | | | 0.15 | %(4) | | | 0.48 | %(4)(7) | |
Ratio of Rebate from Morgan Stanley Affiliates to Average Net Assets | | | 0.00 | %(5) | | | 0.00 | %(5) | | | 0.00 | %(5)(7) | |
Portfolio Turnover Rate | | | 94 | % | | | 68 | % | | | 44 | %(6) | |
(8) Supplemental Information on the Ratios to Average Net Assets: | |
Ratios Before Expense Limitation: | |
Expenses to Average Net Assets | | | 1.90 | % | | | 3.13 | % | | | 3.57 | %(7) | |
Net Investment Income (Loss) to Average Net Assets | | | 0.23 | % | | | (2.00 | )% | | | (2.12 | )%(7) | |
(1) Commencement of Operations.
(2) Per share amount is based on average shares outstanding.
(3) Calculated based on the net asset value as of the last business day of the period.
(4) The Ratios of Expenses and Net Investment Income reflect the rebate of certain Fund expenses in connection with the investments in Morgan Stanley affiliates during the period. The effect of the rebate on the ratios is disclosed in the above table as "Ratio of Rebate from Morgan Stanley Affiliates to Average Net Assets."
(5) Amount is less than 0.005%.
(6) Not annualized.
(7) Annualized.
The accompanying notes are an integral part of the financial statements.
12
Morgan Stanley Institutional Fund, Inc.
Annual Report — December 31, 2018
Financial Highlights
Global Concentrated Portfolio
| | | Class A | |
| | | Year Ended December 31, | | Period from
May 27, 2016(1) to | |
Selected Per Share Data and Ratios | | 2018 | | 2017 | | December 31, 2016 | |
Net Asset Value, Beginning of Period | | $ | 12.37 | | | $ | 10.15 | | | $ | 10.00 | | |
Income (Loss) from Investment Operations: | |
Net Investment Income (Loss)(2) | | | 0.11 | | | | (0.03 | ) | | | 0.01 | | |
Net Realized and Unrealized Gain (Loss) | | | (1.95 | ) | | | 2.28 | | | | 0.19 | | |
Total from Investment Operations | | | (1.84 | ) | | | 2.25 | | | | 0.20 | | |
Distributions from and/or in Excess of: | |
Net Investment Income | | | (0.04 | ) | | | (0.03 | ) | | | (0.05 | ) | |
Net Asset Value, End of Period | | $ | 10.49 | | | $ | 12.37 | | | $ | 10.15 | | |
Total Return(3) | | | (14.91 | )% | | | 22.17 | % | | | 2.02 | %(6) | |
Ratios and Supplemental Data: | |
Net Assets, End of Period (Thousands) | | $ | 2,213 | | | $ | 1,666 | | | $ | 782 | | |
Ratio of Expenses to Average Net Assets(8) | | | 1.35 | %(4) | | | 1.35 | %(4) | | | 1.35 | %(4)(7) | |
Ratio of Net Investment Income (Loss) to Average Net Assets(8) | | | 0.91 | %(4) | | | (0.25 | )%(4) | | | 0.16 | %(4)(7) | |
Ratio of Rebate from Morgan Stanley Affiliates to Average Net Assets | | | 0.00 | %(5) | | | 0.00 | %(5) | | | 0.00 | %(5)(7) | |
Portfolio Turnover Rate | | | 94 | % | | | 68 | % | | | 44 | %(6) | |
(8) Supplemental Information on the Ratios to Average Net Assets: | |
Ratios Before Expense Limitation: | |
Expenses to Average Net Assets | | | 2.24 | % | | | 3.61 | % | | | 4.23 | %(7) | |
Net Investment Income (Loss) to Average Net Assets | | | 0.02 | % | | | (2.51 | )% | | | (2.72 | )%(7) | |
(1) Commencement of Operations.
(2) Per share amount is based on average shares outstanding.
(3) Calculated based on the net asset value which does not reflect sales charges, if applicable, as of the last business day of the period.
(4) The Ratios of Expenses and Net Investment Income (Loss) reflect the rebate of certain Fund expenses in connection with the investments in Morgan Stanley affiliates during the period. The effect of the rebate on the ratios is disclosed in the above table as "Ratio of Rebate from Morgan Stanley Affiliates to Average Net Assets."
(5) Amount is less than 0.005%.
(6) Not annualized.
(7) Annualized.
The accompanying notes are an integral part of the financial statements.
13
Morgan Stanley Institutional Fund, Inc.
Annual Report — December 31, 2018
Financial Highlights
Global Concentrated Portfolio
| | | Class C | |
| | | Year Ended December 31, | | Period from
May 27, 2016(1) to | |
Selected Per Share Data and Ratios | | 2018 | | 2017 | | December 31, 2016 | |
Net Asset Value, Beginning of Period | | $ | 12.27 | | | $ | 10.15 | | | $ | 10.00 | | |
Income (Loss) from Investment Operations: | |
Net Investment Income (Loss)(2) | | | 0.02 | | | | (0.11 | ) | | | (0.04 | ) | |
Net Realized and Unrealized Gain (Loss) | | | (1.93 | ) | | | 2.26 | | | | 0.21 | | |
Total from Investment Operations | | | (1.91 | ) | | | 2.15 | | | | 0.17 | | |
Distributions from and/or in Excess of: | |
Net Investment Income | | | — | | | | (0.03 | ) | | | (0.02 | ) | |
Net Asset Value, End of Period | | $ | 10.36 | | | $ | 12.27 | | | $ | 10.15 | | |
Total Return(3) | | | (15.57 | )% | | | 21.18 | % | | | 1.69 | %(6) | |
Ratios and Supplemental Data: | |
Net Assets, End of Period (Thousands) | | $ | 2,263 | | | $ | 1,728 | | | $ | 877 | | |
Ratio of Expenses to Average Net Assets(8) | | | 2.09 | %(4) | | | 2.10 | %(4) | | | 2.10 | %(4)(7) | |
Ratio of Net Investment Income (Loss) to Average Net Assets(8) | | | 0.18 | %(4) | | | (0.95 | )%(4) | | | (0.69 | )%(4)(7) | |
Ratio of Rebate from Morgan Stanley Affiliates to Average Net Assets | | | 0.00 | %(5) | | | 0.00 | %(5) | | | 0.00 | %(5)(7) | |
Portfolio Turnover Rate | | | 94 | % | | | 68 | % | | | 44 | %(6) | |
(8) Supplemental Information on the Ratios to Average Net Assets: | |
Ratios Before Expense Limitation: | |
Expenses to Average Net Assets | | | 2.98 | % | | | 4.36 | % | | | 4.81 | %(7) | |
Net Investment Loss to Average Net Assets | | | (0.71 | )% | | | (3.21 | )% | | | (3.40 | )%(7) | |
(1) Commencement of Operations.
(2) Per share amount is based on average shares outstanding.
(3) Calculated based on the net asset value which does not reflect sales charges, if applicable, as of the last business day of the period.
(4) The Ratios of Expenses and Net Investment Income (Loss) reflect the rebate of certain Fund expenses in connection with the investments in Morgan Stanley affiliates during the period. The effect of the rebate on the ratios is disclosed in the above table as "Ratio of Rebate from Morgan Stanley Affiliates to Average Net Assets."
(5) Amount is less than 0.005%.
(6) Not annualized.
(7) Annualized.
The accompanying notes are an integral part of the financial statements.
14
Morgan Stanley Institutional Fund, Inc.
Annual Report — December 31, 2018
Financial Highlights
Global Concentrated Portfolio
| | | Class IS | |
| | | Year Ended December 31, | | Period from
May 27, 2016(1) to | |
Selected Per Share Data and Ratios | | 2018 | | 2017 | | December 31, 2016 | |
Net Asset Value, Beginning of Period | | $ | 12.42 | | | $ | 10.16 | | | $ | 10.00 | | |
Income (Loss) from Investment Operations: | |
Net Investment Income(2) | | | 0.16 | | | | 0.02 | | | | 0.03 | | |
Net Realized and Unrealized Gain (Loss) | | | (1.97 | ) | | | 2.28 | | | | 0.20 | | |
Total from Investment Operations | | | (1.81 | ) | | | 2.30 | | | | 0.23 | | |
Distributions from and/or in Excess of: | |
Net Investment Income | | | (0.08 | ) | | | (0.03 | ) | | | (0.07 | ) | |
Paid-in-Capital | | | — | | | | (0.01 | ) | | | — | | |
Total Distributions | | | (0.08 | ) | | | (0.04 | ) | | | (0.07 | ) | |
Net Asset Value, End of Period | | $ | 10.53 | | | $ | 12.42 | | | $ | 10.16 | | |
Total Return(3) | | | (14.55 | )% | | | 22.67 | % | | | 2.25 | %(6) | |
Ratios and Supplemental Data: | |
Net Assets, End of Period (Thousands) | | $ | 11 | | | $ | 12 | | | $ | 10 | | |
Ratio of Expenses to Average Net Assets(8) | | | 0.95 | %(4) | | | 0.95 | %(4) | | | 0.95 | %(4)(7) | |
Ratio of Net Investment Income to Average Net Assets(8) | | | 1.27 | %(4) | | | 0.22 | %(4) | | | 0.56 | %(4)(7) | |
Ratio of Rebate from Morgan Stanley Affiliates to Average Net Assets | | | 0.00 | %(5) | | | 0.00 | %(5) | | | 0.00 | %(5)(7) | |
Portfolio Turnover Rate | | | 94 | % | | | 68 | % | | | 44 | %(6) | |
(8) Supplemental Information on the Ratios to Average Net Assets: | |
Ratios Before Expense Limitation: | |
Expenses to Average Net Assets | | | 17.97 | % | | | 18.61 | % | | | 19.43 | %(7) | |
Net Investment Loss to Average Net Assets | | | (15.75 | )% | | | (17.44 | )% | | | (17.92 | )%(7) | |
(1) Commencement of Operations.
(2) Per share amount is based on average shares outstanding.
(3) Calculated based on the net asset value as of the last business day of the period.
(4) The Ratios of Expenses and Net Investment Income reflect the rebate of certain Fund expenses in connection with the investments in Morgan Stanley affiliates during the period. The effect of the rebate on the ratios is disclosed in the above table as "Ratio of Rebate from Morgan Stanley Affiliates to Average Net Assets."
(5) Amount is less than 0.005%.
(6) Not annualized.
(7) Annualized.
The accompanying notes are an integral part of the financial statements.
15
Morgan Stanley Institutional Fund, Inc.
Annual Report — December 31, 2018
Notes to Financial Statements
Morgan Stanley Institutional Fund, Inc. (the "Company") is registered under the Investment Company Act of 1940, as amended (the "Act"), as an open-end management investment company. The Company is comprised of thirty separate, active, diversified and non-diversified funds (individually referred to as a "Fund", collectively as the "Funds"). The Company applies investment company accounting and reporting guidance.
The accompanying financial statements relate to the Global Concentrated Portfolio. The Fund seeks long-term capital appreciation.
The Fund offers four classes of shares — Class I, Class A, Class C and Class IS.
A. Significant Accounting Policies: The following significant accounting policies are in conformity with U.S. generally accepted accounting principles ("GAAP"). Such policies are consistently followed by the Company in the preparation of its financial statements. GAAP may require management to make estimates and assumptions that affect the reported amounts and disclosures in the financial statements. Actual results may differ from those estimates.
In August 2018, the Financial Accounting Standards Board ("FASB") issued Accounting Standards Update ("ASU") 2018-13, Fair Value Measurement (Topic 820) — Disclosures Framework — Changes to Disclosure Requirements of Fair Value Measurement ("ASU 2018-13") which introduces new fair value disclosure requirements as well as eliminates and modifies certain existing fair value disclosure requirements. ASU 2018-13 would be effective for fiscal years beginning after December 15, 2019 and for interim periods within those fiscal years; however, management has elected to early adopt ASU 2018-13 effective with the current reporting period as permitted by the standard. The impact of the Fund's adoption was limited to changes in the Fund's financial statement disclosures regarding fair value, primarily those disclosures related to transfers between levels of the fair value hierarchy and disclosure of the range and weighted average used to develop significant unobservable inputs for Level 3 fair value measurements, when applicable.
1. Security Valuation: (1) An equity portfolio security listed or traded on an exchange is valued at its latest reported sales price (or at the exchange official closing price if such exchange reports an official closing price), and if there were no sales on a given day and if there is no official exchange closing price for that day, the security is valued at the mean between the last reported bid and asked prices
if such bid and asked prices are available on the relevant exchanges. Listed equity securities not traded on the valuation date with no reported bid and asked prices available on the exchange are valued at the mean between the current bid and asked prices obtained from one or more reputable brokers or dealers. In cases where a security is traded on more than one exchange, the security is valued on the exchange designated as the primary market; (2) all other equity portfolio securities for which over-the-counter ("OTC") market quotations are readily available are valued at the latest reported sales price (or at the market official closing price if such market reports an official closing price), and if there was no trading in the security on a given day and if there is no official closing price from relevant markets for that day, the security is valued at the mean between the last reported bid and asked prices if such bid and asked prices are available on the relevant markets. An unlisted equity security that does not trade on the valuation date and for which bid and asked prices from the relevant markets are unavailable is valued at the mean between the current bid and asked prices obtained from one or more reputable brokers or dealers; (3) certain portfolio securities may be valued by an outside pricing service/vendor approved by the Company's Board of Directors (the "Directors"). The pricing service/vendor may employ a pricing model that takes into account, among other things, bids, yield spreads and/or other market data and specific security characteristics. Alternatively, if a valuation is not available from an outside pricing service/vendor, and the security trades on an exchange, the security may be valued at its latest reported sale price (or at the exchange official closing price if such exchange reports an official closing price), prior to the time when assets are valued. If there are no sales on a given day and if there is no official exchange closing price for that day, the security is valued at the mean between the last reported bid and asked prices if such bid and asked prices are available in the relevant exchanges; (4) when market quotations are not readily available, including circumstances under which Morgan Stanley Investment Management Inc. (the "Adviser") determines that the closing price, last sale price or the mean between the last reported bid and asked prices are not reflective of a security's market value, portfolio securities are valued at their fair value as determined in good faith under procedures established by and under the general supervision of the Directors. Occasionally, developments affecting the closing prices of securities and other
16
Morgan Stanley Institutional Fund, Inc.
Annual Report — December 31, 2018
Notes to Financial Statements (cont'd)
assets may occur between the times at which valuations of such securities are determined (that is, close of the foreign market on which the securities trade) and the close of business of the New York Stock Exchange ("NYSE"). If developments occur during such periods that are expected to materially affect the value of such securities, such valuations may be adjusted to reflect the estimated fair value of such securities as of the close of the NYSE, as determined in good faith by the Directors or by the Adviser using a pricing service and/or procedures approved by the Directors; and (5) investments in mutual funds, including the Morgan Stanley Institutional Liquidity Funds, are valued at the net asset value ("NAV") as of the close of each business day.
The Directors have responsibility for determining in good faith the fair value of the investments, and the Directors may appoint others, such as the Company's Adviser or a valuation committee, to assist the Directors in determining fair value and to make the actual calculations pursuant to the fair valuation methodologies previously approved by the Directors. Under procedures approved by the Directors, the Company's Adviser has formed a Valuation Committee whose members are approved by the Directors. The Valuation Committee provides administration and oversight of the Company's valuation policies and procedures, which are reviewed at least annually by the Directors. These procedures allow the Company to utilize independent pricing services, quotations from securities and financial instrument dealers and other market sources to determine fair value.
2. Fair Value Measurement: FASB Accounting Standards CodificationTM ("ASC") 820, "Fair Value Measurement" ("ASC 820"), defines fair value as the value that the Fund would receive to sell an investment or pay to transfer a liability in a timely transaction with an independent buyer in the principal market, or in the absence of a principal market, the most advantageous market for the investment or liability. ASC 820 establishes a three-tier hierarchy to distinguish between (1) inputs that reflect the assumptions market participants would use in valuing an asset or liability developed based on market data obtained from sources independent of the reporting entity (observable inputs) and (2) inputs that reflect the reporting entity's own assumptions about the assumptions market participants would use in valuing an asset or liability developed based on the best information available in the
circumstances (unobservable inputs) and to establish classification of fair value measurements for disclosure purposes. Various inputs are used in determining the value of the Fund's investments. The inputs are summarized in the three broad levels listed below:
• Level 1 – unadjusted quoted prices in active markets for identical investments
• Level 2 – other significant observable inputs (including quoted prices for similar investments, interest rates, prepayment speeds, credit risk, etc.)
• Level 3 – significant unobservable inputs including the Fund's own assumptions in determining the fair value of investments. Factors considered in making this determination may include, but are not limited to, information obtained by contacting the issuer, analysts, or the appropriate stock exchange (for exchange-traded securities), analysis of the issuer's financial statements or other available documents and, if necessary, available information concerning other securities in similar circumstances
The inputs or methodology used for valuing securities are not necessarily an indication of the risk associated with investing in those securities and the determination of the significance of a particular input to the fair value measurement in its entirety requires judgment and considers factors specific to each security.
The following is a summary of the inputs used to value the Fund's investments as of December 31, 2018:
Investment Type | | Level 1
Unadjusted
quoted
prices
(000) | | Level 2
Other
significant
observable
inputs
(000) | | Level 3
Significant
unobservable
inputs
(000) | | Total
(000) | |
Assets: | |
Common Stocks | |
Airlines | | $ | 699 | | | $ | — | | | $ | — | | | $ | 699 | | |
Banks | | | 1,500 | | | | — | | | | — | | | | 1,500 | | |
Beverages | | | 1,836 | | | | — | | | | — | | | | 1,836 | | |
Biotechnology | | | 371 | | | | — | | | | — | | | | 371 | | |
Capital Markets | | | 1,024 | | | | — | | | | — | | | | 1,024 | | |
Chemicals | | | 472 | | | | — | | | | — | | | | 472 | | |
Energy Equipment
& Services | | | 343 | | | | — | | | | — | | | | 343 | | |
Hotels, Restaurants
& Leisure | | | 749 | | | | — | | | | — | | | | 749 | | |
17
Morgan Stanley Institutional Fund, Inc.
Annual Report — December 31, 2018
Notes to Financial Statements (cont'd)
Investment Type | | Level 1
Unadjusted
quoted
prices
(000) | | Level 2
Other
significant
observable
inputs
(000) | | Level 3
Significant
unobservable
inputs
(000) | | Total
(000) | |
Common Stocks (cont'd) | |
Information
Technology
Services | | $ | 1,523 | | | $ | — | | | $ | — | | | $ | 1,523 | | |
Interactive Media
& Services | | | 2,808 | | | | — | | | | — | | | | 2,808 | | |
Oil, Gas &
Consumable Fuels | | | 1,644 | | | | — | | | | — | | | | 1,644 | | |
Personal Products | | | 697 | | | | — | | | | — | | | | 697 | | |
Semiconductors &
Semiconductor
Equipment | | | 540 | | | | — | | | | — | | | | 540 | | |
Software | | | 1,606 | | | | — | | | | — | | | | 1,606 | | |
Total Common Stocks | | | 15,812 | | | | — | | | | — | | | | 15,812 | | |
Short-Term Investment | |
Investment Company | | | 28 | | | | — | | | | — | | | | 28 | | |
Total Assets | | $ | 15,840 | | | $ | — | | | $ | — | | | $ | 15,840 | | |
Transfers between investment levels may occur as the markets fluctuate and/or the availability of data used in an investment's valuation changes.
3. Indemnifications: The Company enters into contracts that contain a variety of indemnifications. The Company's maximum exposure under these arrangements is unknown. However, the Company has not had prior claims or losses pursuant to these contracts and expects the risk of loss to be remote.
4. Dividends and Distributions to Shareholders: Dividends and distributions to shareholders are recorded on the ex-dividend date. Dividends from net investment income, if any, are declared and paid annually. Net realized capital gains, if any, are distributed at least annually.
5. Security Transactions, Income and Expenses: Security transactions are accounted for on the trade date (date the order to buy or sell is executed). Realized gains and losses on the sale of investment securities are determined on the specific identified cost method. Dividend income and other distributions are recorded on the ex-dividend date (except for certain foreign dividends which may be recorded as soon as the Fund is informed of such dividends) net of applicable withholding taxes. Interest income is recognized on the accrual basis except where collection is in doubt. Discounts are accreted and premiums are amortized over the life of the respective securities. Most expenses of the Company can be directly attributed to a particular Fund. Expenses which cannot be directly attributed are apportioned among the Funds based upon
relative net assets or other appropriate methods. Income, expenses (other than class specific expenses — distribution and shareholder services, transfer agency and sub transfer agency fees) and realized and unrealized gains or losses are allocated to each class of shares based upon their relative net assets.
B. Advisory Fees: The Adviser, a wholly-owned subsidiary of Morgan Stanley, provides the Fund with advisory services under the terms of an Investment Advisory Agreement, paid quarterly, at the annual rate based on the daily net assets as follows:
First $750
million | | Next $750
million | | Over $1.5
billion | |
| | 0.75 | % | | | 0.70 | % | | | 0.65 | % | |
For the year ended December 31, 2018, the advisory fee rate (net of waiver/rebate) was equivalent to an annual effective rate of 0.00% of the Fund's average daily net assets.
The Adviser has agreed to reduce its advisory fee and/or reimburse the Fund so that total annual portfolio operating expenses, excluding certain investment related expenses, taxes, interest and other extraordinary expenses (including litigation), will not exceed 1.00% for Class I shares, 1.35% for Class A shares, 2.10% for Class C shares and 0.95% for Class IS shares. The fee waivers and/or expense reimbursements will continue for at least one year from the date of the Fund's prospectus or until such time as the Directors act to discontinue all or a portion of such waivers and/or reimbursements when they deem such action is appropriate. For the year ended December 31, 2018, approximately $159,000 of advisory fees were waived and approximately $34,000 of other expenses were reimbursed by the Adviser pursuant to this arrangement.
C. Administration Fees: The Adviser also serves as Administrator to the Company and provides administrative services pursuant to an Administration Agreement for an annual fee, accrued daily and paid monthly, of 0.08% of the Fund's average daily net assets.
Under a Sub-Administration Agreement between the Administrator and State Street Bank and Trust Company ("State Street"), State Street provides certain administrative services to the Company. For such services, the Administrator pays State Street a portion of the fee the Administrator receives from the Fund.
D. Distribution and Shareholder Services Fees: Morgan Stanley Distribution, Inc. ("MSDI" or the "Distributor"), a wholly-owned subsidiary of the Adviser and an indirect
18
Morgan Stanley Institutional Fund, Inc.
Annual Report — December 31, 2018
Notes to Financial Statements (cont'd)
subsidiary of Morgan Stanley, serves as the Company's Distributor of Fund shares pursuant to a Distribution Agreement. The Company has adopted a Shareholder Services Plan with respect to Class A shares pursuant to Rule 12b-1 under the Act. Under the Shareholder Services Plan, the Fund pays the Distributor a shareholder services fee, accrued daily and paid monthly, at an annual rate of 0.25% of the Fund's average daily net assets attributable to Class A shares.
The Company has adopted a Distribution and Shareholder Services Plan with respect to Class C shares pursuant to Rule 12b-1 under the Act. Under the Distribution and Shareholder Services Plan, the Fund pays the Distributor a distribution fee, accrued daily and paid monthly, at an annual rate of 0.75% and a shareholder services fee, accrued daily and paid monthly, at an annual rate of 0.25% of the Fund's average daily net assets attributable to Class C shares.
The distribution and shareholder services fees are used to support the expenses associated with servicing and maintaining accounts. The Distributor may compensate other parties for providing shareholder support services to investors who purchase Class A and Class C shares.
E. Dividend Disbursing and Transfer Agent: The Company's dividend disbursing and transfer agent is DST Asset Manager Solutions, Inc. ("DST"). Pursuant to a Transfer Agency Agreement, the Company pays DST a fee based on the number of classes, accounts and transactions relating to the Funds of the Company.
F. Custodian Fees: State Street (the "Custodian") also serves as Custodian for the Company in accordance with a Custodian Agreement. The Custodian holds cash, securities and other assets of the Company as required by the Act. Custody fees are payable monthly based on assets held in custody, investment purchases and sales activity and account maintenance fees, plus reimbursement for certain out-of-pocket expenses.
G. Security Transactions and Transactions with Affiliates: For the year ended December 31, 2018, purchases and sales of investment securities for the Fund, other than long-term U.S. Government securities and short-term investments were approximately $23,843,000 and $19,181,000, respectively. There were no purchases and sales of long-term U.S. Government securities for the year ended December 31, 2018.
The Fund invests in the Institutional Class of the Morgan Stanley Institutional Liquidity Funds — Treasury Securities Portfolio (the "Liquidity Funds"), an open-end management investment company managed by the Adviser. Advisory fees paid by the Fund are reduced by an amount equal to its pro-rata share of the advisory and administration fees paid by the Fund due to its investment in the Liquidity Funds. For the year ended December 31, 2018, advisory fees paid were reduced by approximately $1,000 relating to the Fund's investment in the Liquidity Funds.
A summary of the Fund's transactions in shares of affiliated investments during the year ended December 31, 2018 is as follows:
Affiliated
Investment
Company | | Value
December 31,
2017
(000) | | Purchases
at Cost
(000) | | Proceeds
from Sales
(000) | | Dividend
Income
(000) | |
Liquidity Funds | | $ | 426 | | | $ | 12,454 | | | $ | 12,852 | | | $ | 7 | | |
Affiliated
Investment
Company (cont'd) | | Realized
Gain (Loss)
(000) | | Change in
Unrealized
Appreciation
(Depreciation)
(000) | | Value
December 31,
2018
(000) | |
Liquidity Funds | | $ | — | | | $ | — | | | $ | 28 | | |
The Fund is permitted to purchase and sell securities ("cross-trade") from and to other Morgan Stanley funds as well as other funds and client accounts for which the Adviser or an affiliate of the Adviser serves as investment adviser, pursuant to procedures approved by the Directors in compliance with Rule 17a-7 under the Act (the "Rule"). Each cross-trade is executed at the current market price in compliance with provisions of the Rule. For the year ended December 31, 2018, the Fund did not engage in any cross-trade transactions.
The Fund has an unfunded Deferred Compensation Plan (the "Compensation Plan"), which allows each independent Director to defer payment of all, or a portion, of the fees he or she receives for serving on the Board of Directors. Each eligible Director generally may elect to have the deferred amounts credited with a return equal to the total return on one or more of the Morgan Stanley funds that are offered as investment options under the Compensation Plan. Appreciation/depreciation and distributions received from these investments are recorded with an offsetting increase/decrease in the deferred compensation obligation and do not affect the NAV of the Fund.
H. Federal Income Taxes: It is the Fund's intention to continue to qualify as a regulated investment company and distribute all of its taxable and tax-exempt income. Accordingly,
19
Morgan Stanley Institutional Fund, Inc.
Annual Report — December 31, 2018
Notes to Financial Statements (cont'd)
no provision for federal income taxes is required in the financial statements.
The Fund may be subject to taxes imposed by countries in which it invests. Such taxes are generally based on income and/or capital gains earned or repatriated. Taxes are accrued based on net investment income, net realized gains and net unrealized appreciation as such income and/or gains are earned. Taxes may also be based on transactions in foreign currency and are accrued based on the value of investments denominated in such currency.
FASB ASC 740-10, "Income Taxes — Overall", sets forth a minimum threshold for financial statement recognition of the benefit of a tax position taken or expected to be taken in a tax return. Management has concluded there are no significant uncertain tax positions that would require recognition in the financial statements. If applicable, the Fund recognizes interest accrued related to unrecognized tax benefits in "Interest Expense" and penalties in "Other Expenses" in the Statement of Operations. The Fund files tax returns with the U.S. Internal Revenue Service, New York and various states. Generally, each of the tax years in the four-year period ended December 31, 2018 remains subject to examination by taxing authorities.
The tax character of distributions paid may differ from the character of distributions shown for GAAP purposes due to short-term capital gains being treated as ordinary income for tax purposes. The tax character of distributions paid during fiscal years 2018 and 2017 was as follows:
2018
Distributions
Paid From: | | 2017
Distributions
Paid From: | |
Ordinary
Income
(000) | | Long-Term
Capital Gain
(000) | | Ordinary
Income
(000) | | Paid-in-
Capital
(000) | |
| $ | 92 | | | | — | | | $ | 23 | | | $ | 9 | | |
The amount and character of income and gains to be distributed are determined in accordance with income tax regulations which may differ from GAAP. These book/tax differences are either considered temporary or permanent in nature.
Temporary differences are attributable to differing book and tax treatments for the timing of the recognition of gains (losses) on certain investment transactions and the timing of the deductibility of certain expenses.
The Fund had no permanent differences causing reclassifications among the components of net assets for the year ended December 31, 2018.
At December 31, 2018, the components of distributable earnings for the Fund on a tax basis were as follows:
Undistributed
Ordinary
Income
(000) | | Undistributed
Long-Term
Capital Gain
(000) | |
| $ | 114 | | | $ | — | | |
At December 31, 2018, the Fund had available for federal income tax purposes unused short-term capital losses of approximately $595,000 that do not have an expiration date.
To the extent that capital loss carryforwards are used to offset any future capital gains realized, no capital gains tax liability will be incurred by the Fund for gains realized and not distributed. To the extent that capital gains are offset, such gains will not be distributed to the shareholders.
I. Credit Facility: The Company and other Morgan Stanley funds participated in a $150,000,000 committed, unsecured revolving line of credit facility (the "Facility") with State Street. This Facility is to be used for temporary emergency purposes or funding of shareholder redemption requests. The interest rate on borrowings is based on the federal funds rate or 1 month LIBOR rate plus a spread. The Facility also has a commitment fee of 0.25% per annum based on the unused portion of the Facility. During the year ended December 31, 2018, the Fund did not have any borrowings under the Facility.
J. Other: At December 31, 2018, the Fund had record owners of 10% or greater. Investment activities of these shareholders could have a material impact on the Fund. The aggregate percentage of such owners was 66.7%.
20
Morgan Stanley Institutional Fund, Inc.
Annual Report — December 31, 2018
Report of Independent Registered Public Accounting Firm
To the Shareholders and Board of Directors of
Morgan Stanley Institutional Fund, Inc. —
Global Concentrated Portfolio
Opinion on the Financial Statements
We have audited the accompanying statement of assets and liabilities of Global Concentrated Portfolio (the "Fund") (one of the funds constituting the Morgan Stanley Institutional Fund, Inc. (the "Company")), including the portfolio of investments, as of December 31, 2018, and the related statement of operations for the year then ended, the statements of changes in net assets for each of the two years in the period then ended, the financial highlights for each of the two years in the period then ended and the period from May 27, 2016 (commencement of operations) through December 31, 2016 and the related notes (collectively referred to as the "financial statements"). In our opinion, the financial statements present fairly, in all material respects, the financial position of Global Concentrated Portfolio (one of the funds constituting Morgan Stanley Institutional Fund, Inc.) at December 31, 2018, the results of its operations for the year then ended, the changes in its net assets for each of the two years in the period then ended and its financial highlights for each of the two years in the period then ended and the period from May 27, 2016 (commencement of operations) through December 31, 2016, in conformity with U.S. generally accepted accounting principles.
Basis for Opinion
These financial statements are the responsibility of the Company's management. Our responsibility is to express an opinion on the Fund's financial statements based on our audits. We are a public accounting firm registered with the Public Company Accounting Oversight Board (United States) ("PCAOB") and are required to be independent with respect to the Company in accordance with the U.S. federal securities law and the applicable rules and regulations of the Securities and Exchange Commission and the PCAOB.
We conducted our audits in accordance with the standards of the PCAOB. Those standards require that we plan and perform the audit to obtain reasonable assurance about whether the financial statements are free of material misstatement, whether due to error or fraud. The Company is not required to have, nor were we engaged to perform, an audit of the Company's internal control over financial reporting. As part of our audits, we are required to obtain an understanding of internal control over financial reporting, but not for the purpose of expressing an opinion on the effectiveness of the Company's internal control over financial reporting. Accordingly, we express no such opinion.
Our audits included performing procedures to assess the risks of material misstatement of the financial statements, whether due to error or fraud, and performing procedures that respond to those risks. Such procedures included examining, on a test basis, evidence regarding the amounts and disclosures in the financial statements. Our procedures included confirmation of securities owned as of December 31, 2018 by correspondence with the custodian and others or by other appropriate auditing procedures where replies from others were not received. Our audits also included evaluating the accounting principles used and significant estimates made by management, as well as evaluating the overall presentation of the financial statements. We believe that our audits provide a reasonable basis for our opinion.

We have served as the auditor of one or more Morgan Stanley investment companies since 2000.
Boston, Massachusetts
February 26, 2019
21
Morgan Stanley Institutional Fund, Inc.
Annual Report — December 31, 2018
Federal Tax Notice (unaudited)
For federal income tax purposes, the following information is furnished with respect to the distributions paid by the Fund during its taxable year ended December 31, 2018. For corporate shareholders 100% of the dividends qualified for the dividends received deduction.
For federal income tax purposes, the following information is furnished with respect to the Fund's earnings for its taxable year ended December 31, 2018. When distributed, certain earnings may be subject to a maximum tax rate of 15% as provided for by the Jobs and Growth Tax Relief Reconciliation Act of 2003. The Fund designated up to a maximum of approximately $92,000 as taxable at this lower rate.
In January, the Fund provides tax information to shareholders for the preceding calendar year.
22
Morgan Stanley Institutional Fund, Inc.
Annual Report — December 31, 2018
Privacy Notice (unaudited)
MORGAN STANLEY INVESTMENT MANAGEMENT INC.
AN IMPORTANT NOTICE CONCERNING OUR U.S. PRIVACY POLICY
We are required by federal law to provide you with a copy of our privacy policy annually. This policy applies to current and former individual investors in funds managed or sponsored by Morgan Stanley Investment Management Inc. ("MSIM") as well as current and former individual clients of MSIM. This policy is not applicable to partnerships, corporations, trusts or other non-individual clients or investors. Please note that we may amend this policy at any time, and will inform you of any changes as required by law.
WE RESPECT YOUR PRIVACY
We appreciate that you have provided us with your personal financial information. We strive to maintain the privacy of such information while we help you achieve your financial objectives. This Notice describes what non-public personal information we collect about you, why we collect it, when we may share it with others and how certain others may use it. It discusses the steps you may take to limit our sharing of certain information about you to affiliated companies in the Morgan Stanley family of companies ("other Morgan Stanley companies"). It also discloses how you may limit use of certain shared information for marketing purposes by other Morgan Stanley branded companies. Throughout this policy, we refer to the non-public information that personally identifies you or your accounts as "personal information.''
1. WHAT PERSONAL INFORMATION DO WE COLLECT ABOUT YOU?
We obtain personal information from applications and other forms you submit to us, from your dealings with us, from consumer reporting agencies, from our Web sites and from third parties and other sources.
For example:
• We may collect information such as your name, address, e-mail address, telephone/fax numbers, assets, income and investment objectives through subscription documents, applications and other forms you submit to us.
• We may obtain information about account balances, your use of account(s) and the types of products and services you prefer to receive from us through your dealings and transactions with us and other sources.
• We may obtain information about your creditworthiness and credit history from consumer reporting agencies.
• We may collect background information from and through third-party vendors to verify representations you have made and to comply with various regulatory requirements.
• If you interact with us through our public and private Web sites, we may collect information that you provide directly through online communications (such as an e-mail address). We may also collect information about your Internet service provider, your domain name, your computer's operating system and Web browser, your use of our Web sites and your product and service preferences, through the use of "cookies." Please consult the Terms of Use of these sites for more details.
2. WHEN DO WE DISCLOSE PERSONAL INFORMATION WE COLLECT ABOUT YOU?
We may disclose personal information we collect about you to other Morgan Stanley companies and to non-affiliated third parties.
a. Information We Disclose to Other Morgan Stanley Companies.
We may disclose personal information to other Morgan Stanley companies for a variety of reasons, including to manage your account(s) effectively, to service and process your transactions, to let you know about products and services offered by us and other Morgan Stanley companies, to manage our business, and as otherwise required or permitted by law. Offers for products and services from other Morgan Stanley companies are developed under conditions designed to safeguard your personal information.
23
Morgan Stanley Institutional Fund, Inc.
Annual Report — December 31, 2018
Privacy Notice (unaudited) (cont'd)
b. Information We Disclose to Non-affiliated Third Parties.
We do not disclose personal information that we collect about you to non-affiliated third parties except to those who provide marketing services on our behalf, to financial institutions with whom we have joint marketing agreements, and as otherwise required or permitted by law. For example, we may disclose personal information to non-affiliated third parties for servicing and processing transactions, to offer our own products and services, to protect against fraud, for institutional risk control, to respond to judicial process or to perform services on our behalf. When we share personal information with a non-affiliated third party, they are required to limit their use of personal information to the particular purpose for which it was shared and they are not allowed to share personal information with others except to fulfill that limited purpose or as may be permitted or required by law.
3. HOW DO WE PROTECT THE SECURITY AND CONFIDENTIALITY OF PERSONAL INFORMATION WE COLLECT ABOUT YOU?
We maintain physical, electronic and procedural security measures to help safeguard the personal information we collect about you. We have internal policies governing the proper handling of client information. Third parties that provide support or marketing services on our behalf may also receive personal information, and we require them to adhere to confidentiality standards with respect to such information.
4. HOW CAN YOU LIMIT THE SHARING OF CERTAIN TYPES OF PERSONAL INFORMATION WITH OTHER MORGAN STANLEY COMPANIES?
We offer you choices as to whether we share with other Morgan Stanley companies the personal information that was collected to determine your eligibility for products and services you request ("eligibility information"). Eligibility information does not include your identification information or personal information pertaining to our transactions or experiences with you. Please note that, even if you direct us not to share eligibility information with other Morgan Stanley companies ("opt-out"), we may still share personal information, including eligibility information, with those companies in circumstances excluded from the opt-out under applicable law, such as to process transactions or to service your account.
5. HOW CAN YOU LIMIT THE USE OF CERTAIN TYPES OF PERSONAL INFORMATION BY OTHER MORGAN STANLEY COMPANIES FOR MARKETING?
By following the opt-out instructions in Section 6 below, you may limit other Morgan Stanley branded companies from marketing their products or services to you based on personal information we disclose to them. This information may include, for example, your income and account history with us. Please note that, even if you choose to limit Other Morgan Stanley Companies from using personal information about you that we may share with them for marketing their products and services to you, Other Morgan Stanley Companies may use your personal information that they obtain from us to market to you in circumstances permitted by law, such as if the Other Morgan Stanley Company has its own relationship with you.
6. HOW CAN YOU SEND US AN OPT-OUT INSTRUCTION?
If you wish to limit our sharing of eligibility information about you with other Morgan Stanley companies or other Morgan Stanley companies' use of personal information for marketing purposes, as described in this notice, you may do so by:
• Calling us at (800) 548-7786
Monday–Friday between 8a.m. and 6p.m. (EST)
• Writing to us at the following address:
DST Asset Manager Solutions, Inc.
c/o Privacy Coordinator
P.O. Box 219804
Kansas City, Missouri 64121
24
Morgan Stanley Institutional Fund, Inc.
Annual Report — December 31, 2018
Privacy Notice (unaudited) (cont'd)
Your written request should include your name, address, telephone number and account number(s) to which the opt-out applies and whether you are opting out with respect to sharing of eligibility information (Section 4 above), or if information used for Marketing (Section 5 above) or both. Written opt-out requests should not be sent with any other correspondence. In order to process your request, we require that the request be provided by you directly and not through a third party.
Your opt-out preference will remain in effect with respect to this policy (as it may be amended) until you notify us otherwise. If you have a joint account, your direction for us not to share this information with other Morgan Stanley companies and for those other Morgan Stanley companies not to use your personal information for marketing will be applied to all account holders on that account. Please understand that if you limit our sharing or our affiliated companies' use of personal information, you and any joint account holder(s) may not receive information about Morgan Stanley products and services, including products or services that could help you manage your financial resources and achieve your investment objectives.
7. WHAT IF AN AFFILIATED COMPANY BECOMES A NON-AFFILIATED THIRD PARTY?
If, at any time in the future, an affiliated company becomes a non-affiliated third party, further disclosures of personal information made to the former affiliated company will be limited to those described in Section 2(b) above relating to non-affiliated third parties. If you elected under Section 6 to limit disclosures we make to affiliated companies, or use of personal information by affiliated companies, your election will not apply to use by any former affiliated company of your personal information in their possession once it becomes a non-affiliated third party.
SPECIAL NOTICE TO RESIDENTS OF VERMONT
The following section supplements our policy with respect to our individual clients who have a Vermont address and supersedes anything to the contrary in the above policy with respect to those clients only.
The state of Vermont requires financial institutions to obtain your consent prior to sharing personal information that they collect about you with affiliated companies and non-affiliated third parties other than in certain limited circumstances. Except as permitted by law, we will not share personal information we collect about you with non-affiliated third parties or other Morgan Stanley companies unless you provide us with your written consent to share such information ("opt-in").
If you wish to receive offers for investment products and services offered by or through other Morgan Stanley companies, please notify us in writing at the following address:
DST Asset Manager Solutions, Inc.
c/o Privacy Coordinator
P.O. Box 219804
Kansas City, Missouri 64121
Your authorization should include your name, address, telephone number and account number(s) to which the opt-in applies and should not be sent with any other correspondence. In order to process your authorization, we require that the authorization be provided by you directly and not through a third party.
SPECIAL NOTICE TO RESIDENTS OF CALIFORNIA
The following section supplements our policy with respect to our individual clients who have a California address and supersedes anything to the contrary in the above policy with respect to those clients only.
In response to a California law, if your account has a California home address, your personal information will not be disclosed to non-affiliated third parties except as permitted by applicable California law, and we will limit sharing such information with our affiliates to comply with California privacy laws that apply to us.
25
Morgan Stanley Institutional Fund, Inc.
Annual Report — December 31, 2018
Director and Officer Information (unaudited)
Independent Directors:
Name, Age and Address of
Independent Director | | Position(s)
Held with
Registrant | | Length of Time
Served* | | Principal Occupation(s) During Past 5 Years
and Other Relevant Professional Experience | | Number of
Portfolios in
Fund Complex
Overseen by
Independent
Director** | | Other Directorships
Held by Independent
Director*** | |
Frank L. Bowman (74)
c/o Perkins Coie LLP
Counsel to the Independent
Directors
30 Rockefeller Plaza
New York, NY 10112 | | Director | | Since
August
2006 | | President, Strategic Decisions, LLC (consulting) (since February 2009); Director or Trustee of various Morgan Stanley Funds (since August 2006); Chairperson of the Compliance and Insurance Committee (since October 2015); formerly, Chairperson of the Insurance Sub-Committee of the Compliance and Insurance Committee (2007-2015); served as President and Chief Executive Officer of the Nuclear Energy Institute (policy organization) (February 2005-November 2008); retired as Admiral, U.S. Navy after serving over 38 years on active duty including 8 years as Director of the Naval Nuclear Propulsion Program in the Department of the Navy and the U.S. Department of Energy (1996-2004); served as Chief of Naval Personnel (July 1994-September 1996) and on the Joint Staff as Director of Political Military Affairs (June 1992-July 1994); knighted as Honorary Knight Commander of the Most Excellent Order of the British Empire; awarded the Officier de l'Orde National du Mérite by the French Government; elected to the National Academy of Engineering (2009). | | | 82 | | | Director of BP p.l.c.; Director of Naval and Nuclear Technologies LLP; Director Emeritus of the Armed Services YMCA; Member of the National Security Advisory Council of the Center for U.S. Global Engagement and a member of the CNA Military Advisory Board; Trustee of Fairhaven United Methodist Church; Member of the Board of Advisors of the Dolphin Scholarship Foundation; and Director of other various non-profit organizations. | |
Kathleen A. Dennis (65)
c/o Perkins Coie LLP
Counsel to the Independent Directors
30 Rockefeller Plaza
New York, NY 10112 | | Director | | Since
August
2006 | | President, Cedarwood Associates (mutual fund and investment management consulting) (since July 2006); Chairperson of the Liquidity and Alternatives Sub-Committee of the Investment Committee (since October 2006) and Director or Trustee of various Morgan Stanley Funds (since August 2006); formerly, Senior Managing Director of Victory Capital Management (1993-2006). | | | 82 | | | Director of various non-profit organizations. | |
Nancy C. Everett (63)
c/o Perkins Coie LLP
Counsel to the Independent Directors
30 Rockefeller Plaza
New York, NY 10112 | | Director | | Since
January
2015 | | Chief Executive Officer, Virginia Commonwealth University Investment Company (since November 2015); Owner, OBIR, LLC (institutional investment management consulting) (since June 2014); formerly, Managing Director, BlackRock Inc. (February 2011-December 2013); and Chief Executive Officer, General Motors Asset Management (a/k/a Promark Global Advisors, Inc.) (June 2005-May 2010). | | | 83 | | | Formerly, Member of Virginia Commonwealth University School of Business Foundation (2005-2016); Member of Virginia Commonwealth University Board of Visitors (2013-2015); Member of Committee on Directors for Emerging Markets Growth Fund, Inc. (2007-2010); Chairperson of Performance Equity Management, LLC (2006-2010); and Chairperson, GMAM Absolute Return Strategies Fund, LLC (2006-2010). | |
26
Morgan Stanley Institutional Fund, Inc.
Annual Report — December 31, 2018
Director and Officer Information (unaudited) (cont'd)
Independent Directors: (cont'd)
Name, Age and Address of
Independent Director | | Position(s)
Held with
Registrant | | Length of Time
Served* | | Principal Occupation(s) During Past 5 Years
and Other Relevant Professional Experience | | Number of
Portfolios in
Fund Complex
Overseen by
Independent
Director** | | Other Directorships
Held by Independent
Director*** | |
Jakki L. Haussler (61)
c/o Perkins Coie LLP
Counsel to the Independent Directors
30 Rockefeller Plaza
New York, NY 10112 | | Director | | Since
January
2015 | | Chairman and Chief Executive Officer, Opus Capital Group (since January 1996); formerly, Director, Capvest Venture Fund, LP (May 2000-December 2011); Partner, Adena Ventures, LP (July 1999-December 2010); Director, The Victory Funds (February 2005-July 2008). | | | 83 | | | Director of Service Corporation International and Member, Audit Committee and Investment Committee; Director of Cincinnati Bell Inc. and Member, Audit Committee and Governance and Nominating Committee; Chairman of Northern Kentucky University Member Investment Committee; Member of Chase College of Law Transactional Law Practice Center Board of Advisors; Director of Best Transport; Director of Chase College of Law Board of Visitors; formerly, Member, University of Cincinnati Foundation Investment Committee; Member, Miami University Board of Visitors (2008-2011); Trustee of Victory Funds (2005-2008) and Chairman, Investment Committee (2007-2008) and Member, Service Provider Committee (2005-2008). | |
Dr. Manuel H. Johnson (69)
c/o Johnson Smick
International, Inc.
220 I Street, NE — Suite 200
Washington, D.C. 20002 | | Director | | Since
July
1991 | | Senior Partner, Johnson Smick International, Inc. (consulting firm); Chairperson of the Investment Committee (since October 2006) and Director or Trustee of various Morgan Stanley Funds (since July 1991); Co-Chairman and a founder of the Group of Seven Council (G7C) (international economic commission); formerly, Chairperson of the Audit Committee (July 1991-September 2006), Vice Chairman of the Board of Governors of the Federal Reserve System and Assistant Secretary of the U.S. Treasury. | | | 82 | | | Director of NVR, Inc. (home construction). | |
Joseph J. Kearns (76)
c/o Perkins Cole LLP
Counsel to the Independent
Directors
30 Rockfeller Plaza
New York, NY 10112 | | Director | | Since
August
1994 | | Senior Adviser, Kearns & Associates LLC (investment consulting); Chairperson of the Audit Committee (since October 2006) and Director or Trustee of various Morgan Stanley Funds (since August 1994); formerly, Deputy Chairperson of the Audit Committee (July 2003-September 2006) and Chairperson of the Audit Committee of various Morgan Stanley Funds (since August 1994); CFO of the J. Paul Getty Trust. | | | 83 | | | Prior to August 10, 2016, Director of Electro Rent Corporation (equipment leasing); Prior to December 31, 2013, Director of The Ford Family Foundation. | |
27
Morgan Stanley Institutional Fund, Inc.
Annual Report — December 31, 2018
Director and Officer Information (unaudited) (cont'd)
Independent Directors: (cont'd)
Name, Age and Address of
Independent Director | | Position(s)
Held with
Registrant | | Length of Time
Served* | | Principal Occupation(s) During Past 5 Years
and Other Relevant Professional Experience | | Number of
Portfolios in
Fund Complex
Overseen by
Independent
Director** | | Other Directorships
Held by Independent
Director*** | |
Michael F. Klein (60)
c/o Perkins Coie LLP
Counsel to the Independent Directors
30 Rockefeller Plaza
New York, NY 10112 | | Director | | Since
August
2006 | | Managing Director, Aetos Alternatives Management, LP (since March 2000); Co-President, Aetos Alternatives Management, LP (since January 2004) and Co-Chief Executive Officer of Aetos Alternatives Management, LP (since August 2013); Chairperson of the Fixed Income Sub-Committee of the Investment Committee (since October 2006) and Director or Trustee of various Morgan Stanley Funds (since August 2006); formerly, Managing Director, Morgan Stanley & Co. Inc. and Morgan Stanley Dean Witter Investment Management and President, various Morgan Stanley Funds (June 1998-March 2000); Principal, Morgan Stanley & Co. Inc. and Morgan Stanley Dean Witter Investment Management (August 1997-December 1999). | | | 82 | | | Director of certain investment funds managed or sponsored by Aetos Alternatives Management, LP; Director of Sanitized AG and Sanitized Marketing AG (specialty chemicals). | |
Patricia Maleski (58)
c/o Perkins Coie LLP
Counsel to the Independent Directors
30 Rockefeller Plaza
New York, NY 10112 | | Director | | Since
January
2017 | | Managing Director, JPMorgan Asset Management (2004-2016); Oversight and Control Head of Fiduciary and Conflicts of Interest Program (2015-2016); Chief Control Officer-Global Asset Management (2013-2015); President, JPMorgan Funds (2010-2013); Chief Administrative Officer (2004-2013); various other positions including Treasurer and Board Liaison (since 2001). | | | 83 | | | None. | |
Michael E. Nugent (82)
522 Fifth Avenue
New York, NY 10036 | | Chair of the Board and Director | | Chair of the Boards since July 2006 and Director since July 1991 | | Chair of the Boards of various Morgan Stanley Funds (since July 2006); Chairperson of the Closed-End Fund Committee (since June 2012) Governance Committee (since January 2019) and Director or Trustee of various Morgan Stanley Funds (since July 1991); formerly, Chairperson of the Insurance Committee (until July 2006); General Partner, Triumph Capital, L.P. (private investment partnership) (1988-2013). | | | 82 | | | None. | |
W. Allen Reed (71)
c/o Perkins Coie LLP
Counsel to the Independent Directors
30 Rockefeller Plaza
New York, NY 10112 | | Director | | Since
August
2006 | | Chairperson of the Equity Sub-Committee of the Investment Committee (since October 2006) and Director or Trustee of various Morgan Stanley Funds (since August 2006); formerly, President and CEO of General Motors Asset Management; Chairman and Chief Executive Officer of the GM Trust Bank and Corporate Vice President of General Motors Corporation (August 1994-December 2005). | | | 82 | | | Director of Legg Mason, Inc.; formerly, Director of the Auburn University Foundation (2010-2015). | |
Fergus Reid (86)****
c/o Joe Pietryka, Inc.
85 Charles Colman Blvd.
Pawling, NY 12564 | | Director | | Since
June
1992 | | Chairman, Joe Pietryka, Inc.; Chairperson of the Governance Committee and Director or Trustee of various Morgan Stanley Funds (since June 1992). | | | 83 | | | Formerly, Trustee and Director of certain investment companies in the JP Morgan Fund Complex managed by JP Morgan Investment Management Inc. (1987-2012). | |
* This is the earliest date the Director began serving the Morgan Stanley Funds. Each Director serves an indefinite term, until his or her successor is elected.
** The Fund Complex includes (as of December 31, 2018) all open-end and closed-end funds (including all of their portfolios) advised by Morgan Stanley Investment Management Inc. (the "Adviser") and any funds that have an adviser that is an affiliated person of the Adviser (including, but not limited to, Morgan Stanley AIP GP LP).
*** This includes any directorships at public companies and registered investment companies held by the Director at any time during the past five years.
**** Effective date of retirement is December 31, 2018.
28
Morgan Stanley Institutional Fund, Inc.
Annual Report — December 31, 2018
Director and Officer Information (unaudited) (cont'd)
Executive Officers:
Name, Age and Address of Executive Officer | | Position(s) Held
with
Registrant | | Length of Time
Served* | | Principal Occupation(s) During Past 5 Years | |
John H. Gernon (55)
522 Fifth Avenue
New York, NY 10036 | | President and Principal Executive Officer | | Since
September
2013 | | President and Principal Executive Officer of the Equity and Fixed Income Funds and the Morgan Stanley AIP Funds (since September 2013) and the Liquidity Funds and various money market funds (since May 2014) in the Fund Complex; Managing Director of the Adviser; Head of Product (since 2006). | |
Timothy J. Knierim (59)
522 Fifth Avenue
New York, NY 10036 | | Chief Compliance Officer | | Since
December
2016 | | Managing Director of the Adviser and various entities affiliated with the Adviser; Chief Compliance Officer of various Morgan Stanley Funds and the Adviser (since December 2016) and Chief Compliance Officer of Morgan Stanley AIP GP LP (since 2014). Formerly, Managing Director and Deputy Chief Compliance Officer of the Adviser (2014-2016); and formerly, Chief Compliance Officer of Prudential Investment Management, Inc. (2007-2014). | |
Francis J. Smith (53)
522 Fifth Avenue
New York, NY 10036 | | Treasurer and Principal Financial Officer | | Treasurer since July 2003 and Principal Financial Officer since September 2002 | | Managing Director of the Adviser and various entities affiliated with the Adviser; Treasurer (since July 2003) and Principal Financial Officer of various Morgan Stanley Funds (since September 2002). | |
Mary E. Mullin (51)
522 Fifth Avenue
New York, NY 10036 | | Secretary | | Since
June
1999 | | Managing Director of the Adviser; Secretary of various Morgan Stanley Funds (since June 1999). | |
Michael J. Key (39)
522 Fifth Avenue
New York, NY 10036 | | Vice President | | Since
June
2017 | | Vice President of the Equity and Fixed Income Funds, Liquidity Funds, various money market funds and the Morgan Stanley AIP Funds in the Fund Complex (since June 2017); Executive Director of the Adviser; Head of Product Development for Equity and Fixed Income Funds (since August 2013). | |
* This is the earliest date the officer began serving the Morgan Stanley Funds. Each officer serves a one-year term, until his or her successor is elected and qualifies.
29
Morgan Stanley Institutional Fund, Inc.
Annual Report — December 31, 2018
Adviser and Administrator
Morgan Stanley Investment Management Inc.
522 Fifth Avenue
New York, New York 10036
Distributor
Morgan Stanley Distribution, Inc.
522 Fifth Avenue
New York, New York 10036
Dividend Disbursing and Transfer Agent
DST Asset Manager Solutions, Inc.
2000 Crown Colony Drive
Quincy, Massachusetts 02169
Custodian
State Street Bank and Trust Company
One Lincoln Street
Boston, Massachusetts 02111
Legal Counsel
Dechert LLP
1095 Avenue of the Americas
New York, New York 10036
Counsel to the Independent Directors
Perkins Coie LLP
30 Rockefeller Plaza
New York, New York 10112
Independent Registered Public Accounting Firm
Ernst & Young LLP
200 Clarendon Street
Boston, Massachusetts 02116
Reporting to Shareholders
Each Morgan Stanley fund provides a complete schedule of portfolio holdings in its semi-annual and the annual reports within 60 days of the end of the fund's second and fourth fiscal quarters. The semi-annual and annual reports are filed electronically with the Securities and Exchange Commission ("SEC") on Form N-CSRS and Form N-CSR, respectively. Morgan Stanley also delivers the semi-annual and annual reports to fund shareholders and makes these reports available on its public website, www.morganstanley.com/im/shareholderreports. Each Morgan Stanley fund also files a complete schedule of portfolio holdings with the SEC for the fund's first and third fiscal quarters on Form N-Q. Morgan Stanley does not deliver the reports for the first and third fiscal quarters to shareholders, nor are the reports posted to the Morgan Stanley public website. You may, however, obtain the Form N-Q filings (as well as the Form N-CSR and N-CSRS filings) by accessing the SEC's website, www.sec.gov. You can also request copies of these materials, upon payment of a duplicating fee, by electronic request at the SEC's email address (publicinfo@sec.gov).
Proxy Voting Policies and Procedures and Proxy Voting Record
You may obtain a copy of the Company's Proxy Voting Policy and Procedures and information regarding how the Company voted proxies relating to portfolio securities during the most recent twelve-month period ended June 30, without charge, upon request, by calling toll free 1 (800) 548-7786 or by visiting our website at www.morganstanley.com/im/shareholderreports. This information is also available on the SEC's website at www.sec.gov.
This report is authorized for distribution only when preceded or accompanied by a prospectus or summary prospectus of the applicable Fund of Morgan Stanley Institutional Fund, Inc., which describes in detail the Fund's investment policies, risks, fees and expenses. Please read the prospectus carefully before you invest or send money. For additional information, including information regarding the investments comprising the Fund, please visit our website at www.morganstanley.com/im/shareholderreports or call toll free 1 (800) 548-7786.
30
Printed in U.S.A.
This Report has been prepared for shareholders and may be distributed to others only if preceded or accompanied by a current prospectus.
Morgan Stanley Investment Management Inc.
522 Fifth Avenue
New York, New York 10036
© 2019 Morgan Stanley. Morgan Stanley Distribution, Inc.

IFIGCNPANN
2402603 EXP. 02.29.20
Item 2. Code of Ethics.
(a) The registrant has adopted a code of ethics (the “Code of Ethics”) that applies to its principal executive officer, principal financial officer, principal accounting officer or controller, or persons performing similar functions, regardless of whether these individuals are employed by the registrant or a third party.
(b) No information need be disclosed pursuant to this paragraph.
(c) Not applicable.
(d) Not applicable.
(e) Not applicable.
(f)
(1) The registrant’s Code of Ethics is attached hereto as Exhibit 12 A.
(2) Not applicable.
(3) Not applicable.
Item 3. Audit Committee Financial Expert.
The registrant’s Board of Trustees has determined that Joseph J. Kearns, an “independent” Trustee, is an “audit committee financial expert” serving on its audit committee. Under applicable securities laws, a person who is determined to be an audit committee financial expert will not be deemed an “expert” for any purpose, including without limitation for the purposes of Section 11 of the Securities Act of 1933, as a result of being designated or identified as an audit committee financial expert. The designation or identification of a person as an audit committee financial expert does not impose on such person any duties, obligations, or liabilities that are greater than the duties, obligations, and liabilities imposed on such person as a member of the audit committee and Board of Trustees in the absence of such designation or identification.
Item 4. Principal Accountant Fees and Services.
(a)(b)(c)(d) and (g). Based on fees billed for the periods shown:
2018
| | Registrant | | Covered Entities(1) | |
Audit Fees | | $ | 1,340,837 | | N/A | |
| | | | | |
Non-Audit Fees | | | | | |
Audit-Related Fees | | $ | — | (2) | $ | — | (2) |
Tax Fees | | $ | 158,795 | (3) | $ | 8,773,935 | (4) |
All Other Fees | | $ | | | $ | 18,115 | (5) |
Total Non-Audit Fees | | $ | 158,795 | | $ | 8,792,050 | |
| | | | | |
Total | | $ | 1,499,632 | | $ | 8,792,050 | |
2017
| | Registrant | | Covered Entities(1) | |
Audit Fees | | $ | 1,281,889 | | N/A | |
| | | | | |
Non-Audit Fees | | | | | |
Audit-Related Fees | | $ | — | (2) | $ | — | (2) |
Tax Fees | | $ | 138,206 | (3) | $ | 11,474,825 | (4) |
All Other Fees | | $ | — | | $ | 136,088 | (5) |
Total Non-Audit Fees | | $ | 138,206 | | $ | 11,610,913 | |
| | | | | |
Total | | $ | 1,420,095 | | $ | 11,610,913 | |
N/A- Not applicable, as not required by Item 4.
(1) Covered Entities include the Adviser (excluding sub-advisors) and any entity controlling, controlled by or under common control with the Adviser that provides ongoing services to the Registrant.
(2) Audit-Related Fees represent assurance and related services provided that are reasonably related to the performance of the audit of the financial statements of the Covered Entities’ and funds advised by the Adviser or its affiliates, specifically data verification and agreed-upon procedures related to asset securitizations and agreed-upon procedures engagements.
(3) Tax Fees represent tax compliance, tax planning and tax advice services provided in connection with the preparation and review of the Registrant’s tax returns.
(4) Tax Fees represent tax compliance, tax planning and tax advice services provided in connection with the review of Covered Entities’ tax returns.
(5) All other fees represent project management for future business applications and improving business and operational processes.
(e)(1) The audit committee’s pre-approval policies and procedures are as follows:
APPENDIX A
AUDIT COMMITTEE
AUDIT AND NON-AUDIT SERVICES
PRE-APPROVAL POLICY AND PROCEDURES
OF THE
MORGAN STANLEY FUNDS
AS ADOPTED AND AMENDED JULY 23, 2004 AND JUNE 15 AND 16, 2016(3)
1. Statement of Principles
The Audit Committee of the Board is required to review and, in its sole discretion, pre-approve all Covered Services to be provided by the Independent Auditors to the Fund and Covered Entities in order to assure that services performed by the Independent Auditors do not impair the auditor’s independence from the Fund.
The SEC has issued rules specifying the types of services that an independent auditor may not provide to its audit client, as well as the audit committee’s administration of the engagement of the independent auditor. The SEC’s rules establish two different approaches to pre-approving services, which the SEC considers to be equally valid. Proposed services either: may be pre-approved without consideration of specific case-by-case services by the Audit Committee (“general pre-approval”); or require the specific pre-approval of the Audit Committee or its delegate (“specific pre-approval”). The Audit Committee believes that the combination of these two approaches in this Policy will result in an effective and efficient procedure to pre-approve services performed by the Independent Auditors. As set forth in this Policy, unless a type of service has received general pre-approval, it will require specific pre-approval by the Audit Committee (or by any member of the Audit Committee to which pre-approval authority has been delegated) if it is to be provided by the Independent Auditors. Any proposed services exceeding pre-approved cost levels or budgeted amounts will also require specific pre-approval by the Audit Committee.
The appendices to this Policy describe the Audit, Audit-related, Tax and All Other services that have the general pre-approval of the Audit Committee. The term of any general pre-approval is 12 months from the date of pre-approval, unless the Audit Committee considers and provides a different period and states otherwise. The Audit Committee will annually review and pre-approve the services that may be provided by the Independent Auditors without obtaining specific pre-approval from the Audit Committee. The Audit Committee will add to or subtract from the list of general pre-approved services from time to time, based on subsequent determinations.
The purpose of this Policy is to set forth the policy and procedures by which the Audit Committee intends to fulfill its responsibilities. It does not delegate the Audit Committee’s responsibilities to pre-approve services performed by the Independent Auditors to management.
The Fund’s Independent Auditors have reviewed this Policy and believes that implementation of the Policy will not adversely affect the Independent Auditors’ independence.
(3) This Audit Committee Audit and Non-Audit Services Pre-Approval Policy and Procedures (the “Policy”), adopted as of the date above, supersedes and replaces all prior versions that may have been adopted from time to time.
2. Delegation
As provided in the Act and the SEC’s rules, the Audit Committee may delegate either type of pre-approval authority to one or more of its members. The member to whom such authority is delegated must report, for informational purposes only, any pre-approval decisions to the Audit Committee at its next scheduled meeting.
3. Audit Services
The annual Audit services engagement terms and fees are subject to the specific pre-approval of the Audit Committee. Audit services include the annual financial statement audit and other procedures required to be performed by the Independent Auditors to be able to form an opinion on the Fund’s financial statements. These other procedures include information systems and procedural reviews and testing performed in order to understand and place reliance on the systems of internal control, and consultations relating to the audit. The Audit Committee will approve, if necessary, any changes in terms, conditions and fees resulting from changes in audit scope, Fund structure or other items.
In addition to the annual Audit services engagement approved by the Audit Committee, the Audit Committee may grant general pre-approval to other Audit services, which are those services that only the Independent Auditors reasonably can provide. Other Audit services may include statutory audits and services associated with SEC registration statements (on Forms N-1A, N-2, N-3, N-4, etc.), periodic reports and other documents filed with the SEC or other documents issued in connection with securities offerings.
The Audit Committee has pre-approved the Audit services in Appendix B.1. All other Audit services not listed in Appendix B.1 must be specifically pre-approved by the Audit Committee (or by any member of the Audit Committee to which pre-approval has been delegated).
4. Audit-related Services
Audit-related services are assurance and related services that are reasonably related to the performance of the audit or review of the Fund’s financial statements and, to the extent they are Covered Services, the Covered Entities or that are traditionally performed by the Independent Auditors. Because the Audit Committee believes that the provision of Audit-related services does not impair the independence of the auditor and is consistent with the SEC’s rules on auditor independence, the Audit Committee may grant general pre-approval to Audit-related services. Audit-related services include, among others, accounting consultations related to accounting, financial reporting or disclosure matters not classified as “Audit services”; assistance with understanding and implementing new accounting and financial reporting guidance from rulemaking authorities; agreed-upon or expanded audit procedures related to accounting and/or billing records required to respond to or comply with financial, accounting or regulatory reporting matters; and assistance with internal control reporting requirements under Forms N-CEN and/or N-CSR.
The Audit Committee has pre-approved the Audit-related services in Appendix B.2. All other Audit-related services not listed in Appendix B.2 must be specifically pre-approved by the Audit Committee (or by any member of the Audit Committee to which pre-approval has been delegated).
5. Tax Services
The Audit Committee believes that the Independent Auditors can provide Tax services to the Fund and, to the extent they are Covered Services, the Covered Entities, such as tax compliance, tax planning and tax advice without impairing the auditor’s independence, and the SEC has stated that the Independent Auditors may provide such services.
Pursuant to the preceding paragraph, the Audit Committee has pre-approved the Tax Services in Appendix B.3. All Tax services in Appendix B.3 must be specifically pre-approved by the Audit Committee (or by any member of the Audit Committee to which pre-approval has been delegated).
6. All Other Services
The Audit Committee believes, based on the SEC’s rules prohibiting the Independent Auditors from providing specific non-audit services, that other types of non-audit services are permitted. Accordingly, the Audit Committee believes it may grant general pre-approval to those permissible non-audit services classified as All Other services that it believes are routine and recurring services, would not impair the independence of the auditor and are consistent with the SEC’s rules on auditor independence.
The Audit Committee has pre-approved the All Other services in Appendix B.4. Permissible All Other services not listed in Appendix B.4 must be specifically pre-approved by the Audit Committee (or by any member of the Audit Committee to which pre-approval has been delegated).
7. Pre-Approval Fee Levels or Budgeted Amounts
Pre-approval fee levels or budgeted amounts for all services to be provided by the Independent Auditors will be established annually by the Audit Committee. Any proposed services exceeding these levels or amounts will require specific pre-approval by the Audit Committee. The Audit Committee is mindful of the overall relationship of fees for audit and non-audit services in determining whether to pre-approve any such services.
8. Procedures
All requests or applications for services to be provided by the Independent Auditors that do not require specific approval by the Audit Committee will be submitted to the Fund’s Principal Financial and Accounting Officer and must include a detailed description of the services to be rendered. The Fund’s Principal Financial and Accounting Officer will determine whether such services are included within the list of services that have received the general pre-approval of the Audit Committee. The Audit Committee will be informed on a timely basis of any such services rendered by the Independent Auditors. Requests or applications to provide services that require specific approval by the Audit Committee or Chairman of the Audit Committee will be submitted to the Audit Committee by the Fund’s Principal Financial and
Accounting Officer, who, after consultation with the Independent Auditors, will discuss whether the request or application is consistent with the SEC’s rules on auditor independence.
The Audit Committee has designated the Fund’s Principal Financial and Accounting Officer to monitor the performance of all services provided by the Independent Auditors and to determine whether such services are in compliance with this Policy. The Fund’s Principal Financial and Accounting Officer will report to the Audit Committee on a periodic basis on the results of its monitoring. Both the Fund’s Principal Financial and Accounting Officer and management will immediately report to the chairman of the Audit Committee any breach of this Policy that comes to the attention of the Fund’s Principal Financial and Accounting Officer or any member of management.
9. Additional Requirements
The Audit Committee has determined to take additional measures on an annual basis to meet its responsibility to oversee the work of the Independent Auditors and to assure the auditor’s independence from the Fund, such as reviewing a formal written statement from the Independent Auditors delineating all relationships between the Independent Auditors and the Fund, consistent with the PCAOB’s Ethics and Independence Rule 3526, and discussing with the Independent Auditors its methods and procedures for ensuring independence.
10. Covered Entities
Covered Entities include the Fund’s investment adviser(s) and any entity controlling, controlled by or under common control with the Fund’s investment adviser(s) that provides ongoing services to the Fund(s). Beginning with non-audit service contracts entered into on or after May 6, 2003, the Fund’s audit committee must pre-approve non-audit services provided not only to the Fund but also to the Covered Entities if the engagements relate directly to the operations and financial reporting of the Fund. This list of Covered Entities would include:
Morgan Stanley Funds
Morgan Stanley & Co. LLC
Morgan Stanley Investment Management Inc.
Morgan Stanley Investment Management Limited
Morgan Stanley Investment Management Private Limited
Morgan Stanley Asset & Investment Trust Management Co., Limited
Morgan Stanley Investment Management Company
Morgan Stanley Services Company, Inc.
Morgan Stanley Distribution, Inc.
Morgan Stanley AIP GP LP
Morgan Stanley Alternative Investment Partners LP
Morgan Stanley Smith Barney LLC
Morgan Stanley Capital Management LLC
Morgan Stanley Asia Limited
(e)(2) Beginning with non-audit service contracts entered into on or after May 6, 2003, the audit committee also is required to pre-approve services to Covered Entities to the extent that the services are determined to have a direct impact on the operations or financial reporting of the
Registrant. 100% of such services were pre-approved by the audit committee pursuant to the Audit Committee’s pre-approval policies and procedures (attached hereto).
(f) Not applicable.
(g) See table above.
(h) The audit committee of the Board of Trustees has considered whether the provision of services other than audit services performed by the auditors to the Registrant and Covered Entities is compatible with maintaining the auditors’ independence in performing audit services.
Item 5. Audit Committee of Listed Registrants.
(a) The registrant has a separately-designated standing audit committee established in accordance with Section 3(a)(58)(A) of the Exchange Act whose members are:
Joseph J. Kearns, Jakki L. Haussler, Michael F. Klein and W. Allen Reed.
(b) Not applicable.
Item 6. Schedule of Investments
(a) Refer to Item 1.
(b) Not applicable.
Item 7. Disclosure of Proxy Voting Policies and Procedures for Closed-End Management Investment Companies.
Applicable only to reports filed by closed-end funds.
Item 8. Portfolio Managers of Closed-End Management Investment Companies
Applicable only to reports filed by closed-end funds.
Item 9. Closed-End Fund Repurchases
Applicable only to reports filed by closed-end funds.
Item 10. Submission of Matters to a Vote of Security Holders
Not applicable.
Item 11. Controls and Procedures
(a) The registrant’s principal executive officer and principal financial officer have concluded that the registrant’s disclosure controls and procedures are sufficient to ensure that information required to be disclosed by the registrant in this Form N-CSR was recorded, processed, summarized and reported within the time periods specified in the Securities and Exchange Commission’s rules and forms, based upon such officers’ evaluation of these controls and procedures as of a date within 90 days of the filing date of the report.
(b) There were no changes in the registrant’s internal control over financial reporting that occurred during the second fiscal quarter of the period covered by this report that has materially affected, or is reasonably likely to materially affect, the registrant’s internal control over financial reporting.
Item 12. Exhibits
(a) The Code of Ethics for Principal Executive and Senior Financial Officers is attached hereto.
(b) A separate certification for each principal executive officer and principal financial officer of the registrant are attached hereto as part of EX-99.CERT.
SIGNATURES
Pursuant to the requirements of the Securities Exchange Act of 1934 and the Investment Company Act of 1940, the registrant has duly caused this report to be signed on its behalf by the undersigned, thereunto duly authorized.
Morgan Stanley Institutional Fund, Inc.
/s/ John H. Gernon | |
John H. Gernon | |
Principal Executive Officer | |
February 19, 2019 | |
Pursuant to the requirements of the Securities Exchange Act of 1934 and the Investment Company Act of 1940, this report has been signed by the following persons on behalf of the registrant and in the capacities and on the dates indicated.
/s/ John H. Gernon | |
John H. Gernon | |
Principal Executive Officer | |
February 19, 2019 | |
| |
/s/ Francis Smith | |
Francis Smith | |
Principal Financial Officer | |
February 19, 2019 | |