UNITED STATES
SECURITIES AND EXCHANGE COMMISSION
Washington, D.C. 20549
FORM N-CSR
CERTIFIED SHAREHOLDER REPORT OF REGISTERED
MANAGEMENT INVESTMENT COMPANIES
Investment Company Act file number | 811-05624 |
|
Morgan Stanley Institutional Fund, Inc. |
(Exact name of registrant as specified in charter) |
|
522 Fifth Avenue, New York, New York | | 10036 |
(Address of principal executive offices) | | (Zip code) |
|
John H. Gernon 522 Fifth Avenue, New York, New York 10036 |
(Name and address of agent for service) |
|
Registrant’s telephone number, including area code: | 212-296-0289 | |
|
Date of fiscal year end: | December 31, | |
|
Date of reporting period: | December 31, 2017 | |
| | | | | | | | |
Item 1 - Report to Shareholders

Morgan Stanley Institutional Fund, Inc.
Active International Allocation Portfolio
Annual Report
December 31, 2017

Morgan Stanley Institutional Fund, Inc.
Annual Report — December 31, 2017
Shareholders' Letter | | | 2 | | |
Expense Example | | | 3 | | |
Investment Overview | | | 4 | | |
Portfolio of Investments | | | 7 | | |
Statement of Assets and Liabilities | | | 16 | | |
Statement of Operations | | | 18 | | |
Statements of Changes in Net Assets | | | 19 | | |
Financial Highlights | | | 20 | | |
Notes to Financial Statements | | | 24 | | |
Report of Independent Registered Public Accounting Firm | | | 35 | | |
Federal Tax Notice | | | 36 | | |
Privacy Notice | | | 37 | | |
Director and Officer Information | | | 40 | | |
This report is authorized for distribution only when preceded or accompanied by a prospectus or summary prospectus of the applicable Fund of Morgan Stanley Institutional Fund, Inc. To receive a prospectus and/or statement of additional information (SAI), which contains more complete information such as investment objectives, charges, expenses, policies for voting proxies, risk considerations, and describes in detail each of the Fund's investment policies to the prospective investor, please call toll free 1 (800) 548-7786. Please read the prospectuses carefully before you invest or send money.
Additionally, you can access information about the Fund, including performance, characteristics, and investment team commentary, through Morgan Stanley Investment Management's website: www.morganstanley.com/im.
Market forecasts provided in this report may not necessarily come to pass. There is no guarantee that any sectors mentioned will continue to perform as discussed herein or that securities in such sectors will be held by the Fund in the future. There is no assurance that a fund will achieve its investment objective. Funds are subject to market risk, which is the possibility that market values of securities owned by the Fund will decline and, therefore, the value of the Fund's shares may be less than what you paid for them. Accordingly, you can lose money investing in this Fund. Please see the prospectus for more complete information on investment risks.
1
Morgan Stanley Institutional Fund, Inc.
Annual Report — December 31, 2017
Shareholders' Letter (unaudited)
Dear Shareholders,
We are pleased to provide this Annual report, in which you will learn how your investment in Active International Allocation Portfolio (the "Fund") performed during the latest twelve-month period.
Morgan Stanley Investment Management is a client-centric, investor-led organization. Our global presence, intellectual capital, and breadth of products and services enable us to partner with investors to meet the evolving challenges of today's financial markets. We aim to deliver superior investment service and to empower our clients to make the informed decisions that help them reach their investment goals.
As always, we thank you for selecting Morgan Stanley Investment Management, and look forward to working with you in the months and years ahead.
Sincerely,

John H. Gernon
President and Principal Executive Officer
January 2018
2
Morgan Stanley Institutional Fund, Inc.
Annual Report — December 31, 2017
Expense Example (unaudited)
Active International Allocation Portfolio
As a shareholder of the Fund, you incur two types of costs: (1) transactional costs, including redemption fees; and (2) ongoing costs, which may include advisory fees, administration fees, distribution and shareholder services fees and other Fund expenses. This example is intended to help you understand your ongoing costs (in dollars) of investing in the Fund and to compare these costs with the ongoing costs of investing in other mutual funds.
This example is based on an investment of $1,000 invested at the beginning of the six-month period ended December 31, 2017 and held for the entire six-month period.
Actual Expenses
The table below provides information about actual account values and actual expenses. You may use the information in this table, together with the amount you invested, to estimate the expenses that you paid over the period. Simply divide your account value by $1,000 (for example, an $8,600 account value divided by $1,000 = 8.6), then multiply the result by the number in the table under the heading entitled "Actual Expenses Paid During Period" to estimate the expenses you paid on your account during this period.
Hypothetical Example for Comparison Purposes
The table below provides information about hypothetical account values and hypothetical expenses based on the Fund's actual expense ratio and an assumed rate of return of 5% per year before expenses, which is not the Fund's actual return. The hypothetical account values and expenses may not be used to estimate the actual ending account balance or expenses you paid for the period. You may use this information to compare the ongoing costs of investing in the Fund and other funds. To do so, compare this 5% hypothetical example with the 5% hypothetical examples that appear in the shareholder reports of the other funds.
Please note that the expenses shown in the table are meant to highlight your ongoing costs only and do not reflect any transactional costs, such as sales charges (loads) and redemption fees. Therefore, the information for each class in the table is useful in comparing ongoing costs only, and will not help you determine the relative total costs of owning different funds. In addition, if these transactional costs were included, your costs would have been higher.
| | | Beginning
Account
Value
7/1/17 | | Actual Ending
Account
Value
12/31/17 | | Hypothetical
Ending Account
Value | | Actual
Expenses
Paid
During
Period* | | Hypothetical
Expenses Paid
During Period* | | Net
Expense
Ratio
During
Period** | |
Active International Allocation Portfolio Class I | | $ | 1,000.00 | | | $ | 1,094.90 | | | $ | 1,020.77 | | | $ | 4.65 | | | $ | 4.48 | | | | 0.88 | % | |
Active International Allocation Portfolio Class A | | | 1,000.00 | | | | 1,092.20 | | | | 1,019.00 | | | | 6.49 | | | | 6.26 | | | | 1.23 | | |
Active International Allocation Portfolio Class L | | | 1,000.00 | | | | 1,090.30 | | | | 1,016.48 | | | | 9.11 | | | | 8.79 | | | | 1.73 | | |
Active International Allocation Portfolio Class C | | | 1,000.00 | | | | 1,088.10 | | | | 1,020.27 | | | | 5.16 | | | | 4.99 | | | | 1.98 | | |
* Expenses are calculated using each Fund Class' annualized net expense ratio (as disclosed), multiplied by the average account value over the period, and multiplied by 184/365 (to reflect the most recent one-half year period).
** Annualized.
3
Morgan Stanley Institutional Fund, Inc.
Annual Report — December 31, 2017
Investment Overview (unaudited)
Active International Allocation Portfolio
The Fund seeks long-term capital appreciation by investing primarily, in accordance with country and sector weightings determined by the Fund's "Adviser," Morgan Stanley Investment Management Inc., and/or the Sub-Adviser, Morgan Stanley Investment Management Company ("MSIM Company"), in equity securities of non-U.S. issuers which, in the aggregate, replicate broad market indices.
Performance
For the year ended December 31, 2017, the Fund's Class I shares had a total return based on net asset value and reinvestment of distributions per share of 24.76%, net of fees. The Fund's Class I shares underperformed the Fund's benchmark, the MSCI All Country World ex USA Index (the "Index"), which returned 27.19%, and the Active International Allocation Blend Index, which returned 27.19%. The Active International Allocation Blend Index reflects the performance of the MSCI EAFE Index from inception through December 31, 2016 and the MSCI All Country World ex USA Index for periods thereafter.
Please keep in mind that high double-digit returns are highly unusual and cannot be sustained. Investors should also be aware that these returns were primarily achieved during favorable market conditions.
Factors Affecting Performance
• The positive return in December 2017 for global equities brought to an end one of the best years for equity performance in the last decade. The MSCI All Country World ex USA Index rose +27% in 2017. Regional returns for the year were: emerging markets +37%, euro area +28%, Pacific ex Japan +26%, Japan +24%, the U.K. +22% and the U.S. +21% (as measured by the respective MSCI regional and country indexes). The Index's 2017 sector returns were: information technology +51%, materials +31%, industrials +29%, consumer discretionary +28%, financials and real estate +26%, consumer staples +24%, health care and utilities +18%, energy +16% and telecommunications +15%.
• For 2017, the Fund gained +24.76% versus the benchmark Index return of +27.19%. The overweight to industrials (the largest sector position) and below-benchmark allocations to utilities, Brazil and Canada were positive for performance. The above-benchmark position in euro Europe contributed for most of 2017 but was
a significant detractor in the fourth quarter. The overweight in consumer discretionary and underweights to materials, Korea and China were negative for portfolio performance.
• The Fund utilizes stock index futures as an additional vehicle to implement the portfolio manager's macro investment decisions. For 2017, macro investment decisions made with the use of stock index futures resulted in a realized gain for the Fund. The Fund used currency forward contracts to hedge some local currency exposure, which resulted in a loss for the Fund in the reporting period.
Management Strategies
• We started 2017 with the expectation that non-U.S. equities looked attractive versus U.S. equities, a trend we expect to continue even after a very solid year for international markets. Global growth is broadening out across both developed and emerging countries, while monetary policies and valuations in most non-U.S. markets remain more favorable than in the U.S.
• For the U.S., the recent passage of tax reform is likely to be an incremental positive for an economy that is already relatively strong. What's new is that the other large developed countries, and most emerging market countries, have gained economic strength and momentum in 2017 and now stand to benefit from this further boost from the U.S. (We expect U.S. twin deficits to widen as a result of this reform.) These countries are also earlier in their economic cycles, and their earnings growth is improving off a lower base while their valuations are more attractive.
• An additional important point to make is that, historically, widening twin deficits tend to lead to dollar weakness. While the U.S. dollar (USD) sold off in 2017, by our measures the USD is still expensive relative to the rest of the major currencies in the world on a purchasing power parity/real effective exchange rate basis, and therefore we expect it to continue weakening in 2018. This of course (as was the case last year) would be a tailwind for non-U.S. economic growth as well as USD-based equity returns in 2018.
• For 2018, our general thoughts on the global equity environment are that while global economic growth
4
Morgan Stanley Institutional Fund, Inc.
Annual Report — December 31, 2017
Investment Overview (unaudited) (cont'd)
Active International Allocation Portfolio
is robust and synchronized and the earnings backdrop is favorable, there are several signs that investor complacency levels are elevated. Certainly the benign inflation environment and very low levels of volatility enjoyed by global markets over the last two years have done nothing but exacerbate this trend. We are also entering the tenth year of global expansion, and the easy money era of the last decade is being ushered out as the post-global financial crisis slack fades and levels of unemployment are hitting a 40-year low in most large economies (save parts of Europe).
• The European economy continues to show signs of being in good health. PMIs (purchasing managers indexes) are continuing to hit cycle highs in several countries, while private sector lending continues to accelerate. We still expect to see the pace of growth moderate, especially as comparisons get harder in the next several months, but still see the economy as being well-supported by a recovering consumer and pent-up investment spending.
• As European economic growth looks well-supported, the outlook for earnings should also look better. Our indicators show that while European earnings-per-share (EPS) revisions have slid in the last six months relative to the rest of the world (explaining the moderation of recent equity performance), they are now hitting a relative level that has correlated well with a re-acceleration. While that is the case for earnings, we should also point out that our valuation indicators show that Europe is the only region to have gotten cheaper in the last six months, while all the other developed and emerging regions have seen sizeable multiple expansion. All of the above should bode well for future returns, and we remain overweight the region.
• The portfolio is overweight emerging markets for a number of reasons. Emerging markets usually do well in strong global growth environments, emerging markets currencies are generally inexpensive and could offer additional upside for USD-based investors, and valuations are relatively cheap and supported by broadening EPS growth. The portfolio is above-benchmark weight in India, Poland, Indonesia and the Philippines.
• Japanese equities were rewarded in the fourth quarter following Prime Minister Abe's re-election; however, the composition of returns may actually show that it is the global growth story that is driving Japanese markets more than anything domestic happening at the margin. The portfolio is underweight in Japan.
• Overall, we believe that we are in an environment where there will be increasing divergence between a country's macro conditions and monetary and fiscal policies. In short, 2017 was a great year for markets, but it also marks the progression into what we see as a later-cycle economic and equity market environment. We are by no means saying that complacency or expectations have gotten to a level where a serious drawdown is imminent. On the contrary, our work shows that in these types of environments, equity return opportunities tend to be robust but also often come with rising levels of volatility.
* Minimum Investment for Class I shares
In accordance with SEC regulations, the Fund's performance shown assumes that all recurring fees (including management fees) were deducted and all dividends and distributions were reinvested. The performance of Class A , L and C shares will vary from Class I shares based upon their different inception dates and will be negatively impacted by additional fees assessed to those classes.
5
Morgan Stanley Institutional Fund, Inc.
Annual Report — December 31, 2017
Investment Overview (unaudited) (cont'd)
Active International Allocation Portfolio
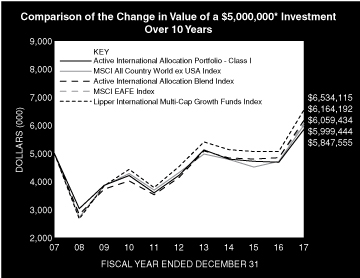
Performance Compared to the MSCI All Country World ex USA Index(1), the Active International Allocation Blend Index(2),the MSCI EAFE Index(3) and the Lipper International Multi-Cap Growth Funds Index(4)
| | Period Ended December 31, 2017
Total Returns(5) | |
| | | | Average Annual | |
| | One
Year | | Five
Years | | Ten
Years | | Since
Inception(10) | |
Fund — Class I Shares
w/o sales charges(6) | | | 24.76 | % | | | 6.74 | % | | | 1.58 | % | | | 6.06 | % | |
Fund — Class A Shares
w/o sales charges(7) | | | 24.29 | | | | 6.36 | | | | 1.28 | | | | 5.35 | | |
Fund — Class A Shares with
maximum 5.25% sales charges(7) | | | 17.77 | | | | 5.21 | | | | 0.73 | | | | 5.09 | | |
Fund — Class L Shares
w/o sales charges(8) | | | 23.80 | | | | 5.82 | | | | — | | | | 8.55 | | |
Fund — Class C Shares
w/o sales charges(9) | | | 23.42 | | | | — | | | | — | | | | 2.84 | | |
Fund — Class C Shares with
maximum 1.00% deferred
sales charges(9) | | | 22.42 | | | | — | | | | — | | | | 2.84 | | |
MSCI AC World ex USA Index | | | 27.19 | | | | 6.80 | | | | 1.84 | | | | 6.13 | | |
Active International Allocation
Blend Index | | | 27.19 | | | | 8.27 | | | | 2.12 | | | | 5.93 | | |
MSCI EAFE Index | | | 25.03 | | | | 7.90 | | | | 1.94 | | | | 5.86 | | |
Lipper International Multi-Cap
Growth Funds Index | | | 28.88 | | | | 7.59 | | | | 2.71 | | | | N/A | | |
Performance data quoted represents past performance, which is no guarantee of future results, and current performance may be lower or higher than the figures shown. Performance assumes that all dividends and distributions, if any, were reinvested. For the most recent month-end performance figures, please visit www.morganstanley.com/im. Investment return and principal value will fluctuate so that Fund shares, when redeemed, may be worth more or less than their original cost. Total returns do not reflect the deduction of taxes that a shareholder would pay on Fund distributions or the redemption of Fund shares. Performance of share classes will vary due to difference in sales charges and expenses.
(1) The MSCI All Country World ex USA Index is a free float-adjusted market capitalization weighted index designed to measure the equity market performance of developed and emerging markets, excluding the United States. The term "free float" represents the portion of shares outstanding that are deemed to be available for purchase in the public equity markets by investors. The performance of the Index is listed in U.S. dollars and assumes reinvestment of net dividends. The Index is unmanaged and its returns do not include any sales charges or fees. Such costs would lower performance. It is not possible to invest directly in an index.
(2) The Active International Allocation Blend Index is performance linked benchmark of the old and new benchmark of the Fund, the old benchmark represented by MSCI EAFE Index from the Fund's inception to 12/31/16 and the new benchmark represented by MSCI AC World Ex USA Index for periods thereafter. The Index is unmanaged and its returns do not include any sales charges or fees. Such costs would lower performance. It is not possible to invest directly in an index.
(3) The MSCI EAFE Index (Europe, Australasia, Far East) is a free float-adjusted market capitalization index that is designed to measure the international equity
market performance of developed markets, excluding the United States & Canada. The term "free float" represents the portion of shares outstanding that are deemed to be available for purchase in the public equity markets by investors. The MSCI EAFE Index currently consists of 21 developed market country indices. The performance of the Index is listed in U.S. dollars and assumes reinvestment of net dividends. The Index is unmanaged and its returns do not include any sales charges or fees. Such costs would lower performance. It is not possible to invest directly in an index. Effective January 1, 2017, the Fund's primary benchmark changed to MSCI AC World Index Ex USA Index.
(4) The Lipper International Multi-Cap Growth Funds Index is an equally weighted performance index of the largest qualifying funds (based on net assets) in the Lipper International Multi-Cap Growth Funds classification. The Index, which is adjusted for capital gains distributions and income dividends, is unmanaged and should not be considered an investment. There are currently 30 funds represented in this Index. As of the date of this report, the Fund was in the Lipper International Multi-Cap Growth Funds classification.
(5) Total returns for the Fund reflect fees waived and expenses reimbursed, if applicable, by the Adviser. Without such waivers and reimbursements, total returns would have been lower.
(6) Commenced operations on January 17, 1992.
(7) Commenced offering on January 2, 1996.
(8) Commenced offering on June 14, 2012.
(9) Commenced offering on April 30, 2015.
(10) For comparative purposes, average annual since inception returns listed for the Indexes refer to the inception date of Class I of the Fund, not the inception of the Index.
6
Morgan Stanley Institutional Fund, Inc.
Annual Report — December 31, 2017
Portfolio of Investments
Active International Allocation Portfolio
| | | Shares | | Value
(000) | |
Common Stocks (86.4%) | |
Australia (1.1%) | |
AGL Energy Ltd. | | | 2,064 | | | $ | 39 | | |
Amcor Ltd. | | | 5,429 | | | | 65 | | |
AMP Ltd. | | | 11,119 | | | | 45 | | |
Aristocrat Leisure Ltd. | | | 1,836 | | | | 34 | | |
ASX Ltd. | | | 611 | | | | 26 | | |
Aurizon Holdings Ltd. | | | 6,173 | | | | 24 | | |
AusNet Services | | | 5,457 | | | | 8 | | |
Australia & New Zealand Banking Group Ltd. | | | 2,760 | | | | 62 | | |
Bank of Queensland Ltd. | | | 302 | | | | 3 | | |
Bendigo & Adelaide Bank Ltd. | | | 313 | | | | 3 | | |
Brambles Ltd. | | | 5,836 | | | | 46 | | |
Caltex Australia Ltd. | | | 680 | | | | 18 | | |
Challenger Ltd. | | | 1,774 | | | | 19 | | |
CIMIC Group Ltd. | | | 633 | | | | 25 | | |
Coca-Cola Amatil Ltd. | | | 3,776 | | | | 25 | | |
Cochlear Ltd. | | | 238 | | | | 32 | | |
Commonwealth Bank of Australia | | | 1,186 | | | | 74 | | |
Computershare Ltd. | | | 1,508 | | | | 19 | | |
Crown Resorts Ltd. | | | 2,779 | | | | 28 | | |
CSL Ltd. | | | 2,515 | | | | 277 | | |
Dexus REIT | | | 2,842 | | | | 22 | | |
Domino's Pizza Enterprises Ltd. (a) | | | 268 | | | | 10 | | |
Flight Centre Travel Group Ltd. (a) | | | 249 | | | | 9 | | |
Goodman Group REIT | | | 6,948 | | | | 46 | | |
GPT Group (The) REIT | | | 5,224 | | | | 21 | | |
Harvey Norman Holdings Ltd. (a) | | | 3,438 | | | | 11 | | |
Healthscope Ltd. | | | 7,354 | | | | 12 | | |
Incitec Pivot Ltd. | | | 9,244 | | | | 28 | | |
Insurance Australia Group Ltd. | | | 9,895 | | | | 56 | | |
James Hardie Industries PLC CDI | | | 1,871 | | | | 33 | | |
Lend Lease Group REIT | | | 2,064 | | | | 26 | | |
Macquarie Group Ltd. | | | 1,407 | | | | 109 | | |
Medibank Pvt Ltd. | | | 10,101 | | | | 26 | | |
Mirvac Group REIT | | | 11,018 | | | | 20 | | |
National Australia Bank Ltd. | | | 2,169 | | | | 50 | | |
Oil Search Ltd. | | | 3,448 | | | | 21 | | |
Orica Ltd. | | | 1,585 | | | | 22 | | |
Origin Energy Ltd. (b) | | | 4,439 | | | | 33 | | |
Platinum Asset Management Ltd. (a) | | | 940 | | | | 6 | | |
Qantas Airways Ltd. | | | 1,569 | | | | 6 | | |
QBE Insurance Group Ltd. | | | 5,593 | | | | 46 | | |
Ramsay Health Care Ltd. | | | 472 | | | | 26 | | |
REA Group Ltd. | | | 161 | | | | 10 | | |
Santos Ltd. (b) | | | 4,036 | | | | 17 | | |
Scentre Group REIT | | | 26,053 | | | | 85 | | |
Seek Ltd. | | | 982 | | | | 14 | | |
Sonic Healthcare Ltd. | | | 2,452 | | | | 44 | | |
South32 Ltd. (a) | | | 23,231 | | | | 63 | | |
Stockland REIT | | | 23,101 | | | | 81 | | |
Suncorp Group Ltd. | | | 5,506 | | | | 59 | | |
Sydney Airport | | | 3,288 | | | | 18 | | |
| | | Shares | | Value
(000) | |
Tabcorp Holdings Ltd. | | | 5,866 | | | $ | 25 | | |
Telstra Corp., Ltd. | | | 14,793 | | | | 42 | | |
TPG Telecom Ltd. (a) | | | 995 | | | | 5 | | |
Transurban Group | | | 4,810 | | | | 47 | | |
Treasury Wine Estates Ltd. | | | 2,250 | | | | 28 | | |
Vicinity Centres REIT | | | 9,858 | | | | 21 | | |
Wesfarmers Ltd. | | | 3,886 | | | | 135 | | |
Westfield Corp. REIT | | | 9,176 | | | | 68 | | |
Westpac Banking Corp. | | | 2,099 | | | | 51 | | |
Woodside Petroleum Ltd. | | | 1,942 | | | | 50 | | |
Woolworths Group Ltd. | | | 4,950 | | | | 105 | | |
| | | | 2,479 | | |
Austria (0.3%) | |
Andritz AG | | | 1,291 | | | | 73 | | |
Erste Group Bank AG (b) | | | 11,504 | | | | 496 | | |
Raiffeisen Bank International AG (b) | | | 1,805 | | | | 65 | | |
| | | | 634 | | |
Belgium (1.2%) | |
Ageas | | | 1,051 | | | | 51 | | |
Anheuser-Busch InBev N.V. | | | 14,587 | | | | 1,627 | | |
Groupe Bruxelles Lambert SA | | | 2,680 | | | | 289 | | |
KBC Group N.V. | | | 3,359 | | | | 286 | | |
Telenet Group Holding N.V. (b) | | | 1,131 | | | | 79 | | |
UCB SA | | | 2,808 | | | | 223 | | |
Umicore SA | | | 2,266 | | | | 107 | | |
| | | | 2,662 | | |
Brazil (0.7%) | |
Banco Bradesco SA (Preference) | | | 35,400 | | | | 363 | | |
Banco Santander Brasil SA (Units) (c) | | | 22,600 | | | | 220 | | |
| BRF SA | | | 11,400 | | | | 128 | | |
Cia Energetica de Minas Gerais (Preference) | | | 1 | | | | — | @ | |
Itau Unibanco Holding SA (Preference) | | | 28,259 | | | | 366 | | |
Lojas Renner SA | | | 17,800 | | | | 190 | | |
Petroleo Brasileiro SA (b) | | | 32,500 | | | | 167 | | |
Raia Drogasil SA | | | 7,400 | | | | 204 | | |
| | | | 1,638 | | |
Chile (0.3%) | |
Banco de Chile | | | 1,018,097 | | | | 163 | | |
Banco de Credito e Inversiones | | | 2,335 | | | | 161 | | |
Banco Santander Chile | | | 1,971,734 | | | | 154 | | |
Itau CorpBanca | | | 15,688,824 | | | | 143 | | |
| | | | 621 | | |
China (4.9%) | |
58.com, Inc. ADR (a)(b) | | | 400 | | | | 29 | | |
AAC Technologies Holdings, Inc. (d) | | | 3,500 | | | | 62 | | |
Alibaba Group Holding Ltd. ADR (a)(b) | | | 20,900 | | | | 3,604 | | |
Baidu, Inc. ADR (b) | | | 5,000 | | | | 1,171 | | |
Brilliance China Automotive Holdings Ltd. (d) | | | 16,000 | | | | 43 | | |
China Literature Ltd. (b)(d)(e) | | | 53 | | | | 1 | | |
China Mengniu Dairy Co., Ltd. (b)(d) | | | 24,000 | | | | 71 | | |
CSPC Pharmaceutical Group Ltd. (d) | | | 46,000 | | | | 93 | | |
The accompanying notes are an integral part of the financial statements.
7
Morgan Stanley Institutional Fund, Inc.
Annual Report — December 31, 2017
Portfolio of Investments (cont'd)
Active International Allocation Portfolio
| | | Shares | | Value
(000) | |
China (cont'd) | |
Ctrip.com International Ltd. ADR (b) | | | 2,200 | | | $ | 97 | | |
Geely Automobile Holdings Ltd. (d) | | | 27,000 | | | | 93 | | |
Hengan International Group Co., Ltd. (d) | | | 6,500 | | | | 72 | | |
JD.com, Inc. ADR (b) | | | 10,200 | | | | 422 | | |
Lenovo Group Ltd. (a)(d) | | | 82,000 | | | | 46 | | |
NetEase, Inc. ADR | | | 400 | | | | 138 | | |
New Oriental Education & Technology
Group, Inc. ADR | | | 800 | | | | 75 | | |
Shenzhou International Group Holdings Ltd. (d) | | | 4,000 | | | | 38 | | |
SINA Corp. (b) | | | 400 | | | | 40 | | |
Sinopharm Group Co., Ltd. H Shares (d) | | | 12,800 | | | | 55 | | |
Sunny Optical Technology Group Co., Ltd. (d) | | | 3,000 | | | | 38 | | |
TAL Education Group ADR | | | 1,600 | | | | 48 | | |
Tencent Holdings Ltd. (d) | | | 92,900 | | | | 4,802 | | |
Yum China Holdings, Inc. | | | 2,200 | | | | 88 | | |
YY, Inc. ADR (b) | | | 300 | | | | 34 | | |
| | | | 11,160 | | |
Czech Republic (1.3%) | |
CEZ AS | | | 52,540 | | | | 1,225 | | |
Komercni Banka AS | | | 24,747 | | | | 1,062 | | |
Moneta Money Bank AS (e) | | | 131,874 | | | | 510 | | |
O2 Czech Republic AS | | | 20,158 | | | | 262 | | |
| | | | 3,059 | | |
Denmark (2.3%) | |
AP Moller - Maersk A/S Series A | | | 97 | | | | 162 | | |
AP Moller - Maersk A/S Series B | | | 431 | | | | 751 | | |
Danske Bank A/S | | | 11,418 | | | | 444 | | |
DSV A/S | | | 12,372 | | | | 974 | | |
ISS A/S | | | 8,889 | | | | 343 | | |
Novo Nordisk A/S Series B | | | 44,123 | | | | 2,371 | | |
Novozymes A/S Series B | | | 3,185 | | | | 182 | | |
Vestas Wind Systems A/S | | | 1,348 | | | | 92 | | |
| | | | 5,319 | | |
Egypt (0.7%) | |
Commercial International Bank Egypt SAE | | | 306,818 | | | | 1,341 | | |
Global Telecom Holding SAE (b) | | | 774,919 | | | | 322 | | |
| | | | 1,663 | | |
Finland (1.1%) | |
Kone Oyj, Class B | | | 5,582 | | | | 300 | | |
Metso Oyj | | | 2,675 | | | | 91 | | |
Neste Oyj | | | 3,145 | | | | 201 | | |
Nokia Oyj | | | 110,241 | | | | 515 | | |
Orion Oyj, Class B | | | 2,195 | | | | 82 | | |
Sampo Oyj, Class A | | | 7,025 | | | | 386 | | |
Stora Enso Oyj, Class R | | | 17,162 | | | | 272 | | |
UPM-Kymmene Oyj | | | 14,785 | | | | 459 | | |
Wartsila Oyj Abp | | | 4,482 | | | | 282 | | |
| | | | 2,588 | | |
France (9.9%) | |
Accor SA | | | 4,602 | | | | 237 | | |
Aeroports de Paris (ADP) | | | 999 | | | | 190 | | |
| | | Shares | | Value
(000) | |
Air Liquide SA | | | 4,946 | | | $ | 622 | | |
Airbus SE | | | 6,995 | | | | 695 | | |
Atos SE | | | 1,887 | | | | 275 | | |
AXA SA | | | 28,494 | | | | 844 | | |
BNP Paribas SA | | | 16,155 | | | | 1,205 | | |
Bureau Veritas SA | | | 10,098 | | | | 276 | | |
Capgemini SE | | | 4,960 | | | | 587 | | |
Carrefour SA | | | 7,927 | | | | 172 | | |
Casino Guichard Perrachon SA | | | 932 | | | | 56 | | |
Cie de Saint-Gobain | | | 9,069 | | | | 499 | | |
Cie Generale des Etablissements Michelin | | | 3,015 | | | | 432 | | |
CNP Assurances | | | 1,932 | | | | 45 | | |
Credit Agricole SA | | | 28,225 | | | | 466 | | |
Danone SA | | | 14,141 | | | | 1,186 | | |
Dassault Systemes SE | | | 3,533 | | | | 375 | | |
Edenred | | | 8,954 | | | | 259 | | |
Eiffage SA | | | 298 | | | | 33 | | |
Electricite de France SA | | | 7,256 | | | | 90 | | |
Engie SA | | | 40,095 | | | | 689 | | |
Essilor International Cie Generale d'Optique SA | | | 2,232 | | | | 308 | | |
Eurazeo SA | | | 341 | | | | 31 | | |
Eutelsat Communications SA | | | 1,721 | | | | 40 | | |
Fonciere Des Regions REIT | | | 804 | | | | 91 | | |
Gecina SA REIT | | | 2,229 | | | | 411 | | |
Getlink SE | | | 5,557 | | | | 71 | | |
Hermes International | | | 230 | | | | 123 | | |
ICADE REIT | | | 802 | | | | 79 | | |
Imerys SA | | | 654 | | | | 62 | | |
Kering | | | 687 | | | | 324 | | |
Klepierre SA REIT | | | 3,077 | | | | 135 | | |
L'Oreal SA | | | 2,311 | | | | 512 | | |
Legrand SA | | | 3,229 | | | | 248 | | |
LVMH Moet Hennessy Louis Vuitton SE | | | 2,234 | | | | 656 | | |
Natixis SA | | | 6,801 | | | | 54 | | |
Pernod Ricard SA | | | 2,373 | | | | 376 | | |
Peugeot SA | | | 5,886 | | | | 120 | | |
Publicis Groupe SA | | | 2,045 | | | | 139 | | |
Remy Cointreau SA | | | 269 | | | | 37 | | |
Renault SA | | | 2,472 | | | | 248 | | |
Safran SA | | | 9,103 | | | | 936 | | |
Sanofi | | | 20,368 | | | | 1,754 | | |
SES SA | | | 4,287 | | | | 67 | | |
Societe BIC SA | | | 2,385 | | | | 262 | | |
Societe Generale SA | | | 16,124 | | | | 831 | | |
Sodexo SA | | | 855 | | | | 115 | | |
STMicroelectronics N.V. | | | 7,689 | | | | 167 | | |
Suez | | | 8,388 | | | | 147 | | |
Thales SA | | | 4,515 | | | | 486 | | |
TOTAL SA | | | 34,884 | | | | 1,925 | | |
Unibail-Rodamco SE REIT | | | 2,442 | | | | 615 | | |
Valeo SA | | | 7,504 | | | | 559 | | |
Vinci SA | | | 11,211 | | | | 1,144 | | |
Vivendi SA | | | 4,595 | | | | 124 | | |
| | | | 22,430 | | |
The accompanying notes are an integral part of the financial statements.
8
Morgan Stanley Institutional Fund, Inc.
Annual Report — December 31, 2017
Portfolio of Investments (cont'd)
Active International Allocation Portfolio
| | | Shares | | Value
(000) | |
Germany (10.1%) | |
Adidas AG | | | 3,347 | | | $ | 668 | | |
Allianz SE (Registered) | | | 8,904 | | | | 2,039 | | |
Axel Springer SE | | | 377 | | | | 29 | | |
BASF SE | | | 14,918 | | | | 1,637 | | |
Bayer AG (Registered) | | | 20,450 | | | | 2,544 | | |
Bayerische Motoren Werke AG | | | 4,266 | | | | 443 | | |
Bayerische Motoren Werke AG (Preference) | | | 579 | | | | 52 | | |
Beiersdorf AG | | | 1,535 | | | | 180 | | |
Brenntag AG | | | 1,510 | | | | 95 | | |
CECONOMY AG | | | 5,638 | | | | 85 | | |
Commerzbank AG (b) | | | 34,097 | | | | 512 | | |
Continental AG | | | 2,374 | | | | 641 | | |
Covestro AG (e) | | | 996 | | | | 102 | | |
Daimler AG (Registered) | | | 12,470 | | | | 1,059 | | |
Deutsche Bank AG (Registered) | | | 21,127 | | | | 401 | | |
Deutsche Boerse AG | | | 4,013 | | | | 465 | | |
Deutsche Post AG (Registered) | | | 14,407 | | | | 684 | | |
Deutsche Wohnen SE | | | 6,540 | | | | 285 | | |
E.ON SE | | | 36,069 | | | | 391 | | |
Fraport AG Frankfurt Airport Services Worldwide | | | 453 | | | | 50 | | |
Fresenius Medical Care AG & Co., KGaA | | | 6,022 | | | | 634 | | |
GEA Group AG | | | 6,574 | | | | 315 | | |
Hannover Rueck SE (Registered) | | | 799 | | | | 100 | | |
HeidelbergCement AG | | | 3,654 | | | | 396 | | |
Henkel AG & Co., KGaA | | | 593 | | | | 71 | | |
Henkel AG & Co., KGaA (Preference) | | | 3,408 | | | | 450 | | |
Hochtief AG | | | 204 | | | | 36 | | |
Infineon Technologies AG | | | 16,921 | | | | 462 | | |
Kabel Deutschland Holding AG | | | 577 | | | | 75 | | |
LANXESS AG | | | 422 | | | | 34 | | |
Linde AG | | | 1,525 | | | | 332 | | |
Merck KGaA | | | 3,052 | | | | 329 | | |
METRO AG | | | 5,638 | | | | 113 | | |
Muenchener Rueckversicherungs-
Gesellschaft AG in Muenchen (Registered) | | | 2,162 | | | | 469 | | |
Porsche Automobil Holding SE (Preference) | | | 1,949 | | | | 163 | | |
ProSiebenSat.1 Media SE (Registered) | | | 4,208 | | | | 145 | | |
QIAGEN N.V. (b) | | | 6,763 | | | | 211 | | |
RTL Group SA (b) | | | 1,147 | | | | 92 | | |
RWE AG (b) | | | 12,263 | | | | 250 | | |
SAP SE | | | 25,580 | | | | 2,868 | | |
Siemens AG (Registered) | | | 10,929 | | | | 1,516 | | |
ThyssenKrupp AG | | | 5,838 | | | | 170 | | |
Uniper SE | | | 3,610 | | | | 113 | | |
United Internet AG (Registered) | | | 10,658 | | | | 733 | | |
Vonovia SE | | | 8,829 | | | | 437 | | |
Zalando SE (b)(e) | | | 420 | | | | 22 | | |
| | | | 22,898 | | |
Hong Kong (2.1%) | |
AIA Group Ltd. | | | 122,800 | | | | 1,047 | | |
Bank of East Asia Ltd. (The) | | | 14,495 | | | | 63 | | |
| | | Shares | | Value
(000) | |
BOC Hong Kong Holdings Ltd. | | | 40,500 | | | $ | 205 | | |
CK Asset Holdings Ltd. | | | 29,000 | | | | 254 | | |
CK Infrastructure Holdings Ltd. | | | 7,000 | | | | 60 | | |
CLP Holdings Ltd. | | | 19,000 | | | | 194 | | |
First Pacific Co., Ltd. | | | 8,000 | | | | 5 | | |
Galaxy Entertainment Group Ltd. | | | 25,000 | | | | 200 | | |
Hang Lung Group Ltd. | | | 3,000 | | | | 11 | | |
Hang Lung Properties Ltd. | | | 26,000 | | | | 63 | | |
Hang Seng Bank Ltd. | | | 8,200 | | | | 203 | | |
Henderson Land Development Co., Ltd. | | | 15,400 | | | | 102 | | |
HK Electric Investments & HK Electric
Investments Ltd. (a)(e) | | | 29,500 | | | | 27 | | |
Hong Kong & China Gas Co., Ltd. | | | 89,430 | | | | 175 | | |
Hong Kong Exchanges & Clearing Ltd. | | | 12,986 | | | | 397 | | |
Hongkong Land Holdings Ltd. | | | 8,400 | | | | 59 | | |
Hysan Development Co., Ltd. | | | 7,000 | | | | 37 | | |
I-CABLE Communications Ltd. (b) | | | 19,285 | | | | 1 | | |
Jardine Matheson Holdings Ltd. | | | 700 | | | | 43 | | |
Kerry Properties Ltd. | | | 2,000 | | | | 9 | | |
Li & Fung Ltd. | | | 66,000 | | | | 36 | | |
Link REIT | | | 23,500 | | | | 218 | | |
MGM China Holdings Ltd. (a) | | | 3,200 | | | | 10 | | |
MTR Corp., Ltd. | | | 16,719 | | | | 98 | | |
New World Development Co., Ltd. | | | 65,163 | | | | 98 | | |
NWS Holdings Ltd. | | | 14,000 | | | | 25 | | |
PCCW Ltd. | | | 50,764 | | | | 30 | | |
Power Assets Holdings Ltd. | | | 14,500 | | | | 122 | | |
Sands China Ltd. | | | 26,000 | | | | 134 | | |
Sino Land Co., Ltd. | | | 36,765 | | | | 65 | | |
SJM Holdings Ltd. | | | 6,000 | | | | 5 | | |
Sun Hung Kai Properties Ltd. | | | 17,000 | | | | 283 | | |
Swire Pacific Ltd., Class A | | | 6,500 | | | | 60 | | |
Swire Properties Ltd. | | | 13,400 | | | | 43 | | |
Techtronic Industries Co., Ltd. | | | 15,000 | | | | 98 | | |
WH Group Ltd. (e) | | | 46,000 | | | | 52 | | |
Wharf Holdings Ltd. (The) | | | 16,000 | | | | 55 | | |
Wharf Real Estate Investment Co., Ltd. (b) | | | 16,000 | | | | 107 | | |
Wheelock & Co., Ltd. | | | 10,000 | | | | 71 | | |
Yue Yuen Industrial Holdings Ltd. | | | 8,500 | | | | 33 | | |
| | | | 4,798 | | |
Hungary (0.1%) | |
OTP Bank PLC | | | 7,656 | | | | 316 | | |
India (1.1%) | |
Ashok Leyland Ltd. | | | 96,514 | | | | 180 | | |
Bharat Financial Inclusion Ltd. (b) | | | 10,370 | | | | 163 | | |
Bharat Petroleum Corp., Ltd. | | | 16,923 | | | | 137 | | |
HDFC Bank Ltd. ADR | | | 1,500 | | | | 152 | | |
Housing Development Finance Corp., Ltd. | | | 22,691 | | | | 607 | | |
ICICI Bank Ltd. | | | 91,353 | | | | 448 | | |
IndusInd Bank Ltd. (Foreign) | | | 5,859 | | | | 151 | | |
Marico Ltd. | | | 26,354 | | | | 133 | | |
Maruti Suzuki India Ltd. | | | 1,229 | | | | 187 | | |
The accompanying notes are an integral part of the financial statements.
9
Morgan Stanley Institutional Fund, Inc.
Annual Report — December 31, 2017
Portfolio of Investments (cont'd)
Active International Allocation Portfolio
| | | Shares | | Value
(000) | |
India (cont'd) | |
Shree Cement Ltd. | | | 419 | | | $ | 119 | | |
Yes Bank Ltd. | | | 32,585 | | | | 161 | | |
Zee Entertainment Enterprises Ltd. | | | 15,713 | | | | 143 | | |
| | | | 2,581 | | |
Indonesia (2.7%) | |
Adaro Energy Tbk PT | | | 764,700 | | | | 104 | | |
Astra International Tbk PT | | | 1,008,100 | | | | 616 | | |
Bank Central Asia Tbk PT | | | 620,500 | | | | 1,000 | | |
Bank Mandiri Persero Tbk PT | | | 947,000 | | | | 558 | | |
Bank Negara Indonesia Persero Tbk PT | | | 416,800 | | | | 304 | | |
Bank Rakyat Indonesia Persero Tbk PT | | | 2,792,000 | | | | 747 | | |
Charoen Pokphand Indonesia Tbk PT | | | 406,700 | | | | 90 | | |
Gudang Garam Tbk PT | | | 26,500 | | | | 164 | | |
Hanjaya Mandala Sampoerna Tbk PT | | | 491,700 | | | | 171 | | |
Indocement Tunggal Prakarsa Tbk PT | | | 89,000 | | | | 144 | | |
Indofood Sukses Makmur Tbk PT | | | 247,000 | | | | 139 | | |
Kalbe Farma Tbk PT | | | 1,161,400 | | | | 145 | | |
Lippo Karawaci Tbk PT | | | 1,281,000 | | | | 46 | | |
Matahari Department Store Tbk PT | | | 138,300 | | | | 102 | | |
Perusahaan Gas Negara Persero Tbk | | | 585,800 | | | | 75 | | |
Semen Indonesia Persero Tbk PT | | | 168,500 | | | | 123 | | |
Summarecon Agung Tbk PT | | | 642,700 | | | | 45 | | |
Surya Citra Media Tbk PT | | | 367,000 | | | | 67 | | |
Telekomunikasi Indonesia Persero Tbk PT | | | 2,542,800 | | | | 828 | | |
Unilever Indonesia Tbk PT | | | 80,300 | | | | 331 | | |
United Tractors Tbk PT | | | 90,400 | | | | 236 | | |
| | | | 6,035 | | |
Ireland (0.8%) | |
Bank of Ireland Group PLC (b) | | | 14,045 | | | | 120 | | |
CRH PLC | | | 27,786 | | | | 1,000 | | |
Kerry Group PLC, Class A | | | 2,429 | | | | 272 | | |
Ryanair Holdings PLC ADR (b) | | | 4,877 | | | | 508 | | |
| | | | 1,900 | | |
Japan (15.0%) | |
AEON Financial Service Co., Ltd. | | | 1,300 | | | | 30 | | |
Aeon Mall Co., Ltd. | | | 600 | | | | 12 | | |
Aisin Seiki Co., Ltd. | | | 100 | | | | 6 | | |
Amada Holdings Co., Ltd. | | | 3,600 | | | | 49 | | |
ANA Holdings, Inc. | | | 5,000 | | | | 209 | | |
Aozora Bank Ltd. | | | 100 | | | | 4 | | |
Asahi Glass Co., Ltd. | | | 1,660 | | | | 72 | | |
Asahi Group Holdings Ltd. | | | 5,100 | | | | 253 | | |
Asahi Kasei Corp. | | | 12,000 | | | | 155 | | |
Asics Corp. | | | 2,100 | | | | 33 | | |
Astellas Pharma, Inc. | | | 21,700 | | | | 276 | | |
Bandai Namco Holdings, Inc. | | | 4,100 | | | | 134 | | |
Bank of Kyoto Ltd. (The) | | | 1,000 | | | | 52 | | |
Benesse Holdings, Inc. | | | 454 | | | | 16 | | |
Bridgestone Corp. | | | 8,200 | | | | 381 | | |
Brother Industries Ltd. | | | 4,800 | | | | 118 | | |
Canon, Inc. | | | 11,104 | | | | 413 | | |
| | | Shares | | Value
(000) | |
Central Japan Railway Co. | | | 2,192 | | | $ | 392 | | |
Chiba Bank Ltd. (The) | | | 8,000 | | | | 67 | | |
Chugai Pharmaceutical Co., Ltd. | | | 2,000 | | | | 102 | | |
Concordia Financial Group Ltd. | | | 33,400 | | | | 202 | | |
Credit Saison Co., Ltd. | | | 4,100 | | | | 75 | | |
Dai Nippon Printing Co., Ltd. | | | 1,550 | | | | 35 | | |
Dai-ichi Life Holdings, Inc. | | | 14,900 | | | | 307 | | |
Daicel Corp. | | | 300 | | | | 3 | | |
Daiichi Sankyo Co., Ltd. | | | 7,500 | | | | 195 | | |
Daikin Industries Ltd. | | | 4,200 | | | | 497 | | |
Daito Trust Construction Co., Ltd. | | | 956 | | | | 195 | | |
Daiwa House Industry Co., Ltd. | | | 7,000 | | | | 269 | | |
Denso Corp. | | | 7,650 | | | | 459 | | |
East Japan Railway Co. | | | 5,300 | | | | 517 | | |
Eisai Co., Ltd. | | | 3,000 | | | | 170 | | |
FANUC Corp. | | | 3,650 | | | | 877 | | |
Fuji Electric Co., Ltd. | | | 5,000 | | | | 38 | | |
FUJIFILM Holdings Corp. | | | 9,800 | | | | 400 | | |
Fujitsu Ltd. | | | 31,200 | | | | 221 | | |
Fukuoka Financial Group, Inc. | | | 10,000 | | | | 56 | | |
Hachijuni Bank Ltd. (The) | | | 3,900 | | | | 22 | | |
Hamamatsu Photonics KK | | | 3,300 | | | | 111 | | |
Hankyu Hanshin Holdings, Inc. | | | 1,300 | | | | 52 | | |
Hino Motors Ltd. | | | 3,600 | | | | 47 | | |
Hirose Electric Co., Ltd. | | | 300 | | | | 44 | | |
Hisamitsu Pharmaceutical Co., Inc. | | | 300 | | | | 18 | | |
Hitachi Construction Machinery Co., Ltd. | | | 3,300 | | | | 120 | | |
Hitachi Ltd. | | | 56,000 | | | | 436 | | |
Hitachi Metals Ltd. | | | 200 | | | | 3 | | |
Honda Motor Co., Ltd. | | | 15,113 | | | | 518 | | |
Hoshino Resorts, Inc. REIT | | | 4 | | | | 19 | | |
Hoshizaki Corp. | | | 200 | | | | 18 | | |
Hoya Corp. | | | 7,800 | | | | 390 | | |
Hulic Co., Ltd. | | | 300 | | | | 3 | | |
IHI Corp. | | | 2,253 | | | | 75 | | |
Isuzu Motors Ltd. | | | 8,100 | | | | 135 | | |
Ito En Ltd. | | | 2,100 | | | | 83 | | |
ITOCHU Corp. | | | 21,951 | | | | 410 | | |
Japan Airlines Co., Ltd. | | | 1,400 | | | | 55 | | |
Japan Hotel REIT Investment Corp. | | | 34 | | | | 23 | | |
Japan Post Bank Co., Ltd. | | | 3,400 | | | | 44 | | |
Japan Prime Realty Investment Corp. REIT | | | 7 | | | | 22 | | |
Japan Real Estate Investment Corp. REIT | | | 11 | | | | 52 | | |
Japan Retail Fund Investment Corp. REIT | | | 20 | | | | 37 | | |
Japan Tobacco, Inc. | | | 14,500 | | | | 467 | | |
JFE Holdings, Inc. | | | 6,500 | | | | 156 | | |
JGC Corp. | | | 3,446 | | | | 67 | | |
JSR Corp. | | | 908 | | | | 18 | | |
JTEKT Corp. | | | 500 | | | | 9 | | |
Kajima Corp. | | | 11,000 | | | | 106 | | |
Kansai Paint Co., Ltd. | | | 3,200 | | | | 83 | | |
Kao Corp. | | | 8,400 | | | | 568 | | |
Kawasaki Heavy Industries Ltd. | | | 2,350 | | | | 82 | | |
The accompanying notes are an integral part of the financial statements.
10
Morgan Stanley Institutional Fund, Inc.
Annual Report — December 31, 2017
Portfolio of Investments (cont'd)
Active International Allocation Portfolio
| | | Shares | | Value
(000) | |
Japan (cont'd) | |
Keikyu Corp. | | | 1,500 | | | $ | 29 | | |
Keio Corp. | | | 600 | | | | 26 | | |
Keyence Corp. | | | 1,800 | | | | 1,005 | | |
Kinden Corp. | | | 1,200 | | | | 20 | | |
Kintetsu Group Holdings Co., Ltd. | | | 100 | | | | 4 | | |
Kirin Holdings Co., Ltd. | | | 11,300 | | | | 284 | | |
Koito Manufacturing Co., Ltd. | | | 100 | | | | 7 | | |
Komatsu Ltd. | | | 15,100 | | | | 547 | | |
Konica Minolta, Inc. | | | 8,430 | | | | 81 | | |
Kose Corp. | | | 1,100 | | | | 172 | | |
Kubota Corp. | | | 600 | | | | 12 | | |
Kuraray Co., Ltd. | | | 6,956 | | | | 131 | | |
Kurita Water Industries Ltd. | | | 2,200 | | | | 71 | | |
Kyocera Corp. | | | 5,700 | | | | 372 | | |
Kyowa Exeo Corp. | | | 800 | | | | 21 | | |
Kyowa Hakko Kirin Co., Ltd. | | | 3,000 | | | | 58 | | |
LIXIL Group Corp. | | | 4,062 | | | | 110 | | |
M3, Inc. | | | 100 | | | | 3 | | |
Mabuchi Motor Co., Ltd. | | | 1,000 | | | | 54 | | |
Makita Corp. | | | 2,800 | | | | 117 | | |
Marubeni Corp. | | | 26,250 | | | | 191 | | |
Maruichi Steel Tube Ltd. | | | 100 | | | | 3 | | |
Mazda Motor Corp. | | | 7,100 | | | | 95 | | |
Mebuki Financial Group, Inc. | | | 23,400 | | | | 99 | | |
Minebea Mitsumi, Inc. | | | 3,000 | | | | 63 | | |
Mitsubishi Chemical Holdings Corp. | | | 15,200 | | | | 167 | | |
Mitsubishi Corp. | | | 24,300 | | | | 672 | | |
Mitsubishi Electric Corp. | | | 38,552 | | | | 641 | | |
Mitsubishi Estate Co., Ltd. | | | 17,100 | | | | 297 | | |
Mitsubishi Materials Corp. | | | 1,700 | | | | 60 | | |
Mitsubishi Motors Corp. | | | 8,500 | | | | 61 | | |
Mitsubishi Tanabe Pharma Corp. | | | 1,100 | | | | 23 | | |
Mitsubishi UFJ Financial Group, Inc.
(See Note G) | | | 92,506 | | | | 679 | | |
Mitsui & Co., Ltd. | | | 18,300 | | | | 297 | | |
Mitsui Fudosan Co., Ltd. | | | 13,300 | | | | 298 | | |
Mizuho Financial Group, Inc. | | | 295,100 | | | | 536 | | |
MS&AD Insurance Group Holdings, Inc. | | | 3,160 | | | | 107 | | |
Murata Manufacturing Co., Ltd. | | | 2,900 | | | | 388 | | |
Nabtesco Corp. | | | 1,200 | | | | 46 | | |
Nagoya Railroad Co., Ltd. | | | 200 | | | | 5 | | |
NEC Corp. | | | 1,790 | | | | 48 | | |
Nexon Co., Ltd. (b) | | | 3,500 | | | | 102 | | |
NGK Insulators Ltd. | | | 2,860 | | | | 54 | | |
NGK Spark Plug Co., Ltd. | | | 3,259 | | | | 79 | | |
Nidec Corp. | | | 4,800 | | | | 674 | | |
Nikon Corp. | | | 5,800 | | | | 117 | | |
Nintendo Co., Ltd. | | | 1,208 | | | | 440 | | |
Nippon Building Fund, Inc. REIT | | | 12 | | | | 59 | | |
Nippon Express Co., Ltd. | | | 530 | | | | 35 | | |
Nippon Paint Holdings Co., Ltd. (a) | | | 2,000 | | | | 63 | | |
Nippon Prologis, Inc. REIT | | | 12 | | | | 25 | | |
| | | Shares | | Value
(000) | |
Nippon Steel & Sumitomo Metal Corp. | | | 6,900 | | | $ | 177 | | |
Nippon Television Holdings, Inc. | | | 3,900 | | | | 67 | | |
Nippon Yusen KK (b) | | | 200 | | | | 5 | | |
Nissan Motor Co., Ltd. | | | 27,805 | | | | 277 | | |
Nitto Denko Corp. | | | 1,900 | | | | 169 | | |
Nomura Research Institute Ltd. | | | 100 | | | | 5 | | |
NSK Ltd. | | | 4,400 | | | | 69 | | |
NTT Data Corp. | | | 6,500 | | | | 77 | | |
Obayashi Corp. | | | 4,971 | | | | 60 | | |
Obic Co., Ltd. | | | 1,300 | | | | 96 | | |
Odakyu Electric Railway Co., Ltd. | | | 9,000 | | | | 192 | | |
Oji Holdings Corp. | | | 1,000 | | | | 7 | | |
Olympus Corp. | | | 200 | | | | 8 | | |
Omron Corp. | | | 4,404 | | | | 262 | | |
Ono Pharmaceutical Co., Ltd. | | | 3,800 | | | | 88 | | |
Oriental Land Co., Ltd. | | | 3,200 | | | | 292 | | |
ORIX Corp. | | | 19,460 | | | | 329 | | |
Otsuka Holdings Co., Ltd. (a) | | | 4,400 | | | | 193 | | |
Panasonic Corp. | | | 19,100 | | | | 280 | | |
Recruit Holdings Co., Ltd. | | | 20,100 | | | | 499 | | |
Resona Holdings, Inc. | | | 12,600 | | | | 75 | | |
Ricoh Co., Ltd. | | | 400 | | | | 4 | | |
Rohm Co., Ltd. | | | 505 | | | | 56 | | |
Santen Pharmaceutical Co., Ltd. | | | 4,600 | | | | 72 | | |
SBI Holdings, Inc. | | | 2,800 | | | | 58 | | |
Sega Sammy Holdings, Inc. | | | 2,300 | | | | 28 | | |
Seiko Epson Corp. | | | 2,400 | | | | 56 | | |
Sekisui Chemical Co., Ltd. | | | 3,772 | | | | 76 | | |
Sekisui House Ltd. | | | 14,446 | | | | 261 | | |
Seven Bank Ltd. | | | 800 | | | | 3 | | |
Shimano, Inc. | | | 1,550 | | | | 218 | | |
Shimizu Corp. | | | 4,100 | | | | 42 | | |
Shin-Etsu Chemical Co., Ltd. | | | 4,293 | | | | 435 | | |
Shionogi & Co., Ltd. | | | 4,400 | | | | 238 | | |
Shiseido Co., Ltd. | | | 5,800 | | | | 280 | | |
Shizuoka Bank Ltd. (The) | | | 8,000 | | | | 83 | | |
SMC Corp. | | | 905 | | | | 373 | | |
SoftBank Group Corp. | | | 8,700 | | | | 687 | | |
Sojitz Corp. | | | 50,300 | | | | 154 | | |
Sompo Holdings, Inc. | | | 2,400 | | | | 92 | | |
Sony Corp. | | | 7,693 | | | | 346 | | |
Subaru Corp. | | | 5,500 | | | | 174 | | |
Sumitomo Chemical Co., Ltd. | | | 4,600 | | | | 33 | | |
Sumitomo Corp. | | | 18,000 | | | | 305 | | |
Sumitomo Electric Industries Ltd. | | | 11,000 | | | | 186 | | |
Sumitomo Metal Mining Co., Ltd. | | | 2,650 | | | | 122 | | |
Sumitomo Mitsui Financial Group, Inc. | | | 14,600 | | | | 631 | | |
Sumitomo Mitsui Trust Holdings, Inc. | | | 5,016 | | | | 199 | | |
Sumitomo Realty & Development Co., Ltd. | | | 5,500 | | | | 180 | | |
Suruga Bank Ltd. | | | 2,400 | | | | 51 | | |
Suzuki Motor Corp. | | | 3,100 | | | | 180 | | |
T&D Holdings, Inc. | | | 4,200 | | | | 72 | | |
Taiheiyo Cement Corp. | | | 1,800 | | | | 78 | | |
The accompanying notes are an integral part of the financial statements.
11
Morgan Stanley Institutional Fund, Inc.
Annual Report — December 31, 2017
Portfolio of Investments (cont'd)
Active International Allocation Portfolio
| | | Shares | | Value
(000) | |
Japan (cont'd) | |
Taisei Corp. | | | 2,400 | | | $ | 119 | | |
Takeda Pharmaceutical Co., Ltd. | | | 7,000 | | | | 396 | | |
TDK Corp. | | | 1,652 | | | | 132 | | |
Teijin Ltd. | | | 221 | | | | 5 | | |
Terumo Corp. | | | 5,100 | | | | 241 | | |
THK Co., Ltd. | | | 3,100 | | | | 116 | | |
Tobu Railway Co., Ltd. | | | 6,980 | | | | 225 | | |
Toho Co., Ltd. | | | 3,000 | | | | 104 | | |
Tokio Marine Holdings, Inc. | | | 7,820 | | | | 357 | | |
Tokyu Corp. | | | 6,200 | | | | 99 | | |
Tokyu Fudosan Holdings Corp. | | | 3,600 | | | | 26 | | |
Toppan Printing Co., Ltd. | | | 3,600 | | | | 32 | | |
Toray Industries, Inc. | | | 20,300 | | | | 191 | | |
TOTO Ltd. | | | 2,100 | | | | 124 | | |
Toyota Industries Corp. | | | 550 | | | | 35 | | |
Toyota Motor Corp. | | | 18,155 | | | | 1,163 | | |
Toyota Tsusho Corp. | | | 200 | | | | 8 | | |
Trend Micro, Inc. | | | 900 | | | | 51 | | |
Unicharm Corp. | | | 6,600 | | | | 172 | | |
West Japan Railway Co. | | | 442 | | | | 32 | | |
Yamaha Corp. | | | 2,400 | | | | 88 | | |
Yamaha Motor Co., Ltd. | | | 3,000 | | | | 98 | | |
Yamato Holdings Co., Ltd. | | | 5,535 | | | | 111 | | |
Yaskawa Electric Corp. | | | 2,800 | | | | 122 | | |
| | | | 34,178 | | |
Korea, Republic of (0.1%) | |
NAVER Corp. | | | 267 | | | | 217 | | |
Malaysia (1.2%) | |
AMMB Holdings Bhd | | | 57,100 | | | | 62 | | |
Axiata Group Bhd | | | 92,700 | | | | 125 | | |
British American Tobacco Malaysia Bhd | | | 4,900 | | | | 48 | | |
CIMB Group Holdings Bhd | | | 122,200 | | | | 198 | | |
DiGi.Com Bhd | | | 107,100 | | | | 135 | | |
Gamuda Bhd | | | 58,500 | | | | 72 | | |
Genting Bhd | | | 77,500 | | | | 176 | | |
Genting Malaysia Bhd | | | 102,300 | | | | 142 | | |
Hong Leong Financial Group Bhd | | | 7,900 | | | | 35 | | |
IHH Healthcare Bhd | | | 70,900 | | | | 103 | | |
IJM Corp., Bhd | | | 99,500 | | | | 75 | | |
Malayan Banking Bhd | | | 122,900 | | | | 297 | | |
Malaysia Airports Holdings Bhd | | | 28,600 | | | | 62 | | |
Petronas Chemicals Group Bhd | | | 82,700 | | | | 157 | | |
Petronas Dagangan Bhd | | | 8,600 | | | | 52 | | |
Petronas Gas Bhd | | | 23,900 | | | | 103 | | |
Public Bank Bhd | | | 100,300 | | | | 515 | | |
RHB Bank Bhd | | | 27,600 | | | | 34 | | |
Sime Darby Bhd | | | 82,000 | | | | 45 | | |
Sime Darby Plantation Bhd (b) | | | 82,000 | | | | 122 | | |
Sime Darby Property Bhd (b) | | | 82,000 | | | | 36 | | |
Telekom Malaysia Bhd | | | 38,800 | | | | 60 | | |
| | | | 2,654 | | |
| | | Shares | | Value
(000) | |
Malta (0.0%) | |
BGP Holdings PLC (b)(f)(g) | | | 72,261 | | | $ | — | @ | |
Netherlands (3.1%) | |
ABN AMRO Group N.V. CVA (e) | | | 250 | | | | 8 | | |
Aegon N.V. | | | 29,744 | | | | 190 | | |
Gemalto N.V. | | | 2,555 | | | | 151 | | |
Heineken Holding N.V. | | | 132 | | | | 13 | | |
Heineken N.V. | | | 3,371 | | | | 351 | | |
ING Groep N.V. | | | 62,309 | | | | 1,147 | | |
Koninklijke Ahold Delhaize N.V. | | | 13,210 | | | | 290 | | |
Koninklijke DSM N.V. | | | 2,602 | | | | 248 | | |
Koninklijke Philips N.V. | | | 23,791 | | | | 900 | | |
Randstad Holding N.V. | | | 12,534 | | | | 769 | | |
RELX N.V. | | | 37,735 | | | | 867 | | |
Unilever N.V. CVA | | | 28,028 | | | | 1,575 | | |
Wolters Kluwer N.V. | | | 11,696 | | | | 609 | | |
| | | | 7,118 | | |
Norway (0.2%) | |
DNB ASA | | | 15,071 | | | | 279 | | |
Marine Harvest ASA (b) | | | 12,579 | | | | 213 | | |
| | | | 492 | | |
Peru (0.9%) | |
Cia de Minas Buenaventura SA ADR | | | 15,000 | | | | 211 | | |
Credicorp Ltd. | | | 7,200 | | | | 1,494 | | |
Southern Copper Corp. (a) | | | 6,700 | | | | 318 | | |
| | | | 2,023 | | |
Philippines (2.0%) | |
Aboitiz Equity Ventures, Inc. | | | 163,160 | | | | 241 | | |
Aboitiz Power Corp. | | | 110,900 | | | | 92 | | |
Ayala Corp. | | | 20,800 | | | | 423 | | |
Ayala Land, Inc. | | | 620,900 | | | | 553 | | |
Bank of the Philippine Islands | | | 66,200 | | | | 143 | | |
BDO Unibank, Inc. | | | 165,212 | | | | 543 | | |
DMCI Holdings, Inc. | | | 352,600 | | | | 102 | | |
Energy Development Corp. | | | 124,154 | | | | 14 | | |
Globe Telecom, Inc. | | | 2,930 | | | | 112 | | |
GT Capital Holdings, Inc. | | | 6,760 | | | | 175 | | |
International Container Terminal Services, Inc. | | | 44,790 | | | | 95 | | |
JG Summit Holdings, Inc. | | | 236,940 | | | | 342 | | |
Jollibee Foods Corp. | | | 35,680 | | | | 181 | | |
Metro Pacific Investments Corp. | | | 1,280,900 | | | | 176 | | |
PLDT, Inc. | | | 8,005 | | | | 237 | | |
SM Investments Corp. | | | 20,210 | | | | 400 | | |
SM Prime Holdings, Inc. | | | 670,300 | | | | 503 | | |
Universal Robina Corp. | | | 70,800 | | | | 214 | | |
| | | | 4,546 | | |
Portugal (0.2%) | |
EDP - Energias de Portugal SA | | | 33,841 | | | | 117 | | |
Galp Energia SGPS SA | | | 15,107 | | | | 278 | | |
| | | | 395 | | |
The accompanying notes are an integral part of the financial statements.
12
Morgan Stanley Institutional Fund, Inc.
Annual Report — December 31, 2017
Portfolio of Investments (cont'd)
Active International Allocation Portfolio
| | | Shares | | Value
(000) | |
Spain (4.2%) | |
ACS Actividades de Construccion y Servicios SA | | | 7,748 | | | $ | 303 | | |
Aena SME SA (e) | | | 2,705 | | | | 548 | | |
Amadeus IT Group SA, Class A | | | 16,146 | | | | 1,162 | | |
Banco Bilbao Vizcaya Argentaria SA | | | 132,117 | | | | 1,125 | | |
Banco de Sabadell SA | | | 242,480 | | | | 480 | | |
Banco Santander SA | | | 243,066 | | | | 1,594 | | |
Bankia SA | | | 69,226 | | | | 330 | | |
Bankinter SA | | | 46,131 | | | | 437 | | |
CaixaBank SA | | | 149,899 | | | | 697 | | |
Endesa SA | | | 16,926 | | | | 362 | | |
Ferrovial SA | | | 14,112 | | | | 320 | | |
Grifols SA | | | 11,782 | | | | 345 | | |
Industria de Diseno Textil SA | | | 26,756 | | | | 931 | | |
Mapfre SA | | | 36,237 | | | | 116 | | |
Red Electrica Corp., SA | | | 20,742 | | | | 465 | | |
Repsol SA | | | 14,739 | | | | 260 | | |
Zardoya Otis SA | | | 6,046 | | | | 66 | | |
| | | | 9,541 | | |
Sweden (3.3%) | |
Arjo AB, Class B (b) | | | 5,486 | | | | 16 | | |
Boliden AB | | | 317 | | | | 11 | | |
Electrolux AB, Class B | | | 40,350 | | | | 1,298 | | |
Elekta AB, Class B | | | 5,951 | | | | 49 | | |
Essity AB, Class B (b) | | | 13,601 | | | | 385 | | |
Hennes & Mauritz AB, Class B | | | 10,858 | | | | 224 | | |
Hexagon AB, Class B | | | 18,376 | | | | 919 | | |
Husqvarna AB, Class B | | | 28,002 | | | | 266 | | |
Investor AB, Class B | | | 11,261 | | | | 512 | | |
Lundin Petroleum AB (b) | | | 3,215 | | | | 74 | | |
Nordea Bank AB | | | 46,960 | | | | 568 | | |
Saab AB | | | 1,565 | | | | 76 | | |
Securitas AB, Class B | | | 14,486 | | | | 252 | | |
Skandinaviska Enskilda Banken AB, Class A | | | 28,790 | | | | 337 | | |
Skanska AB, Class B | | | 8,209 | | | | 170 | | |
Svenska Cellulosa AB SCA, Class B | | | 13,601 | | | | 140 | | |
Svenska Handelsbanken AB, Class A | | | 20,233 | | | | 276 | | |
Swedbank AB, Class A | | | 12,679 | | | | 305 | | |
Swedish Match AB | | | 5,056 | | | | 199 | | |
Telefonaktiebolaget LM Ericsson, Class B | | | 181,320 | | | | 1,189 | | |
Volvo AB, Class B | | | 18,554 | | | | 345 | | |
| | | | 7,611 | | |
Switzerland (4.7%) | |
Adecco Group AG (Registered) | | | 10,293 | | | | 787 | | |
Baloise Holding AG (Registered) | | | 913 | | | | 142 | | |
Cie Financiere Richemont SA (Registered) | | | 5,319 | | | | 482 | | |
Geberit AG (Registered) | | | 1,086 | | | | 478 | | |
Givaudan SA (Registered) | | | 122 | | | | 281 | | |
Julius Baer Group Ltd. (b) | | | 3,275 | | | | 200 | | |
LafargeHolcim Ltd. (Registered) (b) | | | 9,623 | | | | 542 | | |
LafargeHolcim Ltd. (Registered) (b) | | | 3,101 | | | | 175 | | |
Nestle SA (Registered) | | | 57,551 | | | | 4,945 | | |
Partners Group Holding AG | | | 198 | | | | 136 | | |
| | | Shares | | Value
(000) | |
Schindler Holding AG | | | 481 | | | $ | 111 | | |
SGS SA (Registered) | | | 18 | | | | 47 | | |
Swiss Life Holding AG (Registered) (b) | | | 1,023 | | | | 362 | | |
UBS Group AG (Registered) (b) | | | 72,670 | | | | 1,335 | | |
Zurich Insurance Group AG | | | 2,398 | | | | 729 | | |
| | | | 10,752 | | |
Taiwan (1.2%) | |
Taiwan Semiconductor Manufacturing Co., Ltd. | | | 341,000 | | | | 2,620 | | |
United Kingdom (9.6%) | |
| 3i Group PLC | | | 7,590 | | | | 94 | | |
Admiral Group PLC | | | 1,588 | | | | 43 | | |
Anglo American PLC (a) | | | 20,020 | | | | 418 | | |
Antofagasta PLC | | | 2,540 | | | | 34 | | |
AstraZeneca PLC | | | 19,311 | | | | 1,325 | | |
Aviva PLC | | | 57,083 | | | | 390 | | |
Babcock International Group PLC | | | 4,169 | | | | 40 | | |
BAE Systems PLC | | | 130,645 | | | | 1,005 | | |
Barratt Developments PLC | | | 19,177 | | | | 168 | | |
British American Tobacco PLC | | | 23,509 | | | | 1,587 | | |
Bunzl PLC | | | 5,004 | | | | 140 | | |
Burberry Group PLC | | | 4,157 | | | | 100 | | |
Carnival PLC | | | 2,846 | | | | 187 | | |
Centrica PLC | | | 69,318 | | | | 128 | | |
Compass Group PLC | | | 29,519 | | | | 638 | | |
CYBG PLC CDI | | | 7,987 | | | | 36 | | |
DCC PLC | | | 505 | | | | 51 | | |
Diageo PLC | | | 27,352 | | | | 1,001 | | |
Ferguson PLC | | | 3,404 | | | | 244 | | |
GKN PLC | | | 28,664 | | | | 123 | | |
GlaxoSmithKline PLC | | | 74,410 | | | | 1,316 | | |
Glencore PLC (b) | | | 189,340 | | | | 996 | | |
Hargreaves Lansdown PLC | | | 1,234 | | | | 30 | | |
IMI PLC | | | 2,247 | | | | 40 | | |
Imperial Brands PLC | | | 12,782 | | | | 546 | | |
Indivior PLC (b) | | | 10,100 | | | | 55 | | |
InterContinental Hotels Group PLC | | | 3,899 | | | | 248 | | |
Intertek Group PLC | | | 1,914 | | | | 134 | | |
ITV PLC | | | 5,540 | | | | 12 | | |
J Sainsbury PLC | | | 18,966 | | | | 62 | | |
Johnson Matthey PLC | | | 2,526 | | | | 104 | | |
Legal & General Group PLC | | | 55,584 | | | | 205 | | |
Lonmin PLC (b) | | | 23 | | | | — | @ | |
Merlin Entertainments PLC (e) | | | 1,309 | | | | 6 | | |
Mondi PLC | | | 676 | | | | 18 | | |
National Grid PLC | | | 17,208 | | | | 202 | | |
Next PLC | | | 2,193 | | | | 134 | | |
Old Mutual PLC | | | 42,304 | | | | 132 | | |
Pearson PLC | | | 11,921 | | | | 118 | | |
Persimmon PLC | | | 5,527 | | | | 204 | | |
Prudential PLC | | | 28,844 | | | | 742 | | |
Reckitt Benckiser Group PLC | | | 8,470 | | | | 791 | | |
RELX PLC | | | 20,956 | | | | 491 | | |
Rolls-Royce Holdings PLC (b) | | | 22,206 | | | | 253 | | |
Royal Dutch Shell PLC, Class A | | | 58,320 | | | | 1,952 | | |
The accompanying notes are an integral part of the financial statements.
13
Morgan Stanley Institutional Fund, Inc.
Annual Report — December 31, 2017
Portfolio of Investments (cont'd)
Active International Allocation Portfolio
| | | Shares | | Value
(000) | |
United Kingdom (cont'd) | |
Royal Dutch Shell PLC, Class B | | | 42,858 | | | $ | 1,445 | | |
Sage Group PLC (The) | | | 26,348 | | | | 283 | | |
Schroders PLC | | | 1,066 | | | | 50 | | |
Segro PLC REIT | | | 5,885 | | | | 47 | | |
Shire PLC | | | 14,916 | | | | 774 | | |
Smith & Nephew PLC | | | 35,901 | | | | 621 | | |
SSE PLC | | | 4,912 | | | | 87 | | |
Standard Life Aberdeen PLC | | | 14,018 | | | | 83 | | |
Taylor Wimpey PLC | | | 62,655 | | | | 175 | | |
TechnipFMC PLC | | | 3,806 | | | | 118 | | |
Travis Perkins PLC | | | 460 | | | | 10 | | |
TUI AG | | | 7,047 | | | | 146 | | |
Unilever PLC | | | 22,013 | | | | 1,220 | | |
United Utilities Group PLC | | | 3,447 | | | | 39 | | |
Whitbread PLC | | | 3,377 | | | | 182 | | |
| | | | 21,823 | | |
Total Common Stocks (Cost $144,811) | | | 196,751 | | |
| | | No. of
Rights | | | |
Rights (0.0%) | |
Australia (0.0%) | |
Transurban Group (b) | | | 390 | | | | — | @ | |
Spain (0.0%) | |
Repsol SA (b) | | | 14,739 | | | | 7 | | |
Total Rights (Cost $7) | | | 7 | | |
| | | Shares | | | |
Short-Term Investments (12.3%) | |
Securities held as Collateral on Loaned Securities (0.1%) | |
Investment Company (0.1%) | |
Morgan Stanley Institutional Liquidity
Funds — Treasury Securities Portfolio —
Institutional Class (See Note G) | | | 272,727 | | | | 273 | | |
| | | Face
Amount
(000) | | | |
Repurchase Agreements (0.0%) | |
Barclays Capital, Inc., (1.37%,
dated 12/29/17, due 1/2/18;
proceeds $63; fully collateralized by
a U.S. Government obligation;
1.75% due 5/15/23; valued at $64) | | $ | 63 | | | | 63 | | |
HSBC Securities USA, Inc., (1.30%,
dated 12/29/17, due 1/2/18; proceeds
$5; fully collateralized by a
U.S. Government obligation;
3.00% due 2/15/47; valued at $5) | | | 5 | | | | 5 | | |
Merrill Lynch & Co., Inc., (1.42%,
dated 12/29/17, due 1/2/18;
proceeds $32; fully collateralized by a
U.S. Government obligation;
2.00% due 12/31/21; valued at $33) | | | 32 | | | | 32 | | |
| | | | 100 | | |
Total Securities held as Collateral on Loaned
Securities (Cost $373) | | | 373 | | |
| | | Shares | | Value
(000) | |
Investment Company (12.2%) | |
Morgan Stanley Institutional Liquidity
Funds — Treasury Securities Portfolio —
Institutional Class (See Note G)
(Cost $27,705) | | | 27,704,698 | | | $ | 27,705 | | |
Total Short-Term Investments (Cost $28,078) | | | 28,078 | | |
Total Investments (98.7%) (Cost $172,896)
Including $4,356 of Securities Loaned (h)(i)(j) | | | 224,836 | | |
| Other Assets in Excess of Liabilities (1.3%) | | | 2,910 | | |
Net Assets (100.0%) | | $ | 227,746 | | |
Country assignments and aggregations are based generally on third party vendor classifications and information, and may be different from the assignments and aggregations under the policies set forth in the Fund's prospectus and/or statement of additional information relating to geographic classifications.
(a) All or a portion of this security was on loan at December 31, 2017.
(b) Non-income producing security.
(c) Consists of one or more classes of securities traded together as a unit; stocks with attached warrants.
(d) Security trades on the Hong Kong exchange.
(e) 144A security — Certain conditions for public sale may exist. Unless otherwise noted, these securities are deemed to be liquid.
(f) Security has been deemed illiquid at December 31, 2017.
(g) At December 31, 2017, the Fund held a fair valued security valued at less than $500, representing less than 0.05% of net assets. This security has been fair valued as determined in good faith under procedures established by and under the general supervision of the Company's Directors.
(h) The approximate fair value and percentage of net assets, $187,419,000 and 82.3%, respectively, represent the securities that have been fair valued under the fair valuation policy for international investments as described in Note A-1 within the Notes to the Financial Statements.
(i) Securities are available for collateral in connection with open foreign currency forward exchange contracts and futures contracts.
(j) At December 31, 2017, the aggregate cost for federal income tax purposes is approximately $177,052,000. The aggregate gross unrealized appreciation is approximately $53,561,000 and the aggregate gross unrealized depreciation is approximately $4,924,000, resulting in net unrealized appreciation of approximately $48,637,000.
@ Value is less than $500.
ADR American Depositary Receipt.
CDI CHESS Depositary Interest.
CVA Certificaten Van Aandelen.
REIT Real Estate Investment Trust.
The accompanying notes are an integral part of the financial statements.
14
Morgan Stanley Institutional Fund, Inc.
Annual Report — December 31, 2017
Portfolio of Investments (cont'd)
Active International Allocation Portfolio
Foreign Currency Forward Exchange Contracts:
The Fund had the following foreign currency forward exchange contracts open at December 31, 2017:
Counterparty | | Contracts to
Deliver
(000) | | In Exchange
For
(000) | | Delivery
Date | | Unrealized
Appreciation
(Depreciation)
(000) | |
Citibank NA | | JPY | 283,009 | | | $ | 2,518 | | | 3/22/18 | | $ | (3 | ) | |
Goldman Sachs International | | $ | 2,278 | | | BRL | 7,681 | | | 3/22/18 | | | 18 | | |
Goldman Sachs International | | $ | 7,732 | | | INR | 501,353 | | | 3/22/18 | | | 48 | | |
JPMorgan Chase Bank NA | | $ | 4,556 | | | PLN | 16,186 | | | 3/22/18 | | | 95 | | |
State Street Bank and Trust Co. | | EUR | 862 | | | $ | 1,028 | | | 3/22/18 | | | (12 | ) | |
State Street Bank and Trust Co. | | $ | 3,922 | | | EUR | 3,299 | | | 3/22/18 | | | 54 | | |
| | | | | | | | | $ | 200 | | |
Futures Contracts:
The Fund had the following futures contracts open at December 31, 2017:
| | | Number
of
Contracts | | Expiration
Date | | Notional Amount
(000) | | Value
(000) | | Unrealized
Appreciation
(Depreciation)
(000) | |
Long: | |
BOVESPA Index (Brazil) | | | 165 | | | Feb-18 | | | — | @ | | $ | 3,822 | | | $ | 144 | | |
DAX Index (Germany) | | | 2 | | | Mar-18 | | | — | @ | | | 775 | | | | (15 | ) | |
IBEX 35 Index (Spain) | | | 18 | | | Jan-18 | | | — | @ | | | 2,164 | | | | (47 | ) | |
MSCI Emerging Market E Mini (United States) | | | 149 | | | Mar-18 | | | 7 | | | | 8,670 | | | | 486 | | |
SGX NIFTY 50 (Singapore) | | | 423 | | | Jan-18 | | | 1 | | | | 8,932 | | | | 1 | | |
WIG20 Index (Poland) | | | 431 | | | Mar-18 | | | 9 | | | | 6,077 | | | | 85 | | |
| | | | | | | | | | | $ | 654 | | |
@ Amount is less than $500.
BRL — Brazilian Real
EUR — Euro
INR — Indian Rupee
JPY — Japanese Yen
PLN — Polish Zloty
Portfolio Composition*
Classification | | Percentage of
Total Investments | |
Other** | | | 70.2 | % | |
Short-Term Investment | | | 12.3 | | |
Banks | | | 12.1 | | |
Pharmaceuticals | | | 5.4 | | |
Total Investments | | | 100.0 | %*** | |
* Percentages indicated are based upon total investments (excluding Securities held as Collateral on Loaned Securities) as of December 31, 2017.
** Industries and/or investment types representing less than 5% of total investments.
*** Does not include open long futures contracts with an underlying face amount of approximately $30,440,000 with net unrealized appreciation of approximately $654,000. Does not include open foreign currency forward exchange contracts with net unrealized appreciation of approximately $200,000.
The accompanying notes are an integral part of the financial statements.
15
Morgan Stanley Institutional Fund, Inc.
Annual Report — December 31, 2017
Active International Allocation Portfolio
Statement of Assets and Liabilities | | December 31, 2017
(000) | |
Assets: | |
Investments in Securities of Unaffiliated Issuers, at Value(1) (Cost $143,896) | | $ | 196,179 | | |
Investment in Securities of Affiliated Issuer, at Value (Cost $29,000) | | | 28,657 | | |
Total Investments in Securities, at Value (Cost $172,896) | | | 224,836 | | |
Foreign Currency, at Value (Cost $1,007) | | | 1,055 | | |
Receivable for Variation Margin on Futures Contracts | | | 2,379 | | |
Unrealized Appreciation on Foreign Currency Forward Exchange Contracts | | | 215 | | |
Dividends Receivable | | | 143 | | |
Receivable for Fund Shares Sold | | | 84 | | |
Due from Adviser | | | 68 | | |
Receivable from Affiliate | | | 25 | | |
Tax Reclaim Receivable | | | 17 | | |
Receivable for Investments Sold | | | 1 | | |
Receivable from Securities Lending Income | | | 1 | | |
Other Assets | | | 42 | | |
Total Assets | | | 228,866 | | |
Liabilities: | |
Collateral on Securities Loaned, at Value | | | 373 | | |
Payable for Fund Shares Redeemed | | | 116 | | |
Payable for Custodian Fees | | | 96 | | |
Payable for Sub Transfer Agency Fees — Class I | | | 39 | | |
Payable for Sub Transfer Agency Fees — Class A | | | 37 | | |
Payable for Sub Transfer Agency Fees — Class L | | | 5 | | |
Deferred Capital Gain Country Tax | | | 50 | | |
Payable for Professional Fees | | | 24 | | |
Payable for Directors' Fees and Expenses | | | 24 | | |
Payable for Shareholder Services Fees — Class A | | | 14 | | |
Payable for Distribution and Shareholder Services Fees — Class L | | | 4 | | |
Payable for Distribution and Shareholder Services Fees — Class C | | | — | @ | |
Unrealized Depreciation on Foreign Currency Forward Exchange Contracts | | | 15 | | |
Payable for Administration Fees | | | 15 | | |
Payable for Transfer Agency Fees — Class I | | | 2 | | |
Payable for Transfer Agency Fees — Class A | | | 4 | | |
Payable for Transfer Agency Fees — Class L | | | 1 | | |
Payable for Transfer Agency Fees — Class C | | | 1 | | |
Other Liabilities | | | 300 | | |
Total Liabilities | | | 1,120 | | |
Net Assets | | $ | 227,746 | | |
Net Assets Consist Of: | |
Paid-in-Capital | | $ | 192,317 | | |
Dividends in Excess of Net Investment Income | | | (477 | ) | |
Accumulated Net Realized Loss | | | (16,893 | ) | |
Unrealized Appreciation (Depreciation) on: | |
Investments (Net of $44 of Deferred Capital Gain Country Tax) | | | 52,239 | | |
Investments in Affiliates | | | (343 | ) | |
Futures Contracts | | | 654 | | |
Foreign Currency Forward Exchange Contracts | | | 200 | | |
Foreign Currency Translations | | | 49 | | |
Net Assets | | $ | 227,746 | | |
The accompanying notes are an integral part of the financial statements.
16
Morgan Stanley Institutional Fund, Inc.
Annual Report — December 31, 2017
Active International Allocation Portfolio
Statement of Assets and Liabilities (cont'd) | | December 31, 2017
(000) | |
CLASS I: | |
Net Assets | | $ | 155,550 | | |
| Shares Outstanding $0.001 par value shares of beneficial interest (unlimited shares authorized) (not in 000's) | | | 10,758,402 | | |
Net Asset Value, Offering and Redemption Price Per Share | | $ | 14.46 | | |
CLASS A: | |
Net Assets | | $ | 65,710 | | |
| Shares Outstanding $0.001 par value shares of beneficial interest (unlimited shares authorized) (not in 000's) | | | 4,442,650 | | |
Net Asset Value, Redemption Price Per Share | | $ | 14.79 | | |
Maximum Sales Load | | | 5.25 | % | |
Maximum Sales Charge | | $ | 0.82 | | |
Maximum Offering Price Per Share | | $ | 15.61 | | |
CLASS L: | |
Net Assets | | $ | 6,463 | | |
| Shares Outstanding $0.001 par value shares of beneficial interest (unlimited shares authorized) (not in 000's) | | | 438,866 | | |
Net Asset Value, Offering and Redemption Price Per Share | | $ | 14.73 | | |
CLASS C: | |
Net Assets | | $ | 23 | | |
| Shares Outstanding $0.001 par value shares of beneficial interest (unlimited shares authorized) (not in 000's) | | | 1,589 | | |
Net Asset Value, Offering and Redemption Price Per Share | | $ | 14.77 | | |
(1) Including:
Securities on Loan, at Value: | | $ | 4,356 | | |
@ Amount is less than $500.
The accompanying notes are an integral part of the financial statements.
17
Morgan Stanley Institutional Fund, Inc.
Annual Report — December 31, 2017
Active International Allocation Portfolio
Statement of Operations | | Year Ended
December 31, 2017
(000) | |
Investment Income: | |
Dividends from Securities of Unaffiliated Issuers (Net of $825 of Foreign Taxes Withheld) | | $ | 5,037 | | |
Dividends from Securities of Affiliated Issuers (Note G) | | | 233 | | |
Income from Securities Loaned — Net | | | 46 | | |
Interest from Securities of Unaffiliated Issuers | | | 15 | | |
Total Investment Income | | | 5,331 | | |
Expenses: | |
Advisory Fees (Note B) | | | 1,509 | | |
Shareholder Reporting Fees | | | 332 | | |
Shareholder Services Fees — Class A (Note D) | | | 155 | | |
Distribution and Shareholder Services Fees — Class L (Note D) | | | 47 | | |
Distribution and Shareholder Services Fees — Class C (Note D) | | | — | @ | |
Administration Fees (Note C) | | | 186 | | |
Sub Transfer Agency Fees — Class I | | | 86 | | |
Sub Transfer Agency Fees — Class A | | | 83 | | |
Sub Transfer Agency Fees — Class L | | | 12 | | |
Custodian Fees (Note F) | | | 158 | | |
Professional Fees | | | 157 | | |
Pricing Fees | | | 64 | | |
Registration Fees | | | 55 | | |
Transfer Agency Fees — Class I (Note E) | | | 8 | | |
Transfer Agency Fees — Class A (Note E) | | | 12 | | |
Transfer Agency Fees — Class L (Note E) | | | 4 | | |
Transfer Agency Fees — Class C (Note E) | | | 2 | | |
Directors' Fees and Expenses | | | 9 | | |
Other Expenses | | | 39 | | |
Total Expenses | | | 2,918 | | |
Waiver of Advisory Fees (Note B) | | | (420 | ) | |
Reimbursement of Class Specific Expenses — Class I (Note B) | | | (94 | ) | |
Reimbursement of Class Specific Expenses — Class A (Note B) | | | (33 | ) | |
Reimbursement of Class Specific Expenses — Class L (Note B) | | | (9 | ) | |
Reimbursement of Class Specific Expenses — Class C (Note B) | | | (2 | ) | |
Rebate from Morgan Stanley Affiliate (Note G) | | | (54 | ) | |
Net Expenses | | | 2,306 | | |
Net Investment Income | | | 3,025 | | |
Realized Gain: | |
Investments Sold (Net of $6 of Capital Gain Country Tax) | | | 12,563 | | |
Foreign Currency Forward Exchange Contracts | | | 687 | | |
Foreign Currency Transactions | | | 193 | | |
Futures Contracts | | | 5,743 | | |
Realized Gain | | | 19,186 | | |
Change in Unrealized Appreciation (Depreciation): | |
Investments (Net of Increase in Deferred Capital Gain Country Tax of $44) | | | 28,345 | | |
Investments in Affiliates | | | 109 | | |
Foreign Currency Forward Exchange Contracts | | | 86 | | |
Foreign Currency Translations | | | 160 | | |
Futures Contracts | | | 505 | | |
Net Change in Unrealized Appreciation (Depreciation) | | | 29,205 | | |
Net Realized Gain and Change in Unrealized Appreciation (Depreciation) | | | 48,391 | | |
Net Increase in Net Assets Resulting from Operations | | $ | 51,416 | | |
@ Amount is less than $500.
The accompanying notes are an integral part of the financial statements.
18
Morgan Stanley Institutional Fund, Inc.
Annual Report — December 31, 2017
Active International Allocation Portfolio
Statements of Changes in Net Assets | | Year Ended
December 31, 2017
(000) | | Year Ended
December 31, 2016
(000) | |
Increase (Decrease) in Net Assets: | |
Operations: | |
Net Investment Income | | $ | 3,025 | | | $ | 5,019 | | |
Net Realized Gain (Loss) | | | 19,186 | | | | (19,850 | ) | |
Net Change in Unrealized Appreciation (Depreciation) | | | 29,205 | | | | 11,831 | | |
Net Increase (Decrease) in Net Assets Resulting from Operations | | | 51,416 | | | | (3,000 | ) | |
Distributions from and/or in Excess of: | |
Class I: | |
Net Investment Income | | | (3,170 | ) | | | (4,058 | ) | |
Class A: | |
Net Investment Income | | | (1,073 | ) | | | (1,111 | ) | |
Class L: | |
Net Investment Income | | | (75 | ) | | | (80 | ) | |
Class C: | |
Net Investment Income | | | (— | @) | | | — | | |
Total Distributions | | | (4,318 | ) | | | (5,249 | ) | |
Capital Share Transactions:(1) | |
Class I: | |
Subscribed | | | 6,465 | | | | 7,873 | | |
Distributions Reinvested | | | 3,157 | | | | 4,046 | | |
Redeemed | | | (57,220 | ) | | | (34,018 | ) | |
Class A: | |
Subscribed | | | 6,669 | | | | 4,280 | | |
Distributions Reinvested | | | 1,059 | | | | 1,094 | | |
Redeemed | | | (11,227 | ) | | | (10,963 | ) | |
Class L: | |
Distributions Reinvested | | | 74 | | | | 79 | | |
Redeemed | | | (928 | ) | | | (1,279 | ) | |
Class C: | |
Subscribed | | | 13 | | | | 40 | | |
Distributions Reinvested | | | — | @ | | | — | | |
Redeemed | | | — | | | | (60 | ) | |
Net Decrease in Net Assets Resulting from Capital Share Transactions | | | (51,938 | ) | | | (28,908 | ) | |
Redemption Fees | | | 1 | | | | — | @ | |
Total Decrease in Net Assets | | | (4,839 | ) | | | (37,157 | ) | |
Net Assets: | |
Beginning of Period | | | 232,585 | | | | 269,742 | | |
End of Period (Including Dividends in Excess of Net Investment Income of $(477) and $(306)) | | $ | 227,746 | | | $ | 232,585 | | |
(1) Capital Share Transactions: | |
Class I: | |
Shares Subscribed | | | 501 | | | | 673 | | |
Shares Issued on Distributions Reinvested | | | 221 | | | | 344 | | |
Shares Redeemed | | | (4,302 | ) | | | (2,891 | ) | |
Net Decrease in Class I Shares Outstanding | | | (3,580 | ) | | | (1,874 | ) | |
Class A: | |
Shares Subscribed | | | 489 | | | | 356 | | |
Shares Issued on Distributions Reinvested | | | 73 | | | | 91 | | |
Shares Redeemed | | | (826 | ) | | | (913 | ) | |
Net Decrease in Class A Shares Outstanding | | | (264 | ) | | | (466 | ) | |
Class L: | |
Shares Issued on Distributions Reinvested | | | 5 | | | | 7 | | |
Shares Redeemed | | | (69 | ) | | | (108 | ) | |
Net Decrease in Class L Shares Outstanding | | | (64 | ) | | | (101 | ) | |
Class C: | |
Shares Subscribed | | | 1 | | | | 3 | | |
Shares Issued on Distributions Reinvested | | | — | @@ | | | — | | |
Shares Redeemed | | | — | | | | (5 | ) | |
Net Increase (Decrease) in Class C Shares Outstanding | | | 1 | | | | (2 | ) | |
@ Amount is less than $500.
@@ Amount is less than 500 shares.
The accompanying notes are an integral part of the financial statements.
19
Morgan Stanley Institutional Fund, Inc.
Annual Report — December 31, 2017
Financial Highlights
Active International Allocation Portfolio
| | | Class I | |
| | | Year Ended December 31, | |
Selected Per Share Data and Ratios | | 2017 | | 2016(1) | | 2015 | | 2014 | | 2013 | |
Net Asset Value, Beginning of Period | | $ | 11.83 | | | $ | 12.20 | | | $ | 12.52 | | | $ | 13.75 | | | $ | 11.65 | | |
Income (Loss) from Investment Operations: | |
Net Investment Income(2) | | | 0.19 | | | | 0.26 | | | | 0.22 | | | | 0.34 | | | | 0.22 | | |
Net Realized and Unrealized Gain (Loss) | | | 2.74 | | | | (0.34 | ) | | | (0.42 | ) | | | (1.22 | ) | | | 2.25 | | |
Total from Investment Operations | | | 2.93 | | | | (0.08 | ) | | | (0.20 | ) | | | (0.88 | ) | | | 2.47 | | |
Distributions from and/or in Excess of: | |
Net Investment Income | | | (0.30 | ) | | | (0.29 | ) | | | (0.12 | ) | | | (0.35 | ) | | | (0.37 | ) | |
Redemption Fees | | | 0.00 | (3) | | | 0.00 | (3) | | | 0.00 | (3) | | | 0.00 | (3) | | | 0.00 | (3) | |
Net Asset Value, End of Period | | $ | 14.46 | | | $ | 11.83 | | | $ | 12.20 | | | $ | 12.52 | | | $ | 13.75 | | |
Total Return(4) | | | 24.76 | % | | | (0.67 | )% | | | (1.63 | )% | | | (6.37 | )% | | | 21.38 | % | |
Ratios and Supplemental Data: | |
Net Assets, End of Period (Thousands) | | $ | 155,550 | | | $ | 169,589 | | | $ | 197,733 | | | $ | 219,467 | | | $ | 260,614 | | |
Ratio of Expenses to Average Net Assets(6) | | | 0.88 | %(5) | | | 0.76 | %(5) | | | 0.89 | %(5) | | | 0.88 | %(5) | | | 0.83 | %(5) | |
Ratio of Expenses to Average Net Assets Excluding Non Operating Expenses | | | N/A | | | | N/A | | | | N/A | | | | N/A | | | | 0.88 | %(5) | |
Ratio of Net Investment Income to Average Net Assets(6) | | | 1.44 | %(5) | | | 2.18 | %(5) | | | 1.66 | %(5) | | | 2.53 | %(5) | | | 1.71 | %(5) | |
Ratio of Rebate from Morgan Stanley Affiliates to Average Net Assets | | | 0.02 | % | | | 0.01 | % | | | 0.01 | % | | | 0.02 | % | | | 0.02 | % | |
Portfolio Turnover Rate | | | 22 | % | | | 40 | % | | | 30 | % | | | 32 | % | | | 36 | % | |
(6) Supplemental Information on the Ratios to Average Net Assets: | |
Ratios Before Expense Limitation: | |
Expenses to Average Net Assets | | | 1.14 | % | | | 0.94 | % | | | 0.92 | % | | | 0.99 | % | | | 0.99 | % | |
Net Investment Income to Average Net Assets | | | 1.18 | % | | | 2.00 | % | | | 1.63 | % | | | 2.42 | % | | | 1.55 | % | |
(1) Reflects prior period custodian out-of-pocket expenses that were reimbursed in September 2016. The amount of the reimbursement was immaterial on a per share basis and did not impact the total return of Class I shares. The Ratio of Expenses to Average Net Assets would have been 0.13% higher and the Ratio of Net Investment Income to Average Net Assets would have been 0.13% lower had the custodian not reimbursed the Fund.
(2) Per share amount is based on average shares outstanding.
(3) Amount is less than $0.005 per share.
(4) Calculated based on the net asset value as of the last business day of the period.
(5) The Ratios of Expenses and Net Investment Income reflect the rebate of certain Fund expenses in connection with the investments in Morgan Stanley affiliates during the period. The effect of the rebate on the ratios is disclosed in the above table as "Ratio of Rebate from Morgan Stanley Affiliates to Average Net Assets."
The accompanying notes are an integral part of the financial statements.
20
Morgan Stanley Institutional Fund, Inc.
Annual Report — December 31, 2017
Financial Highlights
Active International Allocation Portfolio
| | | Class A | |
| | | Year Ended December 31, | |
Selected Per Share Data and Ratios | | 2017 | | 2016(1) | | 2015 | | 2014 | | 2013 | |
Net Asset Value, Beginning of Period | | $ | 12.10 | | | $ | 12.47 | | | $ | 12.79 | | | $ | 14.03 | | | $ | 11.89 | | |
Income (Loss) from Investment Operations: | |
Net Investment Income(2) | | | 0.14 | | | | 0.21 | | | | 0.17 | | | | 0.30 | | | | 0.11 | | |
Net Realized and Unrealized Gain (Loss) | | | 2.80 | | | | (0.34 | ) | | | (0.42 | ) | | | (1.24 | ) | | | 2.36 | | |
Total from Investment Operations | | | 2.94 | | | | (0.13 | ) | | | (0.25 | ) | | | (0.94 | ) | | | 2.47 | | |
Distributions from and/or in Excess of: | |
Net Investment Income | | | (0.25 | ) | | | (0.24 | ) | | | (0.07 | ) | | | (0.30 | ) | | | (0.33 | ) | |
Redemption Fees | | | 0.00 | (3) | | | 0.00 | (3) | | | 0.00 | (3) | | | 0.00 | (3) | | | 0.00 | (3) | |
Net Asset Value, End of Period | | $ | 14.79 | | | $ | 12.10 | | | $ | 12.47 | | | $ | 12.79 | | | $ | 14.03 | | |
Total Return(4) | | | 24.29 | % | | | (1.05 | )% | | | (1.95 | )% | | | (6.70 | )% | | | 20.94 | % | |
Ratios and Supplemental Data: | |
Net Assets, End of Period (Thousands) | | $ | 65,710 | | | $ | 56,934 | | | $ | 64,482 | | | $ | 71,938 | | | $ | 90,599 | | |
Ratio of Expenses to Average Net Assets(7) | | | 1.23 | %(5) | | | 1.14 | %(5) | | | 1.24 | %(5) | | | 1.23 | %(5) | | | 1.09 | %(5)(6) | |
Ratio of Expenses to Average Net Assets Excluding Non Operating Expenses | | | N/A | | | | N/A | | | | N/A | | | | N/A | | | | 1.21 | %(5)(6) | |
Ratio of Net Investment Income to Average Net Assets(7) | | | 1.02 | %(5) | | | 1.79 | %(5) | | | 1.31 | %(5) | | | 2.18 | %(5) | | | 0.84 | %(5) | |
Ratio of Rebate from Morgan Stanley Affiliates to Average Net Assets | | | 0.02 | % | | | 0.01 | % | | | 0.01 | % | | | 0.02 | % | | | 0.02 | % | |
Portfolio Turnover Rate | | | 22 | % | | | 40 | % | | | 30 | % | | | 32 | % | | | 36 | % | |
(7) Supplemental Information on the Ratios to Average Net Assets: | |
Ratios Before Expense Limitation: | |
Expenses to Average Net Assets | | | 1.48 | % | | | 1.32 | % | | | 1.28 | % | | | 1.31 | %(5) | | | 1.25 | %(5) | |
Net Investment Income to Average Net Assets | | | 0.77 | % | | | 1.61 | % | | | 1.27 | % | | | 2.10 | %(5) | | | 0.68 | %(5) | |
(1) Reflects prior period custodian out-of-pocket expenses that were reimbursed in September 2016. The amount of the reimbursement was immaterial on a per share basis and did not impact the total return of Class A shares. The Ratio of Expenses to Average Net Assets would have been 0.10% higher and the Ratio of Net Investment Income to Average Net Assets would have been 0.10% lower had the custodian not reimbursed the Fund.
(2) Per share amount is based on average shares outstanding.
(3) Amount is less than $0.005 per share.
(4) Calculated based on the net asset value which does not reflect sales charges, if applicable, as of the last business day of the period.
(5) The Ratios of Expenses and Net Investment Income reflect the rebate of certain Fund expenses in connection with the investments in Morgan Stanley affiliates during the period. The effect of the rebate on the ratios is disclosed in the above table as "Ratio of Rebate from Morgan Stanley Affiliates to Average Net Assets."
(6) Effective September 16, 2013, the Adviser has agreed to limit the ratio of expenses to average net assets to the maximum ratio of 1.25% for Class A shares. Prior to September 16, 2013, the maximum ratio was 1.15% for Class A shares.
The accompanying notes are an integral part of the financial statements.
21
Morgan Stanley Institutional Fund, Inc.
Annual Report — December 31, 2017
Financial Highlights
Active International Allocation Portfolio
| | | Class L | |
| | | Year Ended December 31, | |
Selected Per Share Data and Ratios | | 2017 | | 2016(1) | | 2015 | | 2014 | | 2013 | |
Net Asset Value, Beginning of Period | | $ | 12.04 | | | $ | 12.41 | | | $ | 12.74 | | | $ | 13.97 | | | $ | 11.84 | | |
Income (Loss) from Investment Operations: | |
Net Investment Income(2) | | | 0.07 | | | | 0.14 | | | | 0.11 | | | | 0.23 | | | | 0.12 | | |
Net Realized and Unrealized Gain (Loss) | | | 2.79 | | | | (0.35 | ) | | | (0.42 | ) | | | (1.23 | ) | | | 2.27 | | |
Total from Investment Operations | | | 2.86 | | | | (0.21 | ) | | | (0.31 | ) | | | (1.00 | ) | | | 2.39 | | |
Distributions from and/or in Excess of: | |
Net Investment Income | | | (0.17 | ) | | | (0.16 | ) | | | (0.02 | ) | | | (0.23 | ) | | | (0.26 | ) | |
Redemption Fees | | | 0.00 | (3) | | | 0.00 | (3) | | | 0.00 | (3) | | | 0.00 | (3) | | | 0.00 | (3) | |
Net Asset Value, End of Period | | $ | 14.73 | | | $ | 12.04 | | | $ | 12.41 | | | $ | 12.74 | | | $ | 13.97 | | |
Total Return(4) | | | 23.80 | % | | | (1.68 | )% | | | (2.44 | )% | | | (7.17 | )% | | | 20.34 | % | |
Ratios and Supplemental Data: | |
Net Assets, End of Period (Thousands) | | $ | 6,463 | | | $ | 6,053 | | | $ | 7,495 | | | $ | 8,606 | | | $ | 10,345 | | |
Ratio of Expenses to Average Net Assets(7) | | | 1.73 | %(5) | | | 1.74 | %(5) | | | 1.74 | %(5) | | | 1.73 | %(5) | | | 1.61 | %(5)(6) | |
Ratio of Expenses to Average Net Assets Excluding Non Operating Expenses | | | N/A | | | | N/A | | | | N/A | | | | N/A | | | | 1.66 | %(5)(6) | |
Ratio of Net Investment Income to Average Net Assets(7) | | | 0.54 | %(5) | | | 1.20 | %(5) | | | 0.82 | %(5) | | | 1.68 | %(5) | | | 0.94 | %(5) | |
Ratio of Rebate from Morgan Stanley Affiliates to Average Net Assets | | | 0.02 | % | | | 0.01 | % | | | 0.01 | % | | | 0.02 | % | | | 0.02 | % | |
Portfolio Turnover Rate | | | 22 | % | | | 40 | % | | | 30 | % | | | 32 | % | | | 36 | % | |
(7) Supplemental Information on the Ratios to Average Net Assets: | |
Ratios Before Expense Limitation: | |
Expenses to Average Net Assets | | | 2.07 | % | | | 1.93 | % | | | 1.87 | % | | | 1.87 | % | | | 1.76 | % | |
Net Investment Income to Average Net Assets | | | 0.20 | % | | | 1.01 | % | | | 0.69 | % | | | 1.54 | % | | | 0.79 | % | |
(1) Reflects prior period custodian out-of-pocket expenses that were reimbursed in September 2016. The amount of the reimbursement was immaterial on a per share basis and did not impact the total return of Class L shares. The Ratio of Expenses to Average Net Assets and the Ratio of Net Investment Income to Average Net Assets would be unchanged as the reimbursement of custodian fees was offset against expense waivers/reimbursements with no impact to net expenses or net investment income.
(2) Per share amount is based on average shares outstanding.
(3) Amount is less than $0.005 per share.
(4) Calculated based on the net asset value as of the last business day of the period.
(5) The Ratios of Expenses and Net Investment Income reflect the rebate of certain Fund expenses in connection with the investments in Morgan Stanley affiliates during the period. The effect of the rebate on the ratios is disclosed in the above table as "Ratio of Rebate from Morgan Stanley Affiliates to Average Net Assets."
(6) Effective September 16, 2013, the Adviser has agreed to limit the ratio of expenses to average net assets to the maximum ratio of 1.75% for Class L shares. Prior to September 16, 2013, the maximum ratio was 1.65% for Class L shares.
The accompanying notes are an integral part of the financial statements.
22
Morgan Stanley Institutional Fund, Inc.
Annual Report — December 31, 2017
Financial Highlights
Active International Allocation Portfolio
| | | Class C | |
| | | Year Ended December 31, | | Period from
April 30, 2015(2) to | |
Selected Per Share Data and Ratios | | 2017 | | 2016(1) | | December 31, 2015 | |
Net Asset Value, Beginning of Period | | $ | 12.15 | | | $ | 12.38 | | | $ | 13.94 | | |
Income (Loss) from Investment Operations: | |
Net Investment Income (Loss)(3) | | | (0.00 | )(4) | | | 0.14 | | | | (0.00 | )(4) | |
Net Realized and Unrealized Gain (Loss) | | | 2.83 | | | | (0.37 | ) | | | (1.53 | ) | |
Total from Investment Operations | | | 2.83 | | | | (0.23 | ) | | | (1.53 | ) | |
Distributions from and/or in Excess of: | |
Net Investment Income | | | (0.21 | ) | | | — | | | | (0.03 | ) | |
Redemption Fees | | | 0.00 | (4) | | | 0.00 | (4) | | | 0.00 | (4) | |
Net Asset Value, End of Period | | $ | 14.77 | | | $ | 12.15 | | | $ | 12.38 | | |
Total Return(5) | | | 23.42 | % | | | (1.94 | )% | | | (10.96 | )%(7) | |
Ratios and Supplemental Data: | |
Net Assets, End of Period (Thousands) | | $ | 23 | | | $ | 9 | | | $ | 32 | | |
Ratio of Expenses to Average Net Assets(9) | | | 1.97 | %(6) | | | 1.99 | %(6) | | | 1.99 | %(6)(8) | |
Ratio of Net Investment Income (Loss) to Average Net Assets(9) | | | (0.03 | )%(6) | | | 1.19 | %(6) | | | (0.04 | )%(6)(8) | |
Ratio of Rebate from Morgan Stanley Affiliates to Average Net Assets | | | 0.03 | % | | | 0.01 | % | | | 0.01 | %(8) | |
Portfolio Turnover Rate | | | 22 | % | | | 40 | % | | | 30 | % | |
(9) Supplemental Information on the Ratios to Average Net Assets: | |
Ratios Before Expense Limitation: | |
Expense to Average Net Assets | | | 20.06 | % | | | 8.58 | % | | | 4.26 | %(8) | |
Net Investment Loss to Average Net Assets | | | (18.12 | )% | | | (5.40 | )% | | | (2.31 | )%(8) | |
(1) Reflects prior period custodian out-of-pocket expenses that were reimbursed in September 2016. The amount of the reimbursement was immaterial on a per share basis and did not impact the total return of Class C shares. The Ratio of Expenses to Average Net Assets and the Ratio of Net Investment Income to Average Net Assets would be unchanged as the reimbursement of custodian fees was offset against expense waivers/reimbursements with no impact to net expenses or net investment income.
(2) Commencement of Offering.
(3) Per share amount is based on average shares outstanding.
(4) Amount is less than $0.005 per share.
(5) Calculated based on the net asset value which does not reflect sales charges, if applicable, as of the last business day of the period.
(6) The Ratios of Expenses and Net Investment Income (Loss) reflect the rebate of certain Fund expenses in connection with the investments in Morgan Stanley affiliates during the period. The effect of the rebate on the ratios is disclosed in the above table as "Ratio of Rebate from Morgan Stanley Affiliates to Average Net Assets."
(7) Not annualized.
(8) Annualized.
The accompanying notes are an integral part of the financial statements.
23
Morgan Stanley Institutional Fund, Inc.
Annual Report — December 31, 2017
Notes to Financial Statements
Morgan Stanley Institutional Fund, Inc. (the "Company") is registered under the Investment Company Act of 1940, as amended (the "Act"), as an open-end management investment company. The Company is comprised of twenty-nine separate, active, diversified and non-diversified funds (individually referred to as a "Fund", collectively as the "Funds"). The Company applies investment company accounting and reporting guidance.
The accompanying financial statements relate to the Active International Allocation Portfolio. The Fund seeks long-term capital appreciation by investing primarily, in accordance with country and sector weightings determined by Morgan Stanley Investment Management Inc. (the "Adviser") and/or Morgan Stanley Investment Management Company ("MSIM Company") (the "Sub- Adviser"), in equity securities of non-U.S. issuers which, in the aggregate, replicate broad market indices.
The Fund offers four classes of shares — Class I, Class A, Class L and Class C. On April 30, 2015, the Fund suspended offering of Class L shares. Existing Class L shareholders may invest through reinvestment of dividends and distributions.
A. Significant Accounting Policies: The following significant accounting policies are in conformity with U.S. generally accepted accounting principles ("GAAP"). Such policies are consistently followed by the Company in the preparation of its financial statements. GAAP may require management to make estimates and assumptions that affect the reported amounts and disclosures in the financial statements. Actual results may differ from those estimates.
1. Security Valuation: (1) An equity portfolio security listed or traded on an exchange is valued at its latest reported sales price (or at the exchange official closing price if such exchange reports an official closing price), and if there were no sales on a given day and if there is no official exchange closing price for that day, the security is valued at the mean between the last reported bid and asked prices if such bid and asked prices are available on the relevant exchanges. Listed equity securities not traded on the valuation date with no reported bid and asked prices available on the exchange are valued at the mean between the current bid and asked prices obtained from one or more reputable brokers or dealers. In cases where a security is traded on more than one exchange, the security is valued on the exchange designated as the primary market; (2) all other equity portfolio securities for which over-the-counter ("OTC") market quotations are readily available
are valued at the latest reported sales price (or at the market official closing price if such market reports an official closing price), and if there was no trading in the security on a given day and if there is no official closing price from relevant markets for that day, the security is valued at the mean between the last reported bid and asked prices if such bid and asked prices are available on the relevant markets. An unlisted equity security that does not trade on the valuation date and for which bid and asked prices from the relevant markets are unavailable is valued at the mean between the current bid and asked prices obtained from one or more reputable brokers or dealers; (3) certain portfolio securities may be valued by an outside pricing service/vendor approved by the Company's Board of Directors (the "Directors"). The pricing service/vendor may employ a pricing model that takes into account, among other things, bids, yield spreads, and/or other market data and specific security characteristics. Alternatively, if a valuation is not available from an outside pricing service/vendor, and the security trades on an exchange, the security may be valued at its latest reported sale price (or at the exchange official closing price if such exchange reports an official closing price), prior to the time when assets are valued. If there are no sales on a given day and if there is no official exchange closing price for that day, the security is valued at the mean between the last reported bid and asked prices if such bid and asked prices are available in the relevant exchanges; (4) futures are valued at the settlement price on the exchange on which they trade or, if a settlement price is unavailable, at the last sale price on the exchange; (5) when market quotations are not readily available, including circumstances under which the Adviser or Sub-Advisers determine that the closing price, last sale price or the mean between the last reported bid and asked prices are not reflective of a security's market value, portfolio securities are valued at their fair value as determined in good faith under procedures established by and under the general supervision of the Directors. Occasionally, developments affecting the closing prices of securities and other assets may occur between the times at which valuations of such securities are determined (that is, close of the foreign market on which the securities trade) and the close of business of the New York Stock Exchange ("NYSE"). If developments occur during such periods that are expected to materially affect the value of such securities, such valuations may be adjusted to reflect the estimated fair value of such securities as of the close of the
24
Morgan Stanley Institutional Fund, Inc.
Annual Report — December 31, 2017
Notes to Financial Statements (cont'd)
NYSE, as determined in good faith by the Directors or by the Adviser using a pricing service and/or procedures approved by the Directors; (6) quotations of foreign portfolio securities, other assets and liabilities and forward contracts stated in foreign currency are translated into U.S. dollar equivalents at the prevailing market rates prior to the close of the NYSE; and (7) investments in mutual funds, including the Morgan Stanley Institutional Liquidity Funds, are valued at the net asset value ("NAV") as of the close of each business day.
The Directors have responsibility for determining in good faith the fair value of the investments, and the Directors may appoint others, such as the Company's Adviser or a valuation committee, to assist the Directors in determining fair value and to make the actual calculations pursuant to the fair valuation methodologies previously approved by the Directors. Under procedures approved by the Directors, the Company's Adviser has formed a Valuation Committee whose members are approved by the Directors. The Valuation Committee provides administration and oversight of the Company's valuation policies and procedures, which are reviewed at least annually by the Directors. These procedures allow the Company to utilize independent pricing services, quotations from securities and financial instrument dealers, and other market sources to determine fair value.
The Company has procedures to determine the fair value of securities and other financial instruments for which market prices are not readily available. Under these procedures, the Valuation Committee convenes on a regular and ad hoc basis to review such securities and considers a number of factors, including valuation methodologies and significant unobservable valuation inputs, when arriving at fair value. The Valuation Committee may employ a market-based approach which may use related or comparable assets or liabilities, recent transactions, market multiples, book values, and other relevant information for the investment to determine the fair value of the investment. An income-based valuation approach may also be used in which the anticipated future cash flows of the investment are discounted to calculate fair value. Discounts may also be applied due to the nature or duration of any restrictions on the disposition of the investments. Due to the inherent uncertainty of valuations of such investments, the fair values may differ significantly from the values that would have
been used had an active market existed. The Valuation Committee employs various methods for calibrating these valuation approaches including a regular review of valuation methodologies, key inputs and assumptions, transactional back-testing or disposition analysis, and reviews of any related market activity.
2. Fair Value Measurement: Financial Accounting Standards Board ("FASB") Accounting Standards CodificationTM ("ASC") 820, "Fair Value Measurement" ("ASC 820"), defines fair value as the value that the Fund would receive to sell an investment or pay to transfer a liability in a timely transaction with an independent buyer in the principal market, or in the absence of a principal market, the most advantageous market for the investment or liability. ASC 820 establishes a three-tier hierarchy to distinguish between (1) inputs that reflect the assumptions market participants would use in valuing an asset or liability developed based on market data obtained from sources independent of the reporting entity (observable inputs) and (2) inputs that reflect the reporting entity's own assumptions about the assumptions market participants would use in valuing an asset or liability developed based on the best information available in the circumstances (unobservable inputs) and to establish classification of fair value measurements for disclosure purposes. Various inputs are used in determining the value of the Fund's investments. The inputs are summarized in the three broad levels listed below.
• Level 1 – unadjusted quoted prices in active markets for identical investments
• Level 2 – other significant observable inputs (including quoted prices for similar investments, interest rates, prepayment speeds, credit risk, etc.)
• Level 3 – significant unobservable inputs including the Fund's own assumptions in determining the fair value of investments. Factors considered in making this determination may include, but are not limited to, information obtained by contacting the issuer, analysts, or the appropriate stock exchange (for exchange-traded securities), analysis of the issuer's financial statements or other available documents and, if necessary, available information concerning other securities in similar circumstances
25
Morgan Stanley Institutional Fund, Inc.
Annual Report — December 31, 2017
Notes to Financial Statements (cont'd)
The inputs or methodology used for valuing securities are not necessarily an indication of the risk associated with investing in those securities and the determination of the significance of a particular input to the fair value measurement in its entirety requires judgment and considers factors specific to each security.
The following is a summary of the inputs used to value the Fund's investments as of December 31, 2017.
Investment Type | | Level 1
Unadjusted
quoted
prices
(000) | | Level 2
Other
significant
observable
inputs
(000) | | Level 3
Significant
unobservable
inputs
(000) | | Total
(000) | |
Assets: | |
Common Stocks | |
Aerospace & Defense | | $ | — | | | $ | 3,451 | | | $ | — | | | $ | 3,451 | | |
Air Freight & Logistics | | | — | | | | 795 | | | | — | | | | 795 | | |
Airlines | | | 508 | | | | 270 | | | | — | | | | 778 | | |
Auto Components | | | — | | | | 2,908 | | | | — | | | | 2,908 | | |
Automobiles | | | — | | | | 5,725 | | | | — | | | | 5,725 | | |
Banks | | | 2,267 | | | | 24,899 | | | | — | | | | 27,166 | | |
Beverages | | | — | | | | 4,078 | | | | — | | | | 4,078 | | |
Biotechnology | | | — | | | | 1,396 | | | | — | | | | 1,396 | | |
Building Products | | | — | | | | 1,780 | | | | — | | | | 1,780 | | |
Capital Markets | | | — | | | | 3,361 | | | | — | | | | 3,361 | | |
Chemicals | | | — | | | | 5,309 | | | | — | | | | 5,309 | | |
Commercial Services &
Supplies | | | — | | | | 1,269 | | | | — | | | | 1,269 | | |
Communications
Equipment | | | — | | | | 1,704 | | | | — | | | | 1,704 | | |
Construction &
Engineering | | | — | | | | 2,613 | | | | — | | | | 2,613 | | |
Construction Materials | | | — | | | | 2,672 | | | | — | | | | 2,672 | | |
Consumer Finance | | | — | | | | 268 | | | | — | | | | 268 | | |
Containers & Packaging | | | — | | | | 65 | | | | — | | | | 65 | | |
Diversified Consumer
Services | | | 123 | | | | 16 | | | | — | | | | 139 | | |
Diversified Financial
Services | | | — | | | | 2,087 | | | | — | | | | 2,087 | | |
Diversified
Telecommunication
Services | | | — | | | | 1,227 | | | | — | | | | 1,227 | | |
Electric Utilities | | | — | | | | 2,757 | | | | — | | | | 2,757 | | |
Electrical Equipment | | | — | | | | 1,747 | | | | — | | | | 1,747 | | |
Electronic Equipment,
Instruments &
Components | | | — | | | | 3,891 | | | | — | | | | 3,891 | | |
Energy Equipment &
Services | | | — | | | | 118 | | | | — | | | | 118 | | |
Equity Real Estate
Investment
Trusts (REITs) | | | — | | | | 2,197 | | | | — | | | | 2,197 | | |
Food & Staples Retailing | | | — | | | | 1,137 | | | | — | | | | 1,137 | | |
Food Products | | | 122 | | | | 7,310 | | | | — | | | | 7,432 | | |
Gas Utilities | | | — | | | | 353 | | | | — | | | | 353 | | |
Health Care Equipment &
Supplies | | | 16 | | | | 2,549 | | | | — | | | | 2,565 | | |
Investment Type | | Level 1
Unadjusted
quoted
prices
(000) | | Level 2
Other
significant
observable
inputs
(000) | | Level 3
Significant
unobservable
inputs
(000) | | Total
(000) | |
Common Stocks (cont'd) | |
Health Care Providers &
Services | | $ | — | | | $ | 874 | | | $ | — | | | $ | 874 | | |
Health Care Technology | | | — | | | | 3 | | | | — | | | | 3 | | |
Hotels, Restaurants &
Leisure | | | 88 | | | | 3,005 | | | | — | | | | 3,093 | | |
Household Durables | | | — | | | | 3,289 | | | | — | | | | 3,289 | | |
Household Products | | | — | | | | 2,200 | | | | — | | | | 2,200 | | |
Independent Power and
Renewable Electricity
Producers | | | — | | | | 219 | | | | — | | | | 219 | | |
Industrial Conglomerates | | | — | | | | 2,765 | | | | — | | | | 2,765 | | |
Information Technology
Services | | | — | | | | 2,442 | | | | — | | | | 2,442 | | |
Insurance | | | — | | | | 9,154 | | | | — | | | | 9,154 | | |
Internet & Direct
Marketing Retail | | | 519 | | | | 22 | | | | — | | | | 541 | | |
Internet Software &
Services | | | 5,017 | | | | 5,762 | | | | — | | | | 10,779 | | |
Leisure Products | | | — | | | | 468 | | | | — | | | | 468 | | |
Life Sciences Tools &
Services | | | — | | | | 211 | | | | — | | | | 211 | | |
Machinery | | | — | | | | 4,548 | | | | — | | | | 4,548 | | |
Marine | | | — | | | | 918 | | | | — | | | | 918 | | |
Media | | | — | | | | 1,302 | | | | — | | | | 1,302 | | |
Metals & Mining | | | 529 | | | | 2,213 | | | | — | | | | 2,742 | | |
Multi-Line Retail | | | — | | | | 437 | | | | — | | | | 437 | | |
Multi-Utilities | | | — | | | | 1,846 | | | | — | | | | 1,846 | | |
Oil, Gas & Consumable
Fuels | | | — | | | | 6,970 | | | | — | | | | 6,970 | | |
Paper & Forest Products | | | — | | | | 896 | | | | — | | | | 896 | | |
Personal Products | | | — | | | | 4,712 | | | | — | | | | 4,712 | | |
Pharmaceuticals | | | — | | | | 12,066 | | | | — | | | | 12,066 | | |
Professional Services | | | — | | | | 4,493 | | | | — | | | | 4,493 | | |
Real Estate
Management &
Development | | | 143 | | | | 4,385 | | | | — | @ | | | 4,528 | | |
Road & Rail | | | — | | | | 2,704 | | | | — | | | | 2,704 | | |
Semiconductors &
Semiconductor
Equipment | | | — | | | | 3,305 | | | | — | | | | 3,305 | | |
Software | | | — | | | | 4,270 | | | | — | | | | 4,270 | | |
Specialty Retail | | | — | | | | 1,240 | | | | — | | | | 1,240 | | |
Tech Hardware,
Storage & Peripherals | | | — | | | | 1,166 | | | | — | | | | 1,166 | | |
Textiles, Apparel &
Luxury Goods | | | — | | | | 2,493 | | | | — | | | | 2,493 | | |
Thrifts & Mortgage Finance | | | — | | | | 643 | | | | — | | | | 643 | | |
Tobacco | | | — | | | | 3,182 | | | | — | | | | 3,182 | | |
Trading Companies &
Distributors | | | — | | | | 2,526 | | | | — | | | | 2,526 | | |
Transportation
Infrastructure | | | — | | | | 1,081 | | | | — | | | | 1,081 | | |
Water Utilities | | | — | | | | 39 | | | | — | | | | 39 | | |
Wireless
Telecommunication
Services | | | — | | | | 1,618 | | | | — | | | | 1,618 | | |
Total Common Stocks | | | 9,332 | | | | 187,419 | | | | — | @ | | | 196,751 | | |
26
Morgan Stanley Institutional Fund, Inc.
Annual Report — December 31, 2017
Notes to Financial Statements (cont'd)
Investment Type | | Level 1
Unadjusted
quoted
prices
(000) | | Level 2
Other
significant
observable
inputs
(000) | | Level 3
Significant
unobservable
inputs
(000) | | Total
(000) | |
Rights | | $ | 7 | | | $ | — | | | $ | — | | | $ | 7 | | |
Short-Term Investments | |
Investment Company | | | 27,978 | | | | — | | | | — | | | | 27,978 | | |
Repurchase Agreements | | | — | | | | 100 | | | | — | | | | 100 | | |
Total Short-Term
Investments | | | 27,978 | | | | 100 | | | | — | | | | 28,078 | | |
Foreign Currency Forward
Exchange Contract | | | — | | | | 215 | | | | — | | | | 215 | | |
Futures Contracts | | | 716 | | | | — | | | | — | | | | 716 | | |
Total Assets | | | 38,033 | | | | 187,734 | | | | — | @ | | | 225,767 | | |
Liabilities: | |
Foreign Currency Forward
Exchange Contract | | | — | | | | (15 | ) | | | — | | | | (15 | ) | |
Futures Contracts | | | (62 | ) | | | — | | | | — | | | | (62 | ) | |
Total Liabilities | | | (62 | ) | | | (15 | ) | | | — | | | | (77 | ) | |
Total | | $ | 37,971 | | | $ | 187,719 | | | $ | — | @ | | $ | 225,690 | | |
@ Value is less than $500.
Transfers between investment levels may occur as the markets fluctuate and/or the availability of data used in an investment's valuation changes. The Fund recognizes transfers between the levels as of the end of the period. As of December 31, 2017, securities with a total value of approximately $166,951,000 transferred from Level 1 to Level 2. Securities that were valued using unadjusted quoted prices at December 31, 2016 were valued using other significant observable inputs at December 31, 2017. At December 31, 2017, the fair value of certain securities were adjusted due to developments which occurred between the time of the close of the foreign markets on which they trade and the close of business on the NYSE which resulted in their Level 2 classification.
Following is a reconciliation of investments in which significant unobservable inputs (Level 3) were used in determining fair value.
| | | Common
Stocks
(000) | |
Beginning Balance | | $ | 2 | | |
Purchases | | | — | | |
Sales | | | — | | |
Amortization of discount | | | — | | |
Transfers in | | | — | | |
Transfers out | | | — | | |
Corporate actions | | | — | | |
Change in unrealized appreciation (depreciation) | | | (2 | ) | |
Realized gains (losses) | | | — | | |
Ending Balance | | $ | — | @ | |
Net change in unrealized appreciation (depreciation) from investments
still held as of December 31, 2017 | | $ | (2 | ) | |
@ Value is less than $500.
3. Repurchase Agreements: The Fund may enter into repurchase agreements under which the Fund lends cash and takes possession of securities with an agreement that the counterparty will repurchase such securities. In connection with transactions in repurchase agreements, a bank as custodian for the Fund takes possession of the underlying securities which are held as collateral, with a market value at least equal to the amount of the repurchase transaction, including principal and accrued interest. To the extent that any repurchase transaction exceeds one business day, the value of the collateral is marked-to-market on a daily basis to determine that the value of the collateral does not decrease below the repurchase price plus accrued interest as earned. If such a decrease occurs, additional collateral will be requested and, when received, will be added to the account to maintain full collateralization. In the event of default on the obligation to repurchase, the Fund has the right to liquidate the collateral and apply the proceeds in satisfaction of the obligation. In the event of default or bankruptcy by the counterparty to the agreement, realization of the collateral proceeds may be subject to cost and delays. The Fund, along with other affiliated investment companies, may utilize a joint trading account for the purpose of entering into repurchase agreements.
4. Foreign Currency Translation and Foreign Investments: The books and records of the Fund are maintained in U.S. dollars. Foreign currency amounts are translated into U.S. dollars as follows:
– investments, other assets and liabilities at the prevailing rate of exchange on the valuation date;
– investment transactions and investment income at the prevailing rates of exchange on the dates of such transactions.
Although the net assets of the Fund are presented at the foreign exchange rates and market values at the close of the period, the Fund does not isolate that portion of the results of operations arising as a result of changes in the foreign exchange rates from the fluctuations arising from changes in the market prices of securities held at period end. Similarly, the Fund does not isolate the effect of changes in foreign exchange rates from the fluctuations arising from changes in the market prices of securities sold during the period. Accordingly, realized and unrealized foreign currency gains (losses) on investments in securities are included in the reported net
27
Morgan Stanley Institutional Fund, Inc.
Annual Report — December 31, 2017
Notes to Financial Statements (cont'd)
realized and unrealized gains (losses) on investment transactions and balances. However, pursuant to U.S. federal income tax regulations, gains and losses from certain foreign currency transactions and the foreign currency portion of gains and losses realized on sales and maturities of foreign denominated debt securities are treated as ordinary income for U.S. federal income tax purposes.
Net realized gains (losses) on foreign currency transactions represent net foreign exchange gains (losses) from foreign currency forward exchange contracts, disposition of foreign currencies, currency gains (losses) realized between the trade and settlement dates on securities transactions, and the difference between the amount of investment income and foreign withholding taxes recorded on the Fund's books and the U.S. dollar equivalent amounts actually received or paid. Net unrealized currency gains (losses) from valuing foreign currency denominated assets and liabilities at period end exchange rates are reflected as a component of unrealized appreciation (depreciation) in the Statement of Assets and Liabilities. The change in unrealized currency gains (losses) on foreign currency translations for the period is reflected in the Statement of Operations.
Foreign security and currency transactions may involve certain considerations and risks not typically associated with those of U.S. dollar denominated transactions as a result of, among other factors, fluctuations of exchange rates in relation to the U.S. dollar, the possibility of lower levels of governmental supervision and regulation of foreign securities markets and the possibility of political or economic instability.
Governmental approval for foreign investments may be required in advance of making an investment under certain circumstances in some countries, and the extent of foreign investments in domestic companies may be subject to limitation in other countries. Foreign ownership limitations also may be imposed by the charters of individual companies to prevent, among other concerns, violations of foreign investment limitations. As a result, an additional class of shares (identified as "Foreign" in the Portfolio of Investments) may be created and offered for investment. The "local" and "foreign shares" market values may differ. In the absence of trading of the foreign shares in such markets, the Fund values the foreign shares at the closing exchange price of the local shares.
5. Derivatives: The Fund may, but is not required to, use derivative instruments for a variety of purposes, including hedging, risk management, portfolio management or to earn income. Derivatives are financial instruments whose value is based, in part, on the value of an underlying asset, interest rate, index or financial instrument. Prevailing interest rates and volatility levels, among other things, also affect the value of derivative instruments. A derivative instrument often has risks similar to its underlying asset and may have additional risks, including imperfect correlation between the value of the derivative and the underlying asset, risks of default by the counterparty to certain transactions, magnification of losses incurred due to changes in the market value of the securities, instruments, indices or interest rates to which the derivative instrument relates, risks that the transactions may not be liquid and risks arising from margin requirements. The use of derivatives involves risks that are different from, and possibly greater than, the risks associated with other portfolio investments. Derivatives may involve the use of highly specialized instruments that require investment techniques and risk analyses different from those associated with other portfolio investments. All of the Fund's holdings, including derivative instruments, are marked-to-market each day with the change in value reflected in unrealized appreciation (depreciation). Upon disposition, a realized gain or loss is recognized.
Certain derivative transactions may give rise to a form of leverage. Leverage magnifies the potential for gain and the risk of loss. Leverage associated with derivative transactions may cause the Fund to liquidate portfolio positions when it may not be advantageous to do so to satisfy its obligations or to meet earmarking or segregation requirements, pursuant to applicable Securities and Exchange Commission ("SEC") rules and regulations, or may cause the Fund to be more volatile than if the Fund had not been leveraged. Although the Adviser and/or Sub-Adviser seek to use derivatives to further the Fund's investment objectives, there is no assurance that the use of derivatives will achieve this result.
Following is a description of the derivative instruments and techniques that the Fund used during the period and their associated risks:
Futures: A futures contract is a standardized, exchange-traded agreement to buy or sell a specific quantity of an underlying asset, reference rate or index at a specific
28
Morgan Stanley Institutional Fund, Inc.
Annual Report — December 31, 2017
Notes to Financial Statements (cont'd)
price at a specific future time. The value of a futures contract tends to increase and decrease in tandem with the value of the underlying instrument. Depending on the terms of the particular contract, futures contracts are settled through either physical delivery of the underlying instrument on the settlement date or by payment of a cash settlement amount on the settlement date. During the period the futures contract is open, payments are received from or made to the broker based upon changes in the value of the contract (the variation margin). A decision as to whether, when and how to use futures contracts involves the exercise of skill and judgment and even a well-conceived futures transaction may be unsuccessful because of market behavior or unexpected events. In addition to the derivatives risks discussed above, the prices of futures contracts can be highly volatile, using futures contracts can lower total return, and the potential loss from futures contracts can exceed the Fund's initial investment in such contracts. No assurance can be given that a liquid market will exist for any particular futures contract at any particular time. There is also the risk of loss by the Fund of margin deposits in the event of bankruptcy of a broker with which the Fund has open positions in the futures contract.
Foreign Currency Forward Exchange Contracts: In connection with its investments in foreign securities, the Fund also entered into contracts with banks, brokers or dealers to purchase or sell securities or foreign currencies at a future date. A foreign currency forward exchange contract ("currency contract") is a negotiated agreement between the contracting parties to exchange a specified amount of currency at a specified future time at a specified rate. The rate can be higher or lower than the spot rate between the currencies that are the subject of the contract. Currency contracts may be used to protect against uncertainty in the level of future foreign currency exchange rates or to gain or modify exposure to a particular currency. To the extent hedged by the use of currency contracts, the precise matching of the currency contract amounts and the value of the securities involved will not generally be possible because the future value of such securities in foreign currencies will change as a consequence of market movements in the value of those securities between the date on which the contract is entered into and the date it matures. Furthermore, such transactions may reduce or preclude the
opportunity for gain if the value of the currency should move in the direction opposite to the position taken. There is additional risk to the extent that currency contracts create exposure to currencies in which the Fund's securities are not denominated. Unanticipated changes in currency prices may result in poorer overall performance for the Fund than if it had not entered into such contracts. The use of currency contracts involves the risk of loss from the insolvency or bankruptcy of the counterparty to the contract or the failure of the counterparty to make payments or otherwise comply with the terms of the contract. A currency contract is marked-to-market daily and the change in market value is recorded by the Fund as unrealized gain or loss. The Fund records realized gains (losses) when the currency contract is closed equal to the difference between the value of the currency contract at the time it was opened and the value at the time it was closed.
FASB ASC 815, "Derivatives and Hedging" ("ASC 815"), is intended to improve financial reporting about derivative instruments by requiring enhanced disclosures to enable investors to better understand how and why the Fund uses derivative instruments, how these derivative instruments are accounted for and their effects on the Fund's financial position and results of operations.
The following tables set forth the fair value of the Fund's derivative contracts by primary risk exposure as of December 31, 2017.
| | | Asset Derivatives
Statement of Assets and
Liabilities Location | | Primary Risk
Exposure | | Value
(000) | |
Foreign Currency Forward
Exchange Contracts
| | Unrealized Appreciation on
Foreign Currency Forward
Exchange Contracts | |
Currency Risk | | $ | 215 | | |
Futures Contracts
| | Variation Margin on
Futures Contracts | |
Equity Risk | | | 716 | (a) | |
Total | | | | | | $ | 931 | | |
| | | Liability Derivatives
Statement of Assets and
Liabilities Location | | Primary Risk
Exposure | | Value
(000) | |
Foreign Currency Forward
Exchange Contracts
| | Unrealized Depreciation on
Foreign Currency Forward
Exchange Contracts | |
Currency Risk | | $ | (15 | ) | |
Futures Contracts
| | Variation Margin on
Futures Contracts | |
Equity Risk | | | (62 | )(a) | |
Total | | | | | | $ | (77 | ) | |
(a) This amount represents the cumulative appreciation (depreciation) as reported in the Portfolio of Investments. The Statement of Assets and Liabilities only reflects the current day's net variation margin.
29
Morgan Stanley Institutional Fund, Inc.
Annual Report — December 31, 2017
Notes to Financial Statements (cont'd)
The following tables set forth by primary risk exposure the Fund's realized gains (losses) and change in unrealized appreciation (depreciation) by type of derivative contract for the year ended December 31, 2017 in accordance with ASC 815.
Realized Gain (Loss) | |
Primary Risk Exposure | | Derivative Type | | Value
(000) | |
Currency Risk | | Foreign Currency Forward
Exchange Contracts | | $ | 687 | | |
Equity Risk | | Futures Contracts | | | 5,743 | | |
Total | | | | $ | 6,430 | | |
Change in Unrealized Appreciation (Depreciation) | |
Primary Risk Exposure | | Derivative Type | | Value
(000) | |
Currency Risk | | Foreign Currency Forward
Exchange Contracts | | $ | 86 | | |
Equity Risk | | Futures Contracts | | | 505 | | |
Total | | | | $ | 591 | | |
At December 31, 2017, the Fund's derivative assets and liabilities are as follows:
Gross Amounts of Assets and Liabilities
Presented in the Statement of Assets and Liabilities | |
Derivatives(b) | | Assets(c)
(000) | | Liabilities(c)
(000) | |
Foreign Currency Forward
Exchange Contracts | | $ | 215 | | | $ | (15 | ) | |
(b) Excludes exchange traded derivatives.
(c) Absent an event of default or early termination, OTC derivative assets and liabilities are presented gross and not offset in the Statement of Assets and Liabilities.
The Fund typically enters into International Swaps and Derivatives Association, Inc. Master Agreements ("ISDA Master Agreements") or similar master agreements (collectively, "Master Agreements") with its contract counterparties for certain OTC derivatives in order to, among other things, reduce its credit risk to counterparties. ISDA Master Agreements include provisions for general obligations, representations, collateral and events of default or termination. Under an ISDA Master Agreement, the Fund typically may offset with the counterparty certain OTC derivative financial instruments' payables and/or receivables with collateral held and/or posted and create one single net payment (close-out netting) in the event of default, termination and/or potential deterioration in the credit quality of the counterparty. Various Master Agreements govern the terms of certain transactions with counterparties, including transactions such as swap, forward, repurchase and reverse repurchase agreements. These Master Agreements typically attempt to reduce the counterparty risk associated with such transactions by specifying credit
protection mechanisms and providing standardization that improves legal certainty. Cross-termination provisions under Master Agreements typically provide that a default in connection with one transaction between the Fund and a counterparty gives the non-defaulting party the right to terminate any other transactions in place with the defaulting party to create one single net payment due to/due from the defaulting party and may be a feature in certain Master Agreements. In the event the Fund exercises its right to terminate a Master Agreement after a counterparty experiences a termination event as defined in the Master Agreement, the return of collateral with market value in excess of the Fund's net liability may be delayed or denied.
The following tables present derivative financial instruments that are subject to enforceable netting arrangements as of December 31, 2017.
Gross Amounts Not Offset in the Statement of Assets and Liabilities | |
Counterparty | | Gross Asset
Derivatives
Presented in
Statement of
Assets and
Liabilities
(000) | | Financial
Instrument
(000) | | Collateral
Received
(000) | | Net Amount
(not less
than $0)
(000) | |
Goldman Sachs International | | $ | 66 | | | $ | — | | | $ | — | | | $ | 66 | | |
JPMorgan Chase Bank NA | | | 95 | | | | — | | | | — | | | | 95 | | |
State Street Bank and
Trust Co. | | | 54 | | | | (12 | ) | | | — | | | | 42 | | |
Total | | $ | 215 | | | $ | (12 | ) | | $ | — | | | $ | 203 | | |
Gross Amounts Not Offset in the Statement of Assets and Liabilities | |
Counterparty | | Gross Liability
Derivatives
Presented in
Statement of
Assets and
Liabilities
(000) | | Financial
Instrument
(000) | | Collateral
Pledged
(000) | | Net Amount
(not less
than $0)
(000) | |
Citibank NA | | $ | 3 | | | $ | — | | | $ | — | | | $ | 3 | | |
State Street Bank and
Trust Co. | | | 12 | | | | (12 | ) | | | — | | | | 0 | | |
Total | | $ | 15 | | | $ | (12 | ) | | $ | — | | | $ | 3 | | |
For the year ended December 31, 2017, the approximate average monthly amount outstanding for each derivative type is as follows:
Foreign Currency Forward Exchange Contracts: | |
Average monthly principal amount | | $ | 32,897,000 | | |
Futures Contracts: | |
Average monthly original value | | $ | 42,569,000 | | |
6. Securities Lending: The Fund lends securities to qualified financial institutions, such as broker-dealers, to
30
Morgan Stanley Institutional Fund, Inc.
Annual Report — December 31, 2017
Notes to Financial Statements (cont'd)
earn additional income. Any increase or decrease in the fair value of the securities loaned that might occur and any interest earned or dividends declared on those securities during the term of the loan would remain in the Fund. The Fund would receive cash or securities as collateral in an amount equal to or exceeding 100% of the current fair value of the loaned securities. The collateral is marked-to-market daily by State Street Bank and Trust Company ("State Street"), the securities lending agent, to ensure that a minimum of 100% collateral coverage is maintained.
Based on pre-established guidelines, the securities lending agent invests any cash collateral that is received in an affiliated money market portfolio and repurchase agreements. Securities lending income is generated from the earnings on the invested collateral and borrowing fees, less any rebates owed to the borrowers and compensation to the lending agent, and is recorded as "Income from Securities Loaned — Net" in the Fund's Statement of Operations. Risks in securities lending transactions are that a borrower may not provide additional collateral when required or return the securities when due, and that the value of the short-term investments will be less than the amount of cash collateral plus any rebate that is required to be returned to the borrower.
The Fund has the right under the securities lending agreement to recover the securities from the borrower on demand.
The following table presents financial instruments that are subject to enforceable netting arrangements as of December 31, 2017.
Gross Amounts Not Offset in the Statement of Assets and Liabilities | |
Gross Asset
Amounts
Presented in
Statement of
Assets and
Liabilities
(000) | | Financial
Instrument
(000) | | Collateral
Received
(000) | | Net Amount
(not less
than $0)
(000) | |
| $ | 4,356 | (d) | | $ | — | | | $ | (4,356 | )(e)(f) | | $ | 0 | | |
(d) Represents market value of loaned securities at year end.
(e) The Fund received cash collateral of approximately $373,000, which was subsequently invested in Repurchase Agreements and Morgan Stanley Institutional Liquidity Funds as reported in the Portfolio of Investments. In addition, the Fund received non-cash collateral of approximately $4,087,000 in the form of U.S. Government obligations, which the Fund cannot sell or repledge, and accordingly are not reflected in the Portfolio of Investments.
(f) The actual collateral received is greater than the amount shown here due to overcollateralization.
FASB ASC 860 "Transfers & Servicing: Repurchase-to-Maturity Transactions, Repurchase Financings, and Disclosures", is intended to provide increased transparency about the types of collateral pledged in securities lending transactions and other similar transactions that are accounted for as secured borrowing.
The following table displays a breakdown of transactions accounted for as secured borrowings, the gross obligations by class of collateral pledged, and the remaining contractual maturity of those transactions as of December 31, 2017.
Remaining Contractual Maturity of the Agreements | |
| | | Overnight and
Continuous
(000) | | <30 days
(000) | | Between
30 &
90 days
(000) | | >90 days
(000) | | Total
(000) | |
Securities Lending
Transactions | |
Common Stocks | | $ | 373 | | | $ | — | | | $ | — | | | $ | — | | | $ | 373 | | |
Total Borrowings | | $ | 373 | | | $ | — | | | $ | — | | | $ | — | | | $ | 373 | | |
Gross amount of
recognized liabilities
for securities lending
transactions | | | | | | | | | | | | | | | | | | $ | 373 | | |
7. Redemption Fees: The Fund will assess a 2% redemption fee on Class I shares, Class A shares, Class L shares and Class C shares, which is paid directly to the Fund, for shares redeemed or exchanged within thirty days of purchase, subject to certain exceptions. The redemption fee is designed to protect the Fund and its remaining shareholders from the effects of short-term trading. These fees, if any, are included in the Statements of Changes in Net Assets.
8. Indemnifications: The Company enters into contracts that contain a variety of indemnifications. The Company's maximum exposure under these arrangements is unknown. However, the Company has not had prior claims or losses pursuant to these contracts and expects the risk of loss to be remote.
9. Dividends and Distributions to Shareholders: Dividends and distributions to shareholders are recorded on the ex-dividend date. Dividends from net investment income, if any, are declared and paid annually. Net realized capital gains, if any, are distributed at least annually.
10. Security Transactions, Income and Expenses: Security transactions are accounted for on the trade date (date the order to buy or sell is executed). Realized gains and losses on the sale of investment securities are
31
Morgan Stanley Institutional Fund, Inc.
Annual Report — December 31, 2017
Notes to Financial Statements (cont'd)
determined on the specific identified cost method. Dividend income and other distributions are recorded on the ex-dividend date (except for certain foreign dividends which may be recorded as soon as the Fund is informed of such dividends) net of applicable withholding taxes. Interest income is recognized on the accrual basis except where collection is in doubt. Discounts are accreted and premiums are amortized over the life of the respective securities. Most expenses of the Company can be directly attributed to a particular Fund. Expenses which cannot be directly attributed are apportioned among the Funds based upon relative net assets or other appropriate methods. Income, expenses (other than class specific expenses — distribution and shareholder services, transfer agency and sub transfer agency fees) and realized and unrealized gains or losses are allocated to each class of shares based upon their relative net assets.
The Fund owns shares of real estate investment trusts ("REITs") which report information on the source of their distributions annually in the following calendar year. A portion of distributions received from REITs during the year is estimated to be a return of capital and is recorded as a reduction of their cost.
B. Advisory/Sub-Advisory Fees: The Adviser, a wholly-owned subsidiary of Morgan Stanley, provides the Fund with advisory services under the terms of an Investment Advisory Agreement, paid quarterly, at the annual rate based on the daily net assets as follows:
First $1
billion | | Over $1
billion | |
| | 0.65 | % | | | 0.60 | % | |
For the year ended December 31, 2017, the advisory fee rate (net of waiver/rebate) was equivalent to an annual effective rate of 0.45% of the Fund's average daily net assets.
The Adviser has agreed to reduce its advisory fee and/or reimburse the Fund so that total annual portfolio operating expenses, excluding certain investment related expenses, taxes, interest and other extraordinary expenses (including litigation), will not exceed 0.90% for Class I shares, 1.25% for Class A shares, 1.75% for Class L shares and 2.00% for Class C shares. The fee waivers and/or expense reimbursements will continue for at least one year from the date of the Fund's prospectus or until such time as the Directors act to discontinue all or a portion of such waivers and/or reimbursements when they deem such action is appropriate. For the year ended December 31, 2017, approximately $420,000 of advisory fees were waived
and approximately $138,000 of other expenses were reimbursed by the Adviser pursuant to this arrangement.
The Adviser has entered into a Sub-Advisory Agreement with the Sub-Adviser, a wholly-owned subsidiary of Morgan Stanley. The Sub-Adviser provides the Fund with advisory services subject to the overall supervision of the Adviser and the Fund's Officers and Directors. The Adviser pays the Sub-Adviser on a monthly basis a portion of the net advisory fees the Adviser receives from the Fund.
C. Administration Fees: The Adviser also serves as Administrator to the Company and provides administrative services pursuant to an Administration Agreement for an annual fee, accrued daily and paid monthly, of 0.08% of the Fund's average daily net assets.
Under a Sub-Administration Agreement between the Administrator and State Street, State Street provides certain administrative services to the Company. For such services, the Administrator pays State Street a portion of the fee the Administrator receives from the Fund.
D. Distribution and Shareholder Services Fees: Morgan Stanley Distribution, Inc. ("MSDI" or the "Distributor"), a wholly-owned subsidiary of the Adviser and an indirect subsidiary of Morgan Stanley, serves as the Company's Distributor of Fund shares pursuant to a Distribution Agreement. The Company has adopted a Shareholder Services Plan with respect to Class A shares pursuant to Rule 12b-1 under the Act. Under the Shareholder Services Plan, the Fund pays the Distributor a shareholder services fee, accrued daily and paid monthly, at an annual rate of 0.25% of the Fund's average daily net assets attributable to Class A shares.
The Company has adopted a Distribution and Shareholder Services Plan with respect to Class L shares pursuant to Rule 12b-1 under the Act. Under the Distribution and Shareholder Services Plan, the Fund pays the Distributor a distribution fee, accrued daily and paid monthly, at an annual rate of 0.50% and a shareholder services fee, accrued daily and paid monthly, at an annual rate of 0.25% of the Fund's average daily net assets attributable to Class L shares.
The Company has adopted a Distribution and Shareholder Services Plan with respect to Class C shares pursuant to Rule 12b-1 under the Act. Under the Distribution and Shareholder Services Plan, the Fund pays the Distributor a distribution fee, accrued daily and paid monthly, at an annual rate of 0.75% and a shareholder services fee, accrued daily and paid
32
Morgan Stanley Institutional Fund, Inc.
Annual Report — December 31, 2017
Notes to Financial Statements (cont'd)
monthly, at an annual rate of 0.25% of the Fund's average daily net assets attributable to Class C shares.
The distribution and shareholder services fees are used to support the expenses associated with servicing and maintaining accounts. The Distributor may compensate other parties for providing shareholder support services to investors who purchase Class A, Class L and Class C shares.
E. Dividend Disbursing and Transfer Agent: The Company's dividend disbursing and transfer agent is Boston Financial Data Services, Inc. ("BFDS"). Pursuant to a Transfer Agency Agreement, the Company pays BFDS a fee based on the number of classes, accounts and transactions relating to the Funds of the Company. Effective January 1, 2018, BFDS changed its name to DST Asset Manager Solutions, Inc.
F. Custodian Fees: State Street (the "Custodian") also serves as Custodian for the Company in accordance with a Custodian Agreement. The Custodian holds cash, securities, and other assets of the Company as required by the Act. Custody fees are payable monthly based on assets held in custody, investment purchases and sales activity and account maintenance fees, plus reimbursement for certain out-of-pocket expenses.
G. Security Transactions and Transactions with Affiliates: For the year ended December 31, 2017, purchases and sales of investment securities for the Fund, other than long-term U.S. Government securities and short-term investments, were approximately $44,203,000 and $88,724,000, respectively. There were no purchases and sales of long-term U.S. Government securities for the year ended December 31, 2017.
The Fund invests in the Institutional Class of the Morgan Stanley Institutional Liquidity Funds — Treasury Securities Portfolio (the "Liquidity Funds"), an open-end management investment company managed by the Adviser, both directly and as a portion of the securities held as collateral on loaned securities. Advisory fees paid by the Fund are reduced by an amount equal to its pro-rata share of the advisory and administration fees paid by the Fund due to its investment in the Liquidity Funds. For the year ended December 31, 2017, advisory fees paid were reduced by approximately $54,000 relating to the Fund's investment in the Liquidity Funds.
The Fund had transactions with Mitsubishi UFJ Financial Group, Inc. and its affiliated broker-dealers, which may be deemed affiliates of the Adviser/Administrator, Sub-Adviser and Distributor under Section 17 the Act.
A summary of the Fund's transactions in shares of the affiliated investment companies during the year ended December 31, 2017 is as follows:
Affiliated
Investment
Company | | Value
December 31,
2016
(000) | | Purchases
at Cost
(000) | | Proceeds
from Sales
(000) | | Dividend
Income
(000) | |
Liquidity Funds | | $ | 48,686 | | | $ | 63,753 | | | $ | 84,461 | | | $ | 220 | | |
Mitsubishi UFJ
Financial
Group, Inc. | | | 570 | | | | — | | | | — | | | | 13 | | |
| | | $ | 49,256 | | | $ | 63,753 | | | $ | 84,461 | | | $ | 233 | | |
Affiliated
Investment
Company (cont'd) | | Realized
Gain (Loss)
(000) | | Change in
Unrealized
Appreciation
(Depreciation)
(000) | | Value
December 31,
2017
(000) | |
Liquidity Funds | | $ | — | | | $ | — | | | $ | 27,978 | | |
Mitsubishi UFJ
Financial
Group, Inc. | | | — | | | | 109 | | | | 679 | | |
| | | $ | — | | | $ | 109 | | | $ | 28,657 | | |
The Fund is permitted to purchase and sell securities ("cross-trade") from and to other Morgan Stanley Funds as well as other funds and client accounts for which the Adviser or an affiliate of the Adviser serves as investment adviser, pursuant to procedures approved by the Directors in compliance with Rule 17a-7 under the Act (the "Rule"). Each cross-trade is executed at the current market price in compliance with provisions of the Rule. For the year ended December 31, 2017, the Fund did not engage in any cross-trade transactions.
The Fund has an unfunded Deferred Compensation Plan (the "Compensation Plan"), which allows each independent Director to defer payment of all, or a portion, of the fees he or she receives for serving on the Board of Directors. Each eligible Director generally may elect to have the deferred amounts credited with a return equal to the total return on one or more of the Morgan Stanley funds that are offered as investment options under the Compensation Plan. Appreciation/depreciation and distributions received from these investments are recorded with an offsetting increase/decrease in the deferred compensation obligation and do not affect the NAV of the Fund.
H. Federal Income Taxes: It is the Fund's intention to continue to qualify as a regulated investment company and distribute all of its taxable and tax-exempt income. Accordingly, no provision for federal income taxes is required in the financial statements.
The Fund may be subject to taxes imposed by countries in which it invests. Such taxes are generally based on income and/or capital gains earned or repatriated. Taxes are accrued based on net investment income, net realized gains and net
33
Morgan Stanley Institutional Fund, Inc.
Annual Report — December 31, 2017
Notes to Financial Statements (cont'd)
unrealized appreciation as such income and/or gains are earned. Taxes may also be based on transactions in foreign currency and are accrued based on the value of investments denominated in such currency.
FASB ASC 740-10, "Income Taxes — Overall", sets forth a minimum threshold for financial statement recognition of the benefit of a tax position taken or expected to be taken in a tax return. Management has concluded that there are no significant uncertain tax positions that would require recognition in the financial statements. If applicable, the Fund recognizes interest accrued related to unrecognized tax benefits in "Interest Expense" and penalties in "Other Expenses" in the Statement of Operations. The Fund files tax returns with the U.S. Internal Revenue Service, New York and various states. Generally, each of the tax years in the four-year period ended December 31, 2017, remains subject to examination by taxing authorities.
The tax character of distributions paid may differ from the character of distributions shown in the Statements of Changes in Net Assets due to short-term capital gains being treated as ordinary income for tax purposes. The tax character of distributions paid during fiscal years 2017 and 2016 was as follows:
2017
Distributions
Paid From: | | 2016
Distributions
Paid From: | |
Ordinary
Income
(000) | | Long-Term
Capital Gain
(000) | | Ordinary
Income
(000) | | Long-Term
Capital Gain
(000) | |
| $ | 4,318 | | | $ | — | | | $ | 5,249 | | | $ | — | | |
The amount and character of income and gains to be distributed are determined in accordance with income tax regulations which may differ from GAAP. These book/tax differences are either considered temporary or permanent in nature.
Temporary differences are primarily due to differing book and tax treatments for the timing of the recognition of gains (losses) on certain investment transactions and the timing of the deductibility of certain expenses.
Permanent differences, primarily due to differing treatments of gains (losses) related to foreign currency transactions, an expired capital loss carryforward and basis adjustments on certain equity securities designated as passive foreign investment companies, resulted in the following reclassifications among the components of net assets at December 31, 2017:
Distributions
in Excess of Net
Investment
Income
(000) | | Accumulated
Net Realized
Loss
(000) | | Paid-in-
Capital
(000) | |
| $ | 1,122 | | | $ | 32,383 | | | $ | (33,505 | ) | |
At December 31, 2017, the components of distributable earnings for the Fund on a tax basis were as follows:
Undistributed
Ordinary
Income
(000) | | Undistributed
Long-Term
Capital Gain
(000) | |
| $ | 548 | | | $ | — | | |
At December 31, 2017, the Fund had available for federal income tax purposes unused long-term capital losses of approximately $13,737,000 that do not have an expiration date.
During the year ended December 31, 2017, capital loss carryforwards of approximately $33,505,000 expired for federal income tax purposes.
To the extent that capital loss carryforwards are used to offset any future capital gains realized, no capital gains tax liability will be incurred by the Fund for gains realized and not distributed. To the extent that capital gains are offset, such gains will not be distributed to the shareholders.
During the year ended December 31, 2017, the Fund utilized capital loss carryforwards for U.S. federal income tax purposes of approximately $15,683,000.
I. Credit Facility: The Company and other Morgan Stanley funds participated in a $150,000,000 committed, unsecured revolving line of credit facility (the "Facility") with State Street. This Facility is to be used for temporary emergency purposes or funding of shareholder redemption requests. The interest rate on borrowings is based on the federal funds rate or 1 month LIBOR rate plus a spread. The Facility also has a commitment fee of 0.25% per annum based on the unused portion of the Facility. During the year ended December 31, 2017, the Fund did not have any borrowings under the Facility.
J. Other: At December 31, 2017, the Fund had record owners of 10% or greater. Investment activities of these shareholders could have a material impact on the Fund. The aggregate percentage of such owners was 82.9%.
34
Morgan Stanley Institutional Fund, Inc.
Annual Report — December 31, 2017
Report of Independent Registered Public Accounting Firm
To the Shareholders and Board of Directors of
Morgan Stanley Institutional Fund, Inc. —
Active International Allocation Portfolio
Opinion on the Financial Statements
We have audited the accompanying statement of assets and liabilities of Active International Allocation Portfolio (the "Fund") (one of the funds constituting the Morgan Stanley Institutional Fund, Inc. (the "Company")), including the portfolio of investments, as of December 31, 2017, and the related statement of operations for the year then ended, the statements of changes in net assets for each of the two years in the period then ended, the financial highlights for each of the five years in the period then ended and the related notes (collectively referred to as the "financial statements"). In our opinion, the financial statements present fairly, in all material respects, the financial position of Active International Allocation Portfolio (one of the funds constituting Morgan Stanley Institutional Fund, Inc.) at December 31, 2017, the results of its operations for the year then ended, the changes in its net assets for each of the two years in the period then ended and its financial highlights for each of the five years in the period then ended, in conformity with U.S. generally accepted accounting principles.
Basis for Opinion
These financial statements are the responsibility of the Company's management. Our responsibility is to express an opinion on the Fund's financial statements based on our audits. We are a public accounting firm registered with the Public Company Accounting Oversight Board (United States) ("PCAOB") and are required to be independent with respect to the Company in accordance with the U.S. federal securities law and the applicable rules and regulations of the Securities and Exchange Commission and the PCAOB.
We conducted our audits in accordance with the standards of the PCAOB. Those standards require that we plan and perform the audit to obtain reasonable assurance about whether the financial statements are free of material misstatement, whether due to error or fraud. The Company is not required to have, nor were we engaged to perform, an audit of the Company's internal control over financial reporting. As part of our audits, we are required to obtain an understanding of internal control over financial reporting, but not for the purpose of expressing an opinion on the effectiveness of the Company's internal control over financial reporting. Accordingly, we express no such opinion.
Our audits included performing procedures to assess the risks of material misstatement of the financial statements, whether due to error or fraud, and performing procedures that respond to those risks. Such procedures included examining, on a test basis, evidence regarding the amounts and disclosures in the financial statements. Our procedures included confirmation of securities owned as of December 31, 2017 by correspondence with the custodian and others or by other appropriate auditing procedures where replies from others were not received. Our audits also included evaluating the accounting principles used and significant estimates made by management, as well as evaluating the overall presentation of the financial statements. We believe that our audits provide a reasonable basis for our opinion.

We have served as the auditor of one or more Morgan Stanley investment companies since 2000.
Boston, Massachusetts
February 26, 2018
35
Morgan Stanley Institutional Fund, Inc.
Annual Report — December 31, 2017
Federal Tax Notice (unaudited)
For federal income tax purposes, the following information is furnished with respect to the Fund's earnings for its taxable year ended December 31, 2017. When distributed, certain earnings may be subject to a maximum tax rate of 15% as provided for the Jobs and Growth Tax Relief Reconciliation Act of 2003. The Fund designated up to a maximum of approximately $4,484,000 as taxable at this lower rate.
The Fund intends to pass through foreign tax credits of approximately $576,000 and has derived net income from sources within foreign countries amounting to approximately $5,918,000.
In January, the Fund provides tax information to shareholders for the preceding calendar year.
36
Morgan Stanley Institutional Fund, Inc.
Annual Report — December 31, 2017
Privacy Notice (unaudited)
MORGAN STANLEY INVESTMENT MANAGEMENT INC.
AN IMPORTANT NOTICE CONCERNING OUR U.S. PRIVACY POLICY
We are required by federal law to provide you with a copy of our privacy policy annually. This policy applies to current and former individual investors in funds managed or sponsored by Morgan Stanley Investment Management Inc. ("MSIM") as well as current and former individual clients of MSIM. This policy is not applicable to partnerships, corporations, trusts or other non-individual clients or investors. Please note that we may amend this policy at any time, and will inform you of any changes as required by law.
WE RESPECT YOUR PRIVACY
We appreciate that you have provided us with your personal financial information. We strive to maintain the privacy of such information while we help you achieve your financial objectives. This Notice describes what non-public personal information we collect about you, why we collect it, when we may share it with others and how certain others may use it. It discusses the steps you may take to limit our sharing of certain information about you to affiliated companies in the Morgan Stanley family of companies ("other Morgan Stanley companies"). It also discloses how you may limit use of certain shared information for marketing purposes by other Morgan Stanley branded companies. Throughout this policy, we refer to the non-public information that personally identifies you or your accounts as "personal information.''
1. WHAT PERSONAL INFORMATION DO WE COLLECT ABOUT YOU?
We obtain personal information from applications and other forms you submit to us, from your dealings with us, from consumer reporting agencies, from our Web sites and from third parties and other sources.
For example:
• We may collect information such as your name, address, e-mail address, telephone/fax numbers, assets, income and investment objectives through subscription documents, applications and other forms you submit to us.
• We may obtain information about account balances, your use of account(s) and the types of products and services you prefer to receive from us through your dealings and transactions with us and other sources.
• We may obtain information about your creditworthiness and credit history from consumer reporting agencies.
• We may collect background information from and through third-party vendors to verify representations you have made and to comply with various regulatory requirements.
• If you interact with us through our public and private Web sites, we may collect information that you provide directly through online communications (such as an e-mail address). We may also collect information about your Internet service provider, your domain name, your computer's operating system and Web browser, your use of our Web sites and your product and service preferences, through the use of "cookies." Please consult the Terms of Use of these sites for more details.
2. WHEN DO WE DISCLOSE PERSONAL INFORMATION WE COLLECT ABOUT YOU?
We may disclose personal information we collect about you to other Morgan Stanley companies and to non-affiliated third parties.
a. Information We Disclose to Other Morgan Stanley Companies.
We may disclose personal information to other Morgan Stanley companies for a variety of reasons, including to manage your account(s) effectively, to service and process your transactions, to let you know about products and services offered by us and other Morgan Stanley companies, to manage our business, and as otherwise required or permitted by law. Offers for products and services from other Morgan Stanley companies are developed under conditions designed to safeguard your personal information.
37
Morgan Stanley Institutional Fund, Inc.
Annual Report — December 31, 2017
Privacy Notice (unaudited) (cont'd)
b. Information We Disclose to Non-affiliated Third Parties.
We do not disclose personal information that we collect about you to non-affiliated third parties except to those who provide marketing services on our behalf, to financial institutions with whom we have joint marketing agreements, and as otherwise required or permitted by law. For example, we may disclose personal information to non-affiliated third parties for servicing and processing transactions, to offer our own products and services, to protect against fraud, for institutional risk control, to respond to judicial process or to perform services on our behalf. When we share personal information with a non-affiliated third party, they are required to limit their use of personal information to the particular purpose for which it was shared and they are not allowed to share personal information with others except to fulfill that limited purpose or as may be permitted or required by law.
3. HOW DO WE PROTECT THE SECURITY AND CONFIDENTIALITY OF PERSONAL INFORMATION WE COLLECT ABOUT YOU?
We maintain physical, electronic and procedural security measures to help safeguard the personal information we collect about you. We have internal policies governing the proper handling of client information. Third parties that provide support or marketing services on our behalf may also receive personal information, and we require them to adhere to confidentiality standards with respect to such information.
4. HOW CAN YOU LIMIT THE SHARING OF CERTAIN TYPES OF PERSONAL INFORMATION WITH OTHER MORGAN STANLEY COMPANIES?
We offer you choices as to whether we share with other Morgan Stanley companies the personal information that was collected to determine your eligibility for products and services you request ("eligibility information"). Eligibility information does not include your identification information or personal information pertaining to our transactions or experiences with you. Please note that, even if you direct us not to share eligibility information with other Morgan Stanley companies ("opt-out"), we may still share personal information, including eligibility information, with those companies in circumstances excluded from the opt-out under applicable law, such as to process transactions or to service your account.
5. HOW CAN YOU LIMIT THE USE OF CERTAIN TYPES OF PERSONAL INFORMATION BY OTHER MORGAN STANLEY COMPANIES FOR MARKETING?
By following the opt-out instructions in Section 6 below, you may limit other Morgan Stanley branded companies from marketing their products or services to you based on personal information we disclose to them. This information may include, for example, your income and account history with us. Please note that, even if you choose to limit Other Morgan Stanley Companies from using personal information about you that we may share with them for marketing their products and services to you, Other Morgan Stanley Companies may use your personal information that they obtain from us to market to you in circumstances permitted by law, such as if the Other Morgan Stanley Company has its own relationship with you.
6. HOW CAN YOU SEND US AN OPT-OUT INSTRUCTION?
If you wish to limit our sharing of eligibility information about you with other Morgan Stanley companies or other Morgan Stanley companies' use of personal information for marketing purposes, as described in this notice, you may do so by:
• Calling us at (800) 548-7786
Monday–Friday between 8a.m. and 6p.m.(EST)
• Writing to us at the following address:
DST Asset Manager Solutions, Inc.
c/o Privacy Coordinator
P.O. Box 219804
Kansas City, Missouri 64121
38
Morgan Stanley Institutional Fund, Inc.
Annual Report — December 31, 2017
Privacy Notice (unaudited) (cont'd)
Your written request should include your name, address, telephone number and account number(s) to which the opt-out applies and whether you are opting out with respect to sharing of eligibility information (Section 4 above), or if information used for Marketing (Section 5 above) or both. Written opt-out requests should not be sent with any other correspondence. In order to process your request, we require that the request be provided by you directly and not through a third party.
Your opt-out preference will remain in effect with respect to this policy (as it may be amended) until you notify us otherwise. If you have a joint account, your direction for us not to share this information with other Morgan Stanley companies and for those other Morgan Stanley companies not to use your personal information for marketing will be applied to all account holders on that account. Please understand that if you limit our sharing or our affiliated companies' use of personal information, you and any joint account holder(s) may not receive information about Morgan Stanley products and services, including products or services that could help you manage your financial resources and achieve your investment objectives.
7. WHAT IF AN AFFILIATED COMPANY BECOMES A NON-AFFILIATED THIRD PARTY?
If, at any time in the future, an affiliated company becomes a non-affiliated third party, further disclosures of personal information made to the former affiliated company will be limited to those described in Section 2(b) above relating to non-affiliated third parties. If you elected under Section 6 to limit disclosures we make to affiliated companies, or use of personal information by affiliated companies, your election will not apply to use by any former affiliated company of your personal information in their possession once it becomes a non-affiliated third party.
SPECIAL NOTICE TO RESIDENTS OF VERMONT
The following section supplements our policy with respect to our individual clients who have a Vermont address and supersedes anything to the contrary in the above policy with respect to those clients only.
The state of Vermont requires financial institutions to obtain your consent prior to sharing personal information that they collect about you with affiliated companies and non-affiliated third parties other than in certain limited circumstances. Except as permitted by law, we will not share personal information we collect about you with non-affiliated third parties or other Morgan Stanley companies unless you provide us with your written consent to share such information ("opt-in").
If you wish to receive offers for investment products and services offered by or through other Morgan Stanley companies, please notify us in writing at the following address:
DST Asset Manager Solutions, Inc.
c/o Privacy Coordinator
P.O. Box 219804
Kansas City, Missouri 64121
Your authorization should include your name, address, telephone number and account number(s) to which the opt-in applies and should not be sent with any other correspondence. In order to process your authorization, we require that the authorization be provided by you directly and not through a third party.
SPECIAL NOTICE TO RESIDENTS OF CALIFORNIA
The following section supplements our policy with respect to our individual clients who have a California address and supersedes anything to the contrary in the above policy with respect to those clients only.
In response to a California law, if your account has a California home address, your personal information will not be disclosed to non-affiliated third parties except as permitted by applicable California law, and we will limit sharing such information with our affiliates to comply with California privacy laws that apply to us.
39
Morgan Stanley Institutional Fund, Inc.
Annual Report — December 31, 2017
Director and Officer Information (unaudited)
Independent Directors:
Name, Age and Address of
Independent Director | | Position(s)
Held with
Registrant | | Length of Time
Served* | | Principal Occupation(s) During Past 5 Years
and Other Relevant Professional Experience | | Number of
Portfolios in
Fund Complex
Overseen by
Independent
Director** | | Other Directorships
Held by Independent
Director*** | |
Frank L. Bowman (73)
c/o Perkins Coie LLP
Counsel to the Independent
Directors
30 Rockefeller Plaza
New York, NY 10112 | | Director | | Since
August
2006 | | President, Strategic Decisions, LLC (consulting) (since February 2009); Director or Trustee of various Morgan Stanley Funds (since August 2006); Chairperson of the Compliance and Insurance Committee (since October 2015); formerly, Chairperson of the Insurance Sub-Committee of the Compliance and Insurance Committee (2007-2015); served as President and Chief Executive Officer of the Nuclear Energy Institute (policy organization) (February 2005-November 2008); retired as Admiral, U.S. Navy after serving over 38 years on active duty including 8 years as Director of the Naval Nuclear Propulsion Program in the Department of the Navy and the U.S. Department of Energy (1996-2004); served as Chief of Naval Personnel (July 1994-September 1996) and on the Joint Staff as Director of Political Military Affairs (June 1992-July 1994); knighted as Honorary Knight Commander of the Most Excellent Order of the British Empire; awarded the Officier de l'Orde National du Mérite by the French Government; elected to the National Academy of Engineering (2009). | | | 88 | | | Director of BP p.l.c.; Director of Naval and Nuclear Technologies LLP; Director Emeritus of the Armed Services YMCA; Director of the U.S. Naval Submarine League; Member of the National Security Advisory Council of the Center for U.S. Global Engagement and a member of the CNA Military Advisory Board; Trustee of Fairhaven United Methodist Church; and Director of other various non-profit organizations. | |
Kathleen A. Dennis (64)
c/o Perkins Coie LLP
Counsel to the Independent Directors
30 Rockefeller Plaza
New York, NY 10112 | | Director | | Since
August
2006 | | President, Cedarwood Associates (mutual fund and investment management consulting) (since July 2006); Chairperson of the Liquidity and Alternatives Sub-Committee of the Investment Committee (since October 2006) and Director or Trustee of various Morgan Stanley Funds (since August 2006); formerly, Senior Managing Director of Victory Capital Management (1993-2006). | | | 89 | | | Director of various non-profit organizations. | |
Nancy C. Everett (62)
c/o Perkins Coie LLP
Counsel to the Independent Directors
30 Rockefeller Plaza
New York, NY 10112 | | Director | | Since
January
2015 | | Chief Executive Officer, Virginia Commonwealth University Investment Company (since November 2015); Owner, OBIR, LLC (institutional investment management consulting) (since June 2014); formerly, Managing Director, BlackRock Inc. (February 2011-December 2013); and Chief Executive Officer, General Motors Asset Management (a/k/a Promark Global Advisors, Inc.) (June 2005-May 2010). | | | 90 | | | Formerly, Member of Virginia Commonwealth University School of Business Foundation (2005-2016); Member of Virginia Commonwealth University Board of Visitors (2013-2015); Member of Committee on Directors for Emerging Markets Growth Fund, Inc. (2007-2010); Chairperson of Performance Equity Management, LLC (2006-2010); and Chairperson, GMAM Absolute Return Strategies Fund, LLC (2006-2010). | |
40
Morgan Stanley Institutional Fund, Inc.
Annual Report — December 31, 2017
Director and Officer Information (unaudited) (cont'd)
Independent Directors: (cont'd)
Name, Age and Address of
Independent Director | | Position(s)
Held with
Registrant | | Length of Time
Served* | | Principal Occupation(s) During Past 5 Years
and Other Relevant Professional Experience | | Number of
Portfolios in
Fund Complex
Overseen by
Independent
Director** | | Other Directorships
Held by Independent
Director*** | |
Jakki L. Haussler (60)
c/o Perkins Coie LLP
Counsel to the Independent Directors
30 Rockefeller Plaza
New York, NY 10112 | | Director | | Since
January
2015 | | Chairman and Chief Executive Officer, Opus Capital Group (since January 1996); formerly, Director, Capvest Venture Fund, LP (May 2000-December 2011); Partner, Adena Ventures, LP (July 1999-December 2010); Director, The Victory Funds (February 2005-July 2008). | | | 90 | | | Director of Cincinnati Bell Inc. and Member, Audit Committee and Compensation Committee; Director of Northern Kentucky University Foundation and Member, Investment Committee; Member of Chase College of Law Transactional Law Practice Center Board of Advisors; Director of Best Transport; Director of Chase College of Law Board of Visitors; formerly, Member, University of Cincinnati Foundation Investment Committee; Member, Miami University Board of Visitors (2008-2011); Trustee of Victory Funds (2005-2008) and Chairman, Investment Committee (2007-2008) and Member, Service Provider Committee (2005-2008). | |
Dr. Manuel H. Johnson (68)
c/o Johnson Smick
International, Inc.
220 I Street, NE — Suite 200
Washington, D.C. 20002 | | Director | | Since
July
1991 | | Senior Partner, Johnson Smick International, Inc. (consulting firm); Chairperson of the Investment Committee (since October 2006) and Director or Trustee of various Morgan Stanley Funds (since July 1991); Co-Chairman and a founder of the Group of Seven Council (G7C) (international economic commission); formerly, Chairperson of the Audit Committee (July 1991-September 2006), Vice Chairman of the Board of Governors of the Federal Reserve System and Assistant Secretary of the U.S. Treasury. | | | 88 | | | Director of NVR, Inc. (home construction). | |
Joseph J. Kearns (75)
c/o Kearns & Associates LLC
46 E Peninsula Center #385
Rolling Hills Estates,
CA 90274-3712 | | Director | | Since
August
1994 | | Senior Adviser, Kearns & Associates LLC (investment consulting); Chairperson of the Audit Committee (since October 2006) and Director or Trustee of various Morgan Stanley Funds (since August 1994); formerly, Deputy Chairperson of the Audit Committee (July 2003-September 2006) and Chairperson of the Audit Committee of various Morgan Stanley Funds (since August 1994); CFO of the J. Paul Getty Trust. | | | 89 | | | Prior to August 10, 2016, Director of Electro Rent Corporation (equipment leasing); Prior to December 31, 2013, Director of The Ford Family Foundation. | |
41
Morgan Stanley Institutional Fund, Inc.
Annual Report — December 31, 2017
Director and Officer Information (unaudited) (cont'd)
Independent Directors: (cont'd)
Name, Age and Address of
Independent Director | | Position(s)
Held with
Registrant | | Length of Time
Served* | | Principal Occupation(s) During Past 5 Years
and Other Relevant Professional Experience | | Number of
Portfolios in
Fund Complex
Overseen by
Independent
Director** | | Other Directorships
Held by Independent
Director*** | |
Michael F. Klein (59)
c/o Perkins Coie LLP
Counsel to the Independent Directors
30 Rockefeller Plaza
New York, NY 10112 | | Director | | Since
August
2006 | | Managing Director, Aetos Capital, LLC (since March 2000); Co-President, Aetos Alternatives Management, LLC (since January 2004) and Co-Chief Executive Officer of Aetos Capital LLC (since August 2013); Chairperson of the Fixed Income Sub-Committee of the Investment Committee (since October 2006) and Director or Trustee of various Morgan Stanley Funds (since August 2006); formerly, Managing Director, Morgan Stanley & Co. Inc. and Morgan Stanley Dean Witter Investment Management, President, various Morgan Stanley Funds (June 1998-March 2000) and Principal, Morgan Stanley & Co. Inc. and Morgan Stanley Dean Witter Investment Management (August 1997-December 1999). | | | 88 | | | Director of certain investment funds managed or sponsored by Aetos Capital, LLC; Director of Sanitized AG and Sanitized Marketing AG (specialty chemicals). | |
Patricia Maleski (57)
c/o Perkins Coie LLP
Counsel to the Independent Directors
30 Rockefeller Plaza
New York, NY 10112 | | Director | | Since
January
2017 | | Managing Director, JPMorgan Asset Management (2004-2016); Oversight and Control Head of Fiduciary and Conflicts of Interest Program (2015-2016); Chief Control Officer-Global Asset Management (2013-2015); President, JPMorgan Funds (2010-2013); Chief Administrative Officer (2004-2013); various other positions including Treasurer and Board Liaison (since 2001). | | | 90 | | | None. | |
Michael E. Nugent (81)
522 Fifth Avenue
New York, NY 10036 | | Chair of the Board and Director | | Chair of the Boards since July 2006 and Director since July 1991 | | Chair of the Boards of various Morgan Stanley Funds (since July 2006); Chairperson of the Closed-End Fund Committee (since June 2012) and Director or Trustee of various Morgan Stanley Funds (since July 1991); formerly, Chairperson of the Insurance Committee (until July 2006); General Partner, Triumph Capital, L.P. (private investment partnership) (1988-2013). | | | 88 | | | None. | |
W. Allen Reed (70)
c/o Perkins Coie LLP
Counsel to the Independent Directors
30 Rockefeller Plaza
New York, NY 10112 | | Director | | Since
August
2006 | | Chairperson of the Equity Sub-Committee of the Investment Committee (since October 2006) and Director or Trustee of various Morgan Stanley Funds (since August 2006); formerly, President and CEO of General Motors Asset Management; Chairman and Chief Executive Officer of the GM Trust Bank and Corporate Vice President of General Motors Corporation (August 1994-December 2005). | | | 89 | | | Director of Legg Mason, Inc.; formerly, Director of the Auburn University Foundation (2010-2015). | |
Fergus Reid (85)
c/o Joe Pietryka, Inc.
85 Charles Colman Blvd.
Pawling, NY 12564 | | Director | | Since
June
1992 | | Chairman, Joe Pietryka, Inc.; Chairperson of the Governance Committee and Director or Trustee of various Morgan Stanley Funds (since June 1992). | | | 89 | | | Formerly, Trustee and Director of certain investment companies in the JP Morgan Fund Complex managed by JP Morgan Investment Management Inc. (1987-2012). | |
* This is the earliest date the Director began serving the Morgan Stanley Funds. Each Director serves an indefinite term, until his or her successor is elected.
** The Fund Complex includes (as of December 31, 2017) all open-end and closed-end funds (including all of their portfolios) advised by Morgan Stanley Investment Management Inc. (the "Adviser") and any funds that have an adviser that is an affiliated person of the Adviser (including, but not limited to, Morgan Stanley AIP GP LP).
*** This includes any directorships at public companies and registered investment companies held by the Director at any time during the past five years.
42
Morgan Stanley Institutional Fund, Inc.
Annual Report — December 31, 2017
Director and Officer Information (unaudited) (cont'd)
Executive Officers:
Name, Age and Address of Executive Officer | | Position(s) Held
with
Registrant | | Length of Time
Served* | | Principal Occupation(s) During Past 5 Years | |
John H. Gernon (54)
522 Fifth Avenue
New York, NY 10036 | | President and Principal Executive Officer | | Since
September
2013 | | President and Principal Executive Officer of the Equity and Fixed Income Funds and the Morgan Stanley AIP Funds (since September 2013) and the Liquidity Funds and various money market funds (since May 2014) in the Fund Complex; Managing Director of the Adviser; Head of Product (since 2006). | |
Timothy J. Knierim (58)
522 Fifth Avenue
New York, NY 10036 | | Chief Compliance Officer | | Since
December
2016 | | Managing Director of the Adviser and various entities affiliated with the Adviser; Chief Compliance Officer of various Morgan Stanley Funds and the Adviser (since December 2016) and Chief Compliance Officer of Morgan Stanley AIP GP LP (since 2014). Formerly, Managing Director and Deputy Chief Compliance Officer of the Adviser (2014-2016); and formerly, Chief Compliance Officer of Prudential Investment Management, Inc. (2007-2014). | |
Francis J. Smith (52)
522 Fifth Avenue
New York, NY 10036 | | Treasurer and Principal Financial Officer | | Treasurer since July 2003 and Principal Financial Officer since September 2002 | | Manging Director of the Adviser and various entities affiliated with the Adviser; Treasurer (since July 2003) and Principal Financial Officer of various Morgan Stanley Funds (since September 2002). | |
Mary E. Mullin (50)
522 Fifth Avenue
New York, NY 10036 | | Secretary | | Since
June
1999 | | Managing Director of the Adviser; Secretary of various Morgan Stanley Funds (since June 1999). | |
Michael J. Key (38)
522 Fifth Avenue
New York, NY 10036 | | Vice President | | Since
June
2017 | | Vice President of the Equity and Fixed Income Funds, Liquidity Funds, various money market funds and the Morgan Stanley AIP Funds in the Fund Complex (since June 2017); Executive Director of the Adviser; Head of Product Development for Equity and Fixed Income Funds (since August 2013). | |
* This is the earliest date the officer began serving the Morgan Stanley Funds. Each officer serves a one-year term, until his or her successor is elected and qualifies.
43
Morgan Stanley Institutional Fund, Inc.
Annual Report — December 31, 2017
Adviser and Administrator
Morgan Stanley Investment Management Inc.
522 Fifth Avenue
New York, New York 10036
Sub-Adviser
Morgan Stanley Investment Management Company
23 Church Street
16-01 Capital Square, Singapore 049481
Distributor
Morgan Stanley Distribution, Inc.
522 Fifth Avenue
New York, New York 10036
Dividend Disbursing and Transfer Agent
DST Asset Manager Solutions, Inc.
2000 Crown Colony Drive
Quincy, Massachusetts 02169
Custodian
State Street Bank and Trust Company
One Lincoln Street
Boston, Massachusetts 02111
Legal Counsel
Dechert LLP
1095 Avenue of the Americas
New York, New York 10036
Counsel to the Independent Directors
Perkins Coie LLP
30 Rockefeller Plaza
New York, New York 10112
Independent Registered Public Accounting Firm
Ernst & Young LLP
200 Clarendon Street
Boston, Massachusetts 02116
Reporting to Shareholders
Each Morgan Stanley Fund provides a complete schedule of portfolio holdings in its semi-annual and annual reports within 60 days of the end of the fund's second and fourth fiscal quarters. The semi-annual and annual reports are filed electronically with the Securities and Exchange Commission (SEC) on Form N-CSRS and Form N-CSR, respectively. Morgan Stanley also delivers the semi-annual and annual reports to fund shareholders and makes these reports available on its public website, www.morganstanley.com/im. Each Morgan Stanley fund also files a complete schedule of portfolio holdings with the SEC for the fund's first and third fiscal quarters on Form N-Q. Morgan Stanley does not deliver the reports for the first and third fiscal quarters to shareholders, nor are the reports posted to the Morgan Stanley public website. You may, however, obtain the Form N-Q filings (as well as the Form N-CSR and N-CSRS filings) by accessing the SEC's website, www.sec.gov. You may also review and copy them at the SEC's Public Reference Room in Washington, DC. Information on the operation of the SEC's Public Reference Room may be obtained by calling the SEC toll free at 1 (800) SEC-0330. You can also request copies of these materials, upon payment of a duplicating fee, by electronic request at the SEC's email address (publicinfo@sec.gov) or by writing to the SEC's Public Reference Section, Washington, D.C. 20549-1520.
Proxy Voting Policies and Procedures and Proxy Voting Record
You may obtain a copy of the Company's Proxy Voting Policy and Procedures and information regarding how the Company voted proxies relating to portfolio securities during the most recent twelve-month period ended June 30, without charge, upon request, by calling toll free 1 (800) 548-7786 or by visiting our website at www.morganstanley.com/im. This information is also available on the SEC's website at www.sec.gov.
This report is authorized for distribution only when preceded or accompanied by a prospectus or summary prospectus of the applicable Fund of Morgan Stanley Institutional Fund, Inc., which describes in detail the Fund's investment policies, risks, fees and expenses. Please read the prospectus carefully before you invest or send money. For additional information, including information regarding the investments comprising the Fund, please visit our website at www.morganstanley.com/im or call toll free 1 (800) 548-7786.
44
Printed in U.S.A.
This Report has been prepared for shareholders and may be distributed to others only if preceded or accompanied by a current prospectus.
Morgan Stanley Investment Management Inc.
522 Fifth Avenue
New York, New York 10036
© 2018 Morgan Stanley. Morgan Stanley Distribution, Inc.

IFIAIAANN
2007277 EXP. 02.28.19

Morgan Stanley Institutional Fund, Inc.
Advantage Portfolio
Annual Report
December 31, 2017

Morgan Stanley Institutional Fund, Inc.
Annual Report — December 31, 2017
Shareholders' Letter | | | 2 | | |
Expense Example | | | 3 | | |
Investment Overview | | | 4 | | |
Portfolio of Investments | | | 6 | | |
Statement of Assets and Liabilities | | | 8 | | |
Statement of Operations | | | 10 | | |
Statements of Changes in Net Assets | | | 11 | | |
Financial Highlights | | | 13 | | |
Notes to Financial Statements | | | 18 | | |
Report of Independent Registered Public Accounting Firm | | | 26 | | |
Federal Tax Notice | | | 27 | | |
Privacy Notice | | | 28 | | |
Director and Officer Information | | | 31 | | |
This report is authorized for distribution only when preceded or accompanied by a prospectus or summary prospectus of the applicable Fund of Morgan Stanley Institutional Fund, Inc. To receive a prospectus and/or statement of additional information (SAI), which contains more complete information such as investment objectives, charges, expenses, policies for voting proxies, risk considerations, and describes in detail each of the Fund's investment policies to the prospective investor, please call toll free 1 (800) 548-7786. Please read the prospectuses carefully before you invest or send money.
Additionally, you can access information about the Fund, including performance, characteristics, and investment team commentary, through Morgan Stanley Investment Management's website: www.morganstanley.com/im.
Market forecasts provided in this report may not necessarily come to pass. There is no guarantee that any sectors mentioned will continue to perform as discussed herein or that securities in such sectors will be held by the Fund in the future. There is no assurance that a fund will achieve its investment objective. Funds are subject to market risk, which is the possibility that market values of securities owned by the Fund will decline and, therefore, the value of the Fund's shares may be less than what you paid for them. Accordingly, you can lose money investing in this Fund. Please see the prospectus for more complete information on investment risks.
1
Morgan Stanley Institutional Fund, Inc.
Annual Report — December 31, 2017
Shareholders' Letter (unaudited)
Dear Shareholders,
We are pleased to provide this Annual report, in which you will learn how your investment in Advantage Portfolio (the "Fund") performed during the latest twelve-month period.
Morgan Stanley Investment Management is a client-centric, investor-led organization. Our global presence, intellectual capital, and breadth of products and services enable us to partner with investors to meet the evolving challenges of today's financial markets. We aim to deliver superior investment service and to empower our clients to make the informed decisions that help them reach their investment goals.
As always, we thank you for selecting Morgan Stanley Investment Management, and look forward to working with you in the months and years ahead.
Sincerely,

John H. Gernon
President and Principal Executive Officer
January 2018
2
Morgan Stanley Institutional Fund, Inc.
Annual Report — December 31, 2017
Expense Example (unaudited)
Advantage Portfolio
As a shareholder of the Fund, you incur two types of costs: (1) transactional costs; and (2) ongoing costs, which may include advisory fees, administration fees, distribution and shareholder services fees and other Fund expenses. This example is intended to help you understand your ongoing costs (in dollars) of investing in the Fund and to compare these costs with the ongoing costs of investing in other mutual funds.
This example is based on an investment of $1,000 invested at the beginning of the six-month period ended December 31, 2017 and held for the entire six-month period.
Actual Expenses
The table below provides information about actual account values and actual expenses. You may use the information in this table, together with the amount you invested, to estimate the expenses that you paid over the period. Simply divide your account value by $1,000 (for example, an $8,600 account value divided by $1,000 = 8.6), then multiply the result by the number in the table under the heading entitled "Actual Expenses Paid During Period" to estimate the expenses you paid on your account during this period.
Hypothetical Example for Comparison Purposes
The table below provides information about hypothetical account values and hypothetical expenses based on the Fund's actual expense ratio and an assumed rate of return of 5% per year before expenses, which is not the Fund's actual return. The hypothetical account values and expenses may not be used to estimate the actual ending account balance or expenses you paid for the period. You may use this information to compare the ongoing costs of investing in the Fund and other funds. To do so, compare this 5% hypothetical example with the 5% hypothetical examples that appear in the shareholder reports of the other funds.
Please note that the expenses shown in the table are meant to highlight your ongoing costs only and do not reflect any transactional costs, such as sales charges (loads). Therefore, the information for each class in the table is useful in comparing ongoing costs only, and will not help you determine the relative total costs of owning different funds. In addition, if these transactional costs were included, your costs would have been higher.
| | | Beginning
Account
Value
7/1/17 | | Actual Ending
Account
Value
12/31/17 | | Hypothetical
Ending Account
Value | | Actual
Expenses
Paid
During
Period* | | Hypothetical
Expenses Paid
During Period* | | Net
Expense
Ratio
During
Period** | |
Advantage Portfolio Class I | | $ | 1,000.00 | | | $ | 1,134.80 | | | $ | 1,020.97 | | | $ | 4.52 | | | $ | 4.28 | | | | 0.84 | % | |
Advantage Portfolio Class A | | | 1,000.00 | | | | 1,133.20 | | | | 1,019.16 | | | | 6.45 | | | | 6.11 | | | | 1.20 | | |
Advantage Portfolio Class L | | | 1,000.00 | | | | 1,134.50 | | | | 1,020.37 | | | | 5.16 | | | | 4.89 | | | | 0.96 | | |
Advantage Portfolio Class C | | | 1,000.00 | | | | 1,129.30 | | | | 1,015.63 | | | | 10.20 | | | | 9.65 | | | | 1.90 | | |
Advantage Portfolio Class IS | | | 1,000.00 | | | | 1,135.70 | | | | 1,021.17 | | | | 4.31 | | | | 4.08 | | | | 0.80 | | |
* Expenses are calculated using each Fund Class' annualized net expense ratio (as disclosed), multiplied by the average account value over the period, and multiplied by 184/365 (to reflect the most recent one-half year period).
** Annualized.
3
Morgan Stanley Institutional Fund, Inc.
Annual Report — December 31, 2017
Investment Overview (unaudited)
Advantage Portfolio
The Fund seeks long-term capital appreciation.
Performance
For the year ended December 31, 2017, the Fund's Class I shares had a total return based on net asset value and reinvestment of distributions per share of 32.06%, net of fees. The Fund's Class I shares outperformed the Fund's benchmark, the Russell 1000® Growth Index (the "Index"), which returned 30.21%.
Please keep in mind that double-digit returns are highly unusual and cannot be sustained. Investors should also be aware that these returns were primarily achieved during favorable market conditions.
Factors Affecting Performance
• Major U.S. stock indexes spent most of 2017 climbing toward, then exceeding, new record highs. Fueling their momentum was a combination of strong economic growth, robust corporate profits (aided, in part, by a weak dollar) and optimism for tax reform. While the Federal Reserve raised its benchmark interest rate three times in 2017, the moves were incremental and not considered a headwind to the economy's momentum. Notable uncertainties in domestic politics and geopolitics also failed to disrupt the market's advance. Overall, market volatility remained historically low, further bolstering investor confidence in stocks.
• The Index's top-performing sector during the period was utilities, followed by information technology (IT) and financials. The energy sector was the only Index sector with a negative return, and telecommunication services and consumer staples were also among the bottom-performing sectors for the period.
• The long-term investment horizon and conviction-weighted investment approach embraced by the team since 1998 can result in periods of performance deviation from the benchmark and peers. In this reporting period, the Fund benefited from favorable stock selection and sector allocations.
• Stock selection in financials added the most to relative performance, primarily due to strong results from a financial ratings, benchmark and analytics provider and from an equity index and portfolio analytics provider.
• The Fund's lack of exposure to the consumer staples sector was advantageous in this period, as the sector lagged the broad market in this period.
• Stock selection in IT also drove relative gains. A global social networking platform continued to execute well, reported strong earnings and provided a positive outlook on cost cutting, which boosted its share price. An online retail and cloud computing leader also outperformed, due to the company's continued strong earnings results and expectations that the company's e-commerce business could benefit from a shift in the retail landscape, as brick-and-mortar stores have been closing at an accelerating pace.
• Stock selection in industrials was the largest detractor. Although all of the industrials stocks held by the Fund appreciated during the period, the Fund was less exposed to other stronger-performing names within the sector, which was disadvantageous on a relative performance basis.
• Stock selection in the consumer discretionary sector had a modestly negative impact on relative returns. The Fund was hampered by weak performance in two apparel makers suffering weaker-than-expected fundamentals.
Management Strategies
• There were no changes to our bottom-up investment process during the period. We continued to look for franchises with strong name recognition and sustainable competitive advantages. We typically favor companies with rising returns on invested capital, above average business visibility, strong free cash flow generation and an attractive risk/reward profile. Our emphasis is on secular growth, and as a result short-term market events are not as meaningful in the stock selection process.
4
Morgan Stanley Institutional Fund, Inc.
Annual Report — December 31, 2017
Investment Overview (unaudited) (cont'd)
Advantage Portfolio
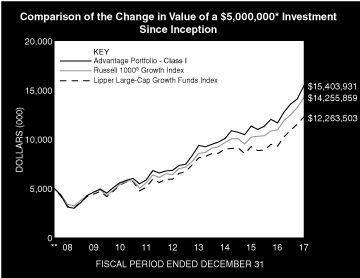
* Minimum Investment for Class I shares
** Commenced Operations on June 30, 2008.
In accordance with SEC regulations, the Fund's performance shown assumes that all recurring fees (including management fees) were deducted and all dividends and distributions were reinvested. The performance of Class A, L, C and IS shares will vary from the performance of Class I shares based upon their different inception dates and will be impacted by additional fees assessed to those classes (if applicable).
Performance Compared to the Russell 1000® Growth Index(1) and the Lipper Large-Cap Growth Funds Index(2)
| | Period Ended December 31, 2017
Total Returns(3) | |
| | | | Average Annual | |
| | One
Year | | Five
Years | | Ten
Years | | Since
Inception(7) | |
Fund — Class I Shares
w/o sales charges(4) | | | 32.06 | % | | | 17.62 | % | | | — | | | | 12.57 | % | |
Fund — Class A Shares
w/o sales charges(4) | | | 31.64 | | | | 17.23 | | | | — | | | | 16.83 | | |
Fund — Class A Shares with
maximum 5.25% sales charges(4) | | | 24.70 | | | | 15.97 | | | | — | | | | 16.01 | | |
Fund — Class L Shares
w/o sales charges(4) | | | 31.96 | | | | 17.50 | | | | — | | | | 12.44 | | |
Fund — Class C Shares
w/o sales charges(6) | | | 30.77 | | | | — | | | | — | | | | 12.88 | | |
Fund — Class C Shares with
maximum 1.00% deferred
sales charges(6) | | | 29.77 | | | | — | | | | — | | | | 12.88 | | |
| | Period Ended December 31, 2017
Total Returns(3) | |
| | | | Average Annual | |
| | One
Year | | Five
Years | | Ten
Years | | Since
Inception(7) | |
Fund — Class IS Shares
w/o sales charges(5) | | | 32.22 | % | | | — | | | | — | | | | 16.03 | % | |
Russell 1000® Growth Index | | | 30.21 | | | | 17.33 | % | | | — | | | | 11.66 | | |
Lipper Large-Cap Growth
Funds Index | | | 31.85 | | | | 15.90 | | | | — | | | | 9.90 | | |
Performance data quoted represents past performance, which is no guarantee of future results, and current performance may be lower or higher than the figures shown. Performance assumes that all dividends and distributions, if any, were reinvested. For the most recent month-end performance figures, please visit www.morganstanley.com/im. Investment return and principal value will fluctuate so that Fund shares, when redeemed, may be worth more or less than their original cost. Total returns do not reflect the deduction of taxes that a shareholder would pay on Fund distributions or the redemption of Fund shares. Performance of share classes will vary due to difference in sales charges and expenses.
(1) The Russell 1000® Growth Index measures the performance of the large-cap growth segment of the U.S. equity universe. It includes those Russell 1000® Index companies with higher price-to-book ratios and higher forecasted growth values. The Russell 1000® Index is an index of approximately 1,000 of the largest U.S. companies based on a combination of market capitalization and current index membership. The Index is unmanaged and its returns do not include any sales charges or fees. Such costs would lower performance. It is not possible to invest directly in an index.
(2) The Lipper Large-Cap Growth Funds Index is an equally weighted performance index of the largest qualifying funds (based on net assets) in the Lipper Large-Cap Growth Funds classification. The Index, which is adjusted for capital gains distributions and income dividends, is unmanaged and should not be considered an investment. There are currently 30 funds represented in this Index. As of the date of this report, the Fund was in the Lipper Large-Cap Growth Funds classification.
(3) Total returns for the Fund reflect fees waived and expenses reimbursed, if applicable, by the Adviser. Without such waivers and reimbursements, total returns would have been lower.
(4) On May 21, 2010 Class C and Class I shares of Van Kampen Core Growth Fund ("the Predecessor Fund") were reorganized into Class L and Class I shares of Morgan Stanley Advantage Portfolio ("the Fund"), respectively. Class L and Class I shares' returns of the Fund will differ from the Predecessor Fund as they have different expenses. Performance shown for the Fund's Class I and Class L shares reflects the performance of the shares of the Predecessor Fund for periods prior to May 21, 2010. The Class C and I shares of the Predecessor Fund commenced operations on June 30, 2008. Class P shares, which were renamed Class A shares effective September 9, 2013, commenced operations on May 21, 2010.
(5) Commenced offering on September 13, 2013.
(6) Commenced offering on April 30, 2015.
(7) For comparative purposes, average annual since inception returns listed for the Indexes refer to the inception date of Class I of the Fund, not the inception of the Index.
5
Morgan Stanley Institutional Fund, Inc.
Annual Report — December 31, 2017
Portfolio of Investments
Advantage Portfolio
| | | Shares | | Value
(000) | |
Common Stocks (97.0%) | |
Aerospace & Defense (8.5%) | |
TransDigm Group, Inc. | | | 13,699 | | | $ | 3,762 | | |
United Technologies Corp. | | | 44,939 | | | | 5,733 | | |
| | | | 9,495 | | |
Automobiles (1.1%) | |
Harley-Davidson, Inc. | | | 23,743 | | | | 1,208 | | |
Capital Markets (2.5%) | |
S&P Global, Inc. | | | 16,163 | | | | 2,738 | | |
Chemicals (1.6%) | |
Sherwin-Williams Co. (The) | | | 4,309 | | | | 1,767 | | |
Construction Materials (3.2%) | |
Martin Marietta Materials, Inc. | | | 8,112 | | | | 1,793 | | |
Vulcan Materials Co. | | | 13,556 | | | | 1,740 | | |
| | | | 3,533 | | |
Diversified Financial Services (5.2%) | |
Berkshire Hathaway, Inc., Class B (a) | | | 28,912 | | | | 5,731 | | |
Health Care Equipment & Supplies (2.4%) | |
Danaher Corp. | | | 29,370 | | | | 2,726 | | |
Hotels, Restaurants & Leisure (4.9%) | |
Starbucks Corp. | | | 95,195 | | | | 5,467 | | |
Household Durables (1.0%) | |
Mohawk Industries, Inc. (a) | | | 4,063 | | | | 1,121 | | |
Information Technology Services (1.5%) | |
Mastercard, Inc., Class A | | | 11,012 | | | | 1,667 | | |
Insurance (1.0%) | |
Markel Corp. (a) | | | 1,008 | | | | 1,148 | | |
Internet & Direct Marketing Retail (9.9%) | |
Amazon.com, Inc. (a) | | | 8,015 | | | | 9,373 | | |
Priceline Group, Inc. (The) (a) | | | 947 | | | | 1,646 | | |
| | | | 11,019 | | |
Internet Software & Services (13.8%) | |
Alphabet, Inc., Class C (a) | | | 6,382 | | | | 6,678 | | |
Facebook, Inc., Class A (a) | | | 27,282 | | | | 4,814 | | |
Twitter, Inc. (a) | | | 159,413 | | | | 3,828 | | |
| | | | 15,320 | | |
Machinery (1.4%) | |
Fortive Corp. | | | 21,999 | | | | 1,592 | | |
Media (4.4%) | |
Walt Disney Co. (The) | | | 45,559 | | | | 4,898 | | |
Pharmaceuticals (2.5%) | |
Zoetis, Inc. | | | 37,876 | | | | 2,728 | | |
| | | Shares | | Value
(000) | |
Professional Services (1.5%) | |
IHS Markit Ltd. (a) | | | 36,964 | | | $ | 1,669 | | |
Road & Rail (5.5%) | |
Union Pacific Corp. | | | 45,473 | | | | 6,098 | | |
Software (10.0%) | |
Activision Blizzard, Inc. | | | 59,731 | | | | 3,782 | | |
salesforce.com, Inc. (a) | | | 39,845 | | | | 4,074 | | |
ServiceNow, Inc. (a) | | | 12,902 | | | | 1,682 | | |
Workday, Inc., Class A (a) | | | 15,835 | | | | 1,611 | | |
| | | | 11,149 | | |
Specialty Retail (7.5%) | |
L Brands, Inc. | | | 18,425 | | | | 1,109 | | |
TJX Cos., Inc. (The) | | | 53,475 | | | | 4,089 | | |
Ulta Salon Cosmetics & Fragrance, Inc. (a) | | | 13,815 | | | | 3,090 | | |
| | | | 8,288 | | |
Textiles, Apparel & Luxury Goods (7.6%) | |
LVMH Moet Hennessy Louis Vuitton SE (France) | | | 18,465 | | | | 5,424 | | |
NIKE, Inc., Class B | | | 48,536 | | | | 3,036 | | |
| | | | 8,460 | | |
Total Common Stocks (Cost $81,672) | | | 107,822 | | |
Short-Term Investment (3.1%) | |
Investment Company (3.1%) | |
Morgan Stanley Institutional Liquidity
Funds — Treasury Securities Portfolio —
Institutional Class (See Note G)
(Cost $3,431) | | | 3,430,668 | | | | 3,431 | | |
Total Investments Excluding Purchased
Options (100.1%) (Cost $85,103) | | | | | 111,253 | | |
Total Purchased Options Outstanding (0.0%)
(Cost $208) | | | 32 | | |
Total Investments (100.1%) (Cost $85,311) (b)(c) | | | 111,285 | | |
Liabilities in Excess of Other Assets (–0.1%) | | | (114 | ) | |
Net Assets (100.0%) | | $ | 111,171 | | |
(a) Non-income producing security.
(b) The approximate fair value and percentage of net assets, $5,424,000 and 4.9%, respectively, represent the securities that have been fair valued under the fair valuation policy for international investments as described in Note A-1 within the Notes to the Financial Statements.
(c) At December 31, 2017, the aggregate cost for federal income tax purposes is approximately $85,262,000. The aggregate gross unrealized appreciation is approximately $26,242,000 and the aggregate gross unrealized depreciation is approximately $219,000, resulting in net unrealized appreciation of approximately $26,023,000.
The accompanying notes are an integral part of the financial statements.
6
Morgan Stanley Institutional Fund, Inc.
Annual Report — December 31, 2017
Portfolio of Investments (cont'd)
Advantage Portfolio
Call Options Purchased:
The Fund had the following call options purchased open at December 31, 2017:
Counterparty | | Description | | Strike
Price | | Expiration
Date | | Number of
Contracts | | Notional
Amount
(000) | | Value
(000) | | Premiums
Paid
(000) | | Unrealized
Depreciation
(000) | |
Royal Bank of Scotland | | USD/CNH | | CNH | 7.52 | | | Nov-18 | | | 25,978,961 | | | | 25,979 | | | $ | 25 | | | $ | 108 | | | $ | (82 | ) | |
Royal Bank of Scotland | | USD/CNH | | CNH | 7.55 | | | Aug-18 | | | 18,861,597 | | | | 18,862 | | | | 7 | | | | 100 | | | | (94 | ) | |
| | | | | | | | | | | | | $ | 32 | | | $ | 208 | | | $ | (176 | ) | |
CNH — Chinese Yuan Renminbi Offshore
USD — United States Dollar
Portfolio Composition
Classification | | Percentage of
Total Investments | |
Other* | | | 32.1 | % | |
Internet Software & Services | | | 13.8 | | |
Software | | | 10.0 | | |
Internet & Direct Marketing Retail | | | 9.9 | | |
Aerospace & Defense | | | 8.5 | | |
Textiles, Apparel & Luxury Goods | | | 7.6 | | |
Specialty Retail | | | 7.4 | | |
Road & Rail | | | 5.5 | | |
Diversified Financial Services | | | 5.2 | | |
Total Investments | | | 100.0 | % | |
* Industries and/or investment types representing less than 5% of total investments.
The accompanying notes are an integral part of the financial statements.
7
Morgan Stanley Institutional Fund, Inc.
Annual Report — December 31, 2017
Statement of Assets and Liabilities | | December 31, 2017
(000) | |
Assets: | |
Investments in Securities of Unaffiliated Issuers, at Value (Cost $81,880) | | $ | 107,854 | | |
Investment in Security of Affiliated Issuer, at Value (Cost $3,431) | | | 3,431 | | |
Total Investments in Securities, at Value (Cost $85,311) | | | 111,285 | | |
Receivable for Fund Shares Sold | | | 52 | | |
Dividends Receivable | | | 36 | | |
Tax Reclaim Receivable | | | 3 | | |
Receivable from Affiliate | | | 3 | | |
Other Assets | | | 36 | | |
Total Assets | | | 111,415 | | |
Liabilities: | |
Payable for Advisory Fees | | | 103 | | |
Payable for Professional Fees | | | 51 | | |
Payable for Fund Shares Redeemed | | | 24 | | |
Payable for Sub Transfer Agency Fees — Class I | | | 11 | | |
Payable for Sub Transfer Agency Fees — Class A | | | 5 | | |
Payable for Sub Transfer Agency Fees — Class L | | | 1 | | |
Payable for Sub Transfer Agency Fees — Class C | | | 1 | | |
Payable for Shareholder Services Fees — Class A | | | 5 | | |
Payable for Distribution and Shareholder Services Fees — Class L | | | — | @ | |
Payable for Distribution and Shareholder Services Fees — Class C | | | 10 | | |
Payable for Administration Fees | | | 8 | | |
Payable for Custodian Fees | | | 7 | | |
Payable for Transfer Agency Fees — Class I | | | 1 | | |
Payable for Transfer Agency Fees — Class A | | | 1 | | |
Payable for Transfer Agency Fees — Class L | | | 1 | | |
Payable for Transfer Agency Fees — Class C | | | 1 | | |
Payable for Transfer Agency Fees — Class IS | | | — | @ | |
Other Liabilities | | | 14 | | |
Total Liabilities | | | 244 | | |
Net Assets | | $ | 111,171 | | |
Net Assets Consist Of: | |
Paid-in-Capital | | $ | 82,971 | | |
Accumulated Net Investment Loss | | | (— | @) | |
Accumulated Undistributed Net Realized Gain | | | 2,226 | | |
Unrealized Appreciation (Depreciation) on: | |
Investments | | | 25,974 | | |
Foreign Currency Translations | | | — | @ | |
Net Assets | | $ | 111,171 | | |
The accompanying notes are an integral part of the financial statements.
8
Morgan Stanley Institutional Fund, Inc.
Annual Report — December 31, 2017
Statement of Assets and Liabilities (cont'd) | | December 31, 2017
(000) | |
CLASS I: | |
Net Assets | | $ | 54,002 | | |
| Shares Outstanding $0.001 par value shares of beneficial interest (unlimited shares authorized) (not in 000's) | | | 2,517,177 | | |
Net Asset Value, Offering and Redemption Price Per Share | | $ | 21.45 | | |
CLASS A: | |
Net Assets | | $ | 23,715 | | |
| Shares Outstanding $0.001 par value shares of beneficial interest (unlimited shares authorized) (not in 000's) | | | 1,123,844 | | |
Net Asset Value, Redemption Price Per Share | | $ | 21.10 | | |
Maximum Sales Load | | | 5.25 | % | |
Maximum Sales Charge | | $ | 1.17 | | |
Maximum Offering Price Per Share | | $ | 22.27 | | |
CLASS L: | |
Net Assets | | $ | 4,077 | | |
| Shares Outstanding $0.001 par value shares of beneficial interest (unlimited shares authorized) (not in 000's) | | | 190,275 | | |
Net Asset Value, Offering and Redemption Price Per Share | | $ | 21.42 | | |
CLASS C: | |
Net Assets | | $ | 11,835 | | |
| Shares Outstanding $0.001 par value shares of beneficial interest (unlimited shares authorized) (not in 000's) | | | 568,505 | | |
Net Asset Value, Offering and Redemption Price Per Share | | $ | 20.82 | | |
CLASS IS: | |
Net Assets | | $ | 17,542 | | |
| Shares Outstanding $0.001 par value shares of beneficial interest (unlimited shares authorized) (not in 000's) | | | 816,470 | | |
Net Asset Value, Offering and Redemption Price Per Share | | $ | 21.49 | | |
@ Amount is less than $500.
The accompanying notes are an integral part of the financial statements.
9
Morgan Stanley Institutional Fund, Inc.
Annual Report — December 31, 2017
Statement of Operations | | Year Ended
December 31, 2017
(000) | |
Investment Income: | |
Dividends from Securities of Unaffiliated Issuers (Net of $8 of Foreign Taxes Withheld) | | $ | 837 | | |
Dividends from Security of Affiliated Issuer (Note G) | | | 22 | | |
Total Investment Income | | | 859 | | |
Expenses: | |
Advisory Fees (Note B) | | | 641 | | |
Shareholder Services Fees — Class A (Note D) | | | 54 | | |
Distribution and Shareholder Services Fees — Class L (Note D) | | | 30 | | |
Distribution and Shareholder Services Fees — Class C (Note D) | | | 89 | | |
Professional Fees | | | 122 | | |
Administration Fees (Note C) | | | 79 | | |
Registration Fees | | | 74 | | |
Sub Transfer Agency Fees — Class I | | | 41 | | |
Sub Transfer Agency Fees — Class A | | | 26 | | |
Sub Transfer Agency Fees — Class L | | | 2 | | |
Sub Transfer Agency Fees — Class C | | | 5 | | |
Shareholder Reporting Fees | | | 22 | | |
Transfer Agency Fees — Class I (Note E) | | | 4 | | |
Transfer Agency Fees — Class A (Note E) | | | 4 | | |
Transfer Agency Fees — Class L (Note E) | | | 2 | | |
Transfer Agency Fees — Class C (Note E) | | | 4 | | |
Transfer Agency Fees — Class IS (Note E) | | | 2 | | |
Custodian Fees (Note F) | | | 12 | | |
Directors' Fees and Expenses | | | 6 | | |
Pricing Fees | | | 3 | | |
Other Expenses | | | 28 | | |
Total Expenses | | | 1,250 | | |
Waiver of Advisory Fees (Note B) | | | (187 | ) | |
Distribution Fees — Class L Shares Waived (Note D) | | | (29 | ) | |
Reimbursement of Class Specific Expenses — Class I (Note B) | | | (26 | ) | |
Reimbursement of Class Specific Expenses — Class IS (Note B) | | | (2 | ) | |
Rebate from Morgan Stanley Affiliate (Note G) | | | (5 | ) | |
Net Expenses | | | 1,001 | | |
Net Investment Loss | | | (142 | ) | |
Realized Gain (Loss): | |
Investments Sold | | | 9,826 | | |
Foreign Currency Transactions | | | (3 | ) | |
Net Realized Gain | | | 9,823 | | |
Change in Unrealized Appreciation (Depreciation): | |
Investments | | | 17,275 | | |
Foreign Currency Translations | | | — | @ | |
Net Change in Unrealized Appreciation (Depreciation) | | | 17,275 | | |
Net Realized Gain and Change in Unrealized Appreciation (Depreciation) | | | 27,098 | | |
Net Increase in Net Assets Resulting from Operations | | $ | 26,956 | | |
@ Amount is less than $500.
The accompanying notes are an integral part of the financial statements.
10
Morgan Stanley Institutional Fund, Inc.
Annual Report — December 31, 2017
Statements of Changes in Net Assets | | Year Ended
December 31, 2017
(000) | | Year Ended
December 31, 2016
(000) | |
Increase (Decrease) in Net Assets: | |
Operations: | |
Net Investment Income (Loss) | | $ | (142 | ) | | $ | 175 | | |
Net Realized Gain | | | 9,823 | | | | 953 | | |
Net Change in Unrealized Appreciation (Depreciation) | | | 17,275 | | | | 2,261 | | |
Net Increase in Net Assets Resulting from Operations | | | 26,956 | | | | 3,389 | | |
Distributions from and/or in Excess of: | |
Class I: | |
Net Investment Income | | | — | | | | (111 | ) | |
Net Realized Gain | | | (3,748 | ) | | | (841 | ) | |
Class A: | |
Net Realized Gain | | | (1,700 | ) | | | (348 | ) | |
Class L: | |
Net Investment Income | | | — | | | | (6 | ) | |
Net Realized Gain | | | (294 | ) | | | (96 | ) | |
Class C: | |
Net Realized Gain | | | (836 | ) | | | (94 | ) | |
Class IS: | |
Net Investment Income | | | — | | | | (38 | ) | |
Net Realized Gain | | | (1,216 | ) | | | (282 | ) | |
Total Distributions | | | (7,794 | ) | | | (1,816 | ) | |
Capital Share Transactions:(1) | |
Class I: | |
Subscribed | | | 11,335 | | | | 33,563 | | |
Distributions Reinvested | | | 3,748 | | | | 950 | | |
Redeemed | | | (13,359 | ) | | | (17,346 | ) | |
Class A: | |
Subscribed | | | 4,674 | | | | 16,149 | | |
Distributions Reinvested | | | 1,700 | | | | 347 | | |
Redeemed | | | (6,744 | ) | | | (8,863 | ) | |
Class L: | |
Exchanged | | | — | | | | 67 | | |
Subscribed | | | 20 | | | | — | | |
Distributions Reinvested | | | 282 | | | | 99 | | |
Redeemed | | | (722 | ) | | | (1,880 | ) | |
Class C: | |
Subscribed | | | 4,367 | | | | 4,912 | | |
Distributions Reinvested | | | 834 | | | | 94 | | |
Redeemed | | | (1,219 | ) | | | (421 | ) | |
Class IS: | |
Subscribed | | | — | | | | 12,500 | | |
Distributions Reinvested | | | 1,215 | | | | 320 | | |
Net Increase in Net Assets Resulting from Capital Share Transactions | | | 6,131 | | | | 40,491 | | |
Total Increase in Net Assets | | | 25,293 | | | | 42,064 | | |
Net Assets: | |
Beginning of Period | | | 85,878 | | | | 43,814 | | |
End of Period (Including Accumulated Net Investment Loss and Distributions in Excess of
Net Investment Income of $(—@) and $(9), respectively) | | $ | 111,171 | | | $ | 85,878 | | |
The accompanying notes are an integral part of the financial statements.
11
Morgan Stanley Institutional Fund, Inc.
Annual Report — December 31, 2017
Statements of Changes in Net Assets (cont'd) | | Year Ended
December 31, 2017
(000) | | Year Ended
December 31, 2016
(000) | |
(1) Capital Share Transactions: | |
Class I: | |
Shares Subscribed | | | 573 | | | | 1,975 | | |
Shares Issued on Distributions Reinvested | | | 177 | | | | 55 | | |
Shares Redeemed | | | (677 | ) | | | (1,006 | ) | |
Net Increase in Class I Shares Outstanding | | | 73 | | | | 1,024 | | |
Class A: | |
Shares Subscribed | | | 237 | | | | 957 | | |
Shares Issued on Distributions Reinvested | | | 82 | | | | 20 | | |
Shares Redeemed | | | (345 | ) | | | (520 | ) | |
Net Increase (Decrease) in Class A Shares Outstanding | | | (26 | ) | | | 457 | | |
Class L: | |
Shares Exchanged | | | — | | | | 3 | | |
Shares Subscribed | | | 1 | | | | — | | |
Shares Issued on Distributions Reinvested | | | 13 | | | | 6 | | |
Shares Redeemed | | | (35 | ) | | | (107 | ) | |
Net Decrease in Class L Shares Outstanding | | | (21 | ) | | | (98 | ) | |
Class C: | |
Shares Subscribed | | | 219 | | | | 288 | | |
Shares Issued on Distributions Reinvested | | | 41 | | | | 6 | | |
Shares Redeemed | | | (63 | ) | | | (25 | ) | |
Net Increase in Class C Shares Outstanding | | | 197 | | | | 269 | | |
Class IS: | |
Shares Subscribed | | | — | | | | 741 | | |
Shares Issued on Distributions Reinvested | | | 57 | | | | 18 | | |
Net Increase in Class IS Shares Outstanding | | | 57 | | | | 759 | | |
@ Amount is less than $500.
The accompanying notes are an integral part of the financial statements.
12
Morgan Stanley Institutional Fund, Inc.
Annual Report — December 31, 2017
Financial Highlights
Advantage Portfolio
| | | Class I | |
| | | Year Ended December 31, | |
Selected Per Share Data and Ratios | | 2017 | | 2016(1) | | 2015 | | 2014 | | 2013 | |
Net Asset Value, Beginning of Period | | $ | 17.47 | | | $ | 17.40 | | | $ | 16.83 | | | $ | 16.41 | | | $ | 12.40 | | |
Income from Investment Operations: | |
Net Investment Income(2) | | | 0.00 | (3) | | | 0.07 | | | | 0.01 | | | | 0.04 | | | | 0.01 | | |
Net Realized and Unrealized Gain | | | 5.57 | | | | 0.42 | | | | 2.11 | | | | 1.15 | | | | 4.54 | | |
Total from Investment Operations | | | 5.57 | | | | 0.49 | | | | 2.12 | | | | 1.19 | | | | 4.55 | | |
Distributions from and/or in Excess of: | |
Net Investment Income | | | — | | | | (0.04 | ) | | | (0.02 | ) | | | (0.01 | ) | | | — | | |
Net Realized Gain | | | (1.59 | ) | | | (0.38 | ) | | | (1.53 | ) | | | (0.76 | ) | | | (0.54 | ) | |
Total Distributions | | | (1.59 | ) | | | (0.42 | ) | | | (1.55 | ) | | | (0.77 | ) | | | (0.54 | ) | |
Net Asset Value, End of Period | | $ | 21.45 | | | $ | 17.47 | | | $ | 17.40 | | | $ | 16.83 | | | $ | 16.41 | | |
Total Return(4) | | | 32.06 | % | | | 2.82 | % | | | 12.56 | % | | | 7.43 | % | | | 37.11 | % | |
Ratios and Supplemental Data: | |
Net Assets, End of Period (Thousands) | | $ | 54,002 | | | $ | 42,695 | | | $ | 24,718 | | | $ | 17,971 | | | $ | 14,712 | | |
Ratio of Expenses to Average Net Assets(8) | | | 0.84 | %(5) | | | 0.84 | %(5) | | | 0.86 | %(5)(6) | | | 1.04 | %(5) | | | 1.04 | %(5) | |
Ratio of Net Investment Income to Average Net Assets(8) | | | 0.02 | %(5) | | | 0.38 | %(5) | | | 0.06 | %(5) | | | 0.23 | %(5) | | | 0.11 | %(5) | |
Ratio of Rebate from Morgan Stanley Affiliates to Average Net Assets | | | 0.01 | % | | | 0.01 | % | | | 0.00 | %(7) | | | 0.01 | % | | | 0.01 | % | |
Portfolio Turnover Rate | | | 65 | % | | | 79 | % | | | 51 | % | | | 31 | % | | | 36 | % | |
(8) Supplemental Information on the Ratios to Average Net Assets: | |
Ratios Before Expense Limitation: | |
Expenses to Average Net Assets | | | 1.09 | % | | | 1.15 | % | | | 1.49 | % | | | 1.78 | % | | | 2.33 | % | |
Net Investment Income (Loss) to Average Net Assets | | | (0.23 | )% | | | 0.07 | % | | | (0.57 | )% | | | (0.51 | )% | | | (1.18 | )% | |
(1) Reflects prior period custodian out-of-pocket expenses that were reimbursed in September 2016. The amount of the reimbursement was immaterial on a per share basis and did not impact the total return of Class I shares. The Ratio of Expenses to Average Net Assets and the Ratio of Net Investment Income to Average Net Assets would be unchanged as the reimbursement of custodian fees was offset against expense waivers/reimbursements with no impact to net expenses or net investment income.
(2) Per share amount is based on average shares outstanding.
(3) Amount is less than $0.005 per share.
(4) Calculated based on the net asset value as of the last business day of the period.
(5) The Ratios of Expenses and Net Investment Income reflect the rebate of certain Fund expenses in connection with the investments in Morgan Stanley affiliates during the period. The effect of the rebate on the ratios is disclosed in the above table as "Ratio of Rebate from Morgan Stanley Affiliates to Average Net Assets."
(6) Effective January 23, 2015, the Adviser has agreed to limit the ratio of expenses to average net assets to the maximum ratio of 0.85% for Class I shares. Prior to January 23, 2015, the maximum ratio was 1.05% for Class I shares.
(7) Amount is less than 0.005%.
The accompanying notes are an integral part of the financial statements.
13
Morgan Stanley Institutional Fund, Inc.
Annual Report — December 31, 2017
Financial Highlights
Advantage Portfolio
| | | Class A | |
| | | Year Ended December 31, | |
Selected Per Share Data and Ratios | | 2017 | | 2016(1) | | 2015 | | 2014 | | 2013 | |
Net Asset Value, Beginning of Period | | $ | 17.26 | | | $ | 17.22 | | | $ | 16.70 | | | $ | 16.34 | | | $ | 12.39 | | |
Income (Loss) from Investment Operations: | |
Net Investment Income (Loss)(2) | | | (0.06 | ) | | | 0.01 | | | | (0.06 | ) | | | (0.03 | ) | | | (0.07 | ) | |
Net Realized and Unrealized Gain | | | 5.49 | | | | 0.41 | | | | 2.11 | | | | 1.15 | | | | 4.56 | | |
Total from Investment Operations | | | 5.43 | | | | 0.42 | | | | 2.05 | | | | 1.12 | | | | 4.49 | | |
Distributions from and/or in Excess of: | |
Net Realized Gain | | | (1.59 | ) | | | (0.38 | ) | | | (1.53 | ) | | | (0.76 | ) | | | (0.54 | ) | |
Net Asset Value, End of Period | | $ | 21.10 | | | $ | 17.26 | | | $ | 17.22 | | | $ | 16.70 | | | $ | 16.34 | | |
Total Return(3) | | | 31.64 | % | | | 2.47 | % | | | 12.20 | % | | | 7.05 | % | | | 36.65 | % | |
Ratios and Supplemental Data: | |
Net Assets, End of Period (Thousands) | | $ | 23,715 | | | $ | 19,850 | | | $ | 11,939 | | | $ | 3,738 | | | $ | 3,134 | | |
Ratio of Expenses to Average Net Assets(8) | | | 1.19 | %(4) | | | 1.19 | %(4) | | | 1.18 | %(4)(6) | | | 1.39 | %(4) | | | 1.35 | %(4)(5) | |
Ratio of Net Investment Income (Loss) to Average Net Assets(8) | | | (0.32 | )%(4) | | | 0.04 | %(4) | | | (0.31 | )%(4) | | | (0.15 | )%(4) | | | (0.44 | )%(4) | |
Ratio of Rebate from Morgan Stanley Affiliates to Average Net Assets | | | 0.01 | % | | | 0.01 | % | | | 0.01 | % | | | 0.01 | % | | | 0.00 | %(7) | |
Portfolio Turnover Rate | | | 65 | % | | | 79 | % | | | 51 | % | | | 31 | % | | | 36 | % | |
(8) Supplemental Information on the Ratios to Average Net Assets: | |
Ratios Before Expense Limitation: | |
Expenses to Average Net Assets | | | 1.39 | % | | | 1.43 | % | | | 1.87 | % | | | 2.14 | % | | | 2.68 | % | |
Net Investment Loss to Average Net Assets | | | (0.52 | )% | | | (0.20 | )% | | | (1.00 | )% | | | (0.90 | )% | | | (1.77 | )% | |
(1) Reflects prior period custodian out-of-pocket expenses that were reimbursed in September 2016. The amount of the reimbursement was immaterial on a per share basis and did not impact the total return of Class A shares. The Ratio of Expenses to Average Net Assets and the Ratio of Net Investment Income to Average Net Assets would be unchanged as the reimbursement of custodian fees was offset against expense waivers/reimbursements with no impact to net expenses or net investment income.
(2) Per share amount is based on average shares outstanding.
(3) Calculated based on the net asset value which does not reflect sales charges, if applicable, as of the last business day of the period.
(4) The Ratios of Expenses and Net Investment Income (Loss) reflect the rebate of certain Fund expenses in connection with the investments in Morgan Stanley affiliates during the period. The effect of the rebate on the ratios is disclosed in the above table as "Ratio of Rebate from Morgan Stanley Affiliates to Average Net Assets."
(5) Effective September 16, 2013, the Adviser has agreed to limit the ratio of expenses to average net assets to the maximum ratio of 1.40% for Class A shares. Prior to September 16, 2013, the maximum ratio was 1.30% for Class A shares.
(6) Effective January 23, 2015, the Adviser has agreed to limit the ratio of expenses to average net assets to the maximum ratio of 1.20% for Class A shares. Prior to January 23, 2015, the maximum ratio was 1.40% for Class A shares.
(7) Amount is less than 0.005%.
The accompanying notes are an integral part of the financial statements.
14
Morgan Stanley Institutional Fund, Inc.
Annual Report — December 31, 2017
Financial Highlights
Advantage Portfolio
| | | Class L | |
| | | Year Ended December 31, | |
Selected Per Share Data and Ratios | | 2017 | | 2016(1) | | 2015 | | 2014 | | 2013 | |
Net Asset Value, Beginning of Period | | $ | 17.46 | | | $ | 17.40 | | | $ | 16.82 | | | $ | 16.42 | | | $ | 12.42 | | |
Income (Loss) from Investment Operations: | |
Net Investment Income (Loss)(2) | | | (0.02 | ) | | | 0.04 | | | | (0.01 | ) | | | 0.02 | | | | (0.01 | ) | |
Net Realized and Unrealized Gain | | | 5.57 | | | | 0.43 | | | | 2.12 | | | | 1.14 | | | | 4.55 | | |
Total from Investment Operations | | | 5.55 | | | | 0.47 | | | | 2.11 | | | | 1.16 | | | | 4.54 | | |
Distributions from and/or in Excess of: | |
Net Investment Income | | | — | | | | (0.03 | ) | | | — | | | | (0.00 | )(3) | | | — | | |
Net Realized Gain | | | (1.59 | ) | | | (0.38 | ) | | | (1.53 | ) | | | (0.76 | ) | | | (0.54 | ) | |
Total Distributions | | | (1.59 | ) | | | (0.41 | ) | | | (1.53 | ) | | | (0.76 | ) | | | (0.54 | ) | |
Net Asset Value, End of Period | | $ | 21.42 | | | $ | 17.46 | | | $ | 17.40 | | | $ | 16.82 | | | $ | 16.42 | | |
Total Return(4) | | | 31.96 | % | | | 2.72 | % | | | 12.47 | % | | | 7.28 | % | | | 36.97 | % | |
Ratios and Supplemental Data: | |
Net Assets, End of Period (Thousands) | | $ | 4,077 | | | $ | 3,684 | | | $ | 5,369 | | | $ | 6,549 | | | $ | 3,908 | | |
Ratio of Expenses to Average Net Assets(8) | | | 0.96 | %(5) | | | 0.91 | %(5) | | | 0.97 | %(5)(7) | | | 1.18 | %(5) | | | 1.08 | %(5)(6) | |
Ratio of Net Investment Income (Loss) to Average Net Assets(8) | | | (0.10 | )%(5) | | | 0.26 | %(5) | | | (0.03 | )%(5) | | | 0.12 | %(5) | | | (0.06 | )%(5) | |
Ratio of Rebate from Morgan Stanley Affiliates to Average Net Assets | | | 0.01 | % | | | 0.01 | % | | | 0.01 | % | | | 0.01 | % | | | 0.01 | % | |
Portfolio Turnover Rate | | | 65 | % | | | 79 | % | | | 51 | % | | | 31 | % | | | 36 | % | |
(8) Supplemental Information on the Ratios to Average Net Assets: | |
Ratios Before Expense Limitation: | |
Expenses to Average Net Assets | | | 1.87 | % | | | 1.85 | % | | | 2.33 | % | | | 2.64 | % | | | 3.10 | % | |
Net Investment Loss to Average Net Assets | | | (1.01 | )% | | | (0.68 | )% | | | (1.39 | )% | | | (1.34 | )% | | | (2.08 | )% | |
(1) Reflects prior period custodian out-of-pocket expenses that were reimbursed in September 2016. The amount of the reimbursement was immaterial on a per share basis and did not impact the total return of Class L shares. The Ratio of Expenses to Average Net Assets and the Ratio of Net Investment Income to Average Net Assets would be unchanged as the reimbursement of custodian fees was offset against expense waivers/reimbursements with no impact to net expenses or net investment income.
(2) Per share amount is based on average shares outstanding.
(3) Amount is less than $0.005 per share.
(4) Calculated based on the net asset value as of the last business day of the period.
(5) The Ratios of Expenses and Net Investment Income (Loss) reflect the rebate of certain Fund expenses in connection with the investments in Morgan Stanley affiliates during the period. The effect of the rebate on the ratios is disclosed in the above table as "Ratio of Rebate from Morgan Stanley Affiliates to Average Net Assets."
(6) Effective September 16, 2013, the Adviser has agreed to limit the ratio of expenses to average net assets to the maximum ratio of 1.19% for Class L shares. Prior to September 16, 2013, the maximum ratio was 1.09% for Class L shares.
(7) Effective January 23, 2015, the Adviser has agreed to limit the ratio of expenses to average net assets to the maximum ratio of 0.99% for Class L shares. Prior to January 23, 2015, the maximum ratio was 1.19% for Class L shares.
The accompanying notes are an integral part of the financial statements.
15
Morgan Stanley Institutional Fund, Inc.
Annual Report — December 31, 2017
Financial Highlights
Advantage Portfolio
| | | Class C | |
| | | Year Ended December 31, | | Period from
April 30, 2015(2) to | |
Selected Per Share Data and Ratios | | 2017 | | 2016(1) | | December 31, 2015 | |
Net Asset Value, Beginning of Period | | $ | 17.16 | | | $ | 17.25 | | | $ | 18.08 | | |
Income (Loss) from Investment Operations: | |
Net Investment Loss(3) | | | (0.20 | ) | | | (0.12 | ) | | | (0.14 | ) | |
Net Realized and Unrealized Gain | | | 5.45 | | | | 0.41 | | | | 0.86 | | |
Total from Investment Operations | | | 5.25 | | | | 0.29 | | | | 0.72 | | |
Distributions from and/or in Excess of: | |
Net Investment Income | | | — | | | | — | | | | (0.02 | ) | |
Net Realized Gain | | | (1.59 | ) | | | (0.38 | ) | | | (1.53 | ) | |
Total Distributions | | | (1.59 | ) | | | (0.38 | ) | | | (1.55 | ) | |
Net Asset Value, End of Period | | $ | 20.82 | | | $ | 17.16 | | | $ | 17.25 | | |
Total Return(4) | | | 30.77 | % | | | 1.71 | % | | | 3.91 | %(6) | |
Ratios and Supplemental Data: | |
Net Assets, End of Period (Thousands) | | $ | 11,835 | | | $ | 6,376 | | | $ | 1,776 | | |
Ratio of Expenses to Average Net Assets(8) | | | 1.90 | %(5) | | | 1.94 | %(5) | | | 1.94 | %(5)(7) | |
Ratio of Net Investment Loss to Average Net Assets(8) | | | (1.01 | )%(5) | | | (0.72 | )%(5) | | | (1.15 | )%(5)(7) | |
Ratio of Rebate from Morgan Stanley Affiliates to Average Net Assets | | | 0.01 | % | | | 0.01 | % | | | 0.01 | %(7) | |
Portfolio Turnover Rate | | | 65 | % | | | 79 | % | | | 51 | % | |
(8) Supplemental Information on the Ratios to Average Net Assets: | |
Ratios Before Expense Limitation: | |
Expense to Average Net Assets | | | 2.10 | % | | | 2.20 | % | | | 2.83 | %(7) | |
Net Investment Loss to Average Net Assets | | | (1.21 | )% | | | (0.98 | )% | | | (2.04 | )%(7) | |
(1) Reflects prior period custodian out-of-pocket expenses that were reimbursed in September 2016. The amount of the reimbursement was immaterial on a per share basis and did not impact the total return of Class C shares. The Ratio of Expenses to Average Net Assets and the Ratio of Net Investment Loss to Average Net Assets would be unchanged as the reimbursement of custodian fees was offset against expense waivers/reimbursements with no impact to net expenses or net investment loss.
(2) Commencement of Offering.
(3) Per share amount is based on average shares outstanding.
(4) Calculated based on the net asset value which does not reflect sales charges, if applicable, as of the last business day of the period.
(5) The Ratios of Expenses and Net Investment Loss reflect the rebate of certain Fund expenses in connection with the investments in Morgan Stanley affiliates during the period. The effect of the rebate on the ratios is disclosed in the above table as "Ratio of Rebate from Morgan Stanley Affiliates to Average Net Assets."
(6) Not annualized.
(7) Annualized.
The accompanying notes are an integral part of the financial statements.
16
Morgan Stanley Institutional Fund, Inc.
Annual Report — December 31, 2017
Financial Highlights
Advantage Portfolio
| | | Class IS | |
| | | Year Ended December 31, | | Period from
September 13, 2013(2) to | |
Selected Per Share Data and Ratios | | 2017 | | 2016(1) | | 2015 | | 2014 | | December 31, 2013 | |
Net Asset Value, Beginning of Period | | $ | 17.48 | | | $ | 17.42 | | | $ | 16.84 | | | $ | 16.41 | | | $ | 14.59 | | |
Income (Loss) from Investment Operations: | |
Net Investment Income (Loss)(3) | | | 0.01 | | | | 0.08 | | | | 0.02 | | | | 0.04 | | | | (0.01 | ) | |
Net Realized and Unrealized Gain | | | 5.59 | | | | 0.41 | | | | 2.11 | | | | 1.16 | | | | 2.21 | | |
Total from Investment Operations | | | 5.60 | | | | 0.49 | | | | 2.13 | | | | 1.20 | | | | 2.20 | | |
Distributions from and/or in Excess of: | |
Net Investment Income | | | — | | | | (0.05 | ) | | | (0.02 | ) | | | (0.01 | ) | | | — | | |
Net Realized Gain | | | (1.59 | ) | | | (0.38 | ) | | | (1.53 | ) | | | (0.76 | ) | | | (0.38 | ) | |
Total Distributions | | | (1.59 | ) | | | (0.43 | ) | | | (1.55 | ) | | | (0.77 | ) | | | (0.38 | ) | |
Net Asset Value, End of Period | | $ | 21.49 | | | $ | 17.48 | | | $ | 17.42 | | | $ | 16.84 | | | $ | 16.41 | | |
Total Return(4) | | | 32.22 | % | | | 2.79 | % | | | 12.65 | % | | | 7.50 | % | | | 15.15 | %(9) | |
Ratios and Supplemental Data: | |
Net Assets, End of Period (Thousands) | | $ | 17,542 | | | $ | 13,273 | | | $ | 12 | | | $ | 12 | | | $ | 11 | | |
Ratio of Expenses to Average Net Assets(11) | | | 0.80 | %(5) | | | 0.80 | %(5) | | | 0.82 | %(5)(7) | | | 1.00 | %(5) | | | 1.01 | %(5)(6)(10) | |
Ratio of Net Investment Income (Loss) to Average Net Assets(11) | | | 0.07 | %(5) | | | 0.46 | %(5) | | | 0.10 | %(5) | | | 0.26 | %(5) | | | (0.25 | )%(5)(10) | |
Ratio of Rebate from Morgan Stanley Affiliates to Average Net Assets | | | 0.01 | % | | | 0.01 | % | | | 0.00 | %(8) | | | 0.01 | % | | | 0.00 | %(8)(10) | |
Portfolio Turnover Rate | | | 65 | % | | | 79 | % | | | 51 | % | | | 31 | % | | | 36 | % | |
(11) Supplemental Information on the Ratios to Average Net Assets: | |
Ratios Before Expense Limitation: | |
Expenses to Average Net Assets | | | 1.01 | % | | | 1.05 | % | | | 14.53 | % | | | 18.84 | % | | | 7.31 | %(10) | |
Net Investment Income (Loss) to Average Net Assets | | | (0.14 | )% | | | 0.21 | % | | | (13.61 | )% | | | (17.58 | )% | | | (6.55 | )%(10) | |
(1) Reflects prior period custodian out-of-pocket expenses that were reimbursed in September 2016. The amount of the reimbursement was immaterial on a per share basis and did not impact the total return of Class IS shares. The Ratio of Expenses to Average Net Assets and the Ratio of Net Investment Income to Average Net Assets would be unchanged as the reimbursement of custodian fees was offset against expense waivers/reimbursements with no impact to net expenses or net investment income.
(2) Commencement of Offering.
(3) Per share amount is based on average shares outstanding.
(4) Calculated based on the net asset value as of the last business day of the period.
(5) The Ratios of Expenses and Net Investment Income (Loss) reflect the rebate of certain Fund expenses in connection with the investments in Morgan Stanley affiliates during the period. The effect of the rebate on the ratios is disclosed in the above table as "Ratio of Rebate from Morgan Stanley Affiliates to Average Net Assets."
(6) Effective September 16, 2013, the Adviser has agreed to limit the ratio of expenses to average net assets to the maximum ratio of 1.01% for Class IS shares.
(7) Effective January 23, 2015, the Adviser has agreed to limit the ratio of expenses to average net assets to the maximum ratio of 0.81% for Class IS shares. Prior to January 23, 2015, the maximum ratio was 1.01% for Class IS shares.
(8) Amount is less than 0.005%.
(9) Not annualized.
(10) Annualized.
The accompanying notes are an integral part of the financial statements.
17
Morgan Stanley Institutional Fund, Inc.
Annual Report — December 31, 2017
Notes to Financial Statements
Morgan Stanley Institutional Fund, Inc. (the "Company") is registered under the Investment Company Act of 1940, as amended (the "Act"), as an open-end management investment company. The Company is comprised of twenty-nine separate, active, diversified and non-diversified funds (individually referred to as a "Fund", collectively as the "Funds"). The Company applies investment company accounting and reporting guidance.
The accompanying financial statements relate to the Advantage Portfolio. The Fund seeks long-term capital appreciation.
The Fund offers five classes of shares — Class I, Class A, Class L, Class C and Class IS. On April 30, 2015, the Fund suspended offering of Class L shares. Existing Class L shareholders may invest through reinvestment of dividends and distributions.
A. Significant Accounting Policies: The following significant accounting policies are in conformity with U.S. generally accepted accounting principles ("GAAP"). Such policies are consistently followed by the Company in the preparation of its financial statements. GAAP may require management to make estimates and assumptions that affect the reported amounts and disclosures in the financial statements. Actual results may differ from those estimates.
1. Security Valuation: (1) An equity portfolio security listed or traded on an exchange is valued at its latest reported sales price (or at the exchange official closing price if such exchange reports an official closing price), and if there were no sales on a given day and if there is no official exchange closing price for that day, the security is valued at the mean between the last reported bid and asked prices if such bid and asked prices are available on the relevant exchanges. Listed equity securities not traded on the valuation date with no reported bid and asked prices available on the exchange are valued at the mean between the current bid and asked prices obtained from one or more reputable brokers or dealers. In cases where a security is traded on more than one exchange, the security is valued on the exchange designated as the primary market; (2) all other equity portfolio securities for which over-the-counter ("OTC") market quotations are readily available are valued at the latest reported sales price (or at the market official closing price if such market reports an official closing price), and if there was no trading in the security on a given day and if there is no official closing price from relevant markets for that day, the security is valued at the mean between the last reported bid and asked prices if
such bid and asked prices are available on the relevant markets. An unlisted equity security that does not trade on the valuation date and for which bid and asked prices from the relevant markets are unavailable is valued at the mean between the current bid and asked prices obtained from one or more reputable brokers or dealers; (3) listed options are valued at the last reported sales price on the exchange on which they are listed (or at the exchange official closing price if such exchange reports an official closing price). If an official closing price or last reported sales price is unavailable, the listed option should be fair valued at the mean between its latest bid and ask prices. Unlisted options are valued at the mean between their latest bid and ask prices from a broker/dealer or valued by a pricing service/vendor; (4) certain portfolio securities may be valued by an outside pricing service/vendor approved by the Company's Board of Directors (the "Directors"). The pricing service/vendor may employ a pricing model that takes into account, among other things, bids, yield spreads, and/or other market data and specific security characteristics. Alternatively, if a valuation is not available from an outside pricing service/vendor, and the security trades on an exchange, the security may be valued at its latest reported sale price (or at the exchange official closing price if such exchange reports an official closing price), prior to the time when assets are valued. If there are no sales on a given day and if there is no official exchange closing price for that day, the security is valued at the mean between the last reported bid and asked prices if such bid and asked prices are available in the relevant exchanges; (5) when market quotations are not readily available, including circumstances under which Morgan Stanley Investment Management Inc. (the "Adviser") determines that the closing price, last sale price or the mean between the last reported bid and asked prices are not reflective of a security's market value, portfolio securities are valued at their fair value as determined in good faith under procedures established by and under the general supervision of the Directors. Occasionally, developments affecting the closing prices of securities and other assets may occur between the times at which valuations of such securities are determined (that is, close of the foreign market on which the securities trade) and the close of business of the New York Stock Exchange ("NYSE"). If developments occur during such periods that are expected to materially affect the value of such securities, such valuations may be adjusted to reflect the estimated fair value of such securities as of the close of the NYSE, as determined in good
18
Morgan Stanley Institutional Fund, Inc.
Annual Report — December 31, 2017
Notes to Financial Statements (cont'd)
faith by the Directors or by the Adviser using a pricing service and/or procedures approved by the Directors; (6) quotations of foreign portfolio securities, other assets and liabilities and forward contracts stated in foreign currency are translated into U.S. dollar equivalents at the prevailing market rates prior to the close of the NYSE; and (7) investments in mutual funds, including the Morgan Stanley Institutional Liquidity Funds, are valued at the net asset value ("NAV") as of the close of each business day.
The Directors have responsibility for determining in good faith the fair value of the investments, and the Directors may appoint others, such as the Company's Adviser or a valuation committee, to assist the Directors in determining fair value and to make the actual calculations pursuant to the fair valuation methodologies previously approved by the Directors. Under procedures approved by the Directors, the Company's Adviser has formed a Valuation Committee whose members are approved by the Directors. The Valuation Committee provides administration and oversight of the Company's valuation policies and procedures, which are reviewed at least annually by the Directors. These procedures allow the Company to utilize independent pricing services, quotations from securities and financial instrument dealers, and other market sources to determine fair value.
The Company has procedures to determine the fair value of securities and other financial instruments for which market prices are not readily available. Under these procedures, the Valuation Committee convenes on a regular and ad hoc basis to review such securities and considers a number of factors, including valuation methodologies and significant unobservable valuation inputs, when arriving at fair value. The Valuation Committee may employ a market-based approach which may use related or comparable assets or liabilities, recent transactions, market multiples, book values, and other relevant information for the investment to determine the fair value of the investment. An income-based valuation approach may also be used in which the anticipated future cash flows of the investment are discounted to calculate fair value. Discounts may also be applied due to the nature or duration of any restrictions on the disposition of the investments. Due to the inherent uncertainty of valuations of such investments, the fair values may differ significantly from the values that would have been used had an active market existed. The Valuation
Committee employs various methods for calibrating these valuation approaches including a regular review of valuation methodologies, key inputs and assumptions, transactional back-testing or disposition analysis, and reviews of any related market activity.
2. Fair Value Measurement: Financial Accounting Standards Board ("FASB") Accounting Standards CodificationTM ("ASC") 820, "Fair Value Measurement" ("ASC 820"), defines fair value as the value that the Fund would receive to sell an investment or pay to transfer a liability in a timely transaction with an independent buyer in the principal market, or in the absence of a principal market, the most advantageous market for the investment or liability. ASC 820 establishes a three-tier hierarchy to distinguish between (1) inputs that reflect the assumptions market participants would use in valuing an asset or liability developed based on market data obtained from sources independent of the reporting entity (observable inputs) and (2) inputs that reflect the reporting entity's own assumptions about the assumptions market participants would use in valuing an asset or liability developed based on the best information available in the circumstances (unobservable inputs) and to establish classification of fair value measurements for disclosure purposes. Various inputs are used in determining the value of the Fund's investments. The inputs are summarized in the three broad levels listed below.
• Level 1 – unadjusted quoted prices in active markets for identical investments
• Level 2 – other significant observable inputs (including quoted prices for similar investments, interest rates, prepayment speeds, credit risk, etc.)
• Level 3 – significant unobservable inputs including the Fund's own assumptions in determining the fair value of investments. Factors considered in making this determination may include, but are not limited to, information obtained by contacting the issuer, analysts, or the appropriate stock exchange (for exchange-traded securities), analysis of the issuer's financial statements or other available documents and, if necessary, available information concerning other securities in similar circumstances
19
Morgan Stanley Institutional Fund, Inc.
Annual Report — December 31, 2017
Notes to Financial Statements (cont'd)
The inputs or methodology used for valuing securities are not necessarily an indication of the risk associated with investing in those securities and the determination of the significance of a particular input to the fair value measurement in its entirety requires judgment and considers factors specific to each security.
The following is a summary of the inputs used to value the Fund's investments as of December 31, 2017.
Investment Type | | Level 1
Unadjusted
quoted
prices
(000) | | Level 2
Other
significant
observable
inputs
(000) | | Level 3
Significant
unobservable
inputs
(000) | | Total
(000) | |
Assets: | |
Common Stocks | |
Aerospace & Defense | | $ | 9,495 | | | $ | — | | | $ | — | | | $ | 9,495 | | |
Automobiles | | | 1,208 | | | | — | | | | — | | | | 1,208 | | |
Capital Markets | | | 2,738 | | | | — | | | | — | | | | 2,738 | | |
Chemicals | | | 1,767 | | | | — | | | | — | | | | 1,767 | | |
Construction Materials | | | 3,533 | | | | — | | | | — | | | | 3,533 | | |
Diversified Financial
Services | | | 5,731 | | | | — | | | | — | | | | 5,731 | | |
Health Care Equipment &
Supplies | | | 2,726 | | | | — | | | | — | | | | 2,726 | | |
Hotels, Restaurants &
Leisure | | | 5,467 | | | | — | | | | — | | | | 5,467 | | |
Household Durables | | | 1,121 | | | | — | | | | — | | | | 1,121 | | |
Information Technology
Services | | | 1,667 | | | | — | | | | — | | | | 1,667 | | |
Insurance | | | 1,148 | | | | — | | | | — | | | | 1,148 | | |
Internet & Direct
Marketing Retail | | | 11,019 | | | | — | | | | — | | | | 11,019 | | |
Internet Software &
Services | | | 15,320 | | | | — | | | | — | | | | 15,320 | | |
Machinery | | | 1,592 | | | | — | | | | — | | | | 1,592 | | |
Media | | | 4,898 | | | | — | | | | — | | | | 4,898 | | |
Pharmaceuticals | | | 2,728 | | | | — | | | | — | | | | 2,728 | | |
Professional Services | | | 1,669 | | | | — | | | | — | | | | 1,669 | | |
Road & Rail | | | 6,098 | | | | — | | | | — | | | | 6,098 | | |
Software | | | 11,149 | | | | — | | | | — | | | | 11,149 | | |
Specialty Retail | | | 8,288 | | | | — | | | | — | | | | 8,288 | | |
Textiles, Apparel &
Luxury Goods | | | 3,036 | | | | 5,424 | | | | — | | | | 8,460 | | |
Total Common Stocks | | | 102,398 | | | | 5,424 | | | | — | | | | 107,822 | | |
Call Options Purchased | | | — | | | | 32 | | | | — | | | | 32 | | |
Short-Term Investment | |
Investment Company | | | 3,431 | | | | — | | | | — | | | | 3,431 | | |
Total Assets | | $ | 105,829 | | | $ | 5,456 | | | $ | — | | | $ | 111,285 | | |
Transfers between investment levels may occur as the markets fluctuate and/or the availability of data used in an investment's valuation changes. The Fund recognizes transfers between the levels as of the end of the period. As of December 31, 2017, the Fund did not have any investments transfer between investment levels.
3. Foreign Currency Translation and Foreign Investments: The books and records of the Fund are
maintained in U.S. dollars. Foreign currency amounts are translated into U.S. dollars as follows:
– investments, other assets and liabilities at the prevailing rate of exchange on the valuation date;
– investment transactions and investment income at the prevailing rates of exchange on the dates of such transactions.
Although the net assets of the Fund are presented at the foreign exchange rates and market values at the close of the period, the Fund does not isolate that portion of the results of operations arising as a result of changes in the foreign exchange rates from the fluctuations arising from changes in the market prices of securities held at period end. Similarly, the Fund does not isolate the effect of changes in foreign exchange rates from the fluctuations arising from changes in the market prices of securities sold during the period. Accordingly, realized and unrealized foreign currency gains (losses) on investments in securities are included in the reported net realized and unrealized gains (losses) on investment transactions and balances. However, pursuant to U.S. federal income tax regulations, gains and losses from certain foreign currency transactions and the foreign currency portion of gains and losses realized on sales and maturities of foreign denominated debt securities are treated as ordinary income for U.S. federal income tax purposes.
Net realized gains (losses) on foreign currency transactions represent net foreign exchange gains (losses) from foreign currency forward exchange contracts, disposition of foreign currencies, currency gains (losses) realized between the trade and settlement dates on securities transactions, and the difference between the amount of investment income and foreign withholding taxes recorded on the Fund's books and the U.S. dollar equivalent amounts actually received or paid. Net unrealized currency gains (losses) from valuing foreign currency denominated assets and liabilities at period end exchange rates are reflected as a component of unrealized appreciation (depreciation) in the Statement of Assets and Liabilities. The change in unrealized currency gains (losses) on foreign currency translations for the period is reflected in the Statement of Operations.
Foreign security and currency transactions may involve certain considerations and risks not typically associated
20
Morgan Stanley Institutional Fund, Inc.
Annual Report — December 31, 2017
Notes to Financial Statements (cont'd)
with those of U.S. dollar denominated transactions as a result of, among other factors, fluctuations of exchange rates in relation to the U.S. dollar, the possibility of lower levels of governmental supervision and regulation of foreign securities markets and the possibility of political or economic instability.
Governmental approval for foreign investments may be required in advance of making an investment under certain circumstances in some countries, and the extent of foreign investments in domestic companies may be subject to limitation in other countries. Foreign ownership limitations also may be imposed by the charters of individual companies to prevent, among other concerns, violations of foreign investment limitations. As a result, an additional class of shares (identified as "Foreign" in the Portfolio of Investments) may be created and offered for investment. The "local" and "foreign shares" market values may differ. In the absence of trading of the foreign shares in such markets, the Fund values the foreign shares at the closing exchange price of the local shares.
4. Derivatives: The Fund may, but is not required to, use derivative instruments for a variety of purposes, including hedging, risk management, portfolio management or to earn income. Derivatives are financial instruments whose value is based, in part, on the value of an underlying asset, interest rate, index or financial instrument. Prevailing interest rates and volatility levels, among other things, also affect the value of derivative instruments. A derivative instrument often has risks similar to its underlying asset and may have additional risks, including imperfect correlation between the value of the derivative and the underlying asset, risks of default by the counterparty to certain transactions, magnification of losses incurred due to changes in the market value of the securities, instruments, indices or interest rates to which the derivative instrument relates, risks that the transactions may not be liquid and risks arising from margin requirements. The use of derivatives involves risks that are different from, and possibly greater than, the risks associated with other portfolio investments. Derivatives may involve the use of highly specialized instruments that require investment techniques and risk analyses different from those associated with other portfolio investments. All of the Fund's holdings, including derivative instruments, are marked-to-market each day with the change in value reflected in unrealized appreciation (depreciation). Upon disposition, a realized gain or loss is recognized.
Certain derivative transactions may give rise to a form of leverage. Leverage magnifies the potential for gain and the risk of loss. Leverage associated with derivative transactions may cause the Fund to liquidate portfolio positions when it may not be advantageous to do so to satisfy its obligations or to meet earmarking or segregation requirements, pursuant to applicable Securities and Exchange Commission ("SEC") rules and regulations, or may cause the Fund to be more volatile than if the Fund had not been leveraged. Although the Adviser seeks to use derivatives to further the Fund's investment objectives, there is no assurance that the use of derivatives will achieve this result.
Following is a description of the derivative instruments and techniques that the Fund used during the period and their associated risks:
Options: With respect to options, the Fund is subject to equity risk, interest rate risk and foreign currency exchange risk in the normal course of pursuing its investment objectives. If the Fund buys an option, it buys a legal contract giving it the right to buy or sell a specific amount of the underlying instrument or foreign currency, or futures contract on the underlying instrument or foreign currency, at an agreed-upon price during a period of time or on a specified date typically in exchange for a premium paid by the Fund. The Fund may purchase and/or sell put and call options. Purchasing call options tends to increase the Fund's exposure to the underlying (or similar) instrument. Purchasing put options tends to decrease the Fund's exposure to the underlying (or similar) instrument. When entering into purchased option contracts, the Fund bears the risk of interest or exchange rates or securities prices moving unexpectedly, in which case, the Fund may not achieve the anticipated benefits of the purchased option contracts; however the risk of loss is limited to the premium paid. Purchased options are reported as part of "Total Investments in Securities" in the Statement of Assets and Liabilities. Premium paid for purchasing options which expired are treated as realized losses. If the Fund sells an option, it sells to another party the right to buy from or sell to the Fund a specific amount of the underlying instrument or foreign currency, or futures contract on the underlying instrument or foreign currency, at an agreed-upon price during a period of time or on a specified date typically in exchange for a premium received by the Fund. When options are purchased OTC, the Fund
21
Morgan Stanley Institutional Fund, Inc.
Annual Report — December 31, 2017
Notes to Financial Statements (cont'd)
bears the risk that the counterparty that wrote the option will be unable or unwilling to perform its obligations under the option contract. Options may also be illiquid and the Fund may have difficulty closing out its position. A decision as to whether, when and how to use options involves the exercise of skill and judgment and even a well-conceived option transaction may be unsuccessful because of market behavior or unexpected events. The prices of options can be highly volatile and the use of options can lower total returns.
FASB ASC 815, "Derivatives and Hedging" ("ASC 815"), is intended to improve financial reporting about derivative instruments by requiring enhanced disclosures to enable investors to better understand how and why the Fund uses derivative instruments, how these derivative instruments are accounted for and their effects on the Fund's financial position and results of operations.
The following table sets forth the fair value of the Fund's derivative contracts by primary risk exposure as of December 31, 2017.
| | | Asset Derivatives
Statement of Assets and
Liabilities Location | | Primary Risk
Exposure | | Value
(000) | |
Option Purchased
| | Investments, at Value
(Options Purchased) | | Currency Risk | | $ | 32 | (a) | |
(a) Amounts are included in Investments in Securities in the Statement of Assets and Liabilities.
The following tables set forth by primary risk exposure the Fund's realized gains (losses) and change in unrealized appreciation (depreciation) by type of derivative contract for the year ended December 31, 2017 in accordance with ASC 815.
Realized Gain (Loss) | |
Primary Risk Exposure | | Derivative Type | | Value
(000) | |
Currency Risk
| | Investments
(Options Purchased) | | $ | (93 | )(b) | |
(b) Amounts are included in Investments Sold in the Statement of Operations.
Change in Unrealized Appreciation (Depreciation) | |
Primary Risk Exposure | | Derivative Type | | Value
(000) | |
Currency Risk
| | Investments
(Options Purchased) | | $ | (172 | )(c) | |
(c) Amounts are included in Investments in the Statement of Operations.
At December 31, 2017, the Fund's derivative assets and liabilities are as follows:
Gross Amounts of Assets and Liabilities
Presented in the Statement of Assets and Liabilities | |
Derivatives | | Assets(d)
(000) | | Liabilities(d)
(000) | |
Options Purchased | | $ | 32 | (a) | | $ | — | | |
(a) Amounts are included in Investments in Securities in the Statement of Assets and Liabilities.
(d) Absent an event of default or early termination, OTC derivative assets and liabilities are presented gross and not offset in the Statement of Assets and Liabilities.
The Fund typically enters into International Swaps and Derivatives Association, Inc. Master Agreements ("ISDA Master Agreements") or similar master agreements (collectively, "Master Agreements") with its contract counterparties for certain OTC derivatives in order to, among other things, reduce its credit risk to counterparties. ISDA Master Agreements include provisions for general obligations, representations, collateral and events of default or termination. Under an ISDA Master Agreement, the Fund typically may offset with the counterparty certain OTC derivative financial instruments' payables and/or receivables with collateral held and/or posted and create one single net payment (close-out netting) in the event of default, termination and/or potential deterioration in the credit quality of the counterparty. Various Master Agreements govern the terms of certain transactions with counterparties, including transactions such as swap, forward, repurchase and reverse repurchase agreements. These Master Agreements typically attempt to reduce the counterparty risk associated with such transactions by specifying credit protection mechanisms and providing standardization that improves legal certainty. Cross-termination provisions under Master Agreements typically provide that a default in connection with one transaction between the Fund and a counterparty gives the non-defaulting party the right to terminate any other transactions in place with the defaulting party to create one single net payment due to/due from the defaulting party and may be a feature in certain Master Agreements. In the event the Fund exercises its right to terminate a Master Agreement after a counterparty experiences a termination event as defined in the Master Agreement, the return of collateral with market value in excess of the Fund's net liability may be delayed or denied.
The following table presents derivative financial instruments that are subject to enforceable netting arrangements as of December 31, 2017.
22
Morgan Stanley Institutional Fund, Inc.
Annual Report — December 31, 2017
Notes to Financial Statements (cont'd)
Gross Amounts Not Offset in the Statement of Assets and Liabilities | |
Counterparty | | Gross Asset
Derivatives
Presented in
Statement of
Assets and
Liabilities
(000) | | Financial
Instrument
(000) | | Collateral
Received
(000) | | Net Amount
(not less
than $0)
(000) | |
Royal Bank of Scotland | | $ | 32 | (e) | | $ | — | | | $ | — | | | $ | 32 | | |
(e) Amounts are included in Investments in Securities in the Statement of Assets and Liabilities.
For the year ended December 31, 2017, the approximate average monthly amount outstanding for each derivative type is as follows:
Options Purchased: | |
Average monthly notional amount | | | 23,015,000 | | |
5. Indemnifications: The Company enters into contracts that contain a variety of indemnifications. The Company's maximum exposure under these arrangements is unknown. However, the Company has not had prior claims or losses pursuant to these contracts and expects the risk of loss to be remote.
6. Dividends and Distributions to Shareholders: Dividend income and distributions to shareholders are recorded on the ex-dividend date. Dividends from net investment income, if any, are declared and paid annually. Net realized capital gains, if any, are distributed at least annually.
7. Security Transactions, Income and Expenses: Security transactions are accounted for on the trade date (date the order to buy or sell is executed). Realized gains and losses on the sale of investment securities are determined on the specific identified cost method. Dividend income and other distributions are recorded on the ex-dividend date (except for certain foreign dividends which may be recorded as soon as the Fund is informed of such dividends) net of applicable withholding taxes. Interest income is recognized on the accrual basis except where collection is in doubt. Discounts are accreted and premiums are amortized over the life of the respective securities. Most expenses of the Company can be directly attributed to a particular Fund. Expenses which cannot be directly attributed are apportioned among the Funds based upon relative net assets or other appropriate methods. Income, expenses (other than class specific expenses — distribution and shareholder services, transfer agency and sub transfer agency fees) and realized and unrealized gains or losses are allocated to each class of shares based upon their relative net assets.
B. Advisory Fees: The Adviser, a wholly-owned subsidiary of Morgan Stanley, provides the Fund with advisory services under the terms of an Investment Advisory Agreement, paid quarterly, at the annual rate based on the daily net assets as follows:
First $750
million | | Next $750
million | | Over $1.5
billion | |
| | 0.65 | % | | | 0.60 | % | | | 0.55 | % | |
For the year ended December 31, 2017, the advisory fee rate (net of waiver/rebate) was equivalent to an annual effective rate of 0.45% of the Fund's average daily net assets.
The Adviser has agreed to reduce its advisory fee and/or reimburse the Fund so that total annual portfolio operating expenses, excluding certain investment related expenses, taxes, interest and other extraordinary expenses (including litigation), will not exceed 0.85% for Class I shares, 1.20% for Class A shares, 0.99% for Class L shares, 1.95% for Class C shares and 0.81% for Class IS shares. The fee waivers and/or expense reimbursements will continue for at least one year from the date of the Fund's prospectus or until such time as the Directors act to discontinue all or a portion of such waivers and/or reimbursements when they deem such action is appropriate. For the year ended December 31, 2017, approximately $187,000 of advisory fees were waived and approximately $28,000 of other expenses were reimbursed by the Adviser pursuant to this arrangement.
C. Administration Fees: The Adviser also serves as Administrator to the Company and provides administrative services pursuant to an Administration Agreement for an annual fee, accrued daily and paid monthly, of 0.08% of the Fund's average daily net assets.
Under a Sub-Administration Agreement between the Administrator and State Street Bank and Trust Company ("State Street"), State Street provides certain administrative services to the Company. For such services, the Administrator pays State Street a portion of the fee the Administrator receives from the Fund.
D. Distribution and Shareholder Services Fees: Morgan Stanley Distribution, Inc. ("MSDI" or the "Distributor"), a wholly-owned subsidiary of the Adviser and an indirect subsidiary of Morgan Stanley, serves as the Company's Distributor of Fund shares pursuant to a Distribution Agreement. The Company has adopted a Shareholder Services Plan with respect to Class A shares pursuant to Rule 12b-1 under the Act. Under the Shareholder Services Plan, the Fund pays the
23
Morgan Stanley Institutional Fund, Inc.
Annual Report — December 31, 2017
Notes to Financial Statements (cont'd)
Distributor a shareholder services fee, accrued daily and paid monthly, at an annual rate of 0.25% of the Fund's average daily net assets attributable to Class A shares.
The Company has adopted a Distribution and Shareholder Services Plan with respect to Class L shares pursuant to Rule 12b-1 under the Act. Under the Distribution and Shareholder Services Plan, the Fund pays the Distributor a distribution fee, accrued daily and paid monthly, at an annual rate of 0.50% and a shareholder services fee, accrued daily and paid monthly, at an annual rate of 0.25% of the Fund's average daily net assets attributable to Class L shares. The Distributor has agreed to waive for at least one year from the date of the Fund's prospectus, the 12b-1 fees on Class L shares of the Fund to the extent it exceeds 0.04% of the average daily net assets of such shares on an annualized basis. For the year ended December 31, 2017, this waiver amounted to approximately $29,000.
The Company has adopted a Distribution and Shareholder Services Plan with respect to Class C shares pursuant to Rule 12b-1 under the Act. Under the Distribution and Shareholder Services Plan, the Fund pays the Distributor a distribution fee, accrued daily and paid monthly, at an annual rate of 0.75% and a shareholder services fee, accrued daily and paid monthly, at an annual rate of 0.25% of the Fund's average daily net assets attributable to Class C shares.
The distribution and shareholder services fees are used to support the expenses associated with servicing and maintaining accounts. The Distributor may compensate other parties for providing shareholder support services to investors who purchase Class A, Class L and Class C shares.
E. Dividend Disbursing and Transfer Agent: The Company's dividend disbursing and transfer agent is Boston Financial Data Services, Inc. ("BFDS"). Pursuant to a Transfer Agency Agreement, the Company pays BFDS a fee based on the number of classes, accounts and transactions relating to the Funds of the Company. Effective January 1, 2018, BFDS changed its name to DST Asset Manager Solutions, Inc.
F. Custodian Fees: State Street (the "Custodian") also serves as Custodian for the Company in accordance with a Custodian Agreement. The Custodian holds cash, securities, and other assets of the Company as required by the Act. Custody fees are payable monthly based on assets held in custody, investment purchases and sales activity and account maintenance fees, plus reimbursement for certain out-of-pocket expenses.
G. Security Transactions and Transactions with Affiliates: For the year ended December 31, 2017, purchases and sales of investment securities for the Fund, other than long-term U.S. Government securities and short-term investments, were approximately $62,544,000 and $65,953,000, respectively. There were no purchases and sales of long-term U.S. Government securities for the year ended December 31, 2017.
The Fund invests in the Institutional Class of the Morgan Stanley Institutional Liquidity Funds (the "Liquidity Funds"), an open-end management investment company managed by the Adviser. Advisory fees paid by the Fund are reduced by an amount equal to its pro-rata share of the advisory and administration fees paid by the Fund due to its investment in the Liquidity Funds. For the year ended December 31, 2017, advisory fees paid were reduced by approximately $5,000 relating to the Fund's investment in the Liquidity Funds.
A summary of the Fund's transactions in shares of the Liquidity Funds during the year ended December 31, 2017 is as follows:
Affiliated
Investment
Company | | Value
December 31,
2016
(000) | | Purchases
at Cost
(000) | | Proceeds
from Sales
(000) | | Dividend
Income
(000) | |
Liquidity Funds | | $ | 2,300 | | | $ | 38,308 | | | $ | 37,177 | | | $ | 22 | | |
Affiliated
Investment
Company (cont'd) | | Realized
Gain
(Loss)
(000) | | Change in
Unrealized
Appreciation
(Depreciation)
(000) | | Value
December 31,
2017
(000) | |
Liquidity Funds | | $ | — | | | $ | — | | | $ | 3,431 | | |
The Fund is permitted to purchase and sell securities ("cross-trade") from and to other Morgan Stanley Funds as well as other funds and client accounts for which the Adviser or an affiliate of the Adviser serves as investment adviser, pursuant to procedures approved by the Directors in compliance with Rule 17a-7 under the Act (the "Rule"). Each cross-trade is executed at the current market price in compliance with provisions of the Rule. For the year ended December 31, 2017, the Fund did not engage in any cross-trade transactions.
The Fund has an unfunded Deferred Compensation Plan (the "Compensation Plan"), which allows each independent Director to defer payment of all, or a portion, of the fees he or she receives for serving on the Board of Directors. Each eligible Director generally may elect to have the deferred amounts credited with a return equal to the total return on one or more of the Morgan Stanley funds that are offered as investment options under the Compensation Plan. Appreciation/depreciation
24
Morgan Stanley Institutional Fund, Inc.
Annual Report — December 31, 2017
Notes to Financial Statements (cont'd)
and distributions received from these investments are recorded with an offsetting increase/decrease in the deferred compensation obligation and do not affect the NAV of the Fund.
H. Federal Income Taxes: It is the Fund's intention to continue to qualify as a regulated investment company and distribute all of its taxable and tax-exempt income. Accordingly, no provision for federal income taxes is required in the financial statements.
The Fund may be subject to taxes imposed by countries in which it invests. Such taxes are generally based on income and/or capital gains earned or repatriated. Taxes are accrued based on net investment income, net realized gains and net unrealized appreciation as such income and/or gains are earned. Taxes may also be based on transactions in foreign currency and are accrued based on the value of investments denominated in such currency.
FASB ASC 740-10, "Income Taxes — Overall", sets forth a minimum threshold for financial statement recognition of the benefit of a tax position taken or expected to be taken in a tax return. Management has concluded there are no significant uncertain tax positions that would require recognition in the financial statements. If applicable, the Fund recognizes interest accrued related to unrecognized tax benefits in "Interest Expense" and penalties in "Other Expenses" in the Statement of Operations. The Fund files tax returns with the U.S. Internal Revenue Service, New York and various states. Generally, each of the tax years in the four-year period ended December 31, 2017, remains subject to examination by taxing authorities.
The tax character of distributions paid may differ from the character of distributions shown in the Statements of Changes in Net Assets due to short-term capital gains being treated as ordinary income for tax purposes. The tax character of distributions paid during fiscal 2017 and 2016 was as follows:
2017
Distributions
Paid From: | | 2016
Distributions
Paid From: | |
Ordinary
Income
(000) | | Long-Term
Capital Gain
(000) | | Ordinary
Income
(000) | | Long-Term
Capital Gain
(000) | |
| $ | 761 | | | $ | 7,033 | | | $ | 166 | | | $ | 1,650 | | |
The amount and character of income and gains to be distributed are determined in accordance with income tax regulations which may differ from GAAP. These book/tax differences are either considered temporary or permanent in nature.
Temporary differences are primarily due to differing book and tax treatments for the timing of the recognition of gains
(losses) on certain investment transactions and the timing of the deductibility of certain expenses.
Permanent differences, primarily due to differing treatments of gains (losses) related to foreign currency transactions, return of capital distributions from real estate investment trust, nondeductible expenses and a net operating loss, resulted in the following reclassifications among the components of net assets at December 31, 2017:
Accumulated
Net Investment
Loss
(000) | | Accumulated
Undistributed
Net Realized
Gain
(000) | | Paid-in-
Capital
(000) | |
| $ | 151 | | | $ | (151 | ) | | $ | — | @ | |
@ Amount is less than $500
At December 31, 2017, the components of distributable earnings for the Fund on a tax basis were as follows:
Undistributed
Ordinary
Income
(000) | | Undistributed
Long-Term
Capital Gain
(000) | |
| $ | 407 | | | $ | 1,772 | | |
I. Credit Facility: The Company and other Morgan Stanley funds participated in a $150,000,000 committed, unsecured revolving line of credit facility (the "Facility") with State Street. This Facility is to be used for temporary emergency purposes or funding of shareholder redemption requests. The interest rate on borrowings is based on the federal funds rate or 1 month LIBOR rate plus a spread. The Facility also has a commitment fee of 0.25% per annum based on the unused portion of the Facility. During the year ended December 31, 2017, the Fund did not have any borrowings under the Facility.
J. Other: At December 31, 2017, the Fund had record owners of 10% or greater. Investment activities of these shareholders could have a material impact on the Fund. The aggregate percentage of such owners was 43.0%.
25
Morgan Stanley Institutional Fund, Inc.
Annual Report — December 31, 2017
Report of Independent Registered Public Accounting Firm
To the Shareholders and Board of Directors of
Morgan Stanley Institutional Fund, Inc. —
Advantage Portfolio
Opinion on the Financial Statements
We have audited the accompanying statement of assets and liabilities of Advantage Portfolio (the "Fund") (one of the funds constituting the Morgan Stanley Institutional Fund, Inc. (the "Company")), including the portfolio of investments, as of December 31, 2017, and the related statement of operations for the year then ended, the statements of changes in net assets for each of the two years in the period then ended, the financial highlights for each of the five years in the period then ended and the related notes (collectively referred to as the "financial statements"). In our opinion, the financial statements present fairly, in all material respects, the financial position of Advantage Portfolio (one of the funds constituting Morgan Stanley Institutional Fund, Inc.) at December 31, 2017, the results of its operations for the year then ended, the changes in its net assets for each of the two years in the period then ended and its financial highlights for each of the five years in the period then ended, in conformity with U.S. generally accepted accounting principles.
Basis for Opinion
These financial statements are the responsibility of the Company's management. Our responsibility is to express an opinion on the Fund's financial statements based on our audits. We are a public accounting firm registered with the Public Company Accounting Oversight Board (United States) ("PCAOB") and are required to be independent with respect to the Company in accordance with the U.S. federal securities law and the applicable rules and regulations of the Securities and Exchange Commission and the PCAOB.
We conducted our audits in accordance with the standards of the PCAOB. Those standards require that we plan and perform the audit to obtain reasonable assurance about whether the financial statements are free of material misstatement, whether due to error or fraud. The Company is not required to have, nor were we engaged to perform, an audit of the Company's internal control over financial reporting. As part of our audits, we are required to obtain an understanding of internal control over financial reporting, but not for the purpose of expressing an opinion on the effectiveness of the Company's internal control over financial reporting. Accordingly, we express no such opinion.
Our audits included performing procedures to assess the risks of material misstatement of the financial statements, whether due to error or fraud, and performing procedures that respond to those risks. Such procedures included examining, on a test basis, evidence regarding the amounts and disclosures in the financial statements. Our procedures included confirmation of securities owned as of December 31, 2017 by correspondence with the custodian and others or by other appropriate auditing procedures where replies from others were not received. Our audits also included evaluating the accounting principles used and significant estimates made by management, as well as evaluating the overall presentation of the financial statements. We believe that our audits provide a reasonable basis for our opinion.

We have served as the auditor of one or more Morgan Stanley investment companies since 2000.
Boston, Massachusetts
February 26, 2018
26
Morgan Stanley Institutional Fund, Inc.
Annual Report — December 31, 2017
Federal Tax Notice (unaudited)
For federal income tax purposes, the following information is furnished with respect to the distributions paid by the Fund during its taxable year ended December 31, 2017. For corporate shareholders 67.4% of the dividends qualified for the dividends received deduction.
The Fund designated and paid approximately $7,033,000 as a long-term capital gain distribution.
For federal income tax purposes, the following information is furnished with respect to the Fund's earnings for its taxable year ended December 31, 2017. When distributed, certain earnings may be subject to a maximum tax rate of 15% as provided for by the Jobs and Growth Tax Relief Reconciliation Act of 2003. The Fund designated up to a maximum of approximately $761,000 as taxable at this lower rate.
In January, the Fund provides tax information to shareholders for the preceding calendar year.
27
Morgan Stanley Institutional Fund, Inc.
Annual Report — December 31, 2017
Privacy Notice (unaudited)
MORGAN STANLEY INVESTMENT MANAGEMENT INC.
AN IMPORTANT NOTICE CONCERNING OUR U.S. PRIVACY POLICY
We are required by federal law to provide you with a copy of our privacy policy annually. This policy applies to current and former individual investors in funds managed or sponsored by Morgan Stanley Investment Management Inc. ("MSIM") as well as current and former individual clients of MSIM. This policy is not applicable to partnerships, corporations, trusts or other non-individual clients or investors. Please note that we may amend this policy at any time, and will inform you of any changes as required by law.
WE RESPECT YOUR PRIVACY
We appreciate that you have provided us with your personal financial information. We strive to maintain the privacy of such information while we help you achieve your financial objectives. This Notice describes what non-public personal information we collect about you, why we collect it, when we may share it with others and how certain others may use it. It discusses the steps you may take to limit our sharing of certain information about you to affiliated companies in the Morgan Stanley family of companies ("other Morgan Stanley companies"). It also discloses how you may limit use of certain shared information for marketing purposes by other Morgan Stanley branded companies. Throughout this policy, we refer to the non-public information that personally identifies you or your accounts as "personal information."
1. WHAT PERSONAL INFORMATION DO WE COLLECT ABOUT YOU?
We obtain personal information from applications and other forms you submit to us, from your dealings with us, from consumer reporting agencies, from our Web sites and from third parties and other sources.
For example:
• We may collect information such as your name, address, e-mail address, telephone/fax numbers, assets, income and investment objectives through subscription documents, applications and other forms you submit to us.
• We may obtain information about account balances, your use of account(s) and the types of products and services you prefer to receive from us through your dealings and transactions with us and other sources.
• We may obtain information about your creditworthiness and credit history from consumer reporting agencies.
• We may collect background information from and through third-party vendors to verify representations you have made and to comply with various regulatory requirements.
• If you interact with us through our public and private Web sites, we may collect information that you provide directly through online communications (such as an e-mail address). We may also collect information about your Internet service provider, your domain name, your computer's operating system and Web browser, your use of our Web sites and your product and service preferences, through the use of "cookies." Please consult the Terms of Use of these sites for more details.
2. WHEN DO WE DISCLOSE PERSONAL INFORMATION WE COLLECT ABOUT YOU?
We may disclose personal information we collect about you to other Morgan Stanley companies and to non-affiliated third parties.
a. Information We Disclose to Other Morgan Stanley Companies.
We may disclose personal information to other Morgan Stanley companies for a variety of reasons, including to manage your account(s) effectively, to service and process your transactions, to let you know about products and services offered by us and other Morgan Stanley companies, to manage our business, and as otherwise required or permitted by law. Offers for products and services from other Morgan Stanley companies are developed under conditions designed to safeguard your personal information.
28
Morgan Stanley Institutional Fund, Inc.
Annual Report — December 31, 2017
Privacy Notice (unaudited) (cont'd)
b. Information We Disclose to Non-affiliated Third Parties.
We do not disclose personal information that we collect about you to non-affiliated third parties except to those who provide marketing services on our behalf, to financial institutions with whom we have joint marketing agreements, and as otherwise required or permitted by law. For example, we may disclose personal information to non-affiliated third parties for servicing and processing transactions, to offer our own products and services, to protect against fraud, for institutional risk control, to respond to judicial process or to perform services on our behalf. When we share personal information with a non-affiliated third party, they are required to limit their use of personal information to the particular purpose for which it was shared and they are not allowed to share personal information with others except to fulfill that limited purpose or as may be permitted or required by law.
3. HOW DO WE PROTECT THE SECURITY AND CONFIDENTIALITY OF PERSONAL INFORMATION WE COLLECT ABOUT YOU?
We maintain physical, electronic and procedural security measures to help safeguard the personal information we collect about you. We have internal policies governing the proper handling of client information. Third parties that provide support or marketing services on our behalf may also receive personal information, and we require them to adhere to confidentiality standards with respect to such information.
4. HOW CAN YOU LIMIT THE SHARING OF CERTAIN TYPES OF PERSONAL INFORMATION WITH OTHER MORGAN STANLEY COMPANIES?
We offer you choices as to whether we share with other Morgan Stanley companies the personal information that was collected to determine your eligibility for products and services you request ("eligibility information"). Eligibility information does not include your identification information or personal information pertaining to our transactions or experiences with you. Please note that, even if you direct us not to share eligibility information with other Morgan Stanley companies ("opt-out"), we may still share personal information, including eligibility information, with those companies in circumstances excluded from the opt-out under applicable law, such as to process transactions or to service your account.
5. HOW CAN YOU LIMIT THE USE OF CERTAIN TYPES OF PERSONAL INFORMATION BY OTHER MORGAN STANLEY COMPANIES FOR MARKETING?
By following the opt-out instructions in Section 6 below, you may limit other Morgan Stanley branded companies from marketing their products or services to you based on personal information we disclose to them. This information may include, for example, your income and account history with us. Please note that, even if you choose to limit Other Morgan Stanley Companies from using personal information about you that we may share with them for marketing their products and services to you, Other Morgan Stanley Companies may use your personal information that they obtain from us to market to you in circumstances permitted by law, such as if the Other Morgan Stanley Company has its own relationship with you.
6. HOW CAN YOU SEND US AN OPT-OUT INSTRUCTION?
If you wish to limit our sharing of eligibility information about you with other Morgan Stanley companies or other Morgan Stanley companies' use of personal information for marketing purposes, as described in this notice, you may do so by:
• Calling us at (800) 548-7786
Monday–Friday between 8a.m. and 6p.m.(EST)
• Writing to us at the following address:
DST Asset Manager Solutions, Inc.
c/o Privacy Coordinator
P.O. Box 219804
Kansas City, Missouri 64121
29
Morgan Stanley Institutional Fund, Inc.
Annual Report — December 31, 2017
Privacy Notice (unaudited) (cont'd)
Your written request should include your name, address, telephone number and account number(s) to which the opt-out applies and whether you are opting out with respect to sharing of eligibility information (Section 4 above), or if information used for Marketing (Section 5 above) or both. Written opt-out requests should not be sent with any other correspondence. In order to process your request, we require that the request be provided by you directly and not through a third party.
Your opt-out preference will remain in effect with respect to this policy (as it may be amended) until you notify us otherwise. If you have a joint account, your direction for us not to share this information with other Morgan Stanley companies and for those other Morgan Stanley companies not to use your personal information for marketing will be applied to all account holders on that account. Please understand that if you limit our sharing or our affiliated companies' use of personal information, you and any joint account holder(s) may not receive information about Morgan Stanley products and services, including products or services that could help you manage your financial resources and achieve your investment objectives.
7. WHAT IF AN AFFILIATED COMPANY BECOMES A NON-AFFILIATED THIRD PARTY?
If, at any time in the future, an affiliated company becomes a non-affiliated third party, further disclosures of personal information made to the former affiliated company will be limited to those described in Section 2(b) above relating to non-affiliated third parties. If you elected under Section 6 to limit disclosures we make to affiliated companies, or use of personal information by affiliated companies, your election will not apply to use by any former affiliated company of your personal information in their possession once it becomes a non-affiliated third party.
SPECIAL NOTICE TO RESIDENTS OF VERMONT
The following section supplements our policy with respect to our individual clients who have a Vermont address and supersedes anything to the contrary in the above policy with respect to those clients only.
The state of Vermont requires financial institutions to obtain your consent prior to sharing personal information that they collect about you with affiliated companies and non-affiliated third parties other than in certain limited circumstances. Except as permitted by law, we will not share personal information we collect about you with non-affiliated third parties or other Morgan Stanley companies unless you provide us with your written consent to share such information ("opt-in").
If you wish to receive offers for investment products and services offered by or through other Morgan Stanley companies, please notify us in writing at the following address:
DST Asset Manager Solutions, Inc.
c/o Privacy Coordinator
P.O. Box 219804
Kansas City, Missouri 64121
Your authorization should include your name, address, telephone number and account number(s) to which the opt-in applies and should not be sent with any other correspondence. In order to process your authorization, we require that the authorization be provided by you directly and not through a third party.
SPECIAL NOTICE TO RESIDENTS OF CALIFORNIA
The following section supplements our policy with respect to our individual clients who have a California address and supersedes anything to the contrary in the above policy with respect to those clients only.
In response to a California law, if your account has a California home address, your personal information will not be disclosed to non-affiliated third parties except as permitted by applicable California law, and we will limit sharing such information with our affiliates to comply with California privacy laws that apply to us.
30
Morgan Stanley Institutional Fund, Inc.
Annual Report — December 31, 2017
Director and Officer Information (unaudited)
Independent Directors:
Name, Age and Address of
Independent Director | | Position(s)
Held with
Registrant | | Length of Time
Served* | | Principal Occupation(s) During Past 5 Years
and Other Relevant Professional Experience | | Number of
Portfolios in
Fund Complex
Overseen by
Independent
Director** | | Other Directorships
Held by Independent
Director*** | |
Frank L. Bowman (73)
c/o Perkins Coie LLP
Counsel to the Independent
Directors
30 Rockefeller Plaza
New York, NY 10112 | | Director | | Since
August
2006 | | President, Strategic Decisions, LLC (consulting) (since February 2009); Director or Trustee of various Morgan Stanley Funds (since August 2006); Chairperson of the Compliance and Insurance Committee (since October 2015); formerly, Chairperson of the Insurance Sub-Committee of the Compliance and Insurance Committee (2007-2015); served as President and Chief Executive Officer of the Nuclear Energy Institute (policy organization) (February 2005-November 2008); retired as Admiral, U.S. Navy after serving over 38 years on active duty including 8 years as Director of the Naval Nuclear Propulsion Program in the Department of the Navy and the U.S. Department of Energy (1996-2004); served as Chief of Naval Personnel (July 1994-September 1996) and on the Joint Staff as Director of Political Military Affairs (June 1992-July 1994); knighted as Honorary Knight Commander of the Most Excellent Order of the British Empire; awarded the Officier de l'Orde National du Mérite by the French Government; elected to the National Academy of Engineering (2009). | | | 88 | | | Director of BP p.l.c.; Director of Naval and Nuclear Technologies LLP; Director Emeritus of the Armed Services YMCA; Director of the U.S. Naval Submarine League; Member of the National Security Advisory Council of the Center for U.S. Global Engagement and a member of the CNA Military Advisory Board; Trustee of Fairhaven United Methodist Church; and Director of other various non-profit organizations. | |
Kathleen A. Dennis (64)
c/o Perkins Coie LLP
Counsel to the Independent Directors
30 Rockefeller Plaza
New York, NY 10112 | | Director | | Since
August
2006 | | President, Cedarwood Associates (mutual fund and investment management consulting) (since July 2006); Chairperson of the Liquidity and Alternatives Sub-Committee of the Investment Committee (since October 2006) and Director or Trustee of various Morgan Stanley Funds (since August 2006); formerly, Senior Managing Director of Victory Capital Management (1993-2006). | | | 89 | | | Director of various non-profit organizations. | |
Nancy C. Everett (62)
c/o Perkins Coie LLP
Counsel to the Independent Directors
30 Rockefeller Plaza
New York, NY 10112 | | Director | | Since
January
2015 | | Chief Executive Officer, Virginia Commonwealth University Investment Company (since November 2015); Owner, OBIR, LLC (institutional investment management consulting) (since June 2014); formerly, Managing Director, BlackRock Inc. (February 2011-December 2013); and Chief Executive Officer, General Motors Asset Management (a/k/a Promark Global Advisors, Inc.) (June 2005-May 2010). | | | 90 | | | Formerly, Member of Virginia Commonwealth University School of Business Foundation (2005-2016); Member of Virginia Commonwealth University Board of Visitors (2013-2015); Member of Committee on Directors for Emerging Markets Growth Fund, Inc. (2007-2010); Chairperson of Performance Equity Management, LLC (2006-2010); and Chairperson, GMAM Absolute Return Strategies Fund, LLC (2006-2010). | |
31
Morgan Stanley Institutional Fund, Inc.
Annual Report — December 31, 2017
Director and Officer Information (unaudited) (cont'd)
Independent Directors: (cont'd)
Name, Age and Address of
Independent Director | | Position(s)
Held with
Registrant | | Length of Time
Served* | | Principal Occupation(s) During Past 5 Years
and Other Relevant Professional Experience | | Number of
Portfolios in
Fund Complex
Overseen by
Independent
Director** | | Other Directorships
Held by Independent
Director*** | |
Jakki L. Haussler (60)
c/o Perkins Coie LLP
Counsel to the Independent Directors
30 Rockefeller Plaza
New York, NY 10112 | | Director | | Since
January
2015 | | Chairman and Chief Executive Officer, Opus Capital Group (since January 1996); formerly, Director, Capvest Venture Fund, LP (May 2000-December 2011); Partner, Adena Ventures, LP (July 1999-December 2010); Director, The Victory Funds (February 2005-July 2008). | | | 90 | | | Director of Cincinnati Bell Inc. and Member, Audit Committee and Compensation Committee; Director of Northern Kentucky University Foundation and Member, Investment Committee; Member of Chase College of Law Transactional Law Practice Center Board of Advisors; Director of Best Transport; Director of Chase College of Law Board of Visitors; formerly, Member, University of Cincinnati Foundation Investment Committee; Member, Miami University Board of Visitors (2008-2011); Trustee of Victory Funds (2005-2008) and Chairman, Investment Committee (2007-2008) and Member, Service Provider Committee (2005-2008). | |
Dr. Manuel H. Johnson (68)
c/o Johnson Smick
International, Inc.
220 I Street, NE — Suite 200
Washington, D.C. 20002 | | Director | | Since
July
1991 | | Senior Partner, Johnson Smick International, Inc. (consulting firm); Chairperson of the Investment Committee (since October 2006) and Director or Trustee of various Morgan Stanley Funds (since July 1991); Co-Chairman and a founder of the Group of Seven Council (G7C) (international economic commission); formerly, Chairperson of the Audit Committee (July 1991-September 2006), Vice Chairman of the Board of Governors of the Federal Reserve System and Assistant Secretary of the U.S. Treasury. | | | 88 | | | Director of NVR, Inc. (home construction). | |
Joseph J. Kearns (75)
c/o Kearns & Associates LLC
46 E Peninsula Center #385
Rolling Hills Estates, CA
90274-3712 | | Director | | Since
August
1994 | | Senior Adviser, Kearns & Associates LLC (investment consulting); Chairperson of the Audit Committee (since October 2006) and Director or Trustee of various Morgan Stanley Funds (since August 1994); formerly, Deputy Chairperson of the Audit Committee (July 2003-September 2006) and Chairperson of the Audit Committee of various Morgan Stanley Funds (since August 1994); CFO of the J. Paul Getty Trust. | | | 89 | | | Prior to August 10, 2016, Director of Electro Rent Corporation (equipment leasing); Prior to December 31, 2013, Director of The Ford Family Foundation. | |
32
Morgan Stanley Institutional Fund, Inc.
Annual Report — December 31, 2017
Director and Officer Information (unaudited) (cont'd)
Independent Directors: (cont'd)
Name, Age and Address of
Independent Director | | Position(s)
Held with
Registrant | | Length of Time
Served* | | Principal Occupation(s) During Past 5 Years
and Other Relevant Professional Experience | | Number of
Portfolios in
Fund Complex
Overseen by
Independent
Director** | | Other Directorships
Held by Independent
Director*** | |
Michael F. Klein (59)
c/o Perkins Coie LLP
Counsel to the Independent Directors
30 Rockefeller Plaza
New York, NY 10112 | | Director | | Since
August
2006 | | Managing Director, Aetos Capital, LLC (since March 2000); Co-President, Aetos Alternatives Management, LLC (since January 2004) and Co-Chief Executive Officer of Aetos Capital LLC (since August 2013); Chairperson of the Fixed Income Sub-Committee of the Investment Committee (since October 2006) and Director or Trustee of various Morgan Stanley Funds (since August 2006); formerly, Managing Director, Morgan Stanley & Co. Inc. and Morgan Stanley Dean Witter Investment Management, President, various Morgan Stanley Funds (June 1998-March 2000) and Principal, Morgan Stanley & Co. Inc. and Morgan Stanley Dean Witter Investment Management (August 1997-December 1999). | | | 88 | | | Director of certain investment funds managed or sponsored by Aetos Capital, LLC; Director of Sanitized AG and Sanitized Marketing AG (specialty chemicals). | |
Patricia Maleski (57)
c/o Perkins Coie LLP
Counsel to the Independent Directors
30 Rockefeller Plaza
New York, NY 10112 | | Director | | Since
January
2017 | | Managing Director, JPMorgan Asset Management (2004-2016); Oversight and Control Head of Fiduciary and Conflicts of Interest Program (2015-2016); Chief Control Officer-Global Asset Management (2013-2015); President, JPMorgan Funds (2010-2013); Chief Administrative Officer (2004-2013); various other positions including Treasurer and Board Liaison (since 2001). | | | 90 | | | None. | |
Michael E. Nugent (81)
522 Fifth Avenue
New York, NY 10036 | | Chair of the Board and Director | | Chair of the Boards since July 2006 and Director since July 1991 | | Chair of the Boards of various Morgan Stanley Funds (since July 2006); Chairperson of the Closed-End Fund Committee (since June 2012) and Director or Trustee of various Morgan Stanley Funds (since July 1991); formerly, Chairperson of the Insurance Committee (until July 2006); General Partner, Triumph Capital, L.P. (private investment partnership) (1988-2013). | | | 88 | | | None. | |
W. Allen Reed (70)
c/o Perkins Coie LLP
Counsel to the Independent Directors
30 Rockefeller Plaza
New York, NY 10112 | | Director | | Since
August
2006 | | Chairperson of the Equity Sub-Committee of the Investment Committee (since October 2006) and Director or Trustee of various Morgan Stanley Funds (since August 2006); formerly, President and CEO of General Motors Asset Management; Chairman and Chief Executive Officer of the GM Trust Bank and Corporate Vice President of General Motors Corporation (August 1994-December 2005). | | | 89 | | | Director of Legg Mason, Inc.; formerly, Director of the Auburn University Foundation (2010-2015). | |
Fergus Reid (85)
c/o Joe Pietryka, Inc.
85 Charles Colman Blvd.
Pawling, NY 12564 | | Director | | Since
June
1992 | | Chairman, Joe Pietryka, Inc.; Chairperson of the Governance Committee and Director or Trustee of various Morgan Stanley Funds (since June 1992). | | | 89 | | | Formerly, Trustee and Director of certain investment companies in the JP Morgan Fund Complex managed by JP Morgan Investment Management Inc. (1987-2012). | |
* This is the earliest date the Director began serving the Morgan Stanley Funds. Each Director serves an indefinite term, until his or her successor is elected.
** The Fund Complex includes (as of December 31, 2017) all open-end and closed-end funds (including all of their portfolios) advised by Morgan Stanley Investment Management Inc. (the "Adviser") and any funds that have an adviser that is an affiliated person of the Adviser (including, but not limited to, Morgan Stanley AIP GP LP).
*** This includes any directorships at public companies and registered investment companies held by the Director at any time during the past five years.
33
Morgan Stanley Institutional Fund, Inc.
Annual Report — December 31, 2017
Director and Officer Information (unaudited) (cont'd)
Executive Officers:
Name, Age and Address of Executive Officer | | Position(s) Held
with
Registrant | | Length of Time
Served* | | Principal Occupation(s) During Past 5 Years | |
John H. Gernon (54)
522 Fifth Avenue
New York, NY 10036 | | President and Principal Executive Officer | | Since
September
2013 | | President and Principal Executive Officer of the Equity and Fixed Income Funds and the Morgan Stanley AIP Funds (since September 2013) and the Liquidity Funds and various money market funds (since May 2014) in the Fund Complex; Managing Director of the Adviser; Head of Product (since 2006). | |
Timothy J. Knierim (58)
522 Fifth Avenue
New York, NY 10036 | | Chief Compliance Officer | | Since
December
2016 | | Managing Director of the Adviser and various entities affiliated with the Adviser; Chief Compliance Officer of various Morgan Stanley Funds and the Adviser (since December 2016) and Chief Compliance Officer of Morgan Stanley AIP GP LP (since 2014). Formerly, Managing Director and Deputy Chief Compliance Officer of the Adviser (2014-2016); and formerly, Chief Compliance Officer of Prudential Investment Management, Inc. (2007-2014). | |
Francis J. Smith (52)
522 Fifth Avenue
New York, NY 10036 | | Treasurer and Principal Financial Officer | | Treasurer since July 2003 and Principal Financial Officer since September 2002 | | Managing Director of the Adviser and various entities affiliated with the Adviser; Treasurer (since July 2003) and Principal Financial Officer of various Morgan Stanley Funds (since September 2002). | |
Mary E. Mullin (50)
522 Fifth Avenue
New York, NY 10036 | | Secretary | | Since
June
1999 | | Managing Director of the Adviser; Secretary of various Morgan Stanley Funds (since June 1999). | |
Michael J. Key (38)
522 Fifth Avenue
New York, NY 10036 | | Vice President | | Since
June
2017 | | Vice President of the Equity and Fixed Income Funds, Liquidity Funds, various money market funds and the Morgan Stanley AIP Funds in the Fund Complex (since June 2017); Executive Director of the Adviser; Head of Product Development for Equity and Fixed Income Funds (since August 2013). | |
* This is the earliest date the officer began serving the Morgan Stanley Funds. Each officer serves a one-year term, until his or her successor is elected and qualifies.
34
Morgan Stanley Institutional Fund, Inc.
Annual Report — December 31, 2017
Adviser and Administrator
Morgan Stanley Investment Management Inc.
522 Fifth Avenue
New York, New York 10036
Distributor
Morgan Stanley Distribution, Inc.
522 Fifth Avenue
New York, New York 10036
Dividend Disbursing and Transfer Agent
DST Asset Manager Solutions, Inc.
2000 Crown Colony Drive
Quincy, Massachusetts 02169
Custodian
State Street Bank and Trust Company
One Lincoln Street
Boston, Massachusetts 02111
Legal Counsel
Dechert LLP
1095 Avenue of the Americas
New York, New York 10036
Counsel to the Independent Directors
Perkins Coie LLP
30 Rockefeller Plaza
New York, New York 10112
Independent Registered Public Accounting Firm
Ernst & Young LLP
200 Clarendon Street
Boston, Massachusetts 02116
Reporting to Shareholders
Each Morgan Stanley Fund provides a complete schedule of portfolio holdings in its semi-annual and annual reports within 60 days of the end of the fund's second and fourth fiscal quarters. The semi-annual and annual reports are filed electronically with the Securities and Exchange Commission (SEC) on Form N-CSRS and Form N-CSR, respectively. Morgan Stanley also delivers the semi-annual and annual reports to fund shareholders and makes these reports available on its public website, www.morganstanley.com/im. Each Morgan Stanley fund also files a complete schedule of portfolio holdings with the SEC for the fund's first and third fiscal quarters on Form N-Q. Morgan Stanley does not deliver the reports for the first and third fiscal quarters to shareholders, nor are the reports posted to the Morgan Stanley public website. You may, however, obtain the Form N-Q filings (as well as the Form N-CSR and N-CSRS filings) by accessing the SEC's website, www.sec.gov. You may also review and copy them at the SEC's Public Reference Room in Washington, DC. Information on the operation of the SEC's Public Reference Room may be obtained by calling the SEC toll free at 1 (800) SEC-0330. You can also request copies of these materials, upon payment of a duplicating fee, by electronic request at the SEC's email address (publicinfo@sec.gov) or by writing to the SEC's Public Reference Section, Washington, D.C. 20549-1520.
Proxy Voting Policies and Procedures and Proxy Voting Record
You may obtain a copy of the Company's Proxy Voting Policy and Procedures and information regarding how the Company voted proxies relating to portfolio securities during the most recent twelve-month period ended June 30, without charge, upon request, by calling toll free 1 (800) 548-7786 or by visiting our website at www.morganstanley.com/im. This information is also available on the SEC's website at www.sec.gov.
This report is authorized for distribution only when preceded or accompanied by a prospectus or summary prospectus of the applicable Fund of Morgan Stanley Institutional Fund, Inc., which describes in detail the Fund's investment policies, risks, fees and expenses. Please read the prospectus carefully before you invest or send money. For additional information, including information regarding the investments comprising the Fund, please visit our website at www.morganstanley.com/im or call toll free 1 (800) 548-7786.
35
Printed in U.S.A.
This Report has been prepared for shareholders and may be distributed to others only if preceded or accompanied by a current prospectus.
Morgan Stanley Investment Management Inc.
522 Fifth Avenue
New York, New York 10036
© 2018 Morgan Stanley. Morgan Stanley Distribution, Inc.

IFIADVANN
2008051 EXP. 02.28.19

Morgan Stanley Institutional Fund, Inc.
Asia Opportunity Portfolio
Annual Report
December 31, 2017

Morgan Stanley Institutional Fund, Inc.
Annual Report — December 31, 2017
Shareholders' Letter | | | 2 | | |
Expense Example | | | 3 | | |
Investment Overview | | | 4 | | |
Portfolio of Investments | | | 6 | | |
Statement of Assets and Liabilities | | | 8 | | |
Statement of Operations | | | 10 | | |
Statements of Changes in Net Assets | | | 11 | | |
Financial Highlights | | | 13 | | |
Notes to Financial Statements | | | 17 | | |
Report of Independent Registered Public Accounting Firm | | | 27 | | |
Federal Tax Notice | | | 28 | | |
Privacy Notice | | | 29 | | |
Director and Officer Information | | | 32 | | |
This report is authorized for distribution only when preceded or accompanied by a prospectus or summary prospectus of the applicable Fund of Morgan Stanley Institutional Fund, Inc. To receive a prospectus and/or statement of additional information (SAI), which contains more complete information such as investment objectives, charges, expenses, policies for voting proxies, risk considerations, and describes in detail each of the Fund's investment policies to the prospective investor, please call toll free 1 (800) 548-7786. Please read the prospectuses carefully before you invest or send money.
Additionally, you can access information about the Fund, including performance, characteristics, and investment team commentary, through Morgan Stanley Investment Management's website: www.morganstanley.com/im.
Market forecasts provided in this report may not necessarily come to pass. There is no guarantee that any sectors mentioned will continue to perform as discussed herein or that securities in such sectors will be held by the Fund in the future. There is no assurance that a fund will achieve its investment objective. Funds are subject to market risk, which is the possibility that market values of securities owned by the Fund will decline and, therefore, the value of the Fund's shares may be less than what you paid for them. Accordingly, you can lose money investing in this Fund. Please see the prospectus for more complete information on investment risks.
1
Morgan Stanley Institutional Fund, Inc.
Annual Report — December 31, 2017
Shareholders' Letter (unaudited)
Dear Shareholders,
We are pleased to provide this Annual report, in which you will learn how your investment in Asia Opportunity Portfolio (the "Fund") performed during the latest twelve-month period.
Morgan Stanley Investment Management is a client-centric, investor-led organization. Our global presence, intellectual capital, and breadth of products and services enable us to partner with investors to meet the evolving challenges of today's financial markets. We aim to deliver superior investment service and to empower our clients to make the informed decisions that help them reach their investment goals.
As always, we thank you for selecting Morgan Stanley Investment Management, and look forward to working with you in the months and years ahead.
Sincerely,

John H. Gernon
President and Principal Executive Officer
January 2018
2
Morgan Stanley Institutional Fund, Inc.
Annual Report — December 31, 2017
Expense Example (unaudited)
Asia Opportunity Portfolio
As a shareholder of the Fund, you incur two types of costs: (1) transactional costs, including redemption fees; and (2) ongoing costs, which may include advisory fees, administration fees, distribution and shareholder services fees and other Fund expenses. This example is intended to help you understand your ongoing costs (in dollars) of investing in the Fund and to compare these costs with the ongoing costs of investing in other mutual funds.
This example is based on an investment of $1,000 invested at the beginning of the six-month period ended December 31, 2017 and held for the entire six-month period.
Actual Expenses
The table below provides information about actual account values and actual expenses. You may use the information in this table, together with the amount you invested, to estimate the expenses that you paid over the period. Simply divide your account value by $1,000 (for example, an $8,600 account value divided by $1,000 = 8.6), then multiply the result by the number in the table under the heading entitled "Actual Expenses Paid During Period" to estimate the expenses you paid on your account during this period.
Hypothetical Example for Comparison Purposes
The table below provides information about hypothetical account values and hypothetical expenses based on the Fund's actual expense ratio and an assumed rate of return of 5% per year before expenses, which is not the Fund's actual return. The hypothetical account values and expenses may not be used to estimate the actual ending account balance or expenses you paid for the period. You may use this information to compare the ongoing costs of investing in the Fund and other funds. To do so, compare this 5% hypothetical example with the 5% hypothetical examples that appear in the shareholder reports of the other funds.
Please note that the expenses shown in the table are meant to highlight your ongoing costs only and do not reflect any transactional costs, such as sales charges (loads) and redemption fees. Therefore, the information for each class in the table is useful in comparing ongoing costs only, and will not help you determine the relative total costs of owning different funds. In addition, if these transactional costs were included, your costs would have been higher.
| | | Beginning
Account
Value
7/1/17 | | Actual Ending
Account
Value
12/31/17 | | Hypothetical
Ending Account
Value | | Actual
Expenses
Paid
During
Period* | | Hypothetical
Expenses Paid
During Period* | | Net
Expense
Ratio
During
Period** | |
Asia Opportunity Portfolio Class I | | $ | 1,000.00 | | | $ | 1,298.60 | | | $ | 1,019.86 | | | $ | 6.14 | | | $ | 5.40 | | | | 1.06 | % | |
Asia Opportunity Portfolio Class A | | | 1,000.00 | | | | 1,295.50 | | | | 1,017.95 | | | | 8.33 | | | | 7.32 | | | | 1.44 | | |
Asia Opportunity Portfolio Class C | | | 1,000.00 | | | | 1,291.10 | | | | 1,014.17 | | | | 12.65 | | | | 11.12 | | | | 2.19 | | |
Asia Opportunity Portfolio Class IS | | | 1,000.00 | | | | 1,298.60 | | | | 1,019.96 | | | | 6.03 | | | | 5.30 | | | | 1.04 | | |
* Expenses are calculated using each Fund Class' annualized net expense ratio (as disclosed), multiplied by the average account value over the period, and multiplied by 184/365 (to reflect the most recent one-half year period).
** Annualized.
3
Morgan Stanley Institutional Fund, Inc.
Annual Report — December 31, 2017
Investment Overview (unaudited)
Asia Opportunity Portfolio
The Fund seeks long-term capital appreciation.
Performance
For the year ended December 31, 2017, the Fund's Class I shares had a total return based on net asset value and reinvestment of distributions per share of 76.82%, net of fees. The Fund's Class I shares outperformed the Fund's benchmark, the MSCI All Country Asia ex Japan Index (the "Index"), which returned 41.72%.
Please keep in mind that double-digit returns are highly unusual and cannot be sustained. Investors should also be aware that these returns were primarily achieved during favorable market conditions.
Factors Affecting Performance
• Asia ex Japan was the top-performing region in 2017, as a surge in technology shares strongly benefited the region, China's economy delivered within expectations and the weaker U.S. dollar was favorable for emerging markets, in particular.
• Asian equity markets advanced 41.72% for the 12-month period ended December 31, 2017, as measured by the Index. Against this backdrop, our team remained focused on assessing company prospects over a longer-term period of three to five years, and owning a portfolio of high quality companies with diverse business drivers not tied to a particular market environment.
• The team manages focused portfolios that are highly differentiated from the benchmark, with securities weighted on our assessment of the quality of the company and our conviction. Our longer-term focus results in lower turnover than many of our peers. The value added or detracted in any period of time will typically result from stock selection, given our philosophy and process.
• For the 12-month period, the Fund outperformed the Index due to favorable stock selection and sector allocation.
• The Fund's outperformance was driven by stock selection in the consumer discretionary, consumer staples and health care sectors.
• Overweight exposures to the consumer staples and health care sectors, and an underweight allocation to information technology were disadvantageous to performance.
Management Strategies
• There were no changes to our bottom-up investment process during the period. The team seeks high quality companies, which we define primarily as those with sustainable competitive advantages. We remain focused on assessing company prospects over a longer-term period of three to five years, and owning a portfolio of high-quality companies with diverse business drivers not tied to a particular market environment.
• At the close of the period, consumer discretionary represented the largest sector weight in the Fund, followed by information technology and consumer staples. The team's bottom-up investment process resulted in sector overweight positions in consumer discretionary, consumer staples and health care and underweight positions in financials, industrials, real estate, information technology, materials, energy, telecommunication services and utilities.
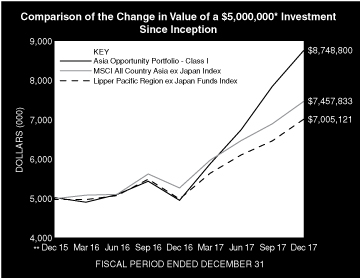
* Minimum Investment for Class I shares
** Commenced Operations on December 29, 2015.
In accordance with SEC regulations, the Fund's performance shown assumes that all recurring fees (including management fees) were deducted and all dividends and distributions were reinvested. The performance of Class A, C and IS shares will vary from the performance of Class I shares and will be impacted by additional fees assessed to those classes (if applicable).
4
Morgan Stanley Institutional Fund, Inc.
Annual Report — December 31, 2017
Investment Overview (unaudited) (cont'd)
Asia Opportunity Portfolio
Performance Compared to the MSCI All Country Asia ex Japan Index(1) and the Lipper Pacific Region ex Japan Funds Index(2)
| | Period Ended December 31, 2017
Total Returns(3) | |
| | | | Average Annual | |
| | One
Year | | Five
Years | | Ten
Years | | Since
Inception(5) | |
Fund — Class I Shares
w/o sales charges(4) | | | 76.82 | % | | | — | | | | — | | | | 32.18 | % | |
Fund — Class A Shares
w/o sales charges(4) | | | 76.17 | | | | — | | | | — | | | | 31.71 | | |
Fund — Class A Shares with
maximum 5.25% sales charges(4) | | | 66.85 | | | | — | | | | — | | | | 28.24 | | |
Fund — Class C Shares
w/o sales charges(4) | | | 74.85 | | | | — | | | | — | | | | 30.71 | | |
Fund — Class C Shares with
maximum 1.00% deferred
sales charges(4) | | | 73.85 | | | | — | | | | — | | | | 30.71 | | |
Fund — Class IS Shares
w/o sales charges(4) | | | 76.82 | | | | — | | | | — | | | | 32.21 | | |
MSCI All Country Asia ex Japan Index | | | 41.72 | | | | — | | | | — | | | | 22.06 | | |
Lipper Pacific Region ex Japan
Funds Index | | | 40.65 | | | | — | | | | — | | | | 18.30 | | |
Performance data quoted represents past performance, which is no guarantee of future results, and current performance may be lower or higher than the figures shown. Performance assumes that all dividends and distributions, if any, were reinvested. For the most recent month-end performance figures, please visit www.morganstanley.com/im. Investment return and principal value will fluctuate so that Fund shares, when redeemed, may be worth more or less than their original cost. Total returns do not reflect the deduction of taxes that a shareholder would pay on Fund distributions or the redemption of Fund shares. Performance of share classes will vary due to difference in sales charges and expenses.
(1) The MSCI All Country Asia ex Japan Index is a free float-adjusted market capitalization weighted index that is designed to measure the equity market performance of Asia, excluding Japan. The performance of the Index is listed in U.S. dollars and assumes reinvestment of net dividends. The Index is unmanaged and its returns do not include any sales charges or fees. Such costs would lower performance. It is not possible to invest directly in an index.
(2) The Lipper Pacific Region ex Japan Funds Index is an equally weighted performance index of the largest qualifying funds (based on net assets) in the Lipper Pacific Region ex Japan Funds classification. The Index, which is adjusted for capital gains distributions and income dividends, is unmanaged and should not be considered an investment. There are currently 10 funds represented in this Index. As of the date of this report, the Fund was in the Lipper Pacific Region ex Japan Funds classification.
(3) Total returns for the Fund reflect fees waived and expenses reimbursed, if applicable, by the Adviser. Without such waivers and reimbursements, total returns would have been lower.
(4) Commenced operations on December 29, 2015.
(5) For comparative purposes, average annual since inception returns listed for the Indexes refer to the inception date of the Fund, not the inception of the Index.
5
Morgan Stanley Institutional Fund, Inc.
Annual Report — December 31, 2017
Portfolio of Investments
Asia Opportunity Portfolio
| | | Shares | | Value
(000) | |
Common Stocks (90.0%) | |
China (67.5%) | |
Alibaba Group Holding Ltd. ADR (a)(b) | | | 5,056 | | | $ | 872 | | |
Baozun, Inc ADR (a)(b) | | | 20,282 | | | | 640 | | |
China Lodging Group Ltd. ADR | | | 6,602 | | | | 954 | | |
China Resources Beer Holdings Co., Ltd. (c) | | | 236,300 | | | | 848 | | |
Ctrip.com International Ltd. ADR (a)(b) | | | 8,898 | | | | 392 | | |
Foshan Haitian Flavouring & Food Co., Ltd.,
Class A | | | 116,198 | | | | 960 | | |
Inner Mongolia Yili Industrial Group Co., Ltd.,
Class A | | | 65,300 | | | | 323 | | |
JD.com, Inc. ADR (b) | | | 15,417 | | | | 639 | | |
Jiangsu Hengrui Medicine Co., Ltd., Class A | | | 54,534 | | | | 577 | | |
Jiangsu Yanghe Brewery Joint-Stock Co., Ltd.,
Class A | | | 25,100 | | | | 443 | | |
Kweichow Moutai Co., Ltd., Class A | | | 9,300 | | | | 996 | | |
NetEase, Inc. ADR | | | 583 | | | | 201 | | |
New Oriental Education & Technology
Group, Inc. ADR | | | 7,763 | | | | 730 | | |
Oppein Home Group, Inc., Class A (b) | | | 4,547 | | | | 82 | | |
Shenzhou International Group Holdings Ltd. (c) | | | 62,000 | | | | 589 | | |
Sino Biopharmaceutical Ltd. (c) | | | 299,000 | | | | 529 | | |
Suofeiya Home Collection Co., Ltd., Class A | | | 76,802 | | | | 434 | | |
TAL Education Group ADR | | | 33,372 | | | | 991 | | |
Tencent Holdings Ltd. (c) | | | 34,600 | | | | 1,789 | | |
| | | | 12,989 | | |
Hong Kong (2.8%) | |
AIA Group Ltd. | | | 63,700 | | | | 543 | | |
India (4.8%) | |
HDFC Bank Ltd. ADR | | | 9,027 | | | | 918 | | |
Korea, Republic of (6.5%) | |
Loen Entertainment, Inc. (b) | | | 3,656 | | | | 384 | | |
NAVER Corp. | | | 1,055 | | | | 857 | | |
| | | | 1,241 | | |
Philippines (2.0%) | |
Jollibee Foods Corp. | | | 39,150 | | | | 198 | | |
Universal Robina Corp. | | | 64,480 | | | | 195 | | |
| | | | 393 | | |
Taiwan (6.4%) | |
Nien Made Enterprise Co., Ltd. | | | 40,000 | | | | 427 | | |
Silergy Corp. | | | 11,000 | | | | 252 | | |
Taiwan Semiconductor Manufacturing Co., Ltd. | | | 72,000 | | | | 553 | | |
| | | | 1,232 | | |
Total Common Stocks (Cost $11,879) | | | 17,316 | | |
Participation Note (2.5%) | |
China (2.5%) | |
Jiangsu Yanghe Brewery, Class A, Equity Linked
Notes, expires 1/10/18 (b)
(Cost $282) | | | 27,441 | | | | 484 | | |
Short-Term Investments (11.1%) | |
Securities held as Collateral on Loaned Securities (3.5%) | |
Investment Company (2.6%) | |
Morgan Stanley Institutional Liquidity
Funds — Treasury Securities Portfolio —
Institutional Class (See Note G) | | | 490,050 | | | | 490 | | |
| | | Face
Amount
(000) | | Value
(000) | |
Repurchase Agreements (0.9%) | |
Barclays Capital, Inc., (1.37%,
dated 12/29/17, due 1/2/18;
proceeds $113; fully collateralized by a
U.S. Government obligation; 1.75%
due 5/15/23; valued at $115) | | $ | 113 | | | $ | 113 | | |
HSBC Securities USA, Inc., (1.30%,
dated 12/29/17, due 1/2/18; proceeds
$9; fully collateralized by a U.S. Government
obligation; 3.00% due 2/15/47; valued at $9) | | | 8 | | | | 8 | | |
Merrill Lynch & Co., Inc., (1.42%,
dated 12/29/17, due 1/2/18; proceeds $58;
fully collateralized by a U.S. Government
obligation; 2.00% due 12/31/21;
valued at $59) | | | 58 | | | | 58 | | |
| | | | 179 | | |
Total Securities held as Collateral on Loaned
Securities (Cost $669) | | | 669 | | |
| | | Shares | | | |
Investment Company (7.6%) | |
Morgan Stanley Institutional Liquidity
Funds — Treasury Securities Portfolio —
Institutional Class (See Note G)
(Cost $1,457) | | | 1,456,548 | | | | 1,457 | | |
Total Short-Term Investments (Cost $2,126) | | | 2,126 | | |
Total Investments Excluding Purchased
Options (103.6%) (Cost $14,287) | | | 19,926 | | |
Total Purchased Options Outstanding (0.02%)
(Cost $17) | | | 4 | | |
Total Investments (103.6%) (Cost $14,304)
including $1,662 of securities of loaned (d)(e) | | | 19,930 | | |
Liabilities in Excess of Other Assets (–3.6%) | | | (696 | ) | |
Net Assets (100.0%) | | $ | 19,234 | | |
Country assignments and aggregations are based generally on third party vendor classifications and information, and may be different from the assignments and aggregations under the policies set forth in the Fund's prospectus and/or statement of additional information relating to geographic classifications.
(a) All or a portion of this security was on loan at December 31, 2017.
(b) Non-income producing security.
(c) Security trades on the Hong Kong exchange.
(d) The approximate fair value and percentage of net assets, $10,979,000 and 57.1%, respectively, represent the securities that have been fair valued under the fair valuation policy for international investments as described in Note A-1 within the Notes to the Financial Statements.
(e) At December 31, 2017, the aggregate cost for federal income tax purposes is approximately $14,316,000. The aggregate gross unrealized appreciation is approximately $5,698,000 and the aggregate gross unrealized depreciation is approximately $83,000, resulting in net unrealized appreciation of approximately $5,615,000.
ADR American Depositary Receipt.
The accompanying notes are an integral part of the financial statements.
6
Morgan Stanley Institutional Fund, Inc.
Annual Report — December 31, 2017
Portfolio of Investments (cont'd)
Asia Opportunity Portfolio
Call Option Purchased:
The Fund had the following call option purchased open at December 31, 2017:
Counterparty | | Description | | Strike
Price | | Expiration
Date | | Number of
Contracts | | Notional
Amount
(000) | | Value
(000) | | Premiums
Paid
(000) | | Unrealized
Depreciation
(000) | |
Royal Bank of Scotland | | | USD/CNH | | | CNH | 7.52 | | | Nov-18 | | | 4,184,264 | | | | 4,184 | | | $ | 4 | | | $ | 17 | | | $ | (13 | ) | |
CNH — Chinese Yuan Renminbi Offshore
USD — United States Dollar
Portfolio Composition*
Classification | | Percentage of
Total Investments | |
Internet Software & Services | | | 22.6 | % | |
Other** | | | 21.7 | | |
Beverages | | | 14.4 | | |
Diversified Consumer Services | | | 8.9 | | |
Food Products | | | 7.7 | | |
Short-Term Investments | | | 7.6 | | |
Hotels, Restaurants & Leisure | | | 6.0 | | |
Pharmaceuticals | | | 5.7 | | |
Internet & Direct Marketing Retail | | | 5.4 | | |
Total Investments | | | 100.0 | % | |
* Percentages indicated are based upon total investments (excluding Securities held as Collateral on Loaned Securities) as of December 31, 2017.
** Industries and/or investment types representing less than 5% of total investments.
The accompanying notes are an integral part of the financial statements.
7
Morgan Stanley Institutional Fund, Inc.
Annual Report — December 31, 2017
Asia Opportunity Portfolio
Statement of Assets and Liabilities | | December 31, 2017
(000) | |
Assets: | |
Investments in Securities of Unaffiliated Issuers, at Value(1) (Cost $12,357) | | $ | 17,983 | | |
Investment in Security of Affiliated Issuer, at Value (Cost $1,947) | | | 1,947 | | |
Total Investments in Securities, at Value (Cost $14,304) | | | 19,930 | | |
Foreign Currency, at Value (Cost $11) | | | 11 | | |
Due from Adviser | | | 58 | | |
Receivable for Fund Shares Sold | | | 25 | | |
Receivable for Investments Sold | | | 9 | | |
Receivable from Affiliate | | | 1 | | |
Receivable from Securities Lending Income | | | 1 | | |
Other Assets | | | 42 | | |
Total Assets | | | 20,077 | | |
Liabilities: | |
Collateral on Securities Loaned, at Value | | | 669 | | |
Payable for Investments Purchased | | | 91 | | |
Payable for Professional Fees | | | 49 | | |
Payable for Custodian Fees | | | 16 | | |
Payable for Transfer Agency Fees — Class I | | | 1 | | |
Payable for Transfer Agency Fees — Class A | | | 1 | | |
Payable for Transfer Agency Fees — Class C | | | — | @ | |
Payable for Administration Fees | | | 1 | | |
Payable for Shareholder Services Fees — Class A | | | 1 | | |
Payable for Distribution and Shareholder Services Fees — Class C | | | — | @ | |
Payable for Sub Transfer Agency Fees — Class A | | | — | @ | |
Payable for Sub Transfer Agency Fees — Class C | | | — | @ | |
Other Liabilities | | | 14 | | |
Total Liabilities | | | 843 | | |
Net Assets | | $ | 19,234 | | |
Net Assets Consist Of: | |
Paid-in-Capital | | $ | 13,419 | | |
Accumulated Net Investment Loss | | | (56 | ) | |
Accumulated Undistributed Net Realized Gain | | | 245 | | |
Unrealized Appreciation (Depreciation) on: | |
Investments | | | 5,626 | | |
Foreign Currency Translations | | | (— | @) | |
Net Assets | | $ | 19,234 | | |
The accompanying notes are an integral part of the financial statements.
8
Morgan Stanley Institutional Fund, Inc.
Annual Report — December 31, 2017
Asia Opportunity Portfolio
Statement of Assets and Liabilities (cont'd) | | December 31, 2017
(000) | |
CLASS I: | |
Net Assets | | $ | 15,913 | | |
| Shares Outstanding $0.001 par value shares of beneficial interest (unlimited shares authorized) (not in 000's) | | | 940,602 | | |
Net Asset Value, Offering and Redemption Price Per Share | | $ | 16.92 | | |
CLASS A: | |
Net Assets | | $ | 2,873 | | |
| Shares Outstanding $0.001 par value shares of beneficial interest (unlimited shares authorized) (not in 000's) | | | 170,611 | | |
Net Asset Value, Redemption Price Per Share | | $ | 16.84 | | |
Maximum Sales Load | | | 5.25 | % | |
Maximum Sales Charge | | $ | 0.93 | | |
Maximum Offering Price Per Share | | $ | 17.77 | | |
CLASS C: | |
Net Assets | | $ | 431 | | |
| Shares Outstanding $0.001 par value shares of beneficial interest (unlimited shares authorized) (not in 000's) | | | 25,782 | | |
Net Asset Value, Offering and Redemption Price Per Share | | $ | 16.73 | | |
CLASS IS: | |
Net Assets | | $ | 17 | | |
| Shares Outstanding $0.001 par value shares of beneficial interest (unlimited shares authorized) (not in 000's) | | | 1,000 | | |
Net Asset Value, Offering and Redemption Price Per Share | | $ | 16.92 | | |
(1) Including:
Securities on Loan, at Value: | | $ | 1,662 | | |
@ Amount is less than $500.
The accompanying notes are an integral part of the financial statements.
9
Morgan Stanley Institutional Fund, Inc.
Annual Report — December 31, 2017
Asia Opportunity Portfolio
Statement of Operations | | Year Ended
December 31, 2017
(000) | |
Investment Income: | |
Dividends from Securities of Unaffiliated Issuers (Net of $5 of Foreign Taxes Withheld) | | $ | 80 | | |
Dividends from Security of Affiliated Issuer (Note G) | | | 7 | | |
Income from Securities Loaned — Net | | | 5 | | |
Total Investment Income | | | 92 | | |
Expenses: | |
Professional Fees | | | 130 | | |
Advisory Fees (Note B) | | | 93 | | |
Registration Fees | | | 49 | | |
Custodian Fees (Note F) | | | 26 | | |
Shareholder Reporting Fees | | | 17 | | |
Administration Fees (Note C) | | | 9 | | |
Transfer Agency Fees — Class I (Note E) | | | 2 | | |
Transfer Agency Fees — Class A (Note E) | | | 2 | | |
Transfer Agency Fees — Class C (Note E) | | | 2 | | |
Transfer Agency Fees — Class IS (Note E) | | | 2 | | |
Shareholder Services Fees — Class A (Note D) | | | 4 | | |
Distribution and Shareholder Services Fees — Class C (Note D) | | | 2 | | |
Pricing Fees | | | 5 | | |
Directors' Fees and Expenses | | | 3 | | |
Sub Transfer Agency Fees — Class I | | | — | @ | |
Sub Transfer Agency Fees — Class A | | | — | @ | |
Sub Transfer Agency Fees — Class C | | | — | @ | |
Other Expenses | | | 27 | | |
Total Expenses | | | 373 | | |
Expenses Reimbursed by Adviser (Note B) | | | (142 | ) | |
Waiver of Advisory Fees (Note B) | | | (93 | ) | |
Reimbursement of Class Specific Expenses — Class A (Note B) | | | (— | @) | |
Reimbursement of Class Specific Expenses — Class C (Note B) | | | (2 | ) | |
Reimbursement of Class Specific Expenses — Class IS (Note B) | | | (2 | ) | |
Rebate from Morgan Stanley Affiliate (Note G) | | | (2 | ) | |
Net Expenses | | | 132 | | |
Net Investment Loss | | | (40 | ) | |
Realized Gain (Loss): | |
Investments Sold | | | 570 | | |
Foreign Currency Transactions | | | (10 | ) | |
Net Realized Gain | | | 560 | | |
Change in Unrealized Appreciation (Depreciation): | |
Investments | | | 5,612 | | |
Foreign Currency Translations | | | (— | @) | |
Net Change in Unrealized Appreciation (Depreciation) | | | 5,612 | | |
Net Realized Gain and Change in Unrealized Appreciation (Depreciation) | | | 6,172 | | |
Net Increase in Net Assets Resulting from Operations | | $ | 6,132 | | |
@ Amount is less than $500.
The accompanying notes are an integral part of the financial statements.
10
Morgan Stanley Institutional Fund, Inc.
Annual Report — December 31, 2017
Asia Opportunity Portfolio
Statements of Changes in Net Assets | | Year Ended
December 31, 2017
(000) | | Year Ended
December 31, 2016
(000) | |
Increase (Decrease) in Net Assets: | |
Operations: | |
Net Investment Loss | | $ | (40 | ) | | $ | (20 | ) | |
Net Realized Gain (Loss) | | | 560 | | | | (57 | ) | |
Net Change in Unrealized Appreciation (Depreciation) | | | 5,612 | | | | 5 | | |
Net Increase (Decrease) in Net Assets Resulting from Operations | | | 6,132 | | | | (72 | ) | |
Distributions from and/or in Excess of: | |
Class I: | |
Net Investment Income | | | — | | | | (46 | ) | |
Net Realized Gain | | | (177 | ) | | | — | | |
Paid-in-Capital | | | — | | | | (75 | ) | |
Class A: | |
Net Investment Income | | | — | | | | (2 | ) | |
Net Realized Gain | | | (32 | ) | | | — | | |
Paid-in-Capital | | | — | | | | (5 | ) | |
Class C: | |
Net Realized Gain | | | (5 | ) | | | — | | |
Paid-in-Capital | | | — | | | | (— | @) | |
Class IS: | |
Net Investment Income | | | — | | | | (— | @) | |
Net Realized Gain | | | (— | @) | | | — | | |
Paid-in-Capital | | | — | | | | (— | @) | |
Total Distributions | | | (214 | ) | | | (128 | ) | |
Capital Share Transactions:(1) | |
Class I: | |
Subscribed | | | 5,518 | | | | — | | |
Distributions Reinvested | | | 82 | | | | 13 | | |
Redeemed | | | (172 | ) | | | — | | |
Class A: | |
Subscribed | | | 1,637 | | | | 550 | | |
Distributions Reinvested | | | 32 | | | | 7 | | |
Redeemed | | | (80 | ) | | | (27 | ) | |
Class C: | |
Subscribed | | | 333 | | | | — | | |
Distributions Reinvested | | | 5 | | | | — | | |
Net Increase in Net Assets Resulting from Capital Share Transactions | | | 7,355 | | | | 543 | | |
Redemption Fees | | | 1 | | | | — | | |
Total Increase in Net Assets | | | 13,274 | | | | 343 | | |
Net Assets: | |
Beginning of Period | | | 5,960 | | | | 5,617 | | |
End of Period (Including Accumulated Net Investment Loss and Distributions in Excess of Net Investment
Income of $(56) and $(64), respectively) | | $ | 19,234 | | | $ | 5,960 | | |
The accompanying notes are an integral part of the financial statements.
11
Morgan Stanley Institutional Fund, Inc.
Annual Report — December 31, 2017
Asia Opportunity Portfolio
Statements of Changes in Net Assets (cont'd) | | Year Ended
December 31, 2017
(000) | | Year Ended
December 31, 2016
(000) | |
(1) Capital Share Transactions: | |
Class I: | |
Shares Subscribed | | | 388 | | | | — | | |
Shares Issued on Distributions Reinvested | | | 5 | | | | 1 | | |
Shares Redeemed | | | (11 | ) | | | — | | |
Net Increase in Class I Shares Outstanding | | | 382 | | | | 1 | | |
Class A: | |
Shares Subscribed | | | 118 | | | | 56 | | |
Shares Issued on Distributions Reinvested | | | 2 | | | | 1 | | |
Shares Redeemed | | | (5 | ) | | | (3 | ) | |
Net Increase in Class A Shares Outstanding | | | 115 | | | | 54 | | |
Class C: | |
Shares Subscribed | | | 25 | | | | — | | |
Shares Issued on Distributions Reinvested | | | — | @@ | | | — | | |
Net Increase in Class C Shares Outstanding | | | 25 | | | | — | | |
@ Amount is less than $500.
@@ Amount is less than 500 shares.
The accompanying notes are an integral part of the financial statements.
12
Morgan Stanley Institutional Fund, Inc.
Annual Report — December 31, 2017
Financial Highlights
Asia Opportunity Portfolio
| | | Class I | |
| | | Year Ended December 31, | | Period from
December 29, 2015(1) to | |
Selected Per Share Data and Ratios | | 2017 | | 2016 | | December 31, 2015 | |
Net Asset Value, Beginning of Period | | $ | 9.68 | | | $ | 10.03 | | | $ | 10.00 | | |
Income (Loss) from Investment Operations: | |
Net Investment Loss(2) | | | (0.04 | ) | | | (0.03 | ) | | | (0.00 | )(3) | |
Net Realized and Unrealized Gain (Loss) | | | 7.47 | | | | (0.10 | ) | | | 0.03 | | |
Total from Investment Operations | | | 7.43 | | | | (0.13 | ) | | | 0.03 | | |
Distributions from and/or in Excess of: | |
Net Investment Income | | | — | | | | (0.08 | ) | | | — | | |
Net Realized Gain | | | (0.19 | ) | | | — | | | | — | | |
Paid-in-Capital | | | — | | | | (0.14 | ) | | | — | | |
Total Distributions | | | (0.19 | ) | | | (0.22 | ) | | | — | | |
Redemption Fees | | | 0.00 | (3) | | | — | | | | — | | |
Net Asset Value, End of Period | | $ | 16.92 | | | $ | 9.68 | | | $ | 10.03 | | |
Total Return(4) | | | 76.82 | % | | | (1.34 | )% | | | 0.30 | %(6) | |
Ratios and Supplemental Data: | |
Net Assets, End of Period (Thousands) | | $ | 15,913 | | | $ | 5,405 | | | $ | 5,587 | | |
Ratio of Expenses to Average Net Assets(8) | | | 1.06 | %(5) | | | 1.08 | %(5) | | | 1.03 | %(5)(7) | |
Ratio of Net Investment Loss to Average Net Assets(8) | | | (0.27 | )%(5) | | | (0.31 | )%(5) | | | (0.71 | )%(5)(7) | |
Ratio of Rebate from Morgan Stanley Affiliates to Average Net Assets | | | 0.01 | % | | | 0.01 | % | | | 0.04 | %(7) | |
Portfolio Turnover Rate | | | 50 | % | | | 44 | % | | | 0 | %(6) | |
(8) Supplemental Information on the Ratios to Average Net Assets: | |
Ratios Before Expense Limitation: | |
Expenses to Average Net Assets | | | 3.10 | % | | | 5.28 | % | | | 125.50 | %(7) | |
Net Investment Loss to Average Net Assets | | | (2.31 | )% | | | (4.51 | )% | | | (125.18 | )%(7) | |
(1) Commencement of Operations.
(2) Per share amount is based on average shares outstanding.
(3) Amount is less than $0.005 per share.
(4) Calculated based on the net asset value as of the last business day of the period.
(5) The Ratios of Expenses and Net Investment Loss reflect the rebate of certain Fund expenses in connection with the investments in Morgan Stanley affiliates during the period. The effect of the rebate on the ratios is disclosed in the above table as "Ratio of Rebate from Morgan Stanley Affiliates to Average Net Assets."
(6) Not annualized.
(7) Annualized.
The accompanying notes are an integral part of the financial statements.
13
Morgan Stanley Institutional Fund, Inc.
Annual Report — December 31, 2017
Financial Highlights
Asia Opportunity Portfolio
| | | Class A | |
| | | Year Ended December 31, | | Period from
December 29, 2015(1) to | |
Selected Per Share Data and Ratios | | 2017 | | 2016 | | December 31, 2015 | |
Net Asset Value, Beginning of Period | | $ | 9.67 | | | $ | 10.03 | | | $ | 10.00 | | |
Income (Loss) from Investment Operations: | |
Net Investment Loss(2) | | | (0.10 | ) | | | (0.08 | ) | | | (0.00 | )(3) | |
Net Realized and Unrealized Gain (Loss) | | | 7.46 | | | | (0.09 | ) | | | 0.03 | | |
Total from Investment Operations | | | 7.36 | | | | (0.17 | ) | | | 0.03 | | |
Distributions from and/or in Excess of: | |
Net Investment Income | | | — | | | | (0.05 | ) | | | — | | |
Net Realized Gain | | | (0.19 | ) | | | — | | | | — | | |
Paid-in-Capital | | | — | | | | (0.14 | ) | | | — | | |
Total Distributions | | | (0.19 | ) | | | (0.19 | ) | | | — | | |
Redemption Fees | | | 0.00 | (3) | | | — | | | | — | | |
Net Asset Value, End of Period | | $ | 16.84 | | | $ | 9.67 | | | $ | 10.03 | | |
Total Return(4) | | | 76.17 | % | | | (1.67 | )% | | | 0.30 | %(6) | |
Ratios and Supplemental Data: | |
Net Assets, End of Period (Thousands) | | $ | 2,873 | | | $ | 535 | | | $ | 10 | | |
Ratio of Expenses to Average Net Assets(8) | | | 1.44 | %(5) | | | 1.44 | %(5) | | | 1.40 | %(5)(7) | |
Ratio of Net Investment Loss to Average Net Assets(8) | | | (0.69 | )%(5) | | | (0.78 | )%(5) | | | (1.09 | )%(5)(7) | |
Ratio of Rebate from Morgan Stanley Affiliates to Average Net Assets | | | 0.01 | % | | | 0.01 | % | | | 0.05 | %(7) | |
Portfolio Turnover Rate | | | 50 | % | | | 44 | % | | | 0 | %(6) | |
(8) Supplemental Information on the Ratios to Average Net Assets: | |
Ratios Before Expense Limitation: | |
Expenses to Average Net Assets | | | 3.50 | % | | | 6.36 | % | | | 139.50 | %(7) | |
Net Investment Loss to Average Net Assets | | | (2.75 | )% | | | (5.70 | )% | | | (139.19 | )%(7) | |
(1) Commencement of Operations.
(2) Per share amount is based on average shares outstanding.
(3) Amount is less than $0.005 per share.
(4) Calculated based on the net asset value which does not reflect sales charges, if applicable, as of the last business day of the period.
(5) The Ratios of Expenses and Net Investment Loss reflect the rebate of certain Fund expenses in connection with the investments in Morgan Stanley affiliates during the period. The effect of the rebate on the ratios is disclosed in the above table as "Ratio of Rebate from Morgan Stanley Affiliates to Average Net Assets."
(6) Not annualized.
(7) Annualized.
The accompanying notes are an integral part of the financial statements.
14
Morgan Stanley Institutional Fund, Inc.
Annual Report — December 31, 2017
Financial Highlights
Asia Opportunity Portfolio
| | | Class C | |
| | | Year Ended December 31, | | Period from
December 29, 2015(1) to | |
Selected Per Share Data and Ratios | | 2017 | | 2016 | | December 31, 2015 | |
Net Asset Value, Beginning of Period | | $ | 9.68 | | | $ | 10.03 | | | $ | 10.00 | | |
Income (Loss) from Investment Operations: | |
Net Investment Loss(2) | | | (0.22 | ) | | | (0.14 | ) | | | (0.00 | )(3) | |
Net Realized and Unrealized Gain (Loss) | | | 7.46 | | | | (0.10 | ) | | | 0.03 | | |
Total from Investment Operations | | | 7.24 | | | | (0.24 | ) | | | 0.03 | | |
Distributions from and/or in Excess of: | |
Net Realized Gain | | | (0.19 | ) | | | — | | | | — | | |
Paid-in-Capital | | | — | | | | (0.11 | ) | | | — | | |
Total Distributions | | | (0.19 | ) | | | (0.11 | ) | | | — | | |
Redemption Fees | | | 0.00 | (3) | | | — | | | | — | | |
Net Asset Value, End of Period | | $ | 16.73 | | | $ | 9.68 | | | $ | 10.03 | | |
Total Return(4) | | | 74.85 | % | | | (2.44 | )% | | | 0.30 | %(6) | |
Ratios and Supplemental Data: | |
Net Assets, End of Period (Thousands) | | $ | 431 | | | $ | 10 | | | $ | 10 | | |
Ratio of Expenses to Average Net Assets(8) | | | 2.19 | %(5) | | | 2.19 | %(5) | | | 2.17 | %(5)(7) | |
Ratio of Net Investment Loss to Average Net Assets(8) | | | (1.51 | )%(5) | | | (1.42 | )%(5) | | | (1.84 | )%(5)(7) | |
Ratio of Rebate from Morgan Stanley Affiliates to Average Net Assets | | | 0.01 | % | | | 0.01 | % | | | 0.03 | %(7) | |
Portfolio Turnover Rate | | | 50 | % | | | 44 | % | | | 0 | %(6) | |
(8) Supplemental Information on the Ratios to Average Net Assets: | |
Ratios Before Expense Limitation: | |
Expense to Average Net Assets | | | 5.26 | % | | | 27.34 | % | | | 140.25 | %(7) | |
Net Investment Loss to Average Net Assets | | | (4.58 | )% | | | (26.57 | )% | | | (139.92 | )%(7) | |
(1) Commencement of Operations.
(2) Per share amount is based on average shares outstanding.
(3) Amount is less than $0.005 per share.
(4) Calculated based on the net asset value which does not reflect sales charges, if applicable, as of the last business day of the period.
(5) The Ratios of Expenses and Net Investment Loss reflect the rebate of certain Fund expenses in connection with the investments in Morgan Stanley affiliates during the period. The effect of the rebate on the ratios is disclosed in the above table as "Ratio of Rebate from Morgan Stanley Affiliates to Average Net Assets."
(6) Not annualized.
(7) Annualized.
The accompanying notes are an integral part of the financial statements.
15
Morgan Stanley Institutional Fund, Inc.
Annual Report — December 31, 2017
Financial Highlights
Asia Opportunity Portfolio
| | | Class IS | |
| | | Year Ended December 31, | | Period from
December 29, 2015(1) to | |
Selected Per Share Data and Ratios | | 2017 | | 2016 | | December 31, 2015 | |
Net Asset Value, Beginning of Period | | $ | 9.68 | | | $ | 10.03 | | | $ | 10.00 | | |
Income (Loss) from Investment Operations: | |
Net Investment Loss(2) | | | (0.02 | ) | | | (0.03 | ) | | | (0.00 | )(3) | |
Net Realized and Unrealized Gain (Loss) | | | 7.45 | | | | (0.10 | ) | | | 0.03 | | |
Total from Investment Operations | | | 7.43 | | | | (0.13 | ) | | | 0.03 | | |
Distributions from and/or in Excess of: | |
Net Investment Income | | | — | | | | (0.08 | ) | | | — | | |
Net Realized Gain | | | (0.19 | ) | | | — | | | | — | | |
Paid-in-Capital | | | — | | | | (0.14 | ) | | | — | | |
Total Distributions | | | (0.19 | ) | | | (0.22 | ) | | | — | | |
Redemption Fees | | | 0.00 | (3) | | | — | | | | — | | |
Net Asset Value, End of Period | | $ | 16.92 | | | $ | 9.68 | | | $ | 10.03 | | |
Total Return(4) | | | 76.82 | % | | | (1.29 | )% | | | 0.30 | %(6) | |
Ratios and Supplemental Data: | |
Net Assets, End of Period (Thousands) | | $ | 17 | | | $ | 10 | | | $ | 10 | | |
Ratio of Expenses to Average Net Assets(8) | | | 1.04 | %(5) | | | 1.04 | %(5) | | | 1.02 | %(5)(7) | |
Ratio of Net Investment Loss to Average Net Assets(8) | | | (0.18 | )%(5) | | | (0.26 | )%(5) | | | (0.69 | )%(5)(7) | |
Ratio of Rebate from Morgan Stanley Affiliates to Average Net Assets | | | 0.01 | % | | | 0.01 | % | | | 0.03 | %(7) | |
Portfolio Turnover Rate | | | 50 | % | | | 44 | % | | | 0 | %(6) | |
(8) Supplemental Information on the Ratios to Average Net Assets: | |
Ratios Before Expense Limitation: | |
Expenses to Average Net Assets | | | 17.65 | % | | | 25.20 | % | | | 139.25 | %(7) | |
Net Investment Loss to Average Net Assets | | | (16.79 | )% | | | (24.42 | )% | | | (138.92 | )%(7) | |
(1) Commencement of Operations.
(2) Per share amount is based on average shares outstanding.
(3) Amount is less than $0.005 per share.
(4) Calculated based on the net asset value as of the last business day of the period.
(5) The Ratios of Expenses and Net Investment Loss reflect the rebate of certain Fund expenses in connection with the investments in Morgan Stanley affiliates during the period. The effect of the rebate on the ratios is disclosed in the above table as "Ratio of Rebate from Morgan Stanley Affiliates to Average Net Assets."
(6) Not annualized.
(7) Annualized.
The accompanying notes are an integral part of the financial statements.
16
Morgan Stanley Institutional Fund, Inc.
Annual Report — December 31, 2017
Notes to Financial Statements
Morgan Stanley Institutional Fund, Inc. (the "Company") is registered under the Investment Company Act of 1940, as amended (the "Act"), as an open-end management investment company. The Company is comprised of twenty-nine separate, active, diversified and non-diversified funds (individually referred to as a "Fund", collectively as the "Funds"). The Company applies investment company accounting and reporting guidance.
The accompanying financial statements relate to the Asia Opportunity Portfolio. The Fund seeks long-term capital appreciation.
The Fund offers four classes of shares — Class I, Class A, Class C and Class IS.
A. Significant Accounting Policies: The following significant accounting policies are in conformity with U.S. generally accepted accounting principles ("GAAP"). Such policies are consistently followed by the Company in the preparation of its financial statements. GAAP may require management to make estimates and assumptions that affect the reported amounts and disclosures in the financial statements. Actual results may differ from those estimates.
1. Security Valuation: (1) An equity portfolio security listed or traded on an exchange is valued at its latest reported sales price (or at the exchange official closing price if such exchange reports an official closing price), and if there were no sales on a given day and if there is no official exchange closing price for that day, the security is valued at the mean between the last reported bid and asked prices if such bid and asked prices are available on the relevant exchanges. Listed equity securities not traded on the valuation date with no reported bid and asked prices available on the exchange are valued at the mean between the current bid and asked prices obtained from one or more reputable brokers or dealers. In cases where a security is traded on more than one exchange, the security is valued on the exchange designated as the primary market; (2) all other equity portfolio securities for which over-the-counter ("OTC") market quotations are readily available are valued at the latest reported sales price (or at the market official closing price if such market reports an official closing price), and if there was no trading in the security on a given day and if there is no official closing price from relevant markets for that day, the security is valued at the mean between the last reported bid and asked prices if such bid and asked prices are available on
the relevant markets. An unlisted equity security that does not trade on the valuation date and for which bid and asked prices from the relevant markets are unavailable is valued at the mean between the current bid and asked prices obtained from one or more reputable brokers or dealers; (3) certain portfolio securities may be valued by an outside pricing service/vendor approved by the Company's Board of Directors (the "Directors"). The pricing service/vendor may employ a pricing model that takes into account, among other things, bids, yield spreads, and/or other market data and specific security characteristics. Alternatively, if a valuation is not available from an outside pricing service/vendor, and the security trades on an exchange, the security may be valued at its latest reported sale price (or at the exchange official closing price if such exchange reports an official closing price), prior to the time when assets are valued. If there are no sales on a given day and if there is no official exchange closing price for that day, the security is valued at the mean between the last reported bid and asked prices if such bid and asked prices are available in the relevant exchanges; (4) listed options are valued at the last reported sales price on the exchange on which they are listed (or at the exchange official closing price if such exchange reports an official closing price). If an official closing price or last reported sales price is unavailable, the listed option should be fair valued at the mean between its latest bid and ask prices. Unlisted options are valued at the mean between their latest bid and ask prices from a broker/dealer or valued by a pricing service/vendor; (5) when market quotations are not readily available, including circumstances under which Morgan Stanley Investment Management Inc. (the "Adviser") determines that the closing price, last sale price or the mean between the last reported bid and asked prices are not reflective of a security's market value, portfolio securities are valued at their fair value as determined in good faith under procedures established by and under the general supervision of the Directors. Occasionally, developments affecting the closing prices of securities and other assets may occur between the times at which valuations of such securities are determined (that is, close of the foreign market on which the securities trade) and the close of business of the New York Stock Exchange ("NYSE"). If developments occur during such periods that are expected to materially affect the value of such securities, such valuations may be adjusted to reflect the estimated fair value of such securities as of the close of the NYSE, as determined
17
Morgan Stanley Institutional Fund, Inc.
Annual Report — December 31, 2017
Notes to Financial Statements (cont'd)
in good faith by the Directors or by the Adviser using a pricing service and/or procedures approved by the Directors; (6) quotations of foreign portfolio securities, other assets and liabilities and forward contracts stated in foreign currency are translated into U.S. dollar equivalents at the prevailing market rates prior to the close of the NYSE; and (7) investments in mutual funds, including the Morgan Stanley Institutional Liquidity Funds, are valued at the net asset value ("NAV") as of the close of each business day.
The Directors have responsibility for determining in good faith the fair value of the investments, and the Directors may appoint others, such as the Company's Adviser or a valuation committee, to assist the Directors in determining fair value and to make the actual calculations pursuant to the fair valuation methodologies previously approved by the Directors. Under procedures approved by the Directors, the Company's Adviser has formed a Valuation Committee whose members are approved by the Directors. The Valuation Committee provides administration and oversight of the Company's valuation policies and procedures, which are reviewed at least annually by the Directors. These procedures allow the Company to utilize independent pricing services, quotations from securities and financial instrument dealers, and other market sources to determine fair value.
The Company has procedures to determine the fair value of securities and other financial instruments for which market prices are not readily available. Under these procedures, the Valuation Committee convenes on a regular and ad hoc basis to review such securities and considers a number of factors, including valuation methodologies and significant unobservable valuation inputs, when arriving at fair value. The Valuation Committee may employ a market-based approach which may use related or comparable assets or liabilities, recent transactions, market multiples, book values, and other relevant information for the investment to determine the fair value of the investment. An income-based valuation approach may also be used in which the anticipated future cash flows of the investment are discounted to calculate fair value. Discounts may also be applied due to the nature or duration of any restrictions on the disposition of the investments. Due to the inherent uncertainty of valuations of such investments, the fair values may differ significantly from the values that would have been used had an active market existed.
The Valuation Committee employs various methods for calibrating these valuation approaches including a regular review of valuation methodologies, key inputs and assumptions, transactional back-testing or disposition analysis, and reviews of any related market activity.
2. Fair Value Measurement: Financial Accounting Standards Board ("FASB") Accounting Standards CodificationTM ("ASC") 820, "Fair Value Measurement" ("ASC 820"), defines fair value as the value that the Fund would receive to sell an investment or pay to transfer a liability in a timely transaction with an independent buyer in the principal market, or in the absence of a principal market, the most advantageous market for the investment or liability. ASC 820 establishes a three-tier hierarchy to distinguish between (1) inputs that reflect the assumptions market participants would use in valuing an asset or liability developed based on market data obtained from sources independent of the reporting entity (observable inputs) and (2) inputs that reflect the reporting entity's own assumptions about the assumptions market participants would use in valuing an asset or liability developed based on the best information available in the circumstances (unobservable inputs) and to establish classification of fair value measurements for disclosure purposes. Various inputs are used in determining the value of the Fund's investments. The inputs are summarized in the three broad levels listed below.
• Level 1 – unadjusted quoted prices in active markets for identical investments
• Level 2 – other significant observable inputs (including quoted prices for similar investments, interest rates, prepayment speeds, credit risk, etc.)
• Level 3 – significant unobservable inputs including the Fund's own assumptions in determining the fair value of investments. Factors considered in making this determination may include, but are not limited to, information obtained by contacting the issuer, analysts, or the appropriate stock exchange (for exchange-traded securities), analysis of the issuer's financial statements or other available documents and, if necessary, available information concerning other securities in similar circumstances
18
Morgan Stanley Institutional Fund, Inc.
Annual Report — December 31, 2017
Notes to Financial Statements (cont'd)
The inputs or methodology used for valuing securities are not necessarily an indication of the risk associated with investing in those securities and the determination of the significance of a particular input to the fair value measurement in its entirety requires judgment and considers factors specific to each security.
The following is a summary of the inputs used to value the Fund's investments as of December 31, 2017.
Investment Type | | Level 1
Unadjusted
quoted
prices
(000) | | Level 2
Other
significant
observable
inputs
(000) | | Level 3
Significant
unobservable
inputs
(000) | | Total
(000) | |
Assets: | |
Common Stocks | |
Banks | | $ | 918 | | | $ | — | | | $ | — | | | $ | 918 | | |
Beverages | | | — | | | | 2,287 | | | | — | | | | 2,287 | | |
Diversified Consumer
Services | | | 1,721 | | | | — | | | | — | | | | 1,721 | | |
Food Products | | | — | | | | 1,478 | | | | — | | | | 1,478 | | |
Hotels, Restaurants &
Leisure | | | 954 | | | | 198 | | | | — | | | | 1,152 | | |
Household Durables | | | — | | | | 943 | | | | — | | | | 943 | | |
Insurance | | | — | | | | 543 | | | | — | | | | 543 | | |
Internet & Direct
Marketing Retail | | | 1,031 | | | | — | | | | — | | | | 1,031 | | |
Internet Software &
Services | | | 1,713 | | | | 2,646 | | | | — | | | | 4,359 | | |
Media | | | — | | | | 384 | | | | — | | | | 384 | | |
Pharmaceuticals | | | — | | | | 1,106 | | | | — | | | | 1,106 | | |
Semiconductors &
Semiconductor
Equipment | | | — | | | | 805 | | | | — | | | | 805 | | |
Textiles, Apparel &
Luxury Goods | | | — | | | | 589 | | | | — | | | | 589 | | |
Total Common Stocks | | | 6,337 | | | | 10,979 | | | | — | | | | 17,316 | | |
Participation Note | | | — | | | | 484 | | | | — | | | | 484 | | |
Short-Term Investments | |
Investment Company | | | 1,947 | | | | — | | | | — | | | | 1,947 | | |
Repurchase Agreements | | | — | | | | 179 | | | | — | | | | 179 | | |
Total Short-Term
Investments | | | 1,947 | | | | 179 | | | | — | | | | 2,126 | | |
Call Option Purchased | | | — | | | | 4 | | | | — | | | | 4 | | |
Total Assets | | $ | 8,284 | | | $ | 11,646 | | | $ | — | | | $ | 19,930 | | |
Transfers between investment levels may occur as the markets fluctuate and/or the availability of data used in an investment's valuation changes. The Fund recognizes transfers between the levels as of the end of the period. As of December 31, 2017, securities with a total value of approximately $8,418,000 transferred from Level 1 to Level 2. Securities that were valued using unadjusted quoted prices at December 31, 2016 were valued using other significant observable inputs at December 31, 2017. At December 31, 2017, the fair value of certain securities were adjusted due to developments which occurred
between the time of the close of the foreign markets on which they trade and the close of business on the NYSE which resulted in their Level 2 classification.
3. Repurchase Agreements: The Fund may enter into repurchase agreements under which the Fund lends cash and takes possession of securities with an agreement that the counterparty will repurchase such securities. In connection with transactions in repurchase agreements, a bank as custodian for the Fund takes possession of the underlying securities which are held as collateral, with a market value at least equal to the amount of the repurchase transaction, including principal and accrued interest. To the extent that any repurchase transaction exceeds one business day, the value of the collateral is marked-to-market on a daily basis to determine that the value of the collateral does not decrease below the repurchase price plus accrued interest as earned. If such a decrease occurs, additional collateral will be requested and, when received, will be added to the account to maintain full collateralization. In the event of default on the obligation to repurchase, the Fund has the right to liquidate the collateral and apply the proceeds in satisfaction of the obligation. In the event of default or bankruptcy by the counterparty to the agreement, realization of the collateral proceeds may be subject to cost and delays. The Fund, along with other affiliated investment companies, may utilize a joint trading account for the purpose of entering into repurchase agreements.
4. Foreign Currency Translation and Foreign Investments: The books and records of the Fund are maintained in U.S. dollars. Foreign currency amounts are translated into U.S. dollars as follows:
– investments, other assets and liabilities at the prevailing rate of exchange on the valuation date;
– investment transactions and investment income at the prevailing rates of exchange on the dates of such transactions.
Although the net assets of the Fund are presented at the foreign exchange rates and market values at the close of the period, the Fund does not isolate that portion of the results of operations arising as a result of changes in the foreign exchange rates from the fluctuations arising from changes in the market prices of securities held at period end. Similarly, the Fund does not isolate the effect of changes in foreign exchange rates from the fluctuations arising from changes in the market prices of
19
Morgan Stanley Institutional Fund, Inc.
Annual Report — December 31, 2017
Notes to Financial Statements (cont'd)
securities sold during the period. Accordingly, realized and unrealized foreign currency gains (losses) on investments in securities are included in the reported net realized and unrealized gains (losses) on investment transactions and balances. However, pursuant to U.S. federal income tax regulations, gains and losses from certain foreign currency transactions and the foreign currency portion of gains and losses realized on sales and maturities of foreign denominated debt securities are treated as ordinary income for U.S. federal income tax purposes.
Net realized gains (losses) on foreign currency transactions represent net foreign exchange gains (losses) from foreign currency forward exchange contracts, disposition of foreign currencies, currency gains (losses) realized between the trade and settlement dates on securities transactions, and the difference between the amount of investment income and foreign withholding taxes recorded on the Fund's books and the U.S. dollar equivalent amounts actually received or paid. Net unrealized currency gains (losses) from valuing foreign currency denominated assets and liabilities at period end exchange rates are reflected as a component of unrealized appreciation (depreciation) in the Statement of Assets and Liabilities. The change in unrealized currency gains (losses) on foreign currency translations for the period is reflected in the Statement of Operations.
Foreign security and currency transactions may involve certain considerations and risks not typically associated with those of U.S. dollar denominated transactions as a result of, among other factors, fluctuations of exchange rates in relation to the U.S. dollar, the possibility of lower levels of governmental supervision and regulation of foreign securities markets and the possibility of political or economic instability.
Governmental approval for foreign investments may be required in advance of making an investment under certain circumstances in some countries, and the extent of foreign investments in domestic companies may be subject to limitation in other countries. Foreign ownership limitations also may be imposed by the charters of individual companies to prevent, among other concerns, violations of foreign investment limitations. As a result, an additional class of shares (identified as "Foreign" in the Portfolio of Investments) may be created and offered
for investment. The "local" and "foreign shares" market values may differ. In the absence of trading of the foreign shares in such markets, the Fund values the foreign shares at the closing exchange price of the local shares.
5. Derivatives: The Fund may, but is not required to, use derivative instruments for a variety of purposes, including hedging, risk management, portfolio management or to earn income. Derivatives are financial instruments whose value is based, in part, on the value of an underlying asset, interest rate, index or financial instrument. Prevailing interest rates and volatility levels, among other things, also affect the value of derivative instruments. A derivative instrument often has risks similar to its underlying asset and may have additional risks, including imperfect correlation between the value of the derivative and the underlying asset, risks of default by the counterparty to certain transactions, magnification of losses incurred due to changes in the market value of the securities, instruments, indices or interest rates to which the derivative instrument relates, risks that the transactions may not be liquid and risks arising from margin requirements. The use of derivatives involves risks that are different from, and possibly greater than, the risks associated with other portfolio investments. Derivatives may involve the use of highly specialized instruments that require investment techniques and risk analyses different from those associated with other portfolio investments. All of the Fund's holdings, including derivative instruments, are marked-to-market each day with the change in value reflected in unrealized appreciation (depreciation). Upon disposition, a realized gain or loss is recognized.
Certain derivative transactions may give rise to a form of leverage. Leverage magnifies the potential for gain and the risk of loss. Leverage associated with derivative transactions may cause the Fund to liquidate portfolio positions when it may not be advantageous to do so to satisfy its obligations or to meet earmarking or segregation requirements, pursuant to applicable Securities and Exchange Commission ("SEC") rules and regulations, or may cause the Fund to be more volatile than if the Fund had not been leveraged. Although the Adviser seeks to use derivatives to further the Fund's investment objectives, there is no assurance that the use of derivatives will achieve this result.
20
Morgan Stanley Institutional Fund, Inc.
Annual Report — December 31, 2017
Notes to Financial Statements (cont'd)
Following is a description of the derivative instruments and techniques that the Fund used during the period and their associated risks:
Options: With respect to options, the Fund is subject to equity risk, interest rate risk and foreign currency exchange risk in the normal course of pursuing its investment objectives. If the Fund buys an option, it buys a legal contract giving it the right to buy or sell a specific amount of the underlying instrument or foreign currency, or futures contract on the underlying instrument or foreign currency, at an agreed-upon price during a period of time or on a specified date typically in exchange for a premium paid by the Fund. The Fund may purchase and/or sell put and call options. Purchasing call options tends to increase the Fund's exposure to the underlying (or similar) instrument. Purchasing put options tends to decrease the Fund's exposure to the underlying (or similar) instrument. When entering into purchased option contracts, the Fund bears the risk of interest or exchange rates or securities prices moving unexpectedly, in which case, the Fund may not achieve the anticipated benefits of the purchased option contracts; however the risk of loss is limited to the premium paid. Purchased options are reported as part of "Total Investments in Securities" in the Statement of Assets and Liabilities. Premium paid for purchasing options which expired are treated as realized losses. If the Fund sells an option, it sells to another party the right to buy from or sell to the Fund a specific amount of the underlying instrument or foreign currency, or futures contract on the underlying instrument or foreign currency, at an agreed-upon price during a period of time or on a specified date typically in exchange for a premium received by the Fund. When options are purchased OTC, the Fund bears the risk that the counterparty that wrote the option will be unable or unwilling to perform its obligations under the option contract. Options may also be illiquid and the Fund may have difficulty closing out its position. A decision as to whether, when and how to use options involves the exercise of skill and judgment and even a well-conceived option transaction may be unsuccessful because of market behavior or unexpected events. The prices of options can be highly volatile and the use of options can lower total returns.
FASB ASC 815, "Derivatives and Hedging" ("ASC 815"), is intended to improve financial reporting about
derivative instruments by requiring enhanced disclosures to enable investors to better understand how and why the Fund uses derivative instruments, how these derivative instruments are accounted for and their effects on the Fund's financial position and results of operations.
The following table sets forth the fair value of the Fund's derivative contracts by primary risk exposure as of December 31, 2017.
| | | Asset Derivatives
Statement of Assets and
Liabilities Location | | Primary Risk
Exposure | | Value
(000) | |
Option Purchased
| | Investments, at Value
(Option Purchased) | |
Currency Risk | | $ | 4 | (a) | |
(a) Amounts are included in Investments in Securities in the Statement of Assets and Liabilities.
The following tables set forth by primary risk exposure the Fund's realized gains (losses) and change in unrealized appreciation (depreciation) by type of derivative contract for the year ended December 31, 2017 in accordance with ASC 815.
Realized Gain (Loss) | |
Primary Risk Exposure | | Derivative Type | | Value
(000) | |
Currency Risk
| | Investments
(Options Purchased) | | $ | (1 | )(b) | |
(b) Amounts are included in Investments Sold in the Statement of Operations.
Change in Unrealized Appreciation (Depreciation) | |
Primary Risk Exposure | | Derivative Type | | Value
(000) | |
Currency Risk
| | Investments
(Options Purchased) | | $ | (12 | )(c) | |
(c) Amounts are included in Investments in the Statement of Operations.
At December 31, 2017, the Fund's derivative assets and liabilities are as follows:
Gross Amounts of Assets and Liabilities
Presented in the Statement of Assets and Liabilities | |
Derivatives | | Assets(d)
(000) | | Liabilities(d)
(000) | |
Option Purchased | | $ | 4 | (a) | | $ | — | | |
(a) Amounts are included in Investments in Securities in the Statement of Assets and Liabilities.
(d) Absent an event of default or early termination, OTC derivative assets and liabilities are presented gross and not offset in the Statement of Assets and Liabilities.
The Fund typically enters into International Swaps and Derivatives Association, Inc. Master Agreements ("ISDA Master Agreements") or similar master agreements (collectively, "Master Agreements") with its contract counterparties for certain OTC derivatives in order to, among other things, reduce its credit risk to
21
Morgan Stanley Institutional Fund, Inc.
Annual Report — December 31, 2017
Notes to Financial Statements (cont'd)
counterparties. ISDA Master Agreements include provisions for general obligations, representations, collateral and events of default or termination. Under an ISDA Master Agreement, the Fund typically may offset with the counterparty certain OTC derivative financial instruments' payables and/or receivables with collateral held and/or posted and create one single net payment (close-out netting) in the event of default, termination and/or potential deterioration in the credit quality of the counterparty. Various Master Agreements govern the terms of certain transactions with counterparties, including transactions such as swap, forward, repurchase and reverse repurchase agreements. These Master Agreements typically attempt to reduce the counterparty risk associated with such transactions by specifying credit protection mechanisms and providing standardization that improves legal certainty. Cross-termination provisions under Master Agreements typically provide that a default in connection with one transaction between the Fund and a counterparty gives the non-defaulting party the right to terminate any other transactions in place with the defaulting party to create one single net payment due to/due from the defaulting party and may be a feature in certain Master Agreements. In the event the Fund exercises its right to terminate a Master Agreement after a counterparty experiences a termination event as defined in the Master Agreement, the return of collateral with market value in excess of the Fund's net liability may be delayed or denied.
The following table presents derivative financial instruments that are subject to enforceable netting arrangements as of December 31, 2017.
Gross Amounts Not Offset in the Statement of Assets and Liabilities | |
Counterparty | | Gross Asset
Derivatives
Presented in
Statement of
Assets and
Liabilities
(000) | | Financial
Instrument
(000) | | Collateral
Received
(000) | | Net Amount
(not less
than $0)
(000) | |
Royal Bank of Scotland | | $ | 4 | (a) | | $ | — | | | $ | — | | | $ | 4 | | |
(a) Amounts are included in Investments in Securities in the Statement of Assets and Liabilities.
For the year ended December 31, 2017, the approximate average monthly amount outstanding for each derivative type is as follows:
Options Purchased: | |
Average monthly notional amount | | | 706,000 | | |
6. Securities Lending: The Fund lends securities to qualified financial institutions, such as broker-dealers, to earn additional income. Any increase or decrease in the fair value of the securities loaned that might occur and any interest earned or dividends declared on those securities during the term of the loan would remain in the Fund. The Fund would receive cash or securities as collateral in an amount equal to or exceeding 100% of the current fair value of the loaned securities. The collateral is marked-to-market daily by State Street Bank and Trust Company ("State Street"), the securities lending agent, to ensure that a minimum of 100% collateral coverage is maintained.
Based on pre-established guidelines, the securities lending agent invests any cash collateral that is received in an affiliated money market portfolio and repurchase agreements. Securities lending income is generated from the earnings on the invested collateral and borrowing fees, less any rebates owed to the borrowers and compensation to the lending agent, and is recorded as "Income from Securities Loaned — Net" in the Fund's Statement of Operations. Risks in securities lending transactions are that a borrower may not provide additional collateral when required or return the securities when due, and that the value of the short-term investments will be less than the amount of cash collateral plus any rebate that is required to be returned to the borrower.
The Fund has the right under the lending agreement to recover the securities from the borrower on demand.
The following table presents financial instruments that are subject to enforceable netting arrangements as of December 31, 2017.
Gross Amounts Not Offset in the Statement of Assets and Liabilities | |
Gross Asset
Amounts
Presented in
Statement of
Assets and
Liabilities
(000) | | Financial
Instrument
(000) | | Collateral
Received
(000) | | Net Amount
(not less
than $0)
(000) | |
| $ | 1,662 | (e) | | $ | — | | | $ | (1,662 | )(f)(g) | | $ | 0 | | |
(e) Represents market value of loaned securities at year end.
(f) The Fund received cash collateral of approximately $669,000, which was subsequently invested in Repurchase Agreements and Morgan Stanley Institutional Liquidity Funds as reported in the Portfolio of Investments. In addition, the Fund received non-cash collateral of approximately $1,044,000 in the form of U.S. Government obligations, which the Fund cannot sell or repledge, and accordingly are not reflected in the Portfolio of Investments.
(g) The actual collateral received is greater than the amount shown here due to overcollateralization.
22
Morgan Stanley Institutional Fund, Inc.
Annual Report — December 31, 2017
Notes to Financial Statements (cont'd)
FASB ASC 860 "Transfers & Servicing: Repurchase-to-Maturity Transactions, Repurchase Financings, and Disclosures", is intended to provide increased transparency about the types of collateral pledged in securities lending transactions and other similar transactions that are accounted for as secured borrowing.
The following table displays a breakdown of transactions accounted for as secured borrowings, the gross obligations by class of collateral pledged, and the remaining contractual maturity of those transactions as of December 31, 2017.
Remaining Contractual Maturity of the Agreements | |
| | | Overnight and
Continuous
(000) | | <30 days
(000) | | Between
30 &
90 days
(000) | | >90 days
(000) | | Total
(000) | |
Securities Lending
Transactions | |
Common Stocks | | $ | 669 | | | $ | — | | | $ | — | | | $ | — | | | $ | 669 | | |
Total Borrowings | | $ | 669 | | | $ | — | | | $ | — | | | $ | — | | | $ | 669 | | |
Gross amount of
recognized liabilities
for securities lending
transactions | | | | | | | | | | $ | 669 | | |
7. Structured Investments: The Fund invested a portion of its assets in structured investments. A structured investment is a derivative security designed to offer a return linked to a particular underlying security, currency, commodity or market. Structured investments may come in various forms including notes (such as exchange-traded notes), warrants and options to purchase securities. The Fund will typically use structured investments to gain exposure to a permitted underlying security, currency, commodity or market when direct access to a market is limited or inefficient from a tax or cost standpoint. There can be no assurance that structured investments will trade at the same price or have the same value as the underlying security, currency, commodity or market. Investments in structured investments involve risks including issuer risk, counterparty risk and market risk. Holders of structured investments bear risks of the underlying investment and are subject to issuer or counterparty risk because the Fund is relying on the creditworthiness of such issuer or counterparty and has no rights with respect to the underlying investment. Certain structured investments may be thinly traded or have a limited trading market and may have the effect of increasing the Fund's illiquidity to the extent that
the Fund, at a particular time, may be unable to find qualified buyers for these securities.
8. Redemption Fees: The Fund will assess a 2% redemption fee on Class I shares, Class A shares, Class C shares and Class IS shares, which is paid directly to the Fund, for shares redeemed or exchanged within thirty days of purchase, subject to certain exceptions. The redemption fee is designed to protect the Fund and its remaining shareholders from the effects of short-term trading. These fees, if any, are included in the Statements of Changes in Net Assets.
9. Indemnifications: The Company enters into contracts that contain a variety of indemnifications. The Company's maximum exposure under these arrangements is unknown. However, the Company has not had prior claims or losses pursuant to these contracts and expects the risk of loss to be remote.
10. Dividends and Distributions to Shareholders: Dividends and distributions to shareholders are recorded on the ex-dividend date. Dividends from net investment income, if any, are declared and paid annually. Net realized capital gains, if any, are distributed at least annually.
11. Security Transactions, Income and Expenses: Security transactions are accounted for on the trade date (date the order to buy or sell is executed). Realized gains and losses on the sale of investment securities are determined on the specific identified cost method. Dividend income and other distributions are recorded on the ex-dividend date (except for certain foreign dividends which may be recorded as soon as the Fund is informed of such dividends) net of applicable withholding taxes. Interest income is recognized on the accrual basis except where collection is in doubt. Discounts are accreted and premiums are amortized over the life of the respective securities. Most expenses of the Company can be directly attributed to a particular Fund. Expenses which cannot be directly attributed are apportioned among the Funds based upon relative net assets or other appropriate methods. Income, expenses (other than class specific expenses — distribution and shareholder services, transfer agency and sub transfer agency fees) and realized and unrealized gains or losses are allocated to each class of shares based upon their relative net assets.
B. Advisory Fees: The Adviser, a wholly-owned subsidiary of Morgan Stanley, provides the Fund with advisory services under
23
Morgan Stanley Institutional Fund, Inc.
Annual Report — December 31, 2017
Notes to Financial Statements (cont'd)
the terms of an Investment Advisory Agreement, paid quarterly, at the annual rate based on the daily net assets as follows:
First $750
million | | Next $750
million | | Over $1.5
billion | |
| | 0.80 | % | | | 0.75 | % | | | 0.70 | % | |
For the year ended December 31, 2017, the advisory fee rate (net of waiver/rebate) was equivalent to an annual effective rate of 0.00% of the Fund's average daily net assets.
The Adviser has agreed to reduce its advisory fee and/or reimburse the Fund so that total annual portfolio operating expenses, excluding certain investment related expenses, taxes, interest and other extraordinary expenses (including litigation), will not exceed 1.10% for Class I shares, 1.45% for Class A shares, 2.20% for Class C shares and 1.05% for Class IS shares. The fee waivers and/or expense reimbursements will continue for at least one year from the date of the Fund's prospectus or until such time as the Directors act to discontinue all or a portion of such waivers and/or reimbursements when they deem such action is appropriate. For the year ended December 31, 2017, approximately $93,000 of advisory fees were waived and approximately $146,000 of other expenses were reimbursed by the Adviser pursuant to this arrangement.
C. Administration Fees: The Adviser also serves as Administrator to the Company and provides administrative services pursuant to an Administration Agreement for an annual fee, accrued daily and paid monthly, of 0.08% of the Fund's average daily net assets.
Under a Sub-Administration Agreement between the Administrator and State Street, State Street provides certain administrative services to the Company. For such services, the Administrator pays State Street a portion of the fee the Administrator receives from the Fund.
D. Distribution and Shareholder Services Fees: Morgan Stanley Distribution, Inc. ("MSDI" or the "Distributor"), a wholly-owned subsidiary of the Adviser and an indirect subsidiary of Morgan Stanley, serves as the Company's Distributor of Fund shares pursuant to a Distribution Agreement. The Company has adopted a Shareholder Services Plan with respect to Class A shares pursuant to Rule 12b-1 under the Act. Under the Shareholder Services Plan, the Fund pays the Distributor a shareholder services fee, accrued daily and paid monthly, at an annual rate of 0.25% of the Fund's average daily net assets attributable to Class A shares.
The Company has adopted a Distribution and Shareholder Services Plan with respect to Class C shares pursuant to Rule 12b-1 under the Act. Under the Distribution and Shareholder Services Plan, the Fund pays the Distributor a distribution fee, accrued daily and paid monthly, at an annual rate of 0.75% and a shareholder services fee, accrued daily and paid monthly, at an annual rate of 0.25% of the Fund's average daily net assets attributable to Class C shares.
The distribution and shareholder services fees are used to support the expenses associated with servicing and maintaining accounts. The Distributor may compensate other parties for providing shareholder support services to investors who purchase Class A and Class C shares.
E. Dividend Disbursing and Transfer Agent: The Company's dividend disbursing and transfer agent is Boston Financial Data Services, Inc. ("BFDS"). Pursuant to a Transfer Agency Agreement, the Company pays BFDS a fee based on the number of classes, accounts and transactions relating to the Funds of the Company. Effective January 1, 2018, BFDS changed its name to DST Asset Manager Solutions, Inc.
F. Custodian Fees: State Street (the "Custodian") also serves as Custodian for the Company in accordance with a Custodian Agreement. The Custodian holds cash, securities, and other assets of the Company as required by the Act. Custody fees are payable monthly based on assets held in custody, investment purchases and sales activity and account maintenance fees, plus reimbursement for certain out-of-pocket expenses.
G. Security Transactions and Transactions with Affiliates: For the year ended December 31, 2017, purchases and sales of investment securities for the Fund, other than long-term U.S. Government securities and short-term investments, were approximately $11,223,000 and $5,188,000, respectively. There were no purchases and sales of long-term U.S. Government securities for the year ended December 31, 2017.
The Fund invests in the Institutional Class of the Morgan Stanley Institutional Liquidity Funds — Treasury Securities Portfolio (the "Liquidity Funds"), an open-end management investment company managed by the Adviser, both directly and as a portion of securities held as collateral on loaned securities. Advisory fees paid by the Fund are reduced by an amount equal to its pro-rata share of the advisory and administration fees paid by the Fund due to its investment in the
24
Morgan Stanley Institutional Fund, Inc.
Annual Report — December 31, 2017
Notes to Financial Statements (cont'd)
Liquidity Funds. For the year ended December 31, 2017, advisory fees paid were reduced by approximately $2,000 relating to the Fund's investment in the Liquidity Funds.
A summary of the Fund's transactions in shares of the Liquidity Funds during the year ended December 31, 2017 is as follows:
Affiliated
Investment
Company | | Value
December 31,
2016
(000) | | Purchases
at Cost
(000) | | Proceeds
from Sales
(000) | | Dividend
Income
(000) | |
Liquidity Funds | | $ | 381 | | | $ | 8,957 | | | $ | 7,391 | | | $ | 7 | | |
Affiliated
Investment
Company (cont'd) | | Realized
Gain (Loss)
(000) | | Change in
Unrealized
Appreciation
(Depreciation)
(000) | | Value
December 31,
2017
(000) | |
Liquidity Funds | | $ | — | | | $ | — | | | $ | 1,947 | | |
The Fund is permitted to purchase and sell securities ("cross-trade") from and to other Morgan Stanley Funds as well as other funds and client accounts for which the Adviser or an affiliate of the Adviser serves as investment adviser, pursuant to procedures approved by the Directors in compliance with Rule 17a-7 under the Act (the "Rule"). Each cross-trade is executed at the current market price in compliance with provisions of the Rule. For the year ended December 31, 2017, the Fund did not engage in any cross-trade transactions.
The Fund has an unfunded Deferred Compensation Plan (the "Compensation Plan"), which allows each independent Director to defer payment of all, or a portion, of the fees he or she receives for serving on the Board of Directors. Each eligible Director generally may elect to have the deferred amounts credited with a return equal to the total return on one or more of the Morgan Stanley funds that are offered as investment options under the Compensation Plan. Appreciation/depreciation and distributions received from these investments are recorded with an offsetting increase/decrease in the deferred compensation obligation and do not affect the NAV of the Fund.
H. Federal Income Taxes: It is the Fund's intention to continue to qualify as a regulated investment company and distribute all of its taxable and tax-exempt income. Accordingly, no provision for federal income taxes is required in the financial statements.
The Fund may be subject to taxes imposed by countries in which it invests. Such taxes are generally based on income and/or capital gains earned or repatriated. Taxes are accrued based on net investment income, net realized gains and net unrealized appreciation as such income and/or gains are earned. Taxes may also be based on transactions in foreign currency
and are accrued based on the value of investments denominated in such currency.
FASB ASC 740-10, "Income Taxes — Overall", sets forth a minimum threshold for financial statement recognition of the benefit of a tax position taken or expected to be taken in a tax return. Management has concluded there are no significant uncertain tax positions that would require recognition in the financial statements. If applicable, the Fund recognizes interest accrued related to unrecognized tax benefits in "Interest Expense" and penalties in "Other Expenses" in the Statement of Operations. The Fund files tax returns with the U.S. Internal Revenue Service, New York and various states. Generally, each of the tax years in the three-year period ended December 31, 2017, remains subject to examination by taxing authorities.
The tax character of distributions paid may differ from the character of distributions shown in the Statements of Changes in Net Assets due to short-term capital gains being treated as ordinary income for tax purposes. The tax character of distributions paid during fiscal years 2017 and 2016 was as follows:
2017
Distributions
Paid From: | | 2016
Distributions
Paid From: | |
Ordinary
Income
(000) | | Long-Term
Capital Gain
(000) | | Ordinary
Income
(000) | | Long-Term
Capital Gain
(000) | | Paid-in-
Capital
(000) | |
| $ | 195 | | | $ | 19 | | | $ | 48 | | | $ | — | | | $ | 80 | | |
The amount and character of income and gains to be distributed are determined in accordance with income tax regulations which may differ from GAAP. These book/tax differences are either considered temporary or permanent in nature.
Temporary differences are primarily due to differing book and tax treatments for the timing of the recognition of gains (losses) on certain investment transactions and the timing of the deductibility of certain expenses.
Permanent differences, primarily due to differing treatments of gains (losses) related to foreign currency transactions, a dividend redesignation and a net operating loss, resulted in the following reclassifications among the components of net assets at December 31, 2017:
Accumulated
Net Investment
Loss
(000) | | Accumulated
Undistributed
Net Realized
Gain
(000) | | Paid-in-
Capital
(000) | |
| $ | 48 | | | $ | (48 | ) | | $ | — | | |
25
Morgan Stanley Institutional Fund, Inc.
Annual Report — December 31, 2017
Notes to Financial Statements (cont'd)
At December 31, 2017, the components of distributable earnings for the Fund on a tax basis were as follows:
Undistributed
Ordinary
Income
(000) | | Undistributed
Long-Term
Capital Gain
(000) | |
| $ | 257 | | | $ | — | | |
During the year ended December 31, 2017, the Fund utilized capital loss carryforwards for U.S. federal income tax purposes of approximately $52,000.
I. Credit Facility: The Company and other Morgan Stanley funds participated in a $150,000,000 committed, unsecured revolving line of credit facility (the "Facility") with State Street. This Facility is to be used for temporary emergency purposes or funding of shareholder redemption requests. The interest rate on borrowings is based on the federal funds rate or 1 month LIBOR rate plus a spread. The Facility also has a commitment fee of 0.25% per annum based on the unused portion of the Facility. During the year ended December 31, 2017, the Fund did not have any borrowings under the Facility.
J. Other: At December 31, 2017, the Fund had record owners of 10% or greater. Investment activities of these shareholders could have a material impact on the Fund. The aggregate percentage of such owners was 33.4%.
26
Morgan Stanley Institutional Fund, Inc.
Annual Report — December 31, 2017
Report of Independent Registered Public Accounting Firm
To the Shareholders and Board of Directors of
Morgan Stanley Institutional Fund, Inc. —
Asia Opportunity Portfolio
Opinion on the Financial Statements
We have audited the accompanying statement of assets and liabilities of Asia Opportunity Portfolio (the "Fund") (one of the funds constituting the Morgan Stanley Institutional Fund, Inc. (the "Company")), including the portfolio of investments, as of December 31, 2017, and the related statement of operations for the year then ended, the statements of changes in net assets for each of the two years in the period then ended, the financial highlights for each of the two years in the period then ended and the period from December 29, 2015 (commencement of operations) through December 31, 2015 and the related notes (collectively referred to as the "financial statements"). In our opinion, the financial statements present fairly, in all material respects, the financial position of Asia Opportunity Portfolio (one of the funds constituting Morgan Stanley Institutional Fund, Inc.) at December 31, 2017, the results of its operations for the year then ended, the changes in its net assets for each of the two years in the period then ended and its financial highlights for each of the two years in the period then ended and the period from December 29, 2015 (commencement of operations) through December 31, 2015, in conformity with U.S. generally accepted accounting principles.
Basis for Opinion
These financial statements are the responsibility of the Company's management. Our responsibility is to express an opinion on the Fund's financial statements based on our audits. We are a public accounting firm registered with the Public Company Accounting Oversight Board (United States) ("PCAOB") and are required to be independent with respect to the Company in accordance with the U.S. federal securities law and the applicable rules and regulations of the Securities and Exchange Commission and the PCAOB.
We conducted our audits in accordance with the standards of the PCAOB. Those standards require that we plan and perform the audit to obtain reasonable assurance about whether the financial statements are free of material misstatement, whether due to error or fraud. The Company is not required to have, nor were we engaged to perform, an audit of the Company's internal control over financial reporting. As part of our audits, we are required to obtain an understanding of internal control over financial reporting, but not for the purpose of expressing an opinion on the effectiveness of the Company's internal control over financial reporting. Accordingly, we express no such opinion.
Our audits included performing procedures to assess the risks of material misstatement of the financial statements, whether due to error or fraud, and performing procedures that respond to those risks. Such procedures included examining, on a test basis, evidence regarding the amounts and disclosures in the financial statements. Our procedures included confirmation of securities owned as of December 31, 2017 by correspondence with the custodian and others or by other appropriate auditing procedures where replies from others were not received. Our audits also included evaluating the accounting principles used and significant estimates made by management, as well as evaluating the overall presentation of the financial statements. We believe that our audits provide a reasonable basis for our opinion.

We have served as the auditor of one or more Morgan Stanley investment companies since 2000.
Boston, Massachusetts
February 26, 2018
27
Morgan Stanley Institutional Fund, Inc.
Annual Report — December 31, 2017
Federal Tax Notice (unaudited)
For federal income tax purposes, the following information is furnished with respect to the distributions paid by the Fund during its taxable year ended December 31, 2017.
The Fund designated and paid approximately $19,000 as a long-term capital gain distribution.
For federal income tax purposes, the following information is furnished with respect to the Fund's earnings for its taxable year ended December 31, 2017. When distributed, certain earnings may be subject to a maximum tax rate of 15% as provided for by the Jobs and Growth Tax Relief Reconciliation Act of 2003. The Fund designated up to a maximum of approximately $48,000 as taxable at this lower rate.
The Fund intends to pass through foreign tax credits of approximately $5,000 and has derived net income from sources within foreign countries amounting to approximately $85,000.
In January, the Fund provides tax information to shareholders for the preceding calendar year.
28
Morgan Stanley Institutional Fund, Inc.
Annual Report — December 31, 2017
Privacy Notice (unaudited)
MORGAN STANLEY INVESTMENT MANAGEMENT INC.
AN IMPORTANT NOTICE CONCERNING OUR U.S. PRIVACY POLICY
We are required by federal law to provide you with a copy of our privacy policy annually. This policy applies to current and former individual investors in funds managed or sponsored by Morgan Stanley Investment Management Inc. ("MSIM") as well as current and former individual clients of MSIM. This policy is not applicable to partnerships, corporations, trusts or other non-individual clients or investors. Please note that we may amend this policy at any time, and will inform you of any changes as required by law.
WE RESPECT YOUR PRIVACY
We appreciate that you have provided us with your personal financial information. We strive to maintain the privacy of such information while we help you achieve your financial objectives. This Notice describes what non-public personal information we collect about you, why we collect it, when we may share it with others and how certain others may use it. It discusses the steps you may take to limit our sharing of certain information about you to affiliated companies in the Morgan Stanley family of companies ("other Morgan Stanley companies"). It also discloses how you may limit use of certain shared information for marketing purposes by other Morgan Stanley branded companies. Throughout this policy, we refer to the non-public information that personally identifies you or your accounts as "personal information."
1. WHAT PERSONAL INFORMATION DO WE COLLECT ABOUT YOU?
We obtain personal information from applications and other forms you submit to us, from your dealings with us, from consumer reporting agencies, from our Web sites and from third parties and other sources.
For example:
• We may collect information such as your name, address, e-mail address, telephone/fax numbers, assets, income and investment objectives through subscription documents, applications and other forms you submit to us.
• We may obtain information about account balances, your use of account(s) and the types of products and services you prefer to receive from us through your dealings and transactions with us and other sources.
• We may obtain information about your creditworthiness and credit history from consumer reporting agencies.
• We may collect background information from and through third-party vendors to verify representations you have made and to comply with various regulatory requirements.
• If you interact with us through our public and private Web sites, we may collect information that you provide directly through online communications (such as an e-mail address). We may also collect information about your Internet service provider, your domain name, your computer's operating system and Web browser, your use of our Web sites and your product and service preferences, through the use of "cookies." Please consult the Terms of Use of these sites for more details.
2. WHEN DO WE DISCLOSE PERSONAL INFORMATION WE COLLECT ABOUT YOU?
We may disclose personal information we collect about you to other Morgan Stanley companies and to non-affiliated third parties.
a. Information We Disclose to Other Morgan Stanley Companies.
We may disclose personal information to other Morgan Stanley companies for a variety of reasons, including to manage your account(s) effectively, to service and process your transactions, to let you know about products and services offered by us and other Morgan Stanley companies, to manage our business, and as otherwise required or permitted by law. Offers for products and services from other Morgan Stanley companies are developed under conditions designed to safeguard your personal information.
29
Morgan Stanley Institutional Fund, Inc.
Annual Report — December 31, 2017
Privacy Notice (unaudited) (cont'd)
b. Information We Disclose to Non-affiliated Third Parties.
We do not disclose personal information that we collect about you to non-affiliated third parties except to those who provide marketing services on our behalf, to financial institutions with whom we have joint marketing agreements, and as otherwise required or permitted by law. For example, we may disclose personal information to non-affiliated third parties for servicing and processing transactions, to offer our own products and services, to protect against fraud, for institutional risk control, to respond to judicial process or to perform services on our behalf. When we share personal information with a non-affiliated third party, they are required to limit their use of personal information to the particular purpose for which it was shared and they are not allowed to share personal information with others except to fulfill that limited purpose or as may be permitted or required by law.
3. HOW DO WE PROTECT THE SECURITY AND CONFIDENTIALITY OF PERSONAL INFORMATION WE COLLECT ABOUT YOU?
We maintain physical, electronic and procedural security measures to help safeguard the personal information we collect about you. We have internal policies governing the proper handling of client information. Third parties that provide support or marketing services on our behalf may also receive personal information, and we require them to adhere to confidentiality standards with respect to such information.
4. HOW CAN YOU LIMIT THE SHARING OF CERTAIN TYPES OF PERSONAL INFORMATION WITH OTHER MORGAN STANLEY COMPANIES?
We offer you choices as to whether we share with other Morgan Stanley companies the personal information that was collected to determine your eligibility for products and services you request ("eligibility information"). Eligibility information does not include your identification information or personal information pertaining to our transactions or experiences with you. Please note that, even if you direct us not to share eligibility information with other Morgan Stanley companies ("opt-out"), we may still share personal information, including eligibility information, with those companies in circumstances excluded from the opt-out under applicable law, such as to process transactions or to service your account.
5. HOW CAN YOU LIMIT THE USE OF CERTAIN TYPES OF PERSONAL INFORMATION BY OTHER MORGAN STANLEY COMPANIES FOR MARKETING?
By following the opt-out instructions in Section 6 below, you may limit other Morgan Stanley branded companies from marketing their products or services to you based on personal information we disclose to them. This information may include, for example, your income and account history with us. Please note that, even if you choose to limit Other Morgan Stanley Companies from using personal information about you that we may share with them for marketing their products and services to you, Other Morgan Stanley Companies may use your personal information that they obtain from us to market to you in circumstances permitted by law, such as if the Other Morgan Stanley Company has its own relationship with you.
6. HOW CAN YOU SEND US AN OPT-OUT INSTRUCTION?
If you wish to limit our sharing of eligibility information about you with other Morgan Stanley companies or other Morgan Stanley companies' use of personal information for marketing purposes, as described in this notice, you may do so by:
• Calling us at (800) 548-7786
Monday–Friday between 8a.m. and 6p.m.(EST)
• Writing to us at the following address:
DST Asset Manager Solutions, Inc.
c/o Privacy Coordinator
P.O. Box 219804
Kansas City, Missouri 64121
30
Morgan Stanley Institutional Fund, Inc.
Annual Report — December 31, 2017
Privacy Notice (unaudited) (cont'd)
Your written request should include your name, address, telephone number and account number(s) to which the opt-out applies and whether you are opting out with respect to sharing of eligibility information (Section 4 above), or if information used for Marketing (Section 5 above) or both. Written opt-out requests should not be sent with any other correspondence. In order to process your request, we require that the request be provided by you directly and not through a third party.
Your opt-out preference will remain in effect with respect to this policy (as it may be amended) until you notify us otherwise. If you have a joint account, your direction for us not to share this information with other Morgan Stanley companies and for those other Morgan Stanley companies not to use your personal information for marketing will be applied to all account holders on that account. Please understand that if you limit our sharing or our affiliated companies' use of personal information, you and any joint account holder(s) may not receive information about Morgan Stanley products and services, including products or services that could help you manage your financial resources and achieve your investment objectives.
7. WHAT IF AN AFFILIATED COMPANY BECOMES A NON-AFFILIATED THIRD PARTY?
If, at any time in the future, an affiliated company becomes a non-affiliated third party, further disclosures of personal information made to the former affiliated company will be limited to those described in Section 2(b) above relating to non-affiliated third parties. If you elected under Section 6 to limit disclosures we make to affiliated companies, or use of personal information by affiliated companies, your election will not apply to use by any former affiliated company of your personal information in their possession once it becomes a non-affiliated third party.
SPECIAL NOTICE TO RESIDENTS OF VERMONT
The following section supplements our policy with respect to our individual clients who have a Vermont address and supersedes anything to the contrary in the above policy with respect to those clients only.
The state of Vermont requires financial institutions to obtain your consent prior to sharing personal information that they collect about you with affiliated companies and non-affiliated third parties other than in certain limited circumstances. Except as permitted by law, we will not share personal information we collect about you with non-affiliated third parties or other Morgan Stanley companies unless you provide us with your written consent to share such information ("opt-in").
If you wish to receive offers for investment products and services offered by or through other Morgan Stanley companies, please notify us in writing at the following address:
DST Asset Manager Solutions, Inc.
c/o Privacy Coordinator
P.O. Box 219804
Kansas City, Missouri 64121
Your authorization should include your name, address, telephone number and account number(s) to which the opt-in applies and should not be sent with any other correspondence. In order to process your authorization, we require that the authorization be provided by you directly and not through a third party.
SPECIAL NOTICE TO RESIDENTS OF CALIFORNIA
The following section supplements our policy with respect to our individual clients who have a California address and supersedes anything to the contrary in the above policy with respect to those clients only.
In response to a California law, if your account has a California home address, your personal information will not be disclosed to non-affiliated third parties except as permitted by applicable California law, and we will limit sharing such information with our affiliates to comply with California privacy laws that apply to us.
31
Morgan Stanley Institutional Fund, Inc.
Annual Report — December 31, 2017
Director and Officer Information (unaudited)
Independent Directors:
Name, Age and Address of
Independent Director | | Position(s)
Held with
Registrant | | Length of Time
Served* | | Principal Occupation(s) During Past 5 Years
and Other Relevant Professional Experience | | Number of
Portfolios in
Fund Complex
Overseen by
Independent
Director** | | Other Directorships
Held by Independent
Director*** | |
Frank L. Bowman (73)
c/o Perkins Coie LLP
Counsel to the Independent
Directors
30 Rockefeller Plaza
New York, NY 10112 | | Director | | Since
August
2006 | | President, Strategic Decisions, LLC (consulting) (since February 2009); Director or Trustee of various Morgan Stanley Funds (since August 2006); Chairperson of the Compliance and Insurance Committee (since October 2015); formerly, Chairperson of the Insurance Sub-Committee of the Compliance and Insurance Committee (2007-2015); served as President and Chief Executive Officer of the Nuclear Energy Institute (policy organization) (February 2005-November 2008); retired as Admiral, U.S. Navy after serving over 38 years on active duty including 8 years as Director of the Naval Nuclear Propulsion Program in the Department of the Navy and the U.S. Department of Energy (1996-2004); served as Chief of Naval Personnel (July 1994-September 1996) and on the Joint Staff as Director of Political Military Affairs (June 1992-July 1994); knighted as Honorary Knight Commander of the Most Excellent Order of the British Empire; awarded the Officier de l'Orde National du Mérite by the French Government; elected to the National Academy of Engineering (2009). | | | 88 | | | Director of BP p.l.c.; Director of Naval and Nuclear Technologies LLP; Director Emeritus of the Armed Services YMCA; Director of the U.S. Naval Submarine League; Member of the National Security Advisory Council of the Center for U.S. Global Engagement and a member of the CNA Military Advisory Board; Trustee of Fairhaven United Methodist Church; and Director of other various non-profit organizations. | |
Kathleen A. Dennis (64)
c/o Perkins Coie LLP
Counsel to the Independent Directors
30 Rockefeller Plaza
New York, NY 10112 | | Director | | Since
August
2006 | | President, Cedarwood Associates (mutual fund and investment management consulting) (since July 2006); Chairperson of the Liquidity and Alternatives Sub-Committee of the Investment Committee (since October 2006) and Director or Trustee of various Morgan Stanley Funds (since August 2006); formerly, Senior Managing Director of Victory Capital Management (1993-2006). | | | 89 | | | Director of various non-profit organizations. | |
Nancy C. Everett (62)
c/o Perkins Coie LLP
Counsel to the Independent Directors
30 Rockefeller Plaza
New York, NY 10112 | | Director | | Since
January
2015 | | Chief Executive Officer, Virginia Commonwealth University Investment Company (since November 2015); Owner, OBIR, LLC (institutional investment management consulting) (since June 2014); formerly, Managing Director, BlackRock Inc. (February 2011-December 2013); and Chief Executive Officer, General Motors Asset Management (a/k/a Promark Global Advisors, Inc.) (June 2005-May 2010). | | | 90 | | | Formerly, Member of Virginia Commonwealth University School of Business Foundation (2005-2016); Member of Virginia Commonwealth University Board of Visitors (2013-2015); Member of Committee on Directors for Emerging Markets Growth Fund, Inc. (2007-2010); Chairperson of Performance Equity Management, LLC (2006-2010); and Chairperson, GMAM Absolute Return Strategies Fund, LLC (2006-2010). | |
32
Morgan Stanley Institutional Fund, Inc.
Annual Report — December 31, 2017
Director and Officer Information (unaudited) (cont'd)
Independent Directors: (cont'd)
Name, Age and Address of
Independent Director | | Position(s)
Held with
Registrant | | Length of Time
Served* | | Principal Occupation(s) During Past 5 Years
and Other Relevant Professional Experience | | Number of
Portfolios in
Fund Complex
Overseen by
Independent
Director** | | Other Directorships
Held by Independent
Director*** | |
Jakki L. Haussler (60)
c/o Perkins Coie LLP
Counsel to the Independent Directors
30 Rockefeller Plaza
New York, NY 10112 | | Director | | Since
January
2015 | | Chairman and Chief Executive Officer, Opus Capital Group (since January 1996); formerly, Director, Capvest Venture Fund, LP (May 2000-December 2011); Partner, Adena Ventures, LP (July 1999-December 2010); Director, The Victory Funds (February 2005-July 2008). | | | 90 | | | Director of Cincinnati Bell Inc. and Member, Audit Committee and Compensation Committee; Director of Northern Kentucky University Foundation and Member, Investment Committee; Member of Chase College of Law Transactional Law Practice Center Board of Advisors; Director of Best Transport; Director of Chase College of Law Board of Visitors; formerly, Member, University of Cincinnati Foundation Investment Committee; Member, Miami University Board of Visitors (2008-2011); Trustee of Victory Funds (2005-2008) and Chairman, Investment Committee (2007-2008) and Member, Service Provider Committee (2005-2008). | |
Dr. Manuel H. Johnson (68)
c/o Johnson Smick
International, Inc.
220 I Street, NE — Suite 200
Washington, D.C. 20002 | | Director | | Since
July
1991 | | Senior Partner, Johnson Smick International, Inc. (consulting firm); Chairperson of the Investment Committee (since October 2006) and Director or Trustee of various Morgan Stanley Funds (since July 1991); Co-Chairman and a founder of the Group of Seven Council (G7C) (international economic commission); formerly, Chairperson of the Audit Committee (July 1991-September 2006), Vice Chairman of the Board of Governors of the Federal Reserve System and Assistant Secretary of the U.S. Treasury. | | | 88 | | | Director of NVR, Inc. (home construction). | |
Joseph J. Kearns (75)
c/o Kearns & Associates LLC
46 E Peninsula Center #385
Rolling Hills Estates, CA
90274-3712 | | Director | | Since
August
1994 | | Senior Adviser, Kearns & Associates LLC (investment consulting); Chairperson of the Audit Committee (since October 2006) and Director or Trustee of various Morgan Stanley Funds (since August 1994); formerly, Deputy Chairperson of the Audit Committee (July 2003-September 2006) and Chairperson of the Audit Committee of various Morgan Stanley Funds (since August 1994); CFO of the J. Paul Getty Trust. | | | 89 | | | Prior to August 10, 2016, Director of Electro Rent Corporation (equipment leasing); Prior to December 31, 2013, Director of The Ford Family Foundation. | |
33
Morgan Stanley Institutional Fund, Inc.
Annual Report — December 31, 2017
Director and Officer Information (unaudited) (cont'd)
Independent Directors: (cont'd)
Name, Age and Address of
Independent Director | | Position(s)
Held with
Registrant | | Length of Time
Served* | | Principal Occupation(s) During Past 5 Years
and Other Relevant Professional Experience | | Number of
Portfolios in
Fund Complex
Overseen by
Independent
Director** | | Other Directorships
Held by Independent
Director*** | |
Michael F. Klein (59)
c/o Perkins Coie LLP
Counsel to the Independent Directors
30 Rockefeller Plaza
New York, NY 10112 | | Director | | Since
August
2006 | | Managing Director, Aetos Capital, LLC (since March 2000); Co-President, Aetos Alternatives Management, LLC (since January 2004) and Co-Chief Executive Officer of Aetos Capital LLC (since August 2013); Chairperson of the Fixed Income Sub-Committee of the Investment Committee (since October 2006) and Director or Trustee of various Morgan Stanley Funds (since August 2006); formerly, Managing Director, Morgan Stanley & Co. Inc. and Morgan Stanley Dean Witter Investment Management, President, various Morgan Stanley Funds (June 1998-March 2000) and Principal, Morgan Stanley & Co. Inc. and Morgan Stanley Dean Witter Investment Management (August 1997-December 1999). | | | 88 | | | Director of certain investment funds managed or sponsored by Aetos Capital, LLC; Director of Sanitized AG and Sanitized Marketing AG (specialty chemicals). | |
Patricia Maleski (57)
c/o Perkins Coie LLP
Counsel to the Independent Directors
30 Rockefeller Plaza
New York, NY 10112 | | Director | | Since
January
2017 | | Managing Director, JPMorgan Asset Management (2004-2016); Oversight and Control Head of Fiduciary and Conflicts of Interest Program (2015-2016); Chief Control Officer-Global Asset Management (2013-2015); President, JPMorgan Funds (2010-2013); Chief Administrative Officer (2004-2013); various other positions including Treasurer and Board Liaison (since 2001). | | | 90 | | | None. | |
Michael E. Nugent (81)
522 Fifth Avenue
New York, NY 10036 | | Chair of the Board and Director | | Chair of the Boards since July 2006 and Director since July 1991 | | Chair of the Boards of various Morgan Stanley Funds (since July 2006); Chairperson of the Closed-End Fund Committee (since June 2012) and Director or Trustee of various Morgan Stanley Funds (since July 1991); formerly, Chairperson of the Insurance Committee (until July 2006); General Partner, Triumph Capital, L.P. (private investment partnership) (1988-2013). | | | 88 | | | None. | |
W. Allen Reed (70)
c/o Perkins Coie LLP
Counsel to the Independent Directors
30 Rockefeller Plaza
New York, NY 10112 | | Director | | Since
August
2006 | | Chairperson of the Equity Sub-Committee of the Investment Committee (since October 2006) and Director or Trustee of various Morgan Stanley Funds (since August 2006); formerly, President and CEO of General Motors Asset Management; Chairman and Chief Executive Officer of the GM Trust Bank and Corporate Vice President of General Motors Corporation (August 1994-December 2005). | | | 89 | | | Director of Legg Mason, Inc.; formerly, Director of the Auburn University Foundation (2010-2015). | |
Fergus Reid (85)
c/o Joe Pietryka, Inc.
85 Charles Colman Blvd.
Pawling, NY 12564 | | Director | | Since
June
1992 | | Chairman, Joe Pietryka, Inc.; Chairperson of the Governance Committee and Director or Trustee of various Morgan Stanley Funds (since June 1992). | | | 89 | | | Formerly, Trustee and Director of certain investment companies in the JP Morgan Fund Complex managed by JP Morgan Investment Management Inc. (1987-2012). | |
* This is the earliest date the Director began serving the Morgan Stanley Funds. Each Director serves an indefinite term, until his or her successor is elected.
** The Fund Complex includes (as of December 31, 2017) all open-end and closed-end funds (including all of their portfolios) advised by Morgan Stanley Investment Management Inc. (the "Adviser") and any funds that have an adviser that is an affiliated person of the Adviser (including, but not limited to, Morgan Stanley AIP GP LP).
*** This includes any directorships at public companies and registered investment companies held by the Director at any time during the past five years.
34
Morgan Stanley Institutional Fund, Inc.
Annual Report — December 31, 2017
Director and Officer Information (unaudited) (cont'd)
Executive Officers:
Name, Age and Address of Executive Officer | | Position(s) Held
with
Registrant | | Length of Time
Served* | | Principal Occupation(s) During Past 5 Years | |
John H. Gernon (54)
522 Fifth Avenue
New York, NY 10036 | | President and Principal Executive Officer | | Since
September
2013 | | President and Principal Executive Officer of the Equity and Fixed Income Funds and the Morgan Stanley AIP Funds (since September 2013) and the Liquidity Funds and various money market funds (since May 2014) in the Fund Complex; Managing Director of the Adviser; Head of Product (since 2006). | |
Timothy J. Knierim (58)
522 Fifth Avenue
New York, NY 10036 | | Chief Compliance Officer | | Since
December
2016 | | Managing Director of the Adviser and various entities affiliated with the Adviser; Chief Compliance Officer of various Morgan Stanley Funds and the Adviser (since December 2016) and Chief Compliance Officer of Morgan Stanley AIP GP LP (since 2014). Formerly, Managing Director and Deputy Chief Compliance Officer of the Adviser (2014-2016); and formerly, Chief Compliance Officer of Prudential Investment Management, Inc. (2007-2014). | |
Francis J. Smith (52)
522 Fifth Avenue
New York, NY 10036 | | Treasurer and Principal Financial Officer | | Treasurer since July 2003 and Principal Financial Officer since September 2002 | | Managing Director of the Adviser and various entities affiliated with the Adviser; Treasurer (since July 2003) and Principal Financial Officer of various Morgan Stanley Funds (since September 2002). | |
Mary E. Mullin (50)
522 Fifth Avenue
New York, NY 10036 | | Secretary | | Since
June
1999 | | Managing Director of the Adviser; Secretary of various Morgan Stanley Funds (since June 1999). | |
Michael J. Key (38)
522 Fifth Avenue
New York, NY 10036 | | Vice President | | Since
June
2017 | | Vice President of the Equity and Fixed Income Funds, Liquidity Funds, various money market funds and the Morgan Stanley AIP Funds in the Fund Complex (since June 2017); Executive Director of the Adviser; Head of Product Development for Equity and Fixed Income Funds (since August 2013). | |
* This is the earliest date the officer began serving the Morgan Stanley Funds. Each officer serves a one-year term, until his or her successor is elected and qualifies.
35
Morgan Stanley Institutional Fund, Inc.
Annual Report — December 31, 2017
Adviser and Administrator
Morgan Stanley Investment Management Inc.
522 Fifth Avenue
New York, New York 10036
Distributor
Morgan Stanley Distribution, Inc.
522 Fifth Avenue
New York, New York 10036
Dividend Disbursing and Transfer Agent
DST Asset Manager Solutions, Inc.
2000 Crown Colony Drive
Quincy, Massachusetts 02169
Custodian
State Street Bank and Trust Company
One Lincoln Street
Boston, Massachusetts 02111
Legal Counsel
Dechert LLP
1095 Avenue of the Americas
New York, New York 10036
Counsel to the Independent Directors
Perkins Coie LLP
30 Rockefeller Plaza
New York, New York 10112
Independent Registered Public Accounting Firm
Ernst & Young LLP
200 Clarendon Street
Boston, Massachusetts 02116
Reporting to Shareholders
Each Morgan Stanley Fund provides a complete schedule of portfolio holdings in its semi-annual and annual reports within 60 days of the end of the fund's second and fourth fiscal quarters. The semi-annual and annual reports are filed electronically with the Securities and Exchange Commission (SEC) on Form N-CSRS and Form N-CSR, respectively. Morgan Stanley also delivers the semi-annual and annual reports to fund shareholders and makes these reports available on its public website, www.morganstanley.com/im. Each Morgan Stanley fund also files a complete schedule of portfolio holdings with the SEC for the fund's first and third fiscal quarters on Form N-Q. Morgan Stanley does not deliver the reports for the first and third fiscal quarters to shareholders, nor are the reports posted to the Morgan Stanley public website. You may, however, obtain the Form N-Q filings (as well as the Form N-CSR and N-CSRS filings) by accessing the SEC's website, www.sec.gov. You may also review and copy them at the SEC's Public Reference Room in Washington, DC. Information on the operation of the SEC's Public Reference Room may be obtained by calling the SEC toll free at 1 (800) SEC-0330. You can also request copies of these materials, upon payment of a duplicating fee, by electronic request at the SEC's email address (publicinfo@sec.gov) or by writing to the SEC's Public Reference Section, Washington, D.C. 20549-1520.
Proxy Voting Policies and Procedures and Proxy Voting Record
You may obtain a copy of the Company's Proxy Voting Policy and Procedures and information regarding how the Company voted proxies relating to portfolio securities during the most recent twelve-month period ended June 30, without charge, upon request, by calling toll free 1 (800) 548-7786 or by visiting our website at www.morganstanley.com/im. This information is also available on the SEC's website at www.sec.gov.
This report is authorized for distribution only when preceded or accompanied by a prospectus or summary prospectus of the applicable Fund of Morgan Stanley Institutional Fund, Inc., which describes in detail the Fund's investment policies, risks, fees and expenses. Please read the prospectus carefully before you invest or send money. For additional information, including information regarding the investments comprising the Fund, please visit our website at www.morganstanley.com/im or call toll free 1 (800) 548-7786.
36
Printed in U.S.A.
This Report has been prepared for shareholders and may be distributed to others only if preceded or accompanied by a current prospectus.
Morgan Stanley Investment Management Inc.
522 Fifth Avenue
New York, New York 10036
© 2018 Morgan Stanley. Morgan Stanley Distribution, Inc.

IFIASOPPANN
2008027 EXP. 02.28.19

Morgan Stanley Institutional Fund, Inc.
Emerging Markets Breakout Nations Portfolio
Annual Report
December 31, 2017

Morgan Stanley Institutional Fund, Inc.
Annual Report — December 31, 2017
Shareholders' Letter | | | 2 | | |
Expense Example | | | 3 | | |
Investment Overview | | | 4 | | |
Portfolio of Investments | | | 7 | | |
Statement of Assets and Liabilities | | | 9 | | |
Statement of Operations | | | 11 | | |
Statements of Changes in Net Assets | | | 12 | | |
Financial Highlights | | | 13 | | |
Notes to Financial Statements | | | 17 | | |
Report of Independent Registered Public Accounting Firm | | | 26 | | |
Federal Tax Notice | | | 27 | | |
Privacy Notice | | | 28 | | |
Director and Officer Information | | | 31 | | |
This report is authorized for distribution only when preceded or accompanied by a prospectus or summary prospectus of the applicable Fund of Morgan Stanley Institutional Fund, Inc. To receive a prospectus and/or statement of additional information (SAI), which contains more complete information such as investment objectives, charges, expenses, policies for voting proxies, risk considerations, and describes in detail each of the Fund's investment policies to the prospective investor, please call toll free 1 (800) 548-7786. Please read the prospectuses carefully before you invest or send money.
Additionally, you can access information about the Fund, including performance, characteristics, and investment team commentary, through Morgan Stanley Investment Management's website: www.morganstanley.com/im.
Market forecasts provided in this report may not necessarily come to pass. There is no guarantee that any sectors mentioned will continue to perform as discussed herein or that securities in such sectors will be held by the Fund in the future. There is no assurance that a fund will achieve its investment objective. Funds are subject to market risk, which is the possibility that market values of securities owned by the Fund will decline and, therefore, the value of the Fund's shares may be less than what you paid for them. Accordingly, you can lose money investing in this Fund. Please see the prospectus for more complete information on investment risks.
1
Morgan Stanley Institutional Fund, Inc.
Annual Report — December 31, 2017
Shareholders' Letter (unaudited)
Dear Shareholders,
We are pleased to provide this Annual report, in which you will learn how your investment in Emerging Markets Breakout Nations Portfolio (the "Fund") performed during the latest twelve-month period.
Morgan Stanley Investment Management is a client-centric, investor-led organization. Our global presence, intellectual capital, and breadth of products and services enable us to partner with investors to meet the evolving challenges of today's financial markets. We aim to deliver superior investment service and to empower our clients to make the informed decisions that help them reach their investment goals.
As always, we thank you for selecting Morgan Stanley Investment Management, and look forward to working with you in the months and years ahead.
Sincerely,

John H. Gernon
President and Principal Executive Officer
January 2018
2
Morgan Stanley Institutional Fund, Inc.
Annual Report — December 31, 2017
Expense Example (unaudited)
Emerging Markets Breakout Nations Portfolio
As a shareholder of the Fund, you incur two types of costs: (1) transactional costs, including redemption fees; and (2) ongoing costs, which may include advisory fees, administration fees, distribution and shareholder services fees and other Fund expenses. This example is intended to help you understand your ongoing costs (in dollars) of investing in the Fund and to compare these costs with the ongoing costs of investing in other mutual funds.
This example is based on an investment of $1,000 invested at the beginning of the six-month period ended December 31, 2017 and held for the entire six-month period.
Actual Expenses
The table below provides information about actual account values and actual expenses. You may use the information in this table, together with the amount you invested, to estimate the expenses that you paid over the period. Simply divide your account value by $1,000 (for example, an $8,600 account value divided by $1,000 = 8.6), then multiply the result by the number in the table under the heading entitled "Actual Expenses Paid During Period" to estimate the expenses you paid on your account during this period.
Hypothetical Example for Comparison Purposes
The table below provides information about hypothetical account values and hypothetical expenses based on the Fund's actual expense ratio and an assumed rate of return of 5% per year before expenses, which is not the Fund's actual return. The hypothetical account values and expenses may not be used to estimate the actual ending account balance or expenses you paid for the period. You may use this information to compare the ongoing costs of investing in the Fund and other funds. To do so, compare this 5% hypothetical example with the 5% hypothetical examples that appear in the shareholder reports of the other funds.
Please note that the expenses shown in the table are meant to highlight your ongoing costs only and do not reflect any transactional costs, such as sales charges (loads) and redemption fees. Therefore, the information for each class in the table is useful in comparing ongoing costs only, and will not help you determine the relative total costs of owning different funds. In addition, if these transactional costs were included, your costs would have been higher.
| | | Beginning
Account
Value
7/1/17 | | Actual Ending
Account
Value
12/31/17 | | Hypothetical
Ending Account
Value | | Actual
Expenses
Paid
During
Period* | | Hypothetical
Expenses Paid
During Period* | | Net
Expense
Ratio
During
Period** | |
Emerging Markets Breakout Nations Portfolio Class I | | $ | 1,000.00 | | | $ | 1,088.20 | | | $ | 1,019.61 | | | $ | 5.84 | | | $ | 5.65 | | | | 1.11 | % | |
Emerging Markets Breakout Nations Portfolio Class A | | | 1,000.00 | | | | 1,086.20 | | | | 1,017.49 | | | | 8.05 | | | | 7.78 | | | | 1.53 | | |
Emerging Markets Breakout Nations Portfolio Class C | | | 1,000.00 | | | | 1,081.80 | | | | 1,013.66 | | | | 12.02 | | | | 11.62 | | | | 2.29 | | |
Emerging Markets Breakout Nations Portfolio Class IS | | | 1,000.00 | | | | 1,088.50 | | | | 1,019.76 | | | | 5.69 | | | | 5.50 | | | | 1.08 | | |
* Expenses are calculated using each Fund Class' annualized net expense ratio (as disclosed), multiplied by the average account value over the period, and multiplied by 184/365 (to reflect the most recent one-half year period).
** Annualized.
3
Morgan Stanley Institutional Fund, Inc.
Annual Report — December 31, 2017
Investment Overview (unaudited)
Emerging Markets Breakout Nations Portfolio
The Fund seeks long-term capital appreciation.
Performance
For the year ended December 31, 2017, the Fund's Class I shares had a total return based on net asset value and reinvestment of distributions per share of 22.44%, net of fees. The Fund's Class I shares underperformed the Fund's benchmark, the MSCI Emerging Markets Net Index (the "Index"), which returned 37.28%.
Please keep in mind that double-digit returns are highly unusual and cannot be sustained. Investors should also be aware that these returns were primarily achieved during favorable market conditions.
Factors Affecting Performance
• Emerging markets (EM) equities outperformed developed market equities in 2017 with the Index returning 37.28% versus the MSCI World Index return of 22.40%. The strong EM equity rally in 2017 is notable for several reasons. As with the U.S. bull market in 2017, technology companies within EM have dominated the surge. On both a sector and country basis, market leadership has been narrow relative to history and it is the first time in almost two decades that EM has not been driven by commodity prices.(i) Further, volatility has been extremely low and the minor 5% drawdown in 2017 was the smallest in EM since 1993.(ii)
• Information technology (IT) companies in EM gained 61% in 2017 (as measured by the Index) and dominated returns to an extent not seen since the dot-com era of the late 1990s.(i) Real estate and consumer discretionary also outperformed the Index, up 49% and 40%, respectively. The Fund's portfolio had an average weight over the year of just 3% in technology versus the Index's weight at 26%, although we added to technology in the fourth quarter of 2017 and the weight at period end was 8%.
• China (+54%), Poland (+55%) and South Korea (+47%) were the only countries to meaningfully outperform the Index. The portfolio was underweight to both China (1.5% average weight versus the Index) and South Korea (zero weight). The largest country overweight in the portfolio was
to Poland (9% in the portfolio versus 1% index average weight).
• We have long held underweight allocations to China and Korea over concern about each country's slowing economic growth and China's massive debt build-up in its "old" and state-controlled portions of the economy and market.
• The two most significant detractors from returns were our underweight allocations to China and technology. Our stock selection in China was a significant contributor, following only stock selection in Egypt in terms of contribution. Stock selection in materials and consumer staples also hampered returns.
• Our overweight allocation to Poland, stock selection in Egypt, an overweight allocation to Argentina and zero weights in Russia and Taiwan contributed to portfolio performance. Poland remains our largest overweight allocation in the portfolio. We think that growth in Eastern Europe should remain healthy, driven by strong consumption, which has been supported by increases in both employment and real wages. We also now expect fixed investment growth to accelerate, which should bolster overall growth and improve its quality. Finally, there are now consistent signs that inflation is returning to the region, which should eventually lead to a normalization of interest rates, which remain negative in real terms throughout the region. In sum, we see the region as offering attractive investment opportunities through a combination of solid economic growth, emerging reflationary trends, attractive currencies and overlooked equity markets.
• Currency exposures, which are sometimes managed using currency forwards, contributed positively during the period.
• Stock index futures are sometimes utilized to gain market exposure and contributed positively during the period.
(i) Source: Morgan Stanley Investment Management, FactSet and Haver Analytics
(ii) Source: Morgan Stanley Investment Management, Bloomberg L.P. and FactSet
4
Morgan Stanley Institutional Fund, Inc.
Annual Report — December 31, 2017
Investment Overview (unaudited) (cont'd)
Emerging Markets Breakout Nations Portfolio
Management Strategies
• Historically, when markets become this stretched, they tend to snap back into some semblance of balance. That snap could produce the first significant corrections in many months. When it comes to pass, it could also produce a shift toward sectors and countries that have been overlooked and have underperformed, as investors were all-consumed by the tech story. The global recovery has been unusually broad, lifting every major economy out of the doldrums, and creating potential opportunity in many sectors.
• What keeps EM equities in good health as an asset class — even if they do experience a drawdown — is that for EM in aggregate, the EM current account is in surplus and the capital account is no longer negative, placing the asset class in better shape to sustain what has been a gradually rising U.S. interest rate environment. This has been a well-signaled U.S. rate hike cycle and the Federal Reserve's moves have been only 25 basis points at a time — in sharp contrast to the abrupt and larger rate hikes that occurred in the 1990s and early 2000s.
• With all this in mind, we continue to own technology companies that are growing for structural reasons; we are underweight more cyclical technology plays.
• We are constructive on those EM financials benefiting from under-penetrated credit markets and favorable interest rate environments in individual countries, and on companies benefiting from healthy domestic demand, particularly in regard to health care, travel and leisure, and select consumer discretionary and staples names.
• On a country basis, we continue to be overweight Eastern Europe, Indonesia, India, Argentina and the Philippines on their strong growth prospects, domestic demand and reform momentum. We are avoiding countries with decelerating growth or heavy dependence on exports such as Taiwan, Korea, Turkey and Russia.
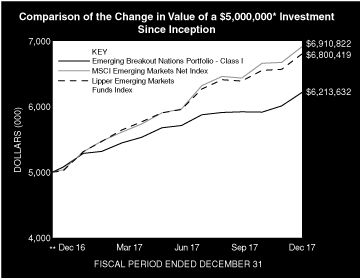
* Minimum Investment for Class I shares
** Commenced Operations on December 15, 2016.
In accordance with SEC regulations, the Fund's performance shown assumes that all recurring fees (including management fees) were deducted and all dividends and distributions were reinvested. The performance of Class A, C and IS shares will vary from the performance of Class I shares and will be impacted by additional fees assessed to those classes (if applicable).
5
Morgan Stanley Institutional Fund, Inc.
Annual Report — December 31, 2017
Investment Overview (unaudited) (cont'd)
Emerging Markets Breakout Nations Portfolio
Performance Compared to the MSCI Emerging Markets Net Index(1) and the Lipper Emerging Markets Funds Index(2)
| | | Period Ended December 31, 2017
Total Returns(3) | |
| | | | | Average Annual | |
| | | One
Year | | Five
Years | | Ten
Years | | Since
Inception(5) | |
Fund — Class I Shares
w/o sales charges(4) | | | 22.44 | % | | | — | | | | — | | | | 23.14 | % | |
Fund — Class A Shares
w/o sales charges(4) | | | 22.01 | | | | — | | | | — | | | | 22.62 | | |
Fund — Class A Shares
with maximum 5.25%
sales charges(4) | | | 15.62 | | | | — | | | | — | | | | 16.49 | | |
Fund — Class C Shares
w/o sales charges(4) | | | 21.09 | | | | — | | | | — | | | | 21.73 | | |
Fund — Class C Shares with
maximum 1.00% deferred
sales charges(4) | | | 20.09 | | | | — | | | | — | | | | 21.73 | | |
Fund — Class IS Shares
w/o sales charges(4) | | | 22.47 | | | | — | | | | — | | | | 23.18 | | |
MSCI Emerging Markets
Net Index | | | 37.28 | | | | — | | | | — | | | | 36.36 | | |
Lipper Emerging Markets
Funds Index | | | 35.56 | | | | — | | | | — | | | | 34.29 | | |
Performance data quoted represents past performance, which is no guarantee of future results, and current performance may be lower or higher than the figures shown. Performance assumes that all dividends and distributions, if any, were reinvested. For the most recent month-end performance figures, please visit www.morganstanley.com/im. Investment return and principal value will fluctuate so that Fund shares, when redeemed, may be worth more or less than their original cost. Total returns do not reflect the deduction of taxes that a shareholder would pay on Fund distributions or the redemption of Fund shares. Performance of share classes will vary due to difference in sales charges and expenses.
(1) The MSCI Emerging Markets Net Index is a free float-adjusted market capitalization weighted index that is designed to measure equity market performance of emerging markets. The term "free float" represents the portion of shares outstanding that are deemed to be available for purchase in the public equity markets by investors. The MSCI Emerging Markets Net Index currently consists of 24 emerging market country indices. The performance of the Index is listed in U.S. dollars and assumes reinvestment of net dividends. The Index is unmanaged and its returns do not include any sales charges or fees. Such costs would lower performance. It is not possible to invest directly in an index.
(2) The Lipper Emerging Markets Funds Index is an equally weighted performance index of the largest qualifying funds (based on net assets) in the Lipper Emerging Markets Funds classification. The Index, which is adjusted for capital gains distributions and income dividends, is unmanaged and should not be considered an investment. There are currently 30 funds represented in this Index. As of the date of this report, the Fund is in the Lipper Emerging Markets Funds classification.
(3) Total returns for the Fund reflect fees waived and expenses reimbursed, if applicable, by the Adviser. Without such waivers and reimbursements, total returns would have been lower.
(4) Commenced operations on December 15, 2016.
(5) For comparative purposes, average annual since inception returns listed for the Indexes refer to the inception date of the Fund, not the inception of the Index.
6
Morgan Stanley Institutional Fund, Inc.
Annual Report — December 31, 2017
Portfolio of Investments
Emerging Markets Breakout Nations Portfolio
| | | Shares | | Value
(000) | |
Common Stocks (80.1%) | |
Argentina (6.0%) | |
Banco Macro SA ADR | | | 846 | | | $ | 98 | | |
BBVA Banco Frances SA ADR | | | 1,617 | | | | 41 | | |
Grupo Financiero Galicia SA ADR | | | 1,969 | | | | 129 | | |
Loma Negra Cia Industrial Argentina SA ADR (a) | | | 1,548 | | | | 36 | | |
Telecom Argentina SA ADR | | | 1,536 | | | | 56 | | |
| | | | 360 | | |
Bangladesh (3.6%) | |
Beximco Pharmaceuticals Ltd. | | | 53,182 | | | | 66 | | |
GrameenPhone Ltd. | | | 7,559 | | | | 43 | | |
Olympic Industries Ltd. | | | 19,098 | | | | 66 | | |
Square Pharmaceuticals Ltd. | | | 10,853 | | | | 40 | | |
| | | | 215 | | |
Brazil (8.6%) | |
B3 SA — Brasil Bolsa Balcao | | | 8,364 | | | | 57 | | |
Banco Bradesco SA (Preference) | | | 10,531 | | | | 108 | | |
| BRF SA (a) | | | 4,758 | | | | 54 | | |
Itau Unibanco Holding SA (Preference) | | | 8,579 | | | | 111 | | |
Lojas Renner SA | | | 7,075 | | | | 75 | | |
Petroleo Brasileiro SA (a) | | | 9,934 | | | | 51 | | |
Petroleo Brasileiro SA (Preference) (a) | | | 11,428 | | | | 56 | | |
| | | | 512 | | |
China (9.8%) | |
AAC Technologies Holdings, Inc. (b) | | | 500 | | | | 9 | | |
Alibaba Group Holding Ltd. ADR (a) | | | 651 | | | | 112 | | |
China Mengniu Dairy Co., Ltd. (a)(b) | | | 5,000 | | | | 15 | | |
CSPC Pharmaceutical Group Ltd. (b) | | | 8,000 | | | | 16 | | |
JD.com, Inc. ADR (a) | | | 737 | | | | 31 | | |
NetEase, Inc. ADR | | | 36 | | | | 12 | | |
New Oriental Education & Technology Group, Inc. ADR | | | 185 | | | | 17 | | |
Shenzhou International Group Holdings Ltd. (b) | | | 2,000 | | | | 19 | | |
Sino Biopharmaceutical Ltd. (b) | | | 17,000 | | | | 30 | | |
Sogou, Inc. ADR (a) | | | 771 | | | | 9 | | |
TAL Education Group ADR | | | 887 | | | | 26 | | |
Tencent Holdings Ltd. (b) | | | 5,600 | | | | 290 | | |
| | | | 586 | | |
Czech Republic (3.2%) | |
Komercni Banka AS | | | 4,392 | | | | 189 | | |
Egypt (4.2%) | |
Commercial International Bank Egypt SAE GDR | | | 26,816 | | | | 117 | | |
Egyptian Financial Group-Hermes Holding Co. | | | 11,860 | | | | 16 | | |
Egyptian Financial Group-Hermes Holding Co. GDR | | | 25,030 | | | | 63 | | |
Integrated Diagnostics Holdings PLC (c) | | | 11,129 | | | | 52 | | |
| | | | 248 | | |
India (1.9%) | |
HDFC Bank Ltd. ADR | | | 279 | | | | 28 | | |
ICICI Bank Ltd. ADR | | | 8,639 | | | | 84 | | |
| | | | 112 | | |
| | | Shares | | Value
(000) | |
Indonesia (8.8%) | |
Astra International Tbk PT | | | 142,600 | | | $ | 87 | | |
Bank Mandiri Persero Tbk PT | | | 182,900 | | | | 108 | | |
Bumi Serpong Damai Tbk PT | | | 316,400 | | | | 40 | | |
Semen Indonesia Persero Tbk PT | | | 101,300 | | | | 74 | | |
Telekomunikasi Indonesia Persero Tbk PT | | | 282,800 | | | | 92 | | |
Unilever Indonesia Tbk PT | | | 21,000 | | | | 86 | | |
XL Axiata Tbk PT (a) | | | 174,400 | | | | 38 | | |
| | | | 525 | | |
Malaysia (5.1%) | |
Genting Malaysia Bhd | | | 46,740 | | | | 65 | | |
IHH Healthcare Bhd | | | 47,700 | | | | 69 | | |
Malayan Banking Bhd | | | 23,840 | | | | 57 | | |
Malaysia Airports Holdings Bhd | | | 20,600 | | | | 45 | | |
Sime Darby Bhd | | | 26,960 | | | | 15 | | |
Sime Darby Plantation Bhd (a) | | | 26,960 | | | | 40 | | |
Sime Darby Property Bhd (a) | | | 29,360 | | | | 13 | | |
| | | | 304 | | |
Mexico (4.4%) | |
Alsea SAB de CV | | | 10,557 | | | | 35 | | |
Fomento Economico Mexicano SAB de CV ADR | | | 993 | | | | 93 | | |
Grupo Financiero Banorte SAB de CV Series O | | | 24,050 | | | | 132 | | |
| | | | 260 | | |
Pakistan (0.1%) | |
Lucky Cement Ltd. | | | 400 | | | | 2 | | |
Maple Leaf Cement Factory Ltd. | | | 5,918 | | | | 4 | | |
| | | | 6 | | |
Peru (4.8%) | |
Credicorp Ltd. | | | 1,376 | | | | 285 | | |
Philippines (6.3%) | |
Ayala Corp. | | | 1,300 | | | | 27 | | |
Ayala Land, Inc. | | | 27,900 | | | | 25 | | |
Metropolitan Bank & Trust Co. | | | 85,900 | | | | 174 | | |
SM Investments Corp. | | | 7,420 | | | | 147 | | |
| | | | 373 | | |
Poland (9.8%) | |
Bank Zachodni WBK SA | | | 841 | | | | 96 | | |
CCC SA | | | 1,194 | | | | 97 | | |
Jeronimo Martins SGPS SA | | | 2,673 | | | | 52 | | |
LPP SA | | | 31 | | | | 79 | | |
Powszechna Kasa Oszczednosci Bank Polski SA (a) | | | 10,173 | | | | 129 | | |
Powszechny Zaklad Ubezpieczen SA | | | 10,752 | | | | 130 | | |
| | | | 583 | | |
United States (1.9%) | |
MercadoLibre, Inc. | | | 358 | | | | 113 | | |
Vietnam (1.6%) | |
Saigon Beer Alcohol Beverage Corp. | | | 1,510 | | | | 17 | | |
Vietjet Aviation JSC | | | 7,354 | | | | 47 | | |
Vietnam Dairy Products JSC | | | 3,610 | | | | 33 | | |
| | | | 97 | | |
Total Common Stocks (Cost $3,976) | | | 4,768 | | |
The accompanying notes are an integral part of the financial statements.
7
Morgan Stanley Institutional Fund, Inc.
Annual Report — December 31, 2017
Portfolio of Investments (cont'd)
Emerging Markets Breakout Nations Portfolio
| | | Shares | | Value
(000) | |
Participation Notes (3.3%) | |
Vietnam (3.3%) | |
Bank for Foreign Trade of Vietnam JSC,
Equity Linked Notes, expires 12/17/18 (a) | | | 23,164 | | | $ | 56 | | |
Vietnam Dairy Products JSC,
Equity Linked Notes, expires 11/20/20 (a) | | | 14,960 | | | | 137 | | |
Total Participation Notes (Cost $132) | | | 193 | | |
Investment Company (5.0%) | |
India (5.0%) | |
| iShares MSCI India ETF (Cost $265) | | | 8,204 | | | | 296 | | |
Short-Term Investment (9.9%) | |
Investment Company (9.9%) | |
Morgan Stanley Institutional Liquidity
Funds — Government Portfolio —
Institutional Class (See Note G)
(Cost $592) | | | 592,296 | | | | 592 | | |
Total Investments (98.3%) (Cost $4,965) (d)(e)(f) | | | 5,849 | | |
Other Assets in Excess of Liabilities (1.7%) | | | 104 | | |
Net Assets (100.0%) | | $ | 5,953 | | |
Country assignments and aggregations are based generally on third party vendor classifications and information, and may be different from the assignments and aggregations under the policies set forth in the Fund's prospectus and/or statement of additional information relating to geographic classifications.
(a) Non-income producing security.
(b) Security trades on the Hong Kong exchange.
(c) 144A security — Certain conditions for public sale may exist. Unless otherwise noted, these securities are deemed to be liquid.
(d) Securities are available for collateral in connection with an open foreign currency forward exchange contract and futures contracts.
(e) The approximate fair value and percentage of net assets, $3,378,000 and 56.7%, respectively, represent the securities that have been fair valued under the fair valuation policy for international investments as described in Note A-1 within the Notes to the Financial Statements.
(f) At December 31, 2017, the aggregate cost for federal income tax purposes is approximately $4,978,000. The aggregate gross unrealized appreciation is approximately $923,000 and the aggregate gross unrealized depreciation is approximately $42,000, resulting in net unrealized appreciation of approximately $881,000.
ADR American Depositary Receipt.
ETF Exchange Traded Fund.
GDR Global Depositary Receipt.
Foreign Currency Forward Exchange Contract:
The Fund had the following foreign currency forward exchange contract open at December 31, 2017:
Counterparty | | Contracts to
Deliver
(000) | | In Exchange
For
(000) | | Delivery
Date | | Unrealized
Appreciation
(000) | |
State Street Bank and Trust Co. | | $ | 424 | | | INR | 27,872 | | | 2/15/18 | | $ | 10 | | |
Futures Contract:
The Fund had the following futures contract open at December 31, 2017:
| | | Number
of
Contracts | | Expiration
Date | | Notional
Amount
(000) | | Value
(000) | | Unrealized
Depreciation
(000) | |
Long: | |
SGX NIFTY 50 (Singapore) | | | 23 | | | Jan-18 | | | — | @ | | $ | 486 | | | $ | (— | @) | |
@ — Value is less than $500.
INR — Indian Rupee
Portfolio Composition
Classification | | Percentage of
Total Investments | |
Other* | | | 36.5 | % | |
Banks | | | 33.2 | | |
Short-Term Investment | | | 10.1 | | |
Internet Software & Services | | | 9.2 | | |
Food Products | | | 5.9 | | |
Investment Company | | | 5.1 | | |
Total Investments | | | 100.0 | %** | |
* Industries and/or investment types representing less than 5% of total investments.
** Does not include an open long futures contract with an underlying face amount of approximately $486,000 with unrealized depreciation of less than $500. Does not include an open foreign currency forward exchange contract with unrealized appreciation of approximately $10,000.
The accompanying notes are an integral part of the financial statements.
8
Morgan Stanley Institutional Fund, Inc.
Annual Report — December 31, 2017
Emerging Markets Breakout Nations Portfolio
Statement of Assets and Liabilities | | December 31, 2017
(000) | |
Assets: | |
Investments in Securities of Unaffiliated Issuers, at Value (Cost $4,373) | | $ | 5,257 | | |
Investment in Security of Affiliated Issuer, at Value (Cost $592) | | | 592 | | |
Total Investments in Securities, at Value (Cost $4,965) | | | 5,849 | | |
Foreign Currency, at Value (Cost $3) | | | 3 | | |
Due from Adviser | | | 186 | | |
Receivable for Variation Margin on Futures Contract | | | 54 | | |
Unrealized Appreciation on Foreign Currency Forward Exchange Contract | | | 10 | | |
Dividends Receivable | | | 9 | | |
Receivable for Investments Sold | | | 3 | | |
Receivable from Affiliate | | | 1 | | |
Tax Reclaim Receivable | | | — | @ | |
Other Assets | | | 46 | | |
Total Assets | | | 6,161 | | |
Liabilities: | |
Payable for Custodian Fees | | | 101 | | |
Payable for Professional Fees | | | 45 | | |
Due to Affiliate | | | 34 | | |
Payable for Investments Purchased | | | 7 | | |
Deferred Capital Gain Country Tax | | | 6 | | |
Payable for Transfer Agency Fees — Class I | | | — | @ | |
Payable for Transfer Agency Fees — Class A | | | — | @ | |
Payable for Transfer Agency Fees — Class C | | | — | @ | |
Payable for Transfer Agency Fees — Class IS | | | — | @ | |
Payable for Shareholder Services Fees — Class A | | | — | @ | |
Payable for Distribution and Shareholder Services Fees — Class C | | | — | @ | |
Payable for Administration Fees | | | — | @ | |
Other Liabilities | | | 15 | | |
Total Liabilities | | | 208 | | |
Net Assets | | $ | 5,953 | | |
Net Assets Consist Of: | |
Paid-in-Capital | | $ | 5,000 | | |
Accumulated Undistributed Net Investment Income | | | 1 | | |
Accumulated Undistributed Net Realized Gain | | | 61 | | |
Unrealized Appreciation (Depreciation) on: | |
Investments (Net of $3 of Deferred Capital Gain Country Tax) | | | 881 | | |
Futures Contracts | | | (— | @) | |
Foreign Currency Forward Exchange Contracts | | | 10 | | |
Foreign Currency Translations | | | — | @ | |
Net Assets | | $ | 5,953 | | |
The accompanying notes are an integral part of the financial statements.
9
Morgan Stanley Institutional Fund, Inc.
Annual Report — December 31, 2017
Emerging Markets Breakout Nations Portfolio
Statement of Assets and Liabilities (cont'd) | | December 31, 2017
(000) | |
CLASS I: | |
Net Assets | | $ | 5,917 | | |
| Shares Outstanding $0.001 par value shares of beneficial interest (unlimited shares authorized) (not in 000's) | | | 497,000 | | |
Net Asset Value, Offering and Redemption Price Per Share | | $ | 11.91 | | |
CLASS A: | |
Net Assets | | $ | 12 | | |
| Shares Outstanding $0.001 par value shares of beneficial interest (unlimited shares authorized) (not in 000's) | | | 1,000 | | |
Net Asset Value, Redemption Price Per Share | | $ | 11.90 | | |
Maximum Sales Load | | | 5.25 | % | |
Maximum Sales Charge | | $ | 0.66 | | |
Maximum Offering Price Per Share | | $ | 12.56 | | |
CLASS C: | |
Net Assets | | $ | 12 | | |
| Shares Outstanding $0.001 par value shares of beneficial interest (unlimited shares authorized) (not in 000's) | | | 1,000 | | |
Net Asset Value, Offering and Redemption Price Per Share | | $ | 11.80 | | |
CLASS IS: | |
Net Assets | | $ | 12 | | |
| Shares Outstanding $0.001 par value shares of beneficial interest (unlimited shares authorized) (not in 000's) | | | 1,000 | | |
Net Asset Value, Offering and Redemption Price Per Share | | $ | 11.91 | | |
@ Amount is less than $500.
The accompanying notes are an integral part of the financial statements.
10
Morgan Stanley Institutional Fund, Inc.
Annual Report — December 31, 2017
Emerging Markets Breakout Nations Portfolio
Statement of Operations | | Year Ended
December 31, 2017
(000) | |
Investment Income: | |
Dividends from Securities of Unaffiliated Issuers (Net of $10 of Foreign Taxes Withheld) | | $ | 97 | | |
Dividends from Security of Affiliated Issuer (Note G) | | | 4 | | |
Total Investment Income | | | 101 | | |
Expenses: | |
Custodian Fees (Note F) | | | 143 | | |
Offering Costs | | | 143 | | |
Professional Fees | | | 136 | | |
Advisory Fees (Note B) | | | 51 | | |
Shareholder Reporting Fees | | | 16 | | |
Registration Fees | | | 16 | | |
Transfer Agency Fees — Class I (Note E) | | | 2 | | |
Transfer Agency Fees — Class A (Note E) | | | 2 | | |
Transfer Agency Fees — Class C (Note E) | | | 2 | | |
Transfer Agency Fees — Class IS (Note E) | | | 2 | | |
Administration Fees (Note C) | | | 5 | | |
Pricing Fees | | | 4 | | |
Directors' Fees and Expenses | | | 2 | | |
Shareholder Services Fees — Class A (Note D) | | | — | @ | |
Distribution and Shareholder Services Fees — Class C (Note D) | | | — | @ | |
Other Expenses | | | 19 | | |
Total Expenses | | | 543 | | |
Expenses Reimbursed by Adviser (Note B) | | | (421 | ) | |
Waiver of Advisory Fees (Note B) | | | (51 | ) | |
Reimbursement of Class Specific Expenses — Class A (Note B) | | | (2 | ) | |
Reimbursement of Class Specific Expenses — Class C (Note B) | | | (2 | ) | |
Reimbursement of Class Specific Expenses — Class IS (Note B) | | | (2 | ) | |
Rebate from Morgan Stanley Affiliate (Note G) | | | (1 | ) | |
Net Expenses | | | 64 | | |
Net Investment Income | | | 37 | | |
Realized Gain (Loss): | |
Investments Sold (Net of $5 of Capital Gain Country Tax) | | | 182 | | |
Foreign Currency Forward Exchange Contracts | | | 1 | | |
Foreign Currency Transactions | | | (10 | ) | |
Futures Contracts | | | 114 | | |
Net Realized Gain | | | 287 | | |
Change in Unrealized Appreciation (Depreciation): | |
Investments (Net of Increase in Deferred Capital Gain Country Tax of $3) | | | 805 | | |
Foreign Currency Forward Exchange Contracts | | | 10 | | |
Foreign Currency Translations | | | — | @ | |
Futures Contracts | | | (8 | ) | |
Net Change in Unrealized Appreciation (Depreciation) | | | 807 | | |
Net Realized Gain and Change in Unrealized Appreciation (Depreciation) | | | 1,094 | | |
Net Increase in Net Assets Resulting from Operations | | $ | 1,131 | | |
@ Amount is less than $500.
The accompanying notes are an integral part of the financial statements.
11
Morgan Stanley Institutional Fund, Inc.
Annual Report — December 31, 2017
Emerging Markets Breakout Nations Portfolio
Statements of Changes in Net Assets | | Year Ended
December 31, 2017
(000) | | Period from
December 15, 2016^ to
December 31, 2016
(000) | |
Increase (Decrease) in Net Assets: | |
Operations: | |
Net Investment Income | | $ | 37 | | | $ | 1 | | |
Net Realized Gain (Loss) | | | 287 | | | | (12 | ) | |
Net Change in Unrealized Appreciation (Depreciation) | | | 807 | | | | 84 | | |
Net Increase in Net Assets Resulting from Operations | | | 1,131 | | | | 73 | | |
Distributions from and/or in Excess of: | |
Class I: | |
Net Investment Income | | | (24 | ) | | | — | | |
Net Realized Gain | | | (227 | ) | | | — | | |
Class A: | |
Net Investment Income | | | (— | @) | | | — | | |
Net Realized Gain | | | (— | @) | | | — | | |
Class C: | |
Net Investment Income | | | (— | @) | | | — | | |
Net Realized Gain | | | (— | @) | | | — | | |
Class IS: | |
Net Investment Income | | | (— | @) | | | — | | |
Net Realized Gain | | | (— | @) | | | — | | |
Total Distributions | | | (251 | ) | | | — | | |
Capital Share Transactions:(1) | |
Class I: | |
Subscribed | | | — | | | | 4,970 | | |
Class A: | |
Subscribed | | | — | | | | 10 | | |
Class C: | |
Subscribed | | | — | | | | 10 | | |
Class IS: | |
Subscribed | | | — | | | | 10 | | |
Net Increase in Net Assets Resulting from Capital Share Transactions | | | — | | | | 5,000 | | |
Total Increase in Net Assets | | | 880 | | | | 5,073 | | |
Net Assets: | |
Beginning of Period | | | 5,073 | | | | — | | |
End of Period (Including Accumulated Undistributed Net Investment Income of $1 and $2) | | $ | 5,953 | | | $ | 5,073 | | |
(1) Capital Share Transactions: | |
Class I: | |
Shares Subscribed | | | — | | | | 497 | | |
Class A: | |
Shares Subscribed | | | — | | | | 1 | | |
Class C: | |
Shares Subscribed | | | — | | | | 1 | | |
Class IS: | |
Shares Subscribed | | | — | | | | 1 | | |
^ Commencement of Operations.
@ Amount is less than $500.
The accompanying notes are an integral part of the financial statements.
12
Morgan Stanley Institutional Fund, Inc.
Annual Report — December 31, 2017
Financial Highlights
Emerging Markets Breakout Nations Portfolio
| | | Class I | |
Selected Per Share Data and Ratios | | Year Ended
December 31, 2017 | | Period from
December 15, 2016(1) to
December 31, 2016 | |
Net Asset Value, Beginning of Period | | $ | 10.15 | | | $ | 10.00 | | |
Income from Investment Operations: | |
Net Investment Income(2) | | | 0.08 | | | | 0.00 | (3) | |
Net Realized and Unrealized Gain | | | 2.19 | | | | 0.15 | | |
Total from Investment Operations | | | 2.27 | | | | 0.15 | | |
Distributions from and/or in Excess of: | |
Net Investment Income | | | (0.05 | ) | | | — | | |
Net Realized Gain | | | (0.46 | ) | | | — | | |
Total Distributions | | | (0.51 | ) | | | — | | |
Net Asset Value, End of Period | | $ | 11.91 | | | $ | 10.15 | | |
Total Return(4) | | | 22.44 | % | | | 1.50 | %(6) | |
Ratios and Supplemental Data: | |
Net Assets, End of Period (Thousands) | | $ | 5,917 | | | $ | 5,043 | | |
Ratio of Expenses to Average Net Assets(8) | | | 1.11 | %(5) | | | 1.09 | %(5)(7) | |
Ratio of Net Investment Income to Average Net Assets(8) | | | 0.66 | %(5) | | | 0.67 | %(5)(7) | |
Ratio of Rebate from Morgan Stanley Affiliates to Average Net Assets | | | 0.02 | % | | | 0.04 | %(7) | |
Portfolio Turnover Rate | | | 79 | % | | | 16 | %(6) | |
(8) Supplemental Information on the Ratios to Average Net Assets: | |
Ratios Before Expense Limitation: | |
Expenses to Average Net Assets | | | 9.42 | % | | | 22.93 | %(7) | |
Net Investment Loss to Average Net Assets | | | (7.65 | )% | | | (21.17 | )%(7) | |
(1) Commencement of Operations.
(2) Per share amount is based on average shares outstanding.
(3) Amount is less than $0.005 per share.
(4) Calculated based on the net asset value as of the last business day of the period.
(5) The Ratios of Expenses and Net Investment Income reflect the rebate of certain Fund expenses in connection with the investments in Morgan Stanley affiliates during the period. The effect of the rebate on the ratios is disclosed in the above table as "Ratio of Rebate from Morgan Stanley Affiliates to Average Net Assets."
(6) Not annualized.
(7) Annualized.
The accompanying notes are an integral part of the financial statements.
13
Morgan Stanley Institutional Fund, Inc.
Annual Report — December 31, 2017
Financial Highlights
Emerging Markets Breakout Nations Portfolio
| | | Class A | |
Selected Per Share Data and Ratios | | Year Ended
December 31, 2017 | | Period from
December 15, 2016(1) to
December 31, 2016 | |
Net Asset Value, Beginning of Period | | $ | 10.14 | | | $ | 10.00 | | |
Income from Investment Operations: | |
Net Investment Income(2) | | | 0.03 | | | | 0.00 | (3) | |
Net Realized and Unrealized Gain | | | 2.20 | | | | 0.14 | | |
Total from Investment Operations | | | 2.23 | | | | 0.14 | | |
Distributions from and/or in Excess of: | |
Net Investment Income | | | (0.01 | ) | | | — | | |
Net Realized Gain | | | (0.46 | ) | | | — | | |
Total Distributions | | | (0.47 | ) | | | — | | |
Net Asset Value, End of Period | | $ | 11.90 | | | $ | 10.14 | | |
Total Return(4) | | | 22.01 | % | | | 1.40 | %(6) | |
Ratios and Supplemental Data: | |
Net Assets, End of Period (Thousands) | | $ | 12 | | | $ | 10 | | |
Ratio of Expenses to Average Net Assets(8) | | | 1.53 | %(5) | | | 1.51 | %(5)(7) | |
Ratio of Net Investment Income to Average Net Assets(8) | | | 0.25 | %(5) | | | 0.24 | %(5)(7) | |
Ratio of Rebate from Morgan Stanley Affiliates to Average Net Assets | | | 0.02 | % | | | 0.04 | %(7) | |
Portfolio Turnover Rate | | | 79 | % | | | 16 | %(6) | |
(8) Supplemental Information on the Ratios to Average Net Assets: | |
Ratios Before Expense Limitation: | |
Expenses to Average Net Assets | | | 27.13 | % | | | 37.02 | %(7) | |
Net Investment Loss to Average Net Assets | | | (25.35 | )% | | | (35.27 | )%(7) | |
(1) Commencement of Operations.
(2) Per share amount is based on average shares outstanding.
(3) Amount is less than $0.005 per share.
(4) Calculated based on the net asset value which does not reflect sales charges, if applicable, as of the last business day of the period.
(5) The Ratios of Expenses and Net Investment Income reflect the rebate of certain Fund expenses in connection with the investments in Morgan Stanley affiliates during the period. The effect of the rebate on the ratios is disclosed in the above table as "Ratio of Rebate from Morgan Stanley Affiliates to Average Net Assets."
(6) Not annualized.
(7) Annualized.
The accompanying notes are an integral part of the financial statements.
14
Morgan Stanley Institutional Fund, Inc.
Annual Report — December 31, 2017
Financial Highlights
Emerging Markets Breakout Nations Portfolio
| | | Class C | |
Selected Per Share Data and Ratios | | Year Ended
December 31, 2017 | | Period from
December 15, 2016(1) to
December 31, 2016 | |
Net Asset Value, Beginning of Period | | $ | 10.14 | | | $ | 10.00 | | |
Income (Loss) from Investment Operations: | |
Net Investment Loss(2) | | | (0.06 | ) | | | (0.00 | )(3) | |
Net Realized and Unrealized Gain | | | 2.18 | | | | 0.14 | | |
Total from Investment Operations | | | 2.12 | | | | 0.14 | | |
Distributions from and/or in Excess of: | |
Net Investment Income | | | (0.00 | )(3) | | | — | | |
Net Realized Gain | | | (0.46 | ) | | | — | | |
Total Distributions | | | (0.46 | ) | | | — | | |
Net Asset Value, End of Period | | $ | 11.80 | | | $ | 10.14 | | |
Total Return(4) | | | 21.09 | % | | | 1.40 | %(6) | |
Ratios and Supplemental Data: | |
Net Assets, End of Period (Thousands) | | $ | 12 | | | $ | 10 | | |
Ratio of Expenses to Average Net Assets(8) | | | 2.28 | %(5) | | | 2.26 | %(5)(7) | |
Ratio of Net Investment Loss to Average Net Assets(8) | | | (0.50 | )%(5) | | | (0.50 | )%(5)(7) | |
Ratio of Rebate from Morgan Stanley Affiliates to Average Net Assets | | | 0.02 | % | | | 0.04 | % | |
Portfolio Turnover Rate | | | 79 | % | | | 16 | %(6) | |
(8) Supplemental Information on the Ratios to Average Net Assets: | |
Ratios Before Expense Limitation: | |
Expenses to Average Net Assets | | | 26.78 | % | | | 37.76 | %(7) | |
Net Investment Loss to Average Net Assets | | | (25.00 | )% | | | (36.00 | )%(7) | |
(1) Commencement of Operations.
(2) Per share amount is based on average shares outstanding.
(3) Amount is less than $0.005 per share.
(4) Calculated based on the net asset value which does not reflect sales charges, if applicable, as of the last business day of the period.
(5) The Ratios of Expenses and Net Investment Loss reflect the rebate of certain Fund expenses in connection with the investments in Morgan Stanley affiliates during the period. The effect of the rebate on the ratios is disclosed in the above table as "Ratio of Rebate from Morgan Stanley Affiliates to Average Net Assets."
(6) Not annualized.
(7) Annualized.
The accompanying notes are an integral part of the financial statements.
15
Morgan Stanley Institutional Fund, Inc.
Annual Report — December 31, 2017
Financial Highlights
Emerging Markets Breakout Nations Portfolio
| | | Class IS | |
Selected Per Share Data and Ratios | | Year Ended
December 31, 2017 | | Period from
December 15, 2016(1) to
December 31, 2016 | |
Net Asset Value, Beginning of Period | | $ | 10.15 | | | $ | 10.00 | | |
Income from Investment Operations: | |
Net Investment Income(2) | | | 0.08 | | | | 0.00 | (3) | |
Net Realized and Unrealized Gain | | | 2.19 | | | | 0.15 | | |
Total from Investment Operations | | | 2.27 | | | | 0.15 | | |
Distributions from and/or in Excess of: | |
Net Investment Income | | | (0.05 | ) | | | — | | |
Net Realized Gain | | | (0.46 | ) | | | — | | |
Total Distributions | | | (0.51 | ) | | | — | | |
Net Asset Value, End of Period | | $ | 11.91 | | | $ | 10.15 | | |
Total Return(4) | | | 22.47 | % | | | 1.50 | %(6) | |
Ratios and Supplemental Data: | |
Net Assets, End of Period (Thousands) | | $ | 12 | | | $ | 10 | | |
Ratio of Expenses to Average Net Assets(8) | | | 1.08 | %(5) | | | 1.06 | %(5)(7) | |
Ratio of Net Investment Income to Average Net Assets(8) | | | 0.69 | %(5) | | | 0.70 | %(5)(7) | |
Ratio of Rebate from Morgan Stanley Affiliates to Average Net Assets | | | 0.02 | % | | | 0.04 | %(7) | |
Portfolio Turnover Rate | | | 79 | % | | | 16 | %(6) | |
(8) Supplemental Information on the Ratios to Average Net Assets: | |
Ratios Before Expense Limitation: | |
Expenses to Average Net Assets | | | 25.68 | % | | | 36.76 | %(7) | |
Net Investment Loss to Average Net Assets | | | (23.91 | )% | | | (35.00 | )%(7) | |
(1) Commencement of Operations.
(2) Per share amount is based on average shares outstanding.
(3) Amount is less than $0.005 per share.
(4) Calculated based on the net asset value as of the last business day of the period.
(5) The Ratios of Expenses and Net Investment Income reflect the rebate of certain Fund expenses in connection with the investments in Morgan Stanley affiliates during the period. The effect of the rebate on the ratios is disclosed in the above table as "Ratio of Rebate from Morgan Stanley Affiliates to Average Net Assets."
(6) Not annualized.
(7) Annualized.
The accompanying notes are an integral part of the financial statements.
16
Morgan Stanley Institutional Fund, Inc.
Annual Report — December 31, 2017
Notes to Financial Statements
Morgan Stanley Institutional Fund, Inc. (the "Company") is registered under the Investment Company Act of 1940, as amended (the "Act"), as an open-end management investment company. The Company is comprised of twenty-nine separate, active, diversified and non-diversified funds (individually referred to as a "Fund", collectively as the "Funds"). The Company applies investment company accounting and reporting guidance.
The accompanying financial statements relate to the Emerging Markets Breakout Nations Portfolio. The Fund seeks long-term capital appreciation.
The Fund offers four classes of shares — Class I, Class A, Class C and Class IS.
A. Significant Accounting Policies: The following significant accounting policies are in conformity with U.S. generally accepted accounting principles ("GAAP"). Such policies are consistently followed by the Company in the preparation of its financial statements. GAAP may require management to make estimates and assumptions that affect the reported amounts and disclosures in the financial statements. Actual results may differ from those estimates.
1. Security Valuation: (1) An equity portfolio security listed or traded on an exchange is valued at its latest reported sales price (or at the exchange official closing price if such exchange reports an official closing price), and if there were no sales on a given day and if there is no official exchange closing price for that day, the security is valued at the mean between the last reported bid and asked prices if such bid and asked prices are available on the relevant exchanges. Listed equity securities not traded on the valuation date with no reported bid and asked prices available on the exchange are valued at the mean between the current bid and asked prices obtained from one or more reputable brokers or dealers. In cases where a security is traded on more than one exchange, the security is valued on the exchange designated as the primary market; (2) all other equity portfolio securities for which over-the-counter ("OTC") market quotations are readily available are valued at the latest reported sales price (or at the market official closing price if such market reports an official closing price), and if there was no trading in the security on a given day and if there is no official closing price from relevant markets for that day, the security is valued at the mean between the last reported bid and asked prices if such bid and asked prices are available on
the relevant markets. An unlisted equity security that does not trade on the valuation date and for which bid and asked prices from the relevant markets are unavailable is valued at the mean between the current bid and asked prices obtained from one or more reputable brokers or dealers; (3) certain portfolio securities may be valued by an outside pricing service/vendor approved by the Company's Board of Directors (the "Directors"). The pricing service/vendor may employ a pricing model that takes into account, among other things, bids, yield spreads, and/or other market data and specific security characteristics. Alternatively, if a valuation is not available from an outside pricing service/vendor, and the security trades on an exchange, the security may be valued at its latest reported sale price (or at the exchange official closing price if such exchange reports an official closing price), prior to the time when assets are valued. If there are no sales on a given day and if there is no official exchange closing price for that day, the security is valued at the mean between the last reported bid and asked prices if such bid and asked prices are available in the relevant exchanges; (4) futures are valued at the settlement price on the exchange on which they trade or, if a settlement price is unavailable, at the last sale price on the exchange; (5) when market quotations are not readily available, including circumstances under which Morgan Stanley Investment Management Inc. (the "Adviser") determines that the closing price, last sale price or the mean between the last reported bid and asked prices are not reflective of a security's market value, portfolio securities are valued at their fair value as determined in good faith under procedures established by and under the general supervision of the Directors. Occasionally, developments affecting the closing prices of securities and other assets may occur between the times at which valuations of such securities are determined (that is, close of the foreign market on which the securities trade) and the close of business of the New York Stock Exchange ("NYSE"). If developments occur during such periods that are expected to materially affect the value of such securities, such valuations may be adjusted to reflect the estimated fair value of such securities as of the close of the NYSE, as determined in good faith by the Directors or by the Adviser using a pricing service and/or procedures approved by the Directors; (6) quotations of foreign portfolio securities, other assets and liabilities and forward contracts stated in foreign currency are translated into U.S. dollar equivalents at the prevailing market rates prior
17
Morgan Stanley Institutional Fund, Inc.
Annual Report — December 31, 2017
Notes to Financial Statements (cont'd)
to the close of the NYSE; and (7) investments in mutual funds, including the Morgan Stanley Institutional Liquidity Funds, are valued at the net asset value ("NAV") as of the close of each business day.
The Directors have responsibility for determining in good faith the fair value of the investments, and the Directors may appoint others, such as the Company's Adviser or a valuation committee, to assist the Directors in determining fair value and to make the actual calculations pursuant to the fair valuation methodologies previously approved by the Directors. Under procedures approved by the Directors, the Company's Adviser has formed a Valuation Committee whose members are approved by the Directors. The Valuation Committee provides administration and oversight of the Company's valuation policies and procedures, which are reviewed at least annually by the Directors. These procedures allow the Company to utilize independent pricing services, quotations from securities and financial instrument dealers, and other market sources to determine fair value.
The Company has procedures to determine the fair value of securities and other financial instruments for which market prices are not readily available. Under these procedures, the Valuation Committee convenes on a regular and ad hoc basis to review such securities and considers a number of factors, including valuation methodologies and significant unobservable valuation inputs, when arriving at fair value. The Valuation Committee may employ a market-based approach which may use related or comparable assets or liabilities, recent transactions, market multiples, book values, and other relevant information for the investment to determine the fair value of the investment. An income-based valuation approach may also be used in which the anticipated future cash flows of the investment are discounted to calculate fair value. Discounts may also be applied due to the nature or duration of any restrictions on the disposition of the investments. Due to the inherent uncertainty of valuations of such investments, the fair values may differ significantly from the values that would have been used had an active market existed. The Valuation Committee employs various methods for calibrating these valuation approaches including a regular review of valuation methodologies, key inputs and assumptions, transactional back-testing or disposition analysis, and reviews of any related market activity.
2. Fair Value Measurement: Financial Accounting Standards Board ("FASB") Accounting Standards CodificationTM ("ASC") 820, "Fair Value Measurement" ("ASC 820"), defines fair value as the value that the Fund would receive to sell an investment or pay to transfer a liability in a timely transaction with an independent buyer in the principal market, or in the absence of a principal market, the most advantageous market for the investment or liability. ASC 820 establishes a three-tier hierarchy to distinguish between (1) inputs that reflect the assumptions market participants would use in valuing an asset or liability developed based on market data obtained from sources independent of the reporting entity (observable inputs) and (2) inputs that reflect the reporting entity's own assumptions about the assumptions market participants would use in valuing an asset or liability developed based on the best information available in the circumstances (unobservable inputs) and to establish classification of fair value measurements for disclosure purposes. Various inputs are used in determining the value of the Fund's investments. The inputs are summarized in the three broad levels listed below.
• Level 1 – unadjusted quoted prices in active markets for identical investments
• Level 2 – other significant observable inputs (including quoted prices for similar investments, interest rates, prepayment speeds, credit risk, etc.)
• Level 3 – significant unobservable inputs including the Fund's own assumptions in determining the fair value of investments. Factors considered in making this determination may include, but are not limited to, information obtained by contacting the issuer, analysts, or the appropriate stock exchange (for exchange-traded securities), analysis of the issuer's financial statements or other available documents and, if necessary, available information concerning other securities in similar circumstances
The inputs or methodology used for valuing securities are not necessarily an indication of the risk associated with investing in those securities and the determination of the significance of a particular input to the fair value measurement in its entirety requires judgment and considers factors specific to each security.
18
Morgan Stanley Institutional Fund, Inc.
Annual Report — December 31, 2017
Notes to Financial Statements (cont'd)
The following is a summary of the inputs used to value the Fund's investments as of December 31, 2017.
Investment Type | | Level 1
Unadjusted
quoted
prices
(000) | | Level 2
Other
significant
observable
inputs
(000) | | Level 3
Significant
unobservable
inputs
(000) | | Total
(000) | |
Assets: | |
Common Stocks | |
Airlines | | $ | — | | | $ | 47 | | | $ | — | | | $ | 47 | | |
Automobiles | | | — | | | | 87 | | | | — | | | | 87 | | |
Banks | | | 797 | | | | 1,089 | | | | — | | | | 1,886 | | |
Beverages | | | 93 | | | | 17 | | | | — | | | | 110 | | |
Capital Markets | | | — | | | | 136 | | | | — | | | | 136 | | |
Construction Materials | | | 36 | | | | 80 | | | | — | | | | 116 | | |
Diversified Consumer
Services | | | 43 | | | | — | | | | — | | | | 43 | | |
Diversified Financial
Services | | | — | | | | 27 | | | | — | | | | 27 | | |
Diversified
Telecommunication
Services | | | 56 | | | | 92 | | | | — | | | | 148 | | |
Electronic Equipment,
Instruments &
Components | | | — | | | | 9 | | | | — | | | | 9 | | |
Food & Staples
Retailing | | | — | | | | 52 | | | | — | | | | 52 | | |
Food Products | | | 40 | | | | 168 | | | | — | | | | 208 | | |
Health Care Providers &
Services | | | — | | | | 121 | | | | — | | | | 121 | | |
Hotels, Restaurants &
Leisure | | | 35 | | | | 65 | | | | — | | | | 100 | | |
Household Products | | | — | | | | 86 | | | | — | | | | 86 | | |
Industrial Conglomerates | | | — | | | | 162 | | | | — | | | | 162 | | |
Insurance | | | — | | | | 130 | | | | — | | | | 130 | | |
Internet & Direct Marketing
Retail | | | 31 | | | | — | | | | — | | | | 31 | | |
Internet Software &
Services | | | 246 | | | | 290 | | | | — | | | | 536 | | |
Multi-Line Retail | | | — | | | | 75 | | | | — | | | | 75 | | |
Oil, Gas & Consumable
Fuels | | | — | | | | 107 | | | | — | | | | 107 | | |
Pharmaceuticals | | | — | | | | 152 | | | | — | | | | 152 | | |
Real Estate
Management &
Development | | | 13 | | | | 65 | | | | — | | | | 78 | | |
Textiles, Apparel & Luxury
Goods | | | — | | | | 195 | | | | — | | | | 195 | | |
Transportation
Infrastructure | | | — | | | | 45 | | | | — | | | | 45 | | |
Wireless
Telecommunication
Services | | | — | | | | 81 | | | | — | | | | 81 | | |
Total Common Stocks | | | 1,390 | | | | 3,378 | | | | — | | | | 4,768 | | |
Participation Notes | | | — | | | | 193 | | | | — | | | | 193 | | |
Investment Company | | | 296 | | | | — | | | | — | | | | 296 | | |
Short-Term Investment | |
Investment Company | | | 592 | | | | — | | | | — | | | | 592 | | |
Foreign Currency Forward
Exchange Contract | | | — | | | | 10 | | | | — | | | | 10 | | |
Total Assets | | | 2,278 | | | | 3,581 | | | | — | | | | 5,859 | | |
Liabilities: | |
Futures Contract | | | (— | @) | | | — | | | | — | | | | (— | @) | |
Total | | $ | 2,278 | | | $ | 3,581 | | | $ | — | | | $ | 5,859 | | |
@ Value is less than $500.
Transfers between investment levels may occur as the markets fluctuate and/or the availability of data used in an investment's valuation changes. The Fund recognizes transfers between the levels as of the end of the period. As of December 31, 2017, securities with a total value of approximately $1,880,000 transferred from Level 1 to Level 2. Securities that were valued using unadjusted quoted prices at December 31, 2016 were valued using other significant observable inputs at December 31, 2017. At December 31, 2017, the fair value of certain securities were adjusted due to developments which occurred between the time of the close of the foreign markets on which they trade and the close of business on the NYSE which resulted in their Level 2 classification.
3. Foreign Currency Translation and Foreign Investments: The books and records of the Fund are maintained in U.S. dollars. Foreign currency amounts are translated into U.S. dollars as follows:
– investments, other assets and liabilities at the prevailing rate of exchange on the valuation date;
– investment transactions and investment income at the prevailing rates of exchange on the dates of such transactions.
Although the net assets of the Fund are presented at the foreign exchange rates and market values at the close of the period, the Fund does not isolate that portion of the results of operations arising as a result of changes in the foreign exchange rates from the fluctuations arising from changes in the market prices of securities held at period end. Similarly, the Fund does not isolate the effect of changes in foreign exchange rates from the fluctuations arising from changes in the market prices of securities sold during the period. Accordingly, realized and unrealized foreign currency gains (losses) on investments in securities are included in the reported net realized and unrealized gains (losses) on investment transactions and balances. However, pursuant to U.S. federal income tax regulations, gains and losses from certain foreign currency transactions and the foreign currency portion of gains and losses realized on sales and maturities of foreign denominated debt securities are treated as ordinary income for U.S. federal income tax purposes.
Net realized gains (losses) on foreign currency transactions represent net foreign exchange gains (losses) from foreign currency forward exchange contracts, disposition
19
Morgan Stanley Institutional Fund, Inc.
Annual Report — December 31, 2017
Notes to Financial Statements (cont'd)
of foreign currencies, currency gains (losses) realized between the trade and settlement dates on securities transactions, and the difference between the amount of investment income and foreign withholding taxes recorded on the Fund's books and the U.S. dollar equivalent amounts actually received or paid. Net unrealized currency gains (losses) from valuing foreign currency denominated assets and liabilities at period end exchange rates are reflected as a component of unrealized appreciation (depreciation) in the Statement of Assets and Liabilities. The change in unrealized currency gains (losses) on foreign currency translations for the period is reflected in the Statement of Operations.
A significant portion of the Fund's net assets consist of securities of issuers located in emerging markets, which are denominated in foreign currencies. Such securities may be concentrated in a limited number of countries and regions and may vary throughout the year. Changes in currency exchange rates will affect the value of securities and investment income from foreign currency denominated securities. Emerging market securities are often subject to greater price volatility, limited capitalization and liquidity, and higher rates of inflation than securities of companies based in the U.S. In addition, emerging market issuers may be subject to substantial governmental involvement in the economy and greater social, economic and political uncertainty.
Governmental approval for foreign investments may be required in advance of making an investment under certain circumstances in some countries, and the extent of foreign investments in domestic companies may be subject to limitation in other countries. Foreign ownership limitations also may be imposed by the charters of individual companies to prevent, among other concerns, violations of foreign investment limitations. As a result, an additional class of shares (identified as "Foreign" in the Portfolio of Investments) may be created and offered for investment. The "local" and "foreign shares" market values may differ. In the absence of trading of the foreign shares in such markets, the Fund values the foreign shares at the closing exchange price of the local shares.
4. Derivatives: The Fund may, but is not required to, use derivative instruments for a variety of purposes, including hedging, risk management, portfolio management or to earn income. Derivatives are financial instruments whose
value is based, in part, on the value of an underlying asset, interest rate, index or financial instrument. Prevailing interest rates and volatility levels, among other things, also affect the value of derivative instruments. A derivative instrument often has risks similar to its underlying asset and may have additional risks, including imperfect correlation between the value of the derivative and the underlying asset, risks of default by the counterparty to certain transactions, magnification of losses incurred due to changes in the market value of the securities, instruments, indices or interest rates to which the derivative instrument relates, risks that the transactions may not be liquid and risks arising from margin requirements. The use of derivatives involves risks that are different from, and possibly greater than, the risks associated with other portfolio investments. Derivatives may involve the use of highly specialized instruments that require investment techniques and risk analyses different from those associated with other portfolio investments. All of the Fund's holdings, including derivative instruments, are marked-to-market each day with the change in value reflected in unrealized appreciation (depreciation). Upon disposition, a realized gain or loss is recognized.
Certain derivative transactions may give rise to a form of leverage. Leverage magnifies the potential for gain and the risk of loss. Leverage associated with derivative transactions may cause the Fund to liquidate portfolio positions when it may not be advantageous to do so to satisfy its obligations or to meet earmarking or segregation requirements, pursuant to applicable Securities and Exchange Commission ("SEC") rules and regulations, or may cause the Fund to be more volatile than if the Fund had not been leveraged. Although the Adviser seeks to use derivatives to further the Fund's investment objectives, there is no assurance that the use of derivatives will achieve this result.
Following is a description of the derivative instruments and techniques that the Fund used during the period and their associated risks:
Foreign Currency Forward Exchange Contracts: In connection with its investments in foreign securities, the Fund also entered into contracts with banks, brokers or dealers to purchase or sell securities or foreign currencies at a future date. A foreign currency forward exchange contract ("currency contract") is a negotiated agreement between the contracting parties to exchange a specified
20
Morgan Stanley Institutional Fund, Inc.
Annual Report — December 31, 2017
Notes to Financial Statements (cont'd)
amount of currency at a specified future time at a specified rate. The rate can be higher or lower than the spot rate between the currencies that are the subject of the contract. Currency contracts may be used to protect against uncertainty in the level of future foreign currency exchange rates or to gain or modify exposure to a particular currency. To the extent hedged by the use of currency contracts, the precise matching of the currency contract amounts and the value of the securities involved will not generally be possible because the future value of such securities in foreign currencies will change as a consequence of market movements in the value of those securities between the date on which the contract is entered into and the date it matures. Furthermore, such transactions may reduce or preclude the opportunity for gain if the value of the currency should move in the direction opposite to the position taken. There is additional risk to the extent that currency contracts create exposure to currencies in which the Fund's securities are not denominated. Unanticipated changes in currency prices may result in poorer overall performance for the Fund than if it had not entered into such contracts. The use of currency contracts involves the risk of loss from the insolvency or bankruptcy of the counterparty to the contract or the failure of the counterparty to make payments or otherwise comply with the terms of the contract. A currency contract is marked-to-market daily and the change in market value is recorded by the Fund as unrealized gain or loss. The Fund records realized gains (losses) when the currency contract is closed equal to the difference between the value of the currency contract at the time it was opened and the value at the time it was closed.
Futures: A futures contract is a standardized, exchange-traded agreement to buy or sell a specific quantity of an underlying asset, reference rate or index at a specific price at a specific future time. The value of a futures contract tends to increase and decrease in tandem with the value of the underlying instrument. Depending on the terms of the particular contract, futures contracts are settled through either physical delivery of the underlying instrument on the settlement date or by payment of a cash settlement amount on the settlement date. During the period the futures contract is open, payments are
received from or made to the broker based upon changes in the value of the contract (the variation margin). A decision as to whether, when and how to use futures contracts involves the exercise of skill and judgment and even a well-conceived futures transaction may be unsuccessful because of market behavior or unexpected events. In addition to the derivatives risks discussed above, the prices of futures contracts can be highly volatile, using futures contracts can lower total return, and the potential loss from futures contracts can exceed the Fund's initial investment in such contracts. No assurance can be given that a liquid market will exist for any particular futures contract at any particular time. There is also the risk of loss by the Fund of margin deposits in the event of bankruptcy of a broker with which the Fund has open positions in the futures contract.
FASB ASC 815, "Derivatives and Hedging" ("ASC 815"), is intended to improve financial reporting about derivative instruments by requiring enhanced disclosures to enable investors to better understand how and why the Fund uses derivative instruments, how these derivative instruments are accounted for and their effects on the Fund's financial position and results of operations.
The following tables set forth the fair value of the Fund's derivative contracts by primary risk exposure as of December 31, 2017.
| | | Asset Derivatives
Statement of Assets and
Liabilities Location | | Primary Risk
Exposure | | Value
(000) | |
Foreign Currency
Forward Exchange
Contract | | Unrealized Appreciation on
Foreign Currency Forward
Exchange Contract | | Currency Risk | | $ | 10 | | |
| | | Liability Derivatives
Statement of Assets and
Liabilities Location | | Primary Risk
Exposure | | Value
(000) | |
Futures Contract
| | Variation Margin on
Future Contract | | Equity Risk | | $ | (— | @)(a) | |
@ Amount is less than $500.
(a) This amount represents the cumulative appreciation (depreciation) as reported in the Portfolio of Investments. The Statement of Assets and Liabilities only reflects the current day's net variation margin.
21
Morgan Stanley Institutional Fund, Inc.
Annual Report — December 31, 2017
Notes to Financial Statements (cont'd)
The following tables set forth by primary risk exposure the Fund's realized gains (losses) and change in unrealized appreciation (depreciation) by type of derivative contract for the year ended December 31, 2017 in accordance with ASC 815.
Realized Gain (Loss) | |
Primary Risk Exposure | | Derivative Type | | Value
(000) | |
Currency Risk | | Foreign Currency Forward
Exchange Contracts | | $ | 1 | | |
Equity Risk | | Futures Contracts | | | 114 | | |
Total | | | | $ | 115 | | |
Change in Unrealized Appreciation (Depreciation) | |
Primary Risk Exposure | | Derivative Type | | Value
(000) | |
Currency Risk | | Foreign Currency Forward
Exchange Contracts | | $ | 10 | | |
Equity Risk | | Futures Contracts | | | (8 | ) | |
Total | | | | $ | 2 | | |
At December 31, 2017, the Fund's derivative assets and liabilities are as follows:
Gross Amounts of Assets and Liabilities
Presented in the Statement of Assets and Liabilities | |
Derivatives(b) | | Assets(c)
(000) | | Liabilities(c)
(000) | |
Foreign Currency Forward Exchange Contract | | $ | 10 | | | $ | — | | |
(b) Excludes exchange traded derivatives.
(c) Absent an event of default or early termination, OTC derivative assets and liabilities are presented gross and not offset in the Statement of Assets and Liabilities.
The Fund typically enters into International Swaps and Derivatives Association, Inc. Master Agreements ("ISDA Master Agreements") or similar master agreements (collectively, "Master Agreements") with its contract counterparties for certain OTC derivatives in order to, among other things, reduce its credit risk to counterparties. ISDA Master Agreements include provisions for general obligations, representations, collateral and events of default or termination. Under an ISDA Master Agreement, the Fund typically may offset with the counterparty certain OTC derivative financial instruments' payables and/or receivables with collateral held and/or posted and create one single net payment (close-out netting) in the event of default, termination and/or potential deterioration in the credit quality of the counterparty. Various Master Agreements govern the terms of certain transactions with counterparties, including transactions such as swap, forward, repurchase and reverse repurchase agreements. These Master Agreements typically attempt to reduce the counterparty risk associated with such transactions by specifying credit protection mechanisms and providing standardization that
improves legal certainty. Cross-termination provisions under Master Agreements typically provide that a default in connection with one transaction between the Fund and a counterparty gives the non-defaulting party the right to terminate any other transactions in place with the defaulting party to create one single net payment due to/due from the defaulting party and may be a feature in certain Master Agreements. In the event the Fund exercises its right to terminate a Master Agreement after a counterparty experiences a termination event as defined in the Master Agreement, the return of collateral with market value in excess of the Fund's net liability may be delayed or denied.
The following table presents derivative financial instruments that are subject to enforceable netting arrangements as of December 31, 2017.
Gross Amounts Not Offset in the Statement of Assets and Liabilities | |
Counterparty | | Gross Assets
Derivatives
Presented in
Statement of
Assets and
Liabilities
(000) | | Financial
Instrument
(000) | | Collateral
Received
(000) | | Net Amount
(not less
than $0)
(000) | |
State Street Bank and Trust Co. | | $ | 10 | | | $ | — | | | $ | — | | | $ | 10 | | |
For the year ended December 31, 2017, the approximate average monthly amount outstanding for each derivative type is as follows:
Foreign Currency Forward Exchange Contract: | |
Average monthly principal amount | | $ | 213,000 | | |
Futures Contract: | |
Average monthly original value | | $ | 1,025,000 | | |
5. Structured Investments: The Fund invested a portion of its assets in structured investments. A structured investment is a derivative security designed to offer a return linked to a particular underlying security, currency, commodity or market. Structured investments may come in various forms including notes (such as exchange-traded notes), warrants and options to purchase securities. The Fund will typically use structured investments to gain exposure to a permitted underlying security, currency, commodity or market when direct access to a market is limited or inefficient from a tax or cost standpoint. There can be no assurance that structured investments will trade at the same price or have the same value as the underlying security, currency, commodity or market. Investments in structured investments involve risks including issuer risk, counterparty risk and market risk. Holders of structured
22
Morgan Stanley Institutional Fund, Inc.
Annual Report — December 31, 2017
Notes to Financial Statements (cont'd)
investments bear risks of the underlying investment and are subject to issuer or counterparty risk because the Fund is relying on the creditworthiness of such issuer or counterparty and has no rights with respect to the underlying investment. Certain structured investments may be thinly traded or have a limited trading market and may have the effect of increasing the Fund's illiquidity to the extent that the Fund, at a particular time, may be unable to find qualified buyers for these securities.
6. Redemption Fees: The Fund will assess a 2% redemption fee on Class I shares, Class A shares, Class C shares and Class IS shares, which is paid directly to the Fund, for shares redeemed or exchanged within thirty days of purchase, subject to certain exceptions. The redemption fee is designed to protect the Fund and its remaining shareholders from the effects of short-term trading. These fees, if any, are included in the Statements of Changes in Net Assets.
7. Indemnifications: The Company enters into contracts that contain a variety of indemnifications. The Company's maximum exposure under these arrangements is unknown. However, the Company has not had prior claims or losses pursuant to these contracts and expects the risk of loss to be remote.
8. Dividends and Distributions to Shareholders: Dividends and distributions to shareholders are recorded on the ex-dividend date. Dividends from net investment income, if any, are declared and paid annually. Net realized capital gains, if any, are distributed at least annually.
9. Security Transactions, Income and Expenses: Security transactions are accounted for on the trade date (date the order to buy or sell is executed). Realized gains and losses on the sale of investment securities are determined on the specific identified cost method. Dividend income and other distributions are recorded on the ex-dividend date (except for certain foreign dividends which may be recorded as soon as the Fund is informed of such dividends) net of applicable withholding taxes. Interest income is recognized on the accrual basis except where collection is in doubt. Discounts are accreted and premiums are amortized over the life of the respective securities. Most expenses of the Company can be directly attributed to a particular Fund. Expenses which cannot be directly attributed are apportioned among the Funds based upon relative net assets or other appropriate methods. Income,
expenses (other than class specific expenses — distribution and shareholder services, transfer agency and sub transfer agency fees) and realized and unrealized gains or losses are allocated to each class of shares based upon their relative net assets.
B. Advisory Fees: The Adviser, a wholly-owned subsidiary of Morgan Stanley, provides the Fund with advisory services under the terms of an Investment Advisory Agreement, paid quarterly, at the annual rate based on the daily net assets as follows:
First $1
billion | | Over $1
billion | |
| | 0.90 | % | | | 0.85 | % | |
For the year ended December 31, 2017, the advisory fee rate (net of waiver/rebate) was equivalent to an annual effective rate of 0.00% of the Fund's average daily net assets.
The Adviser has agreed to reduce its advisory fee and/or reimburse the Fund so that total annual portfolio operating expenses, excluding certain investment related expenses, taxes, interest and other extraordinary expenses (including litigation), will not exceed 1.20% for Class I shares, 1.55% for Class A shares, 2.30% for Class C shares and 1.10% for Class IS shares. The fee waivers and/or expense reimbursements will continue for at least one year from the date of the Fund's prospectus or until such time as the Directors act to discontinue all or a portion of such waivers and/or reimbursements when they deem such action is appropriate. For the period ended December 31, 2017, approximately $51,000 of advisory fees were waived and approximately $427,000 of other expenses were reimbursed by the Adviser pursuant to this arrangement.
C. Administration Fees: The Adviser also serves as Administrator to the Company and provides administrative services pursuant to an Administration Agreement for an annual fee, accrued daily and paid monthly, of 0.08% of the Fund's average daily net assets.
Under a Sub-Administration Agreement between the Administrator and State Street Bank and Trust Company ("State Street"), State Street provides certain administrative services to the Company. For such services, the Administrator pays State Street a portion of the fee the Administrator receives from the Fund.
D. Distribution and Shareholder Services Fees: Morgan Stanley Distribution, Inc. ("MSDI" or the "Distributor"), a wholly-owned subsidiary of the Adviser and an indirect
23
Morgan Stanley Institutional Fund, Inc.
Annual Report — December 31, 2017
Notes to Financial Statements (cont'd)
subsidiary of Morgan Stanley, serves as the Company's Distributor of Fund shares pursuant to a Distribution Agreement. The Company has adopted a Shareholder Services Plan with respect to Class A shares pursuant to Rule 12b-1 under the Act. Under the Shareholder Services Plan, the Fund pays the Distributor a shareholder services fee, accrued daily and paid monthly, at an annual rate of 0.25% of the Fund's average daily net assets attributable to Class A shares.
The Company has adopted a Distribution and Shareholder Services Plan with respect to Class C shares pursuant to Rule 12b-1 under the Act. Under the Distribution and Shareholder Services Plan, the Fund pays the Distributor a distribution fee, accrued daily and paid monthly, at an annual rate of 0.75% and a shareholder services fee, accrued daily and paid monthly, at an annual rate of 0.25% of the Fund's average daily net assets attributable to Class C shares.
The distribution and shareholder services fees are used to support the expenses associated with servicing and maintaining accounts. The Distributor may compensate other parties for providing shareholder support services to investors who purchase Class A and Class C shares.
E. Dividend Disbursing and Transfer Agent: The Company's dividend disbursing and transfer agent is Boston Financial Data Services, Inc. ("BFDS"). Pursuant to a Transfer Agency Agreement, the Company pays BFDS a fee based on the number of classes, accounts and transactions relating to the Funds of the Company. Effective January 1, 2018, BFDS changed its name to DST Asset Manager Solutions, Inc.
F. Custodian Fees: State Street (the "Custodian") also serves as Custodian for the Company in accordance with a Custodian Agreement. The Custodian holds cash, securities, and other assets of the Company as required by the Act. Custody fees are payable monthly based on assets held in custody, investment purchases and sales activity and account maintenance fees, plus reimbursement for certain out-of-pocket expenses.
G. Security Transactions and Transactions with Affiliates: For the year ended December 31, 2017, purchases and sales of investment securities for the Fund, other than long-term U.S. Government securities and short-term investments, were approximately $3,961,000 and $3,896,000, respectively. There were no purchases and sales of long-term U.S. Government securities for the period ended December 31, 2017.
The Fund invests in the Institutional Class of the Morgan Stanley Institutional Liquidity Funds — Government Portfolio (the "Liquidity Funds"), an open-end management investment company managed by the Adviser. Advisory fees paid by the Fund are reduced by an amount equal to its pro-rata share of the advisory and administration fees paid by the Fund due to its investment in the Liquidity Funds. For the period ended December 31, 2017, advisory fees paid were reduced by approximately $1,000 relating to the Fund's investment in the Liquidity Funds.
A summary of the Fund's transactions in shares of the Liquidity Funds during the year ended December 31, 2017 is as follows:
Affiliated
Investment
Company | | Value
December 31,
2016
(000) | | Purchases
at Cost
(000) | | Proceeds
from Sales
(000) | | Dividend
Income
(000) | |
Liquidity Funds | | $ | 749 | | | $ | 2,087 | | | $ | 2,244 | | | $ | 4 | | |
Affiliated
Investment
Company (cont'd) | | Realized
Gain
(Loss)
(000) | | Change in
Unrealized
Appreciation
(Depreciation)
(000) | | Value
December 31,
2017
(000) | |
Liquidity Funds | | $ | — | | | $ | — | | | $ | 592 | | |
The Fund is permitted to purchase and sell securities ("cross-trade") from and to other Morgan Stanley Funds as well as other funds and client accounts for which the Adviser or an affiliate of the Adviser serves as investment adviser, pursuant to procedures approved by the Directors in compliance with Rule 17a-7 under the Act (the "Rule"). Each cross-trade is executed at the current market price in compliance with provisions of the Rule. For the period ended December 31, 2017, the Fund did not engage in any cross-trade transactions.
The Fund has an unfunded Deferred Compensation Plan (the "Compensation Plan"), which allows each independent Director to defer payment of all, or a portion, of the fees he or she receives for serving on the Board of Directors. Each eligible Director generally may elect to have the deferred amounts credited with a return equal to the total return on one or more of the Morgan Stanley funds that are offered as investment options under the Compensation Plan. Appreciation/depreciation and distributions received from these investments are recorded with an offsetting increase/decrease in the deferred compensation obligation and do not affect the NAV of the Fund.
H. Federal Income Taxes: It is the Fund's intention to continue to qualify as a regulated investment company and distribute all of its taxable and tax-exempt income. Accordingly, no provision for federal income taxes is required in the financial statements.
24
Morgan Stanley Institutional Fund, Inc.
Annual Report — December 31, 2017
Notes to Financial Statements (cont'd)
The Fund may be subject to taxes imposed by countries in which it invests. Such taxes are generally based on income and/or capital gains earned or repatriated. Taxes are accrued based on net investment income, net realized gains and net unrealized appreciation as such income and/or gains are earned. Taxes may also be based on transactions in foreign currency and are accrued based on the value of investments denominated in such currency.
FASB ASC 740-10, "Income Taxes — Overall", sets forth a minimum threshold for financial statement recognition of the benefit of a tax position taken or expected to be taken in a tax return. Management has concluded there are no significant uncertain tax positions that would require recognition in the financial statements. If applicable, the Fund recognizes interest accrued related to unrecognized tax benefits in "Interest Expense" and penalties in "Other Expenses" in the Statement of Operations. The Fund files tax returns with the U.S. Internal Revenue Service, New York and various states. Generally, each of the tax years in the two-year period ended December 31, 2017, remains subject to examination by taxing authorities.
The tax character of distributions paid may differ from the character of distributions shown in the Statements of Changes in Net Assets due to short-term capital gains being treated as ordinary income for tax purposes. The tax character of distributions paid during fiscal years 2017 and 2016 was as follows:
2017
Distributions
Paid From: | | 2016
Distributions
Paid From: | |
Ordinary
Income
(000) | | Long-Term
Capital Gain
(000) | | Ordinary
Income
(000) | | Long-Term
Capital Gain
(000) | |
| $ | 243 | | | $ | 8 | | | $ | — | | | $ | — | | |
The amount and character of income and gains to be distributed are determined in accordance with income tax regulations which may differ from GAAP. These book/tax differences are either considered temporary or permanent in nature.
Temporary differences are primarily due to differing book and tax treatments in the timing of the recognition of gains (losses) on certain investment transactions and the timing of the deductibility of certain expenses.
Permanent differences, primarily due to differing treatments of gains (losses) related to foreign currency transactions, foreign
capital gains tax and a nondeductible expense, resulted in the following reclassifications among the components of net assets at December 31, 2017:
Accumulated
Undistributed Net
Investment
Income
(000) | | Accumulated
Undistributed
Net Realized
Gain
(000) | | Paid-in-
Capital
(000) | |
| $ | (14 | ) | | $ | 14 | | | $ | (— | @) | |
@ Amount is less than $500.
At December 31, 2017, the components of distributable earnings for the Fund on a tax basis were as follows:
Undistributed
Ordinary
Income
(000) | | Undistributed
Long-Term
Capital Gain
(000) | |
| $ | 42 | | | $ | 35 | | |
During the year ended December 31, 2017, the Fund utilized capital loss carryforwards for U.S. federal income tax purposes of approximately $13,000.
I. Credit Facility: The Company and other Morgan Stanley funds participated in a $150,000,000 committed, unsecured revolving line of credit facility (the "Facility") with State Street. This Facility is to be used for temporary emergency purposes or funding of shareholder redemption requests. The interest rate on borrowings is based on the federal funds rate or 1 month LIBOR rate plus a spread. The Facility also has a commitment fee of 0.25% per annum based on the unused portion of the Facility. During the year ended December 31, 2017, the Fund did not have any borrowings under the Facility.
J. Other: At December 31, 2017, the Fund did not have record owners of 10% or greater.
25
Morgan Stanley Institutional Fund, Inc.
Annual Report — December 31, 2017
Report of Independent Registered Public Accounting Firm
To the Shareholders and Board of Directors of
Morgan Stanley Institutional Fund, Inc. —
Emerging Markets Breakout Nations Portfolio
Opinion on the Financial Statements
We have audited the accompanying statement of assets and liabilities of Emerging Markets Breakout Nations Portfolio (the "Fund") (one of the funds constituting the Morgan Stanley Institutional Fund, Inc. (the "Company")), including the portfolio of investments, as of December 31, 2017, and the related statement of operations for the year then ended, the statements of changes in net assets and the financial highlights for the year ended December 31, 2017 and the period from December 15, 2016 (commencement of operations) through December 31, 2016 and the related notes (collectively referred to as the "financial statements"). In our opinion, the financial statements present fairly, in all material respects, the financial position of Emerging Markets Breakout Nations Portfolio (one of the funds constituting Morgan Stanley Institutional Fund, Inc.) at December 31, 2017, the results of its operations for the year then ended and the changes in its net assets and its financial highlights for the year ended December 31, 2017 and the period from December 15, 2016 (commencement of operations) through December 31, 2016, in conformity with U.S. generally accepted accounting principles.
Basis for Opinion
These financial statements are the responsibility of the Company's management. Our responsibility is to express an opinion on the Fund's financial statements based on our audits. We are a public accounting firm registered with the Public Company Accounting Oversight Board (United States) ("PCAOB") and are required to be independent with respect to the Company in accordance with the U.S. federal securities law and the applicable rules and regulations of the Securities and Exchange Commission and the PCAOB.
We conducted our audits in accordance with the standards of the PCAOB. Those standards require that we plan and perform the audit to obtain reasonable assurance about whether the financial statements are free of material misstatement, whether due to error or fraud. The Company is not required to have, nor were we engaged to perform, an audit of the Company's internal control over financial reporting. As part of our audits, we are required to obtain an understanding of internal control over financial reporting, but not for the purpose of expressing an opinion on the effectiveness of the Company's internal control over financial reporting. Accordingly, we express no such opinion.
Our audits included performing procedures to assess the risks of material misstatement of the financial statements, whether due to error or fraud, and performing procedures that respond to those risks. Such procedures included examining, on a test basis, evidence regarding the amounts and disclosures in the financial statements. Our procedures included confirmation of securities owned as of December 31, 2017 by correspondence with the custodian and others or by other appropriate auditing procedures where replies from others were not received. Our audits also included evaluating the accounting principles used and significant estimates made by management, as well as evaluating the overall presentation of the financial statements. We believe that our audits provide a reasonable basis for our opinion.

We have served as the auditor of one or more Morgan Stanley investment companies since 2000.
Boston, Massachusetts
February 26, 2018
26
Morgan Stanley Institutional Fund, Inc.
Annual Report — December 31, 2017
Federal Tax Notice (unaudited)
For federal income tax purposes, the following information is furnished with respect to the distributions paid by the Fund during its taxable year ended December 31, 2017. For corporate shareholders 0.06% of the dividends qualified for the dividends received deduction.
The Fund designated and paid approximately $8,000 as a long-term capital gain distribution.
For federal income tax purposes, the following information is furnished with respect to the Fund's earnings for its taxable year ended December 31, 2017. When distributed, certain earnings may be subject to a maximum tax rate of 15% as provided for by the Jobs and Growth Tax Relief Reconciliation Act of 2003. The Fund designated up to a maximum of approximately $83,000 as taxable at this lower rate.
The Fund intends to pass through foreign tax credits of approximately $10,000 and has derived net income from sources within foreign countries amounting to approximately $105,000.
In January, the Fund provides tax information to shareholders for the preceding calendar year.
27
Morgan Stanley Institutional Fund, Inc.
Annual Report — December 31, 2017
Privacy Notice (unaudited)
MORGAN STANLEY INVESTMENT MANAGEMENT INC.
AN IMPORTANT NOTICE CONCERNING OUR U.S. PRIVACY POLICY
We are required by federal law to provide you with a copy of our privacy policy annually. This policy applies to current and former individual investors in funds managed or sponsored by Morgan Stanley Investment Management Inc. ("MSIM") as well as current and former individual clients of MSIM. This policy is not applicable to partnerships, corporations, trusts or other non-individual clients or investors. Please note that we may amend this policy at any time, and will inform you of any changes as required by law.
WE RESPECT YOUR PRIVACY
We appreciate that you have provided us with your personal financial information. We strive to maintain the privacy of such information while we help you achieve your financial objectives. This Notice describes what non-public personal information we collect about you, why we collect it, when we may share it with others and how certain others may use it. It discusses the steps you may take to limit our sharing of certain information about you to affiliated companies in the Morgan Stanley family of companies ("other Morgan Stanley companies"). It also discloses how you may limit use of certain shared information for marketing purposes by other Morgan Stanley branded companies. Throughout this policy, we refer to the non-public information that personally identifies you or your accounts as "personal information.''
1. WHAT PERSONAL INFORMATION DO WE COLLECT ABOUT YOU?
We obtain personal information from applications and other forms you submit to us, from your dealings with us, from consumer reporting agencies, from our Web sites and from third parties and other sources.
For example:
• We may collect information such as your name, address, e-mail address, telephone/fax numbers, assets, income and investment objectives through subscription documents, applications and other forms you submit to us.
• We may obtain information about account balances, your use of account(s) and the types of products and services you prefer to receive from us through your dealings and transactions with us and other sources.
• We may obtain information about your creditworthiness and credit history from consumer reporting agencies.
• We may collect background information from and through third-party vendors to verify representations you have made and to comply with various regulatory requirements.
• If you interact with us through our public and private Web sites, we may collect information that you provide directly through online communications (such as an e-mail address). We may also collect information about your Internet service provider, your domain name, your computer's operating system and Web browser, your use of our Web sites and your product and service preferences, through the use of "cookies." Please consult the Terms of Use of these sites for more details.
2. WHEN DO WE DISCLOSE PERSONAL INFORMATION WE COLLECT ABOUT YOU?
We may disclose personal information we collect about you to other Morgan Stanley companies and to non-affiliated third parties.
a. Information We Disclose to Other Morgan Stanley Companies.
We may disclose personal information to other Morgan Stanley companies for a variety of reasons, including to manage your account(s) effectively, to service and process your transactions, to let you know about products and services offered by us and other Morgan Stanley companies, to manage our business, and as otherwise required or permitted by law. Offers for products and services from other Morgan Stanley companies are developed under conditions designed to safeguard your personal information.
28
Morgan Stanley Institutional Fund, Inc.
Annual Report — December 31, 2017
Privacy Notice (unaudited) (cont'd)
b. Information We Disclose to Non-affiliated Third Parties.
We do not disclose personal information that we collect about you to non-affiliated third parties except to those who provide marketing services on our behalf, to financial institutions with whom we have joint marketing agreements, and as otherwise required or permitted by law. For example, we may disclose personal information to non-affiliated third parties for servicing and processing transactions, to offer our own products and services, to protect against fraud, for institutional risk control, to respond to judicial process or to perform services on our behalf. When we share personal information with a non-affiliated third party, they are required to limit their use of personal information to the particular purpose for which it was shared and they are not allowed to share personal information with others except to fulfill that limited purpose or as may be permitted or required by law.
3. HOW DO WE PROTECT THE SECURITY AND CONFIDENTIALITY OF PERSONAL INFORMATION WE COLLECT ABOUT YOU?
We maintain physical, electronic and procedural security measures to help safeguard the personal information we collect about you. We have internal policies governing the proper handling of client information. Third parties that provide support or marketing services on our behalf may also receive personal information, and we require them to adhere to confidentiality standards with respect to such information.
4. HOW CAN YOU LIMIT THE SHARING OF CERTAIN TYPES OF PERSONAL INFORMATION WITH OTHER MORGAN STANLEY COMPANIES?
We offer you choices as to whether we share with other Morgan Stanley companies the personal information that was collected to determine your eligibility for products and services you request ("eligibility information"). Eligibility information does not include your identification information or personal information pertaining to our transactions or experiences with you. Please note that, even if you direct us not to share eligibility information with other Morgan Stanley companies ("opt-out"), we may still share personal information, including eligibility information, with those companies in circumstances excluded from the opt-out under applicable law, such as to process transactions or to service your account.
5. HOW CAN YOU LIMIT THE USE OF CERTAIN TYPES OF PERSONAL INFORMATION BY OTHER MORGAN STANLEY COMPANIES FOR MARKETING?
By following the opt-out instructions in Section 6 below, you may limit other Morgan Stanley branded companies from marketing their products or services to you based on personal information we disclose to them. This information may include, for example, your income and account history with us. Please note that, even if you choose to limit Other Morgan Stanley Companies from using personal information about you that we may share with them for marketing their products and services to you, Other Morgan Stanley Companies may use your personal information that they obtain from us to market to you in circumstances permitted by law, such as if the Other Morgan Stanley Company has its own relationship with you.
6. HOW CAN YOU SEND US AN OPT-OUT INSTRUCTION?
If you wish to limit our sharing of eligibility information about you with other Morgan Stanley companies or other Morgan Stanley companies' use of personal information for marketing purposes, as described in this notice, you may do so by:
• Calling us at (800) 548-7786
Monday–Friday between 8a.m. and 6p.m.(EST)
• Writing to us at the following address:
DST Asset Manager Solutions, Inc.
c/o Privacy Coordinator
P.O. Box 219804
Kansas City, Missouri 64121
29
Morgan Stanley Institutional Fund, Inc.
Annual Report — December 31, 2017
Privacy Notice (unaudited) (cont'd)
Your written request should include your name, address, telephone number and account number(s) to which the opt-out applies and whether you are opting out with respect to sharing of eligibility information (Section 4 above), or if information used for Marketing (Section 5 above) or both. Written opt-out requests should not be sent with any other correspondence. In order to process your request, we require that the request be provided by you directly and not through a third party.
Your opt-out preference will remain in effect with respect to this policy (as it may be amended) until you notify us otherwise. If you have a joint account, your direction for us not to share this information with other Morgan Stanley companies and for those other Morgan Stanley companies not to use your personal information for marketing will be applied to all account holders on that account. Please understand that if you limit our sharing or our affiliated companies' use of personal information, you and any joint account holder(s) may not receive information about Morgan Stanley products and services, including products or services that could help you manage your financial resources and achieve your investment objectives.
7. WHAT IF AN AFFILIATED COMPANY BECOMES A NON-AFFILIATED THIRD PARTY?
If, at any time in the future, an affiliated company becomes a non-affiliated third party, further disclosures of personal information made to the former affiliated company will be limited to those described in Section 2(b) above relating to non-affiliated third parties. If you elected under Section 6 to limit disclosures we make to affiliated companies, or use of personal information by affiliated companies, your election will not apply to use by any former affiliated company of your personal information in their possession once it becomes a non-affiliated third party.
SPECIAL NOTICE TO RESIDENTS OF VERMONT
The following section supplements our policy with respect to our individual clients who have a Vermont address and supersedes anything to the contrary in the above policy with respect to those clients only.
The state of Vermont requires financial institutions to obtain your consent prior to sharing personal information that they collect about you with affiliated companies and non-affiliated third parties other than in certain limited circumstances. Except as permitted by law, we will not share personal information we collect about you with non-affiliated third parties or other Morgan Stanley companies unless you provide us with your written consent to share such information ("opt-in").
If you wish to receive offers for investment products and services offered by or through other Morgan Stanley companies, please notify us in writing at the following address:
DST Asset Manager Solutions, Inc.
c/o Privacy Coordinator
P.O. Box 219804
Kansas City, Missouri 64121
Your authorization should include your name, address, telephone number and account number(s) to which the opt-in applies and should not be sent with any other correspondence. In order to process your authorization, we require that the authorization be provided by you directly and not through a third party.
SPECIAL NOTICE TO RESIDENTS OF CALIFORNIA
The following section supplements our policy with respect to our individual clients who have a California address and supersedes anything to the contrary in the above policy with respect to those clients only.
In response to a California law, if your account has a California home address, your personal information will not be disclosed to non-affiliated third parties except as permitted by applicable California law, and we will limit sharing such information with our affiliates to comply with California privacy laws that apply to us.
30
Morgan Stanley Institutional Fund, Inc.
Annual Report — December 31, 2017
Director and Officer Information (unaudited)
Independent Directors:
Name, Age and Address of
Independent Director | | Position(s)
Held with
Registrant | | Length of Time
Served* | | Principal Occupation(s) During Past 5 Years
and Other Relevant Professional Experience | | Number of
Portfolios in
Fund Complex
Overseen by
Independent
Director** | | Other Directorships
Held by Independent
Director*** | |
Frank L. Bowman (73)
c/o Perkins Coie LLP
Counsel to the Independent
Directors
30 Rockefeller Plaza
New York, NY 10112 | | Director | | Since
August
2006 | | President, Strategic Decisions, LLC (consulting) (since February 2009); Director or Trustee of various Morgan Stanley Funds (since August 2006); Chairperson of the Compliance and Insurance Committee (since October 2015); formerly, Chairperson of the Insurance Sub-Committee of the Compliance and Insurance Committee (2007-2015); served as President and Chief Executive Officer of the Nuclear Energy Institute (policy organization) (February 2005-November 2008); retired as Admiral, U.S. Navy after serving over 38 years on active duty including 8 years as Director of the Naval Nuclear Propulsion Program in the Department of the Navy and the U.S. Department of Energy (1996-2004); served as Chief of Naval Personnel (July 1994-September 1996) and on the Joint Staff as Director of Political Military Affairs (June 1992-July 1994); knighted as Honorary Knight Commander of the Most Excellent Order of the British Empire; awarded the Officier de l'Orde National du Mérite by the French Government; elected to the National Academy of Engineering (2009). | | | 88 | | | Director of BP p.l.c.; Director of Naval and Nuclear Technologies LLP; Director Emeritus of the Armed Services YMCA; Director of the U.S. Naval Submarine League; Member of the National Security Advisory Council of the Center for U.S. Global Engagement and a member of the CNA Military Advisory Board; Trustee of Fairhaven United Methodist Church; and Director of other various non-profit organizations. | |
Kathleen A. Dennis (64)
c/o Perkins Coie LLP
Counsel to the Independent Directors
30 Rockefeller Plaza
New York, NY 10112 | | Director | | Since
August
2006 | | President, Cedarwood Associates (mutual fund and investment management consulting) (since July 2006); Chairperson of the Liquidity and Alternatives Sub-Committee of the Investment Committee (since October 2006) and Director or Trustee of various Morgan Stanley Funds (since August 2006); formerly, Senior Managing Director of Victory Capital Management (1993-2006). | | | 89 | | | Director of various non-profit organizations. | |
Nancy C. Everett (62)
c/o Perkins Coie LLP
Counsel to the Independent Directors
30 Rockefeller Plaza
New York, NY 10112 | | Director | | Since
January
2015 | | Chief Executive Officer, Virginia Commonwealth University Investment Company (since November 2015); Owner, OBIR, LLC (institutional investment management consulting) (since June 2014); formerly, Managing Director, BlackRock Inc. (February 2011-December 2013); and Chief Executive Officer, General Motors Asset Management (a/k/a Promark Global Advisors, Inc.) (June 2005-May 2010). | | | 90 | | | Formerly, Member of Virginia Commonwealth University School of Business Foundation (2005-2016); Member of Virginia Commonwealth University Board of Visitors (2013-2015); Member of Committee on Directors for Emerging Markets Growth Fund, Inc. (2007-2010); Chairperson of Performance Equity Management, LLC (2006-2010); and Chairperson, GMAM Absolute Return Strategies Fund, LLC (2006-2010). | |
31
Morgan Stanley Institutional Fund, Inc.
Annual Report — December 31, 2017
Director and Officer Information (unaudited) (cont'd)
Independent Directors: (cont'd)
Name, Age and Address of
Independent Director | | Position(s)
Held with
Registrant | | Length of Time
Served* | | Principal Occupation(s) During Past 5 Years
and Other Relevant Professional Experience | | Number of
Portfolios in
Fund Complex
Overseen by
Independent
Director** | | Other Directorships
Held by Independent
Director*** | |
Jakki L. Haussler (60)
c/o Perkins Coie LLP
Counsel to the Independent Directors
30 Rockefeller Plaza
New York, NY 10112 | | Director | | Since
January
2015 | | Chairman and Chief Executive Officer, Opus Capital Group (since January 1996); formerly, Director, Capvest Venture Fund, LP (May 2000-December 2011); Partner, Adena Ventures, LP (July 1999-December 2010); Director, The Victory Funds (February 2005-July 2008). | | | 90 | | | Director of Cincinnati Bell Inc. and Member, Audit Committee and Compensation Committee; Director of Northern Kentucky University Foundation and Member, Investment Committee; Member of Chase College of Law Transactional Law Practice Center Board of Advisors; Director of Best Transport; Director of Chase College of Law Board of Visitors; formerly, Member, University of Cincinnati Foundation Investment Committee; Member, Miami University Board of Visitors (2008-2011); Trustee of Victory Funds (2005-2008) and Chairman, Investment Committee (2007-2008) and Member, Service Provider Committee (2005-2008). | |
Dr. Manuel H. Johnson (68)
c/o Johnson Smick
International, Inc.
220 I Street, NE — Suite 200
Washington, D.C. 20002 | | Director | | Since
July
1991 | | Senior Partner, Johnson Smick International, Inc. (consulting firm); Chairperson of the Investment Committee (since October 2006) and Director or Trustee of various Morgan Stanley Funds (since July 1991); Co-Chairman and a founder of the Group of Seven Council (G7C) (international economic commission); formerly, Chairperson of the Audit Committee (July 1991-September 2006), Vice Chairman of the Board of Governors of the Federal Reserve System and Assistant Secretary of the U.S. Treasury. | | | 88 | | | Director of NVR, Inc. (home construction). | |
Joseph J. Kearns (75)
c/o Kearns & Associates LLC
46 E Peninsula Center #385
Rolling Hills Estates, CA 90274-3712 | | Director | | Since
August
1994 | | Senior Adviser, Kearns & Associates LLC (investment consulting); Chairperson of the Audit Committee (since October 2006) and Director or Trustee of various Morgan Stanley Funds (since August 1994); formerly, Deputy Chairperson of the Audit Committee (July 2003-September 2006) and Chairperson of the Audit Committee of various Morgan Stanley Funds (since August 1994); CFO of the J. Paul Getty Trust. | | | 89 | | | Prior to August 10, 2016, Director of Electro Rent Corporation (equipment leasing); Prior to December 31, 2013, Director of The Ford Family Foundation. | |
32
Morgan Stanley Institutional Fund, Inc.
Annual Report — December 31, 2017
Director and Officer Information (unaudited) (cont'd)
Independent Directors: (cont'd)
Name, Age and Address of
Independent Director | | Position(s)
Held with
Registrant | | Length of Time
Served* | | Principal Occupation(s) During Past 5 Years
and Other Relevant Professional Experience | | Number of
Portfolios in
Fund Complex
Overseen by
Independent
Director** | | Other Directorships
Held by Independent
Director*** | |
Michael F. Klein (59)
c/o Perkins Coie LLP
Counsel to the Independent Directors
30 Rockefeller Plaza
New York, NY 10112 | | Director | | Since
August
2006 | | Managing Director, Aetos Capital, LLC (since March 2000); Co-President, Aetos Alternatives Management, LLC (since January 2004) and Co-Chief Executive Officer of Aetos Capital LLC (since August 2013); Chairperson of the Fixed Income Sub-Committee of the Investment Committee (since October 2006) and Director or Trustee of various Morgan Stanley Funds (since August 2006); formerly, Managing Director, Morgan Stanley & Co. Inc. and Morgan Stanley Dean Witter Investment Management, President, various Morgan Stanley Funds (June 1998-March 2000) and Principal, Morgan Stanley & Co. Inc. and Morgan Stanley Dean Witter Investment Management (August 1997-December 1999). | | | 88 | | | Director of certain investment funds managed or sponsored by Aetos Capital, LLC; Director of Sanitized AG and Sanitized Marketing AG (specialty chemicals). | |
Patricia Maleski (57)
c/o Perkins Coie LLP
Counsel to the Independent Directors
30 Rockefeller Plaza
New York, NY 10112 | | Director | | Since
January
2017 | | Managing Director, JPMorgan Asset Management (2004-2016); Oversight and Control Head of Fiduciary and Conflicts of Interest Program (2015-2016); Chief Control Officer-Global Asset Management (2013-2015); President, JPMorgan Funds (2010-2013); Chief Administrative Officer (2004-2013); various other positions including Treasurer and Board Liaison (since 2001). | | | 90 | | | None. | |
Michael E. Nugent (81)
522 Fifth Avenue
New York, NY 10036 | | Chair of the Board and Director | | Chair of the Boards since July 2006 and Director since July 1991 | | Chair of the Boards of various Morgan Stanley Funds (since July 2006); Chairperson of the Closed-End Fund Committee (since June 2012) and Director or Trustee of various Morgan Stanley Funds (since July 1991); formerly, Chairperson of the Insurance Committee (until July 2006); General Partner, Triumph Capital, L.P. (private investment partnership) (1988-2013). | | | 88 | | | None. | |
W. Allen Reed (70)
c/o Perkins Coie LLP
Counsel to the Independent Directors
30 Rockefeller Plaza
New York, NY 10112 | | Director | | Since
August
2006 | | Chairperson of the Equity Sub-Committee of the Investment Committee (since October 2006) and Director or Trustee of various Morgan Stanley Funds (since August 2006); formerly, President and CEO of General Motors Asset Management; Chairman and Chief Executive Officer of the GM Trust Bank and Corporate Vice President of General Motors Corporation (August 1994-December 2005). | | | 89 | | | Director of Legg Mason, Inc.; formerly, Director of the Auburn University Foundation (2010-2015). | |
Fergus Reid (85)
c/o Joe Pietryka, Inc.
85 Charles Colman Blvd.
Pawling, NY 12564 | | Director | | Since
June
1992 | | Chairman, Joe Pietryka, Inc.; Chairperson of the Governance Committee and Director or Trustee of various Morgan Stanley Funds (since June 1992). | | | 89 | | | Formerly, Trustee and Director of certain investment companies in the JP Morgan Fund Complex managed by JP Morgan Investment Management Inc. (1987-2012). | |
* This is the earliest date the Director began serving the Morgan Stanley Funds. Each Director serves an indefinite term, until his or her successor is elected.
** The Fund Complex includes (as of December 31, 2017) all open-end and closed-end funds (including all of their portfolios) advised by Morgan Stanley Investment Management Inc. (the "Adviser") and any funds that have an adviser that is an affiliated person of the Adviser (including, but not limited to, Morgan Stanley AIP GP LP).
*** This includes any directorships at public companies and registered investment companies held by the Director at any time during the past five years.
33
Morgan Stanley Institutional Fund, Inc.
Annual Report — December 31, 2017
Director and Officer Information (unaudited) (cont'd)
Executive Officers:
Name, Age and Address of Executive Officer | | Position(s) Held
with
Registrant | | Length of Time
Served* | | Principal Occupation(s) During Past 5 Years | |
John H. Gernon (54)
522 Fifth Avenue
New York, NY 10036 | | President and Principal Executive Officer | | Since
September
2013 | | President and Principal Executive Officer of the Equity and Fixed Income Funds and the Morgan Stanley AIP Funds (since September 2013) and the Liquidity Funds and various money market funds (since May 2014) in the Fund Complex; Managing Director of the Adviser; Head of Product (since 2006). | |
Timothy J. Knierim (58)
522 Fifth Avenue
New York, NY 10036 | | Chief Compliance Officer | | Since
December
2016 | | Managing Director of the Adviser and various entities affiliated with the Adviser; Chief Compliance Officer of various Morgan Stanley Funds and the Adviser (since December 2016) and Chief Compliance Officer of Morgan Stanley AIP GP LP (since 2014). Formerly, Managing Director and Deputy Chief Compliance Officer of the Adviser (2014-2016); and formerly, Chief Compliance Officer of Prudential Investment Management, Inc. (2007-2014). | |
Francis J. Smith (52)
522 Fifth Avenue
New York, NY 10036 | | Treasurer and Principal Financial Officer | | Treasurer since July 2003 and Principal Financial Officer since September 2002 | | Managing Director of the Adviser and various entities affiliated with the Adviser; Treasurer (since July 2003) and Principal Financial Officer of various Morgan Stanley Funds (since September 2002). | |
Mary E. Mullin (50)
522 Fifth Avenue
New York, NY 10036 | | Secretary | | Since
June
1999 | | Managing Director of the Adviser; Secretary of various Morgan Stanley Funds (since June 1999). | |
Michael J. Key (38)
522 Fifth Avenue
New York, NY 10036 | | Vice President | | Since
June
2017 | | Vice President of the Equity and Fixed Income Funds, Liquidity Funds, various money market funds and the Morgan Stanley AIP Funds in the Fund Complex (since June 2017); Executive Director of the Adviser; Head of Product Development for Equity and Fixed Income Funds (since August 2013). | |
* This is the earliest date the officer began serving the Morgan Stanley Funds. Each officer serves a one-year term, until his or her successor is elected and qualifies.
34
Morgan Stanley Institutional Fund, Inc.
Annual Report — December 31, 2017
Adviser and Administrator
Morgan Stanley Investment Management Inc.
522 Fifth Avenue
New York, New York 10036
Distributor
Morgan Stanley Distribution, Inc.
522 Fifth Avenue
New York, New York 10036
Dividend Disbursing and Transfer Agent
DST Asset Manager Solutions, Inc.
2000 Crown Colony Drive
Quincy, Massachusetts 02169
Custodian
State Street Bank and Trust Company
One Lincoln Street
Boston, Massachusetts 02111
Legal Counsel
Dechert LLP
1095 Avenue of the Americas
New York, New York 10036
Counsel to the Independent Directors
Perkins Coie LLP
30 Rockefeller Plaza
New York, New York 10112
Independent Registered Public Accounting Firm
Ernst & Young LLP
200 Clarendon Street
Boston, Massachusetts 02116
Reporting to Shareholders
Each Morgan Stanley Fund provides a complete schedule of portfolio holdings in its semi-annual and annual reports within 60 days of the end of the fund's second and fourth fiscal quarters. The semi-annual and annual reports are filed electronically with the Securities and Exchange Commission (SEC) on Form N-CSRS and Form N-CSR, respectively. Morgan Stanley also delivers the semi-annual and annual reports to fund shareholders and makes these reports available on its public website, www.morganstanley.com/im. Each Morgan Stanley fund also files a complete schedule of portfolio holdings with the SEC for the fund's first and third fiscal quarters on Form N-Q. Morgan Stanley does not deliver the reports for the first and third fiscal quarters to shareholders, nor are the reports posted to the Morgan Stanley public website. You may, however, obtain the Form N-Q filings (as well as the Form N-CSR and N-CSRS filings) by accessing the SEC's website, www.sec.gov. You may also review and copy them at the SEC's Public Reference Room in Washington, DC. Information on the operation of the SEC's Public Reference Room may be obtained by calling the SEC toll free at 1 (800) SEC-0330. You can also request copies of these materials, upon payment of a duplicating fee, by electronic request at the SEC's email address (publicinfo@sec.gov) or by writing to the SEC's Public Reference Section, Washington, D.C. 20549-1520.
Proxy Voting Policies and Procedures and Proxy Voting Record
You may obtain a copy of the Company's Proxy Voting Policy and Procedures and information regarding how the Company voted proxies relating to portfolio securities during the most recent twelve-month period ended June 30, without charge, upon request, by calling toll free 1 (800) 548-7786 or by visiting our website at www.morganstanley.com/im. This information is also available on the SEC's website at www.sec.gov.
This report is authorized for distribution only when preceded or accompanied by a prospectus or summary prospectus of the applicable Fund of Morgan Stanley Institutional Fund, Inc., which describes in detail the Fund's investment policies, risks, fees and expenses. Please read the prospectus carefully before you invest or send money. For additional information, including information regarding the investments comprising the Fund, please visit our website at www.morganstanley.com/im or call toll free 1 (800) 548-7786.
35
Printed in U.S.A.
This Report has been prepared for shareholders and may be distributed to others only if preceded or accompanied by a current prospectus.
Morgan Stanley Investment Management Inc.
522 Fifth Avenue
New York, New York 10036
© 2018 Morgan Stanley. Morgan Stanley Distribution, Inc.

IFIEMBONANN
2007359 EXP. 02.28.19

Morgan Stanley Institutional Fund, Inc.
Emerging Markets Fixed Income Opportunities Portfolio
Annual Report
December 31, 2017

Morgan Stanley Institutional Fund, Inc.
Annual Report — December 31, 2017
Shareholders' Letter | | | 2 | | |
Expense Example | | | 3 | | |
Investment Overview | | | 4 | | |
Portfolio of Investments | | | 7 | | |
Statement of Assets and Liabilities | | | 12 | | |
Statement of Operations | | | 14 | | |
Statements of Changes in Net Assets | | | 15 | | |
Financial Highlights | | | 17 | | |
Notes to Financial Statements | | | 22 | | |
Report of Independent Registered Public Accounting Firm | | | 32 | | |
Privacy Notice | | | 33 | | |
Director and Officer Information | | | 36 | | |
This report is authorized for distribution only when preceded or accompanied by a prospectus or summary prospectus of the applicable Fund of Morgan Stanley Institutional Fund, Inc. To receive a prospectus and/or statement of additional information (SAI), which contains more complete information such as investment objectives, charges, expenses, policies for voting proxies, risk considerations, and describes in detail each of the Fund's investment policies to the prospective investor, please call toll free 1 (800) 548-7786. Please read the prospectuses carefully before you invest or send money.
Additionally, you can access information about the Fund, including performance, characteristics, and investment team commentary, through Morgan Stanley Investment Management's website: www.morganstanley.com/im.
Market forecasts provided in this report may not necessarily come to pass. There is no guarantee that any sectors mentioned will continue to perform as discussed herein or that securities in such sectors will be held by the Fund in the future. There is no assurance that a fund will achieve its investment objective. Funds are subject to market risk, which is the possibility that market values of securities owned by the Fund will decline and, therefore, the value of the Fund's shares may be less than what you paid for them. Accordingly, you can lose money investing in this Fund. Please see the prospectus for more complete information on investment risks.
1
Morgan Stanley Institutional Fund, Inc.
Annual Report — December 31, 2017
Shareholders' Letter (unaudited)
Dear Shareholders,
We are pleased to provide this Annual report, in which you will learn how your investment in Emerging Markets Fixed Income Opportunities Portfolio (the "Fund") performed during the latest twelve-month period.
Morgan Stanley Investment Management is a client-centric, investor-led organization. Our global presence, intellectual capital, and breadth of products and services enable us to partner with investors to meet the evolving challenges of today's financial markets. We aim to deliver superior investment service and to empower our clients to make the informed decisions that help them reach their investment goals.
As always, we thank you for selecting Morgan Stanley Investment Management, and look forward to working with you in the months and years ahead.
Sincerely,

John H. Gernon
President and Principal Executive Officer
January 2018
2
Morgan Stanley Institutional Fund, Inc.
Annual Report — December 31, 2017
Expense Example (unaudited)
Emerging Markets Fixed Income Opportunities Portfolio
As a shareholder of the Fund, you incur two types of costs: (1) transactional costs, including redemption fees; and (2) ongoing costs, which may include advisory fees, administration fees, distribution and shareholder services fees and other Fund expenses. This example is intended to help you understand your ongoing costs (in dollars) of investing in the Fund and to compare these costs with the ongoing costs of investing in other mutual funds.
This example is based on an investment of $1,000 invested at the beginning of the six-month period ended December 31, 2017 and held for the entire six-month period.
Actual Expenses
The table below provides information about actual account values and actual expenses. You may use the information in this table, together with the amount you invested, to estimate the expenses that you paid over the period. Simply divide your account value by $1,000 (for example, an $8,600 account value divided by $1,000 = 8.6), then multiply the result by the number in the table under the heading entitled "Actual Expenses Paid During Period" to estimate the expenses you paid on your account during this period.
Hypothetical Example for Comparison Purposes
The table below provides information about hypothetical account values and hypothetical expenses based on the Fund's actual expense ratio and an assumed rate of return of 5% per year before expenses, which is not the Fund's actual return. The hypothetical account values and expenses may not be used to estimate the actual ending account balance or expenses you paid for the period. You may use this information to compare the ongoing costs of investing in the Fund and other funds. To do so, compare this 5% hypothetical example with the 5% hypothetical examples that appear in the shareholder reports of the other funds.
Please note that the expenses shown in the table are meant to highlight your ongoing costs only and do not reflect any transactional costs, such as sales charges (loads) and redemption fees. Therefore, the information for each class in the table is useful in comparing ongoing costs only, and will not help you determine the relative total costs of owning different funds. In addition, if these transactional costs were included, your costs would have been higher.
| | | Beginning
Account
Value
7/1/17 | | Actual Ending
Account
Value
12/31/17 | | Hypothetical
Ending Account
Value | | Actual
Expenses
Paid
During
Period* | | Hypothetical
Expenses Paid
During Period* | | Net
Expense
Ratio
During
Period** | |
Emerging Markets Fixed Income Opportunities Portfolio Class I | | $ | 1,000.00 | | | $ | 1,047.10 | | | $ | 1,021.02 | | | $ | 4.28 | | | $ | 4.23 | | | | 0.83 | % | |
Emerging Markets Fixed Income Opportunities Portfolio Class A | | | 1,000.00 | | | | 1,045.40 | | | | 1,019.21 | | | | 6.14 | | | | 6.06 | | | | 1.19 | | |
Emerging Markets Fixed Income Opportunities Portfolio Class L | | | 1,000.00 | | | | 1,044.50 | | | | 1,017.95 | | | | 7.42 | | | | 7.32 | | | | 1.44 | | |
Emerging Markets Fixed Income Opportunities Portfolio Class C | | | 1,000.00 | | | | 1,042.00 | | | | 1,015.43 | | | | 9.99 | | | | 9.86 | | | | 1.94 | | |
Emerging Markets Fixed Income Opportunities Portfolio Class IS | | | 1,000.00 | | | | 1,046.10 | | | | 1,021.12 | | | | 4.18 | | | | 4.13 | | | | 0.81 | | |
* Expenses are calculated using each Fund Class' annualized net expense ratio (as disclosed), multiplied by the average account value over the period, and multiplied by 184/365 (to reflect the most recent one-half year period).
** Annualized.
3
Morgan Stanley Institutional Fund, Inc.
Annual Report — December 31, 2017
Investment Overview (unaudited)
Emerging Markets Fixed Income Opportunities Portfolio
The Fund seeks high total return.
Performance
For the year ended December 31, 2017, the Fund's Class I shares had a total return based on net asset value and reinvestment of distributions per share of 12.94%, net of fees. The Fund's Class I shares outperformed the Fund's benchmark, the Emerging Markets Fixed Income Blend Index (the "Index"), which for the year ended December 31, 2017 was composed of one-third J.P. Morgan Emerging Markets Bond Global Index (returned 9.32%), one-third J.P. Morgan GBI-EM Global Diversified Index (returned 15.21%) and one-third J.P. Morgan CEMBI Broad Diversified Index (returned 7.96%), which returned 10.82%.
Factors Affecting Performance
• Emerging market (EM) fixed income debt returned 10.82% in 2017, as measured by the Index. Sovereign debt outperformed corporate debt during the year, while EM currencies appreciated 6.30% versus the U.S. dollar, and domestic bonds return 8.91% in local terms (as measured by the JP Morgan GBI-EM Global Diversified Index).(i)
• With the close of 2017, EM fixed income assets capped two consecutive years of above-average performance as markets digested the well-anticipated U.S. Federal Reserve ("Fed") rate hikes with the support of sustained global economic expansion, rebounding commodity prices, and continued easy financial conditions. The U.S. Treasury curve flattened in the year as 10-year yields rose 7 basis points ("bps") after touching lows of 2.04% and highs of 2.63%, while yields on the 5-year segment rose 27 bps in the year.(ii) Prices for energy and many hard commodities continued to strengthen in the year, sustaining a rally that began early in 2015, mitigating the impact from the downturn which started in 2013. Investors set a new record by adding over $109 billion to the EM fixed income asset class, outpacing the $103 billion added in 2012.(iii) Despite the strong run and the outlook for a more challenging global liquidity backdrop, fundamentals in emerging markets have improved, supporting valuations, and the prospects for continued synchronized global economic and trade
growth could lend further support to EM fixed income assets.
• While financial market volatility for the year was one of the lowest on record, political volatility remained elevated with tensions rising, most notably in the Middle East and Asia. The election of Donald Trump to the U.S. presidency triggered a range of concerns, including the possibility of changes to the North American Free Trade Agreement (NAFTA) and the subsequent impact on the Mexican economy. Tensions on the Korean peninsula boiled as North Korea's government conducted repeated missile tests and bellicose rhetoric between North Korea and the U.S. escalated. Additional pressure was applied to North Korea in the form of U.N. sanctions targeting economic activity not directly related to nuclear proliferation. In the Middle East, tensions flared between Qatar and four Arab nations (Saudi Arabia, Egypt, United Arab Emirates, and Bahrain), who moved to physically and politically isolate their smallest neighbor. The "group of four" accused Qatar of supporting terror groups and maintaining close relations with Iran. Qatar is of economic and strategic importance as it hosts roughly 10,000 American troops and is the world's biggest exporter of liquefied natural gas. The U.S. government also passed sanctions on Russia and Venezuela following allegations of Russian interference in the U.S. presidential election and Venezuela's repression of political opposition. Russian sanctions prompted a response by the Russian government, which ordered the expulsion of U.S. embassy staff, as well as rebukes from European allies over the potential impact to their energy security and economic interests. The U.S. administration announced additional sanctions on the Venezuelan government, which, among other restrictions, bar U.S. financial firms from dealing in new debt issuance by the Venezuelan government and by state-owned oil company Petroleos de Venezuela S.A., known as PDVSA (as of December 31, 2017, the portfolio owned PDVSA-issued bonds). However, trading in most of the existing outstanding debt is still permitted. Venezuelan assets also suffered after the government announced it would seek a debt restructuring.
(i) Source: JP Morgan
(ii) Source: Bloomberg L.P. Data as of December 31, 2017
(iii) Source: JP Morgan, EPFR Global. Data as of December 31, 2017
4
Morgan Stanley Institutional Fund, Inc.
Annual Report — December 31, 2017
Investment Overview (unaudited) (cont'd)
Emerging Markets Fixed Income Opportunities Portfolio
• For the year, positioning across domestic, external, and corporate investments was beneficial to performance. Domestic debt investments contributed the most, particularly in Poland, Indonesia, Russia, Mexico, Hungary, and Brazil. Exposure to provincial debt in Argentina was also one of the top contributors to performance, as were corporate debt investments in Brazil, Jamaica, Nigeria, Colombia, and Indonesia. Finally, dollar-denominated (external) sovereign debt holdings in Mexico, Nigeria, Mongolia, Ukraine, Ghana, and Ecuador were among the top contributors to performance.
• Conversely, holdings in Venezuela and Hong Kong detracted from performance, Currency hedges (short forward positions) in China, Europe, and Singapore, and core rate hedges (short bund futures) in Germany also detracted from performance.
Management Strategies
• From a fundamental perspective, EM economies, in aggregate, have continued to improve. The emerging markets/developed markets growth differential appears to be increasing in favor of EM as the negative growth impacts from Brazil and Russia improve. China's growth slowdown is likely to continue in the medium term, as the government emphasizes the quality of growth over rapidity. Volatility has remained low as investor concerns have been offset by global central bank liquidity and an improved outlook for global growth, despite U.S. Fed rate hikes and balance sheet reduction. This positive fundamental outlook could be threatened by a variety of factors including a sharp return of volatility, resurgence in inflation expectations, monetary policy missteps or a flare-up in geopolitical tensions. De-globalization risks may intensify as NAFTA renegotiation talks continue into 2018, but we remain constructive on the final outcome. A U.S. withdrawal from the agreement would be economically self-defeating, causing severe disruptions in the existing value chains of key U.S. industries. Moreover, the political gain from exiting NAFTA does not appear to be clear-cut, since there are segments of the president's support base that stand to lose significantly from such a decision (for example, states with strong agricultural sectors).
• We remain optimistic about the prospects for EM fixed income for 2018 as country fundamentals and the macroeconomic environment remain supportive. The various factors both pushing and pulling investors into EM fixed income remain in place: developed market yields remain very low, economic data in EM is improving, Fed rate hikes are likely to remain gradual, U.S. protectionist inclinations may have diminished and concerns of a sharp slowdown in China have eased. We believe that EM assets should be able to weather Fed rate hikes if driven by increasing U.S. growth and not inflation; however, assets remain vulnerable to spikes in U.S. policy uncertainty from undue Fed hawkishness or Chinese policy tightening triggering a sharper-than-expected growth downturn. We are also cognizant of potential geopolitical risks, which may flare up and trigger spikes in volatility. However, we anticipate such events will be transitory and idiosyncratic to specific countries, rather than systemic.
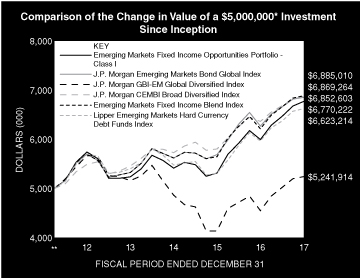
* Minimum Investment for Class I shares
** Commenced Operations on May 24, 2012.
In accordance with SEC regulations, the Fund's performance shown assumes that all recurring fees (including management fees) were deducted and all dividends and distributions were reinvested. The performance of Class A, L, C and IS shares will vary from the performance of Class I shares based upon their different inception dates and will be impacted by additional fees assessed to those classes (if applicable).
5
Morgan Stanley Institutional Fund, Inc.
Annual Report — December 31, 2017
Investment Overview (unaudited) (cont'd)
Emerging Markets Fixed Income Opportunities Portfolio
Performance Compared to the J.P. Morgan Emerging Markets Bond Global Index(1), the J.P. Morgan GBI-EM Global Diversified Index(2), the J.P. Morgan CEMBI Broad Diversified Index(3), the Emerging Markets Fixed Income Blend Index(4) and the Lipper Emerging Markets Hard Currency Debt Funds Index(5)
| | Period Ended December 31, 2017
Total Returns(6) | |
| | | | Average Annual | |
| | One
Year | | Five
Years | | Ten
Years | | Since
Inception(10) | |
Fund — Class I Shares
w/o sales charges(7) | | | 12.94 | % | | | 3.35 | % | | | — | | | | 5.56 | % | |
Fund — Class A Shares
w/o sales charges(7) | | | 12.54 | | | | 3.01 | | | | — | | | | 5.22 | | |
Fund — Class A Shares with
maximum 4.25% sales charges(7) | | | 7.78 | | | | 2.12 | | | | — | | | | 4.41 | | |
Fund — Class L Shares
w/o sales charges(7) | | | 12.28 | | | | 2.72 | | | | — | | | | 4.90 | | |
Fund — Class C Shares
w/o sales charges(9) | | | 11.76 | | | | — | | | | — | | | | 5.73 | | |
Fund — Class C Shares with
maximum 1.00% deferred
sales charges(9) | | | 10.76 | | | | — | | | | — | | | | 5.73 | | |
Fund — Class IS Shares
w/o sales charges(8) | | | 12.95 | | | | — | | | | — | | | | 6.64 | | |
J.P. Morgan Emerging Markets
Bond Global Index | | | 9.32 | | | | 3.75 | | | | — | | | | 5.78 | | |
J.P. Morgan GBI-EM Global
Diversified Index | | | 15.21 | | | | –1.55 | | | | — | | | | 0.85 | | |
J.P. Morgan CEMBI Broad
Diversified Index | | | 7.96 | | | | 4.58 | | | | — | | | | 5.83 | | |
Emerging Markets Fixed Income
Blend Index | | | 10.82 | | | | 3.85 | | | | — | | | | 5.87 | | |
Lipper Emerging Market
Hard Currency Debt Funds Index | | | 11.10 | | | | 3.05 | | | | — | | | | 5.15 | | |
Performance data quoted represents past performance, which is no guarantee of future results, and current performance may be lower or higher than the figures shown. Performance assumes that all dividends and distributions, if any, were reinvested. For the most recent month-end performance figures, please visit www.morganstanley.com/im. Investment return and principal value will fluctuate so that Fund shares, when redeemed, may be worth more or less than their original cost. Total returns do not reflect the deduction of taxes that a shareholder would pay on Fund distributions or the redemption of Fund shares. Performance of share classes will vary due to difference in sales charges and expenses.
(1) The J.P. Morgan Emerging Markets Bond Global Index (EMBI Global Index) tracks total returns for U.S. dollar-denominated debt instruments issued by emerging markets sovereign and quasi-sovereign entities: Brady Bonds, loans, Eurobonds and local market instruments for emerging market countries. The Index is unmanaged and its returns do not include any sales charges or fees. Such costs would lower performance. It is not possible to invest directly in an index.
(2) The J.P. Morgan Government Bond Index-Emerging Markets Global Diversified Index (GBI-EM Global Diversified Index) tracks local currency government bonds issued by emerging markets. The Index is unmanaged and its returns do not include any sales charges or fees. Such costs would lower performance. It is not possible to invest directly in an index.
(3) The J.P. Morgan Corportate Emerging Markets Bond Index Broad Diversified (CEMBI Broad Diversified Index) which tracks performance of corportate issued debt instruments issued by emerging markets. The Index is unmanaged and its returns do not include any sales charges or fees. Such costs would lower performance. It is not possible to invest directly in an index.
(4) The Emerging Markets Fixed Income Blend Index is a performance linked benchmark of the old and new benchmark of the Fund, the old represented by J.P. Morgan Emerging Markets Bond Global Index (EMBI Global Index) for period from the Fund's inception to September 25, 2015 and the new Blended Index which consists of 1/3 J.P. Morgan EMBI Global Index, 1/3 J.P. Morgan GBI-EM Global Diversified Index, 1/3 J.P. Morgan CEMBI Broad Diversified Index for periods thereafter. The Index is unmanaged and its returns do not include any sales charges or fees. Such costs would lower performance. It is not possible to invest directly in an index.
(5) The Lipper Emerging Market Hard Currency Debt Funds Index is an equally weighted performance index of the largest qualifying funds (based on net assets) in the Lipper Emerging Market Hard Currency Debt Funds classification. The Index, which is adjusted for capital gains distributions and income dividends, is unmanaged and should not be considered an investment. There are currently 30 funds represented in this Index. As of the date of this report, the Fund is in the Lipper Emerging Market Hard Currency Debt Funds classification.
(6) Total returns for the Fund reflect fees waived and expenses reimbursed, if applicable, by the Adviser. Without such waivers and reimbursements, total returns would have been lower.
(7) Commenced operations on May 24, 2012.
(8) Commenced offering on September 13, 2013.
(9) Commenced offering on April 30, 2015.
(10) For comparative purposes, average annual since inception returns listed for the Indexes refer to the inception date of Class I of the Fund, not the inception of the Index.
6
Morgan Stanley Institutional Fund, Inc.
Annual Report — December 31, 2017
Portfolio of Investments
Emerging Markets Fixed Income Opportunities Portfolio
| | | Face
Amount
(000) | | Value
(000) | |
Fixed Income Securities (93.7%) | |
Argentina (8.4%) | |
Corporate Bonds (7.1%) | |
Banco Macro SA, | |
17.50%, 5/8/22 (a) | | ARS | 1,080 | | | $ | 54 | | |
Provincia de Buenos Aires, | |
7.88%, 6/15/27 | | $ | 170 | | | | 189 | | |
BADLAR + 3.83%, 26.96%, 5/31/22 (b) | | ARS | 4,540 | | | | 247 | | |
Provincia de Cordoba, | |
7.45%, 9/1/24 (a) | | $ | 170 | | | | 186 | | |
Provincia de Entre Rios Argentina, | |
8.75%, 2/8/25 (a) | | | 230 | | | | 248 | | |
Provincia de Mendoza Argentina, | |
BADLAR + 4.38%, 27.50%, 6/9/21 (b) | | ARS | 3,570 | | | | 184 | | |
Provincia de Rio Negro, | |
7.75%, 12/7/25 (a) | | $ | 150 | | | | 152 | | |
Provincia del Chaco Argentina, | |
9.38%, 8/18/24 (a) | | | 240 | | | | 254 | | |
YPF SA, | |
6.95%, 7/21/27 (a) | | | 195 | | | | 208 | | |
7.00%, 12/15/47 (a) | | | 80 | | | | 79 | | |
| | | | 1,801 | | |
Sovereign (1.3%) | |
Aeropuertos Argentina 2000 SA, | |
6.88%, 2/1/27 (a) | | | 180 | | | | 195 | | |
Argentine Bonos del Tesoro, | |
18.20%, 10/3/21 | | ARS | 634 | | | | 35 | | |
Argentine Republic Government
International Bond, | |
7.13%, 6/28/99 (a) | | $ | 100 | | | | 103 | | |
| | | | 333 | | |
| | | | 2,134 | | |
Brazil (7.9%) | |
Corporate Bonds (3.7%) | |
Braskem Netherlands Finance BV, | |
4.50%, 1/10/28 (a) | | | 310 | | | | 305 | | |
Cosan Luxembourg SA, | |
7.00%, 1/20/27 (a) | | | 240 | | | | 259 | | |
Minerva Luxembourg SA, | |
5.88%, 1/19/28 (a) | | | 200 | | | | 195 | | |
Petrobras Global Finance BV, | |
6.00%, 1/27/28 (a) | | | 100 | | | | 101 | | |
6.13%, 1/17/22 | | | 66 | | | | 70 | | |
| | | | 930 | | |
Sovereign (4.2%) | |
Brazil Notas do Tesouro Nacional, Series F, | |
10.00%, 1/1/21 - 1/1/23 | | BRL | 3,590 | | | | 1,062 | | |
| | | | 1,992 | | |
Chile (1.6%) | |
Corporate Bonds (1.6%) | |
Geopark Ltd., | |
6.50%, 9/21/24 (a) | | $ | 200 | | | | 206 | | |
| | | Face
Amount
(000) | | Value
(000) | |
Latam Finance Ltd., | |
6.88%, 4/11/24 (a) | | $ | 200 | | | $ | 209 | | |
| | | | 415 | | |
Colombia (4.9%) | |
Corporate Bond (2.0%) | |
Millicom International Cellular SA, | |
6.00%, 3/15/25 | | | 485 | | | | 517 | | |
Sovereign (2.9%) | |
Colombia Government International Bond, | |
5.00%, 6/15/45 | | | 266 | | | | 282 | | |
Colombian TES, | |
7.00%, 5/4/22 | | COP | 302,700 | | | | 107 | | |
7.75%, 9/18/30 | | | 30,000 | | | | 11 | | |
10.00%, 7/24/24 | | | 847,300 | | | | 343 | | |
| | | | 743 | | |
| | | | 1,260 | | |
Dominican Republic (1.4%) | |
Corporate Bond (0.9%) | |
AES Andres BV/Dominican Power Partners/
Empresa Generadora de Electricidad It,
(Units) | |
7.95%, 5/11/26 (a)(c) | | $ | 200 | | | | 217 | | |
Sovereign (0.5%) | |
Dominican Republic International Bond, | |
6.88%, 1/29/26 (a) | | | 100 | | | | 114 | | |
| | | | 331 | | |
Ecuador (0.9%) | |
Sovereign (0.9%) | |
Ecuador Government International Bond, | |
8.88%, 10/23/27 (a) | | | 210 | | | | 232 | | |
Egypt (0.8%) | |
Sovereign (0.8%) | |
Egypt Government International Bond, | |
6.13%, 1/31/22 (a) | | | 200 | | | | 210 | | |
El Salvador (0.4%) | |
Sovereign (0.4%) | |
El Salvador Government International Bond, | |
8.63%, 2/28/29 (a) | | | 80 | | | | 94 | | |
Georgia (0.8%) | |
Corporate Bond (0.8%) | |
Bank of Georgia JSC, | |
11.00%, 6/1/20 (a) | | GEL | 500 | | | | 195 | | |
Ghana (1.1%) | |
Sovereign (1.1%) | |
Ghana Government International Bond, | |
10.75%, 10/14/30 | | $ | 200 | | | | 276 | | |
Guatemala (0.8%) | |
Sovereign (0.8%) | |
Guatemala Government Bond, | |
4.50%, 5/3/26 (a) | | | 200 | | | | 203 | | |
The accompanying notes are an integral part of the financial statements.
7
Morgan Stanley Institutional Fund, Inc.
Annual Report — December 31, 2017
Portfolio of Investments (cont'd)
Emerging Markets Fixed Income Opportunities Portfolio
| | | Face
Amount
(000) | | Value
(000) | |
Honduras (0.6%) | |
Sovereign (0.6%) | |
Honduras Government International Bond, | |
6.25%, 1/19/27 (a) | | $ | 150 | | | $ | 161 | | |
Hungary (2.7%) | |
Sovereign (2.7%) | |
Hungary Government Bond, | |
3.00%, 10/27/27 | | HUF | 160,000 | | | | 675 | | |
5.50%, 6/24/25 | | | 970 | | | | 5 | | |
| | | | 680 | | |
India (0.8%) | |
Corporate Bond (0.8%) | |
Greenko Investment Co., | |
4.88%, 8/16/23 (a) | | $ | 200 | | | | 199 | | |
Indonesia (5.7%) | |
Corporate Bond (1.1%) | |
Jababeka International BV, | |
6.50%, 10/5/23 (a) | | | 260 | | | | 269 | | |
Sovereign (4.6%) | |
Indonesia Treasury Bond, | |
8.75%, 5/15/31 | | IDR | 1,310,000 | | | | 113 | | |
9.00%, 3/15/29 | | | 12,090,000 | | | | 1,056 | | |
| | | | 1,169 | | |
| | | | 1,438 | | |
Iraq (0.8%) | |
Sovereign (0.8%) | |
Iraq International Bond, | |
6.75%, 3/9/23 (a) | | $ | 200 | | | | 205 | | |
Jamaica (2.3%) | |
Corporate Bond (1.8%) | |
Digicel Group Ltd., | |
8.25%, 9/30/20 | | | 460 | | | | 454 | | |
Sovereign (0.5%) | |
Jamaica Government International Bond, | |
8.00%, 3/15/39 | | | 100 | | | | 123 | | |
| | | | 577 | | |
Jordan (0.8%) | |
Sovereign (0.8%) | |
Jordan Government International Bond, | |
7.38%, 10/10/47 (a) | | | 200 | | | | 209 | | |
Kazakhstan (1.1%) | |
Corporate Bond (1.1%) | |
Nostrum Oil & Gas Finance BV, | |
8.00%, 7/25/22 (a) | | | 270 | | | | 281 | | |
Malaysia (2.1%) | |
Sovereign (2.1%) | |
Malaysia Government Bond, | |
3.66%, 10/15/20 | | MYR | 137 | | | | 34 | | |
3.96%, 9/15/25 | | | 1,169 | | | | 287 | | |
4.16%, 7/15/21 | | | 215 | | | | 54 | | |
4.18%, 7/15/24 | | | 124 | | | | 31 | | |
| | | Face
Amount
(000) | | Value
(000) | |
4.23%, 6/30/31 | | MYR | 246 | | | $ | 60 | | |
4.50%, 4/15/30 | | | 249 | | | | 62 | | |
| | | | 528 | | |
Mexico (9.9%) | |
Corporate Bonds (1.8%) | |
Alpha Holding SA de CV, | |
10.00%, 12/19/22 (a) | | $ | 200 | | | | 196 | | |
Financiera Independencia SAB de
CV SOFOM ENR, | |
8.00%, 7/19/24 (a) | | | 250 | | | | 256 | | |
| | | | 452 | | |
Sovereign (8.1%) | |
Mexican Bonos,
Series M | |
6.50%, 6/10/21 | | MXN | 20,951 | | | | 1,030 | | |
8.00%, 6/11/20 - 12/7/23 | | | 7,672 | | | | 394 | | |
10.00%, 12/5/24 | | | 1,388 | | | | 80 | | |
Petroleos Mexicanos, | |
6.50%, 3/13/27 (a) | | $ | 130 | | | | 142 | | |
6.50%, 3/13/27 | | | 270 | | | | 296 | | |
6.75%, 9/21/47 (a) | | | 100 | | | | 105 | | |
| | | | 2,047 | | |
| | | | 2,499 | | |
Mongolia (0.9%) | |
Sovereign (0.9%) | |
Mongolia Government International Bond, | |
8.75%, 3/9/24 (a) | | | 200 | | | | 231 | | |
Nigeria (4.9%) | |
Corporate Bonds (3.2%) | |
Fidelity Bank PLC, | |
10.50%, 10/16/22 (a) | | | 200 | | | | 205 | | |
United Bank for Africa PLC, | |
7.75%, 6/8/22 (a) | | | 340 | | | | 352 | | |
Zenith Bank PLC, | |
6.25%, 4/22/19 | | | 240 | | | | 247 | | |
| | | | 804 | | |
Sovereign (1.7%) | |
Nigeria Government International Bond, | |
6.38%, 7/12/23 | | | 200 | | | | 213 | | |
6.50%, 11/28/27 (a) | | | 200 | | | | 209 | | |
| | | | 422 | | |
| | | | 1,226 | | |
Panama (1.7%) | |
Corporate Bond (0.8%) | |
Multibank, Inc., | |
4.38%, 11/9/22 (a) | | | 200 | | | | 200 | | |
Sovereign (0.9%) | |
Aeropuerto Internacional de Tocumen SA, | |
5.63%, 5/18/36 (a) | | | 200 | | | | 216 | | |
| | | | 416 | | |
The accompanying notes are an integral part of the financial statements.
8
Morgan Stanley Institutional Fund, Inc.
Annual Report — December 31, 2017
Portfolio of Investments (cont'd)
Emerging Markets Fixed Income Opportunities Portfolio
| | | Face
Amount
(000) | | Value
(000) | |
Paraguay (1.7%) | |
Sovereign (1.7%) | |
Paraguay Government International Bond, | |
4.70%, 3/27/27 (a) | | $ | 400 | | | $ | 420 | | |
Peru (1.8%) | |
Sovereign (1.8%) | |
Peru Government Bond, | |
6.15%, 8/12/32 (a) | | PEN | 380 | | | | 125 | | |
Peruvian Government International Bond,
(Units) | |
6.35%, 8/12/28 (c) | | | 569 | | | | 193 | | |
(Units) | |
6.95%, 8/12/31 (c) | | | 364 | | | | 128 | | |
| | | | 446 | | |
Philippines (1.9%) | |
Corporate Bond (1.9%) | |
Petron Corp., | |
7.50%, 8/6/18 (d) | | $ | 480 | | | | 492 | | |
Poland (3.4%) | |
Sovereign (3.4%) | |
Poland Government Bond, | |
3.25%, 7/25/25 | | PLN | 1,584 | | | | 459 | | |
4.00%, 10/25/23 | | | 915 | | | | 280 | | |
5.75%, 10/25/21 - 9/23/22 | | | 400 | | | | 130 | | |
| | | | 869 | | |
Romania (0.5%) | |
Sovereign (0.5%) | |
Romania Government Bond, | |
4.75%, 2/24/25 | | RON | 500 | | | | 133 | | |
Russia (4.5%) | |
Corporate Bond (0.9%) | |
Sibur Securities DAC, | |
4.13%, 10/5/23 (a) | | $ | 220 | | | | 220 | | |
Sovereign (3.6%) | |
Russian Federal Bond — OFZ, | |
6.40%, 5/27/20 | | RUB | 12,325 | | | | 212 | | |
7.00%, 1/25/23 - 8/16/23 | | | 23,641 | | | | 410 | | |
7.60%, 7/20/22 | | | 9,800 | | | | 175 | | |
7.75%, 9/16/26 | | | 5,771 | | | | 103 | | |
| | | | 900 | | |
| | | | 1,120 | | |
Senegal (0.8%) | |
Sovereign (0.8%) | |
Senegal Government International Bond, | |
6.25%, 5/23/33 (a) | | $ | 200 | | | | 212 | | |
South Africa (4.2%) | |
Corporate Bond (0.9%) | |
Stillwater Mining Co., | |
7.13%, 6/27/25 (a) | | | 220 | | | | 229 | | |
| | | Face
Amount
(000) | | Value
(000) | |
Sovereign (3.3%) | |
South Africa Government Bond, | |
6.75%, 3/31/21 | | ZAR | 1,170 | | | $ | 92 | | |
8.00%, 1/31/30 | | | 9,841 | | | | 729 | | |
| | | | 821 | | |
| | | | 1,050 | | |
Tajikistan (1.0%) | |
Sovereign (1.0%) | |
Republic of Tajikistan International Bond, | |
7.13%, 9/14/27 (a) | | $ | 260 | | | | 250 | | |
Tanzania, United Republic of (0.8%) | |
Corporate Bond (0.8%) | |
HTA Group Ltd., | |
9.13%, 3/8/22 (a) | | | 200 | | | | 215 | | |
Thailand (1.3%) | |
Sovereign (1.3%) | |
Thailand Government Bond, | |
3.63%, 6/16/23 | | THB | 4,440 | | | | 148 | | |
4.88%, 6/22/29 | | | 4,500 | | | | 170 | | |
| | | | 318 | | |
Turkey (1.8%) | |
Sovereign (1.8%) | |
Turkey Government Bond, | |
7.10%, 3/8/23 | | TRY | 955 | | | | 207 | | |
8.00%, 3/12/25 | | | 503 | | | | 110 | | |
10.40%, 3/20/24 | | | 290 | | | | 73 | | |
10.60%, 2/11/26 | | | 250 | | | | 63 | | |
| | | | 453 | | |
Ukraine (2.9%) | |
Sovereign (2.9%) | |
Ukraine Government International Bond, | |
7.38%, 9/25/32 (a) | | $ | 200 | | | | 197 | | |
7.75%, 9/1/23 | | | 500 | | | | 532 | | |
| | | | 729 | | |
United Arab Emirates (1.8%) | |
Corporate Bond (1.8%) | |
MAF Global Securities Ltd., | |
7.13%, 10/29/18 (d) | | | 450 | | | | 461 | | |
Uruguay (0.9%) | |
Sovereign (0.9%) | |
Uruguay Government International Bond, | |
8.50%, 3/15/28 (a) | | UYU | 2,880 | | | | 101 | | |
9.88%, 6/20/22 (a) | | | 3,400 | | | | 125 | | |
| | | | 226 | | |
Venezuela (1.1%) | |
Sovereign (1.1%) | |
Petroleos de Venezuela SA, | |
6.00%, 11/15/26 | | $ | 1,222 | | | | 274 | | |
Total Fixed Income Securities (Cost $23,245) | | | 23,660 | | |
The accompanying notes are an integral part of the financial statements.
9
Morgan Stanley Institutional Fund, Inc.
Annual Report — December 31, 2017
Portfolio of Investments (cont'd)
Emerging Markets Fixed Income Opportunities Portfolio
| | | No. of
Warrants | | Value
(000) | |
Warrant (0.0%) | |
Venezuela (0.0%) | |
Venezuela Government International Bond,
Oil-Linked Payment Obligation,
0.00%, expires 4/15/20 (b)(e) (Cost $—) | | | 495 | | | $ | 2 | | |
| | | Shares | | | |
Short-Term Investments (4.0%) | |
Investment Company (0.7%) | |
United States (0.7%) | |
Morgan Stanley Institutional Liquidity
Funds — Treasury Securities Portfolio —
Institutional Class (See Note G) (Cost $173) | | | 173,004 | | | | 173 | | |
| | | Face
Amount
(000) | | | |
Egypt (2.1%) | |
Sovereign (2.1%) | |
Egypt Treasury Bills, | |
17.85%, 3/13/18 | | EGP | 4,825 | | | | 263 | | |
18.15%, 4/3/18 | | | 5,000 | | | | 269 | | |
| | | | 532 | | |
Nigeria (1.1%) | |
Sovereign (1.1%) | |
Nigeria Treasury Bill, | |
22.45%, 8/16/18 | | NGN | 111,000 | | | | 281 | | |
Total Sovereign (Cost $807) | | | 813 | | |
U.S. Treasury Security (0.1%) | |
U.S. Treasury Bill, | |
| 1.19%, 4/26/18 (f) (Cost $30) | | $ | 30 | | | | 30 | | |
Total Short-Term Investments (Cost $1,010) | | | 1,016 | | |
Total Investments (97.7%) (Cost $24,255) (g)(h) | | | 24,678 | | |
| Other Assets in Excess of Liabilities (2.3%) | | | 580 | | |
Net Assets (100.0%) | | $ | 25,258 | | |
Country assignments and aggregations are based generally on third party vendor classifications and information, and may be different from the assignments and aggregations under the policies set forth in the Fund's prospectus and/or statement of additional information relating to geographic classifications.
(a) 144A security — Certain conditions for public sale may exist. Unless otherwise noted, these securities are deemed to be liquid.
(b) Floating or Variable rate securities: The rates disclosed are as of December 31, 2017. For securities based on a published reference rate and spread, the reference rate and spread are indicated in the description in the Portfolio of Investments. Certain variable rate securities may not be based on a published reference rate and spread but are determined by the issuer or agent and are based on current market conditions. These securities do not indicate a reference rate and spread in their description in the Portfolio of Investments.
(c) Consists of one or more classes of securities traded together as a unit.
(d) Perpetual — One or more securities do not have a predetermined maturity date. Rates for these securities are fixed for a period of time, after which they revert to a floating rate. Interest rates in effect are as of December 31, 2017.
(e) Security has been deemed illiquid at December 31, 2017.
(f) Rate shown is the yield to maturity at December 31, 2017.
(g) Securities are available for collateral in connection with open foreign currency forward exchange contracts and futures contract.
(h) At December 31, 2017, the aggregate cost for federal income tax purposes is approximately $24,460,000. The aggregate gross unrealized appreciation is approximately $996,000 and the aggregate gross unrealized depreciation is approximately $756,000, resulting in net unrealized appreciation of approximately $240,000.
BADLAR Buenos Aires Deposits of Large Amount Rate.
CMT Constant Maturity Treasury Note Rate.
OFZ Obilgatsyi Federal'novo Zaima (Russian Federal Loan Obligation).
The accompanying notes are an integral part of the financial statements.
10
Morgan Stanley Institutional Fund, Inc.
Annual Report — December 31, 2017
Portfolio of Investments (cont'd)
Emerging Markets Fixed Income Opportunities Portfolio
Foreign Currency Forward Exchange Contracts:
The Fund had the following foreign currency forward exchange contracts open at December 31, 2017:
Counterparty | | Contracts to
Deliver
(000) | | In Exchange
For
(000) | | Delivery
Date | | Unrealized
Appreciation
(Depreciation)
(000) | |
JPMorgan Chase Bank NA | | BRL | 463 | | | $ | 143 | | | 1/3/18 | | $ | 4 | | |
JPMorgan Chase Bank NA | | BRL | 463 | | | $ | 140 | | | 1/3/18 | | | — | @ | |
JPMorgan Chase Bank NA | | $ | 140 | | | BRL | 463 | | | 1/3/18 | | | — | @ | |
JPMorgan Chase Bank NA | | $ | 140 | | | BRL | 463 | | | 1/3/18 | | | (— | @) | |
JPMorgan Chase Bank NA | | MXN | 15,500 | | | $ | 817 | | | 1/8/18 | | | 29 | | |
JPMorgan Chase Bank NA | | $ | 51 | | | MXN | 1,000 | | | 1/8/18 | | | — | @ | |
JPMorgan Chase Bank NA | | $ | 103 | | | TRY | 400 | | | 1/8/18 | | | 3 | | |
JPMorgan Chase Bank NA | | $ | 78 | | | TRY | 300 | | | 1/8/18 | | | 1 | | |
JPMorgan Chase Bank NA | | HUF | 68,000 | | | $ | 256 | | | 1/16/18 | | | (7 | ) | |
JPMorgan Chase Bank NA | | IDR | 2,000,000 | | | $ | 146 | | | 1/16/18 | | | (1 | ) | |
JPMorgan Chase Bank NA | | $ | 141 | | | CLP | 91,900 | | | 1/16/18 | | | 9 | | |
JPMorgan Chase Bank NA | | $ | 62 | | | CLP | 40,000 | | | 1/16/18 | | | 2 | | |
JPMorgan Chase Bank NA | | $ | 120 | | | COP | 360,000 | | | 1/16/18 | | | 1 | | |
JPMorgan Chase Bank NA | | ZAR | 1,250 | | | $ | 94 | | | 1/16/18 | | | (7 | ) | |
State Street Bank and Trust Co. | | $ | 148 | | | MYR | 600 | | | 1/16/18 | | | 1 | | |
JPMorgan Chase Bank NA | | $ | 131 | | | KZT | 44,000 | | | 1/22/18 | | | 1 | | |
JPMorgan Chase Bank NA | | $ | 317 | | | THB | 10,350 | | | 1/29/18 | | | 1 | | |
JPMorgan Chase Bank NA | | BRL | 463 | | | $ | 139 | | | 2/2/18 | | | (— | @) | |
JPMorgan Chase Bank NA | | $ | 109 | | | RON | 429 | | | 2/13/18 | | | 1 | | |
JPMorgan Chase Bank NA | | NGN | 99,000 | | | $ | 253 | | | 8/20/18 | | | (18 | ) | |
| | | | | | | | | $ | 20 | | |
Futures Contract:
The Fund had the following futures contract open at December 31, 2017:
| | | Number
of
Contracts | | Expiration
Date | | Notional
Amount
(000) | | Value
(000) | | Unrealized
Appreciation
(000) | |
Short: | |
German Euro Bund (Germany) | | | 1 | | | Mar-18 | | | (100 | ) | | $ | (194 | ) | | $ | 2 | | |
@ Value is less than $500.
ARS — Argentine Peso
BRL — Brazilian Real
CLP — Chilean Peso
COP — Colombian Peso
EGP — Egyptian Pound
GEL — Georgian Lari
HUF — Hungarian Forint
IDR — Indonesian Rupiah
KZT — Kazakhstan Tenge
MXN — Mexican Peso
MYR — Malaysian Ringgit
NGN — Nigerian Naira
PEN — Peruvian Nuevo Sol
PLN — Polish Zloty
RON — Romanian New Leu
RUB — Russian Ruble
THB — Thai Baht
TRY — Turkish Lira
UYU — Uruguay Peso
ZAR — South African Rand
Portfolio Composition
Classification | | Percentage of
Total Investments | |
Sovereign | | | 62.0 | % | |
Corporate Bonds | | | 33.9 | | |
Other* | | | 4.1 | | |
Total Investments | | | 100.0 | %** | |
* Industries and/or investment types representing less than 5% of total investments.
** Does not include an open short futures contract with an underlying face amount of approximately $194,000 with unrealized appreciation of approximately $2,000. Does not include open foreign currency forward exchange contracts with net unrealized appreciation of approximately $20,000.
The accompanying notes are an integral part of the financial statements.
11
Morgan Stanley Institutional Fund, Inc.
Annual Report — December 31, 2017
Emerging Markets Fixed Income Opportunities Portfolio
Statement of Assets and Liabilities | | December 31, 2017
(000) | |
Assets: | |
Investments in Securities of Unaffiliated Issuers, at Value (Cost $24,082) | | $ | 24,505 | | |
Investment in Security of Affiliated Issuer, at Value (Cost $173) | | | 173 | | |
Total Investments in Securities, at Value (Cost $24,255) | | | 24,678 | | |
Foreign Currency, at Value (Cost $55) | | | 58 | | |
Interest Receivable | | | 541 | | |
Unrealized Appreciation on Foreign Currency Forward Exchange Contracts | | | 53 | | |
Due from Adviser | | | 42 | | |
Receivable for Variation Margin on Futures Contracts | | | 8 | | |
Tax Reclaim Receivable | | | 2 | | |
Receivable from Affiliate | | | — | @ | |
Other Assets | | | 35 | | |
Total Assets | | | 25,417 | | |
Liabilities: | |
Payable for Professional Fees | | | 61 | | |
Unrealized Depreciation on Foreign Currency Forward Exchange Contracts | | | 33 | | |
Deferred Capital Gain Country Tax | | | 3 | | |
Payable for Custodian Fees | | | 29 | | |
Payable for Directors' Fees and Expenses | | | 9 | | |
Payable for Transfer Agency Fees — Class I | | | 1 | | |
Payable for Transfer Agency Fees — Class A | | | 1 | | |
Payable for Transfer Agency Fees — Class L | | | — | @ | |
Payable for Transfer Agency Fees — Class C | | | 1 | | |
Payable for Transfer Agency Fees — Class IS | | | — | @ | |
Payable for Administration Fees | | | 2 | | |
Payable for Shareholder Services Fees — Class A | | | — | @ | |
Payable for Distribution and Shareholder Services Fees — Class L | | | — | @ | |
Payable for Distribution and Shareholder Services Fees — Class C | | | — | @ | |
Payable for Sub Transfer Agency Fees — Class I | | | — | @ | |
Payable for Sub Transfer Agency Fees — Class A | | | — | @ | |
Payable for Sub Transfer Agency Fees — Class L | | | — | @ | |
Payable for Sub Transfer Agency Fees — Class C | | | — | @ | |
Other Liabilities | | | 19 | | |
Total Liabilities | | | 159 | | |
Net Assets | | $ | 25,258 | | |
Net Assets Consist Of: | |
Paid-in-Capital | | $ | 29,399 | | |
Distributions in Excess of Net Investment Income | | | (62 | ) | |
Accumulated Net Realized Loss | | | (4,527 | ) | |
Unrealized Appreciation (Depreciation) on: | |
Investments (Net of $3 of Deferred Capital Gain Country Tax) | | | 420 | | |
Futures Contracts | | | 2 | | |
Foreign Currency Forward Exchange Contracts | | | 20 | | |
Foreign Currency Translations | | | 6 | | |
Net Assets | | $ | 25,258 | | |
The accompanying notes are an integral part of the financial statements.
12
Morgan Stanley Institutional Fund, Inc.
Annual Report — December 31, 2017
Emerging Markets Fixed Income Opportunities Portfolio
Statement of Assets and Liabilities (cont'd) | | December 31, 2017
(000) | |
CLASS I: | |
Net Assets | | $ | 22,219 | | |
| Shares Outstanding $0.001 par value shares of beneficial interest (unlimited shares authorized) (not in 000's) | | | 2,296,456 | | |
Net Asset Value, Offering and Redemption Price Per Share | | $ | 9.68 | | |
CLASS A: | |
Net Assets | | $ | 1,150 | | |
| Shares Outstanding $0.001 par value shares of beneficial interest (unlimited shares authorized) (not in 000's) | | | 119,004 | | |
Net Asset Value, Redemption Price Per Share | | $ | 9.67 | | |
Maximum Sales Load | | | 4.25 | % | |
Maximum Sales Charge | | $ | 0.43 | | |
Maximum Offering Price Per Share | | $ | 10.10 | | |
CLASS L: | |
Net Assets | | $ | 842 | | |
| Shares Outstanding $0.001 par value shares of beneficial interest (unlimited shares authorized) (not in 000's) | | | 87,204 | | |
Net Asset Value, Offering and Redemption Price Per Share | | $ | 9.65 | | |
CLASS C: | |
Net Assets | | $ | 284 | | |
| Shares Outstanding $0.001 par value shares of beneficial interest (unlimited shares authorized) (not in 000's) | | | 29,423 | | |
Net Asset Value, Offering and Redemption Price Per Share | | $ | 9.65 | | |
CLASS IS: | |
Net Assets | | $ | 763 | | |
| Shares Outstanding $0.001 par value shares of beneficial interest (unlimited shares authorized) (not in 000's) | | | 78,874 | | |
Net Asset Value, Offering and Redemption Price Per Share | | $ | 9.68 | | |
@ Amount is less than $500.
The accompanying notes are an integral part of the financial statements.
13
Morgan Stanley Institutional Fund, Inc.
Annual Report — December 31, 2017
Emerging Markets Fixed Income Opportunities Portfolio
Statement of Operations | | Year Ended
December 31, 2017
(000) | |
Investment Income: | |
Interest from Securities of Unaffiliated Issuers (Net of $22 of Foreign Taxes Withheld) | | $ | 1,863 | | |
Dividends from Security of Affiliated Issuer (Note G) | | | 6 | | |
Total Investment Income | | | 1,869 | | |
Expenses: | |
Advisory Fees (Note B) | | | 185 | | |
Professional Fees | | | 136 | | |
Registration Fees | | | 66 | | |
Custodian Fees (Note F) | | | 29 | | |
Administration Fees (Note C) | | | 20 | | |
Shareholder Reporting Fees | | | 15 | | |
Pricing Fees | | | 14 | | |
Transfer Agency Fees — Class I (Note E) | | | 3 | | |
Transfer Agency Fees — Class A (Note E) | | | 2 | | |
Transfer Agency Fees — Class L (Note E) | | | 2 | | |
Transfer Agency Fees — Class C (Note E) | | | 2 | | |
Transfer Agency Fees — Class IS (Note E) | | | 2 | | |
Shareholder Services Fees — Class A (Note D) | | | 3 | | |
Distribution and Shareholder Services Fees — Class L (Note D) | | | 4 | | |
Distribution and Shareholder Services Fees — Class C (Note D) | | | 3 | | |
Directors' Fees and Expenses | | | 4 | | |
Sub Transfer Agency Fees — Class I | | | 1 | | |
Sub Transfer Agency Fees — Class A | | | 1 | | |
Sub Transfer Agency Fees — Class L | | | — | @ | |
Sub Transfer Agency Fees — Class C | | | — | @ | |
Other Expenses | | | 22 | | |
Total Expenses | | | 514 | | |
Waiver of Advisory Fees (Note B) | | | (185 | ) | |
Expenses Reimbursed by Adviser (Note B) | | | (105 | ) | |
Reimbursement of Class Specific Expenses — Class A (Note B) | | | (1 | ) | |
Reimbursement of Class Specific Expenses — Class L (Note B) | | | (1 | ) | |
Reimbursement of Class Specific Expenses — Class C (Note B) | | | (2 | ) | |
Reimbursement of Class Specific Expenses — Class IS (Note B) | | | (2 | ) | |
Rebate from Morgan Stanley Affiliate (Note G) | | | (1 | ) | |
Net Expenses | | | 217 | | |
Net Investment Income | | | 1,652 | | |
Realized Gain (Loss): | |
Investments Sold (Net of $(7)* of Capital Gain Country Tax) | | | 547 | | |
Foreign Currency Forward Exchange Contracts | | | (73 | ) | |
Foreign Currency Transactions | | | 2 | | |
Futures Contracts | | | (7 | ) | |
Swap Agreements | | | 5 | | |
Net Realized Gain | | | 474 | | |
Change in Unrealized Appreciation (Depreciation): | |
Investments (Net of Decrease in Deferred Capital Gain Country Tax of $7) | | | 802 | | |
Foreign Currency Forward Exchange Contracts | | | 30 | | |
Foreign Currency Translations | | | 8 | | |
Futures Contracts | | | 6 | | |
Net Change in Unrealized Appreciation (Depreciation) | | | 846 | | |
Net Realized Gain and Change in Unrealized Appreciation (Depreciation) | | | 1,320 | | |
Net Increase in Net Assets Resulting from Operations | | $ | 2,972 | | |
@ Amount is less than $500.
* Relates to reversal of previously accrued capital gain country tax on Argentina securities.
The accompanying notes are an integral part of the financial statements.
14
Morgan Stanley Institutional Fund, Inc.
Annual Report — December 31, 2017
Emerging Markets Fixed Income Opportunities Portfolio
Statements of Changes in Net Assets | | Year Ended
December 31, 2017
(000) | | Year Ended
December 31, 2016
(000) | |
Increase (Decrease) in Net Assets: | |
Operations: | |
Net Investment Income | | $ | 1,652 | | | $ | 1,703 | | |
Net Realized Gain (Loss) | | | 474 | | | | (124 | ) | |
Net Change in Unrealized Appreciation (Depreciation) | | | 846 | | | | 1,157 | | |
Net Increase in Net Assets Resulting from Operations | | | 2,972 | | | | 2,736 | | |
Distributions from and/or in Excess of: | |
Class I: | |
Net Investment Income | | | (1,274 | ) | | | (1,221 | ) | |
Class A: | |
Net Investment Income | | | (58 | ) | | | (62 | ) | |
Class L: | |
Net Investment Income | | | (42 | ) | | | (43 | ) | |
Class C: | |
Net Investment Income | | | (13 | ) | | | (11 | ) | |
Class IS: | |
Net Investment Income | | | (44 | ) | | | (43 | ) | |
Total Distributions | | | (1,431 | ) | | | (1,380 | ) | |
Capital Share Transactions:(1) | |
Class I: | |
Subscribed | | | 1,173 | | | | 541 | | |
Distributions Reinvested | | | 172 | | | | 144 | | |
Redeemed | | | (820 | ) | | | (760 | ) | |
Class A: | |
Subscribed | | | 226 | | | | 195 | | |
Distributions Reinvested | | | 48 | | | | 51 | | |
Redeemed | | | (160 | ) | | | (443 | ) | |
Class L: | |
Distributions Reinvested | | | 38 | | | | 38 | | |
Redeemed | | | (25 | ) | | | (42 | ) | |
Class C: | |
Subscribed | | | 32 | | | | 2 | | |
Distributions Reinvested | | | 12 | | | | 10 | | |
Redeemed | | | (1 | ) | | | (2 | ) | |
Net Increase (Decrease) in Net Assets Resulting from Capital Share Transactions | | | 695 | | | | (266 | ) | |
Redemption Fees | | | — | @ | | | — | @ | |
Total Increase in Net Assets | | | 2,236 | | | | 1,090 | | |
Net Assets: | |
Beginning of Period | | | 23,022 | | | | 21,932 | | |
End of Period (Including Distributions in Excess of Net Investment Income of $(62) and $(138)) | | $ | 25,258 | | | $ | 23,022 | | |
The accompanying notes are an integral part of the financial statements.
15
Morgan Stanley Institutional Fund, Inc.
Annual Report — December 31, 2017
Emerging Markets Fixed Income Opportunities Portfolio
Statements of Changes in Net Assets (cont'd) | | Year Ended
December 31, 2017
(000) | | Year Ended
December 31, 2016
(000) | |
(1) Capital Share Transactions: | |
Class I: | |
Shares Subscribed | | | 122 | | | | 58 | | |
Shares Issued on Distributions Reinvested | | | 18 | | | | 16 | | |
Shares Redeemed | | | (86 | ) | | | (85 | ) | |
Net Increase (Decrease) in Class I Shares Outstanding | | | 54 | | | | (11 | ) | |
Class A: | |
Shares Subscribed | | | 24 | | | | 21 | | |
Shares Issued on Distributions Reinvested | | | 5 | | | | 6 | | |
Shares Redeemed | | | (17 | ) | | | (49 | ) | |
Net Increase (Decrease) in Class A Shares Outstanding | | | 12 | | | | (22 | ) | |
Class L: | |
Shares Issued on Distributions Reinvested | | | 4 | | | | 4 | | |
Shares Redeemed | | | (3 | ) | | | (4 | ) | |
Net Increase (Decrease) in Class L Shares Outstanding | | | 1 | | | | (— | @@) | |
Class C: | |
Shares Subscribed | | | 4 | | | | — | @@ | |
Shares Issued on Distributions Reinvested | | | 1 | | | | 1 | | |
Shares Redeemed | | | (— | @@) | | | (— | @@) | |
Net Increase in Class C Shares Outstanding | | | 5 | | | | 1 | | |
@ Amount is less than $500.
@@ Amount is less than 500 shares.
The accompanying notes are an integral part of the financial statements.
16
Morgan Stanley Institutional Fund, Inc.
Annual Report — December 31, 2017
Financial Highlights
Emerging Markets Fixed Income Opportunities Portfolio
| | | Class I | |
| | | Year Ended December 31, | |
Selected Per Share Data and Ratios | | 2017 | | 2016(1) | | 2015 | | 2014 | | 2013 | |
Net Asset Value, Beginning of Period | | $ | 9.07 | | | $ | 8.53 | | | $ | 9.22 | | | $ | 9.40 | | | $ | 11.11 | | |
Income (Loss) from Investment Operations: | |
Net Investment Income(2) | | | 0.65 | | | | 0.67 | | | | 0.52 | | | | 0.51 | | | | 0.53 | | |
Net Realized and Unrealized Gain (Loss) | | | 0.52 | | | | 0.42 | | | | (0.68 | ) | | | (0.19 | ) | | | (1.50 | ) | |
Total from Investment Operations | | | 1.17 | | | | 1.09 | | | | (0.16 | ) | | | 0.32 | | | | (0.97 | ) | |
Distributions from and/or in Excess of: | |
Net Investment Income | | | (0.56 | ) | | | (0.55 | ) | | | (0.53 | ) | | | (0.50 | ) | | | (0.48 | ) | |
Net Realized Gain | | | — | | | | — | | | | — | | | | — | | | | (0.26 | ) | |
Total Distributions | | | (0.56 | ) | | | (0.55 | ) | | | (0.53 | ) | | | (0.50 | ) | | | (0.74 | ) | |
Redemption Fees | | | 0.00 | (3) | | | 0.00 | (3) | | | 0.00 | (3) | | | — | | | | 0.00 | (3) | |
Net Asset Value, End of Period | | $ | 9.68 | | | $ | 9.07 | | | $ | 8.53 | | | $ | 9.22 | | | $ | 9.40 | | |
Total Return(4) | | | 12.94 | % | | | 12.80 | % | | | (1.83 | )% | | | 3.38 | % | | | (8.79 | )% | |
Ratios and Supplemental Data: | |
Net Assets, End of Period (Thousands) | | $ | 22,219 | | | $ | 20,332 | | | $ | 19,219 | | | $ | 18,492 | | | $ | 19,400 | | |
Ratio of Expenses to Average Net Assets(7) | | | 0.83 | %(5) | | | 0.84 | %(5) | | | 0.83 | %(5) | | | 0.83 | %(5) | | | 0.84 | %(5) | |
Ratio of Net Investment Income to Average Net Assets(7) | | | 6.73 | %(5) | | | 7.32 | %(5) | | | 5.74 | %(5) | | | 5.23 | %(5) | | | 5.14 | %(5) | |
Ratio of Rebate from Morgan Stanley Affiliates to Average Net Assets | | | 0.01 | % | | | 0.00 | %(6) | | | 0.00 | %(6) | | | 0.00 | %(6) | | | 0.00 | %(6) | |
Portfolio Turnover Rate | | | 77 | % | | | 116 | % | | | 111 | % | | | 95 | % | | | 94 | % | |
(7) Supplemental Information on the Ratios to Average Net Assets: | |
Ratios Before Expense Limitation: | |
Expenses to Average Net Assets | | | 2.01 | % | | | 2.03 | % | | | 1.82 | % | | | 1.91 | % | | | 2.15 | % | |
Net Investment Income to Average Net Assets | | | 5.55 | % | | | 6.13 | % | | | 4.75 | % | | | 4.15 | % | | | 3.83 | % | |
(1) Reflects prior period custodian out-of-pocket expenses that were reimbursed in September 2016. The amount of the reimbursement was immaterial on a per share basis and did not impact the total return of Class I shares. The Ratio of Expenses to Average Net Assets and the Ratio of Net Investment Income to Average Net Assets would be unchanged as the reimbursement of custodian fees was offset against expense waivers/reimbursements with no impact to net expenses or net investment income.
(2) Per share amount is based on average shares outstanding.
(3) Amount is less than $0.005 per share.
(4) Calculated based on the net asset value as of the last business day of the period.
(5) The Ratios of Expenses and Net Investment Income reflect the rebate of certain Fund expenses in connection with the investments in Morgan Stanley affiliates during the period. The effect of the rebate on the ratios is disclosed in the above table as "Ratio of Rebate from Morgan Stanley Affiliates to Average Net Assets."
(6) Amount is less than 0.005%.
The accompanying notes are an integral part of the financial statements.
17
Morgan Stanley Institutional Fund, Inc.
Annual Report — December 31, 2017
Financial Highlights
Emerging Markets Fixed Income Opportunities Portfolio
| | | Class A | |
| | | Year Ended December 31, | |
Selected Per Share Data and Ratios | | 2017 | | 2016(1) | | 2015 | | 2014 | | 2013 | |
Net Asset Value, Beginning of Period | | $ | 9.06 | | | $ | 8.52 | | | $ | 9.21 | | | $ | 9.40 | | | $ | 11.11 | | |
Income (Loss) from Investment Operations: | |
Net Investment Income(2) | | | 0.61 | | | | 0.64 | | | | 0.50 | | | | 0.47 | | | | 0.49 | | |
Net Realized and Unrealized Gain (Loss) | | | 0.52 | | | | 0.42 | | | | (0.69 | ) | | | (0.19 | ) | | | (1.49 | ) | |
Total from Investment Operations | | | 1.13 | | | | 1.06 | | | | (0.19 | ) | | | 0.28 | | | | (1.00 | ) | |
Distributions from and/or in Excess of: | |
Net Investment Income | | | (0.52 | ) | | | (0.52 | ) | | | (0.50 | ) | | | (0.47 | ) | | | (0.45 | ) | |
Net Realized Gain | | | — | | | | — | | | | — | | | | — | | | | (0.26 | ) | |
Total Distributions | | | (0.52 | ) | | | (0.52 | ) | | | (0.50 | ) | | | (0.47 | ) | | | (0.71 | ) | |
Redemption Fees | | | 0.00 | (3) | | | 0.00 | (3) | | | 0.00 | (3) | | | — | | | | 0.00 | (3) | |
Net Asset Value, End of Period | | $ | 9.67 | | | $ | 9.06 | | | $ | 8.52 | | | $ | 9.21 | | | $ | 9.40 | | |
Total Return(4) | | | 12.54 | % | | | 12.53 | % | | | (2.14 | )% | | | 2.90 | % | | | (9.05 | )% | |
Ratios and Supplemental Data: | |
Net Assets, End of Period (Thousands) | | $ | 1,150 | | | $ | 972 | | | $ | 1,103 | | | $ | 291 | | | $ | 196 | | |
Ratio of Expenses to Average Net Assets(8) | | | 1.19 | %(5) | | | 1.09 | %(5) | | | 1.20 | %(5) | | | 1.20 | %(5) | | | 1.14 | %(5)(6) | |
Ratio of Net Investment Income to Average Net Assets(8) | | | 6.37 | %(5) | | | 7.03 | %(5) | | | 5.61 | %(5) | | | 4.88 | %(5) | | | 4.88 | %(5) | |
Ratio of Rebate from Morgan Stanley Affiliates to Average Net Assets | | | 0.01 | % | | | 0.00 | %(7) | | | 0.00 | %(7) | | | 0.00 | %(7) | | | 0.00 | %(7) | |
Portfolio Turnover Rate | | | 77 | % | | | 116 | % | | | 111 | % | | | 95 | % | | | 94 | % | |
(8) Supplemental Information on the Ratios to Average Net Assets: | |
Ratios Before Expense Limitation: | |
Expenses to Average Net Assets | | | 2.51 | % | | | 2.28 | % | | | 2.49 | % | | | 2.85 | % | | | 2.76 | % | |
Net Investment Income to Average Net Assets | | | 5.05 | % | | | 5.84 | % | | | 4.32 | % | | | 3.23 | % | | | 3.26 | % | |
(1) Reflects prior period custodian out-of-pocket expenses that were reimbursed in September 2016. The amount of the reimbursement was immaterial on a per share basis and did not impact the total return of Class A shares. The Ratio of Expenses to Average Net Assets and the Ratio of Net Investment Income to Average Net Assets would be unchanged as the reimbursement of custodian fees was offset against expense waivers/reimbursements with no impact to net expenses or net investment income.
(2) Per share amount is based on average shares outstanding.
(3) Amount is less than $0.005 per share.
(4) Calculated based on the net asset value which does not reflect sales charges, if applicable, as of the last business day of the period.
(5) The Ratios of Expenses and Net Investment Income reflect the rebate of certain Fund expenses in connection with the investments in Morgan Stanley affiliates during the period. The effect of the rebate on the ratios is disclosed in the above table as "Ratio of Rebate from Morgan Stanley Affiliates to Average Net Assets."
(6) Effective September 16, 2013, the Adviser has agreed to limit the ratio of expenses to average net assets to the maximum ratio of 1.20% for Class A shares. Prior to September 16, 2013, the maximum ratio was 1.10% for Class A shares.
(7) Amount is less than 0.005%.
The accompanying notes are an integral part of the financial statements.
18
Morgan Stanley Institutional Fund, Inc.
Annual Report — December 31, 2017
Financial Highlights
Emerging Markets Fixed Income Opportunities Portfolio
| | | Class L | |
| | | Year Ended December 31, | |
Selected Per Share Data and Ratios | | 2017 | | 2016(1) | | 2015 | | 2014 | | 2013 | |
Net Asset Value, Beginning of Period | | $ | 9.05 | | | $ | 8.51 | | | $ | 9.22 | | | $ | 9.39 | | | $ | 11.11 | | |
Income (Loss) from Investment Operations: | |
Net Investment Income(2) | | | 0.59 | | | | 0.62 | | | | 0.49 | | | | 0.45 | | | | 0.47 | | |
Net Realized and Unrealized Gain (Loss) | | | 0.51 | | | | 0.41 | | | | (0.72 | ) | | | (0.18 | ) | | | (1.51 | ) | |
Total from Investment Operations | | | 1.10 | | | | 1.03 | | | | (0.23 | ) | | | 0.27 | | | | (1.04 | ) | |
Distributions from and/or in Excess of: | |
Net Investment Income | | | (0.50 | ) | | | (0.49 | ) | | | (0.48 | ) | | | (0.44 | ) | | | (0.42 | ) | |
Net Realized Gain | | | — | | | | — | | | | — | | | | — | | | | (0.26 | ) | |
Total Distributions | | | (0.50 | ) | | | (0.49 | ) | | | (0.48 | ) | | | (0.44 | ) | | | (0.68 | ) | |
Redemption Fees | | | 0.00 | (3) | | | 0.00 | (3) | | | 0.00 | (3) | | | — | | | | 0.00 | (3) | |
Net Asset Value, End of Period | | $ | 9.65 | | | $ | 9.05 | | | $ | 8.51 | | | $ | 9.22 | | | $ | 9.39 | | |
Total Return(4) | | | 12.28 | % | | | 12.15 | % | | | (2.53 | )% | | | 2.85 | % | | | (9.41 | )% | |
Ratios and Supplemental Data: | |
Net Assets, End of Period (Thousands) | | $ | 842 | | | $ | 777 | | | $ | 735 | | | $ | 98 | | | $ | 100 | | |
Ratio of Expenses to Average Net Assets(8) | | | 1.44 | %(5) | | | 1.45 | %(5) | | | 1.45 | %(5) | | | 1.45 | %(5) | | | 1.41 | %(5)(6) | |
Ratio of Net Investment Income to Average Net Assets(8) | | | 6.11 | %(5) | | | 6.70 | %(5) | | | 5.44 | %(5) | | | 4.62 | %(5) | | | 4.57 | %(5) | |
Ratio of Rebate from Morgan Stanley Affiliates to Average Net Assets | | | 0.01 | % | | | 0.00 | %(7) | | | 0.00 | %(7) | | | 0.00 | %(7) | | | 0.00 | %(7) | |
Portfolio Turnover Rate | | | 77 | % | | | 116 | % | | | 111 | % | | | 95 | % | | | 94 | % | |
(8) Supplemental Information on the Ratios to Average Net Assets: | |
Ratios Before Expense Limitation: | |
Expenses to Average Net Assets | | | 2.77 | % | | | 2.78 | % | | | 2.94 | % | | | 4.10 | % | | | 3.07 | % | |
Net Investment Income to Average Net Assets | | | 4.78 | % | | | 5.37 | % | | | 3.95 | % | | | 1.97 | % | | | 2.91 | % | |
(1) Reflects prior period custodian out-of-pocket expenses that were reimbursed in September 2016. The amount of the reimbursement was immaterial on a per share basis and did not impact the total return of Class L shares. The Ratio of Expenses to Average Net Assets and the Ratio of Net Investment Income to Average Net Assets would be unchanged as the reimbursement of custodian fees was offset against expense waivers/reimbursements with no impact to net expenses or net investment income.
(2) Per share amount is based on average shares outstanding.
(3) Amount is less than $0.005 per share.
(4) Calculated based on the net asset value as of the last business day of the period.
(5) The Ratios of Expenses and Net Investment Income reflect the rebate of certain Fund expenses in connection with the investments in Morgan Stanley affiliates during the period. The effect of the rebate on the ratios is disclosed in the above table as "Ratio of Rebate from Morgan Stanley Affiliates to Average Net Assets."
(6) Effective September 16, 2013, the Adviser has agreed to limit the ratio of expenses to average net assets to the maximum ratio of 1.45% for Class L shares. Prior to September 16, 2013, the maximum ratio was 1.35% for Class L shares.
(7) Amount is less than 0.005%.
The accompanying notes are an integral part of the financial statements.
19
Morgan Stanley Institutional Fund, Inc.
Annual Report — December 31, 2017
Financial Highlights
Emerging Markets Fixed Income Opportunities Portfolio
| | | Class C | |
| | | Year Ended December 31, | | Period from
April 30, 2015(2) to | |
Selected Per Share Data and Ratios | | 2017 | | 2016(1) | | December 31, 2015 | |
Net Asset Value, Beginning of Period | | $ | 9.05 | | | $ | 8.52 | | | $ | 9.52 | | |
Income (Loss) from Investment Operations: | |
Net Investment Income(3) | | | 0.50 | | | | 0.54 | | | | 0.32 | | |
Net Realized and Unrealized Gain (Loss) | | | 0.55 | | | | 0.43 | | | | (0.97 | ) | |
Total from Investment Operations | | | 1.05 | | | | 0.97 | | | | (0.65 | ) | |
Distributions from and/or in Excess of: | |
Net Investment Income | | | (0.45 | ) | | | (0.44 | ) | | | (0.35 | ) | |
Redemption Fees | | | 0.00 | (4) | | | 0.00 | (4) | | | 0.00 | (4) | |
Net Asset Value, End of Period | | $ | 9.65 | | | $ | 9.05 | | | $ | 8.52 | | |
Total Return(5) | | | 11.76 | % | | | 11.60 | % | | | (6.95 | )%(8) | |
Ratios and Supplemental Data: | |
Net Assets, End of Period (Thousands) | | $ | 284 | | | $ | 225 | | | $ | 202 | | |
Ratio of Expenses to Average Net Assets(10) | | | 1.94 | %(6) | | | 1.95 | %(6) | | | 1.95 | %(6)(9) | |
Ratio of Net Investment Income to Average Net Assets(10) | | | 5.18 | %(6) | | | 5.87 | %(6) | | | 5.34 | %(6)(9) | |
Ratio of Rebate from Morgan Stanley Affiliates to Average Net Assets | | | 0.01 | % | | | 0.00 | %(7) | | | 0.00 | %(7)(9) | |
Portfolio Turnover Rate | | | 77 | % | | | 116 | % | | | 111 | % | |
(10) Supplemental Information on the Ratios to Average Net Assets: | |
Ratios Before Expense Limitation: | |
Expense to Average Net Assets | | | 3.84 | % | | | 3.97 | % | | | 6.28 | %(9) | |
Net Investment Income to Average Net Assets | | | 3.28 | % | | | 3.85 | % | | | 1.01 | %(9) | |
(1) Reflects prior period custodian out-of-pocket expenses that were reimbursed in September 2016. The amount of the reimbursement was immaterial on a per share basis and did not impact the total return of Class C shares. The Ratio of Expenses to Average Net Assets and the Ratio of Net Investment Income to Average Net Assets would be unchanged as the reimbursement of custodian fees was offset against expense waivers/reimbursements with no impact to net expenses or net investment income.
(2) Commencement of Offering.
(3) Per share amount is based on average shares outstanding.
(4) Amount is less than $0.005 per share.
(5) Calculated based on the net asset value which does not reflect sales charges, if applicable, as of the last business day of the period.
(6) The Ratios of Expenses and Net Investment Income reflect the rebate of certain Fund expenses in connection with the investments in Morgan Stanley affiliates during the period. The effect of the rebate on the ratios is disclosed in the above table as "Ratio of Rebate from Morgan Stanley Affiliates to Average Net Assets."
(7) Amount is less than 0.005%.
(8) Not annualized.
(9) Annualized.
The accompanying notes are an integral part of the financial statements.
20
Morgan Stanley Institutional Fund, Inc.
Annual Report — December 31, 2017
Financial Highlights
Emerging Markets Fixed Income Opportunities Portfolio
| | | Class IS | |
| | | Year Ended December 31, | | Period from
September 13, 2013(2) to | |
Selected Per Share Data and Ratios | | 2017 | | 2016(1) | | 2015 | | 2014 | | December 31, 2013 | |
Net Asset Value, Beginning of Period | | $ | 9.07 | | | $ | 8.53 | | | $ | 9.22 | | | $ | 9.40 | | | $ | 9.65 | | |
Income (Loss) from Investment Operations: | |
Net Investment Income(3) | | | 0.65 | | | | 0.67 | | | | 0.50 | | | | 0.51 | | | | 0.15 | | |
Net Realized and Unrealized Gain (Loss) | | | 0.52 | | | | 0.42 | | | | (0.66 | ) | | | (0.19 | ) | | | 0.04 | | |
Total from Investment Operations | | | 1.17 | | | | 1.09 | | | | (0.16 | ) | | | 0.32 | | | | 0.19 | | |
Distributions from and/or in Excess of: | |
Net Investment Income | | | (0.56 | ) | | | (0.55 | ) | | | (0.53 | ) | | | (0.50 | ) | | | (0.24 | ) | |
Net Realized Gain | | | — | | | | — | | | | — | | | | — | | | | (0.20 | ) | |
Total Distributions | | | (0.56 | ) | | | (0.55 | ) | | | (0.53 | ) | | | (0.50 | ) | | | (0.44 | ) | |
Redemption Fees | | | 0.00 | (4) | | | 0.00 | (4) | | | 0.00 | (4) | | | — | | | | 0.00 | (4) | |
Net Asset Value, End of Period | | $ | 9.68 | | | $ | 9.07 | | | $ | 8.53 | | | $ | 9.22 | | | $ | 9.40 | | |
Total Return(5) | | | 12.95 | % | | | 12.81 | % | | | (1.83 | )% | | | 3.39 | % | | | 1.92 | %(9) | |
Ratios and Supplemental Data: | |
Net Assets, End of Period (Thousands) | | $ | 763 | | | $ | 716 | | | $ | 673 | | | $ | 10 | | | $ | 10 | | |
Ratio of Expenses to Average Net Assets(11) | | | 0.81 | %(7) | | | 0.82 | %(7) | | | 0.82 | %(7) | | | 0.82 | %(7) | | | 0.81 | %(6)(7)(10) | |
Ratio of Net Investment Income to Average Net Assets(11) | | | 6.74 | %(7) | | | 7.33 | %(7) | | | 5.45 | %(7) | | | 5.25 | %(7) | | | 5.36 | %(7)(10) | |
Ratio of Rebate from Morgan Stanley Affiliates to Average Net Assets | | | 0.01 | % | | | 0.00 | %(8) | | | 0.00 | %(8) | | | 0.00 | %(8) | | | 0.01 | %(10) | |
Portfolio Turnover Rate | | | 77 | % | | | 116 | % | | | 111 | % | | | 95 | % | | | 94 | % | |
(11) Supplemental Information on the Ratios to Average Net Assets: | |
Ratios Before Expense Limitation: | |
Expenses to Average Net Assets | | | 2.25 | % | | | 2.25 | % | | | 1.86 | % | | | 21.21 | % | | | 7.70 | %(10) | |
Net Investment Income (Loss) to Average Net Assets | | | 5.30 | % | | | 5.90 | % | | | 4.41 | % | | | (15.14 | )% | | | (1.53 | )%(10) | |
(1) Reflects prior period custodian out-of-pocket expenses that were reimbursed in September 2016. The amount of the reimbursement was immaterial on a per share basis and did not impact the total return of Class IS shares. The Ratio of Expenses to Average Net Assets and the Ratio of Net Investment Income to Average Net Assets would be unchanged as the reimbursement of custodian fees was offset against expense waivers/reimbursements with no impact to net expenses or net investment income.
(2) Commencement of Offering.
(3) Per share amount is based on average shares outstanding.
(4) Amount is less than $0.005 per share.
(5) Calculated based on the net asset value as of the last business day of the period.
(6) Effective September 16, 2013, the Adviser has agreed to limit the ratio of expenses to average net assets to the maximum ratio of 0.82% for Class IS shares.
(7) The Ratios of Expenses and Net Investment Income reflect the rebate of certain Fund expenses in connection with the investments in Morgan Stanley affiliates during the period. The effect of the rebate on the ratios is disclosed in the above table as "Ratio of Rebate from Morgan Stanley Affiliates to Average Net Assets."
(8) Amount is less than 0.005%.
(9) Not annualized.
(10) Annualized.
The accompanying notes are an integral part of the financial statements.
21
Morgan Stanley Institutional Fund, Inc.
Annual Report — December 31, 2017
Notes to Financial Statements
Morgan Stanley Institutional Fund, Inc. (the "Company") is registered under the Investment Company Act of 1940, as amended (the "Act"), as an open-end management investment company. The Company is comprised of twenty-nine separate, active, diversified and non-diversified funds (individually referred to as a "Fund", collectively as the "Funds"). The Company applies investment company accounting and reporting guidance.
The accompanying financial statements relate to the Emerging Markets Fixed Income Opportunities Portfolio. The Fund seeks high total return.
The Fund offers five classes of shares — Class I, Class A, Class L, Class C and Class IS. On April 30, 2015, the Fund suspended offering of Class L shares. Existing Class L shareholders may invest through reinvestment of dividends and distributions.
A. Significant Accounting Policies: The following significant accounting policies are in conformity with U.S. generally accepted accounting principles ("GAAP"). Such policies are consistently followed by the Company in the preparation of its financial statements. GAAP may require management to make estimates and assumptions that affect the reported amounts and disclosures in the financial statements. Actual results may differ from those estimates.
1. Security Valuation: (1) Certain portfolio securities may be valued by an outside pricing service/vendor approved by the Company's Board of Directors (the "Directors"). The pricing service/vendor may employ a pricing model that takes into account, among other things, bids, yield spreads, and/or other market data and specific security characteristics. Alternatively, if a valuation is not available from an outside pricing service/vendor, and the security trades on an exchange, the security may be valued at its latest reported sale price (or at the exchange official closing price if such exchange reports an official closing price), prior to the time when assets are valued. If there are no sales on a given day and if there is no official exchange closing price for that day, the security is valued at the mean between the last reported bid and asked prices if such bid and asked prices are available in the relevant exchanges; (2) an equity portfolio security listed or traded on an exchange is valued at its latest reported sales price (or at the exchange official closing price if such exchange reports an official closing price), and if there were no sales on a given day and if there is no official exchange closing
price for that day, the security is valued at the mean between the last reported bid and asked prices if such bid and asked prices are available on the relevant exchanges. Listed equity securities not traded on the valuation date with no reported bid and asked prices available on the exchange are valued at the mean between the current bid and asked prices obtained from one or more reputable brokers or dealers. In cases where a security is traded on more than one exchange, the security is valued on the exchange designated as the primary market; (3) all other equity portfolio securities for which over-the-counter ("OTC") market quotations are readily available are valued at the latest reported sales price (or at the market official closing price if such market reports an official closing price), and if there was no trading in the security on a given day and if there is no official closing price from relevant markets for that day, the security is valued at the mean between the last reported bid and asked prices if such bid and asked prices are available on the relevant markets. An unlisted equity security that does not trade on the valuation date and for which bid and asked prices from the relevant markets are unavailable is valued at the mean between the current bid and asked prices obtained from one or more reputable brokers or dealers; (4) futures are valued at the settlement price on the exchange on which they trade or, if a settlement price is unavailable, at the last sale price on the exchange; (5) OTC swaps may be valued by an outside pricing service approved by the Directors or quotes from a broker or dealer. Swaps cleared on a clearinghouse or exchange may be valued using the closing price provided by the clearinghouse or exchange; (6) when market quotations are not readily available, including circumstances under which Morgan Stanley Investment Management Inc. (the "Adviser") determines that the closing price, last sale price or the mean between the last reported bid and asked prices are not reflective of a security's market value, portfolio securities are valued at their fair value as determined in good faith under procedures established by and under the general supervision of the Directors. Occasionally, developments affecting the closing prices of securities and other assets may occur between the times at which valuations of such securities are determined (that is, close of the foreign market on which the securities trade) and the close of business of the New York Stock Exchange ("NYSE"). If developments occur during such periods that are expected to materially affect the value of such securities, such valuations may be
22
Morgan Stanley Institutional Fund, Inc.
Annual Report — December 31, 2017
Notes to Financial Statements (cont'd)
adjusted to reflect the estimated fair value of such securities as of the close of the NYSE, as determined in good faith by the Directors or by the Adviser using a pricing service and/or procedures approved by the Directors; (7) quotations of foreign portfolio securities, other assets and liabilities and forward contracts stated in foreign currency are translated into U.S. dollar equivalents at the prevailing market rates prior to the close of the NYSE; and (8) investments in mutual funds, including the Morgan Stanley Institutional Liquidity Funds, are valued at the net asset value ("NAV") as of the close of each business day.
The Directors have responsibility for determining in good faith the fair value of the investments, and the Directors may appoint others, such as the Company's Adviser or a valuation committee, to assist the Directors in determining fair value and to make the actual calculations pursuant to the fair valuation methodologies previously approved by the Directors. Under procedures approved by the Directors, the Company's Adviser has formed a Valuation Committee whose members are approved by the Directors. The Valuation Committee provides administration and oversight of the Company's valuation policies and procedures, which are reviewed at least annually by the Directors. These procedures allow the Company to utilize independent pricing services, quotations from securities and financial instrument dealers, and other market sources to determine fair value.
The Company has procedures to determine the fair value of securities and other financial instruments for which market prices are not readily available. Under these procedures, the Valuation Committee convenes on a regular and ad hoc basis to review such securities and considers a number of factors, including valuation methodologies and significant unobservable valuation inputs, when arriving at fair value. The Valuation Committee may employ a market-based approach which may use related or comparable assets or liabilities, recent transactions, market multiples, book values, and other relevant information for the investment to determine the fair value of the investment. An income-based valuation approach may also be used in which the anticipated future cash flows of the investment are discounted to calculate fair value. Discounts may also be applied due to the nature or duration of any restrictions on the disposition of the investments. Due to the inherent
uncertainty of valuations of such investments, the fair values may differ significantly from the values that would have been used had an active market existed. The Valuation Committee employs various methods for calibrating these valuation approaches including a regular review of valuation methodologies, key inputs and assumptions, transactional back-testing or disposition analysis, and reviews of any related market activity.
2. Fair Value Measurement: Financial Accounting Standards Board ("FASB") Accounting Standards CodificationTM ("ASC") 820, "Fair Value Measurement" ("ASC 820"), defines fair value as the value that the Fund would receive to sell an investment or pay to transfer a liability in a timely transaction with an independent buyer in the principal market, or in the absence of a principal market, the most advantageous market for the investment or liability. ASC 820 establishes a three-tier hierarchy to distinguish between (1) inputs that reflect the assumptions market participants would use in valuing an asset or liability developed based on market data obtained from sources independent of the reporting entity (observable inputs) and (2) inputs that reflect the reporting entity's own assumptions about the assumptions market participants would use in valuing an asset or liability developed based on the best information available in the circumstances (unobservable inputs) and to establish classification of fair value measurements for disclosure purposes. Various inputs are used in determining the value of the Fund's investments. The inputs are summarized in the three broad levels listed below.
• Level 1 – unadjusted quoted prices in active markets for identical investments
• Level 2 – other significant observable inputs (including quoted prices for similar investments, interest rates, prepayment speeds, credit risk, etc.)
• Level 3 – significant unobservable inputs including the Fund's own assumptions in determining the fair value of investments. Factors considered in making this determination may include, but are not limited to, information obtained by contacting the issuer, analysts, or the appropriate stock exchange (for exchange-traded securities), analysis of the issuer's financial statements or other
23
Morgan Stanley Institutional Fund, Inc.
Annual Report — December 31, 2017
Notes to Financial Statements (cont'd)
available documents and, if necessary, available information concerning other securities in similar circumstances
The inputs or methodology used for valuing securities are not necessarily an indication of the risk associated with investing in those securities and the determination of the significance of a particular input to the fair value measurement in its entirety requires judgment and considers factors specific to each security.
The following is a summary of the inputs used to value the Fund's investments as of December 31, 2017.
Investment Type | | Level 1
Unadjusted
quoted
prices
(000) | | Level 2
Other
significant
observable
inputs
(000) | | Level 3
Significant
unobservable
inputs
(000) | | Total
(000) | |
Assets: | |
Fixed Income Securities | |
Corporate Bonds | | $ | — | | | $ | 8,351 | | | $ | — | | | $ | 8,351 | | |
Sovereign | | | — | | | | 15,309 | | | | — | | | | 15,309 | | |
Total Fixed Income Securities | | | — | | | | 23,660 | | | | — | | | | 23,660 | | |
Warrant | | | — | | | | 2 | | | | — | | | | 2 | | |
Short-Term Investments | |
Investment Company | | | 173 | | | | — | | | | — | | | | 173 | | |
Sovereign | | | — | | | | 813 | | | | — | | | | 813 | | |
U.S. Treasury Security | | | — | | | | 30 | | | | — | | | | 30 | | |
Total Short-Term Investments | | | 173 | | | | 843 | | | | — | | | | 1,016 | | |
Foreign Currency Forward
Exchange Contracts | | | — | | | | 53 | | | | — | | | | 53 | | |
Futures Contract | | | 2 | | | | — | | | | — | | | | 2 | | |
Total Assets | | | 175 | | | | 24,558 | | | | — | | | | 24,733 | | |
Liabilities: | |
Foreign Currency Forward
Exchange Contracts | | | — | | | | (33 | ) | | | — | | | | (33 | ) | |
Total | | $ | 175 | | | $ | 24,525 | | | $ | — | | | $ | 24,700 | | |
Transfers between investment levels may occur as the markets fluctuate and/or the availability of data used in an investment's valuation changes. The Fund recognizes transfers between the levels as of the end of the period. As of December 31, 2017, the Fund did not have any investments transfer between investment levels.
3. Foreign Currency Translation and Foreign Investments: The books and records of the Fund are maintained in U.S. dollars. Foreign currency amounts are translated into U.S. dollars as follows:
– investments, other assets and liabilities at the prevailing rate of exchange on the valuation date;
– investment transactions and investment income at the prevailing rates of exchange on the dates of such transactions.
Although the net assets of the Fund are presented at the foreign exchange rates and market values at the close of the period, the Fund does not isolate that portion of the results of operations arising as a result of changes in the foreign exchange rates from the fluctuations arising from changes in the market prices of securities held at period end. Similarly, the Fund does not isolate the effect of changes in foreign exchange rates from the fluctuations arising from changes in the market prices of securities sold during the period. Accordingly, realized and unrealized foreign currency gains (losses) on investments in securities are included in the reported net realized and unrealized gains (losses) on investment transactions and balances. However, pursuant to U.S. federal income tax regulations, gains and losses from certain foreign currency transactions and the foreign currency portion of gains and losses realized on sales and maturities of foreign denominated debt securities are treated as ordinary income for U.S. federal income tax purposes.
Net realized gains (losses) on foreign currency transactions represent net foreign exchange gains (losses) from foreign currency forward exchange contracts, disposition of foreign currencies, currency gains (losses) realized between the trade and settlement dates on securities transactions, and the difference between the amount of investment income and foreign withholding taxes recorded on the Fund's books and the U.S. dollar equivalent amounts actually received or paid. Net unrealized currency gains (losses) from valuing foreign currency denominated assets and liabilities at period end exchange rates are reflected as a component of unrealized appreciation (depreciation) in the Statement of Assets and Liabilities. The change in unrealized currency gains (losses) on foreign currency translations for the period is reflected in the Statement of Operations.
Foreign security and currency transactions may involve certain considerations and risks not typically associated with those of U.S. dollar denominated transactions as a result of, among other factors, fluctuations of exchange rates in relation to the U.S. dollar, the possibility of
24
Morgan Stanley Institutional Fund, Inc.
Annual Report — December 31, 2017
Notes to Financial Statements (cont'd)
lower levels of governmental supervision and regulation of foreign securities markets and the possibility of political or economic instability.
Governmental approval for foreign investments may be required in advance of making an investment under certain circumstances in some countries, and the extent of foreign investments in domestic companies may be subject to limitation in other countries. Foreign ownership limitations also may be imposed by the charters of individual companies to prevent, among other concerns, violations of foreign investment limitations. As a result, an additional class of shares (identified as "Foreign" in the Portfolio of Investments) may be created and offered for investment. The "local" and "foreign shares" market values may differ. In the absence of trading of the foreign shares in such markets, the Fund values the foreign shares at the closing exchange price of the local shares.
4. Structured Investments: The Fund invested a portion of its assets in structured investments. A structured investment is a derivative security designed to offer a return linked to a particular underlying security, currency, commodity or market. Structured investments may come in various forms including notes (such as exchange-traded notes), warrants and options to purchase securities. The Fund will typically use structured investments to gain exposure to a permitted underlying security, currency, commodity or market when direct access to a market is limited or inefficient from a tax or cost standpoint. There can be no assurance that structured investments will trade at the same price or have the same value as the underlying security, currency, commodity or market. Investments in structured investments involve risks including issuer risk, counterparty risk and market risk. Holders of structured investments bear risks of the underlying investment and are subject to issuer or counterparty risk because the Fund is relying on the creditworthiness of such issuer or counterparty and has no rights with respect to the underlying investment. Certain structured investments may be thinly traded or have a limited trading market and may have the effect of increasing the Fund's illiquidity to the extent that the Fund, at a particular time, may be unable to find qualified buyers for these securities.
5. Derivatives: The Fund may, but is not required to, use derivative instruments for a variety of purposes, including hedging, risk management, portfolio management or to earn income. Derivatives are financial instruments whose
value is based, in part, on the value of an underlying asset, interest rate, index or financial instrument. Prevailing interest rates and volatility levels, among other things, also affect the value of derivative instruments. A derivative instrument often has risks similar to its underlying asset and may have additional risks, including imperfect correlation between the value of the derivative and the underlying asset, risks of default by the counterparty to certain transactions, magnification of losses incurred due to changes in the market value of the securities, instruments, indices or interest rates to which the derivative instrument relates, risks that the transactions may not be liquid and risks arising from margin requirements. The use of derivatives involves risks that are different from, and possibly greater than, the risks associated with other portfolio investments. Derivatives may involve the use of highly specialized instruments that require investment techniques and risk analyses different from those associated with other portfolio investments. All of the Fund's holdings, including derivative instruments, are marked-to-market each day with the change in value reflected in unrealized appreciation (depreciation). Upon disposition, a realized gain or loss is recognized.
Certain derivative transactions may give rise to a form of leverage. Leverage magnifies the potential for gain and the risk of loss. Leverage associated with derivative transactions may cause the Fund to liquidate portfolio positions when it may not be advantageous to do so to satisfy its obligations or to meet earmarking or segregation requirements, pursuant to applicable Securities and Exchange Commission ("SEC") rules and regulations, or may cause the Fund to be more volatile than if the Fund had not been leveraged. Although the Adviser seeks to use derivatives to further the Fund's investment objectives, there is no assurance that the use of derivatives will achieve this result.
Following is a description of the derivative instruments and techniques that the Fund used during the period and their associated risks:
Foreign Currency Forward Exchange Contracts: In connection with its investments in foreign securities, the Fund also entered into contracts with banks, brokers or dealers to purchase or sell securities or foreign currencies at a future date. A foreign currency forward exchange contract ("currency contract") is a negotiated agreement between the contracting parties to exchange a specified
25
Morgan Stanley Institutional Fund, Inc.
Annual Report — December 31, 2017
Notes to Financial Statements (cont'd)
amount of currency at a specified future time at a specified rate. The rate can be higher or lower than the spot rate between the currencies that are the subject of the contract. Currency contracts may be used to protect against uncertainty in the level of future foreign currency exchange rates or to gain or modify exposure to a particular currency. To the extent hedged by the use of currency contracts, the precise matching of the currency contract amounts and the value of the securities involved will not generally be possible because the future value of such securities in foreign currencies will change as a consequence of market movements in the value of those securities between the date on which the contract is entered into and the date it matures. Furthermore, such transactions may reduce or preclude the opportunity for gain if the value of the currency should move in the direction opposite to the position taken. There is additional risk to the extent that currency contracts create exposure to currencies in which the Fund's securities are not denominated. Unanticipated changes in currency prices may result in poorer overall performance for the Fund than if it had not entered into such contracts. The use of currency contracts involves the risk of loss from the insolvency or bankruptcy of the counterparty to the contract or the failure of the counterparty to make payments or otherwise comply with the terms of the contract. A currency contract is marked-to-market daily and the change in market value is recorded by the Fund as unrealized gain or loss. The Fund records realized gains (losses) when the currency contract is closed equal to the difference between the value of the currency contract at the time it was opened and the value at the time it was closed.
Futures: A futures contract is a standardized, exchange-traded agreement to buy or sell a specific quantity of an underlying asset, reference rate or index at a specific price at a specific future time. The value of a futures contract tends to increase and decrease in tandem with the value of the underlying instrument. Depending on the terms of the particular contract, futures contracts are settled through either physical delivery of the underlying instrument on the settlement date or by payment of a cash settlement amount on the settlement date. During the period the futures contract is open, payments are received from or made to the broker based upon changes in the value of the contract (the variation margin). A
decision as to whether, when and how to use futures contracts involves the exercise of skill and judgment and even a well-conceived futures transaction may be unsuccessful because of market behavior or unexpected events. In addition to the derivatives risks discussed above, the prices of futures contracts can be highly volatile, using futures contracts can lower total return, and the potential loss from futures contracts can exceed the Fund's initial investment in such contracts. No assurance can be given that a liquid market will exist for any particular futures contract at any particular time. There is also the risk of loss by the Fund of margin deposits in the event of bankruptcy of a broker with which the Fund has open positions in the futures contract.
Swaps: The Fund may enter into OTC swap contracts or cleared swap transactions. A swap contract is an agreement between two parties pursuant to which the parties exchange payments at specified dates on the basis of a specified notional amount, with the payments calculated by reference to specified securities, indices, reference rates, currencies or other instruments. Typically swap agreements provide that when the period payment dates for both parties are the same, the payments are made on a net basis (i.e., the two payment streams are netted out, with only the net amount paid by one party to the other). The Fund's obligations or rights under a swap contract entered into on a net basis will generally be equal only to the net amount to be paid or received under the agreement, based on the relative values of the positions held by each party. Cleared swap transactions may help reduce counterparty credit risk. In a cleared swap, the Fund's ultimate counterparty is a clearinghouse rather than a swap dealer, bank or other financial institution. OTC swap agreements are not entered into or traded on exchanges and often there is no central clearing or guaranty function for OTC swaps. These OTC swaps are often subject to credit risk or the risk of default or non-performance by the counterparty. Both OTC and cleared swaps could result in losses if interest rates, foreign currency exchange rates or other factors are not correctly anticipated by the Fund or if the reference index, security or investments do not perform as expected. During the period swap agreements are open, payments are received from or made to the clearinghouse or counterparty based upon changes in the value of the contract (variation margin). The Dodd-Frank
26
Morgan Stanley Institutional Fund, Inc.
Annual Report — December 31, 2017
Notes to Financial Statements (cont'd)
Wall Street Reform and Consumer Protection Act and related regulatory developments require the clearing and exchange-trading of certain standardized swap transactions. Mandatory exchange-trading and clearing is occurring on a phased-in basis.
When the Fund has an unrealized loss on a swap agreement, the Fund has instructed the custodian to pledge cash or liquid securities as collateral with a value approximately equal to the amount of the unrealized loss. Collateral pledges are monitored and subsequently adjusted if and when the swap valuations fluctuate. If applicable, cash collateral is included with "Due from (to) Broker" in the Statement of Assets and Liabilities.
Upfront payments paid or received by the Fund will be reflected as an asset or liability, respectively, in the Statement of Assets and Liabilities.
As of December 31, 2017, the Fund did not have any open swap agreements.
FASB ASC 815, "Derivatives and Hedging" ("ASC 815"), is intended to improve financial reporting about derivative instruments by requiring enhanced disclosures to enable investors to better understand how and why the Fund uses derivative instruments, how these derivative instruments are accounted for and their effects on the Fund's financial position and results of operations.
The following tables set forth the fair value of the Fund's derivative contracts by primary risk exposure as of December 31, 2017.
| | | Asset Derivatives
Statement of Assets and
Liabilities Location | | Primary Risk
Exposure | | Value
(000) | |
Foreign Currency
Forward Exchange
Contracts | | Unrealized Appreciation on
Foreign Currency Forward
Exchange Contracts | |
Currency Risk | | $ | 53 | | |
Futures Contract | | Variation Margin on
Futures Contract | |
Interest Rate Risk | | | 2 | (a) | |
Total | | | | | | $ | 55 | | |
| | | Liability Derivatives
Statement of Assets and
Liabilities Location | | Primary Risk
Exposure | | Value
(000) | |
Foreign Currency
Forward Exchange
Contracts | | Unrealized Depreciation on
Foreign Currency Forward
Exchange Contracts | |
Currency Risk | | $ | (33 | ) | |
(a) This amount represents the cumulative appreciation (depreciation) as reported in the Portfolio of Investments. The Statement of Assets and Liabilities only reflects the current day's net variation margin.
The following tables set forth by primary risk exposure the Fund's realized gains (losses) and change in unrealized appreciation (depreciation) by type of derivative contract for the year ended December 31, 2017 in accordance with ASC 815.
Realized Gain (Loss) | |
Primary Risk Exposure | | Derivative Type | | Value
(000) | |
Currency Risk | | Foreign Currency Forward
Exchange Contracts | | $ | (73 | ) | |
Interest Rate Risk | | Futures Contracts | | | (7 | ) | |
Interest Rate Risk | | Swap Agreements | | | 5 | | |
Total | | | | $ | (75 | ) | |
Change in Unrealized Appreciation (Depreciation) | |
Primary Risk Exposure | | Derivative Type | | Value
(000) | |
Currency Risk | | Foreign Currency Forward
Exchange Contracts | | $ | 30 | | |
Interest Rate Risk | | Futures Contracts | | | 6 | | |
Total | | | | $ | 36 | | |
At December 31, 2017, the Fund's derivative assets and liabilities are as follows:
Gross Amounts of Assets and Liabilities
Presented in the Statement of Assets and Liabilities | |
Derivatives(b) | | Assets(c)
(000) | | Liabilities(c)
(000) | |
Foreign Currency Forward Exchange Contracts | | $ | 53 | | | $ | 33 | | |
(b) Excludes exchange traded derivatives.
(c) Absent an event of default or early termination, OTC derivative assets and liabilities are presented gross and not offset in the Statement of Assets and Liabilities.
The Fund typically enters into International Swaps and Derivatives Association, Inc. Master Agreements ("ISDA Master Agreements") or similar master agreements (collectively, "Master Agreements") with its contract counterparties for certain OTC derivatives in order to, among other things, reduce its credit risk to counterparties. ISDA Master Agreements include provisions for general obligations, representations, collateral and events of default or termination. Under an ISDA Master Agreement, the Fund typically may offset with the counterparty certain OTC derivative financial instruments' payables and/or receivables with collateral held and/or posted and create one single net payment (close-out netting) in the event of default, termination and/or potential deterioration in the credit quality of the counterparty. Various Master Agreements govern the terms of certain transactions with counterparties, including transactions such as swap, forward, repurchase and reverse repurchase agreements. These Master Agreements typically attempt to reduce the counterparty risk associated with such transactions by specifying credit
27
Morgan Stanley Institutional Fund, Inc.
Annual Report — December 31, 2017
Notes to Financial Statements (cont'd)
protection mechanisms and providing standardization that improves legal certainty. Cross-termination provisions under Master Agreements typically provide that a default in connection with one transaction between the Fund and a counterparty gives the non-defaulting party the right to terminate any other transactions in place with the defaulting party to create one single net payment due to/due from the defaulting party and may be a feature in certain Master Agreements. In the event the Fund exercises its right to terminate a Master Agreement after a counterparty experiences a termination event as defined in the Master Agreement, the return of collateral with market value in excess of the Fund's net liability may be delayed or denied.
The following tables present derivative financial instruments that are subject to enforceable netting arrangements as of December 31, 2017.
Gross Amounts Not Offset in the Statement of Assets and Liabilities | |
Counterparty | | Gross Asset
Derivatives
Presented in
Statement of
Assets and
Liabilities
(000) | | Financial
Instrument
(000) | | Collateral
Received
(000) | | Net
Amount
(not less
than $0)
(000) | |
JPMorgan Chase Bank NA | | $ | 52 | | | $ | (33 | ) | | $ | — | | | $ | 19 | | |
State Street Bank and Trust Co. | | | 1 | | | | — | | | | — | | | | 1 | | |
Total | | $ | 53 | | | $ | (33 | ) | | $ | — | | | $ | 20 | | |
Gross Amounts Not Offset in the Statement of Assets and Liabilities | |
Counterparty | | Gross Liability
Derivatives
Presented in
Statement of
Assets and
Liabilities
(000) | | Financial
Instrument
(000) | | Collateral
Pledged
(000) | | Net
Amount
(not less
than $0)
(000) | |
JPMorgan Chase Bank NA | | $ | 33 | | | $ | (33 | ) | | $ | — | | | $ | 0 | | |
For the year ended December 31, 2017, the approximate average monthly amount outstanding for each derivative type is as follows:
Foreign Currency Forward Exchange Contracts: | |
Average monthly principal amount | | $ | 5,768,000 | | |
Futures Contracts: | |
Average monthly original value | | $ | 219,000 | | |
Swap Agreements: | |
Average monthly notional amount | | $ | 52,000 | | |
6. Redemption Fees: The Fund will assess a 2% redemption fee on Class I shares, Class A shares, Class L shares, Class C shares and Class IS shares, which is paid directly to the Fund, for shares redeemed or exchanged within
thirty days of purchase, subject to certain exceptions. The redemption fee is designed to protect the Fund and its remaining shareholders from the effects of short-term trading. These fees, if any, are included in the Statements of Changes in Net Assets.
7. Indemnifications: The Company enters into contracts that contain a variety of indemnifications. The Company's maximum exposure under these arrangements is unknown. However, the Company has not had prior claims or losses pursuant to these contracts and expects the risk of loss to be remote.
8. Dividends and Distributions to Shareholders: Dividends and distributions to shareholders are recorded on the ex-dividend date. Dividends from net investment income, if any, are declared and paid quarterly. Net realized capital gains, if any, are distributed at least annually.
9. Security Transactions, Income and Expenses: Security transactions are accounted for on the trade date (date the order to buy or sell is executed). Realized gains and losses on the sale of investment securities are determined on the specific identified cost method. Dividend income and other distributions are recorded on the ex-dividend date (except for certain foreign dividends which may be recorded as soon as the Fund is informed of such dividends) net of applicable withholding taxes. Interest income is recognized on the accrual basis except where collection is in doubt. Discounts are accreted and premiums are amortized over the life of the respective securities. Most expenses of the Company can be directly attributed to a particular Fund. Expenses which cannot be directly attributed are apportioned among the Funds based upon relative net assets or other appropriate methods. Income, expenses (other than class specific expenses — distribution and shareholder services, transfer agency and sub transfer agency fees) and realized and unrealized gains or losses are allocated to each class of shares based upon their relative net assets.
B. Advisory Fees: The Adviser, a wholly-owned subsidiary of Morgan Stanley, provides the Fund with advisory services under the terms of an Investment Advisory Agreement, paid quarterly, at the annual rate based on the daily net assets as follows:
First $500
million | | Next $500
million | | Over $1
billion | |
| | 0.75 | % | | | 0.70 | % | | | 0.65 | % | |
28
Morgan Stanley Institutional Fund, Inc.
Annual Report — December 31, 2017
Notes to Financial Statements (cont'd)
For the year ended December 31, 2017, the advisory fee rate (net of waiver/rebate) was equivalent to an annual effective rate of 0.00% of the Fund's average daily net assets.
The Adviser has agreed to reduce its advisory fee and/or reimburse the Fund so that total annual portfolio operating expenses, excluding certain investment related expenses, taxes, interest and other extraordinary expenses (including litigation), will not exceed 0.85% for Class I shares, 1.20% for Class A shares, 1.45% for Class L shares, 1.95% for Class C shares and 0.82% for Class IS shares. The fee waivers and/or expense reimbursements will continue for at least one year from the date of the Fund's prospectus or until such time as the Directors act to discontinue all or a portion of such waivers and/or reimbursements when they deem such action is appropriate. For the year ended December 31, 2017, approximately $185,000 of advisory fees were waived and approximately $111,000 of other expenses were reimbursed by the Adviser pursuant to this arrangement.
C. Administration Fees: The Adviser also serves as Administrator to the Company and provides administrative services pursuant to an Administration Agreement for an annual fee, accrued daily and paid monthly, of 0.08% of the Fund's average daily net assets.
Under a Sub-Administration Agreement between the Administrator and State Street Bank and Trust Company ("State Street"), State Street provides certain administrative services to the Company. For such services, the Administrator pays State Street a portion of the fee the Administrator receives from the Fund.
D. Distribution and Shareholder Services Fees: Morgan Stanley Distribution, Inc. ("MSDI" or the "Distributor"), a wholly-owned subsidiary of the Adviser and an indirect subsidiary of Morgan Stanley, serves as the Company's Distributor of Fund shares pursuant to a Distribution Agreement. The Company has adopted a Shareholder Services Plan with respect to Class A shares pursuant to Rule 12b-1 under the Act. Under the Shareholder Services Plan, the Fund pays the Distributor a shareholder services fee, accrued daily and paid monthly, at an annual rate of 0.25% of the Fund's average daily net assets attributable to Class A shares.
The Company has adopted a Distribution and Shareholder Services Plan with respect to Class L shares pursuant to
Rule 12b-1 under the Act. Under the Distribution and Shareholder Services Plan, the Fund pays the Distributor a distribution fee, accrued daily and paid monthly, at an annual rate of 0.25% and a shareholder services fee, accrued daily and paid monthly, at an annual rate of 0.25% of the Fund's average daily net assets attributable to Class L shares.
The Company has adopted a Distribution and Shareholder Services Plan with respect to Class C shares pursuant to Rule 12b-1 under the Act. Under the Distribution and Shareholder Services Plan, the Fund pays the Distributor a distribution fee, accrued daily and paid monthly, at an annual rate of 0.75% and a shareholder services fee, accrued daily and paid monthly, at an annual rate of 0.25% of the Fund's average daily net assets attributable to Class C shares.
The distribution and shareholder services fees are used to support the expenses associated with servicing and maintaining accounts. The Distributor may compensate other parties for providing shareholder support services to investors who purchase Class A, Class L and Class C shares.
E. Dividend Disbursing and Transfer Agent: The Company's dividend disbursing and transfer agent is Boston Financial Data Services, Inc. ("BFDS"). Pursuant to a Transfer Agency Agreement, the Company pays BFDS a fee based on the number of classes, accounts and transactions relating to the Funds of the Company. Effective January 1, 2018, BFDS changed its name to DST Asset Manager Solutions, Inc.
F. Custodian Fees: State Street (the "Custodian") also serves as Custodian for the Company in accordance with a Custodian Agreement. The Custodian holds cash, securities, and other assets of the Company as required by the Act. Custody fees are payable monthly based on assets held in custody, investment purchases and sales activity and account maintenance fees, plus reimbursement for certain out-of-pocket expenses.
G. Security Transactions and Transactions with Affiliates: For the year ended December 31, 2017, purchases and sales of investment securities for the Fund, other than long-term U.S. Government securities and short-term investments, were approximately $18,534,000 and $17,815,000, respectively. There were no purchases and sales of long-term U.S. Government securities for the year ended December 31, 2017.
The Fund invests in the Institutional Class of the Morgan Stanley Institutional Liquidity Funds — Treasury Securities
29
Morgan Stanley Institutional Fund, Inc.
Annual Report — December 31, 2017
Notes to Financial Statements (cont'd)
Portfolio (the "Liquidity Funds"), an open-end management investment company managed by the Adviser. Advisory fees paid by the Fund are reduced by an amount equal to its pro-rata share of the advisory and administration fees paid by the Fund due to its investment in the Liquidity Funds. For the year ended December 31, 2017, advisory fees paid were reduced by approximately $1,000 relating to the Fund's investment in the Liquidity Funds.
A summary of the Fund's transactions in shares of the Liquidity Funds during the year ended December 31, 2017 is as follows:
Affiliated
Investment
Company | | Value
December 31,
2016
(000) | | Purchases
at Cost
(000) | | Proceeds
from Sales
(000) | | Dividend
Income
(000) | |
Liquidity Funds | | $ | 1,125 | | | $ | 11,633 | | | $ | 12,585 | | | $ | 6 | | |
Affiliated
Investment
Company (cont'd) | | Realized
Gain
(Loss)
(000) | | Change in
Unrealized
Appreciation
(Depreciation)
(000) | | Value
December 31,
2017
(000) | |
Liquidity Funds | | $ | — | | | $ | — | | | $ | 173 | | |
The Fund is permitted to purchase and sell securities ("cross-trade") from and to other Morgan Stanley Funds as well as other funds and client accounts for which the Adviser or an affiliate of the Adviser serves as investment adviser, pursuant to procedures approved by the Directors in compliance with Rule 17a-7 under the Act (the "Rule"). Each cross-trade is executed at the current market price in compliance with provisions of the Rule. For the year ended December 31, 2017, the Fund did not engage in any cross-trade transactions.
The Fund has an unfunded Deferred Compensation Plan (the "Compensation Plan"), which allows each independent Director to defer payment of all, or a portion, of the fees he or she receives for serving on the Board of Directors. Each eligible Director generally may elect to have the deferred amounts credited with a return equal to the total return on one or more of the Morgan Stanley funds that are offered as investment options under the Compensation Plan. Appreciation/depreciation and distributions received from these investments are recorded with an offsetting increase/decrease in the deferred compensation obligation and do not affect the NAV of the Fund.
H. Federal Income Taxes: It is the Fund's intention to continue to qualify as a regulated investment company and distribute all of its taxable and tax-exempt income. Accordingly, no provision for federal income taxes is required in the financial statements.
The Fund may be subject to taxes imposed by countries in which it invests. Such taxes are generally based on income and/or capital gains earned or repatriated. Taxes are accrued based on net investment income, net realized gains and net unrealized appreciation as such income and/or gains are earned. Taxes may also be based on transactions in foreign currency and are accrued based on the value of investments denominated in such currency.
FASB ASC 740-10, "Income Taxes — Overall", sets forth a minimum threshold for financial statement recognition of the benefit of a tax position taken or expected to be taken in a tax return. Management has concluded there are no significant uncertain tax positions that would require recognition in the financial statements. If applicable, the Fund recognizes interest accrued related to unrecognized tax benefits in "Interest Expense" and penalties in "Other Expenses" in the Statement of Operations. The Fund files tax returns with the U.S. Internal Revenue Service, New York and various states. Each of the tax years in the four-year period ended December 31, 2017, remains subject to examination by taxing authorities.
The tax character of distributions paid may differ from the character of distributions shown in the Statements of Changes in Net Assets due to short-term capital gains being treated as ordinary income for tax purposes. The tax character of distributions paid during fiscal years 2017 and 2016 was as follows:
2017
Distributions
Paid From: | | 2016
Distributions
Paid From: | |
Ordinary
Income
(000) | | Long-Term
Capital Gain
(000) | | Ordinary
Income
(000) | | Long-Term
Capital Gain
(000) | |
| $ | 1,431 | | | $ | — | | | $ | 1,380 | | | $ | — | | |
The amount and character of income and gains to be distributed are determined in accordance with income tax regulations which may differ from GAAP. These book/tax differences are either considered temporary or permanent in nature.
Temporary differences are primarily due to differing book and tax treatments in the timing of the recognition of gains (losses) on certain investment transactions and the timing of the deductibility of certain expenses.
Permanent differences, primarily due to differing treatments of gains (losses) related to foreign currency transactions, basis adjustments for swap transactions, foreign capital gains tax and a
30
Morgan Stanley Institutional Fund, Inc.
Annual Report — December 31, 2017
Notes to Financial Statements (cont'd)
nondeductible expense, resulted in the following reclassifications among the components of net assets at December 31, 2017:
Distributions in
Excess of
Net Investment
Income
(000) | | Accumulated
Net Realized
Loss
(000) | | Paid-in-
Capital
(000) | |
| $ | (145 | ) | | $ | 147 | | | $ | (2 | ) | |
At December 31, 2017, the components of distributable earnings for the Fund on a tax basis were as follows:
Undistributed
Ordinary
Income
(000) | | Undistributed
Long-Term
Capital Gain
(000) | |
| $ | 105 | | | $ | — | | |
At December 31, 2017, the Fund had available for federal income tax purposes unused short term and long term capital losses of approximately $1,063,000 and $3,418,000, respectively, that do not have an expiration date. These amounts include capital losses acquired from MSIF Emerging Markets Domestic Debt that may be subject to limitation under IRC Section 382 in future years.
To the extent that capital loss carryforwards are used to offset any future capital gains realized, no capital gains tax liability will be incurred by the Fund for gains realized and not distributed. To the extent that capital gains are offset, such gains will not be distributed to the shareholders. During the year ended December 31, 2017, the Fund utilized capital loss carryforwards for U.S. federal income tax purposes of approximately $625,000.
I. Credit Facility: The Company and other Morgan Stanley funds participated in a $150,000,000 committed, unsecured revolving line of credit facility (the "Facility") with State Street. This Facility is to be used for temporary emergency purposes or funding of shareholder redemption requests. The interest rate on borrowings is based on the federal funds rate or 1 month LIBOR rate plus a spread. The Facility also has a commitment fee of 0.25% per annum based on the unused portion of the Facility. During the year ended December 31, 2017, the Fund did not have any borrowings under the Facility.
J. Other: At December 31, 2017, the Fund did not have record owners of 10% or greater.
31
Morgan Stanley Institutional Fund, Inc.
Annual Report — December 31, 2017
Report of Independent Registered Public Accounting Firm
To the Shareholders and Board of Directors of
Morgan Stanley Institutional Fund, Inc. —
Emerging Markets Fixed Income Opportunities Portfolio
Opinion on the Financial Statements
We have audited the accompanying statement of assets and liabilities of Emerging Markets Fixed Income Opportunities Portfolio (the "Fund") (one of the funds constituting the Morgan Stanley Institutional Fund, Inc. (the "Company")), including the portfolio of investments, as of December 31, 2017, and the related statement of operations for the year then ended, the statements of changes in net assets for each of the two years in the period then ended, the financial highlights for each of the five years in the period then ended and the related notes (collectively referred to as the "financial statements"). In our opinion, the financial statements present fairly, in all material respects, the financial position of Emerging Markets Fixed Income Opportunities Portfolio (one of the funds constituting Morgan Stanley Institutional Fund, Inc.) at December 31, 2017, the results of its operations for the year then ended, the changes in its net assets for each of the two years in the period then ended and its financial highlights for each of the five years in the period then ended, in conformity with U.S. generally accepted accounting principles.
Basis for Opinion
These financial statements are the responsibility of the Company's management. Our responsibility is to express an opinion on the Fund's financial statements based on our audits. We are a public accounting firm registered with the Public Company Accounting Oversight Board (United States) ("PCAOB") and are required to be independent with respect to the Company in accordance with the U.S. federal securities law and the applicable rules and regulations of the Securities and Exchange Commission and the PCAOB.
We conducted our audits in accordance with the standards of the PCAOB. Those standards require that we plan and perform the audit to obtain reasonable assurance about whether the financial statements are free of material misstatement, whether due to error or fraud. The Company is not required to have, nor were we engaged to perform, an audit of the Company's internal control over financial reporting. As part of our audits, we are required to obtain an understanding of internal control over financial reporting, but not for the purpose of expressing an opinion on the effectiveness of the Company's internal control over financial reporting. Accordingly, we express no such opinion.
Our audits included performing procedures to assess the risks of material misstatement of the financial statements, whether due to error or fraud, and performing procedures that respond to those risks. Such procedures included examining, on a test basis, evidence regarding the amounts and disclosures in the financial statements. Our procedures included confirmation of securities owned as of December 31, 2017 by correspondence with the custodian and others or by other appropriate auditing procedures where replies from others were not received. Our audits also included evaluating the accounting principles used and significant estimates made by management, as well as evaluating the overall presentation of the financial statements. We believe that our audits provide a reasonable basis for our opinion.

We have served as the auditor of one or more Morgan Stanley investment companies since 2000.
Boston, Massachusetts
February 26, 2018
32
Morgan Stanley Institutional Fund, Inc.
Annual Report — December 31, 2017
Privacy Notice (unaudited)
MORGAN STANLEY INVESTMENT MANAGEMENT INC.
AN IMPORTANT NOTICE CONCERNING OUR U.S. PRIVACY POLICY
We are required by federal law to provide you with a copy of our privacy policy annually. This policy applies to current and former individual investors in funds managed or sponsored by Morgan Stanley Investment Management Inc. ("MSIM") as well as current and former individual clients of MSIM. This policy is not applicable to partnerships, corporations, trusts or other non-individual clients or investors. Please note that we may amend this policy at any time, and will inform you of any changes as required by law.
WE RESPECT YOUR PRIVACY
We appreciate that you have provided us with your personal financial information. We strive to maintain the privacy of such information while we help you achieve your financial objectives. This Notice describes what non-public personal information we collect about you, why we collect it, when we may share it with others and how certain others may use it. It discusses the steps you may take to limit our sharing of certain information about you to affiliated companies in the Morgan Stanley family of companies ("other Morgan Stanley companies"). It also discloses how you may limit use of certain shared information for marketing purposes by other Morgan Stanley branded companies. Throughout this policy, we refer to the non-public information that personally identifies you or your accounts as "personal information.''
1. WHAT PERSONAL INFORMATION DO WE COLLECT ABOUT YOU?
We obtain personal information from applications and other forms you submit to us, from your dealings with us, from consumer reporting agencies, from our Web sites and from third parties and other sources.
For example:
• We may collect information such as your name, address, e-mail address, telephone/fax numbers, assets, income and investment objectives through subscription documents, applications and other forms you submit to us.
• We may obtain information about account balances, your use of account(s) and the types of products and services you prefer to receive from us through your dealings and transactions with us and other sources.
• We may obtain information about your creditworthiness and credit history from consumer reporting agencies.
• We may collect background information from and through third-party vendors to verify representations you have made and to comply with various regulatory requirements.
• If you interact with us through our public and private Web sites, we may collect information that you provide directly through online communications (such as an e-mail address). We may also collect information about your Internet service provider, your domain name, your computer's operating system and Web browser, your use of our Web sites and your product and service preferences, through the use of "cookies." Please consult the Terms of Use of these sites for more details.
2. WHEN DO WE DISCLOSE PERSONAL INFORMATION WE COLLECT ABOUT YOU?
We may disclose personal information we collect about you to other Morgan Stanley companies and to non-affiliated third parties.
a. Information We Disclose to Other Morgan Stanley Companies.
We may disclose personal information to other Morgan Stanley companies for a variety of reasons, including to manage your account(s) effectively, to service and process your transactions, to let you know about products and services offered by us and other Morgan Stanley companies, to manage our business, and as otherwise required or permitted by law. Offers for products and services from other Morgan Stanley companies are developed under conditions designed to safeguard your personal information.
33
Morgan Stanley Institutional Fund, Inc.
Annual Report — December 31, 2017
Privacy Notice (unaudited) (cont'd)
b. Information We Disclose to Non-affiliated Third Parties.
We do not disclose personal information that we collect about you to non-affiliated third parties except to those who provide marketing services on our behalf, to financial institutions with whom we have joint marketing agreements, and as otherwise required or permitted by law. For example, we may disclose personal information to non-affiliated third parties for servicing and processing transactions, to offer our own products and services, to protect against fraud, for institutional risk control, to respond to judicial process or to perform services on our behalf. When we share personal information with a non-affiliated third party, they are required to limit their use of personal information to the particular purpose for which it was shared and they are not allowed to share personal information with others except to fulfill that limited purpose or as may be permitted or required by law.
3. HOW DO WE PROTECT THE SECURITY AND CONFIDENTIALITY OF PERSONAL INFORMATION WE COLLECT ABOUT YOU?
We maintain physical, electronic and procedural security measures to help safeguard the personal information we collect about you. We have internal policies governing the proper handling of client information. Third parties that provide support or marketing services on our behalf may also receive personal information, and we require them to adhere to confidentiality standards with respect to such information.
4. HOW CAN YOU LIMIT THE SHARING OF CERTAIN TYPES OF PERSONAL INFORMATION WITH OTHER MORGAN STANLEY COMPANIES?
We offer you choices as to whether we share with other Morgan Stanley companies the personal information that was collected to determine your eligibility for products and services you request ("eligibility information"). Eligibility information does not include your identification information or personal information pertaining to our transactions or experiences with you. Please note that, even if you direct us not to share eligibility information with other Morgan Stanley companies ("opt-out"), we may still share personal information, including eligibility information, with those companies in circumstances excluded from the opt-out under applicable law, such as to process transactions or to service your account.
5. HOW CAN YOU LIMIT THE USE OF CERTAIN TYPES OF PERSONAL INFORMATION BY OTHER MORGAN STANLEY COMPANIES FOR MARKETING?
By following the opt-out instructions in Section 6 below, you may limit other Morgan Stanley branded companies from marketing their products or services to you based on personal information we disclose to them. This information may include, for example, your income and account history with us. Please note that, even if you choose to limit Other Morgan Stanley Companies from using personal information about you that we may share with them for marketing their products and services to you, Other Morgan Stanley Companies may use your personal information that they obtain from us to market to you in circumstances permitted by law, such as if the Other Morgan Stanley Company has its own relationship with you.
6. HOW CAN YOU SEND US AN OPT-OUT INSTRUCTION?
If you wish to limit our sharing of eligibility information about you with other Morgan Stanley companies or other Morgan Stanley companies' use of personal information for marketing purposes, as described in this notice, you may do so by:
• Calling us at (800) 548-7786
Monday–Friday between 8a.m. and 6p.m.(EST)
• Writing to us at the following address:
DST Asset Manager Solutions, Inc.
c/o Privacy Coordinator
P.O. Box 219804
Kansas City, Missouri 64121
34
Morgan Stanley Institutional Fund, Inc.
Annual Report — December 31, 2017
Privacy Notice (unaudited) (cont'd)
Your written request should include your name, address, telephone number and account number(s) to which the opt-out applies and whether you are opting out with respect to sharing of eligibility information (Section 4 above), or if information used for Marketing (Section 5 above) or both. Written opt-out requests should not be sent with any other correspondence. In order to process your request, we require that the request be provided by you directly and not through a third party.
Your opt-out preference will remain in effect with respect to this policy (as it may be amended) until you notify us otherwise. If you have a joint account, your direction for us not to share this information with other Morgan Stanley companies and for those other Morgan Stanley companies not to use your personal information for marketing will be applied to all account holders on that account. Please understand that if you limit our sharing or our affiliated companies' use of personal information, you and any joint account holder(s) may not receive information about Morgan Stanley products and services, including products or services that could help you manage your financial resources and achieve your investment objectives.
7. WHAT IF AN AFFILIATED COMPANY BECOMES A NON-AFFILIATED THIRD PARTY?
If, at any time in the future, an affiliated company becomes a non-affiliated third party, further disclosures of personal information made to the former affiliated company will be limited to those described in Section 2(b) above relating to non-affiliated third parties. If you elected under Section 6 to limit disclosures we make to affiliated companies, or use of personal information by affiliated companies, your election will not apply to use by any former affiliated company of your personal information in their possession once it becomes a non-affiliated third party.
SPECIAL NOTICE TO RESIDENTS OF VERMONT
The following section supplements our policy with respect to our individual clients who have a Vermont address and supersedes anything to the contrary in the above policy with respect to those clients only.
The state of Vermont requires financial institutions to obtain your consent prior to sharing personal information that they collect about you with affiliated companies and non-affiliated third parties other than in certain limited circumstances. Except as permitted by law, we will not share personal information we collect about you with non-affiliated third parties or other Morgan Stanley companies unless you provide us with your written consent to share such information ("opt-in").
If you wish to receive offers for investment products and services offered by or through other Morgan Stanley companies, please notify us in writing at the following address:
DST Asset Manager Solutions, Inc.
c/o Privacy Coordinator
P.O. Box 219804
Kansas City, Missouri 64121
Your authorization should include your name, address, telephone number and account number(s) to which the opt-in applies and should not be sent with any other correspondence. In order to process your authorization, we require that the authorization be provided by you directly and not through a third party.
SPECIAL NOTICE TO RESIDENTS OF CALIFORNIA
The following section supplements our policy with respect to our individual clients who have a California address and supersedes anything to the contrary in the above policy with respect to those clients only.
In response to a California law, if your account has a California home address, your personal information will not be disclosed to non-affiliated third parties except as permitted by applicable California law, and we will limit sharing such information with our affiliates to comply with California privacy laws that apply to us.
35
Morgan Stanley Institutional Fund, Inc.
Annual Report — December 31, 2017
Director and Officer Information (unaudited)
Independent Directors:
Name, Age and Address of
Independent Director | | Position(s)
Held with
Registrant | | Length of
Time Served* | | Principal Occupation(s) During Past 5 Years
and Other Relevant Professional Experience | | Number of
Portfolios in
Fund Complex
Overseen by
Independent
Director** | | Other Directorships
Held by Independent
Director*** | |
Frank L. Bowman (73)
c/o Perkins Coie LLP
Counsel to the Independent
Directors
30 Rockefeller Plaza
New York, NY 10112 | | Director | | Since
August
2006 | | President, Strategic Decisions, LLC (consulting) (since February 2009); Director or Trustee of various Morgan Stanley Funds (since August 2006); Chairperson of the Compliance and Insurance Committee (since October 2015); formerly, Chairperson of the Insurance Sub-Committee of the Compliance and Insurance Committee (2007- 2015); served as President and Chief Executive Officer of the Nuclear Energy Institute (policy organization) (February 2005-November 2008); retired as Admiral, U.S. Navy after serving over 38 years on active duty including 8 years as Director of the Naval Nuclear Propulsion Program in the Department of the Navy and the U.S. Department of Energy (1996-2004); served as Chief of Naval Personnel (July 1994-September 1996) and on the Joint Staff as Director of Political Military Affairs (June 1992-July 1994); knighted as Honorary Knight Commander of the Most Excellent Order of the British Empire; awarded the Officier de l'Orde National du Mérite by the French Government; elected to the National Academy of Engineering (2009). | | | 88 | | | Director of BP p.l.c.; Director of Naval and Nuclear Technologies LLP; Director Emeritus of the Armed Services YMCA; Director of the U.S. Naval Submarine League; Member of the National Security Advisory Council of the Center for U.S. Global Engagement and a member of the CNA Military Advisory Board; Trustee of Fairhaven United Methodist Church; and Director of other various non-profit organizations. | |
Kathleen A. Dennis (64)
c/o Perkins Coie LLP
Counsel to the Independent Directors
30 Rockefeller Plaza
New York, NY 10112 | | Director | | Since
August
2006 | | President, Cedarwood Associates (mutual fund and investment management consulting) (since July 2006); Chairperson of the Liquidity and Alternatives Sub-Committee of the Investment Committee (since October 2006) and Director or Trustee of various Morgan Stanley Funds (since August 2006); formerly, Senior Managing Director of Victory Capital Management (1993-2006). | | | 89 | | | Director of various non-profit organizations. | |
Nancy C. Everett (62)
c/o Perkins Coie LLP
Counsel to the Independent Directors
30 Rockefeller Plaza
New York, NY 10112 | | Director | | Since
January
2015 | | Chief Executive Officer, Virginia Commonwealth University Investment Company (since November 2015); Owner, OBIR, LLC (institutional investment management consulting) (since June 2014); formerly, Managing Director, BlackRock Inc. (February 2011-December 2013); and Chief Executive Officer, General Motors Asset Management (a/k/a Promark Global Advisors, Inc.) (June 2005-May 2010). | | | 90 | | | Formerly, Member of Virginia Commonwealth University School of Business Foundation (2005-2016); Member of Virginia Commonwealth University Board of Visitors (2013-2015); Member of Committee on Directors for Emerging Markets Growth Fund, Inc. (2007-2010); Chairperson of Performance Equity Management, LLC (2006-2010); and Chairperson, GMAM Absolute Return Strategies Fund, LLC (2006-2010). | |
36
Morgan Stanley Institutional Fund, Inc.
Annual Report — December 31, 2017
Director and Officer Information (unaudited) (cont'd)
Independent Directors: (cont'd)
Name, Age and Address of
Independent Director | | Position(s)
Held with
Registrant | | Length of
Time Served* | | Principal Occupation(s) During Past 5 Years
and Other Relevant Professional Experience | | Number of
Portfolios in
Fund Complex
Overseen by
Independent
Director** | | Other Directorships
Held by Independent
Director*** | |
Jakki L. Haussler (60)
c/o Perkins Coie LLP
Counsel to the Independent Directors
30 Rockefeller Plaza
New York, NY 10112 | | Director | | Since
January
2015 | | Chairman and Chief Executive Officer, Opus Capital Group (since January 1996); formerly, Director, Capvest Venture Fund, LP (May 2000- December 2011); Partner, Adena Ventures, LP (July 1999-December 2010); Director, The Victory Funds (February 2005- July 2008). | | | 90 | | | Director of Cincinnati Bell Inc. and Member, Audit Committee and Compensation Committee; Director of Northern Kentucky University Foundation and Member, Investment Committee; Member of Chase College of Law Transactional Law Practice Center Board of Advisors; Director of Best Transport; Director of Chase College of Law Board of Visitors; formerly, Member, University of Cincinnati Foundation Investment Committee; Member, Miami University Board of Visitors (2008-2011); Trustee of Victory Funds (2005-2008) and Chairman, Investment Committee (2007-2008) and Member, Service Provider Committee (2005-2008). | |
Dr. Manuel H. Johnson (68)
c/o Johnson Smick
International, Inc.
220 I Street, NE — Suite 200
Washington, D.C. 20002 | | Director | | Since
July
1991 | | Senior Partner, Johnson Smick International, Inc. (consulting firm); Chairperson of the Investment Committee (since October 2006) and Director or Trustee of various Morgan Stanley Funds (since July 1991); Co-Chairman and a founder of the Group of Seven Council (G7C) (international economic commission); formerly, Chairperson of the Audit Committee (July 1991-September 2006), Vice Chairman of the Board of Governors of the Federal Reserve System and Assistant Secretary of the U.S. Treasury. | | | 88 | | | Director of NVR, Inc. (home construction). | |
Joseph J. Kearns (75)
c/o Kearns & Associates LLC
46 E Peninsula Center #385
Rolling Hills Estates,
CA 90274-3712 | | Director | | Since
August
1994 | | Senior Adviser, Kearns & Associates LLC (investment consulting); Chairperson of the Audit Committee (since October 2006) and Director or Trustee of various Morgan Stanley Funds (since August 1994); formerly, Deputy Chairperson of the Audit Committee (July 2003-September 2006) and Chairperson of the Audit Committee of various Morgan Stanley Funds (since August 1994); CFO of the J. Paul Getty Trust. | | | 89 | | | Prior to August 10, 2016, Director of Electro Rent Corporation (equipment leasing); Prior to December 31, 2013, Director of The Ford Family Foundation. | |
37
Morgan Stanley Institutional Fund, Inc.
Annual Report — December 31, 2017
Director and Officer Information (unaudited) (cont'd)
Independent Directors: (cont'd)
Name, Age and Address of
Independent Director | | Position(s)
Held with
Registrant | | Length of
Time Served* | | Principal Occupation(s) During Past 5 Years
and Other Relevant Professional Experience | | Number of
Portfolios in
Fund Complex
Overseen by
Independent
Director** | | Other Directorships
Held by Independent
Director*** | |
Michael F. Klein (59)
c/o Perkins Coie LLP
Counsel to the Independent Directors
30 Rockefeller Plaza
New York, NY 10112 | | Director | | Since
August
2006 | | Managing Director, Aetos Capital, LLC (since March 2000); Co-President, Aetos Alternatives Management, LLC (since January 2004) and Co-Chief Executive Officer of Aetos Capital LLC (since August 2013); Chairperson of the Fixed Income Sub- Committee of the Investment Committee (since October 2006) and Director or Trustee of various Morgan Stanley Funds (since August 2006); formerly, Managing Director, Morgan Stanley & Co. Inc. and Morgan Stanley Dean Witter Investment Management, President, various Morgan Stanley Funds (June 1998-March 2000) and Principal, Morgan Stanley & Co. Inc. and Morgan Stanley Dean Witter Investment Management (August 1997-December 1999). | | | 88 | | | Director of certain investment funds managed or sponsored by Aetos Capital, LLC; Director of Sanitized AG and Sanitized Marketing AG (specialty chemicals). | |
Patricia Maleski (57)
c/o Perkins Coie LLP
Counsel to the Independent Directors
30 Rockefeller Plaza
New York, NY 10112 | | Director | | Since
January
2017 | | Managing Director, JPMorgan Asset Management (2004-2016); Oversight and Control Head of Fiduciary and Conflicts of Interest Program (2015-2016); Chief Control Officer-Global Asset Management (2013-2015); President, JPMorgan Funds (2010-2013); Chief Administrative Officer (2004-2013); various other positions including Treasurer and Board Liaison (since 2001). | | | 90 | | | None. | |
Michael E. Nugent (81)
522 Fifth Avenue
New York, NY 10036 | | Chair of the Board and Director | | Chair of the Boards since July 2006 and Director since July 1991 | | Chair of the Boards of various Morgan Stanley Funds (since July 2006); Chairperson of the Closed-End Fund Committee (since June 2012) and Director or Trustee of various Morgan Stanley Funds (since July 1991); formerly, Chairperson of the Insurance Committee (until July 2006); General Partner, Triumph Capital, L.P. (private investment partnership) (1988-2013). | | | 88 | | | None. | |
W. Allen Reed (70)
c/o Perkins Coie LLP
Counsel to the Independent Directors
30 Rockefeller Plaza
New York, NY 10112 | | Director | | Since
August
2006 | | Chairperson of the Equity Sub-Committee of the Investment Committee (since October 2006) and Director or Trustee of various Morgan Stanley Funds (since August 2006); formerly, President and CEO of General Motors Asset Management; Chairman and Chief Executive Officer of the GM Trust Bank and Corporate Vice President of General Motors Corporation (August 1994-December 2005). | | | 89 | | | Director of Legg Mason, Inc.; formerly, Director of the Auburn University Foundation (2010-2015). | |
Fergus Reid (85)
c/o Joe Pietryka, Inc.
85 Charles Colman Blvd.
Pawling, NY 12564 | | Director | | Since
June
1992 | | Chairman, Joe Pietryka, Inc.; Chairperson of the Governance Committee and Director or Trustee of various Morgan Stanley Funds (since June 1992). | | | 89 | | | Formerly, Trustee and Director of certain investment companies in the JP Morgan Fund Complex managed by JP Morgan Investment Management Inc. (1987-2012). | |
* This is the earliest date the Director began serving the Morgan Stanley Funds. Each Director serves an indefinite term, until his or her successor is elected.
** The Fund Complex includes (as of December 31, 2017) all open-end and closed-end funds (including all of their portfolios) advised by Morgan Stanley Investment Management Inc. (the "Adviser") and any funds that have an adviser that is an affiliated person of the Adviser (including, but not limited to, Morgan Stanley AIP GP LP).
*** This includes any directorships at public companies and registered investment companies held by the Director at any time during the past five years.
38
Morgan Stanley Institutional Fund, Inc.
Annual Report — December 31, 2017
Director and Officer Information (unaudited) (cont'd)
Executive Officers:
Name, Age and Address of Executive Officer | | Position(s) Held
with
Registrant | | Length of Time
Served* | | Principal Occupation(s) During Past 5 Years | |
John H. Gernon (54)
522 Fifth Avenue
New York, NY 10036 | | President and Principal Executive Officer | | Since
September
2013 | | President and Principal Executive Officer of the Equity and Fixed Income Funds and the Morgan Stanley AIP Funds (since September 2013) and the Liquidity Funds and various money market funds (since May 2014) in the Fund Complex; Managing Director of the Adviser; Head of Product (since 2006). | |
Timothy J. Knierim (58)
522 Fifth Avenue
New York, NY 10036 | | Chief Compliance Officer | | Since
December
2016 | | Managing Director of the Adviser and various entities affiliated with the Adviser; Chief Compliance Officer of various Morgan Stanley Funds and the Adviser (since December 2016) and Chief Compliance Officer of Morgan Stanley AIP GP LP (since 2014). Formerly, Managing Director and Deputy Chief Compliance Officer of the Adviser (2014-2016); and formerly, Chief Compliance Officer of Prudential Investment Management, Inc. (2007-2014). | |
Francis J. Smith (52)
522 Fifth Avenue
New York, NY 10036 | | Treasurer and Principal Financial Officer | | Treasurer since July 2003 and Principal Financial Officer since September 2002 | | Manging Director of the Adviser and various entities affiliated with the Adviser; Treasurer (since July 2003) and Principal Financial Officer of various Morgan Stanley Funds (since September 2002). | |
Mary E. Mullin (50)
522 Fifth Avenue
New York, NY 10036 | | Secretary | | Since
June
1999 | | Managing Director of the Adviser; Secretary of various Morgan Stanley Funds (since June 1999). | |
Michael J. Key (38)
522 Fifth Avenue
New York, NY 10036 | | Vice President | | Since
June
2017 | | Vice President of the Equity and Fixed Income Funds, Liquidity Funds, various money market funds and the Morgan Stanley AIP Funds in the Fund Complex (since June 2017); Executive Director of the Adviser; Head of Product Development for Equity and Fixed Income Funds (since August 2013). | |
* This is the earliest date the officer began serving the Morgan Stanley Funds. Each officer serves a one-year term, until his or her successor is elected and qualifies.
39
Morgan Stanley Institutional Fund, Inc.
Annual Report — December 31, 2017
Adviser and Administrator
Morgan Stanley Investment Management Inc.
522 Fifth Avenue
New York, New York 10036
Distributor
Morgan Stanley Distribution, Inc.
522 Fifth Avenue
New York, New York 10036
Dividend Disbursing and Transfer Agent
DST Asset Manager Solutions, Inc.
2000 Crown Colony Drive
Quincy, Massachusetts 02169
Custodian
State Street Bank and Trust Company
One Lincoln Street
Boston, Massachusetts 02111
Legal Counsel
Dechert LLP
1095 Avenue of the Americas
New York, New York 10036
Counsel to the Independent Directors
Perkins Coie LLP
30 Rockefeller Plaza
New York, New York 10112
Independent Registered Public Accounting Firm
Ernst & Young LLP
200 Clarendon Street
Boston, Massachusetts 02116
Reporting to Shareholders
Each Morgan Stanley Fund provides a complete schedule of portfolio holdings in its semi-annual and annual reports within 60 days of the end of the fund's second and fourth fiscal quarters. The semi-annual and annual reports are filed electronically with the Securities and Exchange Commission (SEC) on Form N-CSRS and Form N-CSR, respectively. Morgan Stanley also delivers the semi-annual and annual reports to fund shareholders and makes these reports available on its public website, www.morganstanley.com/im. Each Morgan Stanley fund also files a complete schedule of portfolio holdings with the SEC for the fund's first and third fiscal quarters on Form N-Q. Morgan Stanley does not deliver the reports for the first and third fiscal quarters to shareholders, nor are the reports posted to the Morgan Stanley public website. You may, however, obtain the Form N-Q filings (as well as the Form N-CSR and N-CSRS filings) by accessing the SEC's website, www.sec.gov. You may also review and copy them at the SEC's Public Reference Room in Washington, DC. Information on the operation of the SEC's Public Reference Room may be obtained by calling the SEC toll free at 1 (800) SEC-0330. You can also request copies of these materials, upon payment of a duplicating fee, by electronic request at the SEC's email address (publicinfo@sec.gov) or by writing to the SEC's Public Reference Section, Washington, D.C. 20549-1520.
Proxy Voting Policies and Procedures and Proxy Voting Record
You may obtain a copy of the Company's Proxy Voting Policy and Procedures and information regarding how the Company voted proxies relating to portfolio securities during the most recent twelve-month period ended June 30, without charge, upon request, by calling toll free 1 (800) 548-7786 or by visiting our website at www.morganstanley.com/im. This information is also available on the SEC's website at www.sec.gov.
This report is authorized for distribution only when preceded or accompanied by a prospectus or summary prospectus of the applicable Fund of Morgan Stanley Institutional Fund, Inc., which describes in detail the Fund's investment policies, risks, fees and expenses. Please read the prospectus carefully before you invest or send money. For additional information, including information regarding the investments comprising the Fund, please visit our website at www.morganstanley.com/im or call toll free 1 (800) 548-7786.
40
Printed in U.S.A.
This Report has been prepared for shareholders and may be distributed to others only if preceded or accompanied by a current prospectus.
Morgan Stanley Investment Management Inc.
522 Fifth Avenue
New York, New York 10036
© 2018 Morgan Stanley. Morgan Stanley Distribution, Inc.

IFIEMEDANN
2008147 EXP. 02.28.19

Morgan Stanley Institutional Fund, Inc.
Emerging Markets Leaders Portfolio
Annual Report
December 31, 2017

Morgan Stanley Institutional Fund, Inc.
Annual Report — December 31, 2017
Shareholders' Letter | | | 2 | | |
Expense Example | | | 3 | | |
Investment Overview | | | 4 | | |
Portfolio of Investments | | | 6 | | |
Statement of Assets and Liabilities | | | 8 | | |
Statement of Operations | | | 10 | | |
Statements of Changes in Net Assets | | | 11 | | |
Financial Highlights | | | 13 | | |
Notes to Financial Statements | | | 17 | | |
Report of Independent Registered Public Accounting Firm | | | 24 | | |
Federal Tax Notice | | | 25 | | |
Privacy Notice | | | 26 | | |
Director and Officer Information | | | 29 | | |
This report is authorized for distribution only when preceded or accompanied by a prospectus or summary prospectus of the applicable Fund of Morgan Stanley Institutional Fund, Inc. To receive a prospectus and/or statement of additional information (SAI), which contains more complete information such as investment objectives, charges, expenses, policies for voting proxies, risk considerations, and describes in detail each of the Fund's investment policies to the prospective investor, please call toll free 1 (800) 548-7786. Please read the prospectuses carefully before you invest or send money.
Additionally, you can access information about the Fund, including performance, characteristics, and investment team commentary, through Morgan Stanley Investment Management's website: www.morganstanley.com/im.
Market forecasts provided in this report may not necessarily come to pass. There is no guarantee that any sectors mentioned will continue to perform as discussed herein or that securities in such sectors will be held by the Fund in the future. There is no assurance that a fund will achieve its investment objective. Funds are subject to market risk, which is the possibility that market values of securities owned by the Fund will decline and, therefore, the value of the Fund's shares may be less than what you paid for them. Accordingly, you can lose money investing in this Fund. Please see the prospectus for more complete information on investment risks.
1
Morgan Stanley Institutional Fund, Inc.
Annual Report — December 31, 2017
Shareholders' Letter (unaudited)
Dear Shareholders,
We are pleased to provide this Annual report, in which you will learn how your investment in Emerging Markets Leaders Portfolio (the "Fund") performed during the latest twelve-month period.
Morgan Stanley Investment Management is a client-centric, investor-led organization. Our global presence, intellectual capital, and breadth of products and services enable us to partner with investors to meet the evolving challenges of today's financial markets. We aim to deliver superior investment service and to empower our clients to make the informed decisions that help them reach their investment goals.
As always, we thank you for selecting Morgan Stanley Investment Management, and look forward to working with you in the months and years ahead.
Sincerely,

John H. Gernon
President and Principal Executive Officer
January 2018
2
Morgan Stanley Institutional Fund, Inc.
Annual Report — December 31, 2017
Expense Example (unaudited)
Emerging Markets Leaders Portfolio
As a shareholder of the Fund, you incur two types of costs: (1) transactional costs, including redemption fees; and (2) ongoing costs, which may include advisory fees, administration fees, distribution and shareholder services fees and other Fund expenses. This example is intended to help you understand your ongoing costs (in dollars) of investing in the Fund and to compare these costs with the ongoing costs of investing in other mutual funds.
This example is based on an investment of $1,000 invested at the beginning of the six-month period ended December 31, 2017 and held for the entire six-month period.
Actual Expenses
The table below provides information about actual account values and actual expenses. You may use the information in this table, together with the amount you invested, to estimate the expenses that you paid over the period. Simply divide your account value by $1,000 (for example, an $8,600 account value divided by $1,000 = 8.6), then multiply the result by the number in the table under the heading entitled "Actual Expenses Paid During Period" to estimate the expenses you paid on your account during this period.
Hypothetical Example for Comparison Purposes
The table below provides information about hypothetical account values and hypothetical expenses based on the Fund's actual expense ratio and an assumed rate of return of 5% per year before expenses, which is not the Fund's actual return. The hypothetical account values and expenses may not be used to estimate the actual ending account balance or expenses you paid for the period. You may use this information to compare the ongoing costs of investing in the Fund and other funds. To do so, compare this 5% hypothetical example with the 5% hypothetical examples that appear in the shareholder reports of the other funds.
Please note that the expenses shown in the table are meant to highlight your ongoing costs only and do not reflect any transactional costs, such as sales charges (loads) and redemption fees. Therefore, the information for each class in the table is useful in comparing ongoing costs only, and will not help you determine the relative total costs of owning different funds. In addition, if these transactional costs were included, your costs would have been higher.
| | | Beginning
Account
Value
7/1/17 | | Actual Ending
Account
Value
12/31/17 | | Hypothetical
Ending Account
Value | | Actual
Expenses
Paid
During
Period* | | Hypothetical
Expenses Paid
During Period* | | Net
Expense
Ratio
During
Period** | |
Emerging Markets Leaders Portfolio Class I | | $ | 1,000.00 | | | $ | 1,069.80 | | | $ | 1,019.61 | | | $ | 5.79 | | | $ | 5.65 | | | | 1.11 | % | |
Emerging Markets Leaders Portfolio Class A | | | 1,000.00 | | | | 1,067.90 | | | | 1,017.44 | | | | 8.03 | | | | 7.83 | | | | 1.54 | | |
Emerging Markets Leaders Portfolio Class C | | | 1,000.00 | | | | 1,063.40 | | | | 1,013.66 | | | | 11.91 | | | | 11.62 | | | | 2.29 | | |
Emerging Markets Leaders Portfolio Class IS | | | 1,000.00 | | | | 1,070.00 | | | | 1,019.71 | | | | 5.69 | | | | 5.55 | | | | 1.09 | | |
* Expenses are calculated using each Fund Class' annualized net expense ratio (as disclosed), multiplied by the average account value over the period, and multiplied by 184/365 (to reflect the most recent one-half year period).
** Annualized.
3
Morgan Stanley Institutional Fund, Inc.
Annual Report — December 31, 2017
Investment Overview (unaudited)
Emerging Markets Leaders Portfolio
The Fund seeks long-term capital appreciation.
Performance
For the year ended December 31, 2017, the Fund's Class I shares had a total return based on net asset value and reinvestment of distributions per share of 26.01%, net of fees. The Fund's Class I shares underperformed the Fund's benchmark, the MSCI Emerging Markets Net Index (the "Index"), which returned 37.28%.
Please keep in mind that double-digit returns are highly unusual and cannot be sustained. Investors should also be aware that these returns were primarily achieved during favorable market conditions.
Factors Affecting Performance
• Emerging market (EM) equities performed well during 2017, up 37.28%, as measured by the Index. The Fund's portfolio lagged on a relative basis. Technology companies within EM dominated the broad market surge. While the portfolio benefited from the tech stocks it does own, our bottom-up assessment of individual companies led us to be underweight the sector relative to the Index, which was disadvantageous to performance during the period.
• Only a few countries meaningfully outperformed the Index for the year, two of which were China and Korea. The portfolio is less exposed to China and Korea. We remain cautious on China because of its massive debt build-up since the global financial crisis. We are also underweight Korea as its economy is mainly export-driven, with large trade and economic exposure to China.
• The top contributors to performance over the year were our holdings in a Chinese tech company, a Hong Kong-based luggage company and an Indian consumer electrical products company.
• The largest detractors from performance were our holdings in a South African quick service restaurant company, an Indonesia minimart company and a Korean tech company.
Management Strategies
• EM economic growth is a critical catalyst for strong performance of EM equities. We remain constructive on EM economic growth prospects over the next three to five years. EM equities historically performed well when EM economic differentials were rising relative to developed countries, and we expect this trend to continue for several years.(i) However, we acknowledge that equity markets could experience some short-term correction from any number of potential factors. Within EM, negative fallout could stem from China's massive debt build-up, which could show up in investor disappointment with a weakening in China's macroeconomic data or an increase in non-performing loans.
• We also note that the 2017 rally in EM was unusual in that it lacked a drawdown of magnitude. The maximum EM drawdown in 2017 was just under 5%.(ii) This is the smallest drawdown since 1993, when EM had a 4% drawdown.(ii) The median calendar year drawdown in EM since 1988 is 19%.(ii) Our strategy historically has excelled at protecting capital in down markets and capturing significant excess return relative to the benchmark, driven by its focus on quality and building downside risk expectations into its target price and expected return models.
• Our investment philosophy continues to focus on finding high-quality businesses exposed to sustainable pockets of growth. We remain constructive on companies benefiting from healthy domestic demand, financials benefiting from under-penetrated credit markets and technology companies that are growing for structural reasons.
(i) Source: FactSet, JP Morgan, Morgan Stanley Investment Management, as of July 31, 2017
(ii) Source: Morgan Stanley Investment Management, Bloomberg L.P., and FactSet
4
Morgan Stanley Institutional Fund, Inc.
Annual Report — December 31, 2017
Investment Overview (unaudited) (cont'd)
Emerging Markets Leaders Portfolio
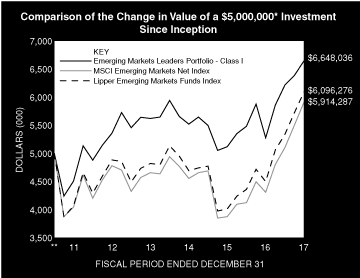
* Minimum Investment for Class I shares
** Commenced Operations on June 30, 2011. The performance shown for the Fund's Class I shares reflects the performance of the Morgan Stanley Emerging Markets Leaders Fund (Cayman) LP, a private fund managed by the Adviser for periods prior to close of business on January 5, 2015, when the Fund acquired substantially all of the assets and liabilities of the Private Fund in exchange for shares of the Fund (the "Emerging Markets Leaders Reorganization").
In accordance with SEC regulations, The Fund's performance shown assumes that all recurring fees (including management fees) were deducted and all dividends and distributions were reinvested. The performance of Class A, C and IS shares will vary from the performance of Class I shares and will be negatively impacted by additional fees assessed to those classes (if applicable).
Performance Compared to the MSCI Emerging Markets Net Index(1) the Lipper Emerging Markets Funds Index(2)
| | Period Ended December 31, 2017
Total Returns(3) | |
| | One
Year | | Five
Years | | Ten
Years | | Since
Inception(6) | |
Fund — Class I Shares
w/o sales charges(4) | | | 26.01 | % | | | 4.41 | % | | | — | | | | 4.48 | % | |
Fund — Class A Shares
w/o sales charges(4) | | | 25.46 | | | | 4.16 | | | | — | | | | 4.28 | | |
Fund — Class A Shares with
maximum 5.25% sales charges(4) | | | 18.82 | | | | 3.03 | | | | — | | | | 3.42 | | |
Fund — Class C Shares
w/o sales charges(5) | | | 24.53 | | | | — | | | | — | | | | 4.83 | | |
Fund — Class C Shares
with maximum 1.00% deferred
sales charges(5) | | | 23.53 | | | | — | | | | — | | | | 4.83 | | |
Fund — Class IS Shares
w/o sales charges(4) | | | 26.02 | | | | 4.42 | | | | — | | | | 4.49 | | |
MSCI Emerging Markets Net Index | | | 37.28 | | | | 4.35 | | | | — | | | | 2.62 | | |
Lipper Emerging Market
Funds Index | | | 35.56 | | | | 4.54 | | | | — | | | | 3.10 | | |
Performance data quoted represents past performance, which is no guarantee of future results, and current performance may be lower or higher than the figures shown. Performance assumes that all dividends and distributions, if any, were reinvested. For the most recent month-end performance figures, please visit www.morganstanley.com/im. Investment return and principal value will fluctuate so that Fund shares, when redeemed, may be worth more or less than their original cost. Total returns do not reflect the deduction of taxes that a shareholder would pay on Fund distributions or the redemption of Fund shares. Performance of share classes will vary due to difference in sales charges and expenses.
(1) The MSCI Emerging Markets Net Index is a free float-adjusted market capitalization weighted index that is designed to measure equity market performance of emerging markets. The term "free float" represents the portion of shares outstanding that are deemed to be available for purchase in the public equity markets by investors. The MSCI Emerging Markets Net Index currently consists of 24 emerging market country indices. The performance of the Index is listed in U.S. dollars and assumes reinvestment of net dividends. The Index is unmanaged and its returns do not include any sales charges or fees. Such costs would lower performance. It is not possible to invest directly in an index.
(2) The Lipper Emerging Markets Funds Index is an equally weighted performance index of the largest qualifying funds (based on net assets) in the Lipper Emerging Markets Funds classification. The Index, which is adjusted for capital gains distributions and income dividends, is unmanaged and should not be considered an investment. There are currently 30 funds represented in this Index. As of the date of this report, the Fund is in the Lipper Emerging Markets Funds classification.
(3) Total returns for the Fund reflect fees waived and expenses reimbursed, if applicable, by the Adviser. Without such waivers and reimbursements, total returns would have been lower.
(4) Pursuant to an agreement and plan of reorganization, between Morgan Stanley Institutional Fund, Inc., on behalf of the Fund, and Morgan Stanley Emerging Markets Leaders Fund (Cayman) LP, a private fund managed by the Adviser (the "Private Fund"), following close of business on January 5, 2015, the Fund acquired substantially all of the assets and liabilities of the Private Fund in exchange for shares of the Fund (the "Emerging Markets Leaders Reorganization"). The Private Fund commenced operations on June 30, 2011. The Fund adopted the performance history of the Private Fund. Performance shown for the Fund's Class I, Class A and Class IS shares reflects the performance of the limited partnership interests of the Private Fund, adjusted to reflect any applicable sales charge of the Class, but not adjusted for any other differences in expenses. If adjusted for other expenses, the historical returns would be different.
(5) Commenced offering on April 30, 2015.
(6) For comparative purposes, average annual since inception returns listed for the Indexes refer to the inception date of Class I of the Fund, not the inception of the Index.
5
Morgan Stanley Institutional Fund, Inc.
Annual Report — December 31, 2017
Portfolio of Investments
Emerging Markets Leaders Portfolio
| | | Shares | | Value
(000) | |
Common Stocks (96.0%) | |
Belgium (2.1%) | |
Anheuser-Busch InBev N.V. | | | 16,792 | | | $ | 1,873 | | |
Brazil (1.5%) | |
Banco Bradesco SA (Preference) | | | 127,715 | | | | 1,310 | | |
China (11.6%) | |
Alibaba Group Holding Ltd. ADR (a) | | | 19,744 | | | | 3,404 | | |
Tencent Holdings Ltd. (b) | | | 135,400 | | | | 7,000 | | |
| | | | 10,404 | | |
Czech Republic (2.7%) | |
Komercni Banka AS | | | 56,935 | | | | 2,444 | | |
Germany (2.8%) | |
Adidas AG | | | 12,650 | | | | 2,525 | | |
Hong Kong (10.0%) | |
AIA Group Ltd. | | | 543,000 | | | | 4,631 | | |
Samsonite International SA | | | 960,300 | | | | 4,411 | | |
| | | | 9,042 | | |
Hungary (3.1%) | |
OTP Bank PLC | | | 68,109 | | | | 2,813 | | |
India (16.4%) | |
Apollo Hospitals Enterprise Ltd. | | | 216,494 | | | | 4,086 | | |
Colgate-Palmolive India Ltd. | | | 102,954 | | | | 1,773 | | |
Crompton Greaves Consumer Electricals Ltd. | | | 524,347 | | | | 2,255 | | |
Godrej Consumer Products Ltd. | | | 150,768 | | | | 2,357 | | |
IndusInd Bank Ltd. (Foreign) | | | 22,448 | | | | 580 | | |
LIC Housing Finance Ltd. | | | 186,591 | | | | 1,644 | | |
Marico Ltd. | | | 419,311 | | | | 2,118 | | |
| | | | 14,813 | | |
Indonesia (6.9%) | |
Bank Mandiri Persero Tbk PT | | | 7,362,700 | | | | 4,336 | | |
Sumber Alfaria Trijaya Tbk PT | | | 41,333,891 | | | | 1,863 | | |
| | | | 6,199 | | |
Korea, Republic of (9.9%) | |
CJ CGV Co., Ltd. | | | 26,650 | | | | 1,843 | | |
Hanssem Co., Ltd. | | | 15,288 | | | | 2,571 | | |
Osstem Implant Co., Ltd. (a) | | | 41,978 | | | | 2,316 | | |
Samsung Electronics Co., Ltd. | | | 924 | | | | 2,195 | | |
| | | | 8,925 | | |
Mexico (6.5%) | |
Alsea SAB de CV | | | 469,905 | | | | 1,538 | | |
Fomento Economico Mexicano SAB de CV ADR | | | 33,943 | | | | 3,187 | | |
Grupo Financiero Banorte SAB de CV Series O | | | 212,628 | | | | 1,167 | | |
| | | | 5,892 | | |
Peru (3.9%) | |
Credicorp Ltd. | | | 17,099 | | | | 3,547 | | |
Poland (1.8%) | |
Eurocash SA | | | 212,272 | | | | 1,609 | | |
Russia (1.1%) | |
Magnit PJSC GDR | | | 36,572 | | | | 1,000 | | |
| | | Shares | | Value
(000) | |
South Africa (5.2%) | |
Famous Brands Ltd. (a) | | | 369,668 | | | $ | 3,078 | | |
Life Healthcare Group Holdings Ltd. | | | 713,796 | | | | 1,600 | | |
| | | | 4,678 | | |
Switzerland (0.3%) | |
| DKSH Holding AG | | | 3,446 | | | | 302 | | |
Taiwan (10.2%) | |
King Slide Works Co., Ltd. | | | 204,000 | | | | 2,746 | | |
Largan Precision Co., Ltd. | | | 5,000 | | | | 673 | | |
Poya International Co., Ltd. | | | 193,304 | | | | 2,419 | | |
Silergy Corp. | | | 48,000 | | | | 1,097 | | |
Superalloy Industrial Co., Ltd. | | | 184,292 | | | | 495 | | |
Voltronic Power Technology Corp. | | | 101,750 | | | | 1,761 | | |
| | | | 9,191 | | |
Total Common Stocks (Cost $72,230) | | | 86,567 | | |
Short-Term Investment (3.7%) | |
Investment Company (3.7%) | |
Morgan Stanley Institutional Liquidity Funds —
Government Portfolio — Institutional Class
(See Note G) (Cost $3,309) | | | 3,308,563 | | | | 3,309 | | |
Total Investments (99.7%) (Cost $75,539) (c)(d) | | | 89,876 | | |
Other Assets in Excess of Liabilities (0.3%) | | | 293 | | |
Net Assets (100.0%) | | $ | 90,169 | | |
Country assignments and aggregations are based generally on third party vendor classifications and information, and may be different from the assignments and aggregations under the policies set forth in the Fund's prospectus and/or statement of additional information relating to geographic classifications.
(a) Non-income producing security.
(b) Security trades on the Hong Kong exchange.
(c) The approximate fair value and percentage of net assets, $73,724,000 and 81.8%, respectively, represent the securities that have been fair valued under the fair valuation policy for international investments as described in Note A-1 within the Notes to the Financial Statements.
(d) At December 31, 2017, the aggregate cost for federal income tax purposes is approximately $77,004,000. The aggregate gross unrealized appreciation is approximately $14,454,000 and the aggregate gross unrealized depreciation is approximately $1,582,000, resulting in net unrealized appreciation of approximately $12,872,000.
ADR American Depositary Receipt.
GDR Global Depositary Receipt.
PJSC Public Joint Stock Company.
The accompanying notes are an integral part of the financial statements.
6
Morgan Stanley Institutional Fund, Inc.
Annual Report — December 31, 2017
Portfolio of Investments (cont'd)
Emerging Markets Leaders Portfolio
Portfolio Composition
Classification | | Percentage of
Total Investments | |
Other* | | | 23.1 | % | |
Banks | | | 18.0 | | |
Internet Software & Services | | | 11.6 | | |
Textiles, Apparel & Luxury Goods | | | 7.7 | | |
Personal Products | | | 7.0 | | |
Health Care Providers & Services | | | 6.3 | | |
Beverages | | | 5.6 | | |
Household Durables | | | 5.4 | | |
Insurance | | | 5.2 | | |
Hotels, Restaurants & Leisure | | | 5.1 | | |
Food & Staples Retailing | | | 5.0 | | |
Total Investments | | | 100.0 | % | |
* Industries and/or investment types representing less than 5% of total investments.
The accompanying notes are an integral part of the financial statements.
7
Morgan Stanley Institutional Fund, Inc.
Annual Report — December 31, 2017
Emerging Markets Leaders Portfolio
Statement of Assets and Liabilities | | December 31, 2017
(000) | |
Assets: | |
Investments in Securities of Unaffiliated Issuers, at Value (Cost $72,230) | | $ | 86,567 | | |
Investment in Security of Affiliated Issuer, at Value (Cost $3,309) | | | 3,309 | | |
Total Investments in Securities, at Value (Cost $75,539) | | | 89,876 | | |
Foreign Currency, at Value (Cost $295) | | | 294 | | |
Receivable for Investments Sold | | | 359 | | |
Tax Reclaim Receivable | | | 134 | | |
Receivable for Fund Shares Sold | | | 60 | | |
Dividends Receivable | | | 28 | | |
Receivable from Affiliate | | | 3 | | |
Other Assets | | | 48 | | |
Total Assets | | | 90,802 | | |
Liabilities: | |
Payable for Investments Purchased | | | 288 | | |
Payable for Custodian Fees | | | 78 | | |
Deferred Capital Gain Country Tax | | | 76 | | |
Payable for Advisory Fees | | | 71 | | |
Payable for Professional Fees | | | 71 | | |
Payable for Fund Shares Redeemed | | | 22 | | |
Payable for Administration Fees | | | 6 | | |
Payable for Transfer Agency Fees — Class I | | | 1 | | |
Payable for Transfer Agency Fees — Class A | | | 1 | | |
Payable for Transfer Agency Fees — Class C | | | 1 | | |
Payable for Transfer Agency Fees — Class IS | | | 1 | | |
Payable for Sub Transfer Agency Fees — Class I | | | 1 | | |
Payable for Sub Transfer Agency Fees — Class A | | | — | @ | |
Payable for Sub Transfer Agency Fees — Class C | | | — | @ | |
Payable for Shareholder Services Fees — Class A | | | — | @ | |
Payable for Distribution and Shareholder Services Fees — Class C | | | 1 | | |
Other Liabilities | | | 15 | | |
Total Liabilities | | | 633 | | |
Net Assets | | $ | 90,169 | | |
Net Assets Consist Of: | |
Paid-in-Capital | | $ | 77,386 | | |
Distributions in Excess of Net Investment Income | | | (220 | ) | |
Distributions in Excess of Net Realized Gain | | | (1,277 | ) | |
Unrealized Appreciation (Depreciation) on: | |
Investments (Net of $62 of Deferred Capital Gain Country Tax) | | | 14,275 | | |
Foreign Currency Translations | | | 5 | | |
Net Assets | | $ | 90,169 | | |
The accompanying notes are an integral part of the financial statements.
8
Morgan Stanley Institutional Fund, Inc.
Annual Report — December 31, 2017
Emerging Markets Leaders Portfolio
Statement of Assets and Liabilities (cont'd) | | December 31, 2017
(000) | |
CLASS I: | |
Net Assets | | $ | 73,273 | | |
| Shares Outstanding $0.001 par value shares of beneficial interest (unlimited shares authorized) (not in 000's) | | | 6,033,848 | | |
Net Asset Value, Offering and Redemption Price Per Share | | $ | 12.14 | | |
CLASS A: | |
Net Assets | | $ | 1,102 | | |
| Shares Outstanding $0.001 par value shares of beneficial interest (unlimited shares authorized) (not in 000's) | | | 91,329 | | |
Net Asset Value, Redemption Price Per Share | | $ | 12.06 | | |
Maximum Sales Load | | | 5.25 | % | |
Maximum Sales Charge | | $ | 0.67 | | |
Maximum Offering Price Per Share | | $ | 12.73 | | |
CLASS C: | |
Net Assets | | $ | 926 | | |
| Shares Outstanding $0.001 par value shares of beneficial interest (unlimited shares authorized) (not in 000's) | | | 77,784 | | |
Net Asset Value, Offering and Redemption Price Per Share | | $ | 11.90 | | |
CLASS IS: | |
Net Assets | | $ | 14,868 | | |
| Shares Outstanding $0.001 par value shares of beneficial interest (unlimited shares authorized) (not in 000's) | | | 1,224,471 | | |
Net Asset Value, Offering and Redemption Price Per Share | | $ | 12.14 | | |
@ Amount is less than $500.
The accompanying notes are an integral part of the financial statements.
9
Morgan Stanley Institutional Fund, Inc.
Annual Report — December 31, 2017
Emerging Markets Leaders Portfolio
Statement of Operations | | Year Ended
December 31, 2017
(000) | |
Investment Income: | |
Dividends from Securities of Unaffiliated Issuers (Net of $172 of Foreign Taxes Withheld) | | $ | 1,642 | | |
Dividends from Security of Affiliated Issuer (Note G) | | | 32 | | |
Total Investment Income | | | 1,674 | | |
Expenses: | |
Advisory Fees (Note B) | | | 841 | | |
Professional Fees | | | 163 | | |
Custodian Fees (Note F) | | | 119 | | |
Administration Fees (Note C) | | | 75 | | |
Registration Fees | | | 70 | | |
Shareholder Reporting Fees | | | 15 | | |
Shareholder Services Fees — Class A (Note D) | | | 2 | | |
Distribution and Shareholder Services Fees — Class C (Note D) | | | 7 | | |
Transfer Agency Fees — Class I (Note E) | | | 3 | | |
Transfer Agency Fees — Class A (Note E) | | | 2 | | |
Transfer Agency Fees — Class C (Note E) | | | 2 | | |
Transfer Agency Fees — Class IS (Note E) | | | 2 | | |
Sub Transfer Agency Fees — Class I | | | 6 | | |
Sub Transfer Agency Fees — Class A | | | 1 | | |
Sub Transfer Agency Fees — Class C | | | 1 | | |
Directors' Fees and Expenses | | | 6 | | |
Pricing Fees | | | 6 | | |
Other Expenses | | | 29 | | |
Total Expenses | | | 1,350 | | |
Waiver of Advisory Fees (Note B) | | | (297 | ) | |
Rebate from Morgan Stanley Affiliate (Note G) | | | (7 | ) | |
Reimbursement of Class Specific Expenses — Class A (Note B) | | | (1 | ) | |
Reimbursement of Class Specific Expenses — Class C (Note B) | | | (1 | ) | |
Reimbursement of Class Specific Expenses — Class IS (Note B) | | | (2 | ) | |
Net Expenses | | | 1,042 | | |
Net Investment Income | | | 632 | | |
Realized Gain (Loss): | |
Investments Sold | | | 4,304 | | |
Foreign Currency Transactions | | | (55 | ) | |
Net Realized Gain | | | 4,249 | | |
Change in Unrealized Appreciation (Depreciation): | |
Investments (Net of Increase in Deferred Capital Gain Country Tax of $62) | | | 18,101 | | |
Foreign Currency Translations | | | 6 | | |
Net Change in Unrealized Appreciation (Depreciation) | | | 18,107 | | |
Net Realized Gain and Change in Unrealized Appreciation (Depreciation) | | | 22,356 | | |
Net Increase in Net Assets Resulting from Operations | | $ | 22,988 | | |
The accompanying notes are an integral part of the financial statements.
10
Morgan Stanley Institutional Fund, Inc.
Annual Report — December 31, 2017
Emerging Markets Leaders Portfolio
Statements of Changes in Net Assets | | Year Ended
December 31, 2017
(000) | | Year Ended
December 31, 2016
(000) | |
Increase (Decrease) in Net Assets: | |
Operations: | |
Net Investment Income | | $ | 632 | | | $ | 75 | | |
Net Realized Gain (Loss) | | | 4,249 | | | | (363 | ) | |
Net Change in Unrealized Appreciation (Depreciation) | | | 18,107 | | | | (1,853 | ) | |
Net Increase (Decrease) in Net Assets Resulting from Operations | | | 22,988 | | | | (2,141 | ) | |
Distributions from and/or in Excess of: | |
Class I: | |
Net Investment Income | | | (463 | ) | | | (22 | ) | |
Net Realized Gain | | | (249 | ) | | | — | | |
Paid-in-Capital | | | — | | | | (7 | ) | |
Class A: | |
Net Investment Income | | | (2 | ) | | | (— | @) | |
Net Realized Gain | | | (3 | ) | | | — | | |
Paid-in-Capital | | | — | | | | (— | @) | |
Class C: | |
Net Investment Income | | | — | | | | (— | @) | |
Net Realized Gain | | | (3 | ) | | | — | | |
Paid-in-Capital | | | — | | | | (— | @) | |
Class IS: | |
Net Investment Income | | | (95 | ) | | | (21 | ) | |
Net Realized Gain | | | (50 | ) | | | — | | |
Paid-in-Capital | | | — | | | | (27 | ) | |
Total Distributions | | | (865 | ) | | | (77 | ) | |
Capital Share Transactions:(1) | |
Class I: | |
Subscribed | | | 47,849 | | | | 15,872 | | |
Distributions Reinvested | | | 490 | | | | 15 | | |
Redeemed | | | (10,905 | ) | | | (4,035 | ) | |
Class A: | |
Subscribed | | | 594 | | | | 1,426 | | |
Distributions Reinvested | | | 6 | | | | — | @ | |
Redeemed | | | (504 | ) | | | (691 | ) | |
Class C: | |
Subscribed | | | 247 | | | | 508 | | |
Distributions Reinvested | | | 3 | | | | — | @ | |
Redeemed | | | (64 | ) | | | — | | |
Class IS: | |
Subscribed | | | 750 | | | | 80,451 | | |
Distributions Reinvested | | | 145 | | | | 48 | | |
Redeemed | | | (86,228 | ) | | | (5,300 | ) | |
Net Increase (Decrease) in Net Assets Resulting from Capital Share Transactions | | | (47,617 | ) | | | 88,294 | | |
Redemption Fees | | | 1 | | | | — | @ | |
Total Increase (Decrease) in Net Assets | | | (25,493 | ) | | | 86,076 | | |
Net Assets: | |
Beginning of Period | | | 115,662 | | | | 29,586 | | |
End of Period (Including Distributions in Excess of Net Investment Income of $(220) and $(242)) | | $ | 90,169 | | | $ | 115,662 | | |
The accompanying notes are an integral part of the financial statements.
11
Morgan Stanley Institutional Fund, Inc.
Annual Report — December 31, 2017
Emerging Markets Leaders Portfolio
Statements of Changes in Net Assets (cont'd) | | Year Ended
December 31, 2017
(000) | | Year Ended
December 31, 2016
(000) | |
(1) Capital Share Transactions: | |
Class I: | |
Shares Subscribed | | | 4,336 | | | | 1,602 | | |
Shares Issued on Distributions Reinvested | | | 41 | | | | 2 | | |
Shares Redeemed | | | (950 | ) | | | (413 | ) | |
Net Increase in Class I Shares Outstanding | | | 3,427 | | | | 1,191 | | |
Class A: | |
Shares Subscribed | | | 52 | | | | 137 | | |
Shares Issued on Distributions Reinvested | | | — | @@ | | | — | @@ | |
Shares Redeemed | | | (46 | ) | | | (71 | ) | |
Net Increase in Class A Shares Outstanding | | | 6 | | | | 66 | | |
Class C: | |
Shares Subscribed | | | 22 | | | | 51 | | |
Shares Issued on Distributions Reinvested | | | — | @@ | | | — | @@ | |
Shares Redeemed | | | (5 | ) | | | — | | |
Net Increase in Class C Shares Outstanding | | | 17 | | | | 51 | | |
Class IS: | |
Shares Subscribed | | | 65 | | | | 7,981 | | |
Shares Issued on Distributions Reinvested | | | 12 | | | | 5 | | |
Shares Redeemed | | | (7,984 | ) | | | (539 | ) | |
Net Increase (Decrease) in Class IS Shares Outstanding | | | (7,907 | ) | | | 7,447 | | |
@ Amount is less than $500.
@@ Amount is less than 500 shares.
The accompanying notes are an integral part of the financial statements.
12
Morgan Stanley Institutional Fund, Inc.
Annual Report — December 31, 2017
Financial Highlights
Emerging Markets Leaders Portfolio
| | | Class I | |
| | | Year Ended December 31, | | Period from
January 5, 2015(2) to | |
Selected Per Share Data and Ratios | | 2017 | | 2016(1) | | December 31, 2015 | |
Net Asset Value, Beginning of Period | | $ | 9.73 | | | $ | 9.45 | | | $ | 10.00 | | |
Income (Loss) from Investment Operations: | |
Net Investment Income(3) | | | 0.08 | | | | 0.04 | | | | 0.06 | | |
Net Realized and Unrealized Gain (Loss) | | | 2.45 | | | | 0.25 | | | | (0.49 | ) | |
Total from Investment Operations | | | 2.53 | | | | 0.29 | | | | (0.43 | ) | |
Distributions from and/or in Excess of: | |
Net Investment Income | | | (0.08 | ) | | | (0.01 | ) | | | (0.12 | ) | |
Net Realized Gain | | | (0.04 | ) | | | — | | | | — | | |
Paid-in-Capital | | | — | | | | (0.00 | )(4) | | | — | | |
Total Distributions | | | (0.12 | ) | | | (0.01 | ) | | | (0.12 | ) | |
Redemption Fees | | | 0.00 | (4) | | | 0.00 | (4) | | | — | | |
Net Asset Value, End of Period | | $ | 12.14 | | | $ | 9.73 | | | $ | 9.45 | | |
Total Return(5) | | | 26.01 | % | | | 3.08 | % | | | (4.26 | )%(7) | |
Ratios and Supplemental Data: | |
Net Assets, End of Period (Thousands) | | $ | 73,273 | | | $ | 25,374 | | | $ | 13,379 | | |
Ratio of Expenses to Average Net Assets(9) | | | 1.11 | %(6) | | | 1.10 | %(6) | | | 1.14 | %(6)(8) | |
Ratio of Net Investment Income to Average Net Assets(9) | | | 0.67 | %(6) | | | 0.37 | %(6) | | | 0.65 | %(6)(8) | |
Ratio of Rebate from Morgan Stanley Affiliates to Average Net Assets | | | 0.01 | % | | | 0.02 | % | | | 0.01 | %(8) | |
Portfolio Turnover Rate | | | 79 | % | | | 45 | % | | | 36 | % | |
(9) Supplemental Information on the Ratios to Average Net Assets: | |
Ratios Before Expense Limitation: | |
Expenses to Average Net Assets | | | 1.43 | % | | | 1.32 | % | | | 2.80 | %(8) | |
Net Investment Income (Loss) to Average Net Assets | | | 0.35 | % | | | 0.15 | % | | | (1.01 | )%(8) | |
(1) Reflects prior period custodian out-of-pocket expenses that were reimbursed in September 2016. The amount of the reimbursement was immaterial on a per share basis and did not impact the total return of Class I shares. The Ratio of Expenses to Average Net Assets and the Ratio of Net Investment Income to Average Net Assets would be unchanged as the reimbursement of custodian fees was offset against expense waivers/reimbursements with no impact to net expenses or net investment income.
(2) Date of Reorganization (close of business).
(3) Per share amount is based on average shares outstanding.
(4) Amount is less than $0.005 per share.
(5) Calculated based on the net asset value as of the last business day of the period.
(6) The Ratios of Expenses and Net Investment Income reflect the rebate of certain Fund expenses in connection with the investments in Morgan Stanley affiliates during the period. The effect of the rebate on the ratios is disclosed in the above table as "Ratio of Rebate from Morgan Stanley Affiliates to Average Net Assets."
(7) Not annualized.
(8) Annualized.
The accompanying notes are an integral part of the financial statements.
13
Morgan Stanley Institutional Fund, Inc.
Annual Report — December 31, 2017
Financial Highlights
Emerging Markets Leaders Portfolio
| | | Class A | |
| | | Year Ended December 31, | | Period from
January 5, 2015(2) to | |
Selected Per Share Data and Ratios | | 2017 | | 2016(1) | | December 31, 2015 | |
Net Asset Value, Beginning of Period | | $ | 9.67 | | | $ | 9.43 | | | $ | 10.00 | | |
Income (Loss) from Investment Operations: | |
Net Investment Income (Loss)(3) | | | 0.02 | | | | (0.03 | ) | | | 0.02 | | |
Net Realized and Unrealized Gain (Loss) | | | 2.44 | | | | 0.28 | | | | (0.48 | ) | |
Total from Investment Operations | | | 2.46 | | | | 0.25 | | | | (0.46 | ) | |
Distributions from and/or in Excess of: | |
Net Investment Income | | | (0.03 | ) | | | (0.01 | ) | | | (0.11 | ) | |
Net Realized Gain | | | (0.04 | ) | | | — | | | | — | | |
Paid-in-Capital | | | — | | | | (0.00 | )(4) | | | — | | |
Total Distributions | | | (0.07 | ) | | | (0.01 | ) | | | (0.11 | ) | |
Redemption Fees | | | 0.00 | (4) | | | 0.00 | (4) | | | — | | |
Net Asset Value, End of Period | | $ | 12.06 | | | $ | 9.67 | | | $ | 9.43 | | |
Total Return(5) | | | 25.46 | % | | | 2.63 | % | | | (4.61 | )%(7) | |
Ratios and Supplemental Data: | |
Net Assets, End of Period (Thousands) | | $ | 1,102 | | | $ | 821 | | | $ | 182 | | |
Ratio of Expenses to Average Net Assets(9) | | | 1.54 | %(6) | | | 1.53 | %(6) | | | 1.54 | %(6)(8) | |
Ratio of Net Investment Income (Loss) to Average Net Assets(9) | | | 0.18 | %(6) | | | (0.33 | )%(6) | | | 0.21 | %(6)(8) | |
Ratio of Rebate from Morgan Stanley Affiliates to Average Net Assets | | | 0.01 | % | | | 0.02 | % | | | 0.01 | %(8) | |
Portfolio Turnover Rate | | | 79 | % | | | 45 | % | | | 36 | % | |
(9) Supplemental Information on the Ratios to Average Net Assets: | |
Ratios Before Expense Limitation: | |
Expenses to Average Net Assets | | | 2.01 | % | | | 1.96 | % | | | 5.89 | %(8) | |
Net Investment Loss to Average Net Assets | | | (0.29 | )% | | | (0.76 | )% | | | (4.14 | )%(8) | |
(1) Reflects prior period custodian out-of-pocket expenses that were reimbursed in September 2016. The amount of the reimbursement was immaterial on a per share basis and did not impact the total return of Class A shares. The Ratio of Expenses to Average Net Assets and the Ratio of Net Investment Loss to Average Net Assets would be unchanged as the reimbursement of custodian fees was offset against expense waivers/reimbursements with no impact to net expenses or net investment loss.
(2) Date of Reorganization (close of business).
(3) Per share amount is based on average shares outstanding.
(4) Amount is less than $0.005 per share.
(5) Calculated based on the net asset value which does not reflect sales charges, if applicable, as of the last business day of the period.
(6) The Ratios of Expenses and Net Investment Income (Loss) reflect the rebate of certain Fund expenses in connection with the investments in Morgan Stanley affiliates during the period. The effect of the rebate on the ratios is disclosed in the above table as "Ratio of Rebate from Morgan Stanley Affiliates to Average Net Assets."
(7) Not annualized.
(8) Annualized.
The accompanying notes are an integral part of the financial statements.
14
Morgan Stanley Institutional Fund, Inc.
Annual Report — December 31, 2017
Financial Highlights
Emerging Markets Leaders Portfolio
| | | Class C | |
| | | Year Ended December 31, | | Period from
April 30, 2015(2) to | |
Selected Per Share Data and Ratios | | 2017 | | 2016(1) | | December 31, 2015 | |
Net Asset Value, Beginning of Period | | $ | 9.59 | | | $ | 9.42 | | | $ | 10.61 | | |
Income (Loss) from Investment Operations: | |
Net Investment Loss(3) | | | (0.06 | ) | | | (0.10 | ) | | | (0.06 | ) | |
Net Realized and Unrealized Gain (Loss) | | | 2.41 | | | | 0.28 | | | | (1.07 | ) | |
Total from Investment Operations | | | 2.35 | | | | 0.18 | | | | (1.13 | ) | |
Distributions from and/or in Excess of: | |
Net Investment Income | | | — | | | | (0.01 | ) | | | (0.06 | ) | |
Net Realized Gain | | | (0.04 | ) | | | — | | | | — | | |
Paid-in-Capital | | | — | | | | (0.00 | )(4) | | | — | | |
Total Distributions | | | (0.04 | ) | | | (0.01 | ) | | | (0.06 | ) | |
Redemption Fees | | | 0.00 | (4) | | | 0.00 | (4) | | | — | | |
Net Asset Value, End of Period | | $ | 11.90 | | | $ | 9.59 | | | $ | 9.42 | | |
Total Return(5) | | | 24.53 | % | | | 1.89 | % | | | (10.61 | )%(8) | |
Ratios and Supplemental Data: | |
Net Assets, End of Period (Thousands) | | $ | 926 | | | $ | 587 | | | $ | 100 | | |
Ratio of Expenses to Average Net Assets(10) | | | 2.29 | %(6) | | | 2.28 | %(6) | | | 2.30 | %(6)(9) | |
Ratio of Net Investment Loss to Average Net Assets(10) | | | (0.49 | )%(6) | | | (0.99 | )%(6) | | | (0.85 | )%(6)(9) | |
Ratio of Rebate from Morgan Stanley Affiliates to Average Net Assets | | | 0.01 | % | | | 0.02 | % | | | 0.00 | %(7)(9) | |
Portfolio Turnover Rate | | | 79 | % | | | 45 | % | | | 36 | % | |
(10) Supplemental Information on the Ratios to Average Net Assets: | |
Ratios Before Expense Limitation: | |
Expense to Average Net Assets | | | 2.80 | % | | | 3.08 | % | | | 5.73 | %(9) | |
Net Investment Loss to Average Net Assets | | | (1.00 | )% | | | (1.79 | )% | | | (4.28 | )%(9) | |
(1) Reflects prior period custodian out-of-pocket expenses that were reimbursed in September 2016. The amount of the reimbursement was immaterial on a per share basis and did not impact the total return of Class C shares. The Ratio of Expenses to Average Net Assets and the Ratio of Net Investment Loss to Average Net Assets would be unchanged as the reimbursement of custodian fees was offset against expense waivers/reimbursements with no impact to net expenses or net investment loss.
(2) Commencement of Offering.
(3) Per share amount is based on average shares outstanding.
(4) Amount is less than $0.005 per share.
(5) Calculated based on the net asset value which does not reflect sales charges, if applicable, as of the last business day of the period.
(6) The Ratios of Expenses and Net Investment Loss reflect the rebate of certain Fund expenses in connection with the investments in Morgan Stanley affiliates during the period. The effect of the rebate on the ratios is disclosed in the above table as "Ratio of Rebate from Morgan Stanley Affiliates to Average Net Assets."
(7) Amount is less than 0.005%.
(8) Not annualized.
(9) Annualized.
The accompanying notes are an integral part of the financial statements.
15
Morgan Stanley Institutional Fund, Inc.
Annual Report — December 31, 2017
Financial Highlights
Emerging Markets Leaders Portfolio
| | | Class IS | |
| | | Year Ended December 31, | | Period from
January 5, 2015(2) to | |
Selected Per Share Data and Ratios | | 2017 | | 2016(1) | | December 31, 2015 | |
Net Asset Value, Beginning of Period | | $ | 9.73 | | | $ | 9.45 | | | $ | 10.00 | | |
Income (Loss) from Investment Operations: | |
Net Investment Income (Loss)(3) | | | 0.08 | | | | (0.00 | )(4) | | | 0.07 | | |
Net Realized and Unrealized Gain (Loss) | | | 2.45 | | | | 0.29 | | | | (0.50 | ) | |
Total from Investment Operations | | | 2.53 | | | | 0.29 | | | | (0.43 | ) | |
Distributions from and/or in Excess of: | |
Net Investment Income | | | (0.08 | ) | | | (0.01 | ) | | | (0.12 | ) | |
Net Realized Gain | | | (0.04 | ) | | | — | | | | — | | |
Paid-in-Capital | | | — | | | | (0.00 | )(4) | | | — | | |
Total Distributions | | | (0.12 | ) | | | (0.01 | ) | | | (0.12 | ) | |
Redemption Fees | | | 0.00 | (4) | | | 0.00 | (4) | | | — | | |
Net Asset Value, End of Period | | $ | 12.14 | | | $ | 9.73 | | | $ | 9.45 | | |
Total Return(5) | | | 26.02 | % | | | 3.09 | % | | | (4.25 | )%(9) | |
Ratios and Supplemental Data: | |
Net Assets, End of Period (Thousands) | | $ | 14,868 | | | $ | 88,880 | | | $ | 15,925 | | |
Ratio of Expenses to Average Net Assets(11) | | | 1.09 | %(6) | | | 1.08 | %(6) | | | 1.12 | %(6)(7)(10) | |
Ratio of Net Investment Income (Loss) to Average Net Assets(11) | | | 0.72 | %(6) | | | (0.00 | )%(6)(8) | | | 0.75 | %(6)(10) | |
Ratio of Rebate from Morgan Stanley Affiliates to Average Net Assets | | | 0.01 | %(10) | | | 0.02 | % | | | 0.01 | %(10) | |
Portfolio Turnover Rate | | | 79 | % | | | 45 | % | | | 36 | % | |
(11) Supplemental Information on the Ratios to Average Net Assets: | |
Ratios Before Expense Limitation: | |
Expenses to Average Net Assets | | | 1.42 | % | | | 1.31 | % | | | 2.65 | %(10) | |
Net Investment Income (Loss) to Average Net Assets | | | 0.39 | % | | | (0.23 | )% | | | (0.78 | )%(10) | |
(1) Reflects prior period custodian out-of-pocket expenses that were reimbursed in September 2016. The amount of the reimbursement was immaterial on a per share basis and did not impact the total return of Class IS shares. The Ratio of Expenses to Average Net Assets and the Ratio of Net Investment Loss to Average Net Assets would be unchanged as the reimbursement of custodian fees was offset against expense waivers/reimbursements with no impact to net expenses or net investment loss.
(2) Date of Reorganization (close of business).
(3) Per share amount is based on average shares outstanding.
(4) Amount is less than $0.005 per share.
(5) Calculated based on the net asset value as of the last business day of the period.
(6) The Ratios of Expenses and Net Investment Income (Loss) reflect the rebate of certain Fund expenses in connection with the investments in Morgan Stanley affiliates during the period. The effect of the rebate on the ratios is disclosed in the above table as "Ratio of Rebate from Morgan Stanley Affiliates to Average Net Assets."
(7) Effective September 30, 2015, the Adviser has agreed to limit the ratio of expenses to average net assets to the maximum ratio of 1.10% for Class IS shares. Prior to September 30, 2015, the maximum ratio was 1.15% for Class IS shares.
(8) Amount is less than 0.005%.
(9) Not annualized.
(10) Annualized.
The accompanying notes are an integral part of the financial statements.
16
Morgan Stanley Institutional Fund, Inc.
Annual Report — December 31, 2017
Notes to Financial Statements
Morgan Stanley Institutional Fund, Inc. (the "Company") is registered under the Investment Company Act of 1940, as amended (the "Act"), as an open-end management investment company. The Company is comprised of twenty-nine separate, active, diversified and non-diversified funds (individually referred to as a "Fund", collectively as the "Funds"). The Company applies investment company accounting and reporting guidance.
The accompanying financial statements relate to the Emerging Markets Leaders Portfolio. The Fund seeks long-term capital appreciation.
The Fund offers four classes of shares — Class I, Class A, Class C and Class IS.
A. Significant Accounting Policies: The following significant accounting policies are in conformity with U.S. generally accepted accounting principles ("GAAP"). Such policies are consistently followed by the Company in the preparation of its financial statements. GAAP may require management to make estimates and assumptions that affect the reported amounts and disclosures in the financial statements. Actual results may differ from those estimates.
1. Security Valuation: (1) An equity portfolio security listed or traded on an exchange is valued at its latest reported sales price (or at the exchange official closing price if such exchange reports an official closing price), and if there were no sales on a given day and if there is no official exchange closing price for that day, the security is valued at the mean between the last reported bid and asked prices if such bid and asked prices are available on the relevant exchanges. Listed equity securities not traded on the valuation date with no reported bid and asked prices available on the exchange are valued at the mean between the current bid and asked prices obtained from one or more reputable brokers or dealers. In cases where a security is traded on more than one exchange, the security is valued on the exchange designated as the primary market; (2) all other equity portfolio securities for which over-the-counter ("OTC") market quotations are readily available are valued at the latest reported sales price (or at the market official closing price if such market reports an official closing price), and if there was no trading in the security on a given day and if there is no official closing price from relevant markets for that day, the security is valued at the mean between the last reported bid and asked prices if such bid and asked prices are available on the relevant markets. An unlisted equity security that does not trade on
the valuation date and for which bid and asked prices from the relevant markets are unavailable is valued at the mean between the current bid and asked prices obtained from one or more reputable brokers or dealers; (3) certain portfolio securities may be valued by an outside pricing service/vendor approved by the Company's Board of Directors (the "Directors"). The pricing service/vendor may employ a pricing model that takes into account, among other things, bids, yield spreads, and/or other market data and specific security characteristics. Alternatively, if a valuation is not available from an outside pricing service/vendor, and the security trades on an exchange, the security may be valued at its latest reported sale price (or at the exchange official closing price if such exchange reports an official closing price), prior to the time when assets are valued. If there are no sales on a given day and if there is no official exchange closing price for that day, the security is valued at the mean between the last reported bid and asked prices if such bid and asked prices are available in the relevant exchanges; (4) when market quotations are not readily available, including circumstances under which Morgan Stanley Investment Management Inc. (the "Adviser") or Morgan Stanley Investment Management Company ("MSIM Company") (the "Sub-Adviser"), a wholly-owned subsidiary of Morgan Stanley, determines that the closing price, last sale price or the mean between the last reported bid and asked prices are not reflective of a security's market value, portfolio securities are valued at their fair value as determined in good faith under procedures established by and under the general supervision of the Directors. Occasionally, developments affecting the closing prices of securities and other assets may occur between the times at which valuations of such securities are determined (that is, close of the foreign market on which the securities trade) and the close of business of the New York Stock Exchange ("NYSE"). If developments occur during such periods that are expected to materially affect the value of such securities, such valuations may be adjusted to reflect the estimated fair value of such securities as of the close of the NYSE, as determined in good faith by the Directors or by the Adviser using a pricing service and/or procedures approved by the Directors; (5) quotations of foreign portfolio securities, other assets and liabilities and forward contracts stated in foreign currency are translated into U.S. dollar equivalents at the prevailing market rates prior to the close of the NYSE; and (6) investments in mutual funds, including the Morgan Stanley Institutional
17
Morgan Stanley Institutional Fund, Inc.
Annual Report — December 31, 2017
Notes to Financial Statements (cont'd)
Liquidity Funds, are valued at the net asset value ("NAV") as of the close of each business day.
The Directors have responsibility for determining in good faith the fair value of the investments, and the Directors may appoint others, such as the Company's Adviser or a valuation committee, to assist the Directors in determining fair value and to make the actual calculations pursuant to the fair valuation methodologies previously approved by the Directors. Under procedures approved by the Directors, the Company's Adviser has formed a Valuation Committee whose members are approved by the Directors. The Valuation Committee provides administration and oversight of the Company's valuation policies and procedures, which are reviewed at least annually by the Directors. These procedures allow the Company to utilize independent pricing services, quotations from securities and financial instrument dealers, and other market sources to determine fair value.
The Company has procedures to determine the fair value of securities and other financial instruments for which market prices are not readily available. Under these procedures, the Valuation Committee convenes on a regular and ad hoc basis to review such securities and considers a number of factors, including valuation methodologies and significant unobservable valuation inputs, when arriving at fair value. The Valuation Committee may employ a market-based approach which may use related or comparable assets or liabilities, recent transactions, market multiples, book values, and other relevant information for the investment to determine the fair value of the investment. An income-based valuation approach may also be used in which the anticipated future cash flows of the investment are discounted to calculate fair value. Discounts may also be applied due to the nature or duration of any restrictions on the disposition of the investments. Due to the inherent uncertainty of valuations of such investments, the fair values may differ significantly from the values that would have been used had an active market existed. The Valuation Committee employs various methods for calibrating these valuation approaches including a regular review of valuation methodologies, key inputs and assumptions, transactional back-testing or disposition analysis, and reviews of any related market activity.
2. Fair Value Measurement: Financial Accounting Standards Board ("FASB") Accounting Standards CodificationTM ("ASC") 820, "Fair Value Measurement" ("ASC 820"), defines fair value as the value that the Fund would receive to sell an investment or pay to transfer a liability in a timely transaction with an independent buyer in the principal market, or in the absence of a principal market, the most advantageous market for the investment or liability. ASC 820 establishes a three-tier hierarchy to distinguish between (1) inputs that reflect the assumptions market participants would use in valuing an asset or liability developed based on market data obtained from sources independent of the reporting entity (observable inputs) and (2) inputs that reflect the reporting entity's own assumptions about the assumptions market participants would use in valuing an asset or liability developed based on the best information available in the circumstances (unobservable inputs) and to establish classification of fair value measurements for disclosure purposes. Various inputs are used in determining the value of the Fund's investments. The inputs are summarized in the three broad levels listed below.
• Level 1 – unadjusted quoted prices in active markets for identical investments
• Level 2 – other significant observable inputs (including quoted prices for similar investments, interest rates, prepayment speeds, credit risk, etc.)
• Level 3 – significant unobservable inputs including the Fund's own assumptions in determining the fair value of investments. Factors considered in making this determination may include, but are not limited to, information obtained by contacting the issuer, analysts, or the appropriate stock exchange (for exchange-traded securities), analysis of the issuer's financial statements or other available documents and, if necessary, available information concerning other securities in similar circumstances
The inputs or methodology used for valuing securities are not necessarily an indication of the risk associated with investing in those securities and the determination of the significance of a particular input to the fair value
18
Morgan Stanley Institutional Fund, Inc.
Annual Report — December 31, 2017
Notes to Financial Statements (cont'd)
measurement in its entirety requires judgment and considers factors specific to each security.
The following is a summary of the inputs used to value the Fund's investments as of December 31, 2017.
Investment Type | | Level 1
Unadjusted
quoted
prices
(000) | | Level 2
Other
significant
observable
inputs
(000) | | Level 3
Significant
unobservable
inputs
(000) | | Total
(000) | |
Assets: | |
Common Stocks | |
Auto Components | | $ | — | | | $ | 495 | | | $ | — | | | $ | 495 | | |
Banks | | | 4,714 | | | | 11,483 | | | | — | | | | 16,197 | | |
Beverages | | | 3,187 | | | | 1,873 | | | | — | | | | 5,060 | | |
Electrical Equipment | | | — | | | | 1,761 | | | | — | | | | 1,761 | | |
Electronic Equipment,
Instruments &
Components | | | — | | | | 673 | | | | — | | | | 673 | | |
Food & Staples Retailing | | | — | | | | 4,472 | | | | — | | | | 4,472 | | |
Health Care Equipment &
Supplies | | | — | | | | 2,316 | | | | — | | | | 2,316 | | |
Health Care Providers &
Services | | | — | | | | 5,686 | | | | — | | | | 5,686 | | |
Hotels, Restaurants &
Leisure | | | 1,538 | | | | 3,078 | | | | — | | | | 4,616 | | |
Household Durables | | | — | | | | 4,826 | | | | — | | | | 4,826 | | |
Insurance | | | — | | | | 4,631 | | | | — | | | | 4,631 | | |
Internet Software &
Services | | | 3,404 | | | | 7,000 | | | | — | | | | 10,404 | | |
Machinery | | | — | | | | 2,746 | | | | — | | | | 2,746 | | |
Media | | | — | | | | 1,843 | | | | — | | | | 1,843 | | |
Multi-Line Retail | | | — | | | | 2,419 | | | | — | | | | 2,419 | | |
Personal Products | | | — | | | | 6,248 | | | | — | | | | 6,248 | | |
Professional Services | | | — | | | | 302 | | | | — | | | | 302 | | |
Semiconductors &
Semiconductor
Equipment | | | — | | | | 1,097 | | | | — | | | | 1,097 | | |
Tech Hardware,
Storage & Peripherals | | | — | | | | 2,195 | | | | — | | | | 2,195 | | |
Textiles, Apparel &
Luxury Goods | | | — | | | | 6,936 | | | | — | | | | 6,936 | | |
Thrifts & Mortgage
Finance | | | — | | | | 1,644 | | | | — | | | | 1,644 | | |
Total Common Stocks | | | 12,843 | | | | 73,724 | | | | — | | | | 86,567 | | |
Short-Term Investment | |
Investment Company | | | 3,309 | | | | — | | | | — | | | | 3,309 | | |
Total Assets | | $ | 16,152 | | | $ | 73,724 | | | $ | — | | | $ | 89,876 | | |
Transfers between investment levels may occur as the markets fluctuate and/or the availability of data used in an investment's valuation changes. The Fund recognizes transfers between the levels as of the end of the period. As of December 31, 2017, securities with a total value of approximately $64,429,000 transferred from Level 1 to Level 2. Securities that were valued using unadjusted quoted prices at December 31, 2016 were valued using other significant observable inputs at December 31, 2017. At December 31, 2017, the fair value of certain securities
were adjusted due to developments which occurred between the time of the close of the foreign markets on which they trade and the close of business on the NYSE which resulted in their Level 2 classification.
3. Foreign Currency Translation and Foreign Investments: The books and records of the Fund are maintained in U.S. dollars. Foreign currency amounts are translated into U.S. dollars as follows:
– investments, other assets and liabilities at the prevailing rate of exchange on the valuation date;
– investment transactions and investment income at the prevailing rates of exchange on the dates of such transactions.
Although the net assets of the Fund are presented at the foreign exchange rates and market values at the close of the period, the Fund does not isolate that portion of the results of operations arising as a result of changes in the foreign exchange rates from the fluctuations arising from changes in the market prices of securities held at period end. Similarly, the Fund does not isolate the effect of changes in foreign exchange rates from the fluctuations arising from changes in the market prices of securities sold during the period. Accordingly, realized and unrealized foreign currency gains (losses) on investments in securities are included in the reported net realized and unrealized gains (losses) on investment transactions and balances. However, pursuant to U.S. federal income tax regulations, gains and losses from certain foreign currency transactions and the foreign currency portion of gains and losses realized on sales and maturities of foreign denominated debt securities are treated as ordinary income for U.S. federal income tax purposes.
Net realized gains (losses) on foreign currency transactions represent net foreign exchange gains (losses) from foreign currency forward exchange contracts, disposition of foreign currencies, currency gains (losses) realized between the trade and settlement dates on securities transactions, and the difference between the amount of investment income and foreign withholding taxes recorded on the Fund's books and the U.S. dollar equivalent amounts actually received or paid. Net unrealized currency gains (losses) from valuing foreign currency denominated assets and liabilities at period end exchange rates are reflected as a component of unrealized appreciation (depreciation) in the Statement of Assets
19
Morgan Stanley Institutional Fund, Inc.
Annual Report — December 31, 2017
Notes to Financial Statements (cont'd)
and Liabilities. The change in unrealized currency gains (losses) on foreign currency translations for the period is reflected in the Statement of Operations.
Foreign security and currency transactions may involve certain considerations and risks not typically associated with those of U.S. dollar denominated transactions as a result of, among other factors, fluctuations of exchange rates in relation to the U.S. dollar, the possibility of lower levels of governmental supervision and regulation of foreign securities markets and the possibility of political or economic instability.
Governmental approval for foreign investments may be required in advance of making an investment under certain circumstances in some countries, and the extent of foreign investments in domestic companies may be subject to limitation in other countries. Foreign ownership limitations also may be imposed by the charters of individual companies to prevent, among other concerns, violations of foreign investment limitations. As a result, an additional class of shares (identified as "Foreign" in the Portfolio of Investments) may be created and offered for investment. The "local" and "foreign shares" market values may differ. In the absence of trading of the foreign shares in such markets, the Fund values the foreign shares at the closing exchange price of the local shares.
4. Redemption Fees: The Fund will assess a 2% redemption fee on Class I shares, Class A shares, Class C shares and Class IS shares, which is paid directly to the Fund, for shares redeemed or exchanged within thirty days of purchase, subject to certain exceptions. The redemption fee is designed to protect the Fund and its remaining shareholders from the effects of short-term trading. These fees, if any, are included in the Statements of Changes in Net Assets.
5. Indemnifications: The Company enters into contracts that contain a variety of indemnifications. The Company's maximum exposure under these arrangements is unknown. However, the Company has not had prior claims or losses pursuant to these contracts and expects the risk of loss to be remote.
6. Dividends and Distributions to Shareholders: Dividends and distributions to shareholders are recorded on the ex-dividend date. Dividends from net investment income, if any, are declared and paid annually. Net realized capital gains, if any, are distributed at least annually.
7. Security Transactions, Income and Expenses: Security transactions are accounted for on the trade date (date the order to buy or sell is executed). Realized gains and losses on the sale of investment securities are determined on the specific identified cost method. Dividend income and other distributions are recorded on the ex-dividend date (except for certain foreign dividends which may be recorded as soon as the Fund is informed of such dividends) net of applicable withholding taxes. Interest income is recognized on the accrual basis except where collection is in doubt. Discounts are accreted and premiums are amortized over the life of the respective securities. Most expenses of the Company can be directly attributed to a particular Fund. Expenses which cannot be directly attributed are apportioned among the Funds based upon relative net assets or other appropriate methods. Income, expenses (other than class specific expenses — distribution and shareholder services, transfer agency and sub transfer agency fees) and realized and unrealized gains or losses are allocated to each class of shares based upon their relative net assets.
B. Advisory/Sub-Advisory Fees: The Adviser, a wholly-owned subsidiary of Morgan Stanley, provides the Fund with advisory services under the terms of an Investment Advisory Agreement, paid quarterly, at the annual rate based on the daily net assets as follows:
First $1
billion | | Over $1
billion | |
| | 0.90 | % | | | 0.85 | % | |
For the year ended December 31, 2017, the advisory fee rate (net of waiver/rebate) was equivalent to an annual effective rate of 0.57% of the Fund's average daily net assets.
The Adviser has agreed to reduce its advisory fee and/or reimburse the Fund so that total annual portfolio operating expenses, excluding certain investment related expenses, taxes, interest and other extraordinary expenses (including litigation), will not exceed 1.20% for Class I shares, 1.55% for Class A shares, 2.30% for Class C shares and 1.10% for Class IS shares. The fee waivers and/or expense reimbursements will continue for at least one year from the date of the Fund's prospectus or until such time as the Directors act to discontinue all or a portion of such waivers and/or reimbursements when they deem such action is appropriate. For the year ended December 31, 2017, approximately $297,000 of advisory fees were waived and approximately $4,000 of other expenses were reimbursed by the Adviser pursuant to this arrangement.
20
Morgan Stanley Institutional Fund, Inc.
Annual Report — December 31, 2017
Notes to Financial Statements (cont'd)
The Adviser has entered into a Sub-Advisory Agreement with the Sub-Adviser, a wholly-owned subsidiary of Morgan Stanley. The Sub-Adviser provides the Fund with advisory services subject to the overall supervision of the Adviser and the Fund's Officers and Directors. The Adviser pays the Sub-Adviser on a monthly basis a portion of the net advisory fees the Adviser receives from the Fund.
C. Administration Fees: The Adviser also serves as Administrator to the Company and provides administrative services pursuant to an Administration Agreement for an annual fee, accrued daily and paid monthly, of 0.08% of the Fund's average daily net assets.
Under a Sub-Administration Agreement between the Administrator and State Street Bank and Trust Company ("State Street"), State Street provides certain administrative services to the Company. For such services, the Administrator pays State Street a portion of the fee the Administrator receives from the Fund.
D. Distribution and Shareholder Services Fees: Morgan Stanley Distribution, Inc. ("MSDI" or the "Distributor"), a wholly-owned subsidiary of the Adviser and Sub-Advisers and an indirect subsidiary of Morgan Stanley, serves as the Company's Distributor of Fund shares pursuant to a Distribution Agreement. The Company has adopted a Shareholder Services Plan with respect to Class A shares pursuant to Rule 12b-1 under the Act. Under the Shareholder Services Plan, the Fund pays the Distributor a shareholder services fee, accrued daily and paid monthly, at an annual rate of 0.25% of the Fund's average daily net assets attributable to Class A shares.
The Company has adopted a Distribution and Shareholder Services Plan with respect to Class C shares pursuant to Rule 12b-1 under the Act. Under the Distribution and Shareholder Services Plan, the Fund pays the Distributor a distribution fee, accrued daily and paid monthly, at an annual rate of 0.75% and a shareholder services fee, accrued daily and paid monthly, at an annual rate of 0.25% of the Fund's average daily net assets attributable to Class C shares.
The distribution and shareholder services fees are used to support the expenses associated with servicing and maintaining accounts. The Distributor may compensate other parties for providing shareholder support services to investors who purchase Class A and Class C shares.
E. Dividend Disbursing and Transfer Agent: The Company's dividend disbursing and transfer agent is Boston Financial Data Services, Inc. ("BFDS"). Pursuant to a Transfer Agency Agreement, the Company pays BFDS a fee based on the number of classes, accounts and transactions relating to the Funds of the Company. Effective January 1, 2018, BFDS changed its name to DST Asset Manager Solutions, Inc.
F. Custodian Fees: State Street (the "Custodian") also serves as Custodian for the Company in accordance with a Custodian Agreement. The Custodian holds cash, securities, and other assets of the Company as required by the Act. Custody fees are payable monthly based on assets held in custody, investment purchases and sales activity and account maintenance fees, plus reimbursement for certain out-of-pocket expenses.
G. Security Transactions and Transactions with Affiliates: For the year ended December 31, 2017, purchases and sales of investment securities for the Fund, other than long-term U.S. Government securities and short-term investments, were approximately $74,932,000 and $72,519,000, respectively. There were no purchases and sales of long-term U.S. Government securities for the year ended December 31, 2017.
The Fund invests in the Institutional Class of the Morgan Stanley Institutional Liquidity Funds — Government Portfolio (the "Liquidity Funds"), an open-end management investment company managed by the Adviser. Advisory fees paid by the Fund are reduced by an amount equal to its pro-rata share of the advisory and administration fees paid by the Fund due to its investment in the Liquidity Funds. For the year ended December 31, 2017, advisory fees paid were reduced by approximately $7,000 relating to the Fund's investment in the Liquidity Funds.
A summary of the Fund's transactions in shares of the Liquidity Funds during the year ended December 31, 2017 is as follows:
Affiliated
Investment
Company | | Value
December 31,
2016
(000) | | Purchases
at Cost
(000) | | Proceeds
from Sales
(000) | | Dividend
Income
(000) | |
Liquidity Funds | | $ | 2,727 | | | $ | 65,915 | | | $ | 65,333 | | | $ | 32 | | |
Affiliated
Investment
Company (cont'd) | | Realized
Gain (Loss)
(000) | | Change in
Unrealized
Appreciation
(Depreciation)
(000) | | Value
December 31,
2017
(000) | |
Liquidity Funds | | $ | — | | | $ | — | | | $ | 3,309 | | |
During the year ended December 31, 2017, the Fund incurred approximately $10,000 in brokerage commissions with Morgan
21
Morgan Stanley Institutional Fund, Inc.
Annual Report — December 31, 2017
Notes to Financial Statements (cont'd)
Stanley & Co., LLC, an affiliate of the Adviser/Administrator, Sub-Adviser and Distributor, for portfolio transactions executed on behalf of the Fund.
The Fund is permitted to purchase and sell securities ("cross-trade") from and to other Morgan Stanley Funds as well as other funds and client accounts for which the Adviser or an affiliate of the Adviser serves as investment adviser, pursuant to procedures approved by the Directors in compliance with Rule 17a-7 under the Act (the "Rule"). Each cross-trade is executed at the current market price in compliance with provisions of the Rule. For the year ended December 31, 2017, the Fund did not engage in any cross-trade transactions.
The Fund has an unfunded Deferred Compensation Plan (the "Compensation Plan"), which allows each independent Director to defer payment of all, or a portion, of the fees he or she receives for serving on the Board of Directors. Each eligible Director generally may elect to have the deferred amounts credited with a return equal to the total return on one or more of the Morgan Stanley funds that are offered as investment options under the Compensation Plan. Appreciation/depreciation and distributions received from these investments are recorded with an offsetting increase/decrease in the deferred compensation obligation and do not affect the NAV of the Fund.
H. Federal Income Taxes: It is the Fund's intention to continue to qualify as a regulated investment company and distribute all of its taxable and tax-exempt income. Accordingly, no provision for federal income taxes is required in the financial statements.
The Fund may be subject to taxes imposed by countries in which it invests. Such taxes are generally based on income and/or capital gains earned or repatriated. Taxes are accrued based on net investment income, net realized gains and net unrealized appreciation as such income and/or gains are earned. Taxes may also be based on transactions in foreign currency and are accrued based on the value of investments denominated in such currency.
FASB ASC 740-10, "Income Taxes — Overall", sets forth a minimum threshold for financial statement recognition of the benefit of a tax position taken or expected to be taken in a tax return. Management has concluded there are no significant uncertain tax positions that would require recognition in the financial statements. If applicable, the Fund recognizes interest accrued related to unrecognized tax benefits in "Interest Expense" and penalties in "Other Expenses" in the Statement of Operations. The Fund files tax returns with the U.S. Internal
Revenue Service, New York and various states. Generally, each of the tax years in the three-year period ended December 31, 2017, remains subject to examination by taxing authorities.
The tax character of distributions paid may differ from the character of distributions shown in the Statements of Changes in Net Assets due to short-term capital gains being treated as ordinary income for tax purposes. The tax character of distributions paid during fiscal years 2017 and 2016 was as follows:
2017
Distributions
Paid From: | | 2016
Distributions
Paid From: | |
Ordinary
Income
(000) | | Long-Term
Capital Gain
(000) | | Ordinary
Income
(000) | | Long-Term
Capital Gain
(000) | | Paid-in-
Capital
(000) | |
| $ | 555 | | | $ | 310 | | | $ | 43 | | | $ | — | | | $ | 34 | | |
The amount and character of income and gains to be distributed are determined in accordance with income tax regulations which may differ from GAAP. These book/tax differences are either considered temporary or permanent in nature.
Temporary differences are primarily due to differing book and tax treatments for the timing of the recognition of gains (losses) on certain investment transactions and the timing of the deductibility of certain expenses.
Permanent differences, primarily due to differing treatments of gains (losses) related to foreign currency transactions, a dividend redesignation and redemptions in kind, resulted in the following reclassifications among the components of net assets at December 31, 2017:
Distributions
in Excess of Net
Investment
Income
(000) | | Distributions
in Excess of
Net Realized
Gain
(000) | | Paid-in-
Capital
(000) | |
| $ | (50 | ) | | $ | (4,298 | ) | | $ | 4,348 | | |
At December 31, 2017, the components of distributable earnings for the Fund on a tax basis were as follows:
Undistributed
Ordinary
Income
(000) | | Undistributed
Long-Term
Capital Gain
(000) | |
| $ | — | | | $ | 188 | | |
During the year ended December 31, 2017, the Fund utilized capital loss carryforwards for U.S. federal income tax purposes of approximately $742,000.
For the year ended December 31, 2017, the Fund realized gains from in-kind redemptions of approximately $4,348,000. The gains are not taxable income to the Fund.
22
Morgan Stanley Institutional Fund, Inc.
Annual Report — December 31, 2017
Notes to Financial Statements (cont'd)
I. Credit Facility: The Company and other Morgan Stanley funds participated in a $150,000,000 committed, unsecured revolving line of credit facility (the "Facility") with State Street. This Facility is to be used for temporary emergency purposes or funding of shareholder redemption requests. The interest rate on borrowings is based on the federal funds rate or 1 month LIBOR rate plus a spread. The Facility also has a commitment fee of 0.25% per annum based on the unused portion of the Facility. During the year ended December 31, 2017, the Fund did not have any borrowings under the Facility.
J. Other: At December 31, 2017, the Fund had record owners of 10% or greater. Investment activities of these shareholders could have a material impact on the Fund. The aggregate percentage of such owners was 81.3%.
23
Morgan Stanley Institutional Fund, Inc.
Annual Report — December 31, 2017
Report of Independent Registered Public Accounting Firm
To the Stockholders and Board of Directors of
Morgan Stanley Institutional Fund, Inc. —
Emerging Markets Leaders Portfolio
Opinion on the Financial Statements
We have audited the accompanying statement of assets and liabilities of Emerging Markets Leaders Portfolio (the "Fund") (one of the funds constituting the Morgan Stanley Institutional Fund, Inc. (the "Company")), including the portfolio of investments, as of December 31, 2017, and the related statement of operations for the year then ended, the statements of changes in net assets for each of the two years in the period then ended, the financial highlights for each of the two years in the period then ended and the period from January 5, 2015 (commencement of operations) through December 31, 2015 and the related notes (collectively referred to as the "financial statements"). In our opinion, the financial statements present fairly, in all material respects, the financial position of Emerging Markets Leaders Portfolio (one of the funds constituting Morgan Stanley Institutional Fund, Inc.) at December 31, 2017, the results of its operations for the year then ended, the changes in its net assets for each of the two years in the period then ended and its financial highlights for each of the two years in the period then ended and the period from January 5, 2015 (commencement of operations) through December 31, 2015, in conformity with U.S. generally accepted accounting principles.
Basis for Opinion
These financial statements are the responsibility of the Company's management. Our responsibility is to express an opinion on the Fund's financial statements based on our audits. We are a public accounting firm registered with the Public Company Accounting Oversight Board (United States) ("PCAOB") and are required to be independent with respect to the Company in accordance with the U.S. federal securities law and the applicable rules and regulations of the Securities and Exchange Commission and the PCAOB.
We conducted our audits in accordance with the standards of the PCAOB. Those standards require that we plan and perform the audit to obtain reasonable assurance about whether the financial statements are free of material misstatement, whether due to error or fraud. The Company is not required to have, nor were we engaged to perform, an audit of the Company's internal control over financial reporting. As part of our audits, we are required to obtain an understanding of internal control over financial reporting, but not for the purpose of expressing an opinion on the effectiveness of the Company's internal control over financial reporting. Accordingly, we express no such opinion.
Our audits included performing procedures to assess the risks of material misstatement of the financial statements, whether due to error or fraud, and performing procedures that respond to those risks. Such procedures included examining, on a test basis, evidence regarding the amounts and disclosures in the financial statements. Our procedures included confirmation of securities owned as of December 31, 2017 by correspondence with the custodian and others or by other appropriate auditing procedures where replies from others were not received. Our audits also included evaluating the accounting principles used and significant estimates made by management, as well as evaluating the overall presentation of the financial statements. We believe that our audits provide a reasonable basis for our opinion.

We have served as the auditor of one or more Morgan Stanley investment companies since 2000.
Boston, Massachusetts
February 26, 2018
24
Morgan Stanley Institutional Fund, Inc.
Annual Report — December 31, 2017
Federal Tax Notice (unaudited)
For federal income tax purposes, the following information is furnished with respect to the distributions paid by the Fund during its taxable year ended December 31, 2017. For corporate shareholders 0.2% of the dividends qualified for the dividends received deduction.
The Fund designated and paid approximately $310,000 as a long-term capital gain distribution.
For federal income tax purposes, the following information is furnished with respect to the Fund's earnings for its taxable year ended December 31, 2017. When distributed, certain earnings may be subject to a maximum tax rate of 15% as provided for by the Jobs and Growth Tax Relief Reconciliation Act of 2003. The Fund designated up to a maximuqm of approximately $728,000 as taxable at this lower rate.
The Fund intends to pass through foreign tax credits of approximately $168,000 and has derived net income from sources within foreign countries amounting to approximately $1,794,000.
In January, the Fund provides tax information to shareholders for the preceding calendar year.
25
Morgan Stanley Institutional Fund, Inc.
Annual Report — December 31, 2017
Privacy Notice (unaudited)
MORGAN STANLEY INVESTMENT MANAGEMENT INC.
AN IMPORTANT NOTICE CONCERNING OUR U.S. PRIVACY POLICY
We are required by federal law to provide you with a copy of our privacy policy annually. This policy applies to current and former individual investors in funds managed or sponsored by Morgan Stanley Investment Management Inc. ("MSIM") as well as current and former individual clients of MSIM. This policy is not applicable to partnerships, corporations, trusts or other non-individual clients or investors. Please note that we may amend this policy at any time, and will inform you of any changes as required by law.
WE RESPECT YOUR PRIVACY
We appreciate that you have provided us with your personal financial information. We strive to maintain the privacy of such information while we help you achieve your financial objectives. This Notice describes what non-public personal information we collect about you, why we collect it, when we may share it with others and how certain others may use it. It discusses the steps you may take to limit our sharing of certain information about you to affiliated companies in the Morgan Stanley family of companies ("other Morgan Stanley companies"). It also discloses how you may limit use of certain shared information for marketing purposes by other Morgan Stanley branded companies. Throughout this policy, we refer to the non-public information that personally identifies you or your accounts as "personal information.''
1. WHAT PERSONAL INFORMATION DO WE COLLECT ABOUT YOU?
We obtain personal information from applications and other forms you submit to us, from your dealings with us, from consumer reporting agencies, from our Web sites and from third parties and other sources.
For example:
• We may collect information such as your name, address, e-mail address, telephone/fax numbers, assets, income and investment objectives through subscription documents, applications and other forms you submit to us.
• We may obtain information about account balances, your use of account(s) and the types of products and services you prefer to receive from us through your dealings and transactions with us and other sources.
• We may obtain information about your creditworthiness and credit history from consumer reporting agencies.
• We may collect background information from and through third-party vendors to verify representations you have made and to comply with various regulatory requirements.
• If you interact with us through our public and private Web sites, we may collect information that you provide directly through online communications (such as an e-mail address). We may also collect information about your Internet service provider, your domain name, your computer's operating system and Web browser, your use of our Web sites and your product and service preferences, through the use of "cookies." Please consult the Terms of Use of these sites for more details.
2. WHEN DO WE DISCLOSE PERSONAL INFORMATION WE COLLECT ABOUT YOU?
We may disclose personal information we collect about you to other Morgan Stanley companies and to non-affiliated third parties.
a. Information We Disclose to Other Morgan Stanley Companies.
We may disclose personal information to other Morgan Stanley companies for a variety of reasons, including to manage your account(s) effectively, to service and process your transactions, to let you know about products and services offered by us and other Morgan Stanley companies, to manage our business, and as otherwise required or permitted by law. Offers for products and services from other Morgan Stanley companies are developed under conditions designed to safeguard your personal information.
26
Morgan Stanley Institutional Fund, Inc.
Annual Report — December 31, 2017
Privacy Notice (unaudited) (cont'd)
b. Information We Disclose to Non-affiliated Third Parties.
We do not disclose personal information that we collect about you to non-affiliated third parties except to those who provide marketing services on our behalf, to financial institutions with whom we have joint marketing agreements, and as otherwise required or permitted by law. For example, we may disclose personal information to non-affiliated third parties for servicing and processing transactions, to offer our own products and services, to protect against fraud, for institutional risk control, to respond to judicial process or to perform services on our behalf. When we share personal information with a non-affiliated third party, they are required to limit their use of personal information to the particular purpose for which it was shared and they are not allowed to share personal information with others except to fulfill that limited purpose or as may be permitted or required by law.
3. HOW DO WE PROTECT THE SECURITY AND CONFIDENTIALITY OF PERSONAL INFORMATION WE COLLECT ABOUT YOU?
We maintain physical, electronic and procedural security measures to help safeguard the personal information we collect about you. We have internal policies governing the proper handling of client information. Third parties that provide support or marketing services on our behalf may also receive personal information, and we require them to adhere to confidentiality standards with respect to such information.
4. HOW CAN YOU LIMIT THE SHARING OF CERTAIN TYPES OF PERSONAL INFORMATION WITH OTHER MORGAN STANLEY COMPANIES?
We offer you choices as to whether we share with other Morgan Stanley companies the personal information that was collected to determine your eligibility for products and services you request ("eligibility information"). Eligibility information does not include your identification information or personal information pertaining to our transactions or experiences with you. Please note that, even if you direct us not to share eligibility information with other Morgan Stanley companies ("opt-out"), we may still share personal information, including eligibility information, with those companies in circumstances excluded from the opt-out under applicable law, such as to process transactions or to service your account.
5. HOW CAN YOU LIMIT THE USE OF CERTAIN TYPES OF PERSONAL INFORMATION BY OTHER MORGAN STANLEY COMPANIES FOR MARKETING?
By following the opt-out instructions in Section 6 below, you may limit other Morgan Stanley branded companies from marketing their products or services to you based on personal information we disclose to them. This information may include, for example, your income and account history with us. Please note that, even if you choose to limit Other Morgan Stanley Companies from using personal information about you that we may share with them for marketing their products and services to you, Other Morgan Stanley Companies may use your personal information that they obtain from us to market to you in circumstances permitted by law, such as if the Other Morgan Stanley Company has its own relationship with you.
6. HOW CAN YOU SEND US AN OPT-OUT INSTRUCTION?
If you wish to limit our sharing of eligibility information about you with other Morgan Stanley companies or other Morgan Stanley companies' use of personal information for marketing purposes, as described in this notice, you may do so by:
• Calling us at (800) 548-7786
Monday-Friday between 8a.m. and 6p.m.(EST)
• Writing to us at the following address:
DST Asset Manager Solutions, Inc.
c/o Privacy Coordinator
P.O. Box 219804
Kansas City, Missouri 64121
27
Morgan Stanley Institutional Fund, Inc.
Annual Report — December 31, 2017
Privacy Notice (unaudited) (cont'd)
Your written request should include your name, address, telephone number and account number(s) to which the opt-out applies and whether you are opting out with respect to sharing of eligibility information (Section 4 above), or if information used for Marketing (Section 5 above) or both. Written opt-out requests should not be sent with any other correspondence. In order to process your request, we require that the request be provided by you directly and not through a third party.
Your opt-out preference will remain in effect with respect to this policy (as it may be amended) until you notify us otherwise. If you have a joint account, your direction for us not to share this information with other Morgan Stanley companies and for those other Morgan Stanley companies not to use your personal information for marketing will be applied to all account holders on that account. Please understand that if you limit our sharing or our affiliated companies' use of personal information, you and any joint account holder(s) may not receive information about Morgan Stanley products and services, including products or services that could help you manage your financial resources and achieve your investment objectives.
7. WHAT IF AN AFFILIATED COMPANY BECOMES A NON-AFFILIATED THIRD PARTY?
If, at any time in the future, an affiliated company becomes a non-affiliated third party, further disclosures of personal information made to the former affiliated company will be limited to those described in Section 2(b) above relating to non-affiliated third parties. If you elected under Section 6 to limit disclosures we make to affiliated companies, or use of personal information by affiliated companies, your election will not apply to use by any former affiliated company of your personal information in their possession once it becomes a non-affiliated third party.
SPECIAL NOTICE TO RESIDENTS OF VERMONT
The following section supplements our policy with respect to our individual clients who have a Vermont address and supersedes anything to the contrary in the above policy with respect to those clients only.
The state of Vermont requires financial institutions to obtain your consent prior to sharing personal information that they collect about you with affiliated companies and non-affiliated third parties other than in certain limited circumstances. Except as permitted by law, we will not share personal information we collect about you with non-affiliated third parties or other Morgan Stanley companies unless you provide us with your written consent to share such information ("opt-in").
If you wish to receive offers for investment products and services offered by or through other Morgan Stanley companies, please notify us in writing at the following address:
DST Asset Manager Solutions, Inc.
c/o Privacy Coordinator
P.O. Box 219804
Kansas City, Missouri 64121
Your authorization should include your name, address, telephone number and account number(s) to which the opt-in applies and should not be sent with any other correspondence. In order to process your authorization, we require that the authorization be provided by you directly and not through a third party.
SPECIAL NOTICE TO RESIDENTS OF CALIFORNIA
The following section supplements our policy with respect to our individual clients who have a California address and supersedes anything to the contrary in the above policy with respect to those clients only.
In response to a California law, if your account has a California home address, your personal information will not be disclosed to non-affiliated third parties except as permitted by applicable California law, and we will limit sharing such information with our affiliates to comply with California privacy laws that apply to us.
28
Morgan Stanley Institutional Fund, Inc.
Annual Report — December 31, 2017
Director and Officer Information (unaudited)
Independent Directors:
Name, Age and Address of
Independent Director | | Position(s)
Held with
Registrant | | Length of Time
Served* | | Principal Occupation(s) During Past 5 Years
and Other Relevant Professional Experience | | Number of
Portfolios in
Fund Complex
Overseen by
Independent
Director** | | Other Directorships
Held by Independent
Director*** | |
Frank L. Bowman (73)
c/o Perkins Coie LLP
Counsel to the Independent
Directors
30 Rockefeller Plaza
New York, NY 10112 | | Director | | Since
August
2006 | | President, Strategic Decisions, LLC (consulting) (since February 2009); Director or Trustee of various Morgan Stanley Funds (since August 2006); Chairperson of the Compliance and Insurance Committee (since October 2015); formerly, Chairperson of the Insurance Sub-Committee of the Compliance and Insurance Committee (2007-2015); served as President and Chief Executive Officer of the Nuclear Energy Institute (policy organization) (February 2005-November 2008); retired as Admiral, U.S. Navy after serving over 38 years on active duty including 8 years as Director of the Naval Nuclear Propulsion Program in the Department of the Navy and the U.S. Department of Energy (1996-2004); served as Chief of Naval Personnel (July 1994-September 1996) and on the Joint Staff as Director of Political Military Affairs (June 1992-July 1994); knighted as Honorary Knight Commander of the Most Excellent Order of the British Empire; awarded the Officier de l'Orde National du Mérite by the French Government; elected to the National Academy of Engineering (2009). | | | 88 | | | Director of BP p.l.c.; Director of Naval and Nuclear Technologies LLP; Director Emeritus of the Armed Services YMCA; Director of the U.S. Naval Submarine League; Member of the National Security Advisory Council of the Center for U.S. Global Engagement and a member of the CNA Military Advisory Board; Trustee of Fairhaven United Methodist Church; and Director of other various non-profit organizations. | |
Kathleen A. Dennis (64)
c/o Perkins Coie LLP
Counsel to the Independent
Directors
30 Rockefeller Plaza
New York, NY 10112 | | Director | | Since
August
2006 | | President, Cedarwood Associates (mutual fund and investment management consulting) (since July 2006); Chairperson of the Liquidity and Alternatives Sub-Committee of the Investment Committee (since October 2006) and Director or Trustee of various Morgan Stanley Funds (since August 2006); formerly, Senior Managing Director of Victory Capital Management (1993-2006). | | | 89 | | | Director of various non-profit organizations. | |
Nancy C. Everett (62)
c/o Perkins Coie LLP
Counsel to the Independent
Directors
30 Rockefeller Plaza
New York, NY 10112 | | Director | | Since
January
2015 | | Chief Executive Officer, Virginia Commonwealth University Investment Company (since November 2015); Owner, OBIR, LLC (institutional investment management consulting) (since June 2014); formerly, Managing Director, BlackRock Inc. (February 2011-December 2013); and Chief Executive Officer, General Motors Asset Management (a/k/a Promark Global Advisors, Inc.) (June 2005-May 2010). | | | 90 | | | Formerly, Member of Virginia Commonwealth University School of Business Foundation (2005-2016); Member of Virginia Commonwealth University Board of Visitors (2013-2015); Member of Committee on Directors for Emerging Markets Growth Fund, Inc. (2007-2010); Chairperson of Performance Equity Management, LLC (2006-2010); and Chairperson, GMAM Absolute Return Strategies Fund, LLC (2006-2010). | |
29
Morgan Stanley Institutional Fund, Inc.
Annual Report — December 31, 2017
Director and Officer Information (unaudited) (cont'd)
Independent Directors: (cont'd)
Name, Age and Address of
Independent Director | | Position(s)
Held with
Registrant | | Length of Time
Served* | | Principal Occupation(s) During Past 5 Years
and Other Relevant Professional Experience | | Number of
Portfolios in
Fund Complex
Overseen by
Independent
Director** | | Other Directorships
Held by Independent
Director*** | |
Jakki L. Haussler (60)
c/o Perkins Coie LLP
Counsel to the Independent
Directors
30 Rockefeller Plaza
New York, NY 10112 | | Director | | Since
January
2015 | | Chairman and Chief Executive Officer, Opus Capital Group (since January 1996); formerly, Director, Capvest Venture Fund, LP (May 2000-December 2011); Partner, Adena Ventures, LP (July 1999-December 2010); Director, The Victory Funds (February 2005-July 2008). | | | 90 | | | Director of Cincinnati Bell Inc. and Member, Audit Committee and Compensation Committee; Director of Northern Kentucky University Foundation and Member, Investment Committee; Member of Chase College of Law Transactional Law Practice Center Board of Advisors; Director of Best Transport; Director of Chase College of Law Board of Visitors; formerly, Member, University of Cincinnati Foundation Investment Committee; Member, Miami University Board of Visitors (2008-2011); Trustee of Victory Funds (2005-2008) and Chairman, Investment Committee (2007-2008) and Member, Service Provider Committee (2005-2008). | |
Dr. Manuel H. Johnson (68)
c/o Johnson Smick International, Inc.
220 I Street, NE — Suite 200
Washington, D.C. 20002 | | Director | | Since
July
1991 | | Senior Partner, Johnson Smick International, Inc. (consulting firm); Chairperson of the Investment Committee (since October 2006) and Director or Trustee of various Morgan Stanley Funds (since July 1991); Co-Chairman and a founder of the Group of Seven Council (G7C) (international economic commission); formerly, Chairperson of the Audit Committee (July 1991-September 2006), Vice Chairman of the Board of Governors of the Federal Reserve System and Assistant Secretary of the U.S. Treasury. | | | 88 | | | Director of NVR, Inc. (home construction). | |
Joseph J. Kearns (75)
c/o Kearns & Associates LLC
46 E Peninsula Center #385
Rolling Hills Estates, CA 90274-3712 | | Director | | Since
August
1994 | | Senior Adviser, Kearns & Associates LLC (investment consulting); Chairperson of the Audit Committee (since October 2006) and Director or Trustee of various Morgan Stanley Funds (since August 1994); formerly, Deputy Chairperson of the Audit Committee (July 2003-September 2006) and Chairperson of the Audit Committee of various Morgan Stanley Funds (since August 1994); CFO of the J. Paul Getty Trust. | | | 89 | | | Prior to August 10, 2016, Director of Electro Rent Corporation (equipment leasing); Prior to December 31, 2013, Director of The Ford Family Foundation. | |
30
Morgan Stanley Institutional Fund, Inc.
Annual Report — December 31, 2017
Director and Officer Information (unaudited) (cont'd)
Independent Directors: (cont'd)
Name, Age and Address of
Independent Director | | Position(s)
Held with
Registrant | | Length of Time
Served* | | Principal Occupation(s) During Past 5 Years
and Other Relevant Professional Experience | | Number of
Portfolios in
Fund Complex
Overseen by
Independent
Director** | | Other Directorships
Held by Independent
Director*** | |
Michael F. Klein (59)
c/o Perkins Coie LLP
Counsel to the Independent
Directors
30 Rockefeller Plaza
New York, NY 10112 | | Director | | Since
August
2006 | | Managing Director, Aetos Capital, LLC (since March 2000); Co-President, Aetos Alternatives Management, LLC (since January 2004) and Co-Chief Executive Officer of Aetos Capital LLC (since August 2013); Chairperson of the Fixed Income Sub-Committee of the Investment Committee (since October 2006) and Director or Trustee of various Morgan Stanley Funds (since August 2006); formerly, Managing Director, Morgan Stanley & Co. Inc. and Morgan Stanley Dean Witter Investment Management, President, various Morgan Stanley Funds (June 1998-March 2000) and Principal, Morgan Stanley & Co. Inc. and Morgan Stanley Dean Witter Investment Management (August 1997-December 1999). | | | 88 | | | Director of certain investment funds managed or sponsored by Aetos Capital, LLC; Director of Sanitized AG and Sanitized Marketing AG (specialty chemicals). | |
Patricia Maleski (57)
c/o Perkins Coie LLP
Counsel to the Independent
Directors
30 Rockefeller Plaza
New York, NY 10112 | | Director | | Since
January
2017 | | Managing Director, JPMorgan Asset Management (2004-2016); Oversight and Control Head of Fiduciary and Conflicts of Interest Program (2015-2016); Chief Control Officer-Global Asset Management (2013-2015); President, JPMorgan Funds (2010-2013); Chief Administrative Officer (2004-2013); various other positions including Treasurer and Board Liaison (since 2001). | | | 90 | | | None. | |
Michael E. Nugent (81)
522 Fifth Avenue
New York, NY 10036 | | Chair of the
Board and
Director | | Chair of the Boards since July 2006 and Director since July 1991 | | Chair of the Boards of various Morgan Stanley Funds (since July 2006); Chairperson of the Closed-End Fund Committee (since June 2012) and Director or Trustee of various Morgan Stanley Funds (since July 1991); formerly, Chairperson of the Insurance Committee (until July 2006); General Partner, Triumph Capital, L.P. (private investment partnership) (1988-2013). | | | 88 | | | None. | |
W. Allen Reed (70)
c/o Perkins Coie LLP
Counsel to the Independent
Directors
30 Rockefeller Plaza
New York, NY 10112 | | Director | | Since
August
2006 | | Chairperson of the Equity Sub-Committee of the Investment Committee (since October 2006) and Director or Trustee of various Morgan Stanley Funds (since August 2006); formerly, President and CEO of General Motors Asset Management; Chairman and Chief Executive Officer of the GM Trust Bank and Corporate Vice President of General Motors Corporation (August 1994-December 2005). | | | 89 | | | Director of Legg Mason, Inc.; formerly, Director of the Auburn University Foundation (2010-2015). | |
Fergus Reid (85)
c/o Joe Pietryka, Inc.
85 Charles Colman Blvd.
Pawling, NY 12564 | | Director | | Since
June
1992 | | Chairman, Joe Pietryka, Inc.; Chairperson of the Governance Committee and Director or Trustee of various Morgan Stanley Funds (since June 1992). | | | 89 | | | Formerly, Trustee and Director of certain investment companies in the JP Morgan Fund Complex managed by JP Morgan Investment Management Inc. (1987-2012). | |
* This is the earliest date the Director began serving the Morgan Stanley Funds. Each Director serves an indefinite term, until his or her successor is elected.
** The Fund Complex includes (as of December 31, 2017) all open-end and closed-end funds (including all of their portfolios) advised by Morgan Stanley Investment Management Inc. (the "Adviser") and any funds that have an adviser that is an affiliated person of the Adviser (including, but not limited to, Morgan Stanley AIP GP LP).
*** This includes any directorships at public companies and registered investment companies held by the Director at any time during the past five years.
31
Morgan Stanley Institutional Fund, Inc.
Annual Report — December 31, 2017
Director and Officer Information (unaudited) (cont'd)
Executive Officers:
Name, Age and Address of Executive Officer | | Position(s) Held
with
Registrant | | Length of Time
Served* | | Principal Occupation(s) During Past 5 Years | |
John H. Gernon (54)
522 Fifth Avenue
New York, NY 10036 | | President and
Principal
Executive
Officer | | Since
September
2013 | | President and Principal Executive Officer of the Equity and Fixed Income Funds and the Morgan Stanley AIP Funds (since September 2013) and the Liquidity Funds and various money market funds (since May 2014) in the Fund Complex; Managing Director of the Adviser; Head of Product (since 2006). | |
Timothy J. Knierim (58)
522 Fifth Avenue
New York, NY 10036 | | Chief
Compliance
Officer | | Since
December
2016 | | Managing Director of the Adviser and various entities affiliated with the Adviser; Chief Compliance Officer of various Morgan Stanley Funds and the Adviser (since December 2016) and Chief Compliance Officer of Morgan Stanley AIP GP LP (since 2014). Formerly, Managing Director and Deputy Chief Compliance Officer of the Adviser (2014-2016); and formerly, Chief Compliance Officer of Prudential Investment Management, Inc. (2007-2014). | |
Francis J. Smith (52)
522 Fifth Avenue
New York, NY 10036 | | Treasurer and
Principal
Financial Officer | | Treasurer
since July
2003 and
Principal
Financial
Officer since
September
2002 | | Managing Director of the Adviser and various entities affiliated with the Adviser; Treasurer (since July 2003) and Principal Financial Officer of various Morgan Stanley Funds (since September 2002). | |
Mary E. Mullin (50)
522 Fifth Avenue
New York, NY 10036 | | Secretary | | Since
June
1999 | | Managing Director of the Adviser; Secretary of various Morgan Stanley Funds (since June 1999). | |
Michael J. Key (38)
522 Fifth Avenue
New York, NY 10036 | | Vice President | | Since
June
2017 | | Vice President of the Equity and Fixed Income Funds, Liquidity Funds, various money market funds and the Morgan Stanley AIP Funds in the Fund Complex (since June 2017); Executive Director of the Adviser; Head of Product Development for Equity and Fixed Income Funds (since August 2013). | |
* This is the earliest date the officer began serving the Morgan Stanley Funds. Each officer serves a one-year term, until his or her successor is elected and qualifies.
32
Morgan Stanley Institutional Fund, Inc.
Annual Report — December 31, 2017
Adviser and Administrator
Morgan Stanley Investment Management Inc.
522 Fifth Avenue
New York, New York 10036
Sub-Adviser
Morgan Stanley Investment Management Company
23 Church Street
16-01 Capital Square, Singapore 049481
Distributor
Morgan Stanley Distribution, Inc.
522 Fifth Avenue
New York, New York 10036
Dividend Disbursing and Transfer Agent
DST Asset Manager Solutions, Inc.
2000 Crown Colony Drive
Quincy, Massachusetts 02169
Custodian
State Street Bank and Trust Company
One Lincoln Street
Boston, Massachusetts 02111
Legal Counsel
Dechert LLP
1095 Avenue of the Americas
New York, New York 10036
Counsel to the Independent Directors
Perkins Coie LLP
30 Rockefeller Plaza
New York, New York 10112
Independent Registered Public Accounting Firm
Ernst & Young LLP
200 Clarendon Street
Boston, Massachusetts 02116
Reporting to Shareholders
Each Morgan Stanley Fund provides a complete schedule of portfolio holdings in its semi-annual and annual reports within 60 days of the end of the fund's second and fourth fiscal quarters. The semi-annual and annual reports are filed electronically with the Securities and Exchange Commission (SEC) on Form N-CSRS and Form N-CSR, respectively. Morgan Stanley also delivers the semi-annual and annual reports to fund shareholders and makes these reports available on its public website, www.morganstanley.com/im. Each Morgan Stanley fund also files a complete schedule of portfolio holdings with the SEC for the fund's first and third fiscal quarters on Form N-Q. Morgan Stanley does not deliver the reports for the first and third fiscal quarters to shareholders, nor are the reports posted to the Morgan Stanley public website. You may, however, obtain the Form N-Q filings (as well as the Form N-CSR and N-CSRS filings) by accessing the SEC's website, www.sec.gov. You may also review and copy them at the SEC's Public Reference Room in Washington, DC. Information on the operation of the SEC's Public Reference Room may be obtained by calling the SEC toll free at 1 (800) SEC-0330. You can also request copies of these materials, upon payment of a duplicating fee, by electronic request at the SEC's email address (publicinfo@sec.gov) or by writing to the SEC's Public Reference Section, Washington, D.C. 20549-1520.
Proxy Voting Policies and Procedures and Proxy Voting Record
You may obtain a copy of the Company's Proxy Voting Policy and Procedures and information regarding how the Company voted proxies relating to portfolio securities during the most recent twelve-month period ended June 30, without charge, upon request, by calling toll free 1 (800) 548-7786 or by visiting our website at www.morganstanley.com/im. This information is also available on the SEC's website at www.sec.gov.
This report is authorized for distribution only when preceded or accompanied by a prospectus or summary prospectus of the applicable Fund of Morgan Stanley Institutional Fund, Inc., which describes in detail the Fund's investment policies, risks, fees and expenses. Please read the prospectus carefully before you invest or send money. For additional information, including information regarding the investments comprising the Fund, please visit our website at www.morganstanley.com/im or call toll free 1 (800) 548-7786.
33
Printed in U.S.A.
This Report has been prepared for shareholders and may be distributed to others only if preceded or accompanied by a current prospectus.
Morgan Stanley Investment Management Inc.
522 Fifth Avenue
New York, New York 10036
© 2018 Morgan Stanley. Morgan Stanley Distribution, Inc.

IFIEMLANN
2007298 EXP. 02.28.19

Morgan Stanley Institutional Fund, Inc.
Emerging Markets Portfolio
Annual Report
December 31, 2017

Morgan Stanley Institutional Fund, Inc.
Annual Report — December 31, 2017
Shareholders' Letter | | | 2 | | |
Expense Example | | | 3 | | |
Investment Overview | | | 4 | | |
Portfolio of Investments | | | 7 | | |
Statement of Assets and Liabilities | | | 10 | | |
Statement of Operations | | | 12 | | |
Statements of Changes in Net Assets | | | 13 | | |
Financial Highlights | | | 15 | | |
Notes to Financial Statements | | | 20 | | |
Report of Independent Registered Public Accounting Firm | | | 29 | | |
Federal Tax Notice | | | 30 | | |
Privacy Notice | | | 31 | | |
Director and Officer Information | | | 34 | | |
This report is authorized for distribution only when preceded or accompanied by a prospectus or summary prospectus of the applicable Fund of Morgan Stanley Institutional Fund, Inc. To receive a prospectus and/or statement of additional information (SAI), which contains more complete information such as investment objectives, charges, expenses, policies for voting proxies, risk considerations, and describes in detail each of the Fund's investment policies to the prospective investor, please call toll free 1 (800) 548-7786. Please read the prospectuses carefully before you invest or send money.
Additionally, you can access information about the Fund, including performance, characteristics, and investment team commentary, through Morgan Stanley Investment Management's website: www.morganstanley.com/im.
Market forecasts provided in this report may not necessarily come to pass. There is no guarantee that any sectors mentioned will continue to perform as discussed herein or that securities in such sectors will be held by the Fund in the future. There is no assurance that a fund will achieve its investment objective. Funds are subject to market risk, which is the possibility that market values of securities owned by the Fund will decline and, therefore, the value of the Fund's shares may be less than what you paid for them. Accordingly, you can lose money investing in this Fund. Please see the prospectus for more complete information on investment risks.
1
Morgan Stanley Institutional Fund, Inc.
Annual Report — December 31, 2017
Shareholders' Letter (unaudited)
Dear Shareholders,
We are pleased to provide this Annual report, in which you will learn how your investment in Emerging Markets Portfolio (the "Fund") performed during the latest twelve-month period.
Morgan Stanley Investment Management is a client-centric, investor-led organization. Our global presence, intellectual capital, and breadth of products and services enable us to partner with investors to meet the evolving challenges of today's financial markets. We aim to deliver superior investment service and to empower our clients to make the informed decisions that help them reach their investment goals.
As always, we thank you for selecting Morgan Stanley Investment Management, and look forward to working with you in the months and years ahead.
Sincerely,

John H. Gernon
President and Principal Executive Officer
January 2018
2
Morgan Stanley Institutional Fund, Inc.
Annual Report — December 31, 2017
Expense Example (unaudited)
Emerging Markets Portfolio
As a shareholder of the Fund, you incur two types of costs: (1) transactional costs, including redemption fees; and (2) ongoing costs, which may include advisory fees, administration fees, distribution and shareholder services fees and other Fund expenses. This example is intended to help you understand your ongoing costs (in dollars) of investing in the Fund and to compare these costs with the ongoing costs of investing in other mutual funds.
This example is based on an investment of $1,000 invested at the beginning of the six-month period ended December 31, 2017 and held for the entire six-month period.
Actual Expenses
The table below provides information about actual account values and actual expenses. You may use the information in this table, together with the amount you invested, to estimate the expenses that you paid over the period. Simply divide your account value by $1,000 (for example, an $8,600 account value divided by $1,000 = 8.6), then multiply the result by the number in the table under the heading entitled "Actual Expenses Paid During Period" to estimate the expenses you paid on your account during this period.
Hypothetical Example for Comparison Purposes
The table below provides information about hypothetical account values and hypothetical expenses based on the Fund's actual expense ratio and an assumed rate of return of 5% per year before expenses, which is not the Fund's actual return. The hypothetical account values and expenses may not be used to estimate the actual ending account balance or expenses you paid for the period. You may use this information to compare the ongoing costs of investing in the Fund and other funds. To do so, compare this 5% hypothetical example with the 5% hypothetical examples that appear in the shareholder reports of the other funds.
Please note that the expenses shown in the table are meant to highlight your ongoing costs only and do not reflect any transactional costs, such as sales charges (loads) and redemption fees. Therefore, the information for each class in the table is useful in comparing ongoing costs only, and will not help you determine the relative total costs of owning different funds. In addition, if these transactional costs were included, your costs would have been higher.
| | | Beginning
Account
Value
7/1/17 | | Actual Ending
Account
Value
12/31/17 | | Hypothetical
Ending Account
Value | | Actual
Expenses
Paid
During
Period* | | Hypothetical
Expenses Paid
During Period* | | Net
Expense
Ratio
During
Period** | |
Emerging Markets Portfolio Class I | | $ | 1,000.00 | | | $ | 1,125.90 | | | $ | 1,019.91 | | | $ | 5.63 | | | $ | 5.35 | | | | 1.05 | % | |
Emerging Markets Portfolio Class A | | | 1,000.00 | | | | 1,124.50 | | | | 1,018.35 | | | | 7.28 | | | | 6.92 | | | | 1.36 | | |
Emerging Markets Portfolio Class L | | | 1,000.00 | | | | 1,121.30 | | | | 1,015.63 | | | | 10.16 | | | | 9.65 | | | | 1.90 | | |
Emerging Markets Portfolio Class C | | | 1,000.00 | | | | 1,119.90 | | | | 1,014.37 | | | | 11.49 | | | | 10.92 | | | | 2.15 | | |
Emerging Markets Portfolio Class IS | | | 1,000.00 | | | | 1,126.50 | | | | 1,020.42 | | | | 5.09 | | | | 4.84 | | | | 0.95 | | |
* Expenses are calculated using each Fund Class' annualized net expense ratio (as disclosed), multiplied by the average account value over the period, and multiplied by 184/365 (to reflect the most recent one-half year period).
** Annualized.
3
Morgan Stanley Institutional Fund, Inc.
Annual Report — December 31, 2017
Investment Overview (unaudited)
Emerging Markets Portfolio
The Fund seeks long-term capital appreciation by investing primarily in growth-oriented equity securities of issuers in emerging market countries.
Performance
For the year ended December 31, 2017, the Fund's Class I shares had a total return based on net asset value and reinvestment of distributions per share of 34.97%, net of fees. The Fund's Class I shares underperformed the Fund's benchmark, the MSCI Emerging Markets Net Index (the "Index"), which returned 37.28%.
Please keep in mind that double-digit returns are highly unusual and cannot be sustained. Investors should also be aware that these returns were primarily achieved during favorable market conditions.
Factors Affecting Performance
• Emerging markets ("EM") equities outperformed developed market equities in 2017 with the Index returning 37.28% versus the MSCI World Index return of 22.40%. The strong EM equity rally in 2017 is notable for several reasons. As with the U.S. bull market in 2017, technology companies within EM have dominated the surge. On both a sector and country basis, leadership has been historically narrow and it is the first year in almost two decades that leadership has not been driven by commodity prices.(i) Further, volatility has been extremely low and the minor 5% drawdown in 2017 was the smallest in EM since 1993.(ii)
• Information technology ("IT") companies dominated returns to an extent not seen since the dot-com era of the late 1990s.(i) Real estate and consumer discretionary also outperformed the Index, but to a much lesser degree. The Index's technology sector rose 61% versus 49% for real estate and 40% for consumer discretionary stocks. China, Poland and South Korea were the only countries to meaningfully outperform the Index. The Fund's portfolio had an average weight of 22% in technology versus the Index's weight at 26% over the year, and a 19% allocation in China versus the Index's allocation at 28%.
• We have long held underweight allocations to China and Korea in the portfolio over concern
about both countries' slowing economic growth and China's massive debt build-up in its "old" and state-controlled portions of the economy and market. Our portfolio makes important distinctions within China, owning only those companies, including tech, which we believe have constructive secular long-term earnings growth prospects; we largely avoid those companies with state control that are not focused on shareholder returns. Considering the underweights to China and Korea, the Fund delivered strong performance by finding those other pockets of accelerating, sustainable growth in such countries as Poland and India and specific companies in Russia, Argentina and Brazil, which are recovering from historically deep recessions.
• While our underweight allocation to China was the biggest detractor from performance from a country allocation standpoint, our strong stock selection in the country was the biggest contributor from a stock selection standpoint, and more than offset losses from allocation. Similarly, our stock selection choices leading to our slightly underweight allocation to the IT sector detracted from returns, but these losses were more than offset by our stock selection within the IT sector.
Management Strategies
• A bullish case can be made that the leading EM tech stocks still have enormous room to grow. We are very careful in our stock selection within the sector. The question, however, is whether tech stocks will remain the only game in global markets, as seemed to be the case for much of last year. 2017 was a year of unusually low volatility, accompanied by abnormally intense concentration both in the U.S. and EMs. Whether we look at emerging markets returns by country, sector or company, they were unusually concentrated on one bet — the big tech firms, particularly from China.
• Historically, when markets become this stretched, they tend to snap back into some semblance of balance. That snap could produce the first significant corrections in many months. But it could also produce a shift toward sectors and countries that have been overlooked and have underperformed as investors were all-consumed by
(i) Source: Morgan Stanley Investment Management, FactSet and Haver Analytics
(ii) Source: Morgan Stanley Investment Management, Bloomberg L.P. and FactSet
4
Morgan Stanley Institutional Fund, Inc.
Annual Report — December 31, 2017
Investment Overview (unaudited) (cont'd)
Emerging Markets Portfolio
the tech story. The time seems ripe for a shift, given that the global recovery has been unusually broad, lifting every major economy out of the doldrums, and creating potential opportunity in many sectors.
• What keeps EM equities in good health as an asset class — even if they do experience a drawdown — is that for EM in aggregate, the EM current account is in surplus and the capital account is no longer negative, placing the asset class in better shape to sustain what has been a gradually rising U.S. interest rate environment. This has been a well-signaled U.S. rate hike cycle and the Federal Reserve's moves have been only 25 basis points at a time — in sharp contrast to the abrupt and larger rate hikes that occurred in the 1990s and early 2000s.
• With all this in mind, we continue to own technology companies that are growing for structural reasons; we are underweight more cyclical tech plays.
• We are constructive on those EM financials benefiting from underpenetrated credit markets and favorable interest rate environments in individual countries, and on companies benefiting from healthy domestic demand, particularly in regard to health care, travel and leisure, and select consumer discretionary and staples.
• On a country basis, we continue to be overweight Eastern Europe, Brazil, the Philippines and Indonesia on various factors including healthy domestic demand, underpenetrated credit and the economic benefits of selective reform. We are underweight countries with decelerating growth or heavy dependence on exports such as China, Taiwan and Korea.
• We believe Eastern European growth should continue to improve. Western European growth continues to gradually recover, as consumer pent-up demand rebounds from depressed levels and monetary conditions remain loose. Eastern Europe offers exposure to that recovery. The region has competitive currencies and labor markets, and it has been gaining market share in global manufactured exports for the past few years. Wage pressure could lead to higher inflation, especially in Poland, Hungary and Romania, which should help nominal gross domestic product (GDP) and earnings growth.
• We remain constructive on the Southeast Asian countries of Indonesia, Malaysia and the Philippines.
• Indonesia and Malaysia have adjusted to lower commodity prices, leading to better current and fiscal account positions, as well as bottoming GDP growth. The Philippines is one of the highest-growing countries in EM, and we think this could translate into superior earnings growth for the equity market. For the region as a whole, fiscal reforms such as subsidy reduction, tax amnesty and a widening of the tax base and infrastructure spending could provide a positive policy backdrop for the equity markets.
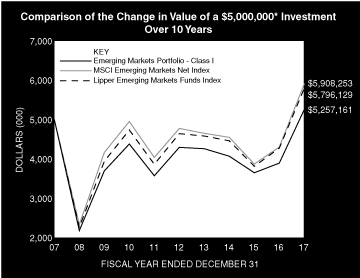
* Minimum Investment for Class I shares
In accordance with SEC regulations, the Fund's performance shown assumes that all recurring fees (including management fees) were deducted and all dividends and distributions were reinvested. The performance of Class A, L, C and IS shares will vary from Class I shares based upon their different inception dates and will be negatively impacted by additional fees assessed to those classes (if applicable).
5
Morgan Stanley Institutional Fund, Inc.
Annual Report — December 31, 2017
Investment Overview (unaudited) (cont'd)
Emerging Markets Portfolio
Performance Compared to the MSCI Emerging Markets Net Index(1) and the Lipper Emerging Markets Funds Index(2)
| | Period Ended December 31, 2017
Total Returns(3) | |
| | | | Average Annual | |
| | One
Year | | Five
Years | | Ten
Years | | Since
Inception(9) | |
Fund — Class I Shares
w/o sales charges(4) | | | 34.97 | % | | | 4.13 | % | | | 0.50 | % | | | 8.21 | % | |
Fund — Class A Shares
w/o sales charges(5) | | | 34.54 | | | | 3.80 | | | | 0.22 | | | | 7.16 | | |
Fund — Class A Shares with
maximum 5.25% sales charges(5) | | | 27.45 | | | | 2.69 | | | | –0.32 | | | | 6.90 | | |
Fund — Class L Shares
w/o sales charges(6) | | | 33.80 | | | | 3.25 | | | | — | | | | 3.95 | | |
Fund — Class C Shares
w/o sales charges(8) | | | 33.45 | | | | — | | | | — | | | | 5.53 | | |
Fund — Class C Shares with
maximum 1.00% deferred
sales charges(8) | | | 32.45 | | | | — | | | | — | | | | 5.53 | | |
Fund — Class IS Shares
w/o sales charges(7) | | | 35.09 | | | | — | | | | — | | | | 5.54 | | |
MSCI Emerging Markets Net Index | | | 37.28 | | | | 4.35 | | | | 1.68 | | | | 8.00 | | |
Lipper Emerging Markets Funds Index | | | 35.56 | | | | 4.54 | | | | 1.49 | | | | N/A | | |
Performance data quoted represents past performance, which is no guarantee of future results, and current performance may be lower or higher than the figures shown. Performance assumes that all dividends and distributions, if any, were reinvested. For the most recent month-end performance figures, please visit www.morganstanley.com/im. Investment return and principal value will fluctuate so that Fund shares, when redeemed, may be worth more or less than their original cost. Total returns do not reflect the deduction of taxes that a shareholder would pay on Fund distributions or the redemption of Fund shares. Performance of share classes will vary due to difference in sales charges and expenses.
(1) The MSCI Emerging Markets Net Index is a free float-adjusted market capitalization weighted index that is designed to measure equity market performance of emerging markets. The term "free float" represents the portion of shares outstanding that are deemed to be available for purchase in the public equity markets by investors. The MSCI Emerging Markets Net Index currently consists of 24 emerging market country indices. The performance of the Index is listed in U.S. dollars and assumes reinvestment of net dividends. The Index is unmanaged and its returns do not include any sales charges or fees. Such costs would lower performance. It is not possible to invest directly in an index.
(2) The Lipper Emerging Markets Funds Index is an equally weighted performance index of the largest qualifying funds (based on net assets) in the Lipper Emerging Markets Funds classification. The Index, which is adjusted for capital gains distributions and income dividends, is unmanaged and should not be considered an investment. There are currently 30 funds represented in this Index. As of the date of this report, the Fund is in the Lipper Emerging Markets Funds classification.
(3) Total returns for the Fund reflect fees waived and expenses reimbursed, if applicable, by the Adviser. Without such waivers and reimbursements, total returns would have been lower.
(4) Commenced operations on September 25, 1992.
(5) Commenced offering on January 2, 1996.
(6) Commenced offering on April 27, 2012.
(7) Commenced offering on September 13, 2013.
(8) Commenced offering on April 30, 2015.
(9) For comparative purposes, average annual since inception returns listed for the Indexes refer to the inception date of Class I of the Fund, not the inception of the Index.
6
Morgan Stanley Institutional Fund, Inc.
Annual Report — December 31, 2017
Portfolio of Investments
Emerging Markets Portfolio
| | | Shares | | Value
(000) | |
Common Stocks (97.0%) | |
Argentina (1.4%) | |
Banco Macro SA ADR | | | 78,457 | | | $ | 9,092 | | |
Grupo Financiero Galicia SA ADR | | | 162,237 | | | | 10,683 | | |
| | | | 19,775 | | |
Austria (0.9%) | |
Erste Group Bank AG (a) | | | 289,085 | | | | 12,467 | | |
Brazil (7.2%) | |
B3 SA — Brasil Bolsa Balcao | | | 1,581,068 | | | | 10,838 | | |
Banco Bradesco SA (Preference) | | | 1,988,595 | | | | 20,398 | | |
| BRF SA (a) | | | 883,845 | | | | 9,949 | | |
Itau Unibanco Holding SA (Preference) | | | 1,718,705 | | | | 22,259 | | |
Lojas Renner SA | | | 1,445,959 | | | | 15,417 | | |
Petroleo Brasileiro SA (a) | | | 1,962,105 | | | | 10,052 | | |
Petroleo Brasileiro SA (Preference) (a) | | | 2,344,730 | | | | 11,468 | | |
| | | | 100,381 | | |
Chile (1.2%) | |
Banco Santander Chile | | | 35,012,859 | | | | 2,737 | | |
Banco Santander Chile ADR | | | 44,029 | | | | 1,377 | | |
SACI Falabella | | | 1,319,884 | | | | 13,179 | | |
| | | | 17,293 | | |
China (21.2%) | |
AAC Technologies Holdings, Inc. (b) | | | 158,000 | | | | 2,810 | | |
Alibaba Group Holding Ltd. ADR (a)(c) | | | 225,026 | | | | 38,801 | | |
Bank of China Ltd. H Shares (b) | | | 52,419,000 | | | | 25,722 | | |
China Construction Bank Corp. H Shares (b) | | | 24,863,750 | | | | 22,870 | | |
China Mengniu Dairy Co., Ltd. (a)(b) | | | 2,082,000 | | | | 6,190 | | |
China Mobile Ltd. (b) | | | 646,500 | | | | 6,544 | | |
China Overseas Land & Investment Ltd. (b) | | | 866,000 | | | | 2,787 | | |
China Pacific Insurance Group Co., Ltd.
H Shares (b) | | | 3,407,000 | | | | 16,295 | | |
China Unicom Hong Kong Ltd. (a)(b) | | | 3,610,000 | | | | 4,886 | | |
CSPC Pharmaceutical Group Ltd. (b) | | | 3,864,000 | | | | 7,801 | | |
Ctrip.com International Ltd. ADR (a) | | | 24,011 | | | | 1,059 | | |
JD.com, Inc. ADR (a) | | | 255,930 | | | | 10,601 | | |
NetEase, Inc. ADR | | | 15,488 | | | | 5,344 | | |
New Oriental Education & Technology
Group, Inc. ADR | | | 91,849 | | | | 8,634 | | |
PetroChina Co., Ltd. H Shares (b) | | | 7,140,000 | | | | 4,983 | | |
Shenzhou International Group Holdings Ltd. (b) | | | 954,000 | | | | 9,061 | | |
Sino Biopharmaceutical Ltd. (b) | | | 5,649,000 | | | | 9,997 | | |
Sogou, Inc. ADR (a)(c) | | | 322,023 | | | | 3,726 | | |
TAL Education Group ADR | | | 308,298 | | | | 9,160 | | |
Tencent Holdings Ltd. (b) | | | 1,928,800 | | | | 99,709 | | |
| | | | 296,980 | | |
Czech Republic (0.8%) | |
Komercni Banka AS | | | 268,049 | | | | 11,505 | | |
Egypt (0.5%) | |
Commercial International Bank Egypt SAE | | | 1,697,163 | | | | 7,417 | | |
Germany (0.7%) | |
Adidas AG | | | 47,017 | | | | 9,386 | | |
| | | Shares | | Value
(000) | |
Hong Kong (2.3%) | |
AIA Group Ltd. | | | 1,727,800 | | | $ | 14,735 | | |
Samsonite International SA | | | 3,871,800 | | | | 17,785 | | |
| | | | 32,520 | | |
Hungary (1.2%) | |
OTP Bank PLC | | | 391,956 | | | | 16,191 | | |
India (8.7%) | |
Ashok Leyland Ltd. | | | 7,416,600 | | | | 13,807 | | |
Bharat Petroleum Corp., Ltd. | | | 1,869,288 | | | | 15,142 | | |
Housing Development Finance Corp., Ltd. | | | 423,756 | | | | 11,341 | | |
ICICI Bank Ltd. | | | 1,253,528 | | | | 6,147 | | |
ICICI Bank Ltd. ADR | | | 441,900 | | | | 4,300 | | |
IndusInd Bank Ltd. (Foreign) | | | 538,855 | | | | 13,918 | | |
Marico Ltd. | | | 3,148,370 | | | | 15,905 | | |
Maruti Suzuki India Ltd. | | | 112,287 | | | | 17,089 | | |
Shree Cement Ltd. | | | 40,637 | | | | 11,525 | | |
Zee Entertainment Enterprises Ltd. | | | 1,474,578 | | | | 13,440 | | |
| | | | 122,614 | | |
Indonesia (4.7%) | |
Astra International Tbk PT | | | 18,135,400 | | | | 11,086 | | |
Bank Mandiri Persero Tbk PT | | | 23,262,800 | | | | 13,701 | | |
Bumi Serpong Damai Tbk PT | | | 38,535,100 | | | | 4,828 | | |
Semen Indonesia Persero Tbk PT | | | 12,887,700 | | | | 9,405 | | |
Telekomunikasi Indonesia Persero Tbk PT | | | 35,967,600 | | | | 11,706 | | |
Unilever Indonesia Tbk PT | | | 2,668,200 | | | | 10,994 | | |
XL Axiata Tbk PT (a) | | | 21,580,200 | | | | 4,708 | | |
| | | | 66,428 | | |
Korea, Republic of (10.0%) | |
CJ Corp. | | | 51,952 | | | | 8,813 | | |
Coway Co., Ltd. | | | 73,024 | | | | 6,653 | | |
Hanssem Co., Ltd. | | | 27,391 | | | | 4,606 | | |
Hugel, Inc. (a) | | | 16,261 | | | | 8,472 | | |
Hyundai Development Co-Engineering &
Construction | | | 166,755 | | | | 6,003 | | |
Hyundai Motor Co. | | | 64,553 | | | | 9,404 | | |
Korea Aerospace Industries Ltd. (c) | | | 160,165 | | | | 7,089 | | |
Korea Electric Power Corp. | | | 242,471 | | | | 8,640 | | |
Mando Corp. (c) | | | 29,534 | | | | 8,490 | | |
NAVER Corp. | | | 18,855 | | | | 15,309 | | |
Samsung Electronics Co., Ltd. | | | 16,835 | | | | 39,997 | | |
Samsung Electronics Co., Ltd. (Preference) | | | 8,513 | | | | 16,595 | | |
| | | | 140,071 | | |
Malaysia (4.1%) | |
Genting Malaysia Bhd | | | 9,455,900 | | | | 13,151 | | |
IHH Healthcare Bhd | | | 9,086,500 | | | | 13,157 | | |
Malayan Banking Bhd | | | 4,543,329 | | | | 10,992 | | |
Malaysia Airports Holdings Bhd | | | 3,827,500 | | | | 8,336 | | |
Sime Darby Bhd | | | 5,054,000 | | | | 2,753 | | |
Sime Darby Plantation Bhd (a) | | | 5,054,000 | | | | 7,493 | | |
Sime Darby Property Bhd (a) | | | 5,054,000 | | | | 2,223 | | |
| | | | 58,105 | | |
The accompanying notes are an integral part of the financial statements.
7
Morgan Stanley Institutional Fund, Inc.
Annual Report — December 31, 2017
Portfolio of Investments (cont'd)
Emerging Markets Portfolio
| | | Shares | | Value
(000) | |
Mexico (2.9%) | |
Alsea SAB de CV | | | 1,694,238 | | | $ | 5,544 | | |
Fomento Economico Mexicano SAB de CV ADR | | | 152,740 | | | | 14,342 | | |
Grupo Financiero Banorte SAB de CV Series O | | | 3,777,451 | | | | 20,735 | | |
| | | | 40,621 | | |
Pakistan (0.4%) | |
Lucky Cement Ltd. | | | 23,250 | | | | 109 | | |
United Bank Ltd. | | | 3,528,900 | | | | 6,012 | | |
| | | | 6,121 | | |
Panama (0.7%) | |
Copa Holdings SA, Class A | | | 71,096 | | | | 9,531 | | |
Peru (1.5%) | |
Credicorp Ltd. | | | 98,406 | | | | 20,412 | | |
Philippines (3.0%) | |
Ayala Corp. | | | 321,610 | | | | 6,540 | | |
Ayala Land, Inc. | | | 6,779,000 | | | | 6,042 | | |
Metropolitan Bank & Trust Co. | | | 7,700,257 | | | | 15,632 | | |
SM Investments Corp. | | | 665,975 | | | | 13,190 | | |
| | | | 41,404 | | |
Poland (5.2%) | |
Bank Zachodni WBK SA | | | 105,064 | | | | 11,932 | | |
CCC SA | | | 147,348 | | | | 12,026 | | |
Jeronimo Martins SGPS SA | | | 330,916 | | | | 6,426 | | |
LPP SA | | | 3,891 | | | | 9,930 | | |
Powszechna Kasa Oszczednosci Bank
Polski SA (a) | | | 1,289,220 | | | | 16,378 | | |
Powszechny Zaklad Ubezpieczen SA | | | 1,348,777 | | | | 16,304 | | |
| | | | 72,996 | | |
Russia (4.9%) | |
Gazprom PJSC ADR | | | 78,009 | | | | 344 | | |
Gazprom PJSC ADR | | | 2,407,238 | | | | 10,614 | | |
Mail.ru Group Ltd. GDR (a) | | | 172,106 | | | | 4,957 | | |
MMC Norilsk Nickel PJSC ADR | | | 14,182 | | | | 268 | | |
MMC Norilsk Nickel PJSC ADR | | | 705,977 | | | | 13,174 | | |
Sberbank of Russia PJSC ADR | | | 1,203,477 | | | | 20,370 | | |
X5 Retail Group N.V. GDR (a) | | | 266,206 | | | | 10,047 | | |
Yandex N.V., Class A (a) | | | 262,392 | | | | 8,593 | | |
| | | | 68,367 | | |
South Africa (4.2%) | |
AVI Ltd. | | | 1,325,406 | | | | 11,819 | | |
Capitec Bank Holdings Ltd. | | | 145,560 | | | | 12,887 | | |
Clicks Group Ltd. | | | 540,344 | | | | 7,909 | | |
Discovery Ltd. | | | 548,916 | | | | 8,251 | | |
Imperial Holdings Ltd. | | | 245,037 | | | | 5,186 | | |
Naspers Ltd., Class N | | | 40,925 | | | | 11,403 | | |
Standard Bank Group Ltd. | | | 50,877 | | | | 804 | | |
| | | | 58,259 | | |
Switzerland (0.3%) | |
| DKSH Holding AG | | | 41,488 | | | | 3,629 | | |
| | | Shares | | Value
(000) | |
Taiwan (7.4%) | |
Advanced Semiconductor Engineering, Inc. | | | 3,949,253 | | | $ | 5,070 | | |
Advantech Co., Ltd. | | | 501,584 | | | | 3,545 | | |
Delta Electronics, Inc. | | | 1,605,557 | | | | 7,732 | | |
Hon Hai Precision Industry Co., Ltd. | | | 2,302,700 | | | | 7,335 | | |
Largan Precision Co., Ltd. | | | 70,000 | | | | 9,427 | | |
MediaTek, Inc. | | | 636,000 | | | | 6,270 | | |
Nanya Technology Corp. | | | 2,026,000 | | | | 5,157 | | |
Nien Made Enterprise Co., Ltd. | | | 759,000 | | | | 8,110 | | |
President Chain Store Corp. | | | 483,000 | | | | 4,603 | | |
Taiwan Semiconductor Manufacturing Co., Ltd. | | | 6,087,205 | | | | 46,774 | | |
| | | | 104,023 | | |
United States (1.6%) | |
MercadoLibre, Inc. | | | 73,089 | | | | 22,998 | | |
Total Common Stocks (Cost $951,950) | | | 1,359,494 | | |
Short-Term Investments (3.3%) | |
Securities held as Collateral on Loaned Securities (0.3%) | |
Investment Company (0.3%) | |
Morgan Stanley Institutional Liquidity
Funds — Government Portfolio —
Institutional Class (See Note G)
(Cost $3,864) | | | 3,864,276 | | | | 3,864 | | |
Investment Company (3.0%) | |
Morgan Stanley Institutional Liquidity
Funds — Government Portfolio —
Institutional Class (See Note G)
(Cost $42,478) | | | 42,477,777 | | | | 42,478 | | |
Total Short-Term Investments (Cost $46,342) | | | 46,342 | | |
Total Investments (100.3%) (Cost $998,292)
Including $15,767 of Securities
Loaned (d)(e) | | | 1,405,836 | | |
| Liabilities in Excess of Other Assets (–0.3%) | | | (4,066 | ) | |
Net Assets (100.0%) | | $ | 1,401,770 | | |
Country assignments and aggregations are based generally on third party vendor classifications and information, and may be different from the assignments and aggregations under the policies set forth in the Fund's prospectus and/or statement of additional information relating to geographic classifications.
(a) Non-income producing security.
(b) Security trades on the Hong Kong exchange.
(c) All or a portion of this security was on loan at December 31, 2017.
(d) The approximate fair value and percentage of net assets, $1,128,318,000 and 80.5%, respectively, represent the securities that have been fair valued under the fair valuation policy for international investments as described in Note A-1 within the Notes to the Financial Statements.
(e) At December 31, 2017, the aggregate cost for federal income tax purposes is approximately $1,003,824,000. The aggregate gross unrealized appreciation is approximately $416,547,000 and the aggregate gross unrealized depreciation is approximately $14,535,000, resulting in net unrealized appreciation of approximately $402,012,000.
ADR American Depositary Receipt.
GDR Global Depositary Receipt.
PJSC Public Joint Stock Company.
The accompanying notes are an integral part of the financial statements.
8
Morgan Stanley Institutional Fund, Inc.
Annual Report — December 31, 2017
Portfolio of Investments (cont'd)
Emerging Markets Portfolio
Portfolio Composition*
Classification | | Percentage of
Total Investments | |
Other** | | | 61.8 | % | |
Banks | | | 24.0 | | |
Internet Software & Services | | | 14.2 | | |
Total Investments | | | 100.0 | % | |
* Percentages indicated are based upon total investments (excluding Securities held as Collateral on Loaned Securities) as of December 31, 2017.
** Industries and/or investment types representing less than 5% of total investments.
The accompanying notes are an integral part of the financial statements.
9
Morgan Stanley Institutional Fund, Inc.
Annual Report — December 31, 2017
Emerging Markets Portfolio
Statement of Assets and Liabilities | | December 31, 2017
(000) | |
Assets: | |
Investments in Securities of Unaffiliated Issuers, at Value(1) (Cost $951,950) | | $ | 1,359,494 | | |
Investment in Security of Affiliated Issuer, at Value (Cost $46,342) | | | 46,342 | | |
Total Investments in Securities, at Value (Cost $998,292) | | | 1,405,836 | | |
Foreign Currency, at Value (Cost $291) | | | 289 | | |
Receivable for Fund Shares Sold | | | 2,007 | | |
Receivable for Investments Sold | | | 1,778 | | |
Dividends Receivable | | | 1,018 | | |
Tax Reclaim Receivable | | | 237 | | |
Receivable from Affiliate | | | 34 | | |
Receivable from Securities Lending Income | | | 6 | | |
Interest Receivable | | | 1 | | |
Other Assets | | | 90 | | |
Total Assets | | | 1,411,296 | | |
Liabilities: | |
Collateral on Securities Loaned, at Value | | | 3,864 | | |
Payable for Advisory Fees | | | 2,469 | | |
Deferred Capital Gain Country Tax | | | 1,924 | | |
Payable for Custodian Fees | | | 642 | | |
Payable for Investments Purchased | | | 102 | | |
Payable for Fund Shares Redeemed | | | 100 | | |
Payable for Directors' Fees and Expenses | | | 99 | | |
Payable for Administration Fees | | | 92 | | |
Payable for Professional Fees | | | 76 | | |
Payable for Sub Transfer Agency Fees — Class I | | | 62 | | |
Payable for Sub Transfer Agency Fees — Class A | | | 5 | | |
Payable for Sub Transfer Agency Fees — Class L | | | — | @ | |
Payable for Sub Transfer Agency Fees — Class C | | | — | @ | |
Payable for Transfer Agency Fees — Class I | | | 4 | | |
Payable for Transfer Agency Fees — Class A | | | 1 | | |
Payable for Transfer Agency Fees — Class L | | | — | @ | |
Payable for Transfer Agency Fees — Class C | | | 1 | | |
Payable for Transfer Agency Fees — Class IS | | | 1 | | |
Payable for Shareholder Services Fees — Class A | | | 5 | | |
Payable for Distribution and Shareholder Services Fees — Class L | | | — | @ | |
Payable for Distribution and Shareholder Services Fees — Class C | | | 1 | | |
Other Liabilities | | | 78 | | |
Total Liabilities | | | 9,526 | | |
Net Assets | | $ | 1,401,770 | | |
Net Assets Consist Of: | |
Paid-in-Capital | | $ | 1,034,553 | | |
Distributions in Excess of Net Investment Income | | | (17 | ) | |
Accumulated Net Realized Loss | | | (38,979 | ) | |
Unrealized Appreciation (Depreciation) on: | |
Investments (Net of $1,306 of Deferred Capital Gain Country Tax) | | | 406,238 | | |
Foreign Currency Translations | | | (25 | ) | |
Net Assets | | $ | 1,401,770 | | |
The accompanying notes are an integral part of the financial statements.
10
Morgan Stanley Institutional Fund, Inc.
Annual Report — December 31, 2017
Emerging Markets Portfolio
Statement of Assets and Liabilities (cont'd) | | December 31, 2017
(000) | |
CLASS I: | |
Net Assets | | $ | 342,400 | | |
| Shares Outstanding $0.001 par value shares of beneficial interest (unlimited shares authorized) (not in 000's) | | | 12,248,815 | | |
Net Asset Value, Offering and Redemption Price Per Share | | $ | 27.95 | | |
CLASS A: | |
Net Assets | | $ | 23,952 | | |
| Shares Outstanding $0.001 par value shares of beneficial interest (unlimited shares authorized) (not in 000's) | | | 879,182 | | |
Net Asset Value, Redemption Price Per Share | | $ | 27.24 | | |
Maximum Sales Load | | | 5.25 | % | |
Maximum Sales Charge | | $ | 1.51 | | |
Maximum Offering Price Per Share | | $ | 28.75 | | |
CLASS L: | |
Net Assets | | $ | 253 | | |
| Shares Outstanding $0.001 par value shares of beneficial interest (unlimited shares authorized) (not in 000's) | | | 9,432 | | |
Net Asset Value, Offering and Redemption Price Per Share | | $ | 26.85 | | |
CLASS C: | |
Net Assets | | $ | 817 | | |
| Shares Outstanding $0.001 par value shares of beneficial interest (unlimited shares authorized) (not in 000's) | | | 30,645 | | |
Net Asset Value, Offering and Redemption Price Per Share | | $ | 26.66 | | |
CLASS IS: | |
Net Assets | | $ | 1,034,348 | | |
| Shares Outstanding $0.001 par value shares of beneficial interest (unlimited shares authorized) (not in 000's) | | | 36,999,399 | | |
Net Asset Value, Offering and Redemption Price Per Share | | $ | 27.96 | | |
(1) Including:
Securities on Loan, at Value: | | $ | 15,767 | | |
@ Amount is less than $500.
The accompanying notes are an integral part of the financial statements.
11
Morgan Stanley Institutional Fund, Inc.
Annual Report — December 31, 2017
Emerging Markets Portfolio
Statement of Operations | | Year Ended
December 31, 2017
(000) | |
Investment Income: | |
Dividends from Securities of Unaffiliated Issuers (Net of $2,463 of Foreign Taxes Withheld) | | $ | 20,903 | | |
Dividends from Security of Affiliated Issuer (Note G) | | | 233 | | |
Income from Securities Loaned — Net | | | 48 | | |
Total Investment Income | | | 21,184 | | |
Expenses: | |
Advisory Fees (Note B) | | | 9,388 | | |
Custodian Fees (Note F) | | | 988 | | |
Administration Fees (Note C) | | | 959 | | |
Sub Transfer Agency Fees — Class I | | | 283 | | |
Sub Transfer Agency Fees — Class A | | | 31 | | |
Sub Transfer Agency Fees — Class L | | | — | @ | |
Sub Transfer Agency Fees — Class C | | | — | @ | |
Professional Fees | | | 164 | | |
Registration Fees | | | 80 | | |
Shareholder Services Fees — Class A (Note D) | | | 54 | | |
Distribution and Shareholder Services Fees — Class L (Note D) | | | 2 | | |
Distribution and Shareholder Services Fees — Class C (Note D) | | | 7 | | |
Shareholder Reporting Fees | | | 58 | | |
Directors' Fees and Expenses | | | 31 | | |
Transfer Agency Fees — Class I (Note E) | | | 13 | | |
Transfer Agency Fees — Class A (Note E) | | | 6 | | |
Transfer Agency Fees — Class L (Note E) | | | 2 | | |
Transfer Agency Fees — Class C (Note E) | | | 2 | | |
Transfer Agency Fees — Class IS (Note E) | | | 2 | | |
Pricing Fees | | | 13 | | |
Other Expenses | | | 82 | | |
Total Expenses | | | 12,165 | | |
Waiver of Advisory Fees (Note B) | | | (377 | ) | |
Rebate from Morgan Stanley Affiliate (Note G) | | | (50 | ) | |
Reimbursement of Class Specific Expenses — Class L (Note B) | | | (2 | ) | |
Reimbursement of Class Specific Expenses — Class C (Note B) | | | (1 | ) | |
Reimbursement of Class Specific Expenses — Class IS (Note B) | | | (2 | ) | |
Net Expenses | | | 11,733 | | |
Net Investment Income | | | 9,451 | | |
Realized Gain (Loss): | |
Investments Sold (Net of $874 of Capital Gain Country Tax) | | | 42,513 | | |
Foreign Currency Forward Exchange Contracts | | | 146 | | |
Foreign Currency Transactions | | | (414 | ) | |
Net Realized Gain | | | 42,245 | | |
Change in Unrealized Appreciation (Depreciation): | |
Investments (Net of Increase in Deferred Capital Gain Country Tax of $711) | | | 294,321 | | |
Foreign Currency Forward Exchange Contracts | | | (264 | ) | |
Foreign Currency Translations | | | (— | @) | |
Net Change in Unrealized Appreciation (Depreciation) | | | 294,057 | | |
Net Realized Gain and Change in Unrealized Appreciation (Depreciation) | | | 336,302 | | |
Net Increase in Net Assets Resulting from Operations | | $ | 345,753 | | |
@ Amount is less than $500.
The accompanying notes are an integral part of the financial statements.
12
Morgan Stanley Institutional Fund, Inc.
Annual Report — December 31, 2017
Emerging Markets Portfolio
Statements of Changes in Net Assets | | Year Ended
December 31, 2017
(000) | | Year Ended
December 31, 2016
(000) | |
Increase (Decrease) in Net Assets: | |
Operations: | |
Net Investment Income | | $ | 9,451 | | | $ | 8,448 | | |
Net Realized Gain (Loss) | | | 42,245 | | | | (25,501 | ) | |
Net Change in Unrealized Appreciation (Depreciation) | | | 294,057 | | | | 72,717 | | |
Net Increase in Net Assets Resulting from Operations | | | 345,753 | | | | 55,664 | | |
Distributions from and/or in Excess of: | |
Class I: | |
Net Investment Income | | | (2,064 | ) | | | (2,318 | ) | |
Class A: | |
Net Investment Income | | | (80 | ) | | | (93 | ) | |
Class L: | |
Net Investment Income | | | (— | @) | | | — | | |
Class C: | |
Net Investment Income | | | (1 | ) | | | (— | @) | |
Class IS: | |
Net Investment Income | | | (6,989 | ) | | | (5,700 | ) | |
Total Distributions | | | (9,134 | ) | | | (8,111 | ) | |
Capital Share Transactions:(1) | |
Class I: | |
Subscribed | | | 48,189 | | | | 76,859 | | |
Distributions Reinvested | | | 2,027 | | | | 2,281 | | |
Redeemed | | | (82,161 | ) | | | (323,673 | ) | |
Class A: | |
Subscribed | | | 6,843 | | | | 5,925 | | |
Distributions Reinvested | | | 77 | | | | 90 | | |
Redeemed | | | (7,956 | ) | | | (7,085 | ) | |
Class L: | |
Exchanged | | | 7 | | | | — | | |
Distributions Reinvested | | | — | @ | | | — | | |
Redeemed | | | (68 | ) | | | — | | |
Class C: | |
Subscribed | | | 56 | | | | 562 | | |
Distributions Reinvested | | | 1 | | | | — | @ | |
Redeemed | | | (50 | ) | | | — | | |
Class IS: | |
Subscribed | | | 172,808 | | | | 348,817 | | |
Distributions Reinvested | | | 6,744 | | | | 5,700 | | |
Redeemed | | | (40,828 | ) | | | (45,556 | ) | |
Net Increase in Net Assets Resulting from Capital Share Transactions | | | 105,689 | | | | 63,920 | | |
Redemption Fees | | | 11 | | | | 14 | | |
Total Increase in Net Assets | | | 442,319 | | | | 111,487 | | |
Net Assets: | |
Beginning of Period | | | 959,451 | | | | 847,964 | | |
End of Period (Including Distributions in Excess of Net Investment Income and
Accumulated Undistributed Net Investment Income of $(17) and $810, respectively) | | $ | 1,401,770 | | | $ | 959,451 | | |
The accompanying notes are an integral part of the financial statements.
13
Morgan Stanley Institutional Fund, Inc.
Annual Report — December 31, 2017
Emerging Markets Portfolio
Statements of Changes in Net Assets (cont'd) | | Year Ended
December 31, 2017
(000) | | Year Ended
December 31, 2016
(000) | |
(1) Capital Share Transactions: | |
Class I: | |
Shares Subscribed | | | 1,924 | | | | 3,587 | | |
Shares Issued on Distributions Reinvested | | | 75 | | | | 111 | | |
Shares Redeemed | | | (3,319 | ) | | | (17,121 | ) | |
Net Decrease in Class I Shares Outstanding | | | (1,320 | ) | | | (13,423 | ) | |
Class A: | |
Shares Subscribed | | | 277 | | | | 294 | | |
Shares Issued on Distributions Reinvested | | | 3 | | | | 5 | | |
Shares Redeemed | | | (328 | ) | | | (366 | ) | |
Net Decrease in Class A Shares Outstanding | | | (48 | ) | | | (67 | ) | |
Class L: | |
Shares Exchanged | | | — | @@ | | | — | | |
Shares Issued on Distributions Reinvested | | | — | @@ | | | — | | |
Shares Redeemed | | | (2 | ) | | | — | | |
Net Increase (Decrease) in Class L Shares Outstanding | | | (2 | ) | | | — | | |
Class C: | |
Shares Subscribed | | | 2 | | | | 30 | | |
Shares Issued on Distributions Reinvested | | | — | @@ | | | — | @@ | |
Shares Redeemed | | | (2 | ) | | | — | | |
Net Increase in Class C Shares Outstanding | | | —- | @@ | | | 30 | | |
Class IS: | |
Shares Subscribed | | | 6,862 | | | | 18,363 | | |
Shares Issued on Distributions Reinvested | | | 249 | | | | 278 | | |
Shares Redeemed | | | (1,653 | ) | | | (2,215 | ) | |
Net Increase in Class IS Shares Outstanding | | | 5,458 | | | | 16,426 | | |
@ Amount is less than $500.
@@ Amount is less than 500 shares.
The accompanying notes are an integral part of the financial statements.
14
Morgan Stanley Institutional Fund, Inc.
Annual Report — December 31, 2017
Financial Highlights
Emerging Markets Portfolio
| | | Class I | |
| | | Year Ended December 31, | |
Selected Per Share Data and Ratios | | 2017 | | 2016(1) | | 2015 | | 2014 | | 2013 | |
Net Asset Value, Beginning of Period | | $ | 20.83 | | | $ | 19.68 | | | $ | 22.13 | | | $ | 24.64 | | | $ | 25.94 | | |
Income (Loss) from Investment Operations: | |
Net Investment Income(2) | | | 0.19 | | | | 0.17 | | | | 0.15 | | | | 0.17 | | | | 0.20 | | |
Net Realized and Unrealized Gain (Loss) | | | 7.10 | | | | 1.15 | | | | (2.43 | ) | | | (1.30 | ) | | | (0.44 | ) | |
Total from Investment Operations | | | 7.29 | | | | 1.32 | | | | (2.28 | ) | | | (1.13 | ) | | | (0.24 | ) | |
Distributions from and/or in Excess of: | |
Net Investment Income | | | (0.17 | ) | | | (0.17 | ) | | | (0.17 | ) | | | (0.20 | ) | | | (0.20 | ) | |
Net Realized Gain | | | — | | | | — | | | | — | | | | (1.18 | ) | | | (0.86 | ) | |
Total Distributions | | | (0.17 | ) | | | (0.17 | ) | | | (0.17 | ) | | | (1.38 | ) | | | (1.06 | ) | |
Redemption Fees | | | 0.00 | (3) | | | 0.00 | (3) | | | 0.00 | (3) | | | 0.00 | (3) | | | 0.00 | (3) | |
Net Asset Value, End of Period | | $ | 27.95 | | | $ | 20.83 | | | $ | 19.68 | | | $ | 22.13 | | | $ | 24.64 | | |
Total Return(4) | | | 34.97 | % | | | 6.73 | % | | | (10.33 | )% | | | (4.47 | )% | | | (0.80 | )% | |
Ratios and Supplemental Data: | |
Net Assets, End of Period (Thousands) | | $ | 342,400 | | | $ | 282,674 | | | $ | 531,194 | | | $ | 644,537 | | | $ | 1,128,618 | | |
Ratio of Expenses to Average Net Assets(9) | | | 1.04 | %(5) | | | 1.11 | %(5)(7) | | | 1.24 | %(5)(6) | | | 1.25 | %(5) | | | 1.24 | %(5) | |
Ratio of Expenses to Average Net Assets Excluding Non Operating Expenses | | | N/A | | | | N/A | | | | N/A | | | | N/A | | | | 1.24 | %(5) | |
Ratio of Net Investment Income to Average Net Assets(9) | | | 0.75 | %(5) | | | 0.83 | %(5) | | | 0.68 | %(5) | | | 0.68 | %(5) | | | 0.79 | %(5) | |
Ratio of Rebate from Morgan Stanley Affiliates to Average Net Assets | | | 0.00 | %(8) | | | 0.00 | %(8) | | | 0.00 | %(8) | | | 0.00 | %(8) | | | 0.01 | % | |
Portfolio Turnover Rate | | | 35 | % | | | 33 | % | | | 40 | % | | | 43 | % | | | 49 | % | |
(9) Supplemental Information on the Ratios to Average Net Assets: | |
Ratios Before Expense Limitation: | |
Expenses to Average Net Assets | | | 1.07 | % | | | 1.16 | % | | | 1.45 | % | | | 1.52 | % | | | 1.51 | % | |
Net Investment Income to Average Net Assets | | | 0.72 | % | | | 0.78 | % | | | 0.47 | % | | | 0.41 | % | | | 0.52 | % | |
(1) Reflects prior period custodian out-of-pocket expenses that were reimbursed in September 2016. The amount of the reimbursement was immaterial on a per share basis and did not impact the total return of Class I shares. The Ratio of Expenses to Average Net Assets and the Ratio of Net Investment Income to Average Net Assets would be unchanged as the reimbursement of custodian fees was offset against expense waivers/reimbursements with no impact to net expenses or net investment income.
(2) Per share amount is based on average shares outstanding.
(3) Amount is less than $0.005 per share.
(4) Calculated based on the net asset value as of the last business day of the period.
(5) The Ratios of Expenses and Net Investment Income reflect the rebate of certain Fund expenses in connection with the investments in Morgan Stanley affiliates during the period. The effect of the rebate on the ratios is disclosed in the above table as "Ratio of Rebate from Morgan Stanley Affiliates to Average Net Assets."
(6) Effective September 30, 2015, the Adviser has agreed to limit the ratio of expenses to average net assets to the maximum ratio of 1.20% for Class I shares. Prior to September 30, 2015, the maximum ratio was 1.25% for Class I shares.
(7) Effective September 30, 2016, the Adviser has agreed to limit the ratio of expenses to average net assets to the maximum ratio of 1.05% for Class I shares. Prior to September 30, 2016, the maximum ratio was 1.20% for Class I shares.
(8) Amount is less than 0.005%.
The accompanying notes are an integral part of the financial statements.
15
Morgan Stanley Institutional Fund, Inc.
Annual Report — December 31, 2017
Financial Highlights
Emerging Markets Portfolio
| | | Class A | |
| | | Year Ended December 31, | |
Selected Per Share Data and Ratios | | 2017 | | 2016(1) | | 2015 | | 2014 | | 2013 | |
Net Asset Value, Beginning of Period | | $ | 20.31 | | | $ | 19.19 | | | $ | 21.57 | | | $ | 24.02 | | | $ | 25.31 | | |
Income (Loss) from Investment Operations: | |
Net Investment Income(2) | | | 0.10 | | | | 0.11 | | | | 0.07 | | | | 0.11 | | | | 0.12 | | |
Net Realized and Unrealized Gain (Loss) | | | 6.92 | | | | 1.11 | | | | (2.36 | ) | | | (1.28 | ) | | | (0.42 | ) | |
Total from Investment Operations | | | 7.02 | | | | 1.22 | | | | (2.29 | ) | | | (1.17 | ) | | | (0.30 | ) | |
Distributions from and/or in Excess of: | |
Net Investment Income | | | (0.09 | ) | | | (0.10 | ) | | | (0.09 | ) | | | (0.10 | ) | | | (0.13 | ) | |
Net Realized Gain | | | — | | | | — | | | | — | | | | (1.18 | ) | | | (0.86 | ) | |
Total Distributions | | | (0.09 | ) | | | (0.10 | ) | | | (0.09 | ) | | | (1.28 | ) | | | (0.99 | ) | |
Redemption Fees | | | 0.00 | (3) | | | 0.00 | (3) | | | 0.00 | (3) | | | 0.00 | (3) | | | 0.00 | (3) | |
Net Asset Value, End of Period | | $ | 27.24 | | | $ | 20.31 | | | $ | 19.19 | | | $ | 21.57 | | | $ | 24.02 | | |
Total Return(4) | | | 34.54 | % | | | 6.37 | % | | | (10.63 | )% | | | (4.77 | )% | | | (1.07 | )% | |
Ratios and Supplemental Data: | |
Net Assets, End of Period (Thousands) | | $ | 23,952 | | | $ | 18,824 | | | $ | 19,065 | | | $ | 26,701 | | | $ | 35,863 | | |
Ratio of Expenses to Average Net Assets(10) | | | 1.36 | %(5) | | | 1.45 | %(5)(8) | | | 1.56 | %(5)(7) | | | 1.57 | %(5) | | | 1.52 | %(5)(6) | |
Ratio of Expenses to Average Net Assets Excluding Non Operating Expenses | | | N/A | | | | N/A | | | | N/A | | | | N/A | | | | 1.52 | %(5)(6) | |
Ratio of Net Investment Income to Average Net Assets(10) | | | 0.42 | %(5) | | | 0.55 | %(5) | | | 0.34 | %(5) | | | 0.45 | %(5) | | | 0.49 | %(5) | |
Ratio of Rebate from Morgan Stanley Affiliates to Average Net Assets | | | 0.00 | %(9) | | | 0.00 | %(9) | | | 0.00 | %(9) | | | 0.00 | %(9) | | | 0.01 | % | |
Portfolio Turnover Rate | | | 35 | % | | | 33 | % | | | 40 | % | | | 43 | % | | | 49 | % | |
(10) Supplemental Information on the Ratios to Average Net Assets: | |
Ratios Before Expense Limitation: | |
Expenses to Average Net Assets | | | 1.40 | % | | | 1.48 | % | | | 1.76 | % | | | 1.82 | % | | | 1.78 | % | |
Net Investment Income to Average Net Assets | | | 0.38 | % | | | 0.52 | % | | | 0.14 | % | | | 0.20 | % | | | 0.23 | % | |
(1) Reflects prior period custodian out-of-pocket expenses that were reimbursed in September 2016. The amount of the reimbursement was immaterial on a per share basis and did not impact the total return of Class A shares. The Ratio of Expenses to Average Net Assets and the Ratio of Net Investment Income to Average Net Assets would be unchanged as the reimbursement of custodian fees was offset against expense waivers/reimbursements with no impact to net expenses or net investment income.
(2) Per share amount is based on average shares outstanding.
(3) Amount is less than $0.005 per share.
(4) Calculated based on the net asset value which does not reflect sales charges, if applicable, as of the last business day of the period.
(5) The Ratios of Expenses and Net Investment Income reflect the rebate of certain Fund expenses in connection with the investments in Morgan Stanley affiliates during the period. The effect of the rebate on the ratios is disclosed in the above table as "Ratio of Rebate from Morgan Stanley Affiliates to Average Net Assets."
(6) Effective September 16, 2013, the Adviser has agreed to limit the ratio of expenses to average net assets to the maximum ratio of 1.60% for Class A shares. Prior to September 16, 2013, the maximum ratio was 1.50% for Class A shares.
(7) Effective September 30, 2015, the Adviser has agreed to limit the ratio of expenses to average net assets to the maximum ratio of 1.55% for Class A shares. Prior to September 30, 2015, the maximum ratio was 1.60% for Class A shares.
(8) Effective September 30, 2016, the Adviser has agreed to limit the ratio of expenses to average net assets to the maximum ratio of 1.40% for Class A shares. Prior to September 30, 2016, the maximum ratio was 1.55% for Class A shares.
(9) Amount is less than 0.005%.
The accompanying notes are an integral part of the financial statements.
16
Morgan Stanley Institutional Fund, Inc.
Annual Report — December 31, 2017
Financial Highlights
Emerging Markets Portfolio
| | | Class L | |
| | | Year Ended December 31, | |
Selected Per Share Data and Ratios | | 2017 | | 2016(1) | | 2015 | | 2014 | | 2013 | |
Net Asset Value, Beginning of Period | | $ | 20.08 | | | $ | 18.98 | | | $ | 21.39 | | | $ | 23.91 | | | $ | 25.27 | | |
Income (Loss) from Investment Operations: | |
Net Investment Income (Loss)(2) | | | (0.01 | ) | | | 0.00 | (3) | | | (0.04 | ) | | | (0.05 | ) | | | (0.05 | ) | |
Net Realized and Unrealized Gain (Loss) | | | 6.80 | | | | 1.10 | | | | (2.33 | ) | | | (1.23 | ) | | | (0.37 | ) | |
Total from Investment Operations | | | 6.79 | | | | 1.10 | | | | (2.37 | ) | | | (1.28 | ) | | | (0.42 | ) | |
Distributions from and/or in Excess of: | |
Net Investment Income | | | (0.02 | ) | | | — | | | | (0.04 | ) | | | (0.06 | ) | | | (0.08 | ) | |
Net Realized Gain | | | — | | | | — | | | | — | | | | (1.18 | ) | | | (0.86 | ) | |
Total Distributions | | | (0.02 | ) | | | — | | | | (0.04 | ) | | | (1.24 | ) | | | (0.94 | ) | |
Redemption Fees | | | 0.00 | (3) | | | 0.00 | (3) | | | 0.00 | (3) | | | 0.00 | (3) | | | 0.00 | (3) | |
Net Asset Value, End of Period | | $ | 26.85 | | | $ | 20.08 | | | $ | 18.98 | | | $ | 21.39 | | | $ | 23.91 | | |
Total Return(4) | | | 33.80 | % | | | 5.80 | % | | | (11.11 | )% | | | (5.26 | )% | | | (1.56 | )% | |
Ratios and Supplemental Data: | |
Net Assets, End of Period (Thousands) | | $ | 253 | | | $ | 239 | | | $ | 226 | | | $ | 210 | | | $ | 203 | | |
Ratio of Expenses to Average Net Assets(10) | | | 1.90 | %(5) | | | 2.01 | %(5)(8) | | | 2.09 | %(5)(7) | | | 2.10 | %(5) | | | 2.03 | %(5)(6) | |
Ratio of Expenses to Average Net Assets Excluding Non Operating Expenses | | | N/A | | | | N/A | | | | N/A | | | | N/A | | | | 2.03 | %(5)(6) | |
Ratio of Net Investment Income (Loss) to Average Net Assets(10) | | | (0.03 | )%(5) | | | 0.00 | %(5)(9) | | | (0.19 | )%(5) | | | (0.21 | )%(5) | | | (0.18 | )%(5) | |
Ratio of Rebate from Morgan Stanley Affiliates to Average Net Assets | | | 0.00 | %(9) | | | 0.00 | %(9) | | | 0.00 | %(9) | | | 0.00 | %(9) | | | 0.01 | % | |
Portfolio Turnover Rate | | | 35 | % | | | 33 | % | | | 40 | % | | | 43 | % | | | 49 | % | |
(10) Supplemental Information on the Ratios to Average Net Assets: | |
Ratios Before Expense Limitation: | |
Expenses to Average Net Assets | | | 2.54 | % | | | 2.69 | % | | | 2.78 | % | | | 2.97 | % | | | 2.54 | % | |
Net Investment Loss to Average Net Assets | | | (0.67 | )% | | | (0.68 | )% | | | (0.88 | )% | | | (1.08 | )% | | | (0.69 | )% | |
(1) Reflects prior period custodian out-of-pocket expenses that were reimbursed in September 2016. The amount of the reimbursement was immaterial on a per share basis and did not impact the total return of Class L shares. The Ratio of Expenses to Average Net Assets and the Ratio of Net Investment Income to Average Net Assets would be unchanged as the reimbursement of custodian fees was offset against expense waivers/reimbursements with no impact to net expenses or net investment income.
(2) Per share amount is based on average shares outstanding.
(3) Amount is less than $0.005 per share.
(4) Calculated based on the net asset value as of the last business day of the period.
(5) The Ratios of Expenses and Net Investment Income reflect the rebate of certain Fund expenses in connection with the investments in Morgan Stanley affiliates during the period. The effect of the rebate on the ratios is disclosed in the above table as "Ratio of Rebate from Morgan Stanley Affiliates to Average Net Assets."
(6) Effective September 16, 2013, the Adviser has agreed to limit the ratio of expenses to average net assets to the maximum ratio of 2.10% for Class L shares. Prior to September 16, 2013, the maximum ratio was 2.00% for Class L shares.
(7) Effective September 30, 2015, the Adviser has agreed to limit the ratio of expenses to average net assets to the maximum ratio of 2.05% for Class L shares. Prior to September 30, 2015, the maximum ratio was 2.10% for Class L shares.
(8) Effective September 30, 2016, the Adviser has agreed to limit the ratio of expenses to average net assets to the maximum ratio of 1.90% for Class L shares. Prior to September 30, 2016, the maximum ratio was 2.05% for Class L shares.
(9) Amount is less than 0.005%.
The accompanying notes are an integral part of the financial statements.
17
Morgan Stanley Institutional Fund, Inc.
Annual Report — December 31, 2017
Financial Highlights
Emerging Markets Portfolio
| | | Class C | |
| | | Year Ended December 31, | | Period from
April 30, 2015(2) to | |
Selected Per Share Data and Ratios | | 2017 | | 2016(1) | | December 31, 2015 | |
Net Asset Value, Beginning of Period | | $ | 19.99 | | | $ | 18.95 | | | $ | 23.16 | | |
Income (Loss) from Investment Operations: | |
Net Investment Loss(3) | | | (0.09 | ) | | | (0.04 | ) | | | (0.03 | ) | |
Net Realized and Unrealized Gain (Loss) | | | 6.78 | | | | 1.09 | | | | (4.14 | ) | |
Total from Investment Operations | | | 6.69 | | | | 1.05 | | | | (4.17 | ) | |
Distributions from and/or in Excess of: | |
Net Investment Income | | | (0.02 | ) | | | (0.01 | ) | | | (0.04 | ) | |
Redemption Fees | | | 0.00 | (4) | | | 0.00 | (4) | | | 0.00 | (4) | |
Net Asset Value, End of Period | | $ | 26.66 | | | $ | 19.99 | | | $ | 18.95 | | |
Total Return(5) | | | 33.45 | % | | | 5.56 | % | | | (18.03 | )%(10) | |
Ratios and Supplemental Data: | |
Net Assets, End of Period (Thousands) | | $ | 817 | | | $ | 608 | | | $ | 10 | | |
Ratio of Expenses to Average Net Assets(12) | | | 2.15 | %(6) | | | 2.24 | %(6)(8) | | | 2.33 | %(6)(7)(11) | |
Ratio of Net Investment Loss to Average Net Assets(12) | | | (0.36 | )%(6) | | | (0.19 | )%(6) | | | (0.23 | )%(6)(11) | |
Ratio of Rebate from Morgan Stanley Affiliates to Average Net Assets | | | 0.00 | %(9) | | | 0.00 | %(9) | | | 0.00 | %(9)(11) | |
Portfolio Turnover Rate | | | 35 | % | | | 33 | % | | | 40 | % | |
(12) Supplemental Information on the Ratios to Average Net Assets: | |
Ratios Before Expense Limitation: | |
Expense to Average Net Assets | | | 2.30 | % | | | 2.58 | % | | | 22.89 | %(11) | |
Net Investment Loss to Average Net Assets | | | (0.51 | )% | | | (0.53 | )% | | | (20.79 | )%(11) | |
(1) Reflects prior period custodian out-of-pocket expenses that were reimbursed in September 2016. The amount of the reimbursement was immaterial on a per share basis and did not impact the total return of Class C shares. The Ratio of Expenses to Average Net Assets and the Ratio of Net Investment Loss to Average Net Assets would be unchanged as the reimbursement of custodian fees was offset against expense waivers/reimbursements with no impact to net expenses or net investment loss.
(2) Commencement of Offering.
(3) Per share amount is based on average shares outstanding.
(4) Amount is less than $0.005 per share.
(5) Calculated based on the net asset value which does not reflect sales charges, if applicable, as of the last business day of the period.
(6) The Ratios of Expenses and Net Investment Loss reflect the rebate of certain Fund expenses in connection with the investments in Morgan Stanley affiliates during the period. The effect of the rebate on the ratios is disclosed in the above table as "Ratio of Rebate from Morgan Stanley Affiliates to Average Net Assets."
(7) Effective September 30, 2015, the Adviser has agreed to limit the ratio of expenses to average net assets to the maximum ratio of 2.30% for Class C shares. Prior to September 30, 2015, the maximum ratio was 2.35% for Class C shares.
(8) Effective September 30, 2016, the Adviser has agreed to limit the ratio of expenses to average net assets to the maximum ratio of 2.15% for Class C shares. Prior to September 30, 2016, the maximum ratio was 2.30% for Class C shares.
(9) Amount is less than 0.005%.
(10) Not annualized.
(11) Annualized.
The accompanying notes are an integral part of the financial statements.
18
Morgan Stanley Institutional Fund, Inc.
Annual Report — December 31, 2017
Financial Highlights
Emerging Markets Portfolio
| | | Class IS | |
| | | Year Ended December 31, | | Period from
September 13, 2013(2) to | |
Selected Per Share Data and Ratios | | 2017 | | 2016(1) | | 2015 | | 2014 | | December 31, 2013 | |
Net Asset Value, Beginning of Period | | $ | 20.83 | | | $ | 19.68 | | | $ | 22.14 | | | $ | 24.64 | | | $ | 24.92 | | |
Income (Loss) from Investment Operations: | |
Net Investment Income (Loss)(3) | | | 0.21 | | | | 0.21 | | | | 0.17 | | | | 0.22 | | | | (0.01 | ) | |
Net Realized and Unrealized Gain (Loss) | | | 7.11 | | | | 1.12 | | | | (2.44 | ) | | | (1.32 | ) | | | 0.46 | | |
Total from Investment Operations | | | 7.32 | | | | 1.33 | | | | (2.27 | ) | | | (1.10 | ) | | | 0.45 | | |
Distributions from and/or in Excess of: | |
Net Investment Income | | | (0.19 | ) | | | (0.18 | ) | | | (0.19 | ) | | | (0.22 | ) | | | (0.14 | ) | |
Net Realized Gain | | | — | | | | — | | | | — | | | | (1.18 | ) | | | (0.59 | ) | |
Total Distributions | | | (0.19 | ) | | | (0.18 | ) | | | (0.19 | ) | | | (1.40 | ) | | | (0.73 | ) | |
Redemption Fees | | | 0.00 | (4) | | | 0.00 | (4) | | | 0.00 | (4) | | | 0.00 | (4) | | | 0.00 | (4) | |
Net Asset Value, End of Period | | $ | 27.96 | | | $ | 20.83 | | | $ | 19.68 | | | $ | 22.14 | | | $ | 24.64 | | |
Total Return(5) | | | 35.09 | % | | | 6.79 | % | | | (10.29 | )% | | | (4.36 | )% | | | 1.85 | %(11) | |
Ratios and Supplemental Data: | |
Net Assets, End of Period (Thousands) | | $ | 1,034,348 | | | $ | 657,106 | | | $ | 297,469 | | | $ | 325,029 | | | $ | 10 | | |
Ratio of Expenses to Average Net Assets(13) | | | 0.95 | %(6) | | | 1.04 | %(6)(9) | | | 1.16 | %(6)(8) | | | 1.18 | %(6) | | | 1.17 | %(6)(7)(12) | |
Ratio of Expenses to Average Net Assets Excluding Non Operating Expenses | | | N/A | | | | N/A | | | | N/A | | | | N/A | | | | 1.17 | %(6)(7)(12) | |
Ratio of Net Investment Income (Loss) to Average Net Assets(13) | | | 0.82 | %(6) | | | 0.99 | %(6) | | | 0.75 | %(6) | | | 0.89 | %(6) | | | (0.21 | )%(6)(12) | |
Ratio of Rebate from Morgan Stanley Affiliates to Average Net Assets | | | 0.00 | %(10) | | | 0.00 | %(10) | | | 0.00 | %(10) | | | 0.00 | %(10) | | | 0.01 | %(12) | |
Portfolio Turnover Rate | | | 35 | % | | | 33 | % | | | 40 | % | | | 43 | % | | | 49 | % | |
(13) Supplemental Information on the Ratios to Average Net Assets: | |
Ratios Before Expense Limitation: | |
Expenses to Average Net Assets | | | 0.98 | % | | | 1.07 | % | | | 1.35 | % | | | 1.42 | % | | | 6.65 | %(12) | |
Net Investment Income (Loss) to Average Net Assets | | | 0.79 | % | | | 0.96 | % | | | 0.56 | % | | | 0.65 | % | | | (5.69 | )%(12) | |
(1) Reflects prior period custodian out-of-pocket expenses that were reimbursed in September 2016. The amount of the reimbursement was immaterial on a per share basis and did not impact the total return of Class IS shares. The Ratio of Expenses to Average Net Assets and the Ratio of Net Investment Income to Average Net Assets would be unchanged as the reimbursement of custodian fees was offset against expense waivers/reimbursements with no impact to net expenses or net investment income.
(2) Commencement of Offering.
(3) Per share amount is based on average shares outstanding.
(4) Amount is less than $0.005 per share.
(5) Calculated based on the net asset value as of the last business day of the period.
(6) The Ratios of Expenses and Net Investment Income (Loss) reflect the rebate of certain Fund expenses in connection with the investments in Morgan Stanley affiliates during the period. The effect of the rebate on the ratios is disclosed in the above table as "Ratio of Rebate from Morgan Stanley Affiliates to Average Net Assets."
(7) Effective September 16, 2013, the Adviser has agreed to limit the ratio of expenses to average net assets to the maximum ratio of 1.18% for Class IS shares.
(8) Effective September 30, 2015, the Adviser has agreed to limit the ratio of expenses to average net assets to the maximum ratio of 1.10% for Class IS shares. Prior to September 30, 2015, the maximum ratio was 1.18% for Class IS shares.
(9) Effective September 30, 2016, the Adviser has agreed to limit the ratio of expenses to average net assets to the maximum ratio of 0.95% for Class IS shares. Prior to September 30, 2016, the maximum ratio was 1.10% for Class IS shares.
(10) Amount is less than 0.005%.
(11) Not annualized.
(12) Annualized.
The accompanying notes are an integral part of the financial statements.
19
Morgan Stanley Institutional Fund, Inc.
Annual Report — December 31, 2017
Notes to Financial Statements
Morgan Stanley Institutional Fund, Inc. (the "Company") is registered under the Investment Company Act of 1940, as amended (the "Act"), as an open-end management investment company. The Company is comprised of twenty-nine separate, active, diversified and non-diversified funds (individually referred to as a "Fund", collectively as the "Funds"). The Company applies investment company accounting and reporting guidance.
The accompanying financial statements relate to the Emerging Markets Portfolio. The Fund seeks long-term capital appreciation by investing primarily in growth-oriented equity securities of issuers in emerging market countries.
The Fund offers five classes of shares — Class I, Class A, Class L, Class C and Class IS. On April 30, 2015, the Fund suspended offering of Class L shares. Existing Class L shareholders may invest through reinvestment of dividends and distributions.
A. Significant Accounting Policies: The following significant accounting policies are in conformity with U.S. generally accepted accounting principles ("GAAP"). Such policies are consistently followed by the Company in the preparation of its financial statements. GAAP may require management to make estimates and assumptions that affect the reported amounts and disclosures in the financial statements. Actual results may differ from those estimates.
1. Security Valuation: (1) An equity portfolio security listed or traded on an exchange is valued at its latest reported sales price (or at the exchange official closing price if such exchange reports an official closing price), and if there were no sales on a given day and if there is no official exchange closing price for that day, the security is valued at the mean between the last reported bid and asked prices if such bid and asked prices are available on the relevant exchanges. Listed equity securities not traded on the valuation date with no reported bid and asked prices available on the exchange are valued at the mean between the current bid and asked prices obtained from one or more reputable brokers or dealers. In cases where a security is traded on more than one exchange, the security is valued on the exchange designated as the primary market; (2) all other equity portfolio securities for which over-the-counter ("OTC") market quotations are readily available are valued at the latest reported sales price (or at the market official closing price if such market reports an official closing price), and if there was no trading in the
security on a given day and if there is no official closing price from relevant markets for that day, the security is valued at the mean between the last reported bid and asked prices if such bid and asked prices are available on the relevant markets. An unlisted equity security that does not trade on the valuation date and for which bid and asked prices from the relevant markets are unavailable is valued at the mean between the current bid and asked prices obtained from one or more reputable brokers or dealers; (3) certain portfolio securities may be valued by an outside pricing service/vendor approved by the Company's Board of Directors (the "Directors"). The pricing service/vendor may employ a pricing model that takes into account, among other things, bids, yield spreads, and/or other market data and specific security characteristics. Alternatively, if a valuation is not available from an outside pricing service/vendor, and the security trades on an exchange, the security may be valued at its latest reported sale price (or at the exchange official closing price if such exchange reports an official closing price), prior to the time when assets are valued. If there are no sales on a given day and if there is no official exchange closing price for that day, the security is valued at the mean between the last reported bid and asked prices if such bid and asked prices are available in the relevant exchanges; (4) when market quotations are not readily available, including circumstances under which Morgan Stanley Investment Management Inc. (the "Adviser") or Morgan Stanley Investment Management Company ("MSIM Company") (the "Sub-Adviser"), a wholly-owned subsidiary of Morgan Stanley, determines that the closing price, last sale price or the mean between the last reported bid and asked prices are not reflective of a security's market value, portfolio securities are valued at their fair value as determined in good faith under procedures established by and under the general supervision of the Directors. Occasionally, developments affecting the closing prices of securities and other assets may occur between the times at which valuations of such securities are determined (that is, close of the foreign market on which the securities trade) and the close of business of the New York Stock Exchange ("NYSE"). If developments occur during such periods that are expected to materially affect the value of such securities, such valuations may be adjusted to reflect the estimated fair value of such securities as of the close of the NYSE, as determined in good faith by the Directors or by the Adviser using a pricing service and/or procedures
20
Morgan Stanley Institutional Fund, Inc.
Annual Report — December 31, 2017
Notes to Financial Statements (cont'd)
approved by the Directors; (5) quotations of foreign portfolio securities, other assets and liabilities and forward contracts stated in foreign currency are translated into U.S. dollar equivalents at the prevailing market rates prior to the close of the NYSE; and (6) investments in mutual funds, including the Morgan Stanley Institutional Liquidity Funds, are valued at the net asset value ("NAV") as of the close of each business day.
The Directors have responsibility for determining in good faith the fair value of the investments, and the Directors may appoint others, such as the Company's Adviser or a valuation committee, to assist the Directors in determining fair value and to make the actual calculations pursuant to the fair valuation methodologies previously approved by the Directors. Under procedures approved by the Directors, the Company's Adviser has formed a Valuation Committee whose members are approved by the Directors. The Valuation Committee provides administration and oversight of the Company's valuation policies and procedures, which are reviewed at least annually by the Directors. These procedures allow the Company to utilize independent pricing services, quotations from securities and financial instrument dealers, and other market sources to determine fair value.
The Company has procedures to determine the fair value of securities and other financial instruments for which market prices are not readily available. Under these procedures, the Valuation Committee convenes on a regular and ad hoc basis to review such securities and considers a number of factors, including valuation methodologies and significant unobservable valuation inputs, when arriving at fair value. The Valuation Committee may employ a market-based approach which may use related or comparable assets or liabilities, recent transactions, market multiples, book values, and other relevant information for the investment to determine the fair value of the investment. An income-based valuation approach may also be used in which the anticipated future cash flows of the investment are discounted to calculate fair value. Discounts may also be applied due to the nature or duration of any restrictions on the disposition of the investments. Due to the inherent uncertainty of valuations of such investments, the fair values may differ significantly from the values that would have been used had an active market existed. The Valuation Committee employs various methods for
calibrating these valuation approaches including a regular review of valuation methodologies, key inputs and assumptions, transactional back-testing or disposition analysis, and reviews of any related market activity.
2. Fair Value Measurement: Financial Accounting Standards Board ("FASB") Accounting Standards CodificationTM ("ASC") 820, "Fair Value Measurement" ("ASC 820"), defines fair value as the value that the Fund would receive to sell an investment or pay to transfer a liability in a timely transaction with an independent buyer in the principal market, or in the absence of a principal market, the most advantageous market for the investment or liability. ASC 820 establishes a three-tier hierarchy to distinguish between (1) inputs that reflect the assumptions market participants would use in valuing an asset or liability developed based on market data obtained from sources independent of the reporting entity (observable inputs) and (2) inputs that reflect the reporting entity's own assumptions about the assumptions market participants would use in valuing an asset or liability developed based on the best information available in the circumstances (unobservable inputs) and to establish classification of fair value measurements for disclosure purposes. Various inputs are used in determining the value of the Fund's investments. The inputs are summarized in the three broad levels listed below.
• Level 1 – unadjusted quoted prices in active markets for identical investments
• Level 2 – other significant observable inputs (including quoted prices for similar investments, interest rates, prepayment speeds, credit risk, etc.)
• Level 3 – significant unobservable inputs including the Fund's own assumptions in determining the fair value of investments. Factors considered in making this determination may include, but are not limited to, information obtained by contacting the issuer, analysts, or the appropriate stock exchange (for exchange-traded securities), analysis of the issuer's financial statements or other available documents and, if necessary, available information concerning other securities in similar circumstances
The inputs or methodology used for valuing securities are not necessarily an indication of the risk associated
21
Morgan Stanley Institutional Fund, Inc.
Annual Report — December 31, 2017
Notes to Financial Statements (cont'd)
with investing in those securities and the determination of the significance of a particular input to the fair value measurement in its entirety requires judgment and considers factors specific to each security.
The following is a summary of the inputs used to value the Fund's investments as of December 31, 2017.
Investment Type | | Level 1
Unadjusted
quoted
prices
(000) | | Level 2
Other
significant
observable
inputs
(000) | | Level 3
Significant
unobservable
inputs
(000) | | Total
(000) | |
Assets: | |
Common Stocks | |
Aerospace & Defense | | $ | — | | | $ | 7,089 | | | $ | — | | | $ | 7,089 | | |
Airlines | | | 9,531 | | | | — | | | | — | | | | 9,531 | | |
Auto Components | | | — | | | | 8,490 | | | | — | | | | 8,490 | | |
Automobiles | | | — | | | | 37,579 | | | | — | | | | 37,579 | | |
Banks | | | 69,336 | | | | 267,602 | | | | — | | | | 336,938 | | |
Beverages | | | 14,342 | | | | — | | | | — | | | | 14,342 | | |
Biotechnology | | | — | | | | 8,472 | | | | — | | | | 8,472 | | |
Capital Markets | | | — | | | | 10,838 | | | | — | | | | 10,838 | | |
Construction &
Engineering | | | — | | | | 6,003 | | | | — | | | | 6,003 | | |
Construction Materials | | | — | | | | 21,039 | | | | — | | | | 21,039 | | |
Distributors | | | — | | | | 5,186 | | | | — | | | | 5,186 | | |
Diversified Consumer
Services | | | 17,794 | | | | — | | | | — | | | | 17,794 | | |
Diversified Financial
Services | | | — | | | | 6,540 | | | | — | | | | 6,540 | | |
Diversified
Telecommunication
Services | | | — | | | | 16,592 | | | | — | | | | 16,592 | | |
Electric Utilities | | | — | | | | 8,640 | | | | — | | | | 8,640 | | |
Electronic Equipment,
Instruments &
Components | | | — | | | | 27,304 | | | | — | | | | 27,304 | | |
Food & Staples
Retailing | | | — | | | | 28,985 | | | | — | | | | 28,985 | | |
Food Products | | | 7,493 | | | | 27,958 | | | | — | | | | 35,451 | | |
Health Care
Providers & Services | | | — | | | | 13,157 | | | | — | | | | 13,157 | | |
Hotels, Restaurants &
Leisure | | | 5,544 | | | | 13,151 | | | | — | | | | 18,695 | | |
Household Durables | | | — | | | | 19,369 | | | | — | | | | 19,369 | | |
Household Products | | | — | | | | 10,994 | | | | — | | | | 10,994 | | |
Industrial
Conglomerates | | | — | | | | 24,756 | | | | — | | | | 24,756 | | |
Insurance | | | — | | | | 55,585 | | | | — | | | | 55,585 | | |
Internet & Direct
Marketing Retail | | | 11,660 | | | | — | | | | — | | | | 11,660 | | |
Internet Software &
Services | | | 79,462 | | | | 119,975 | | | | — | | | | 199,437 | | |
Machinery | | | — | | | | 13,807 | | | | — | | | | 13,807 | | |
Media | | | — | | | | 24,843 | | | | — | | | | 24,843 | | |
Metals & Mining | | | 268 | | | | 13,174 | | | | — | | | | 13,442 | | |
Multi-Line Retail | | | 13,179 | | | | 15,417 | | | | — | | | | 28,596 | | |
Oil, Gas & Consumable
Fuels | | | 344 | | | | 52,259 | | | | — | | | | 52,603 | | |
Personal Products | | | — | | | | 15,905 | | | | — | | | | 15,905 | | |
Pharmaceuticals | | | — | | | | 17,798 | | | | — | | | | 17,798 | | |
Investment Type | | Level 1
Unadjusted
quoted
prices
(000) | | Level 2
Other
significant
observable
inputs
(000) | | Level 3
Significant
unobservable
inputs
(000) | | Total
(000) | |
Common Stocks (cont'd) | |
Professional Services | | $ | — | | | $ | 3,629 | | | $ | — | | | $ | 3,629 | | |
Real Estate
Management &
Development | | | 2,223 | | | | 13,657 | | | | — | | | | 15,880 | | |
Semiconductors &
Semiconductor
Equipment | | | — | | | | 63,271 | | | | — | | | | 63,271 | | |
Tech Hardware,
Storage &
Peripherals | | | — | | | | 60,137 | | | | — | | | | 60,137 | | |
Textiles, Apparel &
Luxury Goods | | | — | | | | 58,188 | | | | — | | | | 58,188 | | |
Thrifts & Mortgage
Finance | | | — | | | | 11,341 | | | | — | | | | 11,341 | | |
Transportation
Infrastructure | | | — | | | | 8,336 | | | | — | | | | 8,336 | | |
Wireless
Telecommunication
Services | | | — | | | | 11,252 | | | | — | | | | 11,252 | | |
Total Common Stocks | | | 231,176 | | | | 1,128,318 | | | | — | | | | 1,359,494 | | |
Short-Term Investments | |
Investment Company | | | 46,342 | | | | — | | | | — | | | | 46,342 | | |
Total Assets | | $ | 277,518 | | | $ | 1,128,318 | | | $ | — | | | $ | 1,405,836 | | |
Transfers between investment levels may occur as the markets fluctuate and/or the availability of data used in an investment's valuation changes. The Fund recognizes transfers between the levels as of the end of the period. As of December 31, 2017, securities with a total value of approximately $929,740,000 transferred from Level 1 to Level 2. Securities that were valued using unadjusted quoted prices at December 31, 2016 were valued using other significant observable inputs at December 31, 2017. At December 31, 2017, the fair value of certain securities were adjusted due to developments which occurred between the time of the close of the foreign markets on which they trade and the close of business on the NYSE which resulted in their Level 2 classification.
3. Foreign Currency Translation and Foreign Investments: The books and records of the Fund are maintained in U.S. dollars. Foreign currency amounts are translated into U.S. dollars as follows:
– investments, other assets and liabilities at the prevailing rate of exchange on the valuation date;
– investment transactions and investment income at the prevailing rates of exchange on the dates of such transactions.
22
Morgan Stanley Institutional Fund, Inc.
Annual Report — December 31, 2017
Notes to Financial Statements (cont'd)
Although the net assets of the Fund are presented at the foreign exchange rates and market values at the close of the period, the Fund does not isolate that portion of the results of operations arising as a result of changes in the foreign exchange rates from the fluctuations arising from changes in the market prices of securities held at period end. Similarly, the Fund does not isolate the effect of changes in foreign exchange rates from the fluctuations arising from changes in the market prices of securities sold during the period. Accordingly, realized and unrealized foreign currency gains (losses) on investments in securities are included in the reported net realized and unrealized gains (losses) on investment transactions and balances. However, pursuant to U.S. federal income tax regulations, gains and losses from certain foreign currency transactions and the foreign currency portion of gains and losses realized on sales and maturities of foreign denominated debt securities are treated as ordinary income for U.S. federal income tax purposes.
Net realized gains (losses) on foreign currency transactions represent net foreign exchange gains (losses) from foreign currency forward exchange contracts, disposition of foreign currencies, currency gains (losses) realized between the trade and settlement dates on securities transactions, and the difference between the amount of investment income and foreign withholding taxes recorded on the Fund's books and the U.S. dollar equivalent amounts actually received or paid. Net unrealized currency gains (losses) from valuing foreign currency denominated assets and liabilities at period end exchange rates are reflected as a component of unrealized appreciation (depreciation) in the Statement of Assets and Liabilities. The change in unrealized currency gains (losses) on foreign currency translations for the period is reflected in the Statement of Operations.
Foreign security and currency transactions may involve certain considerations and risks not typically associated with those of U.S. dollar denominated transactions as a result of, among other factors, fluctuations of exchange rates in relation to the U.S. dollar, the possibility of lower levels of governmental supervision and regulation of foreign securities markets and the possibility of political or economic instability.
Governmental approval for foreign investments may be required in advance of making an investment under certain circumstances in some countries, and the extent
of foreign investments in domestic companies may be subject to limitation in other countries. Foreign ownership limitations also may be imposed by the charters of individual companies to prevent, among other concerns, violations of foreign investment limitations. As a result, an additional class of shares (identified as "Foreign" in the Portfolio of Investments) may be created and offered for investment. The "local" and "foreign shares" market values may differ. In the absence of trading of the foreign shares in such markets, the Fund values the foreign shares at the closing exchange price of the local shares.
4. Derivatives: The Fund may, but is not required to, use derivative instruments for a variety of purposes, including hedging, risk management, portfolio management or to earn income. Derivatives are financial instruments whose value is based, in part, on the value of an underlying asset, interest rate, index or financial instrument. Prevailing interest rates and volatility levels, among other things, also affect the value of derivative instruments. A derivative instrument often has risks similar to its underlying asset and may have additional risks, including imperfect correlation between the value of the derivative and the underlying asset, risks of default by the counterparty to certain transactions, magnification of losses incurred due to changes in the market value of the securities, instruments, indices or interest rates to which the derivative instrument relates, risks that the transactions may not be liquid and risks arising from margin requirements. The use of derivatives involves risks that are different from, and possibly greater than, the risks associated with other portfolio investments. Derivatives may involve the use of highly specialized instruments that require investment techniques and risk analyses different from those associated with other portfolio investments. All of the Fund's holdings, including derivative instruments, are marked-to-market each day with the change in value reflected in unrealized appreciation (depreciation). Upon disposition, a realized gain or loss is recognized.
Certain derivative transactions may give rise to a form of leverage. Leverage magnifies the potential for gain and the risk of loss. Leverage associated with derivative transactions may cause the Fund to liquidate portfolio positions when it may not be advantageous to do so to satisfy its obligations or to meet earmarking or segregation requirements, pursuant to applicable
23
Morgan Stanley Institutional Fund, Inc.
Annual Report — December 31, 2017
Notes to Financial Statements (cont'd)
Securities and Exchange Commission ("SEC") rules and regulations, or may cause the Fund to be more volatile than if the Fund had not been leveraged. Although the Adviser and/or Sub-Advisers seek to use derivatives to further the Fund's investment objectives, there is no assurance that the use of derivatives will achieve this result.
Following is a description of the derivative instruments and techniques that the Fund used during the period and their associated risks:
Foreign Currency Forward Exchange Contracts: In connection with its investments in foreign securities, the Fund also entered into contracts with banks, brokers or dealers to purchase or sell securities or foreign currencies at a future date. A foreign currency forward exchange contract ("currency contract") is a negotiated agreement between the contracting parties to exchange a specified amount of currency at a specified future time at a specified rate. The rate can be higher or lower than the spot rate between the currencies that are the subject of the contract. Currency contracts may be used to protect against uncertainty in the level of future foreign currency exchange rates or to gain or modify exposure to a particular currency. To the extent hedged by the use of currency contracts, the precise matching of the currency contract amounts and the value of the securities involved will not generally be possible because the future value of such securities in foreign currencies will change as a consequence of market movements in the value of those securities between the date on which the contract is entered into and the date it matures. Furthermore, such transactions may reduce or preclude the opportunity for gain if the value of the currency should move in the direction opposite to the position taken. There is additional risk to the extent that currency contracts create exposure to currencies in which the Fund's securities are not denominated. Unanticipated changes in currency prices may result in poorer overall performance for the Fund than if it had not entered into such contracts. The use of currency contracts involves the risk of loss from the insolvency or bankruptcy of the counterparty to the contract or the failure of the counterparty to make payments or otherwise comply with the terms of the contract. A currency contract is marked-to-market daily and the change in market value is recorded by the Fund
as unrealized gain or loss. The Fund records realized gains (losses) when the currency contract is closed equal to the difference between the value of the currency contract at the time it was opened and the value at the time it was closed.
As of December 31, 2017, the Fund did not have any open foreign currency forward exchange contracts.
FASB ASC 815, "Derivatives and Hedging" ("ASC 815"), is intended to improve financial reporting about derivative instruments by requiring enhanced disclosures to enable investors to better understand how and why the Fund uses derivative instruments, how these derivative instruments are accounted for and their effects on the Fund's financial position and results of operations.
The following tables set forth by primary risk exposure the Fund's realized gains (losses) and change in unrealized appreciation (depreciation) by type of derivative contract for the year ended December 31, 2017 in accordance with ASC 815.
Realized Gain (Loss) | |
Primary Risk Exposure | | Derivative Type | | Value
(000) | |
Currency Risk
| | Foreign Currency Forward
Exchange Contracts | | $ | 146 | | |
Change in Unrealized Appreciation (Depreciation) | |
Primary Risk Exposure | | Derivative Type | | Value
(000) | |
Currency Risk
| | Foreign Currency Forward
Exchange Contracts | | $ | (264 | ) | |
For the year ended December 31, 2017, the approximate average monthly amount outstanding for each derivative type is as follows:
Foreign Currency Forward Exchange Contracts: | |
Average monthly principal amount | | $ | 3,679,000 | | |
5. Securities Lending: The Fund lends securities to qualified financial institutions, such as broker-dealers, to earn additional income. Any increase or decrease in the fair value of the securities loaned that might occur and any interest earned or dividends declared on those securities during the term of the loan would remain in the Fund. The Fund would receive cash or securities as collateral in an amount equal to or exceeding 100% of the current fair value of the loaned securities. The collateral is marked-to-market daily by State Street Bank and Trust Company ("State Street"), the securities lending agent, to ensure that a minimum of 100% collateral coverage is maintained.
24
Morgan Stanley Institutional Fund, Inc.
Annual Report — December 31, 2017
Notes to Financial Statements (cont'd)
Based on pre-established guidelines, the securities lending agent invests any cash collateral that is received in an affiliated money market portfolio and repurchase agreements. Securities lending income is generated from the earnings on the invested collateral and borrowing fees, less any rebates owed to the borrowers and compensation to the lending agent, and is recorded as "Income from Securities Loaned — Net" in the Fund's Statement of Operations. Risks in securities lending transactions are that a borrower may not provide additional collateral when required or return the securities when due, and that the value of the short-term investments will be less than the amount of cash collateral plus any rebate that is required to be returned to the borrower.
The Fund has the right under the securities lending agreement to recover the securities from the borrower on demand.
The following table presents financial instruments that are subject to enforceable netting arrangements as of December 31, 2017.
Gross Amounts Not Offset in the Statement of Assets and Liabilities | |
Gross Asset
Amounts
Presented in
Statement of
Assets and
Liabilities
(000) | | Financial
Instrument
(000) | | Collateral
Received
(000) | | Net Amount
(not less
than $0)
(000) | |
| $ | 15,767 | (a) | | $ | — | | | $ | (15,767 | )(b)(c) | | $ | 0 | | |
(a) Represents market value of loaned securities at year end.
(b) The Fund received cash collateral of approximately $3,864,000, which was subsequently invested in Morgan Stanley Institutional Liquidity Funds as reported in the Portfolio of Investments. In addition, the Fund received non-cash collateral of approximately $12,611,000 in the form of U.S. Government obligations, which the Fund cannot sell or repledge, and accordingly are not reflected in the Portfolio of Investments.
(c) The actual collateral received is greater than the amount shown here due to overcollateralization.
FASB ASC 860 "Transfers & Servicing: Repurchase-to-Maturity Transactions, Repurchase Financings, and Disclosures", is intended to provide increased transparency about the types of collateral pledged in securities lending transactions and other
similar transactions that are accounted for as secured borrowing.
Remaining Contractual Maturity of the Agreements | |
| | | Overnight and
Continuous
(000) | | <30 days
(000) | | Between
30 &
90 days
(000) | | >90 days
(000) | | Total
(000) | |
Securities Lending
Transactions | |
Common Stocks | | $ | 3,864 | | | $ | — | | | $ | — | | | $ | — | | | $ | 3,864 | | |
Total Borrowings | | $ | 3,864 | | | $ | — | | | $ | — | | | $ | — | | | $ | 3,864 | | |
Gross amount of
recognized liabilities
for securities lending
transactions | | | | | | | | | | $ | 3,864 | | |
The following table displays a breakdown of transactions accounted for as secured borrowings, the gross obligations by class of collateral pledged, and the remaining contractual maturity of those transactions as of December 31, 2017.
6. Redemption Fees: The Fund will assess a 2% redemption fee on Class I shares, Class A shares, Class L shares, Class C shares and Class IS shares, which is paid directly to the Fund, for shares redeemed or exchanged within thirty days of purchase, subject to certain exceptions. The redemption fee is designed to protect the Fund and its remaining shareholders from the effects of short-term trading. These fees, if any, are included in the Statements of Changes in Net Assets.
7. Indemnifications: The Company enters into contracts that contain a variety of indemnifications. The Company's maximum exposure under these arrangements is unknown. However, the Company has not had prior claims or losses pursuant to these contracts and expects the risk of loss to be remote.
8. Dividends and Distributions to Shareholders: Dividend income and distributions to shareholders are recorded on the ex-dividend date. Dividends from net investment income, if any, are declared and paid annually. Net realized capital gains, if any, are distributed at least annually.
9. Security Transactions, Income and Expenses: Security transactions are accounted for on the trade date (date the order to buy or sell is executed). Realized gains and losses on the sale of investment securities are determined on the specific identified cost method. Dividend income and
25
Morgan Stanley Institutional Fund, Inc.
Annual Report — December 31, 2017
Notes to Financial Statements (cont'd)
other distributions are recorded on the ex-dividend date (except for certain foreign dividends which may be recorded as soon as the Fund is informed of such dividends) net of applicable withholding taxes. Interest income is recognized on the accrual basis except where collection is in doubt. Discounts are accreted and premiums are amortized over the life of the respective securities. Most expenses of the Company can be directly attributed to a particular Fund. Expenses which cannot be directly attributed are apportioned among the Funds based upon relative net assets or other appropriate methods. Income, expenses (other than class specific expenses — distribution and shareholder services, transfer agency and sub transfer agency fees) and realized and unrealized gains or losses are allocated to each class of shares based upon their relative net assets.
B. Advisory/Sub-Advisory Fees: The Adviser, a wholly-owned subsidiary of Morgan Stanley, provides the Fund with advisory services under the terms of an Investment Advisory Agreement, paid quarterly, at the annual rate based on the daily net assets as follows:
First $500
million | | Next $500
million | | Next $1.5
billion | | Over $2.5
billion | |
| | 0.85 | % | | | 0.75 | % | | | 0.70 | % | | | 0.65 | % | |
For the year ended December 31, 2017, the advisory fee rate (net of waiver/rebate) was equivalent to an annual effective rate of 0.75% of the Fund's average daily net assets.
The Adviser has agreed to reduce its advisory fee and/or reimburse the Fund so that total annual portfolio operating expenses, excluding certain investment related expenses, taxes, interest and other extraordinary expenses (including litigation), will not exceed 1.05% for Class I shares, 1.40% for Class A shares, 1.90% for Class L shares, 2.15% for Class C shares and 0.95% for Class IS shares. The fee waivers and/or expense reimbursements will continue for at least one year from the date of the Fund's prospectus or until such time as the Directors act to discontinue all or a portion of such waivers and/or reimbursements when they deem such action is appropriate. For the year ended December 31, 2017, approximately $377,000 of advisory fees were waived and approximately $5,000 of other expenses were reimbursed by the Adviser pursuant to this arrangement.
The Adviser has entered into a Sub-Advisory Agreement with the Sub-Adviser, a wholly-owned subsidiary of Morgan Stanley. The Sub-Adviser provides the Fund with advisory services subject to the overall supervision of the Adviser and the Fund's Officers and Directors. The Adviser pays the Sub-Adviser on a monthly basis a
portion of the net advisory fees the Adviser receives from the Fund.
C. Administration Fees: The Adviser also serves as Administrator to the Company and provides administrative services pursuant to an Administration Agreement for an annual fee, accrued daily and paid monthly, of 0.08% of the Fund's average daily net assets.
Under a Sub-Administration Agreement between the Administrator and State Street, State Street provides certain administrative services to the Company. For such services, the Administrator pays State Street a portion of the fee the Administrator receives from the Fund.
D. Distribution and Shareholder Services Fees: Morgan Stanley Distribution, Inc. ("MSDI" or the "Distributor"), a wholly-owned subsidiary of the Adviser and an indirect subsidiary of Morgan Stanley, serves as the Company's Distributor of Fund shares pursuant to a Distribution Agreement. The Company has adopted a Shareholder Services Plan with respect to Class A shares pursuant to Rule 12b-1 under the Act. Under the Shareholder Services Plan, the Fund pays the Distributor a shareholder services fee, accrued daily and paid monthly, at an annual rate of 0.25% of the Fund's average daily net assets attributable to Class A shares.
The Company has adopted a Distribution and Shareholder Services Plan with respect to Class L shares pursuant to Rule 12b-1 under the Act. Under the Distribution and Shareholder Services Plan, the Fund pays the Distributor a distribution fee, accrued daily and paid monthly, at an annual rate of 0.50% and a shareholder services fee, accrued daily and paid monthly, at an annual rate of 0.25% of the Fund's average daily net assets attributable to Class L shares.
The Company has adopted a Distribution and Shareholder Services Plan with respect to Class C shares pursuant to Rule 12b-1 under the Act. Under the Distribution and Shareholder Services Plan, the Fund pays the Distributor a distribution fee, accrued daily and paid monthly, at an annual rate of 0.75% and a shareholder services fee, accrued daily and paid monthly, at an annual rate of 0.25% of the Fund's average daily net assets attributable to Class C shares.
The distribution and shareholder services fees are used to support the expenses associated with servicing and maintaining accounts. The Distributor may compensate other parties for providing shareholder support services to investors who purchase Class A, Class L and Class C shares.
26
Morgan Stanley Institutional Fund, Inc.
Annual Report — December 31, 2017
Notes to Financial Statements (cont'd)
E. Dividend Disbursing and Transfer Agent: The Company's dividend disbursing and transfer agent is Boston Financial Data Services, Inc. ("BFDS"). Pursuant to a Transfer Agency Agreement, the Company pays BFDS a fee based on the number of classes, accounts and transactions relating to the Funds of the Company. Effective January 1, 2018, BFDS changed its name to DST Asset Manager Solutions, Inc.
F. Custodian Fees: State Street (the "Custodian") also serves as Custodian for the Company in accordance with a Custodian Agreement. The Custodian holds cash, securities, and other assets of the Company as required by the Act. Custody fees are payable monthly based on assets held in custody, investment purchases and sales activity and account maintenance fees, plus reimbursement for certain out-of-pocket expenses.
G. Security Transactions and Transactions with Affiliates: For the year ended December 31, 2017, purchases and sales of investment securities for the Fund, other than long-term U.S. Government securities and short-term investments, were approximately $489,085,000 and $407,619,000, respectively. There were no purchases and sales of long-term U.S. Government securities for the year ended December 31, 2017.
The Fund invests in the Institutional Class of the Morgan Stanley Institutional Liquidity Funds — Government Portfolio (the "Liquidity Funds"), an open-end management investment company managed by the Adviser. Advisory fees paid by the Fund are reduced by an amount equal to its pro-rata share of the advisory and administration fees paid by the Fund due to its investment in the Liquidity Funds. For the year ended December 31, 2017, advisory fees paid were reduced by approximately $50,000 relating to the Fund's investment in the Liquidity Funds.
A summary of the Fund's transactions in shares of the Liquidity Funds during the year ended December 31, 2017 is as follows:
Affiliated
Investment
Company | | Value
December 31,
2016
(000) | | Purchases
at Cost
(000) | | Proceeds
from Sales
(000) | | Dividend
Income
(000) | |
Liquidity Funds | | $ | 18,610 | | | $ | 235,343 | | | $ | 207,611 | | | $ | 233 | | |
Affiliated
Investment
Company (cont'd) | | Realized
Gain
(Loss)
(000) | | Change in
Unrealized
Appreciation
(Depreciation)
(000) | | Value
December 31,
2017
(000) | |
Liquidity Funds | | $ | — | | | $ | — | | | $ | 46,342 | | |
During the year ended December 31, 2017, the Fund incurred approximately $52,000 in brokerage commissions with
Morgan Stanley & Co., LLC, an affiliate of the Adviser/Administrator, Sub-Adviser and Distributor, for portfolio transactions executed on behalf of the Fund.
The Fund is permitted to purchase and sell securities ("cross-trade") from and to other Morgan Stanley Funds as well as other funds and client accounts for which the Adviser or an affiliate of the Adviser serves as investment adviser, pursuant to procedures approved by the Directors in compliance with Rule 17a-7 under the Act (the "Rule"). Each cross-trade is executed at the current market price in compliance with provisions of the Rule. For the year ended December 31, 2017, the Fund did not engage in any cross-trade transactions.
The Fund has an unfunded Deferred Compensation Plan (the "Compensation Plan"), which allows each independent Director to defer payment of all, or a portion, of the fees he or she receives for serving on the Board of Directors. Each eligible Director generally may elect to have the deferred amounts credited with a return equal to the total return on one or more of the Morgan Stanley funds that are offered as investment options under the Compensation Plan. Appreciation/depreciation and distributions received from these investments are recorded with an offsetting increase/decrease in the deferred compensation obligation and do not affect the NAV of the Fund.
H. Federal Income Taxes: It is the Fund's intention to continue to qualify as a regulated investment company and distribute all of its taxable and tax-exempt income. Accordingly, no provision for federal income taxes is required in the financial statements.
The Fund may be subject to taxes imposed by countries in which it invests. Such taxes are generally based on income and/or capital gains earned or repatriated. Taxes are accrued based on net investment income, net realized gains and net unrealized appreciation as such income and/or gains are earned. Taxes may also be based on transactions in foreign currency and are accrued based on the value of investments denominated in such currency.
FASB ASC 740-10, "Income Taxes — Overall", sets forth a minimum threshold for financial statement recognition of the benefit of a tax position taken or expected to be taken in a tax return. Management has concluded there are no significant uncertain tax positions that would require recognition in the financial statements. If applicable, the Fund recognizes interest accrued related to unrecognized tax benefits in "Interest Expense" and penalties in "Other Expenses" in the Statement of Operations. The Fund files tax returns with the U.S. Internal
27
Morgan Stanley Institutional Fund, Inc.
Annual Report — December 31, 2017
Notes to Financial Statements (cont'd)
Revenue Service, New York and various states. Generally, each of the tax years in the four-year period ended December 31, 2017, remains subject to examination by taxing authorities.
The tax character of distributions paid may differ from the character of distributions shown in the Statements of Changes in Net Assets due to short-term capital gains being treated as ordinary income for tax purposes. The tax character of distributions paid during fiscal years 2017 and 2016 was as follows:
2017
Distributions
Paid From: | | 2016
Distributions
Paid From: | |
Ordinary
Income
(000) | | Long-Term
Capital Gain
(000) | | Ordinary
Income
(000) | | Long-Term
Capital Gain
(000) | |
| $ | 9,134 | | | $ | — | | | $ | 8,111 | | | $ | — | | |
The amount and character of income and gains to be distributed are determined in accordance with income tax regulations which may differ from GAAP. These book/tax differences are either considered temporary or permanent in nature.
Temporary differences are primarily due to differing book and tax treatments for the timing of the recognition of gains (losses) on certain investment transactions and the timing of the deductibility of certain expenses.
Permanent differences, primarily due to differing treatments of gains (losses) related to foreign currency transactions and foreign taxes paid on capital gains, resulted in the following reclassifications among the components of net assets at December 31, 2017:
Distributions
in Excess of
Net Investment
Income
(000) | | Accumulated
Net Realized
Loss
(000) | | Paid-in-
Capital
(000) | |
| $ | (1,144 | ) | | $ | 1,144 | | | $ | — | | |
At December 31, 2017, the components of distributable earnings for the Fund on a tax basis were as follows:
Undistributed
Ordinary
Income
(000) | | Undistributed
Long-Term
Capital Gain
(000) | |
| $ | 70 | | | $ | — | | |
At December 31, 2017, the Fund had available for federal income tax purposes unused short term and long term capital losses of approximately $30,544,000 and $2,899,000, respectively, that do not have an expiration date.
To the extent that capital loss carryforwards are used to offset any future capital gains realized, no capital gains tax liability will be incurred by the Fund for gains realized and not distributed. To the extent that capital gains are offset, such gains will
not be distributed to the shareholders. During the year ended December 31, 2017, the Fund utilized capital loss carryforwards for U.S. federal income tax purposes of approximately $43,182,000.
I. Credit Facility: The Company and other Morgan Stanley funds participated in a $150,000,000 committed, unsecured revolving line of credit facility (the "Facility") with State Street. This Facility is to be used for temporary emergency purposes or funding of shareholder redemption requests. The interest rate on borrowings is based on the federal funds rate or 1 month LIBOR rate plus a spread. The Facility also has a commitment fee of 0.25% per annum based on the unused portion of the Facility. During the year ended December 31, 2017, the Fund did not have any borrowings under the Facility.
J. Other: At December 31, 2017, the Fund had record owners of 10% or greater. Investment activities of these shareholders could have a material impact on the Fund. The aggregate percentage of such owners was 63.1%.
28
Morgan Stanley Institutional Fund, Inc.
Annual Report — December 31, 2017
Report of Independent Registered Public Accounting Firm
To the Shareholders and Board of Directors of
Morgan Stanley Institutional Fund, Inc. —
Emerging Markets Portfolio
Opinion on the Financial Statements
We have audited the accompanying statement of assets and liabilities of Emerging Markets Portfolio (the "Fund") (one of the funds constituting the Morgan Stanley Institutional Fund, Inc. (the "Company")), including the portfolio of investments, as of December 31, 2017, and the related statement of operations for the year then ended, the statements of changes in net assets for each of the two years in the period then ended, the financial highlights for each of the five years in the period then ended and the related notes (collectively referred to as the "financial statements"). In our opinion, the financial statements present fairly, in all material respects, the financial position of Emerging Markets Portfolio (one of the funds constituting Morgan Stanley Institutional Fund, Inc.) at December 31, 2017, the results of its operations for the year then ended, the changes in its net assets for each of the two years in the period then ended and its financial highlights for each of the five years in the period then ended, in conformity with U.S. generally accepted accounting principles.
Basis for Opinion
These financial statements are the responsibility of the Company's management. Our responsibility is to express an opinion on the Fund's financial statements based on our audits. We are a public accounting firm registered with the Public Company Accounting Oversight Board (United States) ("PCAOB") and are required to be independent with respect to the Company in accordance with the U.S. federal securities law and the applicable rules and regulations of the Securities and Exchange Commission and the PCAOB.
We conducted our audits in accordance with the standards of the PCAOB. Those standards require that we plan and perform the audit to obtain reasonable assurance about whether the financial statements are free of material misstatement, whether due to error or fraud. The Company is not required to have, nor were we engaged to perform, an audit of the Company's internal control over financial reporting. As part of our audits, we are required to obtain an understanding of internal control over financial reporting, but not for the purpose of expressing an opinion on the effectiveness of the Company's internal control over financial reporting. Accordingly, we express no such opinion.
Our audits included performing procedures to assess the risks of material misstatement of the financial statements, whether due to error or fraud, and performing procedures that respond to those risks. Such procedures included examining, on a test basis, evidence regarding the amounts and disclosures in the financial statements. Our procedures included confirmation of securities owned as of December 31, 2017 by correspondence with the custodian and others or by other appropriate auditing procedures where replies from others were not received. Our audits also included evaluating the accounting principles used and significant estimates made by management, as well as evaluating the overall presentation of the financial statements. We believe that our audits provide a reasonable basis for our opinion.

We have served as the auditor of one or more Morgan Stanley investment companies since 2000.
Boston, Massachusetts
February 26, 2018
29
Morgan Stanley Institutional Fund, Inc.
Annual Report — December 31, 2017
Federal Tax Notice (unaudited)
For federal income tax purposes, the following information is furnished with respect to the distributions paid by the Fund during its taxable year ended December 31, 2017. For corporate shareholders 0.46% of the dividends qualified for the dividends received deduction.
For federal income tax purposes, the following information is furnished with respect to the Fund's earnings for its taxable year ended December 31, 2017. When distributed, certain earnings may be subject to a maximum tax rate of 15% as provided for by the Jobs and Growth Tax Relief Reconciliation Act of 2003. The Fund designated up to a maximum of approximately $11,437,000 as taxable at this lower rate.
The Fund intends to pass through foreign tax credits of approximately $2,304,000 and has derived net income from sources within foreign countries amounting to approximately $23,524,000.
In January, the Fund provides tax information to shareholders for the preceding calendar year.
30
Morgan Stanley Institutional Fund, Inc.
Annual Report — December 31, 2017
Privacy Notice (unaudited)
MORGAN STANLEY INVESTMENT MANAGEMENT INC.
AN IMPORTANT NOTICE CONCERNING OUR U.S. PRIVACY POLICY
We are required by federal law to provide you with a copy of our privacy policy annually. This policy applies to current and former individual investors in funds managed or sponsored by Morgan Stanley Investment Management Inc. ("MSIM") as well as current and former individual clients of MSIM. This policy is not applicable to partnerships, corporations, trusts or other non-individual clients or investors. Please note that we may amend this policy at any time, and will inform you of any changes as required by law.
WE RESPECT YOUR PRIVACY
We appreciate that you have provided us with your personal financial information. We strive to maintain the privacy of such information while we help you achieve your financial objectives. This Notice describes what non-public personal information we collect about you, why we collect it, when we may share it with others and how certain others may use it. It discusses the steps you may take to limit our sharing of certain information about you to affiliated companies in the Morgan Stanley family of companies ("other Morgan Stanley companies"). It also discloses how you may limit use of certain shared information for marketing purposes by other Morgan Stanley branded companies. Throughout this policy, we refer to the non-public information that personally identifies you or your accounts as "personal information."
1. WHAT PERSONAL INFORMATION DO WE COLLECT ABOUT YOU?
We obtain personal information from applications and other forms you submit to us, from your dealings with us, from consumer reporting agencies, from our Web sites and from third parties and other sources.
For example:
• We may collect information such as your name, address, e-mail address, telephone/fax numbers, assets, income and investment objectives through subscription documents, applications and other forms you submit to us.
• We may obtain information about account balances, your use of account(s) and the types of products and services you prefer to receive from us through your dealings and transactions with us and other sources.
• We may obtain information about your creditworthiness and credit history from consumer reporting agencies.
• We may collect background information from and through third-party vendors to verify representations you have made and to comply with various regulatory requirements.
• If you interact with us through our public and private Web sites, we may collect information that you provide directly through online communications (such as an e-mail address). We may also collect information about your Internet service provider, your domain name, your computer's operating system and Web browser, your use of our Web sites and your product and service preferences, through the use of "cookies." Please consult the Terms of Use of these sites for more details.
2. WHEN DO WE DISCLOSE PERSONAL INFORMATION WE COLLECT ABOUT YOU?
We may disclose personal information we collect about you to other Morgan Stanley companies and to non-affiliated third parties.
a. Information We Disclose to Other Morgan Stanley Companies.
We may disclose personal information to other Morgan Stanley companies for a variety of reasons, including to manage your account(s) effectively, to service and process your transactions, to let you know about products and services offered by us and other Morgan Stanley companies, to manage our business, and as otherwise required or permitted by law. Offers for products and services from other Morgan Stanley companies are developed under conditions designed to safeguard your personal information.
31
Morgan Stanley Institutional Fund, Inc.
Annual Report — December 31, 2017
Privacy Notice (unaudited) (cont'd)
b. Information We Disclose to Non-affiliated Third Parties.
We do not disclose personal information that we collect about you to non-affiliated third parties except to those who provide marketing services on our behalf, to financial institutions with whom we have joint marketing agreements, and as otherwise required or permitted by law. For example, we may disclose personal information to non-affiliated third parties for servicing and processing transactions, to offer our own products and services, to protect against fraud, for institutional risk control, to respond to judicial process or to perform services on our behalf. When we share personal information with a non-affiliated third party, they are required to limit their use of personal information to the particular purpose for which it was shared and they are not allowed to share personal information with others except to fulfill that limited purpose or as may be permitted or required by law.
3. HOW DO WE PROTECT THE SECURITY AND CONFIDENTIALITY OF PERSONAL INFORMATION WE COLLECT ABOUT YOU?
We maintain physical, electronic and procedural security measures to help safeguard the personal information we collect about you. We have internal policies governing the proper handling of client information. Third parties that provide support or marketing services on our behalf may also receive personal information, and we require them to adhere to confidentiality standards with respect to such information.
4. HOW CAN YOU LIMIT THE SHARING OF CERTAIN TYPES OF PERSONAL INFORMATION WITH OTHER MORGAN STANLEY COMPANIES?
We offer you choices as to whether we share with other Morgan Stanley companies the personal information that was collected to determine your eligibility for products and services you request ("eligibility information"). Eligibility information does not include your identification information or personal information pertaining to our transactions or experiences with you. Please note that, even if you direct us not to share eligibility information with other Morgan Stanley companies ("opt-out"), we may still share personal information, including eligibility information, with those companies in circumstances excluded from the opt-out under applicable law, such as to process transactions or to service your account.
5. HOW CAN YOU LIMIT THE USE OF CERTAIN TYPES OF PERSONAL INFORMATION BY OTHER MORGAN STANLEY COMPANIES FOR MARKETING?
By following the opt-out instructions in Section 6 below, you may limit other Morgan Stanley branded companies from marketing their products or services to you based on personal information we disclose to them. This information may include, for example, your income and account history with us. Please note that, even if you choose to limit Other Morgan Stanley Companies from using personal information about you that we may share with them for marketing their products and services to you, Other Morgan Stanley Companies may use your personal information that they obtain from us to market to you in circumstances permitted by law, such as if the Other Morgan Stanley Company has its own relationship with you.
6. HOW CAN YOU SEND US AN OPT-OUT INSTRUCTION?
If you wish to limit our sharing of eligibility information about you with other Morgan Stanley companies or other Morgan Stanley companies' use of personal information for marketing purposes, as described in this notice, you may do so by:
• Calling us at (800) 548-7786
Monday–Friday between 8a.m. and 6p.m.(EST)
• Writing to us at the following address:
DST Asset Manager Solutions, Inc.
c/o Privacy Coordinator
P.O. Box 219804
Kansas City, Missouri 64121
32
Morgan Stanley Institutional Fund, Inc.
Annual Report — December 31, 2017
Privacy Notice (unaudited) (cont'd)
Your written request should include your name, address, telephone number and account number(s) to which the opt-out applies and whether you are opting out with respect to sharing of eligibility information (Section 4 above), or if information used for Marketing (Section 5 above) or both. Written opt-out requests should not be sent with any other correspondence. In order to process your request, we require that the request be provided by you directly and not through a third party.
Your opt-out preference will remain in effect with respect to this policy (as it may be amended) until you notify us otherwise. If you have a joint account, your direction for us not to share this information with other Morgan Stanley companies and for those other Morgan Stanley companies not to use your personal information for marketing will be applied to all account holders on that account. Please understand that if you limit our sharing or our affiliated companies' use of personal information, you and any joint account holder(s) may not receive information about Morgan Stanley products and services, including products or services that could help you manage your financial resources and achieve your investment objectives.
7. WHAT IF AN AFFILIATED COMPANY BECOMES A NON-AFFILIATED THIRD PARTY?
If, at any time in the future, an affiliated company becomes a non-affiliated third party, further disclosures of personal information made to the former affiliated company will be limited to those described in Section 2(b) above relating to non-affiliated third parties. If you elected under Section 6 to limit disclosures we make to affiliated companies, or use of personal information by affiliated companies, your election will not apply to use by any former affiliated company of your personal information in their possession once it becomes a non-affiliated third party.
SPECIAL NOTICE TO RESIDENTS OF VERMONT
The following section supplements our policy with respect to our individual clients who have a Vermont address and supersedes anything to the contrary in the above policy with respect to those clients only.
The state of Vermont requires financial institutions to obtain your consent prior to sharing personal information that they collect about you with affiliated companies and non-affiliated third parties other than in certain limited circumstances. Except as permitted by law, we will not share personal information we collect about you with non-affiliated third parties or other Morgan Stanley companies unless you provide us with your written consent to share such information ("opt-in").
If you wish to receive offers for investment products and services offered by or through other Morgan Stanley companies, please notify us in writing at the following address:
DST Asset Manager Solutions, Inc.
c/o Privacy Coordinator
P.O. Box 219804
Kansas City, Missouri 64121
Your authorization should include your name, address, telephone number and account number(s) to which the opt-in applies and should not be sent with any other correspondence. In order to process your authorization, we require that the authorization be provided by you directly and not through a third party.
SPECIAL NOTICE TO RESIDENTS OF CALIFORNIA
The following section supplements our policy with respect to our individual clients who have a California address and supersedes anything to the contrary in the above policy with respect to those clients only.
In response to a California law, if your account has a California home address, your personal information will not be disclosed to non-affiliated third parties except as permitted by applicable California law, and we will limit sharing such information with our affiliates to comply with California privacy laws that apply to us.
33
Morgan Stanley Institutional Fund, Inc.
Annual Report — December 31, 2017
Director and Officer Information (unaudited)
Independent Directors:
Name, Age and Address of
Independent Director | | Position(s)
Held with
Registrant | | Length of Time
Served* | | Principal Occupation(s) During Past 5 Years
and Other Relevant Professional Experience | | Number of
Portfolios in
Fund Complex
Overseen by
Independent
Director** | | Other Directorships
Held by Independent
Director*** | |
Frank L. Bowman (73)
c/o Perkins Coie LLP
Counsel to the Independent
Directors
30 Rockefeller Plaza
New York, NY 10112 | | Director | | Since
August
2006 | | President, Strategic Decisions, LLC (consulting) (since February 2009); Director or Trustee of various Morgan Stanley Funds (since August 2006); Chairperson of the Compliance and Insurance Committee (since October 2015); formerly, Chairperson of the Insurance Sub-Committee of the Compliance and Insurance Committee (2007-2015); served as President and Chief Executive Officer of the Nuclear Energy Institute (policy organization) (February 2005-November 2008); retired as Admiral, U.S. Navy after serving over 38 years on active duty including 8 years as Director of the Naval Nuclear Propulsion Program in the Department of the Navy and the U.S. Department of Energy (1996-2004); served as Chief of Naval Personnel (July 1994-September 1996) and on the Joint Staff as Director of Political Military Affairs (June 1992-July 1994); knighted as Honorary Knight Commander of the Most Excellent Order of the British Empire; awarded the Officier de l'Orde National du Mérite by the French Government; elected to the National Academy of Engineering (2009). | | | 88 | | | Director of BP p.l.c.; Director of Naval and Nuclear Technologies LLP; Director Emeritus of the Armed Services YMCA; Director of the U.S. Naval Submarine League; Member of the National Security Advisory Council of the Center for U.S. Global Engagement and a member of the CNA Military Advisory Board; Trustee of Fairhaven United Methodist Church; and Director of other various non-profit organizations. | |
Kathleen A. Dennis (64)
c/o Perkins Coie LLP
Counsel to the Independent Directors
30 Rockefeller Plaza
New York, NY 10112 | | Director | | Since
August
2006 | | President, Cedarwood Associates (mutual fund and investment management consulting) (since July 2006); Chairperson of the Liquidity and Alternatives Sub-Committee of the Investment Committee (since October 2006) and Director or Trustee of various Morgan Stanley Funds (since August 2006); formerly, Senior Managing Director of Victory Capital Management (1993-2006). | | | 89 | | | Director of various non-profit organizations. | |
Nancy C. Everett (62)
c/o Perkins Coie LLP
Counsel to the Independent Directors
30 Rockefeller Plaza
New York, NY 10112 | | Director | | Since
January
2015 | | Chief Executive Officer, Virginia Commonwealth University Investment Company (since November 2015); Owner, OBIR, LLC (institutional investment management consulting) (since June 2014); formerly, Managing Director, BlackRock Inc. (February 2011-December 2013); and Chief Executive Officer, General Motors Asset Management (a/k/a Promark Global Advisors, Inc.) (June 2005-May 2010). | | | 90 | | | Formerly, Member of Virginia Commonwealth University School of Business Foundation (2005-2016); Member of Virginia Commonwealth University Board of Visitors (2013-2015); Member of Committee on Directors for Emerging Markets Growth Fund, Inc. (2007-2010); Chairperson of Performance Equity Management, LLC (2006-2010); and Chairperson, GMAM Absolute Return Strategies Fund, LLC (2006-2010). | |
34
Morgan Stanley Institutional Fund, Inc.
Annual Report — December 31, 2017
Director and Officer Information (unaudited) (cont'd)
Independent Directors: (cont'd)
Name, Age and Address of
Independent Director | | Position(s)
Held with
Registrant | | Length of Time
Served* | | Principal Occupation(s) During Past 5 Years
and Other Relevant Professional Experience | | Number of
Portfolios in
Fund Complex
Overseen by
Independent
Director** | | Other Directorships
Held by Independent
Director*** | |
Jakki L. Haussler (60)
c/o Perkins Coie LLP
Counsel to the Independent Directors
30 Rockefeller Plaza
New York, NY 10112 | | Director | | Since
January
2015 | | Chairman and Chief Executive Officer, Opus Capital Group (since January 1996); formerly, Director, Capvest Venture Fund, LP (May 2000-December 2011); Partner, Adena Ventures, LP (July 1999-December 2010); Director, The Victory Funds (February 2005- July 2008). | | | 90 | | | Director of Cincinnati Bell Inc. and Member, Audit Committee and Compensation Committee; Director of Northern Kentucky University Foundation and Member, Investment Committee; Member of Chase College of Law Transactional Law Practice Center Board of Advisors; Director of Best Transport; Director of Chase College of Law Board of Visitors; formerly, Member, University of Cincinnati Foundation Investment Committee; Member, Miami University Board of Visitors (2008-2011); Trustee of Victory Funds (2005-2008) and Chairman, Investment Committee (2007-2008) and Member, Service Provider Committee (2005-2008). | |
Dr. Manuel H. Johnson (68)
c/o Johnson Smick
International, Inc.
220 I Street, NE — Suite 200
Washington, D.C. 20002 | | Director | | Since
July
1991 | | Senior Partner, Johnson Smick International, Inc. (consulting firm); Chairperson of the Investment Committee (since October 2006) and Director or Trustee of various Morgan Stanley Funds (since July 1991); Co-Chairman and a founder of the Group of Seven Council (G7C) (international economic commission); formerly, Chairperson of the Audit Committee (July 1991-September 2006), Vice Chairman of the Board of Governors of the Federal Reserve System and Assistant Secretary of the U.S. Treasury. | | | 88 | | | Director of NVR, Inc. (home construction). | |
Joseph J. Kearns (75)
c/o Kearns & Associates LLC
46 E Peninsula Center #385
Rolling Hills Estates, CA
90274-3712 | | Director | | Since
August
1994 | | Senior Adviser, Kearns & Associates LLC (investment consulting); Chairperson of the Audit Committee (since October 2006) and Director or Trustee of various Morgan Stanley Funds (since August 1994); formerly, Deputy Chairperson of the Audit Committee (July 2003-September 2006) and Chairperson of the Audit Committee of various Morgan Stanley Funds (since August 1994); CFO of the J. Paul Getty Trust. | | | 89 | | | Prior to August 10, 2016, Director of Electro Rent Corporation (equipment leasing); Prior to December 31, 2013, Director of The Ford Family Foundation. | |
35
Morgan Stanley Institutional Fund, Inc.
Annual Report — December 31, 2017
Director and Officer Information (unaudited) (cont'd)
Independent Directors: (cont'd)
Name, Age and Address of
Independent Director | | Position(s)
Held with
Registrant | | Length of Time
Served* | | Principal Occupation(s) During Past 5 Years
and Other Relevant Professional Experience | | Number of
Portfolios in
Fund Complex
Overseen by
Independent
Director** | | Other Directorships
Held by Independent
Director*** | |
Michael F. Klein (59)
c/o Perkins Coie LLP
Counsel to the Independent Directors
30 Rockefeller Plaza
New York, NY 10112 | | Director | | Since
August
2006 | | Managing Director, Aetos Capital, LLC (since March 2000); Co-President, Aetos Alternatives Management, LLC (since January 2004) and Co-Chief Executive Officer of Aetos Capital LLC (since August 2013); Chairperson of the Fixed Income Sub-Committee of the Investment Committee (since October 2006) and Director or Trustee of various Morgan Stanley Funds (since August 2006); formerly, Managing Director, Morgan Stanley & Co. Inc. and Morgan Stanley Dean Witter Investment Management, President, various Morgan Stanley Funds (June 1998-March 2000) and Principal, Morgan Stanley & Co. Inc. and Morgan Stanley Dean Witter Investment Management (August 1997-December 1999). | | | 88 | | | Director of certain investment funds managed or sponsored by Aetos Capital, LLC; Director of Sanitized AG and Sanitized Marketing AG (specialty chemicals). | |
Patricia Maleski (57)
c/o Perkins Coie LLP
Counsel to the Independent Directors
30 Rockefeller Plaza
New York, NY 10112 | | Director | | Since
January
2017 | | Managing Director, JPMorgan Asset Management (2004-2016); Oversight and Control Head of Fiduciary and Conflicts of Interest Program (2015-2016); Chief Control Officer-Global Asset Management (2013-2015); President, JPMorgan Funds (2010-2013); Chief Administrative Officer (2004-2013); various other positions including Treasurer and Board Liaison (since 2001). | | | 90 | | | None. | |
Michael E. Nugent (81)
522 Fifth Avenue
New York, NY 10036 | | Chair of the Board and Director | | Chair of the Boards since July 2006 and Director since July 1991 | | Chair of the Boards of various Morgan Stanley Funds (since July 2006); Chairperson of the Closed-End Fund Committee (since June 2012) and Director or Trustee of various Morgan Stanley Funds (since July 1991); formerly, Chairperson of the Insurance Committee (until July 2006); General Partner, Triumph Capital, L.P. (private investment partnership) (1988-2013). | | | 88 | | | None. | |
W. Allen Reed (70)
c/o Perkins Coie LLP
Counsel to the Independent Directors
30 Rockefeller Plaza
New York, NY 10112 | | Director | | Since
August
2006 | | Chairperson of the Equity Sub-Committee of the Investment Committee (since October 2006) and Director or Trustee of various Morgan Stanley Funds (since August 2006); formerly, President and CEO of General Motors Asset Management; Chairman and Chief Executive Officer of the GM Trust Bank and Corporate Vice President of General Motors Corporation (August 1994-December 2005). | | | 89 | | | Director of Legg Mason, Inc.; formerly, Director of the Auburn University Foundation (2010-2015). | |
Fergus Reid (85)
c/o Joe Pietryka, Inc.
85 Charles Colman Blvd.
Pawling, NY 12564 | | Director | | Since
June
1992 | | Chairman, Joe Pietryka, Inc.; Chairperson of the Governance Committee and Director or Trustee of various Morgan Stanley Funds (since June 1992). | | | 89 | | | Formerly, Trustee and Director of certain investment companies in the JP Morgan Fund Complex managed by JP Morgan Investment Management Inc. (1987-2012). | |
* This is the earliest date the Director began serving the Morgan Stanley Funds. Each Director serves an indefinite term, until his or her successor is elected.
** The Fund Complex includes (as of December 31, 2017) all open-end and closed-end funds (including all of their portfolios) advised by Morgan Stanley Investment Management Inc. (the "Adviser") and any funds that have an adviser that is an affiliated person of the Adviser (including, but not limited to, Morgan Stanley AIP GP LP).
*** This includes any directorships at public companies and registered investment companies held by the Director at any time during the past five years.
36
Morgan Stanley Institutional Fund, Inc.
Annual Report — December 31, 2017
Director and Officer Information (unaudited) (cont'd)
Executive Officers:
Name, Age and Address of Executive Officer | | Position(s) Held
with
Registrant | | Length of Time
Served* | | Principal Occupation(s) During Past 5 Years | |
John H. Gernon (54)
522 Fifth Avenue
New York, NY 10036 | | President and Principal Executive Officer | | Since
September
2013 | | President and Principal Executive Officer of the Equity and Fixed Income Funds and the Morgan Stanley AIP Funds (since September 2013) and the Liquidity Funds and various money market funds (since May 2014) in the Fund Complex; Managing Director of the Adviser; Head of Product (since 2006). | |
Timothy J. Knierim (58)
522 Fifth Avenue
New York, NY 10036 | | Chief Compliance Officer | | Since
December
2016 | | Managing Director of the Adviser and various entities affiliated with the Adviser; Chief Compliance Officer of various Morgan Stanley Funds and the Adviser (since December 2016) and Chief Compliance Officer of Morgan Stanley AIP GP LP (since 2014). Formerly, Managing Director and Deputy Chief Compliance Officer of the Adviser (2014-2016); and formerly, Chief Compliance Officer of Prudential Investment Management, Inc. (2007-2014). | |
Francis J. Smith (52)
522 Fifth Avenue
New York, NY 10036 | | Treasurer and Principal Financial Officer | | Treasurer since July 2003 and Principal Financial Officer since September 2002 | | Managing Director of the Adviser and various entities affiliated with the Adviser; Treasurer (since July 2003) and Principal Financial Officer of various Morgan Stanley Funds (since September 2002). | |
Mary E. Mullin (50)
522 Fifth Avenue
New York, NY 10036 | | Secretary | | Since
June
1999 | | Managing Director of the Adviser; Secretary of various Morgan Stanley Funds (since June 1999). | |
Michael J. Key (38)
522 Fifth Avenue
New York, NY 10036 | | Vice President | | Since
June
2017 | | Vice President of the Equity and Fixed Income Funds, Liquidity Funds, various money market funds and the Morgan Stanley AIP Funds in the Fund Complex (since June 2017); Executive Director of the Adviser; Head of Product Development for Equity and Fixed Income Funds (since August 2013). | |
* This is the earliest date the officer began serving the Morgan Stanley Funds. Each officer serves a one-year term, until his or her successor is elected and qualifies.
37
Morgan Stanley Institutional Fund, Inc.
Annual Report — December 31, 2017
Adviser and Administrator
Morgan Stanley Investment Management Inc.
522 Fifth Avenue
New York, New York 10036
Sub-Adviser
Morgan Stanley Investment Management Company
23 Church Street
16-01 Capital Square, Singapore 049481
Distributor
Morgan Stanley Distribution, Inc.
522 Fifth Avenue
New York, New York 10036
Dividend Disbursing and Transfer Agent
DST Asset Manager Solutions, Inc.
2000 Crown Colony Drive
Quincy, Massachusetts 02169
Custodian
State Street Bank and Trust Company
One Lincoln Street
Boston, Massachusetts 02111
Legal Counsel
Dechert LLP
1095 Avenue of the Americas
New York, New York 10036
Counsel to the Independent Directors
Perkins Coie LLP
30 Rockefeller Plaza
New York, New York 10112
Independent Registered Public Accounting Firm
Ernst & Young LLP
200 Clarendon Street
Boston, Massachusetts 02116
Reporting to Shareholders
Each Morgan Stanley Fund provides a complete schedule of portfolio holdings in its semi-annual and annual reports within 60 days of the end of the fund's second and fourth fiscal quarters. The semi-annual and annual reports are filed electronically with the Securities and Exchange Commission (SEC) on Form N-CSRS and Form N-CSR, respectively. Morgan Stanley also delivers the semi-annual and annual reports to fund shareholders and makes these reports available on its public website, www.morganstanley.com/im. Each Morgan Stanley fund also files a complete schedule of portfolio holdings with the SEC for the fund's first and third fiscal quarters on Form N-Q. Morgan Stanley does not deliver the reports for the first and third fiscal quarters to shareholders, nor are the reports posted to the Morgan Stanley public website. You may, however, obtain the Form N-Q filings (as well as the Form N-CSR and N-CSRS filings) by accessing the SEC's website, www.sec.gov. You may also review and copy them at the SEC's Public Reference Room in Washington, DC. Information on the operation of the SEC's Public Reference Room may be obtained by calling the SEC toll free at 1 (800) SEC-0330. You can also request copies of these materials, upon payment of a duplicating fee, by electronic request at the SEC's email address (publicinfo@sec.gov) or by writing to the SEC's Public Reference Section, Washington, D.C. 20549-1520.
Proxy Voting Policies and Procedures and Proxy Voting Record
You may obtain a copy of the Company's Proxy Voting Policy and Procedures and information regarding how the Company voted proxies relating to portfolio securities during the most recent twelve-month period ended June 30, without charge, upon request, by calling toll free 1 (800) 548-7786 or by visiting our website at www.morganstanley.com/im. This information is also available on the SEC's website at www.sec.gov.
This report is authorized for distribution only when preceded or accompanied by a prospectus or summary prospectus of the applicable Fund of Morgan Stanley Institutional Fund, Inc., which describes in detail the Fund's investment policies, risks, fees and expenses. Please read the prospectus carefully before you invest or send money. For additional information, including information regarding the investments comprising the Fund, please visit our website at www.morganstanley.com/im or call toll free 1 (800) 548-7786.
38
Printed in U.S.A.
This Report has been prepared for shareholders and may be distributed to others only if preceded or accompanied by a current prospectus.
Morgan Stanley Investment Management Inc.
522 Fifth Avenue
New York, New York 10036
© 2018 Morgan Stanley. Morgan Stanley Distribution, Inc.

IFIEMANN
2007383 EXP. 02.28.19

Morgan Stanley Institutional Fund, Inc.
Emerging Markets Small Cap Portfolio
Annual Report
December 31, 2017

Morgan Stanley Institutional Fund, Inc.
Annual Report — December 31, 2017
Shareholders' Letter | | | 2 | | |
Expense Example | | | 3 | | |
Investment Overview | | | 4 | | |
Portfolio of Investments | | | 7 | | |
Statement of Assets and Liabilities | | | 9 | | |
Statement of Operations | | | 11 | | |
Statements of Changes in Net Assets | | | 12 | | |
Financial Highlights | | | 13 | | |
Notes to Financial Statements | | | 17 | | |
Report of Independent Registered Public Accounting Firm | | | 24 | | |
Federal Tax Notice | | | 25 | | |
Privacy Notice | | | 26 | | |
Director and Officer Information | | | 29 | | |
This report is authorized for distribution only when preceded or accompanied by a prospectus or summary prospectus of the applicable Fund of Morgan Stanley Institutional Fund, Inc. To receive a prospectus and/or statement of additional information (SAI), which contains more complete information such as investment objectives, charges, expenses, policies for voting proxies, risk considerations, and describes in detail each of the Fund's investment policies to the prospective investor, please call toll free 1 (800) 548-7786. Please read the prospectuses carefully before you invest or send money.
Additionally, you can access information about the Fund, including performance, characteristics, and investment team commentary, through Morgan Stanley Investment Management's website: www.morganstanley.com/im.
Market forecasts provided in this report may not necessarily come to pass. There is no guarantee that any sectors mentioned will continue to perform as discussed herein or that securities in such sectors will be held by the Fund in the future. There is no assurance that a fund will achieve its investment objective. Funds are subject to market risk, which is the possibility that market values of securities owned by the Fund will decline and, therefore, the value of the Fund's shares may be less than what you paid for them. Accordingly, you can lose money investing in this Fund. Please see the prospectus for more complete information on investment risks.
1
Morgan Stanley Institutional Fund, Inc.
Annual Report — December 31, 2017
Shareholders' Letter (unaudited)
Dear Shareholders,
We are pleased to provide this Annual report, in which you will learn how your investment in Emerging Markets Small Cap Portfolio (the "Fund") performed during the latest twelve-month period.
Morgan Stanley Investment Management is a client-centric, investor-led organization. Our global presence, intellectual capital, and breadth of products and services enable us to partner with investors to meet the evolving challenges of today's financial markets. We aim to deliver superior investment service and to empower our clients to make the informed decisions that help them reach their investment goals.
As always, we thank you for selecting Morgan Stanley Investment Management, and look forward to working with you in the months and years ahead.
Sincerely,

John H. Gernon
President and Principal Executive Officer
January 2018
2
Morgan Stanley Institutional Fund, Inc.
Annual Report — December 31, 2017
Expense Example (unaudited)
Emerging Markets Small Cap Portfolio
As a shareholder of the Fund, you incur two types of costs: (1) transactional costs, including redemption fees; and (2) ongoing costs, which may include advisory fees, administration fees, distribution and shareholder services fees and other Fund expenses. This example is intended to help you understand your ongoing costs (in dollars) of investing in the Fund and to compare these costs with the ongoing costs of investing in other mutual funds.
This example is based on an investment of $1,000 invested at the beginning of the six-month period ended December 31, 2017 and held for the entire six-month period.
Actual Expenses
The table below provides information about actual account values and actual expenses. You may use the information in this table, together with the amount you invested, to estimate the expenses that you paid over the period. Simply divide your account value by $1,000 (for example, an $8,600 account value divided by $1,000 = 8.6), then multiply the result by the number in the table under the heading entitled "Actual Expenses Paid During Period" to estimate the expenses you paid on your account during this period.
Hypothetical Example for Comparison Purposes
The table below provides information about hypothetical account values and hypothetical expenses based on the Fund's actual expense ratio and an assumed rate of return of 5% per year before expenses, which is not the Fund's actual return. The hypothetical account values and expenses may not be used to estimate the actual ending account balance or expenses you paid for the period. You may use this information to compare the ongoing costs of investing in the Fund and other funds. To do so, compare this 5% hypothetical example with the 5% hypothetical examples that appear in the shareholder reports of the other funds.
Please note that the expenses shown in the table are meant to highlight your ongoing costs only and do not reflect any transactional costs, such as sales charges (loads) and redemption fees. Therefore, the information for each class in the table is useful in comparing ongoing costs only, and will not help you determine the relative total costs of owning different funds. In addition, if these transactional costs were included, your costs would have been higher.
| | | Beginning
Account
Value
7/1/17 | | Actual Ending
Account
Value
12/31/17 | | Hypothetical
Ending Account
Value | | Actual
Expenses
Paid
During
Period* | | Hypothetical
Expenses Paid
During Period* | | Net
Expense
Ratio
During
Period** | |
Emerging Markets Small Cap Portfolio Class I | | $ | 1,000.00 | | | $ | 1,141.30 | | | $ | 1,017.24 | | | $ | 8.53 | | | $ | 8.03 | | | | 1.58 | % | |
Emerging Markets Small Cap Portfolio Class A | | | 1,000.00 | | | | 1,140.00 | | | | 1,015.27 | | | | 10.63 | | | | 10.01 | | | | 1.97 | | |
Emerging Markets Small Cap Portfolio Class C | | | 1,000.00 | | | | 1,135.50 | | | | 1,011.49 | | | | 14.64 | | | | 13.79 | | | | 2.72 | | |
Emerging Markets Small Cap Portfolio Class IS | | | 1,000.00 | | | | 1,142.30 | | | | 1,017.29 | | | | 8.48 | | | | 7.98 | | | | 1.57 | | |
* Expenses are calculated using each Fund Class' annualized net expense ratio (as disclosed), multiplied by the average account value over the period, and multiplied by 184/365 (to reflect the most recent one-half year period).
** Annualized.
3
Morgan Stanley Institutional Fund, Inc.
Annual Report — December 31, 2017
Investment Overview (unaudited)
Emerging Markets Small Cap Portfolio
The Fund seeks long-term capital appreciation.
Performance
For the year ended December 31, 2017, the Fund's Class I shares had a total return based on net asset value and reinvestment of distributions per share of 34.29%, net of fees. The Fund's Class I shares outperformed the Fund's benchmark, the MSCI Emerging Markets Small Cap Net Index (the "Index"), which returned 33.84%.
Please keep in mind that double-digit returns are highly unusual and cannot be sustained. Investors should also be aware that these returns were primarily achieved during favorable market conditions.
Factors Affecting Performance
• Emerging markets (EM) small-cap equities underperformed during the one-year period ending December 31, 2017, with the Index returning 33.84% versus the MSCI Emerging Markets Index's return of 37.28%.
• The strong EM equity rally in 2017 is notable for several reasons. As with the U.S. bull market in 2017, technology companies within EM have dominated the surge. On both a sector and country basis, leadership has been historically narrow and it is the first year in almost two decades that leadership has not been driven by commodity prices.(i) Further, volatility has been extremely low and the minor 5% drawdown in 2017 was the smallest in EM since 1993.(ii)
• Positive contributors to the Fund's performance during the period included our stock selection in and underweight allocation to China and our allocation to Argentina. Stock selection in Poland and Thailand were also strong contributors. Our underweight allocation to and stock selection in Qatar also contributed. Our stock selection in Malaysia and underweight allocation to Russia added to returns.
• Key detractors from performance included the Fund's stock selection in and overweight allocation to Pakistan. Stock selection in and underweight allocations to Taiwan and Korea were also the main detractors. Stock selection in Brazil and Egypt
hampered returns. While our stock selection in the Philippines was positive for performance, gains were more than offset by our overweight allocation to the country.
• From a sector perspective, our stock selection in consumer discretionary and utilities contributed to returns. Our stock selection in consumer staples was strong, but gains were partially offset by our overweight allocation to the sector, which detracted. Our underweight allocation to information technology detracted from returns, as the sector was the best-performing sector in both the MSCI Emerging Markets Index and the benchmark Index. Our stock selection in health care and financials also hampered returns.
Management Strategies
• A bullish case can be made that the leading EM tech stocks still have enormous room to grow. We are very careful in our stock selection within the sector. The question, however, is whether tech stocks will remain the only game in global markets, as seemed to be the case for much of last year. 2017 was a year of unusually low volatility, accompanied by abnormally intense concentration both in the U.S. and emerging markets. Whether we look at emerging markets returns by country, sector or company, they were unusually concentrated on one bet — the big tech firms, particularly from China.
• Historically, when markets become this stretched, they tend to snap back into some semblance of balance. That snap could produce the first significant corrections in many months. But it could also produce a shift toward sectors and countries that have been overlooked and have underperformed as investors were all-consumed by the tech story. The time seems ripe for a shift, given that the global recovery has been unusually broad, lifting every major economy out of the doldrums, and creating potential opportunity in many sectors.
• What keeps EM equities in good health as an asset class — even if they do experience a drawdown — is that for EM in aggregate, the EM current account is in surplus and the capital account is no longer negative, placing the asset class in better shape to
(i) Source: Morgan Stanley Investment Management, FactSet and Haver Analytics
(ii) Source: Morgan Stanley Investment Management, Bloomberg L.P. and FactSet
4
Morgan Stanley Institutional Fund, Inc.
Annual Report — December 31, 2017
Investment Overview (unaudited) (cont'd)
Emerging Markets Small Cap Portfolio
sustain what has been a gradually rising U.S. interest rate environment. This has been a well-signaled U.S. rate hike cycle and the Federal Reserve's moves have been only 25 basis points at a time — in sharp contrast to the abrupt and larger rate hikes that occurred in the 1990s and early 2000s.
• With all this in mind, we are constructive on those EM financials benefiting from underpenetrated credit markets and favorable interest rate environments in individual countries and on companies benefiting from healthy domestic demand, particularly in regard to health care, travel and leisure, and select consumer discretionary and staples.
• On a country basis, we continue to be overweight Eastern Europe, Brazil, the Philippines and Indonesia on various factors including healthy domestic demand, underpenetrated credit and the economic benefits of selective reform. We are underweight countries with decelerating growth or heavy dependence on exports such as China, Taiwan and Korea.
• We believe Eastern European growth should continue to improve. Western European growth continues to gradually recover, as consumer pent-up demand rebounds from depressed levels and monetary conditions remain loose. Eastern Europe offers exposure to that recovery. The region has competitive currencies and labor markets, and has been gaining market share in global manufactured exports for the past few years. Wage pressure could lead to higher inflation, especially in Poland, Hungary and Romania, which could help nominal gross domestic product (GDP) and earnings growth.
• We remain constructive on the Southeast Asian countries of Indonesia, Malaysia and the Philippines. Indonesia and Malaysia have adjusted to lower commodity prices, leading to better current and fiscal account positions, as well as bottoming GDP growth. The Philippines is one of the highest growing countries in EM, and we think this could translate into superior earnings growth for the equity market. For the region as a whole, fiscal reforms such as subsidy reduction, tax amnesty and a widening of the tax base and infrastructure spending could provide a positive policy backdrop for the equity markets.
5
Morgan Stanley Institutional Fund, Inc.
Annual Report — December 31, 2017
Investment Overview (unaudited) (cont'd)
Emerging Markets Small Cap Portfolio
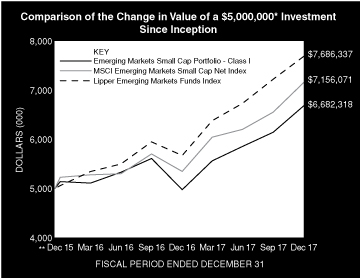
* Minimum Investment for Class I shares
** Commenced Operations on December 15, 2015.
In accordance with SEC regulations, the Fund's performance shown assumes that all recurring fees (including management fees) were deducted and all dividends and distributions were reinvested. The performance of Class A, C and IS shares will vary from the performance of Class I shares and will be impacted by additional fees assessed to those classes (if applicable).
Performance Compared to the MSCI Emerging Markets Small Cap Net Index(1) and the Lipper Emerging Markets Funds Index(2)
| | Period Ended December 31, 2017
Total Returns(3) | |
| | | | Average Annual | |
| | One
Year | | Five
Years | | Ten
Years | | Since
Inception(5) | |
Fund — Class I Shares
w/o sales charges(4) | | | 34.29 | % | | | — | | | | — | | | | 15.25 | % | |
Fund — Class A Shares
w/o sales charges(4) | | | 33.79 | | | | — | | | | — | | | | 14.81 | | |
Fund — Class A Shares with
maximum 5.25% sales charges(4) | | | 26.71 | | | | — | | | | — | | | | 11.84 | | |
Fund — Class C Shares
w/o sales charges(4) | | | 32.70 | | | | — | | | | — | | | | 13.95 | | |
Fund — Class C Shares with
maximum 1.00% deferred
sales charges(4) | | | 31.70 | | | | — | | | | — | | | | 13.95 | | |
Fund — Class IS Shares
w/o sales charges(4) | | | 34.29 | | | | — | | | | — | | | | 15.25 | | |
MSCI Emerging Markets Small
Cap Net Index | | | 33.84 | | | | — | | | | — | | | | 19.18 | | |
Lipper Emerging Markets Funds
Index | | | 35.56 | | | | — | | | | — | | | | 23.40 | | |
Performance data quoted represents past performance, which is no guarantee of future results, and current performance may be lower or higher than the figures shown. Performance assumes that all dividends and distributions, if any, were reinvested. For the most recent month-end performance figures, please visit www.morganstanley.com/im. Investment return and principal value will fluctuate so that Fund shares, when redeemed, may be worth more or less than their original cost. Total returns do not reflect the deduction of taxes that a shareholder would pay on Fund distributions or the redemption of Fund shares. Performance of share classes will vary due to difference in sales charges and expenses.
(1) The MSCI Emerging Markets Small Cap Net Index is a free float-adjusted market capitalization weighted index that is designed to measure small cap equity market performance of emerging markets. The term "free float" represents the portion of shares outstanding that are deemed to be available for purchase in the public equity markets by investors. The performance of the Index is listed in U.S. dollars and assumes reinvestment of net dividends. The Index is unmanaged and its returns do not include any sales charges or fees. Such costs would lower performance. It is not possible to invest directly in an index.
(2) The Lipper Emerging Markets Funds Index is an equally weighted performance index of the largest qualifying funds (based on net assets) in the Lipper Emerging Markets Funds classification. The Index, which is adjusted for capital gains distributions and income dividends, is unmanaged and should not be considered an investment. There are currently 30 funds represented in this Index. As of the date of this report, the Fund is in the Lipper Emerging Markets Funds classification.
(3) Total returns for the Fund reflect fees waived and expenses reimbursed, if applicable, by the Adviser. Without such waivers and reimbursements, total returns would have been lower.
(4) Commenced operations on December 15, 2015.
(5) For comparative purposes, average annual since inception returns listed for the Indexes refer to the inception date of the Fund, not the inception of the Index.
6
Morgan Stanley Institutional Fund, Inc.
Annual Report — December 31, 2017
Portfolio of Investments
Emerging Markets Small Cap Portfolio
| | | Shares | | Value
(000) | |
Common Stocks (96.8%) | |
Argentina (2.6%) | |
Arcos Dorados Holdings, Inc., Class A (a) | | | 32,284 | | | $ | 334 | | |
Grupo Supervielle SA ADR | | | 11,588 | | | | 340 | | |
| | | | 674 | | |
Bangladesh (1.0%) | |
Brac Bank Ltd. | | | 199,912 | | | | 260 | | |
Brazil (7.7%) | |
Banco ABC Brasil SA (Preference) | | | 67,500 | | | | 348 | | |
BK Brasil Operacao e Assessoria a
Restaurantes SA (a) | | | 86,723 | | | | 457 | | |
Linx SA | | | 65,619 | | | | 424 | | |
Localiza Rent a Car SA | | | 42,429 | | | | 282 | | |
Ser Educacional SA (b) | | | 53,273 | | | | 500 | | |
| | | | 2,011 | | |
China (15.3%) | |
51job, Inc. ADR (a)(c) | | | 6,701 | | | | 408 | | |
Bitauto Holdings Ltd. ADR (a)(c) | | | 13,570 | | | | 431 | | |
Canvest Environmental Protection
Group Co., Ltd. (d) | | | 608,000 | | | | 359 | | |
China Mengniu Dairy Co., Ltd. (a)(d) | | | 93,000 | | | | 276 | | |
China New Higher Education Group Ltd. (b)(c)(d) | | | 596,000 | | | | 308 | | |
China Resources Phoenix Healthcare
Holdings Co., Ltd. (c)(d) | | | 183,500 | | | | 232 | | |
NavInfo Co., Ltd., Class A | | | 62,346 | | | | 253 | | |
Tarena International, Inc. ADR | | | 25,293 | | | | 379 | | |
Wanda Film Holding Co., Ltd., Class A (e) | | | 25,696 | | | | 195 | | |
Xiabuxiabu Catering Management China
Holdings Co., Ltd (b)(d) | | | 249,000 | | | | 501 | | |
Yestar Healthcare Holdings Co., Ltd. (c)(d) | | | 700,000 | | | | 297 | | |
Zhou Hei Ya International Holdings Co., Ltd. (b)(d) | | | 310,000 | | | | 325 | | |
| | | | 3,964 | | |
Egypt (2.8%) | |
Credit Agricole Egypt SAE | | | 124,259 | | | | 299 | | |
Egyptian Financial Group-Hermes Holding Co. | | | 265,594 | | | | 352 | | |
Integrated Diagnostics Holdings PLC (b) | | | 16,185 | | | | 76 | | |
| | | | 727 | | |
India (13.6%) | |
Apollo Hospitals Enterprise Ltd. | | | 14,805 | | | | 279 | | |
Can Fin Homes Ltd. | | | 36,290 | | | | 269 | | |
Gulf Oil Lubricants India Ltd. | | | 25,333 | | | | 392 | | |
Indraprastha Gas Ltd. | | | 77,447 | | | | 407 | | |
Inox Leisure Ltd. (a) | | | 99,565 | | | | 456 | | |
Motilal Oswal Financial Services Ltd. | | | 10,930 | | | | 256 | | |
Natco Pharma Ltd. | | | 16,178 | | | | 244 | | |
Persistent Systems Ltd. | | | 24,931 | | | | 280 | | |
Ramco Cements Ltd. (The) | | | 28,204 | | | | 347 | | |
Sterlite Technologies Ltd. | | | 54,078 | | | | 247 | | |
Westlife Development Ltd. (a) | | | 68,611 | | | | 354 | | |
| | | | 3,531 | | |
| | | Shares | | Value
(000) | |
Indonesia (4.5%) | |
Bank Tabungan Negara Persero Tbk PT | | | 1,052,900 | | | $ | 277 | | |
Nippon Indosari Corpindo Tbk PT | | | 2,704,700 | | | | 254 | | |
Semen Indonesia Persero Tbk PT | | | 370,700 | | | | 271 | | |
Sumber Alfaria Trijaya Tbk PT | | | 8,262,200 | | | | 372 | | |
| | | | 1,174 | | |
Korea, Republic of (13.6%) | |
Cosmax, Inc. (a) | | | 2,748 | | | | 300 | | |
Hanwha Techwin Co., Ltd. (a) | | | 7,461 | | | | 248 | | |
Hugel, Inc. (a) | | | 860 | | | | 448 | | |
Innocean Worldwide, Inc. (a) | | | 3,870 | | | | 264 | | |
Koh Young Technology, Inc. (a) | | | 5,459 | | | | 420 | | |
Korea Kolmar Co., Ltd. (a) | | | 6,228 | | | | 476 | | |
LIG Nex1 Co., Ltd. (a) | | | 3,126 | | | | 175 | | |
Loen Entertainment, Inc. (a) | | | 4,309 | | | | 453 | | |
Nasmedia Co., Ltd. (a) | | | 6,115 | | | | 425 | | |
Viatron Technologies, Inc. (a) | | | 17,210 | | | | 332 | | |
| | | | 3,541 | | |
Malaysia (5.8%) | |
BIMB Holdings Bhd | | | 219,500 | | | | 239 | | |
Carlsberg Brewery Malaysia Bhd, Class B | | | 67,100 | | | | 254 | | |
Malaysia Airports Holdings Bhd | | | 153,900 | | | | 335 | | |
My EG Services Bhd | | | 656,200 | | | | 362 | | |
Mynews Holdings Bhd | | | 889,000 | | | | 316 | | |
| | | | 1,506 | | |
Mexico (2.3%) | |
Alsea SAB de CV | | | 79,774 | | | | 261 | | |
Banregio Grupo Financiero SAB de CV | | | 55,858 | | | | 306 | | |
Unifin Financiera SAB de CV SOFOM ENR | | | 10,150 | | | | 35 | | |
| | | | 602 | | |
Pakistan (0.1%) | |
Maple Leaf Cement Factory Ltd. | | | 31,627 | | | | 20 | | |
Philippines (3.1%) | |
Megawide Construction Corp. | | | 869,500 | | | | 314 | | |
Security Bank Corp. | | | 49,510 | | | | 249 | | |
Shakey's Pizza Asia Ventures, Inc. | | | 951,900 | | | | 256 | | |
| | | | 819 | | |
Poland (3.9%) | |
CCC SA | | | 3,804 | | | | 310 | | |
Dino Polska SA (a)(b) | | | 17,310 | | | | 391 | | |
mBank SA (a) | | | 2,250 | | | | 301 | | |
| | | | 1,002 | | |
Qatar (1.2%) | |
Qatar Insurance Co., SAQ | | | 21,367 | | | | 315 | | |
South Africa (1.1%) | |
AVI Ltd. | | | 33,217 | | | | 296 | | |
Taiwan (13.6%) | |
Bizlink Holding, Inc. | | | 27,000 | | | | 252 | | |
Bon Fame Co., Ltd. | | | 75,000 | | | | 181 | | |
Cub Elecparts, Inc. | | | 42,010 | | | | 386 | | |
Gourmet Master Co., Ltd. | | | 32,320 | | | | 472 | | |
The accompanying notes are an integral part of the financial statements.
7
Morgan Stanley Institutional Fund, Inc.
Annual Report — December 31, 2017
Portfolio of Investments (cont'd)
Emerging Markets Small Cap Portfolio
| | | Shares | | Value
(000) | |
Taiwan (cont'd) | |
King Slide Works Co., Ltd. | | | 18,000 | | | $ | 242 | | |
Nien Made Enterprise Co., Ltd. | | | 34,000 | | | | 363 | | |
Poya International Co., Ltd. | | | 29,492 | | | | 369 | | |
President Chain Store Corp. | | | 28,000 | | | | 267 | | |
Taiwan Secom Co., Ltd. | | | 78,000 | | | | 240 | | |
TCI Co., Ltd. | | | 47,343 | | | | 458 | | |
Voltronic Power Technology Corp. | | | 17,000 | | | | 294 | | |
| | | | 3,524 | | |
Thailand (3.3%) | |
Mega Lifesciences PCL (Foreign) | | | 384,600 | | | | 518 | | |
Muangthai Leasing PCL (Foreign) | | | 290,600 | | | | 345 | | |
| | | | 863 | | |
United Kingdom (1.3%) | |
DP Eurasia N.V. (a)(b) | | | 115,930 | | | | 337 | | |
Total Common Stocks (Cost $20,191) | | | 25,166 | | |
Short-Term Investments (5.5%) | |
Securities held as Collateral on Loaned Securities (2.3%) | |
Investment Company (2.3%) | |
Morgan Stanley Institutional Liquidity
Funds — Government Portfolio —
Institutional Class (See Note G)
(Cost $602) | | | 602,332 | | | | 602 | | |
Investment Company (3.2%) | |
Morgan Stanley Institutional Liquidity
Funds — Government Portfolio —
Institutional Class (See Note G)
(Cost $822) | | | 821,641 | | | | 822 | | |
Total Short-Term Investments (Cost $1,424) | | | 1,424 | | |
Total Investments (102.3%) (Cost $21,615)
Including $1,055 of Securities Loaned (f)(g) | | | 26,590 | | |
Liabilities in Excess of Other Assets (–2.3%) | | | (603 | ) | |
Net Assets (100.0%) | | $ | 25,987 | | |
Country assignments and aggregations are based generally on third party vendor classifications and information, and may be different from the assignments and aggregations under the policies set forth in the Fund's prospectus and/or statement of additional information relating to geographic classifications.
(a) Non-income producing security.
(b) 144A security — Certain conditions for public sale may exist. Unless otherwise noted, these securities are deemed to be liquid.
(c) All or a portion of this security was on loan at December 31, 2017.
(d) Security trades on the Hong Kong exchange.
(e) Security has been deemed illiquid at December 31, 2017.
(f) The approximate fair value and percentage of net assets, $21,156,000 and 81.4%, respectively, represent the securities that have been fair valued under the fair valuation policy for international investments as described in Note A-1 within the Notes to the Financial Statements.
(g) At December 31, 2017, the aggregate cost for federal income tax purposes is approximately $21,618,000. The aggregate gross unrealized appreciation is approximately $5,573,000 and the aggregate gross unrealized depreciation is approximately $601,000, resulting in net unrealized appreciation of approximately $4,972,000.
ADR American Depositary Receipt.
Portfolio Composition*
Classification | | Percentage of
Total Investments | |
Other** | | | 71.6 | % | |
Hotels, Restaurants & Leisure | | | 11.4 | | |
Banks | | | 10.1 | | |
Media | | | 6.9 | | |
Total Investments | | | 100.0 | % | |
* Percentages indicated are based upon total investments (excluding Securities held as Collateral on Loaned Securities) as of December 31, 2017.
** Industries and/or investment types representing less than 5% of total investments.
The accompanying notes are an integral part of the financial statements.
8
Morgan Stanley Institutional Fund, Inc.
Annual Report — December 31, 2017
Emerging Markets Small Cap Portfolio
Statement of Assets and Liabilities | | December 31, 2017
(000) | |
Assets: | |
Investments in Securities of Unaffiliated Issuers, at Value(1) (Cost $20,191) | | $ | 25,166 | | |
Investment in Security of Affiliated Issuer, at Value (Cost $1,424) | | | 1,424 | | |
Total Investments in Securities, at Value (Cost $21,615) | | | 26,590 | | |
Foreign Currency, at Value (Cost $33) | | | 33 | | |
Receivable for Fund Shares Sold | | | 101 | | |
Receivable for Investments Sold | | | 20 | | |
Due from Adviser | | | 14 | | |
Dividends Receivable | | | 8 | | |
Receivable from Securities Lending Income | | | 3 | | |
Tax Reclaim Receivable | | | — | @ | |
Receivable from Affiliate | | | — | @ | |
Other Assets | | | 45 | | |
Total Assets | | | 26,814 | | |
Liabilities: | |
Collateral on Securities Loaned, at Value | | | 602 | | |
Deferred Capital Gain Country Tax | | | 98 | | |
Payable for Professional Fees | | | 51 | | |
Payable for Custodian Fees | | | 34 | | |
Payable for Investments Purchased | | | 25 | | |
Payable for Administration Fees | | | 2 | | |
Payable for Transfer Agency Fees — Class I | | | 1 | | |
Payable for Transfer Agency Fees — Class A | | | 1 | | |
Payable for Transfer Agency Fees — Class C | | | — | @ | |
Payable for Shareholder Services Fees — Class A | | | — | @ | |
Payable for Distribution and Shareholder Services Fees — Class C | | | — | @ | |
Payable for Sub Transfer Agency Fees — Class A | | | — | @ | |
Payable for Sub Transfer Agency Fees — Class C | | | — | @ | |
Other Liabilities | | | 13 | | |
Total Liabilities | | | 827 | | |
Net Assets | | $ | 25,987 | | |
Net Assets Consist of: | |
Paid-in-Capital | | $ | 20,322 | | |
Accumulated Net Investment Loss | | | (103 | ) | |
Accumulated Undistributed Net Realized Gain | | | 890 | | |
Unrealized Appreciation (Depreciation) on: | |
Investments (Net of $97 of Deferred Capital Gain Country Tax) | | | 4,878 | | |
Foreign Currency Translations | | | (— | @) | |
Net Assets | | $ | 25,987 | | |
The accompanying notes are an integral part of the financial statements.
9
Morgan Stanley Institutional Fund, Inc.
Annual Report — December 31, 2017
Emerging Markets Small Cap Portfolio
Statement of Assets and Liabilities (cont'd) | | December 31, 2017
(000) | |
CLASS I: | |
Net Assets | | $ | 25,762 | | |
| Shares Outstanding $0.001 par value shares of beneficial interest (unlimited shares authorized) (not in 000's) | | | 2,016,653 | | |
Net Asset Value, Offering and Redemption Price Per Share | | $ | 12.77 | | |
CLASS A: | |
Net Assets | | $ | 188 | | |
| Shares Outstanding $0.001 par value shares of beneficial interest (unlimited shares authorized) (not in 000's) | | | 14,752 | | |
Net Asset Value, Redemption Price Per Share | | $ | 12.72 | | |
Maximum Sales Load | | | 5.25 | % | |
Maximum Sales Charge | | $ | 0.70 | | |
Maximum Offering Price Per Share | | $ | 13.42 | | |
CLASS C: | |
Net Assets | | $ | 24 | | |
| Shares Outstanding $0.001 par value shares of beneficial interest (unlimited shares authorized) (not in 000's) | | | 1,887 | | |
Net Asset Value, Offering and Redemption Price Per Share | | $ | 12.60 | | |
CLASS IS: | |
Net Assets | | $ | 13 | | |
| Shares Outstanding $0.001 par value shares of beneficial interest (unlimited shares authorized) (not in 000's) | | | 1,000 | | |
Net Asset Value, Offering and Redemption Price Per Share | | $ | 12.77 | | |
(1) Including:
Securities on Loan, at Value: | | $ | 1,055 | | |
@ Amount is less than $500.
The accompanying notes are an integral part of the financial statements.
10
Morgan Stanley Institutional Fund, Inc.
Annual Report — December 31, 2017
Emerging Markets Small Cap Portfolio
Statement of Operations | | Year Ended
December 31, 2017
(000) | |
Investment Income: | |
Dividends from Securities of Unaffiliated Issuers (Net of $36 of Foreign Taxes Withheld) | | $ | 285 | | |
Income from Securities Loaned — Net | | | 29 | | |
Dividends from Securities of Affiliated Issuer (Note G) | | | 27 | | |
Total Investment Income | | | 341 | | |
Expenses: | |
Advisory Fees (Note B) | | | 289 | | |
Professional Fees | | | 137 | | |
Custodian Fees (Note F) | | | 52 | | |
Registration Fees | | | 50 | | |
Administration Fees (Note C) | | | 19 | | |
Shareholder Reporting Fees | | | 14 | | |
Transfer Agency Fees — Class I (Note E) | | | 2 | | |
Transfer Agency Fees — Class A (Note E) | | | 2 | | |
Transfer Agency Fees — Class C (Note E) | | | 2 | | |
Transfer Agency Fees — Class IS (Note E) | | | 2 | | |
Pricing Fees | | | 8 | | |
Directors' Fees and Expenses | | | 4 | | |
Shareholder Services Fees — Class A (Note D) | | | — | @ | |
Distribution and Shareholder Services Fees — Class C (Note D) | | | — | @ | |
Sub Transfer Agency Fees — Class A | | | — | @ | |
Sub Transfer Agency Fees — Class C | | | — | @ | |
Other Expenses | | | 22 | | |
Total Expenses | | | 603 | | |
Waiver of Advisory Fees (Note B) | | | (225 | ) | |
Rebate from Morgan Stanley Affiliate (Note G) | | | (10 | ) | |
Reimbursement of Class Specific Expenses — Class A (Note B) | | | (2 | ) | |
Reimbursement of Class Specific Expenses — Class C (Note B) | | | (2 | ) | |
Reimbursement of Class Specific Expenses — Class IS (Note B) | | | (2 | ) | |
Net Expenses | | | 362 | | |
Net Investment Loss | | | (21 | ) | |
Realized Gain (Loss): | |
Investments Sold (Net of $55 of Capital Gain Country Tax) | | | 2,270 | | |
Investments in Affiliate | | | 328 | | |
Foreign Currency Transactions | | | (8 | ) | |
Net Realized Gain | | | 2,590 | | |
Change in Unrealized Appreciation (Depreciation): | |
Investments (Net of Increase in Deferred Capital Gain Country Tax of $44) | | | 4,198 | | |
Investments in Affiliate | | | (22 | ) | |
Foreign Currency Translations | | | — | @ | |
Net Change in Unrealized Appreciation (Depreciation) | | | 4,176 | | |
Net Realized Gain and Change in Unrealized Appreciation (Depreciation) | | | 6,766 | | |
Net Increase in Net Assets Resulting from Operations | | $ | 6,745 | | |
@ Amount is less than $500.
The accompanying notes are an integral part of the financial statements.
11
Morgan Stanley Institutional Fund, Inc.
Annual Report — December 31, 2017
Emerging Markets Small Cap Portfolio
Statements of Changes in Net Assets | | Year Ended
December 31, 2017
(000) | | Year Ended
December 31, 2016
(000) | |
Increase (Decrease) in Net Assets: | |
Operations: | |
Net Investment Income (Loss) | | $ | (21 | ) | | $ | 32 | | |
Net Realized Gain (Loss) | | | 2,590 | | | | (821 | ) | |
Net Change in Unrealized Appreciation (Depreciation) | | | 4,176 | | | | 127 | | |
Net Increase (Decrease) in Net Assets Resulting from Operations | | | 6,745 | | | | (662 | ) | |
Distributions from and/or in Excess of: | |
Class I: | |
Net Investment Income | | | — | | | | (201 | ) | |
Net Realized Gain | | | (891 | ) | | | — | | |
Class A: | |
Net Investment Income | | | — | | | | (— | @) | |
Net Realized Gain | | | (1 | ) | | | — | | |
Class C: | |
Net Realized Gain | | | (— | @) | | | — | | |
Class IS: | |
Net Investment Income | | | — | | | | (— | @) | |
Net Realized Gain | | | (— | @) | | | — | | |
Total Distributions | | | (892 | ) | | | (201 | ) | |
Capital Share Transactions: (1) | |
Class I: | |
Subscribed | | | 247 | | | | — | | |
Distributions Reinvested | | | 2 | | | | — | | |
Class A: | |
Subscribed | | | 172 | | | | — | | |
Distributions Reinvested | | | — | @ | | | — | | |
Redeemed | | | (1 | ) | | | — | | |
Class C: | |
Subscribed | | | 11 | | | | — | | |
Distributions Reinvested | | | — | @ | | | — | | |
Net Increase in Net Assets Resulting from Capital Share Transactions | | | 431 | | | | — | | |
Total Increase (Decrease) in Net Assets | | | 6,284 | | | | (863 | ) | |
Net Assets: | |
Beginning of Period | | | 19,703 | | | | 20,566 | | |
End of Period (Including Accumulated Net Investment Loss of
$(103) and $(148)) | | $ | 25,987 | | | $ | 19,703 | | |
(1) Capital Share Transactions: | |
Class I: | |
Shares Subscribed | | | 20 | | | | — | | |
Shares Issued on Distributions Reinvested | | | — | @@ | | | — | | |
Net Increase in Class I Shares Outstanding | | | 20 | | | | — | | |
Class A: | |
Shares Subscribed | | | 14 | | | | — | | |
Shares Issued on Distributions Reinvested | | | — | @@ | | | — | | |
Shares Redeemed | | | (— | @@) | | | — | | |
Net Increase in Class A Shares Outstanding | | | 14 | | | | — | | |
Class L: | |
Class C: | |
Shares Subscribed | | | 1 | | | | — | | |
Shares Issued on Distributions Reinvested | | | — | @@ | | | — | | |
Net Increase in Class C Shares Outstanding | | | 1 | | | | — | | |
@ Amount is less than $500.
@@ Amount is less than 500 shares.
The accompanying notes are an integral part of the financial statements.
12
Morgan Stanley Institutional Fund, Inc.
Annual Report — December 31, 2017
Financial Highlights
Emerging Markets Small Cap Portfolio
| | | Class I | |
| | | Year Ended December 31, | | Period from
December 15, 2015(1) to | |
Selected Per Share Data and Ratios | | 2017 | | 2016 | | December 31, 2015 | |
Net Asset Value, Beginning of Period | | $ | 9.85 | | | $ | 10.28 | | | $ | 10.00 | | |
Income (Loss) from Investment Operations: | |
Net Investment Income (Loss)(2) | | | (0.01 | ) | | | 0.02 | | | | 0.01 | | |
Net Realized and Unrealized Gain (Loss) | | | 3.38 | | | | (0.35 | ) | | | 0.27 | | |
Total from Investment Operations | | | 3.37 | | | | (0.33 | ) | | | 0.28 | | |
Distributions from and/or in Excess of: | |
Net Investment Income | | | — | | | | (0.10 | ) | | | — | | |
Net Realized Gain | | | (0.45 | ) | | | — | | | | — | | |
Total Distributions | | | (0.45 | ) | | | (0.10 | ) | | | — | | |
Net Asset Value, End of Period | | $ | 12.77 | | | $ | 9.85 | | | $ | 10.28 | | |
Total Return(3) | | | 34.29 | % | | | (3.19 | )% | | | 2.80 | %(6) | |
Ratios and Supplemental Data: | |
Net Assets, End of Period (Thousands) | | $ | 25,762 | | | $ | 19,673 | | | $ | 20,536 | | |
Ratio of Expenses to Average Net Assets(8) | | | 1.57 | %(4) | | | 1.61 | %(4) | | | 1.58 | %(4)(7) | |
Ratio of Net Investment Income (Loss) to Average Net Assets(8) | | | (0.09 | )%(4) | | | 0.16 | %(4) | | | 1.01 | %(4)(7) | |
Ratio of Rebate from Morgan Stanley Affiliates to Average Net Assets | | | 0.04 | % | | | 0.00 | %(5) | | | 0.03 | %(7) | |
Portfolio Turnover Rate | | | 71 | % | | | 69 | % | | | 5 | %(6) | |
(8) Supplemental Information on the Ratios to Average Net Assets: | |
Ratios Before Expense Limitation: | |
Expenses to Average Net Assets | | | 2.58 | % | | | 2.63 | % | | | 7.62 | %(7) | |
Net Investment Loss to Average Net Assets | | | (1.10 | )% | | | (0.86 | )% | | | (5.03 | )%(7) | |
(1) Commencement of Operations.
(2) Per share amount is based on average shares outstanding.
(3) Calculated based on the net asset value as of the last business day of the period.
(4) The Ratios of Expenses and Net Investment Income (Loss) reflect the rebate of certain Fund expenses in connection with the investments in Morgan Stanley affiliates during the period. The effect of the rebate on the ratios is disclosed in the above table as "Ratio of Rebate from Morgan Stanley Affiliates to Average Net Assets."
(5) Amount is less than 0.005%.
(6) Not annualized.
(7) Annualized.
The accompanying notes are an integral part of the financial statements.
13
Morgan Stanley Institutional Fund, Inc.
Annual Report — December 31, 2017
Financial Highlights
Emerging Markets Small Cap Portfolio
| | | Class A | |
| | | Year Ended December 31, | | Period from
December 15, 2015(1) to | |
Selected Per Share Data and Ratios | | 2017 | | 2016 | | December 31, 2015 | |
Net Asset Value, Beginning of Period | | $ | 9.85 | | | $ | 10.28 | | | $ | 10.00 | | |
Income (Loss) from Investment Operations: | |
Net Investment Income (Loss)(2) | | | (0.06 | ) | | | (0.02 | ) | | | 0.00 | (3) | |
Net Realized and Unrealized Gain (Loss) | | | 3.38 | | | | (0.35 | ) | | | 0.28 | | |
Total from Investment Operations | | | 3.32 | | | | (0.37 | ) | | | 0.28 | | |
Distributions from and/or in Excess of: | |
Net Investment Income | | | — | | | | (0.06 | ) | | | — | | |
Net Realized Gain | | | (0.45 | ) | | | — | | | | — | | |
Total Distributions | | | (0.45 | ) | | | (0.06 | ) | | | — | | |
Net Asset Value, End of Period | | $ | 12.72 | | | $ | 9.85 | | | $ | 10.28 | | |
Total Return(4) | | | 33.79 | % | | | (3.58 | )% | | | 2.80 | %(7) | |
Ratios and Supplemental Data: | |
Net Assets, End of Period (Thousands) | | $ | 188 | | | $ | 10 | | | $ | 10 | | |
Ratio of Expenses to Average Net Assets(9) | | | 1.96 | %(5) | | | 2.00 | %(5) | | | 1.97 | %(5)(8) | |
Ratio of Net Investment Income (Loss) to Average Net Assets(9) | | | (0.50 | )%(5) | | | (0.22 | )%(5) | | | 0.62 | %(5)(8) | |
Ratio of Rebate from Morgan Stanley Affiliates to Average Net Assets | | | 0.04 | % | | | 0.00 | %(6) | | | 0.03 | %(8) | |
Portfolio Turnover Rate | | | 71 | % | | | 69 | % | | | 5 | %(7) | |
(9) Supplemental Information on the Ratios to Average Net Assets: | |
Ratios Before Expense Limitation: | |
Expenses to Average Net Assets | | | 12.38 | % | | | 22.65 | % | | | 21.45 | %(8) | |
Net Investment Loss to Average Net Assets | | | (10.92 | )% | | | (20.87 | )% | | | (18.86 | )%(8) | |
(1) Commencement of Operations.
(2) Per share amount is based on average shares outstanding.
(3) Amount is less than $0.005 per share.
(4) Calculated based on the net asset value which does not reflect sales charges, if applicable, as of the last business day of the period.
(5) The Ratios of Expenses and Net Investment Income (Loss) reflect the rebate of certain Fund expenses in connection with the investments in Morgan Stanley affiliates during the period. The effect of the rebate on the ratios is disclosed in the above table as "Ratio of Rebate from Morgan Stanley Affiliates to Average Net Assets."
(6) Amount is less than 0.005%.
(7) Not annualized.
(8) Annualized.
The accompanying notes are an integral part of the financial statements.
14
Morgan Stanley Institutional Fund, Inc.
Annual Report — December 31, 2017
Financial Highlights
Emerging Markets Small Cap Portfolio
| | | Class C | |
| | | Year Ended December 31, | | Period from
December 15, 2015(1) to | |
Selected Per Share Data and Ratios | | 2017 | | 2016 | | December 31, 2015 | |
Net Asset Value, Beginning of Period | | $ | 9.84 | | | $ | 10.28 | | | $ | 10.00 | | |
Income (Loss) from Investment Operations: | |
Net Investment Loss(2) | | | (0.15 | ) | | | (0.10 | ) | | | (0.00 | )(3) | |
Net Realized and Unrealized Gain (Loss) | | | 3.36 | | | | (0.34 | ) | | | 0.28 | | |
Total from Investment Operations | | | 3.21 | | | | (0.44 | ) | | | 0.28 | | |
Distributions from and/or in Excess of: | |
Net Realized Gain | | | (0.45 | ) | | | — | | | | — | | |
Net Asset Value, End of Period | | $ | 12.60 | | | $ | 9.84 | | | $ | 10.28 | | |
Total Return(4) | | | 32.70 | % | | | (4.28 | )% | | | 2.80 | %(7) | |
Ratios and Supplemental Data: | |
Net Assets, End of Period (Thousands) | | $ | 24 | | | $ | 10 | | | $ | 10 | | |
Ratio of Expenses to Average Net Assets(9) | | | 2.71 | %(5) | | | 2.75 | %(5) | | | 2.73 | %(5)(8) | |
Ratio of Net Investment Loss to Average Net Assets(9) | | | (1.27 | )%(5) | | | (0.99 | )%(5) | | | (0.14 | )%(5)(8) | |
Ratio of Rebate from Morgan Stanley Affiliates to Average Net Assets | | | 0.04 | % | | | 0.00 | %(6) | | | 0.02 | %(8) | |
Portfolio Turnover Rate | | | 71 | % | | | 69 | % | | | 5 | %(7) | |
(9) Supplemental Information on the Ratios to Average Net Assets: | |
Ratios Before Expense Limitation: | |
Expenses to Average Net Assets | | | 20.48 | % | | | 23.48 | % | | | 22.20 | %(8) | |
Net Investment Loss to Average Net Assets | | | (19.04 | )% | | | (21.72 | )% | | | (19.61 | )%(8) | |
(1) Commencement of Operations.
(2) Per share amount is based on average shares outstanding.
(3) Amount is less than $0.005 per share.
(4) Calculated based on the net asset value which does not reflect sales charges, if applicable, as of the last business day of the period.
(5) The Ratios of Expenses and Net Investment Loss reflect the rebate of certain Fund expenses in connection with the investments in Morgan Stanley affiliates during the period. The effect of the rebate on the ratios is disclosed in the above table as "Ratio of Rebate from Morgan Stanley Affiliates to Average Net Assets."
(6) Amount is less than 0.005%.
(7) Not annualized.
(8) Annualized.
The accompanying notes are an integral part of the financial statements.
15
Morgan Stanley Institutional Fund, Inc.
Annual Report — December 31, 2017
Financial Highlights
Emerging Markets Small Cap Portfolio
| | | Class IS | |
| | | Year Ended December 31, | | Period from
December 15, 2015(1) to | |
Selected Per Share Data and Ratios | | 2017 | | 2016 | | December 31, 2015 | |
Net Asset Value, Beginning of Period | | $ | 9.85 | | | $ | 10.28 | | | $ | 10.00 | | |
Income (Loss) from Investment Operations: | |
Net Investment Income (Loss)(2) | | | (0.01 | ) | | | 0.02 | | | | 0.01 | | |
Net Realized and Unrealized Gain (Loss) | | | 3.38 | | | | (0.35 | ) | | | 0.27 | | |
Total from Investment Operations | | | 3.37 | | | | (0.33 | ) | | | 0.28 | | |
Distributions from and/or in Excess of: | |
Net Investment Income | | | — | | | | (0.10 | ) | | | — | | |
Net Realized Gain | | | (0.45 | ) | | | — | | | | — | | |
Total Distributions | | | (0.45 | ) | | | (0.10 | ) | | | — | | |
Net Asset Value, End of Period | | $ | 12.77 | | | $ | 9.85 | | | $ | 10.28 | | |
Total Return(3) | | | 34.29 | % | | | (3.18 | )% | | | 2.80 | %(6) | |
Ratios and Supplemental Data: | |
Net Assets, End of Period (Thousands) | | $ | 13 | | | $ | 10 | | | $ | 10 | | |
Ratio of Expenses to Average Net Assets(8) | | | 1.55 | %(4) | | | 1.60 | %(4) | | | 1.58 | %(4)(7) | |
Ratio of Net Investment Income (Loss) to Average Net Assets(8) | | | (0.08 | )%(4) | | | 0.16 | %(4) | | | 1.01 | %(4)(7) | |
Ratio of Rebate from Morgan Stanley Affiliates to Average Net Assets | | | 0.05 | % | | | 0.00 | %(5) | | | 0.02 | %(7) | |
Portfolio Turnover Rate | | | 71 | % | | | 69 | % | | | 5 | %(6) | |
(8) Supplemental Information on the Ratios to Average Net Assets: | |
Ratios Before Expense Limitation: | |
Expenses to Average Net Assets | | | 19.47 | % | | | 21.37 | % | | | 21.20 | %(7) | |
Net Investment Loss to Average Net Assets | | | (18.00 | )% | | | (19.61 | )% | | | (18.61 | )%(7) | |
(1) Commencement of Operations.
(2) Per share amount is based on average shares outstanding.
(3) Calculated based on the net asset value as of the last business day of the period.
(4) The Ratios of Expenses and Net Investment Income (Loss) reflect the rebate of certain Fund expenses in connection with the investments in Morgan Stanley affiliates during the period. The effect of the rebate on the ratios is disclosed in the above table as "Ratio of Rebate from Morgan Stanley Affiliates to Average Net Assets."
(5) Amount is less than 0.005%.
(6) Not annualized.
(7) Annualized.
The accompanying notes are an integral part of the financial statements.
16
Morgan Stanley Institutional Fund, Inc.
Annual Report — December 31, 2017
Notes to Financial Statements
Morgan Stanley Institutional Fund, Inc. (the "Company") is registered under the Investment Company Act of 1940, as amended (the "Act"), as an open-end management investment company. The Company is comprised of twenty-nine separate, active, diversified and non-diversified funds (individually referred to as a "Fund", collectively as the "Funds"). The Company applies investment company accounting and reporting guidance.
The accompanying financial statements relate to the Emerging Markets Small Cap Portfolio. The Fund seeks long-term capital appreciation.
The Fund offers four classes of shares — Class I, Class A, Class C and Class IS.
A. Significant Accounting Policies: The following significant accounting policies are in conformity with U.S. generally accepted accounting principles ("GAAP"). Such policies are consistently followed by the Company in the preparation of its financial statements. GAAP may require management to make estimates and assumptions that affect the reported amounts and disclosures in the financial statements. Actual results may differ from those estimates.
1. Security Valuation: (1) An equity portfolio security listed or traded on an exchange is valued at its latest reported sales price (or at the exchange official closing price if such exchange reports an official closing price), and if there were no sales on a given day and if there is no official exchange closing price for that day, the security is valued at the mean between the last reported bid and asked prices if such bid and asked prices are available on the relevant exchanges. Listed equity securities not traded on the valuation date with no reported bid and asked prices available on the exchange are valued at the mean between the current bid and asked prices obtained from one or more reputable brokers or dealers. In cases where a security is traded on more than one exchange, the security is valued on the exchange designated as the primary market; (2) all other equity portfolio securities for which over-the-counter ("OTC") market quotations are readily available are valued at the latest reported sales price (or at the market official closing price if such market reports an official closing price), and if there was no trading in the security on a given day and if there is no official closing price from relevant markets for that day, the security is valued at the mean between the last reported bid and asked prices if such bid and asked prices are available on the relevant
markets. An unlisted equity security that does not trade on the valuation date and for which bid and asked prices from the relevant markets are unavailable is valued at the mean between the current bid and asked prices obtained from one or more reputable brokers or dealers; (3) certain portfolio securities may be valued by an outside pricing service/vendor approved by the Company's Board of Directors (the "Directors"). The pricing service/vendor may employ a pricing model that takes into account, among other things, bids, yield spreads, and/or other market data and specific security characteristics. Alternatively, if a valuation is not available from an outside pricing service/vendor, and the security trades on an exchange, the security may be valued at its latest reported sale price (or at the exchange official closing price if such exchange reports an official closing price), prior to the time when assets are valued. If there are no sales on a given day and if there is no official exchange closing price for that day, the security is valued at the mean between the last reported bid and asked prices if such bid and asked prices are available in the relevant exchanges; (4) when market quotations are not readily available, including circumstances under which Morgan Stanley Investment Management Inc. (the "Adviser") determines that the closing price, last sale price or the mean between the last reported bid and asked prices are not reflective of a security's market value, portfolio securities are valued at their fair value as determined in good faith under procedures established by and under the general supervision of the Directors. Occasionally, developments affecting the closing prices of securities and other assets may occur between the times at which valuations of such securities are determined (that is, close of the foreign market on which the securities trade) and the close of business of the New York Stock Exchange ("NYSE"). If developments occur during such periods that are expected to materially affect the value of such securities, such valuations may be adjusted to reflect the estimated fair value of such securities as of the close of the NYSE, as determined in good faith by the Directors or by the Adviser using a pricing service and/or procedures approved by the Directors; (5) quotations of foreign portfolio securities, other assets and liabilities and forward contracts stated in foreign currency are translated into U.S. dollar equivalents at the prevailing market rates prior to the close of the NYSE; and (6) investments in mutual funds, including the Morgan Stanley Institutional Liquidity Funds, are valued at the net asset value ("NAV") as of the close of each business day.
17
Morgan Stanley Institutional Fund, Inc.
Annual Report — December 31, 2017
Notes to Financial Statements (cont'd)
The Directors have responsibility for determining in good faith the fair value of the investments, and the Directors may appoint others, such as the Company's Adviser or a valuation committee, to assist the Directors in determining fair value and to make the actual calculations pursuant to the fair valuation methodologies previously approved by the Directors. Under procedures approved by the Directors, the Company's Adviser has formed a Valuation Committee whose members are approved by the Directors. The Valuation Committee provides administration and oversight of the Company's valuation policies and procedures, which are reviewed at least annually by the Directors. These procedures allow the Company to utilize independent pricing services, quotations from securities and financial instrument dealers, and other market sources to determine fair value.
The Company has procedures to determine the fair value of securities and other financial instruments for which market prices are not readily available. Under these procedures, the Valuation Committee convenes on a regular and ad hoc basis to review such securities and considers a number of factors, including valuation methodologies and significant unobservable valuation inputs, when arriving at fair value. The Valuation Committee may employ a market-based approach which may use related or comparable assets or liabilities, recent transactions, market multiples, book values, and other relevant information for the investment to determine the fair value of the investment. An income-based valuation approach may also be used in which the anticipated future cash flows of the investment are discounted to calculate fair value. Discounts may also be applied due to the nature or duration of any restrictions on the disposition of the investments. Due to the inherent uncertainty of valuations of such investments, the fair values may differ significantly from the values that would have been used had an active market existed. The Valuation Committee employs various methods for calibrating these valuation approaches including a regular review of valuation methodologies, key inputs and assumptions, transactional back-testing or disposition analysis, and reviews of any related market activity.
2. Fair Value Measurement: Financial Accounting Standards Board ("FASB") Accounting Standards CodificationTM ("ASC") 820, "Fair Value Measurement" ("ASC
820"), defines fair value as the value that the Fund would receive to sell an investment or pay to transfer a liability in a timely transaction with an independent buyer in the principal market, or in the absence of a principal market, the most advantageous market for the investment or liability. ASC 820 establishes a three-tier hierarchy to distinguish between (1) inputs that reflect the assumptions market participants would use in valuing an asset or liability developed based on market data obtained from sources independent of the reporting entity (observable inputs) and (2) inputs that reflect the reporting entity's own assumptions about the assumptions market participants would use in valuing an asset or liability developed based on the best information available in the circumstances (unobservable inputs) and to establish classification of fair value measurements for disclosure purposes. Various inputs are used in determining the value of the Fund's investments. The inputs are summarized in the three broad levels listed below.
• Level 1 – unadjusted quoted prices in active markets for identical investments
• Level 2 – other significant observable inputs (including quoted prices for similar investments, interest rates, prepayment speeds, credit risk, etc.)
• Level 3 – significant unobservable inputs including the Fund's own assumptions in determining the fair value of investments. Factors considered in making this determination may include, but are not limited to, information obtained by contacting the issuer, analysts, or the appropriate stock exchange (for exchange-traded securities), analysis of the issuer's financial statements or other available documents and, if necessary, available information concerning other securities in similar circumstances
The inputs or methodology used for valuing securities are not necessarily an indication of the risk associated with investing in those securities and the determination of the significance of a particular input to the fair value measurement in its entirety requires judgment and considers factors specific to each security.
18
Morgan Stanley Institutional Fund, Inc.
Annual Report — December 31, 2017
Notes to Financial Statements (cont'd)
The following is a summary of the inputs used to value the Fund's investments as of December 31, 2017.
Investment Type | | Level 1
Unadjusted
quoted
prices
(000) | | Level 2
Other
significant
observable
inputs
(000) | | Level 3
Significant
unobservable
inputs
(000) | | Total
(000) | |
Assets: | |
Common Stocks | |
Aerospace & Defense | | $ | — | | | $ | 423 | | | $ | — | | | $ | 423 | | |
Auto Components | | | — | | | | 386 | | | | — | | | | 386 | | |
Banks | | | 646 | | | | 1,973 | | | | — | | | | 2,619 | | |
Beverages | | | — | | | | 254 | | | | — | | | | 254 | | |
Biotechnology | | | — | | | | 448 | | | | — | | | | 448 | | |
Capital Markets | | | — | | | | 608 | | | | — | | | | 608 | | |
Chemicals | | | — | | | | 392 | | | | — | | | | 392 | | |
Commercial Services &
Supplies | | | — | | | | 240 | | | | — | | | | 240 | | |
Communications Equipment | | | — | | | | 247 | | | | — | | | | 247 | | |
Construction & Engineering | | | — | | | | 314 | | | | — | | | | 314 | | |
Construction Materials | | | — | | | | 638 | | | | — | | | | 638 | | |
Consumer Finance | | | 35 | | | | 345 | | | | — | | | | 380 | | |
Diversified Consumer
Services | | | 379 | | | | 808 | | | | — | | | | 1,187 | | |
Electrical Equipment | | | — | | | | 546 | | | | — | | | | 546 | | |
Food & Staples Retailing | | | — | | | | 1,030 | | | | — | | | | 1,030 | | |
Food Products | | | — | | | | 1,151 | | | | — | | | | 1,151 | | |
Gas Utilities | | | — | | | | 407 | | | | — | | | | 407 | | |
Health Care Equipment &
Supplies | | | — | | | | 297 | | | | — | | | | 297 | | |
Health Care Providers &
Services | | | — | | | | 587 | | | | — | | | | 587 | | |
Hotels, Restaurants &
Leisure | | | 1,052 | | | | 1,920 | | | | — | | | | 2,972 | | |
Household Durables | | | — | | | | 616 | | | | — | | | | 616 | | |
Independent Power
and Renewable
Electricity Producers | | | — | | | | 359 | | | | — | | | | 359 | | |
Information Technology
Services | | | — | | | | 642 | | | | — | | | | 642 | | |
Insurance | | | — | | | | 315 | | | | — | | | | 315 | | |
Internet Software &
Services | | | 431 | | | | — | | | | — | | | | 431 | | |
Machinery | | | — | | | | 242 | | | | — | | | | 242 | | |
Media | | | — | | | | 1,793 | | | | — | | | | 1,793 | | |
Multi-Line Retail | | | — | | | | 369 | | | | — | | | | 369 | | |
Personal Products | | | — | | | | 1,234 | | | | — | | | | 1,234 | | |
Pharmaceuticals | | | — | | | | 762 | | | | — | | | | 762 | | |
Professional Services | | | 408 | | | | — | | | | — | | | | 408 | | |
Road & Rail | | | — | | | | 282 | | | | — | | | | 282 | | |
Semiconductors &
Semiconductor
Equipment | | | — | | | | 752 | | | | — | | | | 752 | | |
Software | | | — | | | | 424 | | | | — | | | | 424 | | |
Specialty Retail | | | — | | | | 316 | | | | — | | | | 316 | | |
Textiles, Apparel & Luxury
Goods | | | — | | | | 491 | | | | — | | | | 491 | | |
Thrifts & Mortgage Finance | | | — | | | | 269 | | | | — | | | | 269 | | |
Transportation
Infrastructure | | | — | | | | 335 | | | | — | | | | 335 | | |
Total Common Stocks | | | 2,951 | | | | 22,215 | | | | — | | | | 25,166 | | |
Short-Term Investments | |
Investment Company | | | 1,424 | | | | — | | | | — | | | | 1,424 | | |
Total Assets | | $ | 4,375 | | | $ | 22,215 | | | $ | — | | | $ | 26,590 | | |
Transfers between investment levels may occur as the markets fluctuate and/or the availability of data used in an investment's valuation changes. The Fund recognizes transfers between the levels as of the end of the period. As of December 31, 2017, securities with a total value of approximately $7,262,000 transferred from Level 1 to Level 2. Securities that were valued using unadjusted quoted prices at December 31, 2016 were valued using other significant observable inputs at December 31, 2017. At December 31, 2017, the fair value of certain securities were adjusted due to developments which occurred between the time of the close of the foreign markets on which they trade and the close of business on the NYSE which resulted in their Level 2 classification.
3. Foreign Currency Translation and Foreign Investments: The books and records of the Fund are maintained in U.S. dollars. Foreign currency amounts are translated into U.S. dollars as follows:
— investments, other assets and liabilities at the prevailing rate of exchange on the valuation date;
— investment transactions and investment income at the prevailing rates of exchange on the dates of such transactions.
Although the net assets of the Fund are presented at the foreign exchange rates and market values at the close of the period, the Fund does not isolate that portion of the results of operations arising as a result of changes in the foreign exchange rates from the fluctuations arising from changes in the market prices of securities held at period end. Similarly, the Fund does not isolate the effect of changes in foreign exchange rates from the fluctuations arising from changes in the market prices of securities sold during the period. Accordingly, realized and unrealized foreign currency gains (losses) on investments in securities are included in the reported net realized and unrealized gains (losses) on investment transactions and balances. However, pursuant to U.S. federal income tax regulations, gains and losses from certain foreign currency transactions and the foreign currency portion of gains and losses realized on sales and maturities of foreign denominated debt securities are treated as ordinary income for U.S. federal income tax purposes.
Net realized gains (losses) on foreign currency transactions represent net foreign exchange gains (losses) from foreign currency forward exchange contracts, disposition
19
Morgan Stanley Institutional Fund, Inc.
Annual Report — December 31, 2017
Notes to Financial Statements (cont'd)
of foreign currencies, currency gains (losses) realized between the trade and settlement dates on securities transactions, and the difference between the amount of investment income and foreign withholding taxes recorded on the Fund's books and the U.S. dollar equivalent amounts actually received or paid. Net unrealized currency gains (losses) from valuing foreign currency denominated assets and liabilities at period end exchange rates are reflected as a component of unrealized appreciation (depreciation) in the Statement of Assets and Liabilities. The change in unrealized currency gains (losses) on foreign currency translations for the period is reflected in the Statement of Operations.
A significant portion of the Fund's net assets consist of securities of issuers located in emerging markets, which are denominated in foreign currencies. Such securities may be concentrated in a limited number of countries and regions and may vary throughout the year. Changes in currency exchange rates will affect the value of securities and investment income from foreign currency denominated securities. Emerging market securities are often subject to greater price volatility, limited capitalization and liquidity, and higher rates of inflation than securities of companies based in the U.S. In addition, emerging market issuers may be subject to substantial governmental involvement in the economy and greater social, economic and political uncertainty.
Governmental approval for foreign investments may be required in advance of making an investment under certain circumstances in some countries, and the extent of foreign investments in domestic companies may be subject to limitation in other countries. Foreign ownership limitations also may be imposed by the charters of individual companies to prevent, among other concerns, violations of foreign investment limitations. As a result, an additional class of shares (identified as "Foreign" in the Portfolio of Investments) may be created and offered for investment. The "local" and "foreign shares" market values may differ. In the absence of trading of the foreign shares in such markets, the Fund values the foreign shares at the closing exchange price of the local shares.
4. Securities Lending: The Fund lends securities to qualified financial institutions, such as broker-dealers, to earn additional income. Any increase or decrease in the fair value of the securities loaned that might occur and any interest earned or dividends declared on those securities dur-
ing the term of the loan would remain in the Fund. The Fund would receive cash or securities as collateral in an amount equal to or exceeding 100% of the current fair value of the loaned securities. The collateral is marked-to-market daily by State Street Bank and Trust Company ("State Street"), the securities lending agent, to ensure that a minimum of 100% collateral coverage is maintained.
Based on pre-established guidelines, the securities lending agent invests any cash collateral that is received in an affiliated money market portfolio and repurchase agreements. Securities lending income is generated from the earnings on the invested collateral and borrowing fees, less any rebates owed to the borrowers and compensation to the lending agent, and is recorded as "Income from Securities Loaned — Net" in the Fund's Statement of Operations. Risks in securities lending transactions are that a borrower may not provide additional collateral when required or return the securities when due, and that the value of the short-term investments will be less than the amount of cash collateral plus any rebate that is required to be returned to the borrower.
The Fund has the right under the securities lending agreement to recover the securities from the borrower on demand.
The following table presents financial instruments that are subject to enforceable netting arrangements as of December 31, 2017.
Gross Amounts Not Offset in the Statement of Assets and Liabilities | |
Gross Asset
Amounts
Presented in
Statement of
Assets and
Liabilities
(000) | | Financial
Instrument
(000) | | Collateral
Received
(000) | | Net Amount
(not less
than $0)
(000) | |
| $ | 1,055 | (a) | | $ | — | | | $ | (1,055 | )(b)(c) | | $ | 0 | | |
(a) Represents market value of loaned securities at year end.
(b) The Fund received cash collateral of approximately $602,000, which was subsequently invested in Morgan Stanley Institutional Liquidity Funds as reported in the Portfolio of Investments. In addition, the Fund received non-cash collateral of approximately $496,000 in the form of U.S. Government obligations, which the Fund cannot sell or repledge, and accordingly are not reflected in the Portfolio of Investments.
(c) The actual collateral received is greater than the amount shown here due to overcollateralization.
FASB ASC 860 "Transfers & Servicing: Repurchase-to-Maturity Transactions, Repurchase Financings, and Disclosures", is intended to provide increased transparency about the types of collateral pledged in securities lending
20
Morgan Stanley Institutional Fund, Inc.
Annual Report — December 31, 2017
Notes to Financial Statements (cont'd)
transactions and other similar transactions that are accounted for as secured borrowing.
The following table displays a breakdown of transactions accounted for as secured borrowings, the gross obligations by class of collateral pledged, and the remaining contractual maturity of those transactions as of December 31, 2017.
Remaining Contractual Maturity of the Agreements | |
| | | Overnight and
Continuous
(000) | | <30 days
(000) | | Between
30 &
90 days
(000) | | >90 days
(000) | | Total
(000) | |
Securities Lending
Transactions | |
Common Stocks | | $ | 602 | | | $ | — | | | $ | — | | | $ | — | | | $ | 602 | | |
Total Borrowings | | $ | 602 | | | $ | — | | | $ | — | | | $ | — | | | $ | 602 | | |
Gross amount of
recognized liabilities
for securities lending
transactions | | | | | | | | | | $ | 602 | | |
5. Redemption Fees: The Fund will assess a 2% redemption fee, on Class I shares, Class A shares, Class C shares and Class IS shares, which is paid directly to the Fund, for shares redeemed or exchanged within thirty days of purchase, subject to certain exceptions. The redemption fee is designed to protect the Fund and its remaining shareholders from the effects of short-term trading. These fees, if any, are included in the Statement of Changes in Net Assets.
6. Indemnifications: The Company enters into contracts that contain a variety of indemnifications. The Company's maximum exposure under these arrangements is unknown. However, the Company has not had prior claims or losses pursuant to these contracts and expects the risk of loss to be remote.
7. Dividends and Distributions to Shareholders: Dividends and distributions to shareholders are recorded on the ex-dividend date. Dividends from net investment income, if any, are declared and paid annually. Net realized capital gains, if any, are distributed at least annually.
8. Security Transactions, Income and Expenses: Security transactions are accounted for on the trade date (date the order to buy or sell is executed). Realized gains and losses on the sale of investment securities are determined on the specific identified cost method. Dividend income and other distributions are recorded on the ex-dividend date (except for certain foreign dividends which may be recorded as soon as the Fund is informed of such dividends) net of applicable withholding taxes. Interest in-
come is recognized on the accrual basis except where collection is in doubt. Discounts are accreted and premiums are amortized over the life of the respective securities. Most expenses of the Company can be directly attributed to a particular Fund. Expenses which cannot be directly attributed are apportioned among the Funds based upon relative net assets or other appropriate methods. Income, expenses (other than class specific expenses — distribution and shareholder services, transfer agency and sub transfer agency fees) and realized and unrealized gains or losses are allocated to each class of shares based upon their relative net assets.
B. Advisory Fees: The Adviser, a wholly-owned subsidiary of Morgan Stanley, provides the Fund with advisory services under the terms of an Investment Advisory Agreement, paid quarterly, at an annual rate of 1.25% of the average daily net assets of the Fund.
The Adviser has agreed to reduce its advisory fee and/or reimburse the Fund so that total annual portfolio operating expenses, excluding certain investment related expenses, taxes, interest and other extraordinary expenses (including litigation), will not exceed 1.65% for Class I shares, 2.00% for Class A shares, 2.75% for Class C shares and 1.60% for Class IS shares. The fee waivers and/or expense reimbursements will continue for at least one year from the date of the Fund's prospectus or until such time as the Directors act to discontinue all or a portion of such waivers and/or reimbursements when they deem such action is appropriate. For the year ended December 31, 2017, approximately $225,000 of advisory fees were waived and approximately $6,000 of other expenses were reimbursed by the Adviser pursuant to this arrangement.
C. Administration Fees: The Adviser also serves as Administrator to the Company and provides administrative services pursuant to an Administration Agreement for an annual fee, accrued daily and paid monthly, of 0.08% of the Fund's average daily net assets.
Under a Sub-Administration Agreement between the Administrator and State Street, State Street provides certain administrative services to the Company. For such services, the Administrator pays State Street a portion of the fee the Administrator receives from the Fund.
D. Distribution and Shareholder Services Fees: Morgan Stanley Distribution, Inc. ("MSDI" or the "Distributor"), a wholly-owned subsidiary of the Adviser and an indirect subsidiary of Morgan Stanley, serves as the Company's Distributor
21
Morgan Stanley Institutional Fund, Inc.
Annual Report — December 31, 2017
Notes to Financial Statements (cont'd)
of Fund shares pursuant to a Distribution Agreement. The Company has adopted a Shareholder Services Plan with respect to Class A shares pursuant to Rule 12b-1 under the Act. Under the Shareholder Services Plan, the Fund pays the Distributor a shareholder services fee, accrued daily and paid monthly, at an annual rate of 0.25% of the Fund's average daily net assets attributable to Class A shares.
The Company has adopted a Distribution and Shareholder Services Plan with respect to Class C shares pursuant to Rule 12b-1 under the Act. Under the Distribution and Shareholder Services Plan, the Fund pays the Distributor a distribution fee, accrued daily and paid monthly, at an annual rate of 0.75% and a shareholder services fee, accrued daily and paid monthly, at an annual rate of 0.25% of the Fund's average daily net assets attributable to Class C shares.
The distribution and shareholder services fees are used to support the expenses associated with servicing and maintaining accounts. The Distributor may compensate other parties for providing shareholder support services to investors who purchase Class A and Class C shares.
E. Dividend Disbursing and Transfer Agent: The Company's dividend disbursing and transfer agent is Boston Financial Data Services, Inc. ("BFDS"). Pursuant to a Transfer Agency Agreement, the Company pays BFDS a fee based on the number of classes, accounts and transactions relating to the Funds of the Company. Effective January 1, 2018, BFDS changed its name to DST Asset Manager Solutions, Inc.
F. Custodian Fees: State Street (the "Custodian") also serves as Custodian for the Company in accordance with a Custodian Agreement. The Custodian holds cash, securities, and other assets of the Company as required by the Act. Custody fees are payable monthly based on assets held in custody, investment purchases and sales activity and account maintenance fees, plus reimbursement for certain out-of-pocket expenses.
G. Security Transactions and Transactions with Affiliates: For the year ended December 31, 2017, purchases and sales of investment securities for the Fund, other than long-term U.S. Government securities and short-term investments, were approximately $16,283,000 and $17,094,000, respectively. There were no purchases and sales of long-term U.S. Government securities for the year ended December 31, 2017.
The Fund invests in the Institutional Class of the Morgan Stanley Institutional Liquidity Funds — Government Portfolio (the "Liquidity Funds"), an open-end management investment
company managed by the Adviser, both directly and as a portion of the securities held as collateral on loaned securities. Advisory fees paid by the Fund are reduced by an amount equal to its pro-rata share of the advisory and administration fees paid by the Fund due to its investment in the Liquidity Funds. For the year ended December 31, 2017, advisory fees paid were reduced by less than $500 relating to the Fund's investment in the Liquidity Funds.
The Fund invests in Morgan Stanley India Investment Fund, Inc., an open-end management investment company advised by an affiliate of the Adviser. Advisory fees paid by the Fund are reduced by an amount equal to its pro-rata share of the advisory and administration fees paid by the Fund due to its investment in Morgan Stanley India Investment Fund, Inc. For the year ended December 31, 2017, advisory fees paid were reduced by approximately $10,000 relating to the Fund's investment in the Morgan Stanley India Investment Fund, Inc.
A summary of the Fund's transactions in share of the affiliated investments companies during the year ended December 31, 2017 are as follows:
Affiliated
Investment
Company | | Value
December 31,
2016
(000) | | Purchases
at Cost
(000) | | Proceeds
from Sales
(000) | | Dividend
Income
(000) | |
Liquidity Funds | | $ | 700 | | | $ | 7,235 | | | $ | 6,511 | | | $ | 2 | | |
Morgan Stanley
India Investment
Fund, Inc. | | | 881 | | | | — | | | | 1,187 | | | | 25 | | |
| | | $ | 1,581 | | | $ | 7,235 | | | $ | 7,698 | | | $ | 27 | | |
Affiliated
Investment
Company (cont'd) | | Realized
Gain
(000) | | Change in
Unrealized
Appreciation
(Depreciation)
(000) | | Value
December 31,
2017
(000) | |
Liquidity Funds | | $ | — | | | $ | — | | | $ | 1,424 | | |
Morgan Stanley
India Investment
Fund, Inc. | | | 328 | | | | (22 | ) | | | — | | |
| | | $ | 328 | | | $ | (22 | ) | | $ | 1,424 | | |
The Fund is permitted to purchase and sell securities ("cross-trade") from and to other Morgan Stanley Funds as well as other funds and client accounts for which the Adviser or an affiliate of the Adviser serves as investment adviser, pursuant to procedures approved by the Directors in compliance with Rule 17a-7 under the Act (the "Rule"). Each cross-trade is executed at the current market price in compliance with provisions of the Rule. For the year ended December 31, 2017, the Fund did not engage in any cross-trade transactions.
The Fund has an unfunded Deferred Compensation Plan (the "Compensation Plan"), which allows each independent
22
Morgan Stanley Institutional Fund, Inc.
Annual Report — December 31, 2017
Notes to Financial Statements (cont'd)
Director to defer payment of all, or a portion, of the fees he or she receives for serving on the Board of Directors. Each eligible Director generally may elect to have the deferred amounts credited with a return equal to the total return on one or more of the Morgan Stanley funds that are offered as investment options under the Compensation Plan. Appreciation/depreciation and distributions received from these investments are recorded with an offsetting increase/decrease in the deferred compensation obligation and do not affect the NAV of the Fund.
H. Federal Income Taxes: It is the Fund's intention to continue to qualify as a regulated investment company and distribute all of its taxable and tax-exempt income. Accordingly, no provision for federal income taxes is required in the financial statements.
The Fund may be subject to taxes imposed by countries in which it invests. Such taxes are generally based on income and/or capital gains earned or repatriated. Taxes are accrued based on net investment income, net realized gains and net unrealized appreciation as such income and/or gains are earned. Taxes may also be based on transactions in foreign currency and are accrued based on the value of investments denominated in such currency.
FASB ASC 740-10, "Income Taxes — Overall", sets forth a minimum threshold for financial statement recognition of the benefit of a tax position taken or expected to be taken in a tax return. Management has concluded there are no significant uncertain tax positions that would require recognition in the financial statements. If applicable, the Fund recognizes interest accrued related to unrecognized tax benefits in "Interest Expense" and penalties in "Other Expenses" in the Statement of Operations. The Fund files tax returns with the U.S. Internal Revenue Service, New York and various states. Each of the tax years in the three-year period ended December 31, 2017, remains subject to examination by taxing authorities.
The tax character of distributions paid may differ from the character of distributions shown in the Statements of Changes in Net Assets due to short-term capital gains being treated as ordinary income for tax purposes. The tax character of distributions paid during fiscal years 2017 and 2016 was as follows:
2017
Distributions
Paid From: | | 2016
Distributions
Paid From: | |
Ordinary
Income
(000) | | Long-Term
Capital Gain
(000) | | Ordinary
Income
(000) | | Long-Term
Capital Gain
(000) | | Paid-in-
Capital
(000) | |
| $ | — | | | $ | 892 | | | $ | 178 | | | $ | — | | | $ | 23 | | |
The amount and character of income and gains to be distributed are determined in accordance with income tax regulations which may differ from GAAP. These book/tax differences are either considered temporary or permanent in nature.
Temporary differences are primarily due to differing book and tax treatments for the timing of the recognition of gains (losses) on certain investment transactions and the timing of the deductibility of certain expenses.
Permanent differences, primarily due to differing treatments of gains (losses) related to foreign currency transactions and a net operating loss, resulted in the following reclassifications among the components of net assets at December 31, 2017:
Accumulated
Net Investment
Loss
(000) | | Accumulated
Undistributed
Net Realized
Gain
(000) | | Paid-in-
Capital
(000) | |
| $ | 66 | | | $ | 19 | | | $ | (85 | ) | |
At December 31, 2017, the components of distributable earnings for the Fund on a tax basis were as follows:
Undistributed
Ordinary
Income
(000) | | Undistributed
Long-Term
Capital Gain
(000) | |
| $ | — | | | $ | 892 | | |
During the year ended December 31, 2017, the Fund utilized capital loss carryforwards for U.S. federal income tax purposes of approximately $827,000.
I. Credit Facility: The Company and other Morgan Stanley funds participated in a $150,000,000 committed, unsecured revolving line of credit facility (the "Facility") with State Street. This Facility is to be used for temporary emergency purposes or funding of shareholder redemption requests. The interest rate on borrowings is based on the federal funds rate or 1 month LIBOR rate plus a spread. The Facility also has a commitment fee of 0.25% per annum based on the unused portion of the Facility. During the year ended December 31, 2017, the Fund did not have any borrowings under the Facility.
J. Other: At December 31, 2017, the Fund did not have record owners of 10% or greater.
23
Morgan Stanley Institutional Fund, Inc.
Annual Report — December 31, 2017
Report of Independent Registered Public Accounting Firm
To the Shareholders and Board of Directors of
Morgan Stanley Institutional Fund, Inc. —
Emerging Markets Small Cap Portfolio
Opinion on the Financial Statements
We have audited the accompanying statement of assets and liabilities of Emerging Markets Small Cap Portfolio (the "Fund") (one of the funds constituting the Morgan Stanley Institutional Fund, Inc. (the "Company")), including the portfolio of investments, as of December 31, 2017, and the related statement of operations for the year then ended, the statements of changes in net assets for each of the two years in the period then ended, the financial highlights for each of the two years in the period then ended and the period from December 15, 2015 (commencement of operations) through December 31, 2015 and the related notes (collectively referred to as the "financial statements"). In our opinion, the financial statements present fairly, in all material respects, the financial position of Emerging Markets Small Cap Portfolio (one of the funds constituting Morgan Stanley Institutional Fund, Inc.) at December 31, 2017, the results of its operations for the year then ended, the changes in its net assets for each of the two years in the period then ended and its financial highlights for each of the two years in the period then ended and the period from December 15, 2015 (commencement of operations) through December 31, 2015, in conformity with U.S. generally accepted accounting principles.
Basis for Opinion
These financial statements are the responsibility of the Company's management. Our responsibility is to express an opinion on the Fund's financial statements based on our audits. We are a public accounting firm registered with the Public Company Accounting Oversight Board (United States) ("PCAOB") and are required to be independent with respect to the Company in accordance with the U.S. federal securities law and the applicable rules and regulations of the Securities and Exchange Commission and the PCAOB.
We conducted our audits in accordance with the standards of the PCAOB. Those standards require that we plan and perform the audit to obtain reasonable assurance about whether the financial statements are free of material misstatement, whether due to error or fraud. The Company is not required to have, nor were we engaged to perform, an audit of the Company's internal control over financial reporting. As part of our audits, we are required to obtain an understanding of internal control over financial reporting, but not for the purpose of expressing an opinion on the effectiveness of the Company's internal control over financial reporting. Accordingly, we express no such opinion.
Our audits included performing procedures to assess the risks of material misstatement of the financial statements, whether due to error or fraud, and performing procedures that respond to those risks. Such procedures included examining, on a test basis, evidence regarding the amounts and disclosures in the financial statements. Our procedures included confirmation of securities owned as of December 31, 2017 by correspondence with the custodian and others or by other appropriate auditing procedures where replies from others were not received. Our audits also included evaluating the accounting principles used and significant estimates made by management, as well as evaluating the overall presentation of the financial statements. We believe that our audits provide a reasonable basis for our opinion.

We have served as the auditor of one or more Morgan Stanley investment companies since 2000.
Boston, Massachusetts
February 26, 2018
24
Morgan Stanley Institutional Fund, Inc.
Annual Report — December 31, 2017
Federal Tax Notice (unaudited)
For federal income tax purposes, the following information is furnished with respect to the distributions paid by the Fund during its taxable year ended December 31, 2017.
The Fund designated and paid approximately $892,000 as a long-term capital gain distribution.
In January, the Fund provides tax information to shareholders for the preceding calendar year.
25
Morgan Stanley Institutional Fund, Inc.
Annual Report — December 31, 2017
Privacy Notice (unaudited)
MORGAN STANLEY INVESTMENT MANAGEMENT INC.
AN IMPORTANT NOTICE CONCERNING OUR U.S. PRIVACY POLICY
We are required by federal law to provide you with a copy of our privacy policy annually. This policy applies to current and former individual investors in funds managed or sponsored by Morgan Stanley Investment Management Inc. ("MSIM") as well as current and former individual clients of MSIM. This policy is not applicable to partnerships, corporations, trusts or other non-individual clients or investors. Please note that we may amend this policy at any time, and will inform you of any changes as required by law.
WE RESPECT YOUR PRIVACY
We appreciate that you have provided us with your personal financial information. We strive to maintain the privacy of such information while we help you achieve your financial objectives. This Notice describes what non-public personal information we collect about you, why we collect it, when we may share it with others and how certain others may use it. It discusses the steps you may take to limit our sharing of certain information about you to affiliated companies in the Morgan Stanley family of companies ("other Morgan Stanley companies"). It also discloses how you may limit use of certain shared information for marketing purposes by other Morgan Stanley branded companies. Throughout this policy, we refer to the non-public information that personally identifies you or your accounts as "personal information.''
1. WHAT PERSONAL INFORMATION DO WE COLLECT ABOUT YOU?
We obtain personal information from applications and other forms you submit to us, from your dealings with us, from consumer reporting agencies, from our Web sites and from third parties and other sources.
For example:
• We may collect information such as your name, address, e-mail address, telephone/fax numbers, assets, income and investment objectives through subscription documents, applications and other forms you submit to us.
• We may obtain information about account balances, your use of account(s) and the types of products and services you prefer to receive from us through your dealings and transactions with us and other sources.
• We may obtain information about your creditworthiness and credit history from consumer reporting agencies.
• We may collect background information from and through third-party vendors to verify representations you have made and to comply with various regulatory requirements.
• If you interact with us through our public and private Web sites, we may collect information that you provide directly through online communications (such as an e-mail address). We may also collect information about your Internet service provider, your domain name, your computer's operating system and Web browser, your use of our Web sites and your product and service preferences, through the use of "cookies." Please consult the Terms of Use of these sites for more details.
2. WHEN DO WE DISCLOSE PERSONAL INFORMATION WE COLLECT ABOUT YOU?
We may disclose personal information we collect about you to other Morgan Stanley companies and to non-affiliated third parties.
a. Information We Disclose to Other Morgan Stanley Companies.
We may disclose personal information to other Morgan Stanley companies for a variety of reasons, including to manage your account(s) effectively, to service and process your transactions, to let you know about products and services offered by us and other Morgan Stanley companies, to manage our business, and as otherwise required or permitted by law. Offers for products and services from other Morgan Stanley companies are developed under conditions designed to safeguard your personal information.
26
Morgan Stanley Institutional Fund, Inc.
Annual Report — December 31, 2017
Privacy Notice (unaudited) (cont'd)
b. Information We Disclose to Non-affiliated Third Parties.
We do not disclose personal information that we collect about you to non-affiliated third parties except to those who provide marketing services on our behalf, to financial institutions with whom we have joint marketing agreements, and as otherwise required or permitted by law. For example, we may disclose personal information to non-affiliated third parties for servicing and processing transactions, to offer our own products and services, to protect against fraud, for institutional risk control, to respond to judicial process or to perform services on our behalf. When we share personal information with a non-affiliated third party, they are required to limit their use of personal information to the particular purpose for which it was shared and they are not allowed to share personal information with others except to fulfill that limited purpose or as may be permitted or required by law.
3. HOW DO WE PROTECT THE SECURITY AND CONFIDENTIALITY OF PERSONAL INFORMATION WE COLLECT ABOUT YOU?
We maintain physical, electronic and procedural security measures to help safeguard the personal information we collect about you. We have internal policies governing the proper handling of client information. Third parties that provide support or marketing services on our behalf may also receive personal information, and we require them to adhere to confidentiality standards with respect to such information.
4. HOW CAN YOU LIMIT THE SHARING OF CERTAIN TYPES OF PERSONAL INFORMATION WITH OTHER MORGAN STANLEY COMPANIES?
We offer you choices as to whether we share with other Morgan Stanley companies the personal information that was collected to determine your eligibility for products and services you request ("eligibility information"). Eligibility information does not include your identification information or personal information pertaining to our transactions or experiences with you. Please note that, even if you direct us not to share eligibility information with other Morgan Stanley companies ("opt-out"), we may still share personal information, including eligibility information, with those companies in circumstances excluded from the opt-out under applicable law, such as to process transactions or to service your account.
5. HOW CAN YOU LIMIT THE USE OF CERTAIN TYPES OF PERSONAL INFORMATION BY OTHER MORGAN STANLEY COMPANIES FOR MARKETING?
By following the opt-out instructions in Section 6 below, you may limit other Morgan Stanley branded companies from marketing their products or services to you based on personal information we disclose to them. This information may include, for example, your income and account history with us. Please note that, even if you choose to limit Other Morgan Stanley Companies from using personal information about you that we may share with them for marketing their products and services to you, Other Morgan Stanley Companies may use your personal information that they obtain from us to market to you in circumstances permitted by law, such as if the Other Morgan Stanley Company has its own relationship with you.
6. HOW CAN YOU SEND US AN OPT-OUT INSTRUCTION?
If you wish to limit our sharing of eligibility information about you with other Morgan Stanley companies or other Morgan Stanley companies' use of personal information for marketing purposes, as described in this notice, you may do so by:
• Calling us at (800) 548-7786
Monday-Friday between 8a.m. and 6p.m.(EST)
• Writing to us at the following address:
DST Asset Manager Solutions, Inc.
c/o Privacy Coordinator
P.O. Box 219804
Kansas City, Missouri 64121
27
Morgan Stanley Institutional Fund, Inc.
Annual Report — December 31, 2017
Privacy Notice (unaudited) (cont'd)
Your written request should include your name, address, telephone number and account number(s) to which the opt-out applies and whether you are opting out with respect to sharing of eligibility information (Section 4 above), or if information used for Marketing (Section 5 above) or both. Written opt-out requests should not be sent with any other correspondence. In order to process your request, we require that the request be provided by you directly and not through a third party.
Your opt-out preference will remain in effect with respect to this policy (as it may be amended) until you notify us otherwise. If you have a joint account, your direction for us not to share this information with other Morgan Stanley companies and for those other Morgan Stanley companies not to use your personal information for marketing will be applied to all account holders on that account. Please understand that if you limit our sharing or our affiliated companies' use of personal information, you and any joint account holder(s) may not receive information about Morgan Stanley products and services, including products or services that could help you manage your financial resources and achieve your investment objectives.
7. WHAT IF AN AFFILIATED COMPANY BECOMES A NON-AFFILIATED THIRD PARTY?
If, at any time in the future, an affiliated company becomes a non-affiliated third party, further disclosures of personal information made to the former affiliated company will be limited to those described in Section 2(b) above relating to non-affiliated third parties. If you elected under Section 6 to limit disclosures we make to affiliated companies, or use of personal information by affiliated companies, your election will not apply to use by any former affiliated company of your personal information in their possession once it becomes a non-affiliated third party.
SPECIAL NOTICE TO RESIDENTS OF VERMONT
The following section supplements our policy with respect to our individual clients who have a Vermont address and supersedes anything to the contrary in the above policy with respect to those clients only.
The state of Vermont requires financial institutions to obtain your consent prior to sharing personal information that they collect about you with affiliated companies and non-affiliated third parties other than in certain limited circumstances. Except as permitted by law, we will not share personal information we collect about you with non-affiliated third parties or other Morgan Stanley companies unless you provide us with your written consent to share such information ("opt-in").
If you wish to receive offers for investment products and services offered by or through other Morgan Stanley companies, please notify us in writing at the following address:
DST Asset Manager Solutions, Inc.
c/o Privacy Coordinator
P.O. Box 219804
Kansas City, Missouri 64121
Your authorization should include your name, address, telephone number and account number(s) to which the opt-in applies and should not be sent with any other correspondence. In order to process your authorization, we require that the authorization be provided by you directly and not through a third party.
SPECIAL NOTICE TO RESIDENTS OF CALIFORNIA
The following section supplements our policy with respect to our individual clients who have a California address and supersedes anything to the contrary in the above policy with respect to those clients only.
In response to a California law, if your account has a California home address, your personal information will not be disclosed to non-affiliated third parties except as permitted by applicable California law, and we will limit sharing such information with our affiliates to comply with California privacy laws that apply to us.
28
Morgan Stanley Institutional Fund, Inc.
Annual Report — December 31, 2017
Director and Officer Information (unaudited)
Independent Directors:
Name, Age and Address of
Independent Director | | Position(s)
Held with
Registrant | | Length of
Time Served* | | Principal Occupation(s) During Past 5 Years
and Other Relevant Professional Experience | | Number of
Portfolios in
Fund Complex
Overseen by
Independent
Director** | | Other Directorships
Held by Independent
Director*** | |
Frank L. Bowman (73)
c/o Perkins Coie LLP
Counsel to the Independent Directors
30 Rockefeller Plaza
New York, NY 10112 | | Director | | Since
August
2006 | | President, Strategic Decisions, LLC (consulting) (since February 2009); Director or Trustee of various Morgan Stanley Funds (since August 2006); Chairperson of the Compliance and Insurance Committee (since October 2015); formerly, Chairperson of the Insurance Sub-Committee of the Compliance and Insurance Committee (200-2015); served as President and Chief Executive Officer of the Nuclear Energy Institute (policy organization) (February 2005-November 2008); retired as Admiral, U.S. Navy after serving over 38 years on active duty including 8 years as Director of the Naval Nuclear Propulsion Program in the Department of the Navy and the U.S. Department of Energy (1996-2004); served as Chief of Naval Personnel (July 1994-September 1996) and on the Joint Staff as Director of Political Military Affairs (June 1992-July 1994); knighted as Honorary Knight Commander of the Most Excellent Order of the British Empire; awarded the Officier de l'Orde National du Mérite by the French Government; elected to the National Academy of Engineering (2009). | | | 88 | | | Director of BP p.l.c.; Director of Naval and Nuclear Technologies LLP; Director Emeritus of the Armed Services YMCA; Director of the U.S. Naval Submarine League; Member of the National Security Advisory Council of the Center for U.S. Global Engagement and a member of the CNA Military Advisory Board; Trustee of Fairhaven United Methodist Church; and Director of other various non-profit organizations. | |
Kathleen A. Dennis (64)
c/o Perkins Coie LLP
Counsel to the Independent Directors
30 Rockefeller Plaza
New York, NY 10112 | | Director | | Since
August
2006 | | President, Cedarwood Associates (mutual fund and investment management consulting) (since July 2006); Chairperson of the Liquidity and Alternatives Sub-Committee of the Investment Committee (since October 2006) and Director or Trustee of various Morgan Stanley Funds (since August 2006); formerly, Senior Managing Director of Victory Capital Management (1993-2006). | | | 89 | | | Director of various non-profit organizations. | |
Nancy C. Everett (62)
c/o Perkins Coie LLP
Counsel to the Independent Directors
30 Rockefeller Plaza
New York, NY 10112 | | Director | | Since
January
2015 | | Chief Executive Officer, Virginia Commonwealth University Investment Company (since November 2015); Owner, OBIR, LLC (institutional investment management consulting) (since June 2014); formerly, Managing Director, BlackRock Inc. (February 2011-December 2013); and Chief Executive Officer, General Motors Asset Management (a/k/a Promark Global Advisors, Inc.) (June 2005-May 2010). | | | 90 | | | Formerly, Member of Virginia Commonwealth University School of Business Foundation (2005-2016); Member of Virginia Commonwealth University Board of Visitors (2013-2015); Member of Committee on Directors for Emerging Markets Growth Fund, Inc. (2007-2010); Chairperson of Performance Equity Management, LLC (2006-2010); and Chairperson, GMAM Absolute Return Strategies Fund, LLC (2006-2010). | |
29
Morgan Stanley Institutional Fund, Inc.
Annual Report — December 31, 2017
Director and Officer Information (unaudited) (cont'd)
Independent Directors: (cont'd)
Name, Age and Address of
Independent Director | | Position(s)
Held with
Registrant | | Length of
Time Served* | | Principal Occupation(s) During Past 5 Years
and Other Relevant Professional Experience | | Number of
Portfolios in
Fund Complex
Overseen by
Independent
Director** | | Other Directorships
Held by Independent
Director*** | |
Jakki L. Haussler (60)
c/o Perkins Coie LLP
Counsel to the Independent Directors
30 Rockefeller Plaza
New York, NY 10112 | | Director | | Since
January
2015 | | Chairman and Chief Executive Officer, Opus Capital Group (since January 1996); formerly, Director, Capvest Venture Fund, LP (May 2000-December 2011); Partner, Adena Ventures, LP (July 1999-December 2010); Director, The Victory Funds (February 2005-July 2008). | | | 90 | | | Director of Cincinnati Bell Inc. and Member, Audit Committee and Compensation Committee; Director of Northern Kentucky University Foundation and Member, Investment Committee; Member of Chase College of Law Transactional Law Practice Center Board of Advisors; Director of Best Transport; Director of Chase College of Law Board of Visitors; formerly, Member, University of Cincinnati Foundation Investment Committee; Member, Miami University Board of Visitors (2008-2011); Trustee of Victory Funds (2005-2008) and Chairman, Investment Committee (2007-2008) and Member, Service Provider Committee (2005-2008). | |
Dr. Manuel H. Johnson (68)
c/o Johnson Smick
International, Inc.
220 I Street, NE — Suite 200
Washington, D.C. 20002 | | Director | | Since
July
1991 | | Senior Partner, Johnson Smick International, Inc. (consulting firm); Chairperson of the Investment Committee (since October 2006) and Director or Trustee of various Morgan Stanley Funds (since July 1991); Co-Chairman and a founder of the Group of Seven Council (G7C) (international economic commission); formerly, Chairperson of the Audit Committee (July 1991-September 2006), Vice Chairman of the Board of Governors of the Federal Reserve System and Assistant Secretary of the U.S. Treasury. | | | 88 | | | Director of NVR, Inc. (home construction). | |
Joseph J. Kearns (75)
c/o Kearns & Associates LLC
46 E Peninsula Center #385
Rolling Hills Estates, CA 90274-3712 | | Director | | Since
August
1994 | | Senior Adviser, Kearns & Associates LLC (investment consulting); Chairperson of the Audit Committee (since October 2006) and Director or Trustee of various Morgan Stanley Funds (since August 1994); formerly, Deputy Chairperson of the Audit Committee (July 2003-September 2006) and Chairperson of the Audit Committee of various Morgan Stanley Funds (since August 1994); CFO of the J. Paul Getty Trust. | | | 89 | | | Prior to August 10, 2016, Director of Electro Rent Corporation (equipment leasing); Prior to December 31, 2013, Director of The Ford Family Foundation. | |
30
Morgan Stanley Institutional Fund, Inc.
Annual Report — December 31, 2017
Director and Officer Information (unaudited) (cont'd)
Independent Directors: (cont'd)
Name, Age and Address of
Independent Director | | Position(s)
Held with
Registrant | | Length of
Time Served* | | Principal Occupation(s) During Past 5 Years
and Other Relevant Professional Experience | | Number of
Portfolios in
Fund Complex
Overseen by
Independent
Director** | | Other Directorships
Held by Independent
Director*** | |
Michael F. Klein (59)
c/o Perkins Coie LLP
Counsel to the Independent Directors
30 Rockefeller Plaza
New York, NY 10112 | | Director | | Since
August
2006 | | Managing Director, Aetos Capital, LLC (since March 2000); Co-President, Aetos Alternatives Management, LLC (since January 2004) and Co-Chief Executive Officer of Aetos Capital LLC (since August 2013); Chairperson of the Fixed Income Sub-Committee of the Investment Committee (since October 2006) and Director or Trustee of various Morgan Stanley Funds (since August 2006); formerly, Managing Director, Morgan Stanley & Co. Inc. and Morgan Stanley Dean Witter Investment Management, President, various Morgan Stanley Funds (June 1998-March 2000) and Principal, Morgan Stanley & Co. Inc. and Morgan Stanley Dean Witter Investment Management (August 1997-December 1999). | | | 88 | | | Director of certain investment funds managed or sponsored by Aetos Capital, LLC; Director of Sanitized AG and Sanitized Marketing AG (specialty chemicals). | |
Patricia Maleski (57)
c/o Perkins Coie LLP
Counsel to the Independent Directors
30 Rockefeller Plaza
New York, NY 10112 | | Director | | Since
January
2017 | | Managing Director, JPMorgan Asset Management (2004-2016); Oversight and Control Head of Fiduciary and Conflicts of Interest Program (2015-2016); Chief Control Officer-Global Asset Management (2013-2015); President, JPMorgan Funds (2010-2013); Chief Administrative Officer (2004-2013); various other positions including Treasurer and Board Liaison (since 2001). | | | 90 | | | None. | |
Michael E. Nugent (81)
522 Fifth Avenue
New York, NY 10036 | | Chair of the
Board and
Director | | Chair of the
Boards since
July 2006 and
Director since
July 1991 | | Chair of the Boards of various Morgan Stanley Funds (since July 2006); Chairperson of the Closed-End Fund Committee (since June 2012) and Director or Trustee of various Morgan Stanley Funds (since July 1991); formerly, Chairperson of the Insurance Committee (until July 2006); General Partner, Triumph Capital, L.P. (private investment partnership) (1988-2013). | | | 88 | | | None. | |
W. Allen Reed (70)
c/o Perkins Coie LLP
Counsel to the Independent Directors
30 Rockefeller Plaza
New York, NY 10112 | | Director | | Since
August
2006 | | Chairperson of the Equity Sub-Committee of the Investment Committee (since October 2006) and Director or Trustee of various Morgan Stanley Funds (since August 2006); formerly, President and CEO of General Motors Asset Management; Chairman and Chief Executive Officer of the GM Trust Bank and Corporate Vice President of General Motors Corporation (August 1994-December 2005). | | | 89 | | | Director of Legg Mason, Inc.; formerly, Director of the Auburn University Foundation (2010-2015). | |
Fergus Reid (85)
c/o Joe Pietryka, Inc.
85 Charles Colman Blvd.
Pawling, NY 12564 | | Director | | Since
June
1992 | | Chairman, Joe Pietryka, Inc.; Chairperson of the Governance Committee and Director or Trustee of various Morgan Stanley Funds (since June 1992). | | | 89 | | | Formerly, Trustee and Director of certain investment companies in the JP Morgan Fund Complex managed by JP Morgan Investment Management Inc. (1987-2012). | |
* This is the earliest date the Director began serving the Morgan Stanley Funds. Each Director serves an indefinite term, until his or her successor is elected.
** The Fund Complex includes (as of December 31, 2017) all open-end and closed-end funds (including all of their portfolios) advised by Morgan Stanley Investment Management Inc. (the "Adviser") and any funds that have an adviser that is an affiliated person of the Adviser (including, but not limited to, Morgan Stanley AIP GP LP).
*** This includes any directorships at public companies and registered investment companies held by the Director at any time during the past five years.
31
Morgan Stanley Institutional Fund, Inc.
Annual Report — December 31, 2017
Director and Officer Information (unaudited) (cont'd)
Executive Officers:
Name, Age and Address of Executive Officer | | Position(s) Held
with
Registrant | | Length of
Time Served* | | Principal Occupation(s) During Past 5 Years | |
John H. Gernon (54)
522 Fifth Avenue
New York, NY 10036 | | President and
Principal
Executive
Officer | | Since
September
2013 | | President and Principal Executive Officer of the Equity and Fixed Income Funds and the Morgan Stanley AIP Funds (since September 2013) and the Liquidity Funds and various money market funds (since May 2014) in the Fund Complex; Managing Director of the Adviser; Head of Product (since 2006). | |
Timothy J. Knierim (58)
522 Fifth Avenue
New York, NY 10036 | | Chief
Compliance
Officer | | Since
December
2016 | | Managing Director of the Adviser and various entities affiliated with the Adviser; Chief Compliance Officer of various Morgan Stanley Funds and the Adviser (since December 2016) and Chief Compliance Officer of Morgan Stanley AIP GP LP (since 2014). Formerly, Managing Director and Deputy Chief Compliance Officer of the Adviser (2014-2016); and formerly, Chief Compliance Officer of Prudential Investment Management, Inc. (2007-2014). | |
Francis J. Smith (52)
522 Fifth Avenue
New York, NY 10036 | | Treasurer and
Principal
Financial Officer | | Treasurer
since July
2003 and
Principal
Financial
Officer since
September
2002 | | Managing Director of the Adviser and various entities affiliated with the Adviser; Treasurer (since July 2003) and Principal Financial Officer of various Morgan Stanley Funds (since September 2002). | |
Mary E. Mullin (50)
522 Fifth Avenue
New York, NY 10036 | | Secretary | | Since
June
1999 | | Managing Director of the Adviser; Secretary of various Morgan Stanley Funds (since June 1999). | |
Michael J. Key (38)
522 Fifth Avenue
New York, NY 10036 | | Vice President | | Since
June
2017 | | Vice President of the Equity and Fixed Income Funds, Liquidity Funds, various money market funds and the Morgan Stanley AIP Funds in the Fund Complex (since June 2017); Executive Director of the Adviser; Head of Product Development for Equity and Fixed Income Funds (since August 2013). | |
* This is the earliest date the officer began serving the Morgan Stanley Funds. Each officer serves a one-year term, until his or her successor is elected and qualifies.
32
Morgan Stanley Institutional Fund, Inc.
Annual Report — December 31, 2017
Adviser and Administrator
Morgan Stanley Investment Management Inc.
522 Fifth Avenue
New York, New York 10036
Distributor
Morgan Stanley Distribution, Inc.
522 Fifth Avenue
New York, New York 10036
Dividend Disbursing and Transfer Agent
DST Asset Manager Solutions, Inc.
2000 Crown Colony Drive
Quincy, Massachusetts 02169
Custodian
State Street Bank and Trust Company
One Lincoln Street
Boston, Massachusetts 02111
Legal Counsel
Dechert LLP
1095 Avenue of the Americas
New York, New York 10036
Counsel to the Independent Directors
Perkins Coie LLP
30 Rockefeller Plaza
New York, New York 10112
Independent Registered Public Accounting Firm
Ernst & Young LLP
200 Clarendon Street
Boston, Massachusetts 02116
Reporting to Shareholders
Each Morgan Stanley Fund provides a complete schedule of portfolio holdings in its semi-annual and annual reports within 60 days of the end of the fund's second and fourth fiscal quarters. The semi-annual and annual reports are filed electronically with the Securities and Exchange Commission (SEC) on Form N-CSRS and Form N-CSR, respectively. Morgan Stanley also delivers the semi-annual and annual reports to fund shareholders and makes these reports available on its public website, www.morganstanley.com/im. Each Morgan Stanley fund also files a complete schedule of portfolio holdings with the SEC for the fund's first and third fiscal quarters on Form N-Q. Morgan Stanley does not deliver the reports for the first and third fiscal quarters to shareholders, nor are the reports posted to the Morgan Stanley public website. You may, however, obtain the Form N-Q filings (as well as the Form N-CSR and N-CSRS filings) by accessing the SEC's website, www.sec.gov. You may also review and copy them at the SEC's Public Reference Room in Washington, DC. Information on the operation of the SEC's Public Reference Room may be obtained by calling the SEC toll free at 1 (800) SEC-0330. You can also request copies of these materials, upon payment of a duplicating fee, by electronic request at the SEC's email address (publicinfo@sec.gov) or by writing to the SEC's Public Reference Section, Washington, D.C. 20549-1520.
Proxy Voting Policies and Procedures and Proxy Voting Record
You may obtain a copy of the Company's Proxy Voting Policy and Procedures and information regarding how the Company voted proxies relating to portfolio securities during the most recent twelve-month period ended June 30, without charge, upon request, by calling toll free 1 (800) 548-7786 or by visiting our website at www.morganstanley.com/im. This information is also available on the SEC's website at www.sec.gov.
This report is authorized for distribution only when preceded or accompanied by a prospectus or summary prospectus of the applicable Fund of Morgan Stanley Institutional Fund, Inc., which describes in detail the Fund's investment policies, risks, fees and expenses. Please read the prospectus carefully before you invest or send money. For additional information, including information regarding the investments comprising the Fund, please visit our website at www.morganstanley.com/im or call toll free 1 (800) 548-7786.
33
Printed in U.S.A.
This Report has been prepared for shareholders and may be distributed to others only if preceded or accompanied by a current prospectus.
Morgan Stanley Investment Management Inc.
522 Fifth Avenue
New York, New York 10036
© 2018 Morgan Stanley. Morgan Stanley Distribution, Inc.

IFIEMSCANN
2007449 EXP. 02.28.19

Morgan Stanley Institutional Fund, Inc.
Frontier Markets Portfolio
(formerly Frontier Emerging Markets Portfolio)
Annual Report
December 31, 2017

Morgan Stanley Institutional Fund, Inc.
Annual Report — December 31, 2017
Shareholders' Letter | | | 2 | | |
Expense Example | | | 3 | | |
Investment Overview | | | 4 | | |
Portfolio of Investments | | | 7 | | |
Statement of Assets and Liabilities | | | 9 | | |
Statement of Operations | | | 11 | | |
Statements of Changes in Net Assets | | | 12 | | |
Financial Highlights | | | 14 | | |
Notes to Financial Statements | | | 19 | | |
Report of Independent Registered Public Accounting Firm | | | 26 | | |
Privacy Notice | | | 27 | | |
Director and Officer Information | | | 30 | | |
This report is authorized for distribution only when preceded or accompanied by a prospectus or summary prospectus of the applicable Fund of Morgan Stanley Institutional Fund, Inc. To receive a prospectus and/or statement of additional information (SAI), which contains more complete information such as investment objectives, charges, expenses, policies for voting proxies, risk considerations, and describes in detail each of the Fund's investment policies to the prospective investor, please call toll free 1 (800) 548-7786. Please read the prospectuses carefully before you invest or send money.
Additionally, you can access information about the Fund, including performance, characteristics, and investment team commentary, through Morgan Stanley Investment Management's website: www.morganstanley.com/im.
Market forecasts provided in this report may not necessarily come to pass. There is no guarantee that any sectors mentioned will continue to perform as discussed herein or that securities in such sectors will be held by the Fund in the future. There is no assurance that a fund will achieve its investment objective. Funds are subject to market risk, which is the possibility that market values of securities owned by the Fund will decline and, therefore, the value of the Fund's shares may be less than what you paid for them. Accordingly, you can lose money investing in this Fund. Please see the prospectus for more complete information on investment risks.
1
Morgan Stanley Institutional Fund, Inc.
Annual Report — December 31, 2017
Shareholders' Letter (unaudited)
Dear Shareholders,
We are pleased to provide this Annual report, in which you will learn how your investment in Frontier Markets Portfolio (the "Fund") performed during the latest twelve-month period.
Morgan Stanley Investment Management is a client-centric, investor-led organization. Our global presence, intellectual capital, and breadth of products and services enable us to partner with investors to meet the evolving challenges of today's financial markets. We aim to deliver superior investment service and to empower our clients to make the informed decisions that help them reach their investment goals.
As always, we thank you for selecting Morgan Stanley Investment Management, and look forward to working with you in the months and years ahead.
Sincerely,

John H. Gernon
President and Principal Executive Officer
January 2018
2
Morgan Stanley Institutional Fund, Inc.
Annual Report — December 31, 2017
Expense Example (unaudited)
Frontier Markets Portfolio
As a shareholder of the Fund, you incur two types of costs: (1) transactional costs, including redemption fees; and (2) ongoing costs, which may include advisory fees, administration fees, distribution and shareholder services fees and other Fund expenses. This example is intended to help you understand your ongoing costs (in dollars) of investing in the Fund and to compare these costs with the ongoing costs of investing in other mutual funds.
This example is based on an investment of $1,000 invested at the beginning of the six-month period ended December 31, 2017 and held for the entire six-month period.
Actual Expenses
The table below provides information about actual account values and actual expenses. You may use the information in this table, together with the amount you invested, to estimate the expenses that you paid over the period. Simply divide your account value by $1,000 (for example, an $8,600 account value divided by $1,000 = 8.6), then multiply the result by the number in the table under the heading entitled "Actual Expenses Paid During Period" to estimate the expenses you paid on your account during this period.
Hypothetical Example for Comparison Purposes
The table below provides information about hypothetical account values and hypothetical expenses based on the Fund's actual expense ratio and an assumed rate of return of 5% per year before expenses, which is not the Fund's actual return. The hypothetical account values and expenses may not be used to estimate the actual ending account balance or expenses you paid for the period. You may use this information to compare the ongoing costs of investing in the Fund and other funds. To do so, compare this 5% hypothetical example with the 5% hypothetical examples that appear in the shareholder reports of the other funds.
Please note that the expenses shown in the table are meant to highlight your ongoing costs only and do not reflect any transactional costs, such as sales charges (loads) and redemption fees. Therefore, the information for each class in the table is useful in comparing ongoing costs only, and will not help you determine the relative total costs of owning different funds. In addition, if these transactional costs were included, your costs would have been higher.
| | | Beginning
Account
Value
7/1/17 | | Actual Ending
Account
Value
12/31/17 | | Hypothetical
Ending Account
Value | | Actual
Expenses
Paid
During
Period* | | Hypothetical
Expenses Paid
During Period* | | Net
Expense
Ratio
During
Period** | |
Frontier Markets Portfolio Class I | | $ | 1,000.00 | | | $ | 1,071.40 | | | $ | 1,016.28 | | | $ | 9.24 | | | $ | 9.00 | | | | 1.77 | % | |
Frontier Markets Portfolio Class A | | | 1,000.00 | | | | 1,069.80 | | | | 1,014.67 | | | | 10.90 | | | | 10.61 | | | | 2.09 | | |
Frontier Markets Portfolio Class L | | | 1,000.00 | | | | 1,066.10 | | | | 1,011.59 | | | | 14.06 | | | | 13.69 | | | | 2.70 | | |
Frontier Markets Portfolio Class C | | | 1,000.00 | | | | 1,065.80 | | | | 1,010.79 | | | | 14.89 | | | | 14.50 | | | | 2.86 | | |
Frontier Markets Portfolio Class IS | | | 1,000.00 | | | | 1,071.40 | | | | 1,016.48 | | | | 9.03 | | | | 8.79 | | | | 1.73 | | |
* Expenses are calculated using each Fund Class' annualized net expense ratio (as disclosed), multiplied by the average account value over the period, and multiplied by 184/365 (to reflect the most recent one-half year period).
** Annualized.
3
Morgan Stanley Institutional Fund, Inc.
Annual Report — December 31, 2017
Investment Overview (unaudited)
Frontier Markets Portfolio
The Fund seeks long-term capital appreciation.
Performance
For the year ended December 31, 2017, the Fund's Class I shares had a total return based on net asset value and reinvestment of distributions per share of 20.82%, net of fees. The Fund's Class I shares underperformed the Fund's benchmark, the MSCI Frontier Markets Index (the "Index"), which returned 31.86%.
Please keep in mind that double-digit returns are highly unusual and cannot be sustained. Investors should also be aware that these returns were primarily achieved during favorable market conditions.
Factors Affecting Performance
• The MSCI Frontier Markets Index (+31.86%) underperformed the MSCI Emerging Markets Index (+37.28%) this year amid an emerging markets rally dominated by technology companies. Within the Index, Argentina (+73.46%) led market returns, followed by Kazakhstan (+69.90%), Vietnam (+64.86%) and Estonia (+49.48%). Pakistan was the worst-performing market, losing –24.44% on the back of its inclusion in the MSCI Emerging Markets Index at the end of May 2017. Pakistan faces some headwinds, notably an overvalued currency, a sliding current account and uncertainty in politics surrounding former Prime Minister Nawaz Sharif's involvement in the Panama Papers.
• In aggregate, country allocation and stock selection detracted from returns. The Fund's overweight allocation to Pakistan was the biggest detractor from returns during the year, though stock selection in the country slightly offset losses. The Fund's stock selection in and underweight allocation to Nigeria also detracted from returns, followed by overweight allocations to Tanzania, Saudi Arabia and Egypt. Stock selection in and overweight allocation to Bangladesh also hampered performance.
• The Fund's stock selection in and underweight allocation to Morocco contributed to performance. Zero allocations to Oman, Lebanon and Bahrain were also beneficial to returns.
• From a sector perspective, stock selection in industrials, consumer discretionary and health care added to returns, while stock selection in consumer
staples, financials and materials detracted from performance.
Management Strategies
• The Fund continuously assesses the growth levers providing tailwinds to frontier economies, such as strong demographics with labor force growth sufficient for high gross domestic product (GDP) growth, an underpenetrated credit cycle, a relatively low level of private debt to GDP and healthy domestic demand. Many of the frontier markets are recovering off a low in GDP growth and experienced significant resets in the economy, including markets like Argentina, Nigeria and select markets across the Middle East. This is in contrast to emerging markets, where there is widespread declining labor force growth, an over-penetrated credit cycle, especially in some of the largest countries such as China, and high exposure to interest rate hikes given the level of private debt to GDP held by both the corporates and consumers.
• From a thematic perspective, the Fund continues to own and seek companies benefiting from healthy domestic demand, particularly in regards to health care, and select consumer discretionary and staples. The team sees demand for financial services in countries with low credit penetration. The Fund seeks to minimize exposure to countries highly dependent on trade, as protectionism is increasingly part of the platform of new populist leaders.
• During the year, the Fund increased its allocation to Kuwait, whose economy still looks the best among the Gulf Cooperation Council (GCC) countries, in our view. Kuwait also has rising infrastructure investment driving GDP growth, while most other GCC countries are cutting capital expenditure (capex). Importantly, government surpluses provide the banking system with ample liquidity. The Kuwaiti banking sector continues to look attractive due to healthy liquidity and net interest margin expansion, high single-digit loan growth and strong capital positions. The sector is also seeing improving asset quality and a potential reversal of over-provisioned balance sheets. We added a position in a bank stock that we believe is well-positioned to take advantage of all of these trends.
4
Morgan Stanley Institutional Fund, Inc.
Annual Report — December 31, 2017
Investment Overview (unaudited) (cont'd)
Frontier Markets Portfolio
• Saudi Arabia was added to the portfolio, as we believe the country should benefit from stability in the oil price, continued reforms and potential MSCI Emerging Markets Index inclusion. The Fund initiated positions in two banks and a consumer discretionary retailer that we believe may potentially benefit from emerging growth trends within their respective industries.
• The Fund increased its allocation to Vietnam. Vietnam's GDP is expected to grow 6.5% in 2017, mainly driven by strong consumption, increasing private investments into foreign direct investment sectors and healthy export growth.(i) We added two names during the year that we believe have high exposure to Vietnam's favorable consumer trends, including rising tourism, increasing wages, a growing middle class and continued urbanization.
• To help fund these additions, the allocation to Pakistan was decreased during the year. The Fund started to trim the position ahead of the country's move from the MSCI Frontier Markets Index to the MSCI Emerging Markets Index in May 2017. Post-inclusion, the market continued to underperform, and we significantly decreased the Fund's holdings in Pakistan.
• The Fund reduced its position in Argentina, specifically in oil and gas exposure. We believe there is little upside in the Argentine oil and gas sector near-term, as most of the price adjustments have already been made. The government's incentive program for producers is likely to be unfavorable for the country's oil majors, at least in the near term, as only incremental production from unconventional production will be priced at the higher subsidized price.

* Minimum Investment for Class I shares
** Commenced Operations on August 25, 2008. Performance shown for the Fund's Class I shares reflects the performance of the common shares of Morgan Stanley Frontier Emerging Markets Fund, Inc. (the "Predecessor Fund") for periods prior to September 17, 2012.
In accordance with SEC regulations, the Fund's performance shown assumes that all recurring fees (including management fees) were deducted and all dividends and distributions were reinvested. The performance of Class A, L, C and IS shares will vary from the performance of Class I shares based upon their different inception dates and will be impacted by additional fees assessed to those classes (if applicable).
(i) Source: International Monetary Fund
5
Morgan Stanley Institutional Fund, Inc.
Annual Report — December 31, 2017
Investment Overview (unaudited) (cont'd)
Frontier Markets Portfolio
Performance Compared to the MSCI Frontier Markets Index(1) and the Lipper Emerging Markets Funds Index(2)
| | | Period Ended December 31, 2017
Total Returns(3) | |
| | | | | Average Annual | |
| | | One
Year | | Five
Years | | Ten
Years | | Since
Inception(8) | |
Fund — Class I Shares
w/o sales charges(4) | | | 20.82 | % | | | 8.89 | % | | | — | | | | 2.23 | % | |
Fund — Class A Shares
w/o sales charges(5) | | | 20.39 | | | | 8.54 | | | | — | | | | 9.14 | | |
Fund — Class A Shares with
maximum 5.25% sales charges(5) | | | 14.07 | | | | 7.37 | | | | — | | | | 8.04 | | |
Fund — Class L Shares
w/o sales charges(5) | | | 19.59 | | | | 7.85 | | | | — | | | | 8.46 | | |
Fund — Class C Shares
w/o sales charges(7) | | | 19.51 | | | | — | | | | — | | | | 1.97 | | |
Fund — Class C Shares
with maximum 1.00%
deferred sales charges(7) | | | 18.51 | | | | — | | | | — | | | | 1.97 | | |
Fund — Class IS Shares
w/o sales charges(6) | | | 20.83 | | | | — | | | | — | | | | 3.92 | | |
MSCI Frontier Markets Index | | | 31.86 | | | | 9.27 | | | | — | | | | –0.27 | | |
Lipper Emerging Markets
Funds Index | | | 35.56 | | | | 4.54 | | | | — | | | | 4.43 | | |
Performance data quoted represents past performance, which is no guarantee of future results, and current performance may be lower or higher than the figures shown. Performance assumes that all dividends and distributions, if any, were reinvested. For the most recent month-end performance figures, please visit www.morganstanley.com/im. Investment return and principal value will fluctuate so that Fund shares, when redeemed, may be worth more or less than their original cost. Total returns do not reflect the deduction of taxes that a shareholder would pay on Fund distributions or the redemption of Fund shares. Performance of share classes will vary due to difference in sales charges and expenses.
(1) The MSCI Frontier Markets Index is a free float-adjusted market capitalization index that is designed to measure equity market performance of frontier markets. The MSCI Frontier Markets Index currently consists of 29 frontier market country indices. The performance of the Index is calculated in U.S. dollars and assumes reinvestment of net dividends. "Net dividends" reflects a reduction in dividends after taking into account withholding of taxes by certain foreign countries represented in the Index. The Index is unmanaged and its returns do not include any sales charges or fees. Such costs would lower performance. It is not possible to invest directly in an index.
(2) The Lipper Emerging Markets Funds Index is an equally weighted performance index of the largest qualifying funds (based on net assets) in the Lipper Emerging Markets Funds classification. The Index, which is adjusted for capital gains distributions and income dividends, is unmanaged and should not be considered an investment. There are currently 30 funds represented in this Index. As of the date of this report, the Fund is in the Lipper Emerging Markets Funds classification.
(3) Total returns for the Fund reflect fees waived and expenses reimbursed, if applicable, by the Adviser. Without such waivers and reimbursements, total returns would have been lower.
(4) On September 17, 2012, all assets of Morgan Stanley Frontier Emerging Markets Fund, Inc. (the "Predecessor Fund") were reorganized into Class I shares of Morgan Stanley Institutional Fund, Inc. Frontier Emerging Markets Portfolio ("the Fund"). Performance shown for Class I shares reflects the performance of the shares of the Predecessor Fund for periods prior to September 17, 2012. The Predecessor Fund may have performed differently if it were an open-end fund since closed-end funds are generally not subject to the cash flow fluctuations of an open-end fund. In addition, Class I shares' returns of the Fund will differ from the Predecessor Fund as they have different expenses. The Predecessor Fund commenced operations on August 25, 2008.
(5) Commenced offering on September 14, 2012.
(6) Commenced offering on February 27, 2015.
(7) Commenced offering on April 30, 2015.
(8) For comparative purposes, average annual since inception returns listed for the Indexes refer to the inception date of Class I of the Fund, not the inception of the Index.
6
Morgan Stanley Institutional Fund, Inc.
Annual Report — December 31, 2017
Portfolio of Investments
Frontier Markets Portfolio
| | | Shares | | Value
(000) | |
Common Stocks (93.7%) | |
Argentina (21.0%) | |
Arcos Dorados Holdings, Inc., Class A (a) | | | 1,223,349 | | | $ | 12,662 | | |
Banco Macro SA ADR | | | 317,000 | | | | 36,734 | | |
BBVA Banco Frances SA ADR | | | 594,773 | | | | 14,988 | | |
Bolsas y Mercados Argentinos SA (a) | | | 89,123 | | | | 1,627 | | |
Grupo Financiero Galicia SA ADR | | | 684,192 | | | | 45,054 | | |
Grupo Supervielle SA ADR | | | 465,963 | | | | 13,662 | | |
Loma Negra Cia Industrial Argentina SA ADR (a) | | | 507,719 | | | | 11,698 | | |
Telecom Argentina SA ADR | | | 509,518 | | | | 18,663 | | |
| | | | 155,088 | | |
Bangladesh (5.4%) | |
Beximco Pharmaceuticals Ltd. | | | 9,957,621 | | | | 12,413 | | |
GrameenPhone Ltd. | | | 1,504,390 | | | | 8,518 | | |
Olympic Industries Ltd. | | | 2,398,749 | | | | 8,315 | | |
Prime Bank Ltd. | | | 10,435,266 | | | | 3,438 | | |
Square Pharmaceuticals Ltd. | | | 2,084,801 | | | | 7,564 | | |
| | | | 40,248 | | |
Egypt (4.4%) | |
Commercial International Bank Egypt SAE | | | 3,399,627 | | | | 14,857 | | |
Egyptian Financial Group-Hermes Holding Co. | | | 7,071,397 | | | | 9,386 | | |
Egyptian Financial Group-Hermes Holding Co. GDR | | | 650,613 | | | | 1,649 | | |
Integrated Diagnostics Holdings PLC (b) | | | 1,463,263 | | | | 6,841 | | |
| | | | 32,733 | | |
Kazakhstan (2.8%) | |
Halyk Savings Bank of Kazakhstan JSC GDR (a) | | | 361,436 | | | | 3,580 | | |
KazMunaiGas Exploration Production JSC GDR | | | 1,294,893 | | | | 16,812 | | |
| | | | 20,392 | | |
Kenya (2.7%) | |
Safaricom Ltd. | | | 75,462,426 | | | | 19,748 | | |
Kuwait (15.0%) | |
Boubyan Bank KSCP | | | 5,598,304 | | | | 8,090 | | |
Human Soft Holding Co. KSC | | | 1,212,518 | | | | 15,024 | | |
Mezzan Holding Co. KSCC | | | 859,673 | | | | 2,208 | | |
Mobile Telecommunications Co. KSC | | | 19,395,399 | | | | 27,871 | | |
National Bank of Kuwait | | | 24,012,413 | | | | 57,918 | | |
| | | | 111,111 | | |
Morocco (4.3%) | |
Attijariwafa Bank | | | 427,995 | | | | 22,118 | | |
Societe d'Exploitation des Ports | | | 557,761 | | | | 9,540 | | |
| | | | 31,658 | | |
Nigeria (5.6%) | |
Dangote Cement PLC | | | 2,940,639 | | | | 1,861 | | |
Guaranty Trust Bank PLC | | | 76,306,221 | | | | 8,638 | | |
Nestle Nigeria PLC | | | 1,684,664 | | | | 7,281 | | |
Nigerian Breweries PLC | | | 29,605,295 | | | | 11,093 | | |
Zenith Bank PLC | | | 175,012,074 | | | | 12,509 | | |
| | | | 41,382 | | |
| | | Shares | | Value
(000) | |
Pakistan (2.2%) | |
Lucky Cement Ltd. | | | 125,962 | | | $ | 589 | | |
Maple Leaf Cement Factory Ltd. | | | 1,604,734 | | | | 1,004 | | |
United Bank Ltd. | | | 8,735,778 | | | | 14,883 | | |
| | | | 16,476 | | |
Panama (1.3%) | |
Copa Holdings SA, Class A | | | 71,143 | | | | 9,537 | | |
Qatar (1.0%) | |
Qatar National Bank SAQ | | | 203,288 | | | | 7,085 | | |
Romania (3.7%) | |
Banca Transilvania SA | | | 25,641,307 | | | | 14,060 | | |
BRD-Groupe Societe Generale SA | | | 3,906,671 | | | | 12,963 | | |
| | | | 27,023 | | |
Sri Lanka (1.7%) | |
Commercial Bank of Ceylon PLC | | | 14,284,053 | | | | 12,618 | | |
Tanzania, United Republic of (0.8%) | |
National Microfinance Bank PLC (a) | | | 6,718,721 | | | | 6,173 | | |
Turkey (0.9%) | |
Coca-Cola Icecek AS | | | 734,213 | | | | 6,624 | | |
United Arab Emirates (7.5%) | |
Aramex PJSC | | | 1,733,293 | | | | 2,031 | | |
DP World Ltd. | | | 488,150 | | | | 12,212 | | |
Dubai Islamic Bank PJSC | | | 6,006,509 | | | | 10,118 | | |
Emaar Properties PJSC | | | 6,442,548 | | | | 12,161 | | |
NMC Health PLC | | | 496,949 | | | | 19,355 | | |
| | | | 55,877 | | |
United Kingdom (1.1%) | |
KAZ Minerals PLC (a) | | | 697,716 | | | | 8,363 | | |
Vietnam (12.3%) | |
Bank for Foreign Trade of Vietnam JSC | | | 8,352,993 | | | | 19,954 | | |
Mobile World Investment Corp. | | | 469,890 | | | | 2,708 | | |
Saigon Beer Alcohol Beverage Corp. (a) | | | 849,330 | | | | 9,281 | | |
Vietjet Aviation JSC | | | 3,341,800 | | | | 21,572 | | |
Vietnam Dairy Products JSC | | | 2,738,160 | | | | 25,106 | | |
Vincom Retail JSC (a) | | | 6,149,630 | | | | 12,768 | | |
| | | | 91,389 | | |
Total Common Stocks (Cost $553,902) | | | 693,525 | | |
Participation Notes (3.8%) | |
Saudi Arabia (3.7%) | |
Al Rajhi Bank, Equity Linked Notes,
expires 1/22/18 (a) | | | 641,669 | | | | 11,052 | | |
Dallay Healthcare Co., Equity Linked
Notes, expires 11/2/18 (a) | | | 170,163 | | | | 4,585 | | |
Jarir Marketing Co., Equity Linked Notes,
expires 1/22/18 (a) | | | 126,791 | | | | 4,971 | | |
Saudi British Bank, Equity Linked Notes,
expires 3/24/20 (a) | | | 956,274 | | | | 7,022 | | |
Saudi Co. for Hardware LLC, Equity Linked
Notes, expires 5/21/18 (a) | | | 9,400 | | | | 278 | | |
| | | | 27,908 | | |
The accompanying notes are an integral part of the financial statements.
7
Morgan Stanley Institutional Fund, Inc.
Annual Report — December 31, 2017
Portfolio of Investments (cont'd)
Frontier Markets Portfolio
| | | Shares | | Value
(000) | |
United Arab Emirates (0.1%) | |
Aramex PJSC, Equity Linked Notes,
expires 3/14/19 (a) | | | 412,123 | | | $ | 483 | | |
Total Participation Notes (Cost $27,737) | | | 28,391 | | |
Short-Term Investment (2.0%) | |
Investment Company (2.0%) | |
Morgan Stanley Institutional Liquidity
Funds — Government Portfolio —
Institutional Class (See Note G)
(Cost $14,764) | | | 14,764,455 | | | | 14,764 | | |
Total Investments (99.5%) (Cost $596,403) (c)(d) | | | 736,680 | | |
| Liabilities in Excess of Other Assets (0.5%) | | | 3,850 | | |
Net Assets (100.0%) | | $ | 740,530 | | |
Country assignments and aggregations are based generally on third party vendor classifications and information, and may be different from the assignments and aggregations under the policies set forth in the Fund's prospectus and/or statement of additional information relating to geographic classifications.
(a) Non-income producing security.
(b) 144A security — Certain conditions for public sale may exist. Unless otherwise noted, these securities are deemed to be liquid.
(c) The approximate fair value and percentage of net assets, $509,959,000 and 68.9%, respectively, represent the securities that have been fair valued under the fair valuation policy for international investments as described in Note A-1 within the Notes to the Financial Statements.
(d) At December 31, 2017, the aggregate cost for federal income tax purposes is approximately $603,094,000. The aggregate gross unrealized appreciation is approximately $161,325,000 and the aggregate gross unrealized depreciation is approximately $27,740,000, resulting in net unrealized appreciation of approximately $133,585,000.
ADR American Depositary Receipt.
GDR Global Depositary Receipt.
PJSC Public Joint Stock Company.
Portfolio Composition
Classification | | Percentage of
Total Investments | |
Banks | | | 48.2 | % | |
Other* | | | 37.4 | | |
Wireless Telecommunication Services | | | 8.6 | | |
Food Products | | | 5.8 | | |
Total Investments | | | 100.0 | % | |
* Industries and/or investment types representing less than 5% of total investments.
The accompanying notes are an integral part of the financial statements.
8
Morgan Stanley Institutional Fund, Inc.
Annual Report — December 31, 2017
Frontier Markets Portfolio
Statement of Assets and Liabilities | | December 31, 2017
(000) | |
Assets: | |
Investments in Securities of Unaffiliated Issuers, at Value (Cost $581,639) | | $ | 721,916 | | |
Investment in Security of Affiliated Issuer, at Value (Cost $14,764) | | | 14,764 | | |
Total Investments in Securities, at Value (Cost $596,403) | | | 736,680 | | |
Foreign Currency, at Value (Cost $9,808) | | | 9,804 | | |
Cash | | | 21 | | |
Receivable for Investments Sold | | | 6,211 | | |
Dividends Receivable | | | 1,277 | | |
Receivable for Fund Shares Sold | | | 476 | | |
Receivable from Affiliate | | | 8 | | |
Other Assets | | | 74 | | |
Total Assets | | | 754,551 | | |
Liabilities: | |
Deferred Capital Gain Country Tax | | | 2,131 | | |
Payable for Investments Purchased | | | 4,251 | | |
Payable for Fund Shares Redeemed | | | 3,936 | | |
Payable for Advisory Fees | | | 2,238 | | |
Payable for Custodian Fees | | | 1,167 | | |
Payable for Sub Transfer Agency Fees — Class I | | | 69 | | |
Payable for Sub Transfer Agency Fees — Class A | | | 17 | | |
Payable for Sub Transfer Agency Fees — Class L | | | 1 | | |
Payable for Sub Transfer Agency Fees — Class C | | | 1 | | |
Payable for Professional Fees | | | 76 | | |
Payable for Administration Fees | | | 48 | | |
Payable for Transfer Agency Fees — Class I | | | 22 | | |
Payable for Transfer Agency Fees — Class A | | | 1 | | |
Payable for Transfer Agency Fees — Class L | | | 1 | | |
Payable for Transfer Agency Fees — Class C | | | 1 | | |
Payable for Transfer Agency Fees — Class IS | | | 2 | | |
Payable for Shareholder Services Fees — Class A | | | 18 | | |
Payable for Distribution and Shareholder Services Fees — Class L | | | 2 | | |
Payable for Distribution and Shareholder Services Fees — Class C | | | 2 | | |
Other Liabilities | | | 37 | | |
Total Liabilities | | | 14,021 | | |
Net Assets | | $ | 740,530 | | |
Net Assets Consist Of: | |
Paid-in-Capital | | $ | 671,426 | | |
Accumulated Undistributed Net Investment Income | | | 1,389 | | |
Accumulated Net Realized Loss | | | (70,587 | ) | |
Unrealized Appreciation (Depreciation) on: | |
Investments (Net of $1,962 of Deferred Capital Gain Country Tax) | | | 138,315 | | |
Foreign Currency Translations | | | (13 | ) | |
Net Assets | | $ | 740,530 | | |
The accompanying notes are an integral part of the financial statements.
9
Morgan Stanley Institutional Fund, Inc.
Annual Report — December 31, 2017
Frontier Markets Portfolio
Statement of Assets and Liabilities (cont'd) | | December 31, 2017
(000) | |
CLASS I: | |
Net Assets | | $ | 632,435 | | |
| Shares Outstanding $0.001 par value shares of beneficial interest (unlimited shares authorized) (not in 000's) | | | 30,084,309 | | |
Net Asset Value, Offering and Redemption Price Per Share | | $ | 21.02 | | |
CLASS A: | |
Net Assets | | $ | 86,324 | | |
| Shares Outstanding $0.001 par value shares of beneficial interest (unlimited shares authorized) (not in 000's) | | | 4,139,188 | | |
Net Asset Value, Redemption Price Per Share | | $ | 20.86 | | |
Maximum Sales Load | | | 5.25 | % | |
Maximum Sales Charge | | $ | 1.16 | | |
Maximum Offering Price Per Share | | $ | 22.02 | | |
CLASS L: | |
Net Assets | | $ | 2,570 | | |
| Shares Outstanding $0.001 par value shares of beneficial interest (unlimited shares authorized) (not in 000's) | | | 124,498 | | |
Net Asset Value, Offering and Redemption Price Per Share | | $ | 20.65 | | |
CLASS C: | |
Net Assets | | $ | 2,857 | | |
| Shares Outstanding $0.001 par value shares of beneficial interest (unlimited shares authorized) (not in 000's) | | | 139,974 | | |
Net Asset Value, Offering and Redemption Price Per Share | | $ | 20.41 | | |
CLASS IS: | |
Net Assets | | $ | 16,344 | | |
| Shares Outstanding $0.001 par value shares of beneficial interest (unlimited shares authorized) (not in 000's) | | | 777,597 | | |
Net Asset Value, Offering and Redemption Price Per Share | | $ | 21.02 | | |
The accompanying notes are an integral part of the financial statements.
10
Morgan Stanley Institutional Fund, Inc.
Annual Report — December 31, 2017
Frontier Markets Portfolio
Statement of Operations | | Year Ended
December 31, 2017
(000) | |
Investment Income: | |
Dividends from Securities of Unaffiliated Issuers (Net of $1,206 of Foreign Taxes Withheld) | | $ | 17,530 | | |
Dividends from Security of Affiliated Issuer (Note G) | | | 92 | | |
Total Investment Income | | | 17,622 | | |
Expenses: | |
Advisory Fees (Note B) | | | 8,625 | | |
Custodian Fees (Note F) | | | 1,726 | | |
Sub Transfer Agency Fees — Class I | | | 446 | | |
Sub Transfer Agency Fees — Class A | | | 139 | | |
Sub Transfer Agency Fees — Class L | | | 2 | | |
Sub Transfer Agency Fees — Class C | | | 2 | | |
Administration Fees (Note C) | | | 552 | | |
Shareholder Services Fees — Class A (Note D) | | | 225 | | |
Distribution and Shareholder Services Fees — Class L (Note D) | | | 19 | | |
Distribution and Shareholder Services Fees — Class C (Note D) | | | 26 | | |
Professional Fees | | | 150 | | |
Transfer Agency Fees — Class I (Note E) | | | 90 | | |
Transfer Agency Fees — Class A (Note E) | | | 5 | | |
Transfer Agency Fees — Class L (Note E) | | | 8 | | |
Transfer Agency Fees — Class C (Note E) | | | 3 | | |
Transfer Agency Fees — Class IS (Note E) | | | 7 | | |
Registration Fees | | | 110 | | |
Shareholder Reporting Fees | | | 67 | | |
Directors' Fees and Expenses | | | 20 | | |
Pricing Fees | | | 7 | | |
Other Expenses | | | 43 | | |
Expenses Before Non Operating Expenses | | | 12,272 | | |
Bank Overdraft Expense | | | 3 | | |
Total Expenses | | | 12,275 | | |
Rebate from Morgan Stanley Affiliate (Note G) | | | (20 | ) | |
Reimbursement of Class Specific Expenses — Class L (Note B) | | | (2 | ) | |
Net Expenses | | | 12,253 | | |
Net Investment Income | | | 5,369 | | |
Realized Gain (Loss): | |
Investments Sold (Net of $2,274 of Capital Gain Country Tax) | | | 57,720 | | |
Foreign Currency Transactions | | | (1,452 | ) | |
Net Realized Gain | | | 56,268 | | |
Change in Unrealized Appreciation (Depreciation): | |
Investments (Net of Decrease in Deferred Capital Gain Country Tax of $5,953) | | | 67,869 | | |
Foreign Currency Translations | | | (11 | ) | |
Net Change in Unrealized Appreciation (Depreciation) | | | 67,858 | | |
Net Realized Gain and Change in Unrealized Appreciation (Depreciation) | | | 124,126 | | |
Net Increase in Net Assets Resulting from Operations | | $ | 129,495 | | |
The accompanying notes are an integral part of the financial statements.
11
Morgan Stanley Institutional Fund, Inc.
Annual Report — December 31, 2017
Frontier Markets Portfolio
Statements of Changes in Net Assets | | Year Ended
December 31, 2017
(000) | | Year Ended
December 31, 2016
(000) | |
Increase (Decrease) in Net Assets: | |
Operations: | |
Net Investment Income | | $ | 5,369 | | | $ | 11,125 | | |
Net Realized Gain (Loss) | | | 56,268 | | | | (65,651 | ) | |
Net Change in Unrealized Appreciation (Depreciation) | | | 67,858 | | | | 79,451 | | |
Net Increase in Net Assets Resulting from Operations | | | 129,495 | | | | 24,925 | | |
Distributions from and/or in Excess of: | |
Class I: | |
Net Investment Income | | | — | | | | (6,910 | ) | |
Paid-in-Capital | | | — | | | | (132 | ) | |
Class A: | |
Net Investment Income | | | — | | | | (900 | ) | |
Paid-in-Capital | | | — | | | | (23 | ) | |
Class L: | |
Net Investment Income | | | — | | | | (2 | ) | |
Paid-in-Capital | | | — | | | | (1 | ) | |
Class C: | |
Net Investment Income | | | — | | | | (5 | ) | |
Paid-in-Capital | | | — | | | | (1 | ) | |
Class IS: | |
Net Investment Income | | | — | | | | (163 | ) | |
Paid-in-Capital | | | — | | | | (3 | ) | |
Total Distributions | | | — | | | | (8,140 | ) | |
Capital Share Transactions:(1) | |
Class I: | |
Subscribed | | | 209,840 | | | | 227,451 | | |
Distributions Reinvested | | | — | | | | 4,530 | | |
Redeemed | | | (212,122 | ) | | | (252,360 | ) | |
Class A: | |
Subscribed | | | 15,862 | | | | 33,925 | | |
Distributions Reinvested | | | — | | | | 923 | | |
Redeemed | | | (37,356 | ) | | | (28,799 | ) | |
Class L: | |
Distributions Reinvested | | | — | | | | 3 | | |
Redeemed | | | (526 | ) | | | (1,934 | ) | |
Class C: | |
Subscribed | | | 1,066 | | | | 663 | | |
Distributions Reinvested | | | — | | | | 6 | | |
Redeemed | | | (578 | ) | | | (193 | ) | |
Class IS: | |
Subscribed | | | 16,912 | | | | 4,172 | | |
Distributions Reinvested | | | — | | | | 166 | | |
Redeemed | | | (15,164 | ) | | | (295 | ) | |
Net Decrease in Net Assets Resulting from Capital Share Transactions | | | (22,066 | ) | | | (11,742 | ) | |
Redemption Fees | | | 10 | | | | 19 | | |
Total Increase in Net Assets | | | 107,439 | | | | 5,062 | | |
Net Assets: | |
Beginning of Period | | | 633,091 | | | | 628,029 | | |
End of Period (Including Accumulated Undistributed Net Investment Income and Distributions in Excess of
Net Investment Income of $1,389 and $(253), respectively) | | $ | 740,530 | | | $ | 633,091 | | |
The accompanying notes are an integral part of the financial statements.
12
Morgan Stanley Institutional Fund, Inc.
Annual Report — December 31, 2017
Frontier Markets Portfolio
Statements of Changes in Net Assets (cont'd) | | Year Ended
December 31, 2017
(000) | | Year Ended
December 31, 2016
(000) | |
(1) Capital Share Transactions: | |
Class I: | |
Shares Subscribed | | | 10,845 | | | | 13,505 | | |
Shares Issued on Distributions Reinvested | | | — | | | | 267 | | |
Shares Redeemed | | | (10,982 | ) | | | (14,884 | ) | |
Net Decrease in Class I Shares Outstanding | | | (137 | ) | | | (1,112 | ) | |
Class A: | |
Shares Subscribed | | | 851 | | | | 2,007 | | |
Shares Issued on Distributions Reinvested | | | — | | | | 55 | | |
Shares Redeemed | | | (1,958 | ) | | | (1,697 | ) | |
Net Increase (Decrease) in Class A Shares Outstanding | | | (1,107 | ) | | | 365 | | |
Class L: | |
Shares Issued on Distributions Reinvested | | | — | | | | — | @@ | |
Shares Redeemed | | | (28 | ) | | | (115 | ) | |
Net Decrease in Class L Shares Outstanding | | | (28 | ) | | | (115 | ) | |
Class C: | |
Shares Subscribed | | | 57 | | | | 41 | | |
Shares Issued on Distributions Reinvested | | | — | | | | — | @@ | |
Shares Redeemed | | | (30 | ) | | | (12 | ) | |
Net Increase in Class C Shares Outstanding | | | 27 | | | | 29 | | |
Class IS: | |
Shares Subscribed | | | 863 | | | | 245 | | |
Shares Issued on Distributions Reinvested | | | — | | | | 10 | | |
Shares Redeemed | | | (779 | ) | | | (17 | ) | |
Net Increase in Class IS Shares Outstanding | | | 84 | | | | 238 | | |
@@ Amount is less than 500 shares.
The accompanying notes are an integral part of the financial statements.
13
Morgan Stanley Institutional Fund, Inc.
Annual Report — December 31, 2017
Financial Highlights
Frontier Markets Portfolio
| | | Class I | |
| | | Year Ended December 31, | |
Selected Per Share Data and Ratios | | 2017 | | 2016(1) | | 2015 | | 2014 | | 2013 | |
Net Asset Value, Beginning of Period | | $ | 17.39 | | | $ | 16.98 | | | $ | 19.15 | | | $ | 18.86 | | | $ | 14.24 | | |
Income (Loss) from Investment Operations: | |
Net Investment Income(2) | | | 0.16 | | | | 0.31 | | | | 0.19 | | | | 0.25 | | | | 0.09 | | |
Net Realized and Unrealized Gain (Loss) | | | 3.47 | | | | 0.33 | | | | (2.21 | ) | | | 0.23 | | | | 4.60 | | |
Total from Investment Operations | | | 3.63 | | | | 0.64 | | | | (2.02 | ) | | | 0.48 | | | | 4.69 | | |
Distributions from and/or in Excess of: | |
Net Investment Income | | | — | | | | (0.23 | ) | | | (0.14 | ) | | | (0.18 | ) | | | (0.07 | ) | |
Paid-in-Capital | | | — | | | | (0.00 | )(3) | | | (0.01 | ) | | | (0.01 | ) | | | — | | |
Total Distributions | | | — | | | | (0.23 | ) | | | (0.15 | ) | | | (0.19 | ) | | | (0.07 | ) | |
Redemption Fees | | | 0.00 | (3) | | | 0.00 | (3) | | | 0.00 | (3) | | | 0.00 | (3) | | | 0.00 | (3) | |
Net Asset Value, End of Period | | $ | 21.02 | | | $ | 17.39 | | | $ | 16.98 | | | $ | 19.15 | | | $ | 18.86 | | |
Total Return(4) | | | 20.82 | % | | | 3.83 | % | | | (10.58 | )% | | | 2.66 | % | | | 32.95 | % | |
Ratios and Supplemental Data: | |
Net Assets, End of Period (Thousands) | | $ | 632,435 | | | $ | 525,664 | | | $ | 531,927 | | | $ | 547,535 | | | $ | 239,378 | | |
Ratio of Expenses to Average Net Assets(7) | | | 1.73 | %(5) | | | 1.67 | %(5) | | | 1.72 | %(5) | | | 1.69 | %(5) | | | 1.77 | %(5) | |
Ratio of Expenses to Average Net Assets Excluding Non Operating Expenses | | | 1.73 | %(5) | | | N/A | | | | N/A | | | | 1.71 | %(5) | | | N/A | | |
Ratio of Net Investment Income to Average Net Assets(7) | | | 0.82 | %(5) | | | 1.82 | %(5) | | | 1.02 | %(5) | | | 1.23 | %(5) | | | 0.54 | %(5) | |
Ratio of Rebate from Morgan Stanley Affiliates to Average Net Assets | | | 0.00 | %(6) | | | 0.00 | %(6) | | | 0.00 | %(6) | | | 0.01 | % | | | 0.01 | % | |
Portfolio Turnover Rate | | | 52 | % | | | 30 | % | | | 37 | % | | | 52 | % | | | 34 | % | |
(7) Supplemental Information on the Ratios to Average Net Assets: | |
Ratios Before Expense Limitation: | |
Expenses to Average Net Assets | | | N/A | | | | 1.69 | % | | | N/A | | | | 1.72 | % | | | 1.89 | % | |
Net Investment Income to Average Net Assets | | | N/A | | | | 1.80 | % | | | N/A | | | | 1.20 | % | | | 0.42 | % | |
(1) Reflects prior period custodian out-of-pocket expenses that were reimbursed in September 2016. The amount of the reimbursement was immaterial on a per share basis and did not impact the total return of Class I shares. The Ratio of Expenses to Average Net Assets would have been 0.01% higher and the Ratio of Net Investment Income to Average Net Assets would have been 0.01% lower had the custodian not reimbursed the Fund.
(2) Per share amount is based on average shares outstanding.
(3) Amount is less than $0.005 per share.
(4) Calculated based on the net asset value as of the last business day of the period.
(5) The Ratios of Expenses and Net Investment Income reflect the rebate of certain Fund expenses in connection with the investments in Morgan Stanley affiliates during the period. The effect of the rebate on the ratios is disclosed in the above table as "Ratio of Rebate from Morgan Stanley Affiliates to Average Net Assets."
(6) Amount is less than 0.005%.
The accompanying notes are an integral part of the financial statements.
14
Morgan Stanley Institutional Fund, Inc.
Annual Report — December 31, 2017
Financial Highlights
Frontier Markets Portfolio
| | | Class A | |
| | | Year Ended December 31, | |
Selected Per Share Data and Ratios | | 2017 | | 2016(1) | | 2015 | | 2014 | | 2013 | |
Net Asset Value, Beginning of Period | | $ | 17.31 | | | $ | 16.90 | | | $ | 19.06 | | | $ | 18.78 | | | $ | 14.20 | | |
Income (Loss) from Investment Operations: | |
Net Investment Income (Loss)(2) | | | 0.11 | | | | 0.24 | | | | 0.11 | | | | 0.18 | | | | (0.15 | ) | |
Net Realized and Unrealized Gain (Loss) | | | 3.44 | | | | 0.35 | | | | (2.18 | ) | | | 0.24 | | | | 4.79 | | |
Total from Investment Operations | | | 3.55 | | | | 0.59 | | | | (2.07 | ) | | | 0.42 | | | | 4.64 | | |
Distributions from and/or in Excess of: | |
Net Investment Income | | | — | | | | (0.18 | ) | | | (0.08 | ) | | | (0.13 | ) | | | (0.06 | ) | |
Paid-in-Capital | | | — | | | | (0.00 | )(3) | | | (0.01 | ) | | | (0.01 | ) | | | — | | |
Total Distributions | | | — | | | | (0.18 | ) | | | (0.09 | ) | | | (0.14 | ) | | | (0.06 | ) | |
Redemption Fees | | | 0.00 | (3) | | | 0.00 | (3) | | | 0.00 | (3) | | | 0.00 | (3) | | | 0.00 | (3) | |
Net Asset Value, End of Period | | $ | 20.86 | | | $ | 17.31 | | | $ | 16.90 | | | $ | 19.06 | | | $ | 18.78 | | |
Total Return(4) | | | 20.39 | % | | | 3.49 | % | | | (10.90 | )% | | | 2.39 | % | | | 32.53 | % | |
Ratios and Supplemental Data: | |
Net Assets, End of Period (Thousands) | | $ | 86,324 | | | $ | 90,817 | | | $ | 82,480 | | | $ | 76,839 | | | $ | 23,762 | | |
Ratio of Expenses to Average Net Assets(8) | | | 2.05 | %(5) | | | 2.01 | %(5) | | | 2.07 | %(5) | | | 2.02 | %(5) | | | 1.95 | %(5)(6) | |
Ratio of Expenses to Average Net Assets Excluding Non Operating Expenses | | | 2.05 | %(5) | | | N/A | | | | N/A | | | | 2.04 | %(5) | | | N/A | | |
Ratio of Net Investment Income (Loss) to Average Net Assets(8) | | | 0.59 | %(5) | | | 1.40 | %(5) | | | 0.60 | %(5) | | | 0.90 | %(5) | | | (0.81 | )%(5) | |
Ratio of Rebate from Morgan Stanley Affiliates to Average Net Assets | | | 0.00 | %(7) | | | 0.00 | %(7) | | | 0.00 | %(7) | | | 0.01 | % | | | 0.01 | % | |
Portfolio Turnover Rate | | | 52 | % | | | 30 | % | | | 37 | % | | | 52 | % | | | 34 | % | |
(8) Supplemental Information on the Ratios to Average Net Assets: | |
Ratios Before Expense Limitation: | |
Expenses to Average Net Assets | | | N/A | | | | 2.03 | % | | | N/A | | | | 2.05 | % | | | N/A | | |
Net Investment Income to Average Net Assets | | | N/A | | | | 1.38 | % | | | N/A | | | | 0.87 | % | | | N/A | | |
(1) Reflects prior period custodian out-of-pocket expenses that were reimbursed in September 2016. The amount of the reimbursement was immaterial on a per share basis and did not impact the total return of Class A shares. The Ratio of Expenses to Average Net Assets would have been 0.01% higher and the Ratio of Net Investment Income to Average Net Assets would have been 0.01% lower had the custodian not reimbursed the Fund.
(2) Per share amount is based on average shares outstanding.
(3) Amount is less than $0.005 per share.
(4) Calculated based on the net asset value which does not reflect sales charges, if applicable, as of the last business day of the period.
(5) The Ratios of Expenses and Net Investment Income (Loss) reflect the rebate of certain Fund expenses in connection with the investments in Morgan Stanley affiliates during the period. The effect of the rebate on the ratios is disclosed in the above table as "Ratio of Rebate from Morgan Stanley Affiliates to Average Net Assets."
(6) Effective September 16, 2013, the Adviser has agreed to limit the ratio of expenses to average net assets to the maximum ratio of 2.20% for Class A shares. Prior to September 16, 2013, the maximum ratio was 2.10% for Class A shares.
(7) Amount is less than 0.005%.
The accompanying notes are an integral part of the financial statements.
15
Morgan Stanley Institutional Fund, Inc.
Annual Report — December 31, 2017
Financial Highlights
Frontier Markets Portfolio
| | | Class L | |
| | | Year Ended December 31, | |
Selected Per Share Data and Ratios | | 2017 | | 2016(1) | | 2015 | | 2014 | | 2013 | |
Net Asset Value, Beginning of Period | | $ | 17.25 | | | $ | 16.79 | | | $ | 18.96 | | | $ | 18.71 | | | $ | 14.19 | | |
Income (Loss) from Investment Operations: | |
Net Investment Income (Loss)(2) | | | (0.02 | ) | | | 0.15 | | | | 0.05 | | | | 0.06 | | | | (0.16 | ) | |
Net Realized and Unrealized Gain (Loss) | | | 3.42 | | | | 0.32 | | | | (2.22 | ) | | | 0.25 | | | | 4.69 | | |
Total from Investment Operations | | | 3.40 | | | | 0.47 | | | | (2.17 | ) | | | 0.31 | | | | 4.53 | | |
Distributions from and/or in Excess of: | |
Net Investment Income | | | — | | | | (0.01 | ) | | | — | | | | (0.05 | ) | | | (0.01 | ) | |
Paid-in-Capital | | | — | | | | (0.00 | )(3) | | | — | | | | (0.01 | ) | | | — | | |
Total Distributions | | | — | | | | (0.01 | ) | | | — | | | | (0.06 | ) | | | (0.01 | ) | |
Redemption Fees | | | 0.00 | (3) | | | 0.00 | (3) | | | 0.00 | (3) | | | 0.00 | (3) | | | 0.00 | (3) | |
Net Asset Value, End of Period | | $ | 20.65 | | | $ | 17.25 | | | $ | 16.79 | | | $ | 18.96 | | | $ | 18.71 | | |
Total Return(4) | | | 19.59 | % | | | 2.77 | % | | | (11.49 | )% | | | 1.77 | % | | | 31.81 | % | |
Ratios and Supplemental Data: | |
Net Assets, End of Period (Thousands) | | $ | 2,570 | | | $ | 2,630 | | | $ | 4,490 | | | $ | 8,003 | | | $ | 3,212 | | |
Ratio of Expenses to Average Net Assets(8) | | | 2.70 | %(5) | | | 2.70 | %(5) | | | 2.70 | %(5) | | | 2.65 | %(5) | | | 2.53 | %(5)(6) | |
Ratio of Expenses to Average Net Assets Excluding Non Operating Expenses | | | 2.70 | %(5) | | | N/A | | | | N/A | | | | 2.67 | %(5) | | | N/A | | |
Ratio of Net Investment Income (Loss) to Average Net Assets(8) | | | (0.13 | )%(5) | | | 0.88 | %(5) | | | 0.26 | %(5) | | | 0.27 | %(5) | | | (0.92 | )%(5) | |
Ratio of Rebate from Morgan Stanley Affiliates to Average Net Assets | | | 0.00 | %(7) | | | 0.00 | %(7) | | | 0.00 | %(7) | | | 0.01 | % | | | 0.00 | %(7) | |
Portfolio Turnover Rate | | | 52 | % | | | 30 | % | | | 37 | % | | | 52 | % | | | 34 | % | |
(8) Supplemental Information on the Ratios to Average Net Assets: | |
Ratios Before Expense Limitation: | |
Expenses to Average Net Assets | | | 2.76 | % | | | 2.80 | % | | | 2.73 | % | | | 2.68 | % | | | N/A | | |
Net Investment Income (Loss) to Average Net Assets | | | (0.19 | )% | | | 0.78 | % | | | 0.23 | % | | | 0.24 | % | | | N/A | | |
(1) Reflects prior period custodian out-of-pocket expenses that were reimbursed in September 2016. The amount of the reimbursement was immaterial on a per share basis and did not impact the total return of Class L shares. The Ratio of Expenses to Average Net Assets and the Ratio of Net Investment Income to Average Net Assets would be unchanged as the reimbursement of custodian fees was offset against expense waivers/reimbursements with no impact to net expenses or net investment income.
(2) Per share amount is based on average shares outstanding.
(3) Amount is less than $0.005 per share.
(4) Calculated based on the net asset value as of the last business day of the period.
(5) The Ratios of Expenses and Net Investment Income (Loss) reflect the rebate of certain Fund expenses in connection with the investments in Morgan Stanley affiliates during the period. The effect of the rebate on the ratios is disclosed in the above table as "Ratio of Rebate from Morgan Stanley Affiliates to Average Net Assets."
(6) Effective September 16, 2013, the Adviser has agreed to limit the ratio of expenses to average net assets to the maximum ratio of 2.70% for Class L shares. Prior to September 16, 2013, the maximum ratio was 2.60% for Class L shares.
(7) Amount is less than 0.005%.
The accompanying notes are an integral part of the financial statements.
16
Morgan Stanley Institutional Fund, Inc.
Annual Report — December 31, 2017
Financial Highlights
Frontier Markets Portfolio
| | | Class C | |
| | | Year Ended December 31, | | Period from
April 30, 2015(2) to | |
Selected Per Share Data and Ratios | | 2017 | | 2016(1) | | December 31, 2015 | |
Net Asset Value, Beginning of Period | | $ | 17.07 | | | $ | 16.69 | | | $ | 19.53 | | |
Income (Loss) from Investment Operations: | |
Net Investment Income (Loss)(3) | | | (0.05 | ) | | | 0.10 | | | | (0.16 | ) | |
Net Realized and Unrealized Gain (Loss) | | | 3.39 | | | | 0.34 | | | | (2.60 | ) | |
Total from Investment Operations | | | 3.34 | | | | 0.44 | | | | (2.76 | ) | |
Distributions from and/or in Excess of: | |
Net Investment Income | | | — | | | | (0.06 | ) | | | (0.07 | ) | |
Paid-in-Capital | | | — | | | | (0.00 | )(4) | | | (0.01 | ) | |
Total Distributions | | | — | | | | (0.06 | ) | | | (0.08 | ) | |
Redemption Fees | | | 0.00 | (4) | | | 0.00 | (4) | | | 0.00 | (4) | |
Net Asset Value, End of Period | | $ | 20.41 | | | $ | 17.07 | | | $ | 16.69 | | |
Total Return(5) | | | 19.51 | % | | | 2.63 | % | | | (14.10 | )%(8) | |
Ratios and Supplemental Data: | |
Net Assets, End of Period (Thousands) | | $ | 2,857 | | | $ | 1,925 | | | $ | 1,400 | | |
Ratio of Expenses to Average Net Assets(10) | | | 2.81 | %(6) | | | 2.88 | %(6) | | | 2.95 | %(6)(9) | |
Ratio of Expenses to Average Net Assets Excluding Non Operating Expenses | | | 2.81 | %(6) | | | N/A | | | | N/A | | |
Ratio of Net Investment Income (Loss) to Average Net Assets(10) | | | (0.26 | )%(6) | | | 0.57 | %(6) | | | (1.38 | )%(6)(9) | |
Ratio of Rebate from Morgan Stanley Affiliates to Average Net Assets | | | 0.00 | %(7) | | | 0.00 | %(7) | | | 0.00 | %(7)(9) | |
Portfolio Turnover Rate | | | 52 | % | | | 30 | % | | | 37 | % | |
(10) Supplemental Information on the Ratios to Average Net Assets: | |
Ratios Before Expense Limitation: | |
Expenses to Average Net Assets | | | N/A | | | | 2.89 | % | | | 3.17 | %(9) | |
Net Investment Income (Loss) to Average Net Assets | | | N/A | | | | 0.56 | % | | | (1.60 | )%(9) | |
(1) Reflects prior period custodian out-of-pocket expenses that were reimbursed in September 2016. The amount of the reimbursement was immaterial on a per share basis and did not impact the total return of Class C shares. The Ratio of Expenses to Average Net Assets would have been 0.01% higher and the Ratio of Net Investment Income to Average Net Assets would have been 0.01% lower had the custodian not reimbursed the Fund.
(2) Commencement of Offering.
(3) Per share amount is based on average shares outstanding.
(4) Amount is less than $0.005 per share.
(5) Calculated based on the net asset value which does not reflect sales charges, if applicable, as of the last business day of the period.
(6) The Ratios of Expenses and Net Investment Income (Loss) reflect the rebate of certain Fund expenses in connection with the investments in Morgan Stanley affiliates during the period. The effect of the rebate on the ratios is disclosed in the above table as "Ratio of Rebate from Morgan Stanley Affiliates to Average Net Assets."
(7) Amount is less than 0.005%.
(8) Not annualized.
(9) Annualized.
The accompanying notes are an integral part of the financial statements.
17
Morgan Stanley Institutional Fund, Inc.
Annual Report — December 31, 2017
Financial Highlights
Frontier Markets Portfolio
| | | Class IS | |
| | | Year Ended December 31, | | Period from
February 27, 2015(2) to | |
Selected Per Share Data and Ratios | | 2017 | | 2016(1) | | December 31, 2015 | |
Net Asset Value, Beginning of Period | | $ | 17.39 | | | $ | 16.97 | | | $ | 19.28 | | |
Income (Loss) from Investment Operations: | |
Net Investment Income(3) | | | 0.13 | | | | 0.30 | | | | 0.26 | | |
Net Realized and Unrealized Gain (Loss) | | | 3.50 | | | | 0.36 | | | | (2.41 | ) | |
Total from Investment Operations | | | 3.63 | | | | 0.66 | | | | (2.15 | ) | |
Distributions from and/or in Excess of: | |
Net Investment Income | | | — | | | | (0.24 | ) | | | (0.15 | ) | |
Paid-in-Capital | | | — | | | | (0.00 | )(4) | | | (0.01 | ) | |
Total Distributions | | | — | | | | (0.24 | ) | | | (0.16 | ) | |
Redemption Fees | | | 0.00 | (4) | | | 0.00 | (4) | | | 0.00 | (4) | |
Net Asset Value, End of Period | | $ | 21.02 | | | $ | 17.39 | | | $ | 16.97 | | |
Total Return(5) | | | 20.83 | % | | | 3.88 | % | | | (11.14 | )%(8) | |
Ratios and Supplemental Data: | |
Net Assets, End of Period (Thousands) | | $ | 16,344 | | | $ | 12,055 | | | $ | 7,732 | | |
Ratio of Expenses to Average Net Assets(10) | | | 1.69 | %(6) | | | 1.62 | %(6) | | | 1.68 | %(6)(9) | |
Ratio of Expenses to Average Net Assets Excluding Non Operating Expenses | | | 1.69 | %(6) | | | N/A | | | | N/A | | |
Ratio of Net Investment Income to Average Net Assets(10) | | | 0.65 | %(6) | | | 1.75 | %(6) | | | 1.67 | %(6)(9) | |
Ratio of Rebate from Morgan Stanley Affiliates to Average Net Assets | | | 0.00 | %(7) | | | 0.00 | %(7) | | | 0.00 | %(7)(9) | |
Portfolio Turnover Rate | | | 52 | % | | | 30 | % | | | 37 | % | |
(10) Supplemental Information on the Ratios to Average Net Assets: | |
Ratios Before Expense Limitation: | |
Expenses to Average Net Assets | | | N/A | | | | 1.64 | % | | | 1.68 | %(9) | |
Net Investment Income to Average Net Assets | | | N/A | | | | 1.73 | % | | | 1.67 | %(9) | |
(1) Reflects prior period custodian out-of-pocket expenses that were reimbursed in September 2016. The amount of the reimbursement was immaterial on a per share basis and did not impact the total return of Class IS shares. The Ratio of Expenses to Average Net Assets would have been 0.01% higher and the Ratio of Net Investment Income to Average Net Assets would have been 0.01% lower had the custodian not reimbursed the Fund.
(2) Commencement of Offering.
(3) Per share amount is based on average shares outstanding.
(4) Amount is less than $0.005 per share.
(5) Calculated based on the net asset value as of the last business day of the period.
(6) The Ratios of Expenses and Net Investment Income reflect the rebate of certain Fund expenses in connection with the investments in Morgan Stanley affiliates during the period. The effect of the rebate on the ratios is disclosed in the above table as "Ratio of Rebate from Morgan Stanley Affiliates to Average Net Assets."
(7) Amount is less than 0.005%.
(8) Not annualized.
(9) Annualized.
The accompanying notes are an integral part of the financial statements.
18
Morgan Stanley Institutional Fund, Inc.
Annual Report — December 31, 2017
Notes to Financial Statements
Morgan Stanley Institutional Fund, Inc. (the "Company") is registered under the Investment Company Act of 1940, as amended (the "Act"), as an open-end management investment company. The Company is comprised of twenty-nine separate, active, diversified and non-diversified funds (individually referred to as a "Fund", collectively as the "Funds"). The Company applies investment company accounting and reporting guidance.
The accompanying financial statements relate to the Frontier Markets Portfolio (name changed on March 31, 2017, formerly Frontier Emerging Markets Portfolio). The Fund seeks long-term capital appreciation.
The Fund offers five classes of shares — Class I, Class A, Class L, Class C and Class IS. On April 30, 2015, the Fund suspended offering of Class L shares. Existing Class L shareholders may invest through reinvestment of dividends and distributions.
A. Significant Accounting Policies: The following significant accounting policies are in conformity with U.S. generally accepted accounting principles ("GAAP"). Such policies are consistently followed by the Company in the preparation of its financial statements. GAAP may require management to make estimates and assumptions that affect the reported amounts and disclosures in the financial statements. Actual results may differ from those estimates.
1. Security Valuation: (1) An equity portfolio security listed or traded on an exchange is valued at its latest reported sales price (or at the exchange official closing price if such exchange reports an official closing price), and if there were no sales on a given day and if there is no official exchange closing price for that day, the security is valued at the mean between the last reported bid and asked prices if such bid and asked prices are available on the relevant exchanges. Listed equity securities not traded on the valuation date with no reported bid and asked prices available on the exchange are valued at the mean between the current bid and asked prices obtained from one or more reputable brokers or dealers. In cases where a security is traded on more than one exchange, the security is valued on the exchange designated as the primary market; (2) all other equity portfolio securities for which over-the-counter ("OTC") market quotations are readily available are valued at the latest reported sales price (or at the market official closing price if such market reports an official closing price), and if there was no trading in the security on a
given day and if there is no official closing price from relevant markets for that day, the security is valued at the mean between the last reported bid and asked prices if such bid and asked prices are available on the relevant markets. An unlisted equity security that does not trade on the valuation date and for which bid and asked prices from the relevant markets are unavailable is valued at the mean between the current bid and asked prices obtained from one or more reputable brokers or dealers; (3) certain portfolio securities may be valued by an outside pricing service/vendor approved by the Company's Board of Directors (the "Directors"). The pricing service/vendor may employ a pricing model that takes into account, among other things, bids, yield spreads, and/or other market data and specific security characteristics. Alternatively, if a valuation is not available from an outside pricing service/vendor, and the security trades on an exchange, the security may be valued at its latest reported sale price (or at the exchange official closing price if such exchange reports an official closing price), prior to the time when assets are valued. If there are no sales on a given day and if there is no official exchange closing price for that day, the security is valued at the mean between the last reported bid and asked prices if such bid and asked prices are available in the relevant exchanges; (4) when market quotations are not readily available, including circumstances under which Morgan Stanley Investment Management Inc. (the "Adviser") determines that the closing price, last sale price or the mean between the last reported bid and asked prices are not reflective of a security's market value, portfolio securities are valued at their fair value as determined in good faith under procedures established by and under the general supervision of the Directors. Occasionally, developments affecting the closing prices of securities and other assets may occur between the times at which valuations of such securities are determined (that is, close of the foreign market on which the securities trade) and the close of business of the New York Stock Exchange ("NYSE"). If developments occur during such periods that are expected to materially affect the value of such securities, such valuations may be adjusted to reflect the estimated fair value of such securities as of the close of the NYSE, as determined in good faith by the Directors or by the Adviser using a pricing service and/or procedures approved by the Directors; (5) quotations of foreign portfolio securities, other assets and liabilities and forward contracts stated in foreign currency are translated into U.S. dollar equivalents
19
Morgan Stanley Institutional Fund, Inc.
Annual Report — December 31, 2017
Notes to Financial Statements (cont'd)
at the prevailing market rates prior to the close of the NYSE; and (6) investments in mutual funds, including the Morgan Stanley Institutional Liquidity Funds, are valued at the net asset value ("NAV") as of the close of each business day.
The Directors have responsibility for determining in good faith the fair value of the investments, and the Directors may appoint others, such as the Company's Adviser or a valuation committee, to assist the Directors in determining fair value and to make the actual calculations pursuant to the fair valuation methodologies previously approved by the Directors. Under procedures approved by the Directors, the Company's Adviser has formed a Valuation Committee whose members are approved by the Directors. The Valuation Committee provides administration and oversight of the Company's valuation policies and procedures, which are reviewed at least annually by the Directors. These procedures allow the Company to utilize independent pricing services, quotations from securities and financial instrument dealers, and other market sources to determine fair value.
The Company has procedures to determine the fair value of securities and other financial instruments for which market prices are not readily available. Under these procedures, the Valuation Committee convenes on a regular and ad hoc basis to review such securities and considers a number of factors, including valuation methodologies and significant unobservable valuation inputs, when arriving at fair value. The Valuation Committee may employ a market-based approach which may use related or comparable assets or liabilities, recent transactions, market multiples, book values, and other relevant information for the investment to determine the fair value of the investment. An income-based valuation approach may also be used in which the anticipated future cash flows of the investment are discounted to calculate fair value. Discounts may also be applied due to the nature or duration of any restrictions on the disposition of the investments. Due to the inherent uncertainty of valuations of such investments, the fair values may differ significantly from the values that would have been used had an active market existed. The Valuation Committee employs various methods for calibrating these valuation approaches including a regular review of valuation methodologies, key inputs and assumptions,
transactional back-testing or disposition analysis, and reviews of any related market activity.
2. Fair Value Measurement: Financial Accounting Standards Board ("FASB") Accounting Standards CodificationTM ("ASC") 820, "Fair Value Measurement" ("ASC 820"), defines fair value as the value that the Fund would receive to sell an investment or pay to transfer a liability in a timely transaction with an independent buyer in the principal market, or in the absence of a principal market, the most advantageous market for the investment or liability. ASC 820 establishes a three-tier hierarchy to distinguish between (1) inputs that reflect the assumptions market participants would use in valuing an asset or liability developed based on market data obtained from sources independent of the reporting entity (observable inputs) and (2) inputs that reflect the reporting entity's own assumptions about the assumptions market participants would use in valuing an asset or liability developed based on the best information available in the circumstances (unobservable inputs) and to establish classification of fair value measurements for disclosure purposes. Various inputs are used in determining the value of the Fund's investments. The inputs are summarized in the three broad levels listed below.
• Level 1 – unadjusted quoted prices in active markets for identical investments
• Level 2 – other significant observable inputs (including quoted prices for similar investments, interest rates, prepayment speeds, credit risk, etc.)
• Level 3 – significant unobservable inputs including the Fund's own assumptions in determining the fair value of investments. Factors considered in making this determination may include, but are not limited to, information obtained by contacting the issuer, analysts, or the appropriate stock exchange (for exchange-traded securities), analysis of the issuer's financial statements or other available documents and, if necessary, available information concerning other securities in similar circumstances
The inputs or methodology used for valuing securities are not necessarily an indication of the risk associated with investing in those securities and the determination
20
Morgan Stanley Institutional Fund, Inc.
Annual Report — December 31, 2017
Notes to Financial Statements (cont'd)
of the significance of a particular input to the fair value measurement in its entirety requires judgment and considers factors specific to each security.
The following is a summary of the inputs used to value the Fund's investments as of December 31, 2017.
Investment Type | | Level 1
Unadjusted
quoted
prices
(000) | | Level 2
Other
significant
observable
inputs
(000) | | Level 3
Significant
unobservable
inputs
(000) | | Total
(000) | |
Assets: | |
Common Stocks | |
Air Freight & Logistics | | $ | — | | | $ | 2,031 | | | $ | — | | | $ | 2,031 | | |
Airlines | | | 9,537 | | | | 21,572 | | | | — | | | | 31,109 | | |
Banks | | | 116,611 | | | | 222,829 | | | | — | | | | 339,440 | | |
Beverages | | | — | | | | 26,998 | | | | — | | | | 26,998 | | |
Capital Markets | | | 1,627 | | | | 11,035 | | | | — | | | | 12,662 | | |
Construction Materials | | | 11,698 | | | | 3,454 | | | | — | | | | 15,152 | | |
Diversified Consumer
Services | | | — | | | | 15,024 | | | | — | | | | 15,024 | | |
Diversified
Telecommunication
Services | | | 18,663 | | | | — | | | | — | | | | 18,663 | | |
Food Products | | | — | | | | 42,910 | | | | — | | | | 42,910 | | |
Health Care Providers &
Services | | | — | | | | 26,196 | | | | — | | | | 26,196 | | |
Hotels, Restaurants &
Leisure | | | 12,662 | | | | — | | | | — | | | | 12,662 | | |
Metals & Mining | | | — | | | | 8,363 | | | | — | | | | 8,363 | | |
Oil, Gas & Consumable
Fuels | | | — | | | | 16,812 | | | | — | | | | 16,812 | | |
Pharmaceuticals | | | — | | | | 19,977 | | | | — | | | | 19,977 | | |
Real Estate
Management &
Development | | | 12,768 | | | | 12,161 | | | | — | | | | 24,929 | | |
Specialty Retail | | | — | | | | 2,708 | | | | — | | | | 2,708 | | |
Transportation
Infrastructure | | | — | | | | 21,752 | | | | — | | | | 21,752 | | |
Wireless
Telecommunication
Services | | | — | | | | 56,137 | | | | — | | | | 56,137 | | |
Total Common Stocks | | | 183,566 | | | | 509,959 | | | | — | | | | 693,525 | | |
Participation Notes | | | — | | | | 28,391 | | | | — | | | | 28,391 | | |
Short-Term Investment | |
Investment Company | | | 14,764 | | | | — | | | | — | | | | 14,764 | | |
Total Assets | | $ | 198,330 | | | $ | 538,350 | | | $ | — | | | $ | 736,680 | | |
Transfers between investment levels may occur as the markets fluctuate and/or the availability of data used in an investment's valuation changes. The Fund recognizes transfers between the levels as of the end of the period. As of December 31, 2017, securities with a total value of approximately $312,834,000 transferred from Level 1 to Level 2. Securities that were valued using unadjusted quoted prices at December 31, 2016 were valued using other significant observable inputs at December 31, 2017. At December 31, 2017, the fair value of certain securities
were adjusted due to developments which occurred between the time of the close of the foreign markets on which they trade and the close of business on the NYSE which resulted in their Level 2 classification.
3. Foreign Currency Translation and Foreign Investments: The books and records of the Fund are maintained in U.S. dollars. Foreign currency amounts are translated into U.S. dollars as follows:
– investments, other assets and liabilities at the prevailing rate of exchange on the valuation date;
– investment transactions and investment income at the prevailing rates of exchange on the dates of such transactions.
Although the net assets of the Fund are presented at the foreign exchange rates and market values at the close of the period, the Fund does not isolate that portion of the results of operations arising as a result of changes in the foreign exchange rates from the fluctuations arising from changes in the market prices of securities held at period end. Similarly, the Fund does not isolate the effect of changes in foreign exchange rates from the fluctuations arising from changes in the market prices of securities sold during the period. Accordingly, realized and unrealized foreign currency gains (losses) on investments in securities are included in the reported net realized and unrealized gains (losses) on investment transactions and balances. However, pursuant to U.S. federal income tax regulations, gains and losses from certain foreign currency transactions and the foreign currency portion of gains and losses realized on sales and maturities of foreign denominated debt securities are treated as ordinary income for U.S. federal income tax purposes.
Net realized gains (losses) on foreign currency transactions represent net foreign exchange gains (losses) from foreign currency forward exchange contracts, disposition of foreign currencies, currency gains (losses) realized between the trade and settlement dates on securities transactions, and the difference between the amount of investment income and foreign withholding taxes recorded on the Fund's books and the U.S. dollar equivalent amounts actually received or paid. Net unrealized currency gains (losses) from valuing foreign currency denominated assets and liabilities at period end exchange rates are reflected as a component of unrealized appreciation (depreciation) in the Statement of Assets
21
Morgan Stanley Institutional Fund, Inc.
Annual Report — December 31, 2017
Notes to Financial Statements (cont'd)
and Liabilities. The change in unrealized currency gains (losses) on foreign currency translations for the period is reflected in the Statement of Operations.
A significant portion of the Fund's net assets consist of securities of issuers located in emerging markets, which are denominated in foreign currencies. Such securities may be concentrated in a limited number of countries and regions and may vary throughout the year. Changes in currency exchange rates will affect the value of securities and investment income from foreign currency denominated securities. Emerging market securities are often subject to greater price volatility, limited capitalization and liquidity, and higher rates of inflation than securities of companies based in the U.S. In addition, emerging market issuers may be subject to substantial governmental involvement in the economy and greater social, economic and political uncertainty.
Governmental approval for foreign investments may be required in advance of making an investment under certain circumstances in some countries, and the extent of foreign investments in domestic companies may be subject to limitation in other countries. Foreign ownership limitations also may be imposed by the charters of individual companies to prevent, among other concerns, violations of foreign investment limitations. As a result, an additional class of shares (identified as "Foreign" in the Portfolio of Investments) may be created and offered for investment. The "local" and "foreign shares" market values may differ. In the absence of trading of the foreign shares in such markets, the Fund values the foreign shares at the closing exchange price of the local shares.
4. Structured Investments: The Fund invested a portion of its assets in structured investments. A structured investment is a derivative security designed to offer a return linked to a particular underlying security, currency, commodity or market. Structured investments may come in various forms including notes (such as exchange-traded notes), warrants and options to purchase securities. The Fund will typically use structured investments to gain exposure to a permitted underlying security, currency, commodity or market when direct access to a market is limited or inefficient from a tax or cost standpoint. There can be no assurance that structured investments will trade at the same price or have the same value as the underlying security, currency, commodity or market. Investments in structured investments involve risks including issuer risk,
counterparty risk and market risk. Holders of structured investments bear risks of the underlying investment and are subject to issuer or counterparty risk because the Fund is relying on the creditworthiness of such issuer or counterparty and has no rights with respect to the underlying investment. Certain structured investments may be thinly traded or have a limited trading market and may have the effect of increasing the Fund's illiquidity to the extent that the Fund, at a particular time, may be unable to find qualified buyers for these securities.
5. Redemption Fees: The Fund will assess a 2% redemption fee on Class I shares, Class A shares, Class L shares, Class C shares and Class IS shares, which is paid directly to the Fund, for shares redeemed or exchanged within thirty days of purchase, subject to certain exceptions. The redemption fee is designed to protect the Fund and its remaining shareholders from the effects of short-term trading. These fees, if any, are included in the Statements of Changes in Net Assets.
6. Indemnifications: The Company enters into contracts that contain a variety of indemnifications. The Company's maximum exposure under these arrangements is unknown. However, the Company has not had prior claims or losses pursuant to these contracts and expects the risk of loss to be remote.
7. Dividends and Distributions to Shareholders: Dividend income and distributions to shareholders are recorded on the ex-dividend date. Dividends from net investment income, if any, are declared and paid annually. Net realized capital gains, if any, are distributed at least annually.
8. Security Transactions, Income and Expenses: Security transactions are accounted for on the trade date (date the order to buy or sell is executed). Realized gains and losses on the sale of investment securities are determined on the specific identified cost method. Dividend income and other distributions are recorded on the ex-dividend date (except for certain foreign dividends which may be recorded as soon as the Fund is informed of such dividends) net of applicable withholding taxes. Interest income is recognized on the accrual basis except where collection is in doubt. Discounts are accreted and premiums are amortized over the life of the respective securities. Most expenses of the Company can be directly attributed to a particular Fund. Expenses which cannot be directly
22
Morgan Stanley Institutional Fund, Inc.
Annual Report — December 31, 2017
Notes to Financial Statements (cont'd)
attributed are apportioned among the Funds based upon relative net assets or other appropriate methods. Income, expenses (other than class specific expenses — distribution and shareholder services, transfer agency and sub transfer agency fees) and realized and unrealized gains or losses are allocated to each class of shares based upon their relative net assets.
B. Advisory Fees: The Adviser, a wholly-owned subsidiary of Morgan Stanley, provides the Fund with advisory services under the terms of an Investment Advisory Agreement, paid quarterly, at an annual rate of 1.25% of the daily net assets of the Fund.
The Adviser has agreed to reduce its advisory fee and/or reimburse the Fund so that total annual portfolio operating expenses, excluding certain investment related expenses, taxes, interest and other extraordinary expenses (including litigation), will not exceed 1.85% for Class I shares, 2.20% for Class A shares, 2.70% for Class L shares, 2.95% for Class C shares and 1.80% for Class IS shares. The fee waivers and/or expense reimbursements will continue for at least one year from the date of the Fund's prospectus or until such time as the Directors act to discontinue all or a portion of such waivers and/or reimbursements when they deem such action is appropriate. For the year ended December 31, 2017, approximately $2,000 of other expenses were reimbursed by the Adviser pursuant to this arrangement.
C. Administration Fees: The Adviser also serves as Administrator to the Company and provides administrative services pursuant to an Administration Agreement for an annual fee, accrued daily and paid monthly, of 0.08% of the Fund's average daily net assets.
Under a Sub-Administration Agreement between the Administrator and State Street Bank and Trust Company ("State Street"), State Street provides certain administrative services to the Company. For such services, the Administrator pays State Street a portion of the fee the Administrator receives from the Fund.
D. Distribution and Shareholder Services Fees: Morgan Stanley Distribution, Inc. ("MSDI" or the "Distributor"), a wholly-owned subsidiary of the Adviser and an indirect subsidiary of Morgan Stanley, serves as the Company's Distributor of Fund shares pursuant to a Distribution Agreement. The Company has adopted a Shareholder Services Plan with respect to Class A shares pursuant to Rule 12b-1 under the Act. Under the Shareholder Services Plan, the Fund pays the
Distributor a shareholder services fee, accrued daily and paid monthly, at an annual rate of 0.25% of the Fund's average daily net assets attributable to Class A shares.
The Company has adopted a Distribution and Shareholder Services Plan with respect to Class L shares pursuant to Rule 12b-1 under the Act. Under the Distribution and Shareholder Services Plan, the Fund pays the Distributor a distribution fee, accrued daily and paid monthly, at an annual rate of 0.50% and a shareholder services fee, accrued daily and paid monthly, at an annual rate of 0.25% of the Fund's average daily net assets attributable to Class L shares.
The Company has adopted a Distribution and Shareholder Services Plan with respect to Class C shares pursuant to Rule 12b-1 under the Act. Under the Distribution and Shareholder Services Plan, the Fund pays the Distributor a distribution fee, accrued daily and paid monthly, at an annual rate of 0.75% and a shareholder services fee, accrued daily and paid monthly, at an annual rate of 0.25% of the Fund's average daily net assets attributable to Class C shares.
The distribution and shareholder services fees are used to support the expenses associated with servicing and maintaining accounts. The Distributor may compensate other parties for providing shareholder support services to investors who purchase Class A, Class L and Class C shares.
E. Dividend Disbursing and Transfer Agent: The Company's dividend disbursing and transfer agent is Boston Financial Data Services, Inc. ("BFDS"). Pursuant to a Transfer Agency Agreement, the Company pays BFDS a fee based on the number of classes, accounts and transactions relating to the Funds of the Company. Effective January 1, 2018, BFDS changed its name to DST Asset Manager Solutions, Inc.
F. Custodian Fees: State Street (the "Custodian") also serves as Custodian for the Company in accordance with a Custodian Agreement. The Custodian holds cash, securities, and other assets of the Company as required by the Act. Custody fees are payable monthly based on assets held in custody, investment purchases and sales activity and account maintenance fees, plus reimbursement for certain out-of-pocket expenses.
G. Security Transactions and Transactions with Affiliates: For the year ended December 31, 2017, purchases and sales of investment securities for the Fund, other than long-term U.S. Government securities and short-term investments, were approximately $354,148,000 and $405,356,000, respectively. There were no purchases and sales of long-term
23
Morgan Stanley Institutional Fund, Inc.
Annual Report — December 31, 2017
Notes to Financial Statements (cont'd)
U.S. Government securities for the year ended December 31, 2017.
The Fund invests in the Institutional Class of the Morgan Stanley Institutional Liquidity Funds — Government Portfolio (the "Liquidity Funds"), an open-end management investment company managed by the Adviser. Advisory fees paid by the Fund are reduced by an amount equal to its pro-rata share of the advisory and administration fees paid by the Fund due to its investment in the Liquidity Funds. For the year ended December 31, 2017, advisory fees paid were reduced by approximately $20,000 relating to the Fund's investment in the Liquidity Funds.
A summary of the Fund's transactions in shares of the Liquidity Funds during the year ended December 31, 2017 is as follows:
Affiliated
Investment
Company | | Value
December 31,
2016
(000) | | Purchases
at Cost
(000) | | Proceeds
from Sales
(000) | | Dividend
Income
(000) | |
Liquidity Funds | | $ | 4,479 | | | $ | 248,710 | | | $ | 238,425 | | | $ | 92 | | |
Affiliated
Investment
Company (cont'd) | | Realized
Gain (Loss)
(000) | | Change in
Unrealized
Appreciation
(Depreciation)
(000) | | Value
December 31,
2017
(000) | |
Liquidity Funds | | $ | — | | | $ | — | | | $ | 14,764 | | |
During the year ended December 31, 2017, the Fund incurred approximately $40,000 in brokerage commissions with Morgan Stanley & Co., LLC, an affiliate of the Adviser/Administrator and Distributor, for portfolio transactions executed on behalf of the Fund.
The Fund is permitted to purchase and sell securities ("cross-trade") from and to other Morgan Stanley Funds as well as other funds and client accounts for which the Adviser or an affiliate of the Adviser serves as investment adviser, pursuant to procedures approved by the Directors in compliance with Rule 17a-7 under the Act (the "Rule"). Each cross-trade is executed at the current market price in compliance with provisions of the Rule. For the year ended December 31, 2017, the Fund did not engage in any cross-trade transactions.
The Fund has an unfunded Deferred Compensation Plan (the "Compensation Plan"), which allows each independent Director to defer payment of all, or a portion, of the fees he or she receives for serving on the Board of Directors. Each eligible Director generally may elect to have the deferred amounts credited with a return equal to the total return on one or more of the Morgan Stanley funds that are offered as investment options under the Compensation Plan. Appreciation/depreciation and
distributions received from these investments are recorded with an offsetting increase/decrease in the deferred compensation obligation and do not affect the NAV of the Fund.
H. Federal Income Taxes: It is the Fund's intention to continue to qualify as a regulated investment company and distribute all of its taxable and tax-exempt income. Accordingly, no provision for federal income taxes is required in the financial statements.
The Fund may be subject to taxes imposed by countries in which it invests. Such taxes are generally based on income and/or capital gains earned or repatriated. Taxes are accrued based on net investment income, net realized gains and net unrealized appreciation as such income and/or gains are earned. Taxes may also be based on transactions in foreign currency and are accrued based on the value of investments denominated in such currency.
FASB ASC 740-10, "Income Taxes — Overall", sets forth a minimum threshold for financial statement recognition of the benefit of a tax position taken or expected to be taken in a tax return. Management has concluded there are no significant uncertain tax positions that would require recognition in the financial statements. If applicable, the Fund recognizes interest accrued related to unrecognized tax benefits in "Interest Expense" and penalties in "Other Expenses" in the Statement of Operations. The Fund files tax returns with the U.S. Internal Revenue Service, New York and various states. Generally, each of the tax years in the four-year period ended December 31, 2017, remains subject to examination by taxing authorities.
The tax character of distributions paid may differ from the character of distributions shown in the Statements of Changes in Net Assets due to short-term capital gains being treated as ordinary income for tax purposes. The tax character of distributions paid during fiscal years 2017 and 2016 was as follows:
2017
Distributions
Paid From: | | 2016
Distributions
Paid From: | |
Ordinary
Income
(000) | | Long-Term
Capital Gain
(000) | | Ordinary
Income
(000) | | Long-Term
Capital Gain
(000) | | Paid-in-
Capital
(000) | |
| $ | — | | | $ | — | | | $ | 7,980 | | | $ | — | | | $ | 160 | | |
The amount and character of income and gains to be distributed are determined in accordance with income tax regulations which may differ from GAAP. These book/tax differences are either considered temporary or permanent in nature.
Temporary differences are attributable to differing book and tax treatments for the timing of the recognition of gains
24
Morgan Stanley Institutional Fund, Inc.
Annual Report — December 31, 2017
Notes to Financial Statements (cont'd)
(losses) on certain investment transactions and the timing of the deductibility of certain expenses.
Permanent differences, primarily due to differing treatments of gains (losses) related to foreign currency transactions, foreign capital gains tax and an expired capital loss carryforward, resulted in the following reclassifications among the components of net assets at December 31, 2017:
Accumulated
Undistributed
Net Investment
Income
(000) | | Accumulated
Net Realized
Loss
(000) | | Paid-in-
Capital
(000) | |
| $ | (3,727 | ) | | $ | 7,926 | | | $ | (4,199 | ) | |
At December 31, 2017, the components of distributable earnings for the Fund on a tax basis were as follows:
Undistributed
Ordinary
Income
(000) | | Undistributed
Long-Term
Capital Gain
(000) | |
| $ | 5,633 | | | $ | — | | |
At December 31, 2017, the Fund had available for federal income tax purposes unused short term and long term capital losses of approximately $47,462,000 and $20,653,000, respectively, that do not have an expiration date.
During the year ended December 31, 2017, capital loss carryforwards of approximately $4,191,000 expired for federal income tax purposes.
To the extent that capital loss carryforwards are used to offset any future capital gains realized, no capital gains tax liability will be incurred by the Fund for gains realized and not distributed. To the extent that capital gains are offset, such gains will not be distributed to the shareholders. During the year ended December 31, 2017, the Fund utilized capital loss carryforwards for U.S. federal income tax purposes of approximately $59,822,000.
I. Credit Facility: The Company and other Morgan Stanley funds participated in a $150,000,000 committed, unsecured revolving line of credit facility (the "Facility") with State Street. This Facility is to be used for temporary emergency purposes or funding of shareholder redemption requests. The interest rate on borrowings is based on the federal funds rate or 1 month LIBOR rate plus a spread. The Facility also has a commitment fee of 0.25% per annum based on the unused portion of the Facility. During the year ended December 31, 2017, the Fund did not have any borrowings under the Facility.
J. Other: At December 31, 2017, the Fund had record owners of 10% or greater. Investment activities of these shareholders could have a material impact on the Fund. The aggregate percentage of such owners was 41.9%.
25
Morgan Stanley Institutional Fund, Inc.
Annual Report — December 31, 2017
Report of Independent Registered Public Accounting Firm
To the Shareholders and Board of Directors of
Morgan Stanley Institutional Fund, Inc. —
Frontier Markets Portfolio
Opinion on the Financial Statements
We have audited the accompanying statement of assets and liabilities of Frontier Markets Portfolio (formerly, Frontier Emerging Markets Portfolio) (the "Fund") (one of the funds constituting the Morgan Stanley Institutional Fund, Inc. (the "Company")), including the portfolio of investments, as of December 31, 2017, and the related statement of operations for the year then ended, the statements of changes in net assets for each of the two years in the period then ended, the financial highlights for each of the five years in the period then ended and the related notes (collectively referred to as the "financial statements"). In our opinion, the financial statements present fairly, in all material respects, the financial position of Frontier Markets Portfolio (one of the funds constituting Morgan Stanley Institutional Fund, Inc.) at December 31, 2017, the results of its operations for the year then ended, the changes in its net assets for each of the two years in the period then ended and its financial highlights for each of the five years in the period then ended, in conformity with U.S. generally accepted accounting principles.
Basis for Opinion
These financial statements are the responsibility of the Company's management. Our responsibility is to express an opinion on the Fund's financial statements based on our audits. We are a public accounting firm registered with the Public Company Accounting Oversight Board (United States) ("PCAOB") and are required to be independent with respect to the Company in accordance with the U.S. federal securities law and the applicable rules and regulations of the Securities and Exchange Commission and the PCAOB.
We conducted our audits in accordance with the standards of the PCAOB. Those standards require that we plan and perform the audit to obtain reasonable assurance about whether the financial statements are free of material misstatement, whether due to error or fraud. The Company is not required to have, nor were we engaged to perform, an audit of the Company's internal control over financial reporting. As part of our audits, we are required to obtain an understanding of internal control over financial reporting, but not for the purpose of expressing an opinion on the effectiveness of the Company's internal control over financial reporting. Accordingly, we express no such opinion.
Our audits included performing procedures to assess the risks of material misstatement of the financial statements, whether due to error or fraud, and performing procedures that respond to those risks. Such procedures included examining, on a test basis, evidence regarding the amounts and disclosures in the financial statements. Our procedures included confirmation of securities owned as of December 31, 2017 by correspondence with the custodian and others or by other appropriate auditing procedures where replies from others were not received. Our audits also included evaluating the accounting principles used and significant estimates made by management, as well as evaluating the overall presentation of the financial statements. We believe that our audits provide a reasonable basis for our opinion.

We have served as the auditor of one or more Morgan Stanley investment companies since 2000.
Boston, Massachusetts
February 26, 2018
26
Morgan Stanley Institutional Fund, Inc.
Annual Report — December 31, 2017
Privacy Notice (unaudited)
MORGAN STANLEY INVESTMENT MANAGEMENT INC.
AN IMPORTANT NOTICE CONCERNING OUR U.S. PRIVACY POLICY
We are required by federal law to provide you with a copy of our privacy policy annually. This policy applies to current and former individual investors in funds managed or sponsored by Morgan Stanley Investment Management Inc. ("MSIM") as well as current and former individual clients of MSIM. This policy is not applicable to partnerships, corporations, trusts or other non-individual clients or investors. Please note that we may amend this policy at any time, and will inform you of any changes as required by law.
WE RESPECT YOUR PRIVACY
We appreciate that you have provided us with your personal financial information. We strive to maintain the privacy of such information while we help you achieve your financial objectives. This Notice describes what non-public personal information we collect about you, why we collect it, when we may share it with others and how certain others may use it. It discusses the steps you may take to limit our sharing of certain information about you to affiliated companies in the Morgan Stanley family of companies ("other Morgan Stanley companies"). It also discloses how you may limit use of certain shared information for marketing purposes by other Morgan Stanley branded companies. Throughout this policy, we refer to the non-public information that personally identifies you or your accounts as "personal information.''
1. WHAT PERSONAL INFORMATION DO WE COLLECT ABOUT YOU?
We obtain personal information from applications and other forms you submit to us, from your dealings with us, from consumer reporting agencies, from our Web sites and from third parties and other sources.
For example:
• We may collect information such as your name, address, e-mail address, telephone/fax numbers, assets, income and investment objectives through subscription documents, applications and other forms you submit to us.
• We may obtain information about account balances, your use of account(s) and the types of products and services you prefer to receive from us through your dealings and transactions with us and other sources.
• We may obtain information about your creditworthiness and credit history from consumer reporting agencies.
• We may collect background information from and through third-party vendors to verify representations you have made and to comply with various regulatory requirements.
• If you interact with us through our public and private Web sites, we may collect information that you provide directly through online communications (such as an e-mail address). We may also collect information about your Internet service provider, your domain name, your computer's operating system and Web browser, your use of our Web sites and your product and service preferences, through the use of "cookies." Please consult the Terms of Use of these sites for more details.
2. WHEN DO WE DISCLOSE PERSONAL INFORMATION WE COLLECT ABOUT YOU?
We may disclose personal information we collect about you to other Morgan Stanley companies and to non-affiliated third parties.
a. Information We Disclose to Other Morgan Stanley Companies.
We may disclose personal information to other Morgan Stanley companies for a variety of reasons, including to manage your account(s) effectively, to service and process your transactions, to let you know about products and services offered by us and other Morgan Stanley companies, to manage our business, and as otherwise required or permitted by law. Offers for products and services from other Morgan Stanley companies are developed under conditions designed to safeguard your personal information.
27
Morgan Stanley Institutional Fund, Inc.
Annual Report — December 31, 2017
Privacy Notice (unaudited) (cont'd)
b. Information We Disclose to Non-affiliated Third Parties.
We do not disclose personal information that we collect about you to non-affiliated third parties except to those who provide marketing services on our behalf, to financial institutions with whom we have joint marketing agreements, and as otherwise required or permitted by law. For example, we may disclose personal information to non-affiliated third parties for servicing and processing transactions, to offer our own products and services, to protect against fraud, for institutional risk control, to respond to judicial process or to perform services on our behalf. When we share personal information with a non-affiliated third party, they are required to limit their use of personal information to the particular purpose for which it was shared and they are not allowed to share personal information with others except to fulfill that limited purpose or as may be permitted or required by law.
3. HOW DO WE PROTECT THE SECURITY AND CONFIDENTIALITY OF PERSONAL INFORMATION WE COLLECT ABOUT YOU?
We maintain physical, electronic and procedural security measures to help safeguard the personal information we collect about you. We have internal policies governing the proper handling of client information. Third parties that provide support or marketing services on our behalf may also receive personal information, and we require them to adhere to confidentiality standards with respect to such information.
4. HOW CAN YOU LIMIT THE SHARING OF CERTAIN TYPES OF PERSONAL INFORMATION WITH OTHER MORGAN STANLEY COMPANIES?
We offer you choices as to whether we share with other Morgan Stanley companies the personal information that was collected to determine your eligibility for products and services you request ("eligibility information"). Eligibility information does not include your identification information or personal information pertaining to our transactions or experiences with you. Please note that, even if you direct us not to share eligibility information with other Morgan Stanley companies ("opt-out"), we may still share personal information, including eligibility information, with those companies in circumstances excluded from the opt-out under applicable law, such as to process transactions or to service your account.
5. HOW CAN YOU LIMIT THE USE OF CERTAIN TYPES OF PERSONAL INFORMATION BY OTHER MORGAN STANLEY COMPANIES FOR MARKETING?
By following the opt-out instructions in Section 6 below, you may limit other Morgan Stanley branded companies from marketing their products or services to you based on personal information we disclose to them. This information may include, for example, your income and account history with us. Please note that, even if you choose to limit Other Morgan Stanley Companies from using personal information about you that we may share with them for marketing their products and services to you, Other Morgan Stanley Companies may use your personal information that they obtain from us to market to you in circumstances permitted by law, such as if the Other Morgan Stanley Company has its own relationship with you.
6. HOW CAN YOU SEND US AN OPT-OUT INSTRUCTION?
If you wish to limit our sharing of eligibility information about you with other Morgan Stanley companies or other Morgan Stanley companies' use of personal information for marketing purposes, as described in this notice, you may do so by:
• Calling us at (800) 548-7786
Monday–Friday between 8a.m. and 6p.m.(EST)
• Writing to us at the following address:
DST Asset Manager Solutions, Inc.
c/o Privacy Coordinator
P.O. Box 219804
Kansas City, Missouri 64121
28
Morgan Stanley Institutional Fund, Inc.
Annual Report — December 31, 2017
Privacy Notice (unaudited) (cont'd)
Your written request should include your name, address, telephone number and account number(s) to which the opt-out applies and whether you are opting out with respect to sharing of eligibility information (Section 4 above), or if information used for Marketing (Section 5 above) or both. Written opt-out requests should not be sent with any other correspondence. In order to process your request, we require that the request be provided by you directly and not through a third party.
Your opt-out preference will remain in effect with respect to this policy (as it may be amended) until you notify us otherwise. If you have a joint account, your direction for us not to share this information with other Morgan Stanley companies and for those other Morgan Stanley companies not to use your personal information for marketing will be applied to all account holders on that account. Please understand that if you limit our sharing or our affiliated companies' use of personal information, you and any joint account holder(s) may not receive information about Morgan Stanley products and services, including products or services that could help you manage your financial resources and achieve your investment objectives.
7. WHAT IF AN AFFILIATED COMPANY BECOMES A NON-AFFILIATED THIRD PARTY?
If, at any time in the future, an affiliated company becomes a non-affiliated third party, further disclosures of personal information made to the former affiliated company will be limited to those described in Section 2(b) above relating to non-affiliated third parties. If you elected under Section 6 to limit disclosures we make to affiliated companies, or use of personal information by affiliated companies, your election will not apply to use by any former affiliated company of your personal information in their possession once it becomes a non-affiliated third party.
SPECIAL NOTICE TO RESIDENTS OF VERMONT
The following section supplements our policy with respect to our individual clients who have a Vermont address and supersedes anything to the contrary in the above policy with respect to those clients only.
The state of Vermont requires financial institutions to obtain your consent prior to sharing personal information that they collect about you with affiliated companies and non-affiliated third parties other than in certain limited circumstances. Except as permitted by law, we will not share personal information we collect about you with non-affiliated third parties or other Morgan Stanley companies unless you provide us with your written consent to share such information ("opt-in").
If you wish to receive offers for investment products and services offered by or through other Morgan Stanley companies, please notify us in writing at the following address:
DST Asset Manager Solutions, Inc.
c/o Privacy Coordinator
P.O. Box 219804
Kansas City, Missouri 64121
Your authorization should include your name, address, telephone number and account number(s) to which the opt-in applies and should not be sent with any other correspondence. In order to process your authorization, we require that the authorization be provided by you directly and not through a third party.
SPECIAL NOTICE TO RESIDENTS OF CALIFORNIA
The following section supplements our policy with respect to our individual clients who have a California address and supersedes anything to the contrary in the above policy with respect to those clients only.
In response to a California law, if your account has a California home address, your personal information will not be disclosed to non-affiliated third parties except as permitted by applicable California law, and we will limit sharing such information with our affiliates to comply with California privacy laws that apply to us.
29
Morgan Stanley Institutional Fund, Inc.
Annual Report — December 31, 2017
Director and Officer Information (unaudited)
Independent Directors:
Name, Age and Address of
Independent Director | | Position(s)
Held with
Registrant | | Length of Time
Served* | | Principal Occupation(s) During Past 5 Years
and Other Relevant Professional Experience | | Number of
Portfolios in
Fund Complex
Overseen by
Independent
Director** | | Other Directorships
Held by Independent
Director*** | |
Frank L. Bowman (73)
c/o Perkins Coie LLP
Counsel to the Independent
Directors
30 Rockefeller Plaza
New York, NY 10112 | | Director | | Since
August
2006 | | President, Strategic Decisions, LLC (consulting) (since February 2009); Director or Trustee of various Morgan Stanley Funds (since August 2006); Chairperson of the Compliance and Insurance Committee (since October 2015); formerly, Chairperson of the Insurance Sub-Committee of the Compliance and Insurance Committee (2007-2015); served as President and Chief Executive Officer of the Nuclear Energy Institute (policy organization) (February 2005-November 2008); retired as Admiral, U.S. Navy after serving over 38 years on active duty including 8 years as Director of the Naval Nuclear Propulsion Program in the Department of the Navy and the U.S. Department of Energy (1996-2004); served as Chief of Naval Personnel (July 1994-September 1996) and on the Joint Staff as Director of Political Military Affairs (June 1992-July 1994); knighted as Honorary Knight Commander of the Most Excellent Order of the British Empire; awarded the Officier de l'Orde National du Mérite by the French Government; elected to the National Academy of Engineering (2009). | | | 88 | | | Director of BP p.l.c.; Director of Naval and Nuclear Technologies LLP; Director Emeritus of the Armed Services YMCA; Director of the U.S. Naval Submarine League; Member of the National Security Advisory Council of the Center for U.S. Global Engagement and a member of the CNA Military Advisory Board; Trustee of Fairhaven United Methodist Church; and Director of other various non-profit organizations. | |
Kathleen A. Dennis (64)
c/o Perkins Coie LLP
Counsel to the Independent Directors
30 Rockefeller Plaza
New York, NY 10112 | | Director | | Since
August
2006 | | President, Cedarwood Associates (mutual fund and investment management consulting) (since July 2006); Chairperson of the Liquidity and Alternatives Sub-Committee of the Investment Committee (since October 2006) and Director or Trustee of various Morgan Stanley Funds (since August 2006); formerly, Senior Managing Director of Victory Capital Management (1993-2006). | | | 89 | | | Director of various non-profit organizations. | |
Nancy C. Everett (62)
c/o Perkins Coie LLP
Counsel to the Independent Directors
30 Rockefeller Plaza
New York, NY 10112 | | Director | | Since
January
2015 | | Chief Executive Officer, Virginia Commonwealth University Investment Company (since November 2015); Owner, OBIR, LLC (institutional investment management consulting) (since June 2014); formerly, Managing Director, BlackRock Inc. (February 2011-December 2013); and Chief Executive Officer, General Motors Asset Management (a/k/a Promark Global Advisors, Inc.) (June 2005-May 2010). | | | 90 | | | Formerly, Member of Virginia Commonwealth University School of Business Foundation (2005-2016); Member of Virginia Commonwealth University Board of Visitors (2013-2015); Member of Committee on Directors for Emerging Markets Growth Fund, Inc. (2007-2010); Chairperson of Performance Equity Management, LLC (2006-2010); and Chairperson, GMAM Absolute Return Strategies Fund, LLC (2006-2010). | |
30
Morgan Stanley Institutional Fund, Inc.
Annual Report — December 31, 2017
Director and Officer Information (unaudited) (cont'd)
Independent Directors: (cont'd)
Name, Age and Address of
Independent Director | | Position(s)
Held with
Registrant | | Length of Time
Served* | | Principal Occupation(s) During Past 5 Years
and Other Relevant Professional Experience | | Number of
Portfolios in
Fund Complex
Overseen by
Independent
Director** | | Other Directorships
Held by Independent
Director*** | |
Jakki L. Haussler (60)
c/o Perkins Coie LLP
Counsel to the Independent Directors
30 Rockefeller Plaza
New York, NY 10112 | | Director | | Since
January
2015 | | Chairman and Chief Executive Officer, Opus Capital Group (since January 1996); formerly, Director, Capvest Venture Fund, LP (May 2000-December 2011); Partner, Adena Ventures, LP (July 1999-December 2010); Director, The Victory Funds (February 2005-July 2008). | | | 90 | | | Director of Cincinnati Bell Inc. and Member, Audit Committee and Compensation Committee; Director of Northern Kentucky University Foundation and Member, Investment Committee; Member of Chase College of Law Transactional Law Practice Center Board of Advisors; Director of Best Transport; Director of Chase College of Law Board of Visitors; formerly, Member, University of Cincinnati Foundation Investment Committee; Member, Miami University Board of Visitors (2008-2011); Trustee of Victory Funds (2005-2008) and Chairman, Investment Committee (2007-2008) and Member, Service Provider Committee (2005-2008). | |
Dr. Manuel H. Johnson (68)
c/o Johnson Smick
International, Inc.
220 I Street, NE — Suite 200
Washington, D.C. 20002 | | Director | | Since
July
1991 | | Senior Partner, Johnson Smick International, Inc. (consulting firm); Chairperson of the Investment Committee (since October 2006) and Director or Trustee of various Morgan Stanley Funds (since July 1991); Co-Chairman and a founder of the Group of Seven Council (G7C) (international economic commission); formerly, Chairperson of the Audit Committee (July 1991-September 2006), Vice Chairman of the Board of Governors of the Federal Reserve System and Assistant Secretary of the U.S. Treasury. | | | 88 | | | Director of NVR, Inc. (home construction). | |
Joseph J. Kearns (75)
c/o Kearns & Associates LLC
46 E Peninsula Center #385
Rolling Hills Estates, CA
90274-3712 | | Director | | Since
August
1994 | | Senior Adviser, Kearns & Associates LLC (investment consulting); Chairperson of the Audit Committee (since October 2006) and Director or Trustee of various Morgan Stanley Funds (since August 1994); formerly, Deputy Chairperson of the Audit Committee (July 2003-September 2006) and Chairperson of the Audit Committee of various Morgan Stanley Funds (since August 1994); CFO of the J. Paul Getty Trust. | | | 89 | | | Prior to August 10, 2016, Director of Electro Rent Corporation (equipment leasing); Prior to December 31, 2013, Director of The Ford Family Foundation. | |
31
Morgan Stanley Institutional Fund, Inc.
Annual Report — December 31, 2017
Director and Officer Information (unaudited) (cont'd)
Independent Directors: (cont'd)
Name, Age and Address of
Independent Director | | Position(s)
Held with
Registrant | | Length of Time
Served* | | Principal Occupation(s) During Past 5 Years
and Other Relevant Professional Experience | | Number of
Portfolios in
Fund Complex
Overseen by
Independent
Director** | | Other Directorships
Held by Independent
Director*** | |
Michael F. Klein (59)
c/o Perkins Coie LLP
Counsel to the Independent Directors
30 Rockefeller Plaza
New York, NY 10112 | | Director | | Since
August
2006 | | Managing Director, Aetos Capital, LLC (since March 2000); Co-President, Aetos Alternatives Management, LLC (since January 2004) and Co-Chief Executive Officer of Aetos Capital LLC (since August 2013); Chairperson of the Fixed Income Sub-Committee of the Investment Committee (since October 2006) and Director or Trustee of various Morgan Stanley Funds (since August 2006); formerly, Managing Director, Morgan Stanley & Co. Inc. and Morgan Stanley Dean Witter Investment Management, President, various Morgan Stanley Funds (June 1998-March 2000) and Principal, Morgan Stanley & Co. Inc. and Morgan Stanley Dean Witter Investment Management (August 1997-December 1999). | | | 88 | | | Director of certain investment funds managed or sponsored by Aetos Capital, LLC; Director of Sanitized AG and Sanitized Marketing AG (specialty chemicals). | |
Patricia Maleski (57)
c/o Perkins Coie LLP
Counsel to the Independent Directors
30 Rockefeller Plaza
New York, NY 10112 | | Director | | Since
January
2017 | | Managing Director, JPMorgan Asset Management (2004-2016); Oversight and Control Head of Fiduciary and Conflicts of Interest Program (2015-2016); Chief Control Officer-Global Asset Management (2013-2015); President, JPMorgan Funds (2010-2013); Chief Administrative Officer (2004-2013); various other positions including Treasurer and Board Liaison (since 2001). | | | 90 | | | None. | |
Michael E. Nugent (81)
522 Fifth Avenue
New York, NY 10036 | | Chair of the Board and Director | | Chair of the Boards since July 2006 and Director since July 1991 | | Chair of the Boards of various Morgan Stanley Funds (since July 2006); Chairperson of the Closed-End Fund Committee (since June 2012) and Director or Trustee of various Morgan Stanley Funds (since July 1991); formerly, Chairperson of the Insurance Committee (until July 2006); General Partner, Triumph Capital, L.P. (private investment partnership) (1988-2013). | | | 88 | | | None. | |
W. Allen Reed (70)
c/o Perkins Coie LLP
Counsel to the Independent Directors
30 Rockefeller Plaza
New York, NY 10112 | | Director | | Since
August
2006 | | Chairperson of the Equity Sub-Committee of the Investment Committee (since October 2006) and Director or Trustee of various Morgan Stanley Funds (since August 2006); formerly, President and CEO of General Motors Asset Management; Chairman and Chief Executive Officer of the GM Trust Bank and Corporate Vice President of General Motors Corporation (August 1994-December 2005). | | | 89 | | | Director of Legg Mason, Inc.; formerly, Director of the Auburn University Foundation (2010-2015). | |
Fergus Reid (85)
c/o Joe Pietryka, Inc.
85 Charles Colman Blvd.
Pawling, NY 12564 | | Director | | Since
June
1992 | | Chairman, Joe Pietryka, Inc.; Chairperson of the Governance Committee and Director or Trustee of various Morgan Stanley Funds (since June 1992). | | | 89 | | | Formerly, Trustee and Director of certain investment companies in the JP Morgan Fund Complex managed by JP Morgan Investment Management Inc. (1987-2012). | |
* This is the earliest date the Director began serving the Morgan Stanley Funds. Each Director serves an indefinite term, until his or her successor is elected.
** The Fund Complex includes (as of December 31, 2017) all open-end and closed-end funds (including all of their portfolios) advised by Morgan Stanley Investment Management Inc. (the "Adviser") and any funds that have an adviser that is an affiliated person of the Adviser (including, but not limited to, Morgan Stanley AIP GP LP).
*** This includes any directorships at public companies and registered investment companies held by the Director at any time during the past five years.
32
Morgan Stanley Institutional Fund, Inc.
Annual Report — December 31, 2017
Director and Officer Information (unaudited) (cont'd)
Executive Officers:
Name, Age and Address of Executive Officer | | Position(s) Held
with
Registrant | | Length of Time
Served* | | Principal Occupation(s) During Past 5 Years | |
John H. Gernon (54)
522 Fifth Avenue
New York, NY 10036 | | President and Principal Executive Officer | | Since
September
2013 | | President and Principal Executive Officer of the Equity and Fixed Income Funds and the Morgan Stanley AIP Funds (since September 2013) and the Liquidity Funds and various money market funds (since May 2014) in the Fund Complex; Managing Director of the Adviser; Head of Product (since 2006). | |
Timothy J. Knierim (58)
522 Fifth Avenue
New York, NY 10036 | | Chief Compliance Officer | | Since
December
2016 | | Managing Director of the Adviser and various entities affiliated with the Adviser; Chief Compliance Officer of various Morgan Stanley Funds and the Adviser (since December 2016) and Chief Compliance Officer of Morgan Stanley AIP GP LP (since 2014). Formerly, Managing Director and Deputy Chief Compliance Officer of the Adviser (2014-2016); and formerly, Chief Compliance Officer of Prudential Investment Management, Inc. (2007-2014). | |
Francis J. Smith (52)
522 Fifth Avenue
New York, NY 10036 | | Treasurer and Principal Financial Officer | | Treasurer since July 2003 and Principal Financial Officer since September 2002 | | Managing Director of the Adviser and various entities affiliated with the Adviser; Treasurer (since July 2003) and Principal Financial Officer of various Morgan Stanley Funds (since September 2002). | |
Mary E. Mullin (50)
522 Fifth Avenue
New York, NY 10036 | | Secretary | | Since
June
1999 | | Managing Director of the Adviser; Secretary of various Morgan Stanley Funds (since June 1999). | |
Michael J. Key (38)
522 Fifth Avenue
New York, NY 10036 | | Vice President | | Since
June
2017 | | Vice President of the Equity and Fixed Income Funds, Liquidity Funds, various money market funds and the Morgan Stanley AIP Funds in the Fund Complex (since June 2017); Executive Director of the Adviser; Head of Product Development for Equity and Fixed Income Funds (since August 2013). | |
* This is the earliest date the officer began serving the Morgan Stanley Funds. Each officer serves a one-year term, until his or her successor is elected and qualifies.
33
Morgan Stanley Institutional Fund, Inc.
Annual Report — December 31, 2017
Adviser and Administrator
Morgan Stanley Investment Management Inc.
522 Fifth Avenue
New York, New York 10036
Distributor
Morgan Stanley Distribution, Inc.
522 Fifth Avenue
New York, New York 10036
Dividend Disbursing and Transfer Agent
DST Asset Manager Solutions, Inc.
2000 Crown Colony Drive
Quincy, Massachusetts 02169
Custodian
State Street Bank and Trust Company
One Lincoln Street
Boston, Massachusetts 02111
Legal Counsel
Dechert LLP
1095 Avenue of the Americas
New York, New York 10036
Counsel to the Independent Directors
Perkins Coie LLP
30 Rockefeller Plaza
New York, New York 10112
Independent Registered Public Accounting Firm
Ernst & Young LLP
200 Clarendon Street
Boston, Massachusetts 02116
Reporting to Shareholders
Each Morgan Stanley Fund provides a complete schedule of portfolio holdings in its semi-annual and annual reports within 60 days of the end of the fund's second and fourth fiscal quarters. The semi-annual and annual reports are filed electronically with the Securities and Exchange Commission (SEC) on Form N-CSRS and Form N-CSR, respectively. Morgan Stanley also delivers the semi-annual and annual reports to fund shareholders and makes these reports available on its public website, www.morganstanley.com/im. Each Morgan Stanley fund also files a complete schedule of portfolio holdings with the SEC for the fund's first and third fiscal quarters on Form N-Q. Morgan Stanley does not deliver the reports for the first and third fiscal quarters to shareholders, nor are the reports posted to the Morgan Stanley public website. You may, however, obtain the Form N-Q filings (as well as the Form N-CSR and N-CSRS filings) by accessing the SEC's website, www.sec.gov. You may also review and copy them at the SEC's Public Reference Room in Washington, DC. Information on the operation of the SEC's Public Reference Room may be obtained by calling the SEC toll free at 1 (800) SEC-0330. You can also request copies of these materials, upon payment of a duplicating fee, by electronic request at the SEC's email address (publicinfo@sec.gov) or by writing to the SEC's Public Reference Section, Washington, D.C. 20549-1520.
Proxy Voting Policies and Procedures and Proxy Voting Record
You may obtain a copy of the Company's Proxy Voting Policy and Procedures and information regarding how the Company voted proxies relating to portfolio securities during the most recent twelve-month period ended June 30, without charge, upon request, by calling toll free 1 (800) 548-7786 or by visiting our website at www.morganstanley.com/im. This information is also available on the SEC's website at www.sec.gov.
This report is authorized for distribution only when preceded or accompanied by a prospectus or summary prospectus of the applicable Fund of Morgan Stanley Institutional Fund, Inc., which describes in detail the Fund's investment policies, risks, fees and expenses. Please read the prospectus carefully before you invest or send money. For additional information, including information regarding the investments comprising the Fund, please visit our website at www.morganstanley.com/im or call toll free 1 (800) 548-7786.
34
Printed in U.S.A.
This Report has been prepared for shareholders and may be distributed to others only if preceded or accompanied by a current prospectus.
Morgan Stanley Investment Management Inc.
522 Fifth Avenue
New York, New York 10036
© 2018 Morgan Stanley. Morgan Stanley Distribution, Inc.

IFIFEMANN
2007490 EXP. 02.28.19

Morgan Stanley Institutional Fund, Inc.
Global Advantage Portfolio
Annual Report
December 31, 2017

Morgan Stanley Institutional Fund, Inc.
Annual Report — December 31, 2017
Shareholders' Letter | | | 2 | | |
Expense Example | | | 3 | | |
Investment Overview | | | 4 | | |
Portfolio of Investments | | | 6 | | |
Statement of Assets and Liabilities | | | 8 | | |
Statement of Operations | | | 10 | | |
Statements of Changes in Net Assets | | | 11 | | |
Financial Highlights | | | 13 | | |
Notes to Financial Statements | | | 17 | | |
Report of Independent Registered Public Accounting Firm | | | 25 | | |
Federal Tax Notice | | | 26 | | |
Privacy Notice | | | 27 | | |
Director and Officer Information | | | 30 | | |
This report is authorized for distribution only when preceded or accompanied by a prospectus or summary prospectus of the applicable Fund of Morgan Stanley Institutional Fund, Inc. To receive a prospectus and/or statement of additional information (SAI), which contains more complete information such as investment objectives, charges, expenses, policies for voting proxies, risk considerations, and describes in detail each of the Fund's investment policies to the prospective investor, please call toll free 1 (800) 548-7786. Please read the prospectuses carefully before you invest or send money.
Additionally, you can access information about the Fund, including performance, characteristics, and investment team commentary, through Morgan Stanley Investment Management's website: www.morganstanley.com/im.
Market forecasts provided in this report may not necessarily come to pass. There is no guarantee that any sectors mentioned will continue to perform as discussed herein or that securities in such sectors will be held by the Fund in the future. There is no assurance that a fund will achieve its investment objective. Funds are subject to market risk, which is the possibility that market values of securities owned by the Fund will decline and, therefore, the value of the Fund's shares may be less than what you paid for them. Accordingly, you can lose money investing in this Fund. Please see the prospectus for more complete information on investment risks.
1
Morgan Stanley Institutional Fund, Inc.
Annual Report — December 31, 2017
Shareholders' Letter (unaudited)
Dear Shareholders,
We are pleased to provide this Annual report, in which you will learn how your investment in Global Advantage Portfolio (the "Fund") performed during the latest twelve-month period.
Morgan Stanley Investment Management is a client-centric, investor-led organization. Our global presence, intellectual capital, and breadth of products and services enable us to partner with investors to meet the evolving challenges of today's financial markets. We aim to deliver superior investment service and to empower our clients to make the informed decisions that help them reach their investment goals.
As always, we thank you for selecting Morgan Stanley Investment Management, and look forward to working with you in the months and years ahead.
Sincerely,

John H. Gernon
President and Principal Executive Officer
January 2018
2
Morgan Stanley Institutional Fund, Inc.
Annual Report — December 31, 2017
Expense Example (unaudited)
Global Advantage Portfolio
As a shareholder of the Fund, you incur two types of costs: (1) transactional costs; and (2) ongoing costs, which may include advisory fees, administration fees, distribution and shareholder services fees and other Fund expenses. This example is intended to help you understand your ongoing costs (in dollars) of investing in the Fund and to compare these costs with the ongoing costs of investing in other mutual funds.
This example is based on an investment of $1,000 invested at the beginning of the six-month period ended December 31, 2017 and held for the entire six-month period.
Actual Expenses
The table below provides information about actual account values and actual expenses. You may use the information in this table, together with the amount you invested, to estimate the expenses that you paid over the period. Simply divide your account value by $1,000 (for example, an $8,600 account value divided by $1,000 = 8.6), then multiply the result by the number in the table under the heading entitled "Actual Expenses Paid During Period" to estimate the expenses you paid on your account during this period.
Hypothetical Example for Comparison Purposes
The table below provides information about hypothetical account values and hypothetical expenses based on the Fund's actual expense ratio and an assumed rate of return of 5% per year before expenses, which is not the Fund's actual return. The hypothetical account values and expenses may not be used to estimate the actual ending account balance or expenses you paid for the period. You may use this information to compare the ongoing costs of investing in the Fund and other funds. To do so, compare this 5% hypothetical example with the 5% hypothetical examples that appear in the shareholder reports of the other funds.
Please note that the expenses shown in the table are meant to highlight your ongoing costs only and do not reflect any transactional costs, such as sales charges (loads). Therefore, the information for each class in the table is useful in comparing ongoing costs only, and will not help you determine the relative total costs of owning different funds. In addition, if these transactional costs were included, your costs would have been higher.
| | | Beginning
Account
Value
7/1/17 | | Actual Ending
Account
Value
12/31/17 | | Hypothetical
Ending Account
Value | | Actual
Expenses
Paid
During
Period* | | Hypothetical
Expenses Paid
During Period* | | Net
Expense
Ratio
During
Period** | |
Global Advantage Portfolio Class I | | $ | 1,000.00 | | | $ | 1,151.50 | | | $ | 1,019.71 | | | $ | 5.91 | | | $ | 5.55 | | | | 1.09 | % | |
Global Advantage Portfolio Class A | | | 1,000.00 | | | | 1,149.80 | | | | 1,018.20 | | | | 7.53 | | | | 7.07 | | | | 1.39 | | |
Global Advantage Portfolio Class L | | | 1,000.00 | | | | 1,145.70 | | | | 1,015.43 | | | | 10.49 | | | | 9.86 | | | | 1.94 | | |
Global Advantage Portfolio Class C | | | 1,000.00 | | | | 1,144.90 | | | | 1,014.17 | | | | 11.84 | | | | 11.12 | | | | 2.19 | | |
* Expenses are calculated using each Fund Class' annualized net expense ratio (as disclosed), multiplied by the average account value over the period, and multiplied by 184/365 (to reflect the most recent one-half year period).
** Annualized.
3
Morgan Stanley Institutional Fund, Inc.
Annual Report — December 31, 2017
Investment Overview (unaudited)
Global Advantage Portfolio
The Fund seeks long-term capital appreciation.
Performance
For the year ended December 31, 2017, the Fund's Class I shares had a total return based on net asset value and reinvestment of distributions per share of 41.56%, net of fees. The Fund's Class I shares outperformed the Fund's benchmark, the MSCI All Country World Index (the "Index"), which returned 23.97%.
Please keep in mind that double-digit returns are highly unusual and cannot be sustained. Investors should also be aware that these returns were primarily achieved during favorable market conditions.
Factors Affecting Performance
• Better-than-expected global economic growth and strong corporate profits provided a positive backdrop for global equity markets. Central bank policy remained largely accommodative as inflation stayed muted, recoveries continued in U.S., Europe and Japan, and China's economy stabilized. Although the U.S. Federal Reserve raised its interest rate three times during 2017, interest rate levels were still historically low, further boosting demand for equities. Political risk abated as key elections across Europe voted in more mainstream candidates, and trade negotiation fears also diminished somewhat, although the North American Free Trade Agreement (NAFTA) and Brexit talks are ongoing. In the U.S., sweeping tax reforms were signed into law in December 2017, fueling a sharp rally in U.S. share prices at year-end. These events helped global equities shrug off geopolitical tensions in North Korea and the Middle East, and natural disasters in the U.S., to end the year sharply higher.
• All sectors in the Index showed positive performance for the year. The information technology sector led, followed by the materials and industrials sectors. Conversely, the energy, telecommunication services and utilities sectors were the biggest laggards in the Index.
• The long-term investment horizon and conviction-weighted investment approach embraced by the team since 1998 can result in periods of performance deviation from the benchmark and peers. In this reporting period, both stock selection
and sector allocations contributed favorably to the Fund's relative outperformance.
• The information technology (IT) sector was the largest driver of positive relative performance, with both stock selection and overweight allocation adding to relative gains. A U.S.-based global social networking platform, a Chinese social networking platform and a Chinese social commerce platform were among the top five contributing holdings in the reporting period, reflecting the broader trend of large-cap technology stocks dominating both developed and emerging markets performance in 2017.
• Stock selection in the consumer discretionary sector was advantageous, boosted by strong results from a luxury apparel and goods brand and an online retail and cloud computing leader. The Fund's overweight allocation to the consumer discretionary sector was also modestly beneficial.
• Stock selection in the financials sector outperformed, led by a financial ratings, benchmarks and analytics provider.
• The materials sector was the only sector-level detractor from performance in the period. The sector was the second best performing group in the Index, and the Fund had less exposure than the Index to materials stocks with strong appreciation during the period.
• Looking at individual holdings, a U.K. household and personal care products company and an India-based online travel booker (not included in the benchmark) were the most detrimental to performance.
Management Strategies
• There were no changes to our bottom-up investment process during the period. We continued to look for franchises with strong name recognition and sustainable competitive advantages. We typically favor companies with rising returns on invested capital, above average business visibility, strong free cash flow generation and an attractive risk/reward profile. Our emphasis is on secular growth, and as a result short-term market events are not as meaningful in the stock selection process.
4
Morgan Stanley Institutional Fund, Inc.
Annual Report — December 31, 2017
Investment Overview (unaudited) (cont'd)
Global Advantage Portfolio
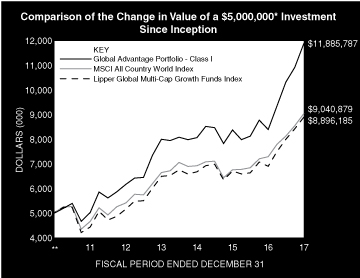
* Minimum Investment for Class I shares
** Commenced Operations on December 28, 2010.
In accordance with SEC regulations, the Fund's performance shown assumes that all recurring fees (including management fees) were deducted and all dividends and distributions were reinvested. The performance of Class A, L and C shares will vary from the performance of Class I shares and will be negatively impacted by additional fees assessed to those classes.
Performance Compared to the MSCI All Country World Index(1) and the Lipper Global Multi-Cap Growth Funds Index(2)
| | Period Ended December 31, 2017
Total Returns(3) | |
| | | | Average Annual | |
| | One
Year | | Five
Years | | Ten
Years | | Since
Inception(6) | |
Fund — Class I Shares
w/o sales charges(4) | | | 41.56 | % | | | 14.02 | % | | | — | | | | 13.15 | % | |
Fund — Class A Shares
w/o sales charges(4) | | | 41.02 | | | | 13.63 | | | | — | | | | 12.78 | | |
Fund — Class A Shares with
maximum 5.25% sales charges(4) | | | 33.57 | | | | 12.41 | | | | — | | | | 11.93 | | |
Fund — Class L Shares
w/o sales charges(4) | | | 40.34 | | | | 13.05 | | | | — | | | | 12.22 | | |
Fund — Class C Shares
w/o sales charges(5) | | | 40.02 | | | | — | | | | — | | | | 11.77 | | |
Fund — Class C Shares with
maximum 1.00% deferred
sales charges(5) | | | 39.02 | | | | — | | | | — | | | | 11.77 | | |
MSCI All Country World Index | | | 23.97 | | | | 10.80 | | | | — | | | | 8.82 | | |
Lipper Global Multi-Cap Growth
Funds Index | | | 28.87 | | | | 11.49 | | | | — | | | | 8.57 | | |
Performance data quoted represents past performance, which is no guarantee of future results, and current performance may be lower or higher than the figures shown. Performance assumes that all dividends and distributions, if any, were reinvested. For the most recent month-end performance figures, please visit www.morganstanley.com/im. Investment return and principal value will fluctuate so that Fund shares, when redeemed, may be worth more or less than their original cost. Total returns do not reflect the deduction of taxes that a shareholder would pay on Fund distributions or the redemption of Fund shares. Performance of share classes will vary due to difference in sales charges and expenses.
(1) The MSCI All Country World Index (ACWI) is a free float-adjusted market capitalization weighted index designed to measure the equity market performance of developed and emerging markets. The term "free float" represents the portion of shares outstanding that are deemed to be available for purchase in the public equity markets by investors. It is not possible to invest directly in an index. The Index is unmanaged and its returns do not include any sales charges or fees. Such costs would lower performance. It is not possible to invest directly in an index.
(2) The Lipper Global Multi-Cap Growth Funds Index is an equally weighted performance index of the largest qualifying funds (based on net assets) in the Lipper Global Multi-Cap Growth Funds classification. The Index, which is adjusted for capital gains distributions and income dividends, is unmanaged and should not be considered an investment. There are currently 30 funds represented in this Index. As of the date of this report, the Fund is in the Lipper Global Multi-Cap Growth Funds classification.
(3) Total returns for the Fund reflect fees waived and expenses reimbursed, if applicable, by the Adviser. Without such waivers and reimbursements, total returns would have been lower.
(4) Commenced operations on December 28, 2010.
(5) Commenced offering on April 30, 2015.
(6) For comparative purposes, average annual since inception returns listed for the Indexes refer to the inception date of Class I of the Fund, not the inception of the Index.
5
Morgan Stanley Institutional Fund, Inc.
Annual Report — December 31, 2017
Portfolio of Investments
Global Advantage Portfolio
| | | Shares | | Value
(000) | |
Common Stocks (96.9%) | |
China (7.4%) | |
Alibaba Group Holding Ltd. ADR (a) | | | 925 | | | $ | 159 | | |
JD.com, Inc. ADR (a) | | | 3,163 | | | | 131 | | |
Tencent Holdings Ltd. (b) | | | 12,200 | | | | 631 | | |
| | | | 921 | | |
France (9.8%) | |
Christian Dior SE | | | 2,023 | | | | 738 | | |
Getlink SE | | | 14,512 | | | | 187 | | |
Hermes International | | | 325 | | | | 174 | | |
Ubisoft Entertainment SA (a) | | | 1,625 | | | | 125 | | |
| | | | 1,224 | | |
Germany (4.0%) | |
HeidelbergCement AG | | | 1,682 | | | | 182 | | |
ThyssenKrupp AG | | | 6,446 | | | | 187 | | |
Zalando SE (a)(c) | | | 2,422 | | | | 128 | | |
| | | | 497 | | |
Italy (3.1%) | |
Brunello Cucinelli SpA | | | 5,905 | | | | 191 | | |
Moncler SpA | | | 6,342 | | | | 198 | | |
| | | | 389 | | |
Mexico (1.5%) | |
Grupo Aeroportuario del Sureste SAB de CV | | | 10,015 | | | | 183 | | |
Spain (2.5%) | |
Aena SME SA (c) | | | 928 | | | | 188 | | |
Industria de Diseno Textil SA | | | 3,501 | | | | 122 | | |
| | | | 310 | | |
Switzerland (1.5%) | |
LafargeHolcim Ltd. (Registered) (a) | | | 3,287 | | | | 185 | | |
United Arab Emirates (1.5%) | |
DP World Ltd. | | | 7,571 | | | | 189 | | |
United Kingdom (8.8%) | |
BBA Aviation PLC | | | 39,517 | | | | 187 | | |
Whitbread PLC | | | 16,840 | | | | 909 | | |
| | | | 1,096 | | |
United States (56.8%) | |
Activision Blizzard, Inc. | | | 4,385 | | | | 278 | | |
Alphabet, Inc., Class C (a) | | | 230 | | | | 241 | | |
Amazon.com, Inc. (a) | | | 625 | | | | 731 | | |
Berkshire Hathaway, Inc., Class B (a) | | | 2,236 | | | | 443 | | |
Danaher Corp. | | | 1,851 | | | | 172 | | |
Facebook, Inc., Class A (a) | | | 1,291 | | | | 228 | | |
Liberty Media Corp.-Liberty Formula One,
Class C (a) | | | 12,226 | | | | 418 | | |
MakeMyTrip Ltd. (a) | | | 10,903 | | | | 325 | | |
Manchester United PLC, Class A | | | 9,330 | | | | 185 | | |
MercadoLibre, Inc. | | | 1,106 | | | | 348 | | |
NIKE, Inc., Class B | | | 3,095 | | | | 194 | | |
S&P Global, Inc. | | | 1,028 | | | | 174 | | |
salesforce.com, Inc. (a) | | | 2,943 | | | | 301 | | |
Starbucks Corp. | | | 7,486 | | | | 430 | | |
| | | Shares | | Value
(000) | |
TJX Cos., Inc. (The) | | | 4,111 | | | $ | 314 | | |
TransDigm Group, Inc. | | | 1,034 | | | | 284 | | |
Twitter, Inc. (a) | | | 12,572 | | | | 302 | | |
Ulta Salon Cosmetics & Fragrance, Inc. | | | 881 | | | | 197 | | |
Union Pacific Corp. | | | 3,499 | | | | 469 | | |
United Technologies Corp. | | | 3,499 | | | | 446 | | |
Walt Disney Co. (The) | | | 3,912 | | | | 420 | | |
Zoetis, Inc. | | | 2,474 | | | | 178 | | |
| | | | 7,078 | | |
Total Common Stocks (Cost $10,254) | | | 12,072 | | |
Short-Term Investment (2.9%) | |
Investment Company (2.9%) | |
Morgan Stanley Institutional Liquidity
Funds — Treasury Securities Portfolio —
Institutional Class (See Note G)
(Cost $367) | | | 366,795 | | | | 367 | | |
Total Investments Excluding Purchased
Options (99.8%) (Cost $10,621) | | | 12,439 | | |
Total Purchased Options
Outstanding (0.0%) (Cost $21) | | | 3 | | |
Total Investments (99.9%) (Cost $10,642) (d)(e) | | | 12,442 | | |
Other Assets in Excess of Liabilities (0.1%) | | | 16 | | |
Net Assets (100.0%) | | $ | 12,458 | | |
Country assignments and aggregations are based generally on third party vendor classifications and information, and may be different from the assignments and aggregations under the policies set forth in the Fund's prospectus and/or statement of additional information relating to geographic classifications.
(a) Non-income producing security.
(b) Security trades on the Hong Kong exchange.
(c) 144A security — Certain conditions for public sale may exist. Unless otherwise noted, these securities are deemed to be liquid.
(d) The approximate fair value and percentage of net assets, $4,521,000 and 36.3%, respectively, represent the securities that have been fair valued under the fair valuation policy for international investments as described in Note A-1 within the Notes to the Financial Statements.
(e) At December 31, 2017, the aggregate cost for federal income tax purposes is approximately $10,636,000. The aggregate gross unrealized appreciation is approximately $1,857,000 and the aggregate gross unrealized depreciation is approximately $71,000, resulting in net unrealized appreciation of approximately $1,786,000.
ADR American Depositary Receipt.
The accompanying notes are an integral part of the financial statements.
6
Morgan Stanley Institutional Fund, Inc.
Annual Report — December 31, 2017
Portfolio of Investments (cont'd)
Global Advantage Portfolio
Call Options Purchased:
The Fund had the following call options purchased open at December 31, 2017:
Counterparty | | Description | | Strike
Price | | Expiration
Date | | Number of
Contracts | | Notional
Amount
(000) | | Value
(000) | | Premiums
Paid
(000) | | Unrealized
Depreciation
(000) | |
Royal Bank of Scotland | | USD/CNH | | CNH | 7.52 | | | Nov - 18 | | | 2,708,014 | | | | 2,708 | | | $ | 2 | | | $ | 11 | | | $ | (9 | ) | |
Royal Bank of Scotland | | USD/CNH | | CNH | 7.55 | | | Aug - 18 | | | 1,752,855 | | | | 1,753 | | | | 1 | | | | 10 | | | | (9 | ) | |
| | | | | | | | | | | | | $ | 3 | | | $ | 21 | | | $ | (18 | ) | |
CNH — Chinese Yuan Renminbi Offshore
USD — United States Dollar
Portfolio Composition
Classification | | Percentage of
Total Investments | |
Other* | | | 18.9 | % | |
Internet Software & Services | | | 15.3 | | |
Textiles, Apparel & Luxury Goods | | | 12.0 | | |
Hotels, Restaurants & Leisure | | | 10.8 | | |
Internet & Direct Marketing Retail | | | 10.6 | | |
Media | | | 8.2 | | |
Transportation Infrastructure | | | 7.5 | | |
Aerospace & Defense | | | 5.9 | | |
Software | | | 5.7 | | |
Specialty Retail | | | 5.1 | | |
Total Investments | | | 100.0 | % | |
* Industries and/or investment types representing less than 5% of total investments.
The accompanying notes are an integral part of the financial statements.
7
Morgan Stanley Institutional Fund, Inc.
Annual Report — December 31, 2017
Global Advantage Portfolio
Statement of Assets and Liabilities | | December 31, 2017
(000) | |
Assets: | |
Investments in Securities of Unaffiliated Issuers, at Value (Cost $10,275) | | $ | 12,075 | | |
Investment in Security of Affiliated Issuer, at Value (Cost $367) | | | 367 | | |
Total Investments in Securities, at Value (Cost $10,642) | | | 12,442 | | |
Foreign Currency, at Value (Cost —@) | | | — | @ | |
Receivable for Fund Shares Sold | | | 110 | | |
Due from Adviser | | | 50 | | |
Dividends Receivable | | | 3 | | |
Tax Reclaim Receivable | | | 1 | | |
Receivable from Affiliate | | | — | @ | |
Other Assets | | | 43 | | |
Total Assets | | | 12,649 | | |
Liabilities: | |
Payable for Fund Shares Redeemed | | | 112 | | |
Payable for Professional Fees | | | 54 | | |
Payable for Custodian Fees | | | 7 | | |
Payable for Transfer Agency Fees — Class I | | | — | @ | |
Payable for Transfer Agency Fees — Class A | | | 1 | | |
Payable for Transfer Agency Fees — Class L | | | — | @ | |
Payable for Transfer Agency Fees — Class C | | | 1 | | |
Payable for Shareholder Services Fees — Class A | | | 1 | | |
Payable for Distribution and Shareholder Services Fees — Class L | | | — | @ | |
Payable for Distribution and Shareholder Services Fees — Class C | | | — | @ | |
Payable for Administration Fees | | | 1 | | |
Payable for Sub Transfer Agency Fees — Class I | | | 1 | | |
Payable for Sub Transfer Agency Fees — Class A | | | — | @ | |
Payable for Sub Transfer Agency Fees — Class L | | | — | @ | |
Payable for Sub Transfer Agency Fees — Class C | | | — | @ | |
Other Liabilities | | | 13 | | |
Total Liabilities | | | 191 | | |
Net Assets | | $ | 12,458 | | |
Net Assets Consist Of: | |
Paid-in-Capital | | $ | 10,251 | | |
Accumulated Undistributed Net Realized Gain | | | 407 | | |
Unrealized Appreciation (Depreciation) on: | |
Investments | | | 1,800 | | |
Foreign Currency Translations | | | — | @ | |
Net Assets | | $ | 12,458 | | |
The accompanying notes are an integral part of the financial statements.
8
Morgan Stanley Institutional Fund, Inc.
Annual Report — December 31, 2017
Global Advantage Portfolio
Statement of Assets and Liabilities (cont'd) | | December 31, 2017
(000) | |
CLASS I: | |
Net Assets | | $ | 7,005 | | |
| Shares Outstanding $0.001 par value shares of beneficial interest (unlimited shares authorized) (not in 000's) | | | 454,031 | | |
Net Asset Value, Offering and Redemption Price Per Share | | $ | 15.43 | | |
CLASS A: | |
Net Assets | | $ | 4,577 | | |
| Shares Outstanding $0.001 par value shares of beneficial interest (unlimited shares authorized) (not in 000's) | | | 300,878 | | |
Net Asset Value, Redemption Price Per Share | | $ | 15.21 | | |
Maximum Sales Load | | | 5.25 | % | |
Maximum Sales Charge | | $ | 0.84 | | |
Maximum Offering Price Per Share | | $ | 16.05 | | |
CLASS L: | |
Net Assets | | $ | 327 | | |
| Shares Outstanding $0.001 par value shares of beneficial interest (unlimited shares authorized) (not in 000's) | | | 22,146 | | |
Net Asset Value, Offering and Redemption Price Per Share | | $ | 14.75 | | |
CLASS C: | |
Net Assets | | $ | 549 | | |
| Shares Outstanding $0.001 par value shares of beneficial interest (unlimited shares authorized) (not in 000's) | | | 37,639 | | |
Net Asset Value, Offering and Redemption Price Per Share | | $ | 14.60 | | |
@ Amount is less than $500.
The accompanying notes are an integral part of the financial statements.
9
Morgan Stanley Institutional Fund, Inc.
Annual Report — December 31, 2017
Global Advantage Portfolio
Statement of Operations | | Year Ended
December 31, 2017
(000) | |
Investment Income: | |
Dividends from Securities of Unaffiliated Issuers (Net of $3 of Foreign Taxes Withheld) | | $ | 76 | | |
Dividends from Security of Affiliated Issuer (Note G) | | | 2 | | |
Total Investment Income | | | 78 | | |
Expenses: | |
Professional Fees | | | 128 | | |
Advisory Fees (Note B) | | | 70 | | |
Registration Fees | | | 50 | | |
Shareholder Services Fees — Class A (Note D) | | | 9 | | |
Distribution and Shareholder Services Fees — Class L (Note D) | | | 2 | | |
Distribution and Shareholder Services Fees — Class C (Note D) | | | 4 | | |
Shareholder Reporting Fees | | | 13 | | |
Custodian Fees (Note F) | | | 11 | | |
Transfer Agency Fees — Class I (Note E) | | | 2 | | |
Transfer Agency Fees — Class A (Note E) | | | 2 | | |
Transfer Agency Fees — Class L (Note E) | | | 2 | | |
Transfer Agency Fees — Class C (Note E) | | | 2 | | |
Administration Fees (Note C) | | | 7 | | |
Pricing Fees | | | 6 | | |
Directors' Fees and Expenses | | | 3 | | |
Sub Transfer Agency Fees — Class I | | | 3 | | |
Sub Transfer Agency Fees — Class L | | | — | @ | |
Sub Transfer Agency Fees — Class C | | | — | @ | |
Other Expenses | | | 24 | | |
Total Expenses | | | 338 | | |
Expenses Reimbursed by Adviser (Note B) | | | (146 | ) | |
Waiver of Advisory Fees (Note B) | | | (70 | ) | |
Reimbursement of Class Specific Expenses — Class I (Note B) | | | (5 | ) | |
Reimbursement of Class Specific Expenses — Class L (Note B) | | | (2 | ) | |
Reimbursement of Class Specific Expenses — Class C (Note B) | | | (2 | ) | |
Rebate from Morgan Stanley Affiliate (Note G) | | | (1 | ) | |
Net Expenses | | | 112 | | |
Net Investment Loss | | | (34 | ) | |
Realized Gain: | |
Investments Sold | | | 1,742 | | |
Foreign Currency Transactions | | | 1 | | |
Realized Gain | | | 1,743 | | |
Change in Unrealized Appreciation (Depreciation): | |
Investments | | | 1,152 | | |
Foreign Currency Translations | | | — | @ | |
Net Change in Unrealized Appreciation (Depreciation) | | | 1,152 | | |
Net Realized Gain and Change in Unrealized Appreciation (Depreciation) | | | 2,895 | | |
Net Increase in Net Assets Resulting from Operations | | $ | 2,861 | | |
@ Amount is less than $500.
The accompanying notes are an integral part of the financial statements.
10
Morgan Stanley Institutional Fund, Inc.
Annual Report — December 31, 2017
Global Advantage Portfolio
Statements of Changes in Net Assets | | Year Ended
December 31, 2017
(000) | | Year Ended
December 31, 2016
(000) | |
Increase (Decrease) in Net Assets: | |
Operations: | |
Net Investment Loss | | $ | (34 | ) | | $ | (18 | ) | |
Net Realized Gain | | | 1,743 | | | | 46 | | |
Net Change in Unrealized Appreciation (Depreciation) | | | 1,152 | | | | 110 | | |
Net Increase in Net Assets Resulting from Operations | | | 2,861 | | | | 138 | | |
Distributions from and/or in Excess of: | |
Class I: | |
Net Realized Gain | | | (685 | ) | | | (61 | ) | |
Class A: | |
Net Realized Gain | | | (481 | ) | | | (74 | ) | |
Class L: | |
Net Realized Gain | | | (35 | ) | | | (6 | ) | |
Class C: | |
Net Realized Gain | | | (58 | ) | | | (5 | ) | |
Total Distributions | | | (1,259 | ) | | | (146 | ) | |
Capital Share Transactions:(1) | |
Class I: | |
Subscribed | | | 2,892 | | | | 2,106 | | |
Distributions Reinvested | | | 685 | | | | 58 | | |
Redeemed | | | (601 | ) | | | (671 | ) | |
Class A: | |
Subscribed | | | 1,163 | | | | 1,326 | | |
Distributions Reinvested | | | 480 | | | | 71 | | |
Redeemed | | | (402 | ) | | | (2,218 | ) | |
Class L: | |
Exchanged | | | 94 | | | | 21 | | |
Distributions Reinvested | | | 34 | | | | 4 | | |
Redeemed | | | (70 | ) | | | (183 | ) | |
Class C: | |
Subscribed | | | 307 | | | | 223 | | |
Distributions Reinvested | | | 57 | | | | 5 | | |
Redeemed | | | (49 | ) | | | (108 | ) | |
Net Increase in Net Assets Resulting from Capital Share Transactions | | | 4,590 | | | | 634 | | |
Total Increase in Net Assets | | | 6,192 | | | | 626 | | |
Net Assets: | |
Beginning of Period | | | 6,266 | | | | 5,640 | | |
End of Period (Including Accumulated Net Investment Loss of $0 and $(3)) | | $ | 12,458 | | | $ | 6,266 | | |
The accompanying notes are an integral part of the financial statements.
11
Morgan Stanley Institutional Fund, Inc.
Annual Report — December 31, 2017
Global Advantage Portfolio
Statements of Changes in Net Assets (cont'd) | | Year Ended
December 31, 2017
(000) | | Year Ended
December 31, 2016
(000) | |
(1) Capital Share Transactions: | |
Class I: | |
Shares Subscribed | | | 186 | | | | 171 | | |
Shares Issued on Distributions Reinvested | | | 44 | | | | 5 | | |
Shares Redeemed | | | (42 | ) | | | (54 | ) | |
Net Increase in Class I Shares Outstanding | | | 188 | | | | 122 | | |
Class A: | |
Shares Subscribed | | | 76 | | | | 114 | | |
Shares Issued on Distributions Reinvested | | | 32 | | | | 6 | | |
Shares Redeemed | | | (27 | ) | | | (178 | ) | |
Net Increase (Decrease) in Class A Shares Outstanding | | | 81 | | | | (58 | ) | |
Class L: | |
Shares Exchanged | | | 7 | | | | 2 | | |
Shares Issued on Distributions Reinvested | | | 2 | | | | — | @@ | |
Shares Redeemed | | | (5 | ) | | | (15 | ) | |
Net Increase (Decrease) in Class L Shares Outstanding | | | 4 | | | | (13 | ) | |
Class C: | |
Shares Subscribed | | | 21 | | | | 20 | | |
Shares Issued on Distributions Reinvested | | | 4 | | | | — | @@ | |
Shares Redeemed | | | (3 | ) | | | (9 | ) | |
Net Increase in Class C Shares Outstanding | | | 22 | | | | 11 | | |
@@ Amount is less than 500 shares.
The accompanying notes are an integral part of the financial statements.
12
Morgan Stanley Institutional Fund, Inc.
Annual Report — December 31, 2017
Financial Highlights
Global Advantage Portfolio
| | | Class I | |
| | | Year Ended December 31, | |
Selected Per Share Data and Ratios | | 2017 | | 2016(1) | | 2015 | | 2014 | | 2013 | |
Net Asset Value, Beginning of Period | | $ | 12.12 | | | $ | 12.36 | | | $ | 12.74 | | | $ | 13.57 | | | $ | 11.37 | | |
Income (Loss) from Investment Operations: | |
Net Investment Income (Loss)(2) | | | (0.03 | ) | | | 0.00 | (3) | | | 0.05 | | | | 0.05 | | | | 0.04 | | |
Net Realized and Unrealized Gain | | | 5.07 | | | | 0.02 | | | | 0.46 | | | | 0.04 | | | | 3.27 | | |
Total from Investment Operations | | | 5.04 | | | | 0.02 | | | | 0.51 | | | | 0.09 | | | | 3.31 | | |
Distributions from and/or in Excess of: | |
Net Investment Income | | | — | | | | — | | | | (0.03 | ) | | | (0.01 | ) | | | (0.08 | ) | |
Net Realized Gain | | | (1.73 | ) | | | (0.26 | ) | | | (0.86 | ) | | | (0.91 | ) | | | (1.03 | ) | |
Total Distributions | | | (1.73 | ) | | | (0.26 | ) | | | (0.89 | ) | | | (0.92 | ) | | | (1.11 | ) | |
Net Asset Value, End of Period | | $ | 15.43 | | | $ | 12.12 | | | $ | 12.36 | | | $ | 12.74 | | | $ | 13.57 | | |
Total Return(4) | | | 41.56 | % | | | 0.21 | % | | | 3.85 | % | | | 0.83 | % | | | 29.71 | % | |
Ratios and Supplemental Data: | |
Net Assets, End of Period (Thousands) | | $ | 7,005 | | | $ | 3,229 | | | $ | 1,785 | | | $ | 3,181 | | | $ | 2,868 | | |
Ratio of Expenses to Average Net Assets(8) | | | 1.09 | %(5) | | | 1.09 | %(5) | | | 1.11 | %(5)(6) | | | 1.30 | %(5) | | | 1.29 | %(5) | |
Ratio of Net Investment Income (Loss) to Average Net Assets(8) | | | (0.19 | )%(5) | | | 0.04 | %(5) | | | 0.37 | %(5) | | | 0.40 | %(5) | | | 0.29 | %(5) | |
Ratio of Rebate from Morgan Stanley Affiliates to Average Net Assets | | | 0.01 | % | | | 0.01 | % | | | 0.00 | %(7) | | | 0.00 | %(7) | | | 0.01 | % | |
Portfolio Turnover Rate | | | 103 | % | | | 90 | % | | | 90 | % | | | 46 | % | | | 57 | % | |
(8) Supplemental Information on the Ratios to Average Net Assets: | |
Ratios Before Expense Limitation: | |
Expenses to Average Net Assets | | | 3.67 | % | | | 3.82 | % | | | 5.38 | % | | | 5.31 | % | | | 8.07 | % | |
Net Investment Loss to Average Net Assets | | | (2.77 | )% | | | (2.69 | )% | | | (3.90 | )% | | | (3.61 | )% | | | (6.49 | )% | |
(1) Reflects prior period custodian out-of-pocket expenses that were reimbursed in September 2016. The amount of the reimbursement was immaterial on a per share basis and did not impact the total return of Class I shares. The Ratio of Expenses to Average Net Assets and the Ratio of Net Investment Income to Average Net Assets would be unchanged as the reimbursement of custodian fees was offset against expense waivers/reimbursements with no impact to net expenses or net investment income.
(2) Per share amount is based on average shares outstanding.
(3) Amount is less than $0.005 per share.
(4) Calculated based on the net asset value as of the last business day of the period.
(5) The Ratios of Expenses and Net Investment Income (Loss) reflect the rebate of certain Fund expenses in connection with the investments in Morgan Stanley affiliates during the period. The effect of the rebate on the ratios is disclosed in the above table as "Ratio of Rebate from Morgan Stanley Affiliates to Average Net Assets."
(6) Effective January 23, 2015, the Adviser has agreed to limit the ratio of expenses to average net assets to the maximum ratio of 1.10% for Class I shares. Prior to January 23, 2015, the maximum ratio was 1.30% for Class I share.
(7) Amount is less than 0.005%.
The accompanying notes are an integral part of the financial statements.
13
Morgan Stanley Institutional Fund, Inc.
Annual Report — December 31, 2017
Financial Highlights
Global Advantage Portfolio
| | | Class A | |
| | | Year Ended December 31, | |
Selected Per Share Data and Ratios | | 2017 | | 2016(1) | | 2015 | | 2014 | | 2013 | |
Net Asset Value, Beginning of Period | | $ | 12.01 | | | $ | 12.29 | | | $ | 12.70 | | | $ | 13.57 | | | $ | 11.36 | | |
Income (Loss) from Investment Operations: | |
Net Investment Income (Loss)(2) | | | (0.08 | ) | | | (0.05 | ) | | | (0.04 | ) | | | 0.01 | | | | (0.04 | ) | |
Net Realized and Unrealized Gain | | | 5.01 | | | | 0.03 | | | | 0.49 | | | | 0.04 | | | | 3.31 | | |
Total from Investment Operations | | | 4.93 | | | | (0.02 | ) | | | 0.45 | | | | 0.05 | | | | 3.27 | | |
Distributions from and/or in Excess of: | |
Net Investment Income | | | — | | | | — | | | | — | | | | (0.01 | ) | | | (0.03 | ) | |
Net Realized Gain | | | (1.73 | ) | | | (0.26 | ) | | | (0.86 | ) | | | (0.91 | ) | | | (1.03 | ) | |
Total Distributions | | | (1.73 | ) | | | (0.26 | ) | | | (0.86 | ) | | | (0.92 | ) | | | (1.06 | ) | |
Net Asset Value, End of Period | | $ | 15.21 | | | $ | 12.01 | | | $ | 12.29 | | | $ | 12.70 | | | $ | 13.57 | | |
Total Return(3) | | | 41.02 | % | | | (0.11 | )% | | | 3.40 | % | | | 0.46 | % | | | 29.48 | % | |
Ratios and Supplemental Data: | |
Net Assets, End of Period (Thousands) | | $ | 4,577 | | | $ | 2,640 | | | $ | 3,414 | | | $ | 790 | | | $ | 681 | | |
Ratio of Expenses to Average Net Assets(8) | | | 1.41 | %(4) | | | 1.44 | %(4) | | | 1.45 | %(4)(6) | | | 1.65 | %(4) | | | 1.60 | %(4)(5) | |
Ratio of Net Investment Income (Loss) to Average Net Assets(8) | | | (0.52 | )%(4) | | | (0.38 | )%(4) | | | (0.34 | )%(4) | | | 0.05 | %(4) | | | (0.35 | )%(4) | |
Ratio of Rebate from Morgan Stanley Affiliates to Average Net Assets | | | 0.01 | % | | | 0.01 | % | | | 0.01 | % | | | 0.00 | %(7) | | | 0.01 | % | |
Portfolio Turnover Rate | | | 103 | % | | | 90 | % | | | 90 | % | | | 46 | % | | | 57 | % | |
(8) Supplemental Information on the Ratios to Average Net Assets: | |
Ratios Before Expense Limitation: | |
Expenses to Average Net Assets | | | 3.88 | % | | | 4.09 | % | | | 5.92 | % | | | 5.79 | % | | | 8.43 | % | |
Net Investment Loss to Average Net Assets | | | (2.99 | )% | | | (3.03 | )% | | | (4.81 | )% | | | (4.09 | )% | | | (7.18 | )% | |
(1) Reflects prior period custodian out-of-pocket expenses that were reimbursed in September 2016. The amount of the reimbursement was immaterial on a per share basis and did not impact the total return of Class A shares. The Ratio of Expenses to Average Net Assets and the Ratio of Net Investment Loss to Average Net Assets would be unchanged as the reimbursement of custodian fees was offset against expense waivers/reimbursements with no impact to net expenses or net investment loss.
(2) Per share amount is based on average shares outstanding.
(3) Calculated based on the net asset value which does not reflect sales charges, if applicable, as of the last business day of the period.
(4) The Ratios of Expenses and Net Investment Income (Loss) reflect the rebate of certain Fund expenses in connection with the investments in Morgan Stanley affiliates during the period. The effect of the rebate on the ratios is disclosed in the above table as "Ratio of Rebate from Morgan Stanley Affiliates to Average Net Assets."
(5) Effective September 16, 2013, the Adviser has agreed to limit the ratio of expenses to average net assets to the maximum ratio of 1.65% for Class A shares. Prior to September 16, 2013, the maximum ratio was 1.55% for Class A shares.
(6) Effective January 23, 2015, the Adviser has agreed to limit the ratio of expenses to average net assets to the maximum ratio of 1.45% for Class A shares. Prior to January 23, 2015, the maximum ratio was 1.65% for Class A share.
(7) Amount is less than 0.005%.
The accompanying notes are an integral part of the financial statements.
14
Morgan Stanley Institutional Fund, Inc.
Annual Report — December 31, 2017
Financial Highlights
Global Advantage Portfolio
| | | Class L | |
| | | Year Ended December 31, | |
Selected Per Share Data and Ratios | | 2017 | | 2016(1) | | 2015 | | 2014 | | 2013 | |
Net Asset Value, Beginning of Period | | $ | 11.74 | | | $ | 12.09 | | | $ | 12.56 | | | $ | 13.50 | | | $ | 11.35 | | |
Income (Loss) from Investment Operations: | |
Net Investment Loss(2) | | | (0.15 | ) | | | (0.10 | ) | | | (0.08 | ) | | | (0.06 | ) | | | (0.09 | ) | |
Net Realized and Unrealized Gain | | | 4.89 | | | | 0.01 | | | | 0.47 | | | | 0.04 | | | | 3.28 | | |
Total from Investment Operations | | | 4.74 | | | | (0.09 | ) | | | 0.39 | | | | (0.02 | ) | | | 3.19 | | |
Distributions from and/or in Excess of: | |
Net Investment Income | | | — | | | | — | | | | — | | | | (0.01 | ) | | | (0.01 | ) | |
Net Realized Gain | | | (1.73 | ) | | | (0.26 | ) | | | (0.86 | ) | | | (0.91 | ) | | | (1.03 | ) | |
Total Distributions | | | (1.73 | ) | | | (0.26 | ) | | | (0.86 | ) | | | (0.92 | ) | | | (1.04 | ) | |
Net Asset Value, End of Period | | $ | 14.75 | | | $ | 11.74 | | | $ | 12.09 | | | $ | 12.56 | | | $ | 13.50 | | |
Total Return(3) | | | 40.34 | % | | | (0.70 | )% | | | 2.96 | % | | | (0.07 | )% | | | 28.78 | % | |
Ratios and Supplemental Data: | |
Net Assets, End of Period (Thousands) | | $ | 327 | | | $ | 217 | | | $ | 382 | | | $ | 338 | | | $ | 254 | | |
Ratio of Expenses to Average Net Assets(8) | | | 1.94 | %(4) | | | 1.94 | %(4) | | | 1.96 | %(4)(6) | | | 2.15 | %(4) | | | 2.09 | %(4)(5) | |
Ratio of Net Investment Loss to Average Net Assets(8) | | | (1.05 | )%(4) | | | (0.86 | )%(4) | | | (0.60 | )%(4) | | | (0.45 | )%(4) | | | (0.71 | )%(4) | |
Ratio of Rebate from Morgan Stanley Affiliates to Average Net Assets | | | 0.01 | % | | | 0.01 | % | | | 0.00 | %(7) | | | 0.00 | %(7) | | | 0.01 | % | |
Portfolio Turnover Rate | | | 103 | % | | | 90 | % | | | 90 | % | | | 46 | % | | | 57 | % | |
(8) Supplemental Information on the Ratios to Average Net Assets: | |
Ratios Before Expense Limitation: | |
Expenses to Average Net Assets | | | 5.07 | % | | | 5.12 | % | | | 6.58 | % | | | 6.55 | % | | | 9.07 | % | |
Net Investment Loss to Average Net Assets | | | (4.18 | )% | | | (4.04 | )% | | | (5.22 | )% | | | (4.85 | )% | | | (7.69 | )% | |
(1) Reflects prior period custodian out-of-pocket expenses that were reimbursed in September 2016. The amount of the reimbursement was immaterial on a per share basis and did not impact the total return of Class L shares. The Ratio of Expenses to Average Net Assets and the Ratio of Net Investment Loss to Average Net Assets would be unchanged as the reimbursement of custodian fees was offset against expense waivers/reimbursements with no impact to net expenses or net investment loss.
(2) Per share amount is based on average shares outstanding.
(3) Calculated based on the net asset value as of the last business day of the period.
(4) The Ratios of Expenses and Net Investment Loss reflect the rebate of certain Fund expenses in connection with the investments in Morgan Stanley affiliates during the period. The effect of the rebate on the ratios is disclosed in the above table as "Ratio of Rebate from Morgan Stanley Affiliates to Average Net Assets."
(5) Effective September 16, 2013, the Adviser has agreed to limit the ratio of expenses to average net assets to the maximum ratio of 2.15% for Class L shares. Prior to September 16, 2013, the maximum ratio was 2.05% for Class L shares.
(6) Effective January 23, 2015, the Adviser has agreed to limit the ratio of expenses to average net assets to the maximum ratio of 1.95% for Class L shares. Prior to January 23, 2015, the maximum ratio was 2.15% for Class L shares.
(7) Amount is less than 0.005%.
The accompanying notes are an integral part of the financial statements.
15
Morgan Stanley Institutional Fund, Inc.
Annual Report — December 31, 2017
Financial Highlights
Global Advantage Portfolio
| | | Class C | |
| | | Year Ended December 31, | | Period from
April 30, 2015(2) to | |
Selected Per Share Data and Ratios | | 2017 | | 2016(1) | | December 31, 2015 | |
Net Asset Value, Beginning of Period | | $ | 11.66 | | | $ | 12.04 | | | $ | 13.30 | | |
Income (Loss) from Investment Operations: | |
Net Investment Loss(3) | | | (0.19 | ) | | | (0.13 | ) | | | (0.11 | ) | |
Net Realized and Unrealized Gain (Loss) | | | 4.86 | | | | 0.01 | | | | (0.26 | ) | |
Total from Investment Operations | | | 4.67 | | | | (0.12 | ) | | | (0.37 | ) | |
Distributions from and/or in Excess of: | |
Net Investment Income | | | — | | | | — | | | | (0.03 | ) | |
Net Realized Gain | | | (1.73 | ) | | | (0.26 | ) | | | (0.86 | ) | |
Total Distributions | | | (1.73 | ) | | | (0.26 | ) | | | (0.89 | ) | |
Net Asset Value, End of Period | | $ | 14.60 | | | $ | 11.66 | | | $ | 12.04 | | |
Total Return(4) | | | 40.02 | % | | | (0.95 | )% | | | (2.94 | )%(7) | |
Ratios and Supplemental Data: | |
Net Assets, End of Period (Thousands) | | $ | 549 | | | $ | 180 | | | $ | 59 | | |
Ratio of Expenses to Average Net Assets(9) | | | 2.19 | %(5) | | | 2.19 | %(5) | | | 2.20 | %(5)(8) | |
Ratio of Net Investment Loss to Average Net Assets(9) | | | (1.30 | )%(5) | | | (1.12 | )%(5) | | | (1.33 | )%(5)(8) | |
Ratio of Rebate from Morgan Stanley Affiliates to Average Net Assets | | | 0.01 | % | | | 0.01 | % | | | 0.00 | %(6)(8) | |
Portfolio Turnover Rate | | | 103 | % | | | 90 | % | | | 90 | % | |
(9) Supplemental Information on the Ratios to Average Net Assets: | |
Ratios Before Expense Limitation: | |
Expense to Average Net Assets | | | 5.22 | % | | | 6.12 | % | | | 12.84 | %(8) | |
Net Investment Loss to Average Net Assets | | | (4.33 | )% | | | (5.05 | )% | | | (11.97 | )%(8) | |
(1) Reflects prior period custodian out-of-pocket expenses that were reimbursed in September 2016. The amount of the reimbursement was immaterial on a per share basis and did not impact the total return of Class C shares. The Ratio of Expenses to Average Net Assets and the Ratio of Net Investment Loss to Average Net Assets would be unchanged as the reimbursement of custodian fees was offset against expense waivers/reimbursements with no impact to net expenses or net investment loss.
(2) Commencement of Offering.
(3) Per share amount is based on average shares outstanding.
(4) Calculated based on the net asset value which does not reflect sales charges, if applicable, as of the last business day of the period.
(5) The Ratios of Expenses and Net Investment Loss reflect the rebate of certain Fund expenses in connection with the investments in Morgan Stanley affiliates during the period. The effect of the rebate on the ratios is disclosed in the above table as "Ratio of Rebate from Morgan Stanley Affiliates to Average Net Assets."
(6) Amount is less than 0.005%.
(7) Not annualized.
(8) Annualized.
The accompanying notes are an integral part of the financial statements.
16
Morgan Stanley Institutional Fund, Inc.
Annual Report — December 31, 2017
Notes to Financial Statements
Morgan Stanley Institutional Fund, Inc. (the "Company") is registered under the Investment Company Act of 1940, as amended (the "Act"), as an open-end management investment company. The Company is comprised of twenty-nine separate, active, diversified and non-diversified funds (individually referred to as a "Fund", collectively as the "Funds"). The Company applies investment company accounting and reporting guidance.
The accompanying financial statements relate to the Global Advantage Portfolio. The Fund seeks long-term capital appreciation.
The Fund offers four classes of shares — Class I, Class A, Class L and Class C. On April 30, 2015, the Fund suspended offering Class L shares. Existing Class L shareholders may invest through reinvestment of dividends and distributions.
A. Significant Accounting Policies: The following significant accounting policies are in conformity with U.S. generally accepted accounting principles ("GAAP"). Such policies are consistently followed by the Company in the preparation of its financial statements. GAAP may require management to make estimates and assumptions that affect the reported amounts and disclosures in the financial statements. Actual results may differ from those estimates.
1. Security Valuation: (1) An equity portfolio security listed or traded on an exchange is valued at its latest reported sales price (or at the exchange official closing price if such exchange reports an official closing price), and if there were no sales on a given day and if there is no official exchange closing price for that day, the security is valued at the mean between the last reported bid and asked prices if such bid and asked prices are available on the relevant exchanges. Listed equity securities not traded on the valuation date with no reported bid and asked prices available on the exchange are valued at the mean between the current bid and asked prices obtained from one or more reputable brokers or dealers. In cases where a security is traded on more than one exchange, the security is valued on the exchange designated as the primary market; (2) all other equity portfolio securities for which over-the-counter ("OTC") market quotations are readily available are valued at the latest reported sales price (or at the market official closing price if such market reports an official closing price), and if there was no trading in the security on a given day and if there is no official closing price from relevant markets for that day, the security is valued at the
mean between the last reported bid and asked prices if such bid and asked prices are available on the relevant markets. An unlisted equity security that does not trade on the valuation date and for which bid and asked prices from the relevant markets are unavailable is valued at the mean between the current bid and asked prices obtained from one or more reputable brokers or dealers; (3) listed options are valued at the last reported sales price on the exchange on which they are listed (or at the exchange official closing price if such exchange reports an official closing price). If an official closing price or last reported sales price is unavailable, the listed option should be fair valued at the mean between its latest bid and ask prices. Unlisted options are valued at the mean between their latest bid and ask prices from a broker/dealer or valued by a pricing service/vendor; (4) certain portfolio securities may be valued by an outside pricing service/vendor approved by the Company's Board of Directors (the "Directors"). The pricing service/vendor may employ a pricing model that takes into account, among other things, bids, yield spreads, and/or other market data and specific security characteristics. Alternatively, if a valuation is not available from an outside pricing service/vendor, and the security trades on an exchange, the security may be valued at its latest reported sale price (or at the exchange official closing price if such exchange reports an official closing price), prior to the time when assets are valued. If there are no sales on a given day and if there is no official exchange closing price for that day, the security is valued at the mean between the last reported bid and asked prices if such bid and asked prices are available in the relevant exchanges; (5) when market quotations are not readily available, including circumstances under which Morgan Stanley Investment Management Inc. (the "Adviser") determines that the closing price, last sale price or the mean between the last reported bid and asked prices are not reflective of a security's market value, portfolio securities are valued at their fair value as determined in good faith under procedures established by and under the general supervision of the Directors. Occasionally, developments affecting the closing prices of securities and other assets may occur between the times at which valuations of such securities are determined (that is, close of the foreign market on which the securities trade) and the close of business of the New York Stock Exchange ("NYSE"). If developments occur during such periods that are expected to materially affect the value of such securities, such valuations may be adjusted to reflect
17
Morgan Stanley Institutional Fund, Inc.
Annual Report — December 31, 2017
Notes to Financial Statements (cont'd)
the estimated fair value of such securities as of the close of the NYSE, as determined in good faith by the Directors or by the Adviser using a pricing service and/or procedures approved by the Directors; (6) quotations of foreign portfolio securities, other assets and liabilities and forward contracts stated in foreign currency are translated into U.S. dollar equivalents at the prevailing market rates prior to the close of the NYSE; and (7) investments in mutual funds, including the Morgan Stanley Institutional Liquidity Funds, are valued at the net asset value ("NAV") as of the close of each business day.
The Directors have responsibility for determining in good faith the fair value of the investments, and the Directors may appoint others, such as the Company's Adviser or a valuation committee, to assist the Directors in determining fair value and to make the actual calculations pursuant to the fair valuation methodologies previously approved by the Directors. Under procedures approved by the Directors, the Company's Adviser has formed a Valuation Committee whose members are approved by the Directors. The Valuation Committee provides administration and oversight of the Company's valuation policies and procedures, which are reviewed at least annually by the Directors. These procedures allow the Company to utilize independent pricing services, quotations from securities and financial instrument dealers, and other market sources to determine fair value.
The Company has procedures to determine the fair value of securities and other financial instruments for which market prices are not readily available. Under these procedures, the Valuation Committee convenes on a regular and ad hoc basis to review such securities and considers a number of factors, including valuation methodologies and significant unobservable valuation inputs, when arriving at fair value. The Valuation Committee may employ a market-based approach which may use related or comparable assets or liabilities, recent transactions, market multiples, book values, and other relevant information for the investment to determine the fair value of the investment. An income-based valuation approach may also be used in which the anticipated future cash flows of the investment are discounted to calculate fair value. Discounts may also be applied due to the nature or duration of any restrictions on the disposition of the investments. Due to the inherent uncertainty of valuations of such investments, the fair values may differ significantly from the values that would have
been used had an active market existed. The Valuation Committee employs various methods for calibrating these valuation approaches including a regular review of valuation methodologies, key inputs and assumptions, transactional back-testing or disposition analysis, and reviews of any related market activity.
2. Fair Value Measurement: Financial Accounting Standards Board ("FASB") Accounting Standards CodificationTM ("ASC") 820, "Fair Value Measurement" ("ASC 820"), defines fair value as the value that the Fund would receive to sell an investment or pay to transfer a liability in a timely transaction with an independent buyer in the principal market, or in the absence of a principal market, the most advantageous market for the investment or liability. ASC 820 establishes a three-tier hierarchy to distinguish between (1) inputs that reflect the assumptions market participants would use in valuing an asset or liability developed based on market data obtained from sources independent of the reporting entity (observable inputs) and (2) inputs that reflect the reporting entity's own assumptions about the assumptions market participants would use in valuing an asset or liability developed based on the best information available in the circumstances (unobservable inputs) and to establish classification of fair value measurements for disclosure purposes. Various inputs are used in determining the value of the Fund's investments. The inputs are summarized in the three broad levels listed below.
• Level 1 – unadjusted quoted prices in active markets for identical investments
• Level 2 – other significant observable inputs (including quoted prices for similar investments, interest rates, prepayment speeds, credit risk, etc.)
• Level 3 – significant unobservable inputs including the Fund's own assumptions in determining the fair value of investments. Factors considered in making this determination may include, but are not limited to, information obtained by contacting the issuer, analysts, or the appropriate stock exchange (for exchange-traded securities), analysis of the issuer's financial statements or other available documents and, if necessary, available information concerning other securities in similar circumstances
18
Morgan Stanley Institutional Fund, Inc.
Annual Report — December 31, 2017
Notes to Financial Statements (cont'd)
The inputs or methodology used for valuing securities are not necessarily an indication of the risk associated with investing in those securities and the determination of the significance of a particular input to the fair value measurement in its entirety requires judgment and considers factors specific to each security.
The following is a summary of the inputs used to value the Fund's investments as of December 31, 2017.
Investment Type | | Level 1
Unadjusted
quoted
prices
(000) | | Level 2
Other
significant
observable
inputs
(000) | | Level 3
Significant
unobservable
inputs
(000) | | Total
(000) | |
Assets: | |
Common Stocks | |
Aerospace & Defense | | $ | 730 | | | $ | — | | | $ | — | | | $ | 730 | | |
Capital Markets | | | 174 | | | | — | | | | — | | | | 174 | | |
Construction Materials | | | — | | | | 367 | | | | — | | | | 367 | | |
Diversified Financial
Services | | | 443 | | | | — | | | | — | | | | 443 | | |
Health Care
Equipment &
Supplies | | | 172 | | | | — | | | | — | | | | 172 | | |
Hotels, Restaurants &
Leisure | | | 430 | | | | 909 | | | | — | | | | 1,339 | | |
Internet & Direct
Marketing Retail | | | 1,187 | | | | 128 | | | | — | | | | 1,315 | | |
Internet Software &
Services | | | 1,278 | | | | 631 | | | | — | | | | 1,909 | | |
Media | | | 1,023 | | | | — | | | | — | | | | 1,023 | | |
Metals & Mining | | | — | | | | 187 | | | | — | | | | 187 | | |
Pharmaceuticals | | | 178 | | | | — | | | | — | | | | 178 | | |
Road & Rail | | | 469 | | | | — | | | | — | | | | 469 | | |
Software | | | 579 | | | | 125 | | | | — | | | | 704 | | |
Specialty Retail | | | 511 | | | | 122 | | | | — | | | | 633 | | |
Textiles, Apparel &
Luxury Goods | | | 194 | | | | 1,301 | | | | — | | | | 1,495 | | |
Transportation
Infrastructure | | | 183 | | | | 751 | | | | — | | | | 934 | | |
Total Common Stocks | | | 7,551 | | | | 4,521 | | | | — | | | | 12,072 | | |
Short-Term Investment | |
Investment Company | | | 367 | | | | — | | | | — | | | | 367 | | |
Call Options Purchased | | | — | | | | 3 | | | | — | | | | 3 | | |
Total Assets | | $ | 7,918 | | | $ | 4,524 | | | $ | — | | | $ | 12,442 | | |
Transfers between investment levels may occur as the markets fluctuate and/or the availability of data used in an investment's valuation changes. The Fund recognizes transfers between the levels as of the end of the period. As of December 31, 2017, securities with a total value of approximately $3,139,000 transferred from Level 1 to Level 2. Securities that were valued using unadjusted quoted prices at December 31, 2016 were valued using other significant observable inputs at December 31, 2017. At December 31, 2017, the fair value of certain securities were adjusted due to developments which
occurred between the time of the close of the foreign markets on which they trade and the close of business on the NYSE which resulted in their Level 2 classification.
3. Foreign Currency Translation and Foreign Investments: The books and records of the Fund are maintained in U.S. dollars. Foreign currency amounts are translated into U.S. dollars as follows:
– investments, other assets and liabilities at the prevailing rate of exchange on the valuation date;
– investment transactions and investment income at the prevailing rates of exchange on the dates of such transactions.
Although the net assets of the Fund are presented at the foreign exchange rates and market values at the close of the period, the Fund does not isolate that portion of the results of operations arising as a result of changes in the foreign exchange rates from the fluctuations arising from changes in the market prices of securities held at period end. Similarly, the Fund does not isolate the effect of changes in foreign exchange rates from the fluctuations arising from changes in the market prices of securities sold during the period. Accordingly, realized and unrealized foreign currency gains (losses) on investments in securities are included in the reported net realized and unrealized gains (losses) on investment transactions and balances. However, pursuant to U.S. federal income tax regulations, gains and losses from certain foreign currency transactions and the foreign currency portion of gains and losses realized on sales and maturities of foreign denominated debt securities are treated as ordinary income for U.S. federal income tax purposes.
Net realized gains (losses) on foreign currency transactions represent net foreign exchange gains (losses) from foreign currency forward exchange contracts, disposition of foreign currencies, currency gains (losses) realized between the trade and settlement dates on securities transactions, and the difference between the amount of investment income and foreign withholding taxes recorded on the Fund's books and the U.S. dollar equivalent amounts actually received or paid. Net unrealized currency gains (losses) from valuing foreign currency denominated assets and liabilities at period end exchange rates are reflected as a component of unrealized appreciation (depreciation) in the Statement of Assets and Liabilities. The change in unrealized currency gains (losses)
19
Morgan Stanley Institutional Fund, Inc.
Annual Report — December 31, 2017
Notes to Financial Statements (cont'd)
on foreign currency translations for the period is reflected in the Statement of Operations.
Foreign security and currency transactions may involve certain considerations and risks not typically associated with those of U.S. dollar denominated transactions as a result of, among other factors, fluctuations of exchange rates in relation to the U.S. dollar, the possibility of lower levels of governmental supervision and regulation of foreign securities markets and the possibility of political or economic instability.
Governmental approval for foreign investments may be required in advance of making an investment under certain circumstances in some countries, and the extent of foreign investments in domestic companies may be subject to limitation in other countries. Foreign ownership limitations also may be imposed by the charters of individual companies to prevent, among other concerns, violations of foreign investment limitations. As a result, an additional class of shares (identified as "Foreign" in the Portfolio of Investments) may be created and offered for investment. The "local" and "foreign shares" market values may differ. In the absence of trading of the foreign shares in such markets, the Fund values the foreign shares at the closing exchange price of the local shares.
4. Derivatives: The Fund may, but is not required to, use derivative instruments for a variety of purposes, including hedging, risk management, portfolio management or to earn income. Derivatives are financial instruments whose value is based, in part, on the value of an underlying asset, interest rate, index or financial instrument. Prevailing interest rates and volatility levels, among other things, also affect the value of derivative instruments. A derivative instrument often has risks similar to its underlying asset and may have additional risks, including imperfect correlation between the value of the derivative and the underlying asset, risks of default by the counterparty to certain transactions, magnification of losses incurred due to changes in the market value of the securities, instruments, indices or interest rates to which the derivative instrument relates, risks that the transactions may not be liquid and risks arising from margin requirements. The use of derivatives involves risks that are different from, and possibly greater than, the risks associated with other portfolio investments. Derivatives may involve the use of highly specialized instruments that require investment techniques and risk analyses different from those associated with other portfolio
investments. All of the Fund's holdings, including derivative instruments, are marked-to-market each day with the change in value reflected in unrealized appreciation (depreciation). Upon disposition, a realized gain or loss is recognized.
Certain derivative transactions may give rise to a form of leverage. Leverage magnifies the potential for gain and the risk of loss. Leverage associated with derivative transactions may cause the Fund to liquidate portfolio positions when it may not be advantageous to do so to satisfy its obligations or to meet earmarking or segregation requirements, pursuant to applicable Securities and Exchange Commission ("SEC") rules and regulations, or may cause the Fund to be more volatile than if the Fund had not been leveraged. Although the Adviser seeks to use derivatives to further the Fund's investment objectives, there is no assurance that the use of derivatives will achieve this result.
Following is a description of the derivative instruments and techniques that the Fund used during the period and their associated risks:
Options: With respect to options, the Fund is subject to equity risk, interest rate risk and foreign currency exchange risk in the normal course of pursuing its investment objectives. If the Fund buys an option, it buys a legal contract giving it the right to buy or sell a specific amount of the underlying instrument or foreign currency, or futures contract on the underlying instrument or foreign currency, at an agreed-upon price during a period of time or on a specified date typically in exchange for a premium paid by the Fund. The Fund may purchase and/or sell put and call options. Purchasing call options tends to increase the Fund's exposure to the underlying (or similar) instrument. Purchasing put options tends to decrease the Fund's exposure to the underlying (or similar) instrument. When entering into purchased option contracts, the Fund bears the risk of interest or exchange rates or securities prices moving unexpectedly, in which case, the Fund may not achieve the anticipated benefits of the purchased option contracts; however the risk of loss is limited to the premium paid. Purchased options are reported as part of "Total Investments in Securities" in the Statement of Assets and Liabilities. Premium paid for purchasing options which expired are treated as realized losses. If the Fund sells an option, it sells to another party the right to buy from or sell to the
20
Morgan Stanley Institutional Fund, Inc.
Annual Report — December 31, 2017
Notes to Financial Statements (cont'd)
Fund a specific amount of the underlying instrument or foreign currency, or futures contract on the underlying instrument or foreign currency, at an agreed-upon price during a period of time or on a specified date typically in exchange for a premium received by the Fund. When options are purchased OTC, the Fund bears the risk that the counterparty that wrote the option will be unable or unwilling to perform its obligations under the option contract. Options may also be illiquid and the Fund may have difficulty closing out its position. A decision as to whether, when and how to use options involves the exercise of skill and judgment and even a well-conceived option transaction may be unsuccessful because of market behavior or unexpected events. The prices of options can be highly volatile and the use of options can lower total returns.
FASB ASC 815, "Derivatives and Hedging" ("ASC 815"), is intended to improve financial reporting about derivative instruments by requiring enhanced disclosures to enable investors to better understand how and why the Fund uses derivative instruments, how these derivative instruments are accounted for and their effects on the Fund's financial position and results of operations.
The following table sets forth the fair value of the Fund's derivative contracts by primary risk exposure as of December 31, 2017.
| | | Asset Derivatives
Statement of Assets and
Liabilities Location | | Primary Risk
Exposure | | Value
(000) | |
Options Purchased
| | Investments, at Value
(Options Purchased) | | Currency Risk | | $ | 3 | (a) | |
(a) Amounts are included in Investments in Securities in the Statement of Assets and Liabilities.
The following tables set forth by primary risk exposure the Fund's realized gains (losses) and change in unrealized appreciation (depreciation) by type of derivative contract for the year ended December 31, 2017 in accordance with ASC 815.
Realized Gain (Loss) | |
Primary Risk Exposure | | Derivative Type | | Value
(000) | |
Currency Risk
| | Investments
(Options Purchased) | | $ | (7 | )(b) | |
(b) Amounts are included in Investments Sold in the Statement of Operations.
Change in Unrealized Appreciation (Depreciation) | |
Primary Risk Exposure | | Derivative Type | | Value
(000) | |
Currency Risk
| | Investments
(Options Purchased) | | $ | (18 | )(c) | |
(c) Amounts are included in Investments in the Statement of Operations.
At December 31, 2017, the Fund's derivative assets and liabilities are as follows:
Statement of Assets and Liabilities | | Gross Amounts of Assets and Liabilities Presented in the | |
Derivatives | | Assets(d)
(000) | | Liabilities(d)
(000) | |
Options Purchased | | $ | 3 | (a) | | $ | — | | |
(a) Amounts are included in Investments in Securities in the Statement of Assets and Liabilities.
(d) Absent an event of default or early termination, OTC derivative assets and liabilities are presented gross and not offset in the Statement of Assets and Liabilities.
The Fund typically enters into International Swaps and Derivatives Association, Inc. Master Agreements ("ISDA Master Agreements") or similar master agreements (collectively, "Master Agreements") with its contract counterparties for certain OTC derivatives in order to, among other things, reduce its credit risk to counterparties. ISDA Master Agreements include provisions for general obligations, representations, collateral and events of default or termination. Under an ISDA Master Agreement, the Fund typically may offset with the counterparty certain OTC derivative financial instruments' payables and/or receivables with collateral held and/or posted and create one single net payment (close-out netting) in the event of default, termination and/or potential deterioration in the credit quality of the counterparty. Various Master Agreements govern the terms of certain transactions with counterparties, including transactions such as swap, forward, repurchase and reverse repurchase agreements. These Master Agreements typically attempt to reduce the counterparty risk associated with such transactions by specifying credit protection mechanisms and providing standardization that improves legal certainty. Cross-termination provisions under Master Agreements typically provide that a default in connection with one transaction between the Fund and a counterparty gives the non-defaulting party the right to terminate any other transactions in place with the defaulting party to create one single net payment due to/due from the defaulting party and may be a feature in certain Master Agreements. In the event the Fund exercises its right to terminate a Master Agreement after a counterparty experiences a termination event as defined in the Master
21
Morgan Stanley Institutional Fund, Inc.
Annual Report — December 31, 2017
Notes to Financial Statements (cont'd)
Agreement, the return of collateral with market value in excess of the Fund's net liability may be delayed or denied.
The following table presents derivative financial instruments that are subject to enforceable netting arrangements as of December 31, 2017.
Gross Amounts Not Offset in the Statement of Assets and Liabilities | |
Counterparty | | Gross Asset
Derivatives
Presented in
Statement of
Assets and
Liabilities
(000) | | Financial
Instrument
(000) | | Collateral
Received
(000) | | Net Amount
(not less
than $0)
(000) | |
Royal Bank of Scotland | | $ | 3 | (a) | | $ | — | | | $ | — | | | $ | 3 | | |
(a) Amount are included in Investment in Securities in the Statement of Assets and Liabilities.
For the year ended December 31, 2017, the approximate average monthly amount outstanding for each derivative type is as follows:
Options Purchased: | |
Average monthly notional amount | | | 2,027,000 | | |
5. Indemnifications: The Company enters into contracts that contain a variety of indemnifications. The Company's maximum exposure under these arrangements is unknown. However, the Company has not had prior claims or losses pursuant to these contracts and expects the risk of loss to be remote.
6. Dividends and Distributions to Shareholders: Dividends and distributions to shareholders are recorded on the ex-dividend date. Dividends from net investment income, if any, are declared and paid annually. Net realized capital gains, if any, are distributed at least annually.
7. Security Transactions, Income and Expenses: Security transactions are accounted for on the trade date (date the order to buy or sell is executed). Realized gains and losses on the sale of investment securities are determined on the specific identified cost method. Dividend income and other distributions are recorded on the ex-dividend date (except for certain foreign dividends which may be recorded as soon as the Fund is informed of such dividends) net of applicable withholding taxes. Interest income is recognized on the accrual basis except where collection is in doubt. Discounts are accreted and premiums are amortized over the life of the respective securities. Most expenses of the Company can be directly attributed to a particular Fund. Expenses which cannot be directly attributed are apportioned among the Funds based upon
relative net assets or other appropriate methods. Income, expenses (other than class specific expenses — distribution and shareholder services, transfer agency and sub transfer agency fees) and realized and unrealized gains or losses are allocated to each class of shares based upon their relative net assets.
B. Advisory Fees: The Adviser, a wholly-owned subsidiary of Morgan Stanley, provides the Fund with advisory services under the terms of an Investment Advisory Agreement, paid quarterly, at the annual rate based on the daily net assets as follows:
First $1
billion | | Over $1
billion | |
| | 0.80 | % | | | 0.75 | % | |
For the year ended December 31, 2017, the advisory fee rate (net of waiver/rebate) was equivalent to an annual effective rate of 0.00% of the Fund's average daily net assets.
The Adviser has agreed to reduce its advisory fee and/or reimburse the Fund so that total annual portfolio operating expenses, excluding certain investment related expenses, taxes, interest and other extraordinary expenses (including litigation), will not exceed 1.10% for Class I shares, 1.45% for Class A shares, 1.95% for Class L shares and 2.20% for Class C shares. The fee waivers and/or expense reimbursements will continue for at least one year from the date of the Fund's prospectus or until such time as the Directors act to discontinue all or a portion of such waivers and/or reimbursements when they deem such action is appropriate. For the year ended December 31, 2017, approximately $70,000 of advisory fees were waived and approximately $155,000 of other expenses were reimbursed by the Adviser pursuant to this arrangement.
C. Administration Fees: The Adviser also serves as Administrator to the Company and provides administrative services pursuant to an Administration Agreement for an annual fee, accrued daily and paid monthly, of 0.08% of the Fund's average daily net assets.
Under a Sub-Administration Agreement between the Administrator and State Street Bank and Trust Company ("State Street"), State Street provides certain administrative services to the Company. For such services, the Administrator pays State Street a portion of the fee the Administrator receives from the Fund.
D. Distribution and Shareholder Services Fees: Morgan Stanley Distribution, Inc. ("MSDI" or the "Distributor"), a wholly-owned subsidiary of the Adviser and an indirect
22
Morgan Stanley Institutional Fund, Inc.
Annual Report — December 31, 2017
Notes to Financial Statements (cont'd)
subsidiary of Morgan Stanley, serves as the Company's Distributor of Fund shares pursuant to a Distribution Agreement. The Company has adopted a Shareholder Services Plan with respect to Class A shares pursuant to Rule 12b-1 under the Act. Under the Shareholder Services Plan, the Fund pays the Distributor a shareholder services fee, accrued daily and paid monthly, at an annual rate of 0.25% of the Fund's average daily net assets attributable to Class A shares.
The Company has adopted a Distribution and Shareholder Services Plan with respect to Class L shares pursuant to Rule 12b-1 under the Act. Under the Distribution and Shareholder Services Plan, the Fund pays the Distributor a distribution fee, accrued daily and paid monthly, at an annual rate of 0.50% and a shareholder services fee, accrued daily and paid monthly, at an annual rate of 0.25% of the Fund's average daily net assets attributable to Class L shares.
The Company has adopted a Distribution and Shareholder Services Plan with respect to Class C shares pursuant to Rule 12b-1 under the Act. Under the Distribution and Shareholder Services Plan, the Fund pays the Distributor a distribution fee, accrued daily and paid monthly, at an annual rate of 0.75% and a shareholder services fee, accrued daily and paid monthly, at an annual rate of 0.25% of the Fund's average daily net assets attributable to Class C shares.
The distribution and shareholder services fees are used to support the expenses associated with servicing and maintaining accounts. The Distributor may compensate other parties for providing shareholder support services to investors who purchase Class A, Class L and Class C shares.
E. Dividend Disbursing and Transfer Agent: The Company's dividend disbursing and transfer agent is Boston Financial Data Services, Inc. ("BFDS"). Pursuant to a Transfer Agency Agreement, the Company pays BFDS a fee based on the number of classes, accounts and transactions relating to the Funds of the Company. Effective January 1, 2018, BFDS changed its name to DST Asset Manager Solutions, Inc.
F. Custodian Fees: State Street (the "Custodian") serves as Custodian for the Company in accordance with a Custodian Agreement. The Custodian holds cash, securities, and other assets of the Company as required by the Act. Custody fees are payable monthly based on assets held in custody, investment purchases and sales activity and account maintenance fees, plus reimbursement for certain out-of-pocket expenses.
G. Security Transactions and Transactions with Affiliates: For the year ended December 31, 2017, purchases and sales of investment securities for the Fund, other than long-term U.S. Government securities and short-term investments, were approximately $11,733,000 and $8,763,000, respectively. There were no purchases and sales of long-term U.S. Government securities for the year ended December 31, 2017.
The Fund invests in the Institutional Class of the Morgan Stanley Institutional Liquidity Funds — Treasury Securities Portfolio (the "Liquidity Funds"), an open-end management investment company managed by the Adviser. Advisory fees paid by the Fund are reduced by an amount equal to its pro-rata share of the advisory and administration fees paid by the Fund due to its investment in the Liquidity Funds. For the year ended December 31, 2017, advisory fees paid were reduced by approximately $1,000 relating to the Fund's investment in the Liquidity Funds.
A summary of the Fund's transactions in shares of the Liquidity Funds during the year ended December 31, 2017 is as follows:
Affiliated
Investment
Company | | Value
December 31,
2016
(000) | | Purchases
at Cost
(000) | | Proceeds
from Sales
(000) | | Dividend
Income
(000) | |
Liquidity Funds | | $ | 29 | | | $ | 6,014 | | | $ | 5,676 | | | $ | 2 | | |
Affiliated
Investment
Company (cont'd) | | Realized
Gain (Loss)
(000) | | Change in
Unrealized
Appreciation
(Depreciation)
(000) | | Value
December 31,
2017
(000) | |
Liquidity Funds | | $ | — | | | $ | — | | | $ | 367 | | |
During the year ended December 31, 2017, the Fund incurred less than $500 in brokerage commissions with Morgan Stanley & Co., LLC, an affiliate of the Adviser/Administrator and Distributor, for portfolio transactions executed on behalf of the Fund.
The Fund is permitted to purchase and sell securities ("cross-trade") from and to other Morgan Stanley Funds as well as other funds and client accounts for which the Adviser or an affiliate of the Adviser serves as investment adviser, pursuant to procedures approved by the Directors in compliance with Rule 17a-7 under the Act (the "Rule"). Each cross-trade is executed at the current market price in compliance with provisions of the Rule. For the year ended December 31, 2017, the Fund did not engage in any cross-trade transactions.
The Fund has an unfunded Deferred Compensation Plan (the "Compensation Plan"), which allows each independent Director to defer payment of all, or a portion, of the fees he or she
23
Morgan Stanley Institutional Fund, Inc.
Annual Report — December 31, 2017
Notes to Financial Statements (cont'd)
receives for serving on the Board of Directors. Each eligible Director generally may elect to have the deferred amounts credited with a return equal to the total return on one or more of the Morgan Stanley funds that are offered as investment options under the Compensation Plan. Appreciation/depreciation and distributions received from these investments are recorded with an offsetting increase/decrease in the deferred compensation obligation and do not affect the NAV of the Fund.
H. Federal Income Taxes: It is the Fund's intention to continue to qualify as a regulated investment company and distribute all of its taxable and tax-exempt income. Accordingly, no provision for federal income taxes is required in the financial statements.
The Fund may be subject to taxes imposed by countries in which it invests. Such taxes are generally based on income and/or capital gains earned or repatriated. Taxes are accrued based on net investment income, net realized gains and net unrealized appreciation as such income and/or gains are earned. Taxes may also be based on transactions in foreign currency and are accrued based on the value of investments denominated in such currency.
FASB ASC 740-10, "Income Taxes — Overall", sets forth a minimum threshold for financial statement recognition of the benefit of a tax position taken or expected to be taken in a tax return. Management has concluded there are no significant uncertain tax positions that would require recognition in the financial statements. If applicable, the Fund recognizes interest accrued related to unrecognized tax benefits in "Interest Expense" and penalties in "Other Expenses" in the Statement of Operations. The Fund files tax returns with the U.S. Internal Revenue Service, New York and various states. Generally, each of the tax years in the four-year period ended December 31, 2017, remains subject to examination by taxing authorities.
The tax character of distributions paid may differ from the character of distributions shown in the Statements of Changes in Net Assets due to short-term capital gains being treated as ordinary income for tax purposes. The tax character of distributions paid during fiscal years 2017 and 2016 was as follows:
2017
Distributions
Paid From: | | 2016
Distributions
Paid From: | |
Ordinary
Income
(000) | | Long-Term
Capital Gain
(000) | | Ordinary
Income
(000) | | Long-Term
Capital Gain
(000) | |
| $ | 64 | | | $ | 1,195 | | | $ | — | | | $ | 146 | | |
The amount and character of income and gains to be distributed are determined in accordance with income tax regulations which may differ from GAAP. These book/tax differences are either considered temporary or permanent in nature.
Temporary differences are primarily due to differing book and tax treatments for the timing of the recognition of gains (losses) on certain investment transactions and the timing of the deductibility of certain expenses.
Permanent differences, primarily due to differing treatments of gains (losses) related to foreign currency transactions, return of capital distributions from real estate investment trusts, a nondeductible expense and a net operating loss, resulted in the following reclassifications among the components of net assets at December 31, 2017:
Accumulated
Net Investment
Loss
(000) | | Accumulated
Undistributed
Net Realized
Gain
(000) | | Paid-in-
Capital
(000) | |
| $ | 37 | | | $ | (36 | ) | | $ | (1 | ) | |
At December 31, 2017, the components of distributable earnings for the Fund on a tax basis were as follows:
Undistributed
Ordinary
Income
(000) | | Undistributed
Long-Term
Capital Gain
(000) | |
| $ | 126 | | | $ | 295 | | |
I. Credit Facility: The Company and other Morgan Stanley funds participated in a $150,000,000 committed, unsecured revolving line of credit facility (the "Facility") with State Street. This Facility is to be used for temporary emergency purposes or funding of shareholder redemption requests. The interest rate on borrowings is based on the federal funds rate or 1 month LIBOR rate plus a spread. The Facility also has a commitment fee of 0.25% per annum based on the unused portion of the Facility. During the year ended December 31, 2017, the Fund did not have any borrowings under the Facility.
J. Other: At December 31, 2017, the Fund had record owners of 10% or greater. Investment activities of these shareholders could have a material impact on the Fund. The aggregate percentage of such owners was 78.3%.
24
Morgan Stanley Institutional Fund, Inc.
Annual Report — December 31, 2017
Report of Independent Registered Public Accounting Firm
To the Shareholders and Board of Directors of
Morgan Stanley Institutional Fund, Inc. —
Global Advantage Portfolio
Opinion on the Financial Statements
We have audited the accompanying statement of assets and liabilities of Global Advantage Portfolio (the "Fund") (one of the funds constituting the Morgan Stanley Institutional Fund, Inc. (the "Company")), including the portfolio of investments, as of December 31, 2017, and the related statement of operations for the year then ended, the statements of changes in net assets for each of the two years in the period then ended, the financial highlights for each of the five years in the period then ended and the related notes (collectively referred to as the "financial statements"). In our opinion, the financial statements present fairly, in all material respects, the financial position of Global Advantage Portfolio (one of the funds constituting Morgan Stanley Institutional Fund, Inc.) at December 31, 2017, the results of its operations for the year then ended, the changes in its net assets for each of the two years in the period then ended and its financial highlights for each of the five years in the period then ended, in conformity with U.S. generally accepted accounting principles.
Basis for Opinion
These financial statements are the responsibility of the Company's management. Our responsibility is to express an opinion on the Fund's financial statements based on our audits. We are a public accounting firm registered with the Public Company Accounting Oversight Board (United States) ("PCAOB") and are required to be independent with respect to the Company in accordance with the U.S. federal securities law and the applicable rules and regulations of the Securities and Exchange Commission and the PCAOB.
We conducted our audits in accordance with the standards of the PCAOB. Those standards require that we plan and perform the audit to obtain reasonable assurance about whether the financial statements are free of material misstatement, whether due to error or fraud. The Company is not required to have, nor were we engaged to perform, an audit of the Company's internal control over financial reporting. As part of our audits, we are required to obtain an understanding of internal control over financial reporting, but not for the purpose of expressing an opinion on the effectiveness of the Company's internal control over financial reporting. Accordingly, we express no such opinion.
Our audits included performing procedures to assess the risks of material misstatement of the financial statements, whether due to error or fraud, and performing procedures that respond to those risks. Such procedures included examining, on a test basis, evidence regarding the amounts and disclosures in the financial statements. Our procedures included confirmation of securities owned as of December 31, 2017 by correspondence with the custodian and others or by other appropriate auditing procedures where replies from others were not received. Our audits also included evaluating the accounting principles used and significant estimates made by management, as well as evaluating the overall presentation of the financial statements. We believe that our audits provide a reasonable basis for our opinion.

We have served as the auditor of one or more Morgan Stanley investment companies since 2000.
Boston, Massachusetts
February 26, 2018
25
Morgan Stanley Institutional Fund, Inc.
Annual Report — December 31, 2017
Federal Tax Notice (unaudited)
For federal income tax purposes, the following information is furnished with respect to the distributions paid by the Fund during its taxable year ended December 31, 2017. For corporate shareholders 19.8% of the dividends qualified for the dividends received deduction.
The Fund designated and paid approximately $1,195,000 as a long-term capital gain distribution.
For federal income tax purposes, the following information is furnished with respect to the Fund's earnings for its taxable year ended December 31, 2017. When distributed, certain earnings may be subject to a maximum tax rate of 15% as provided for by the Jobs and Growth Tax Relief Reconciliation Act of 2003. The Fund designated up to a maximum of approximately $65,000 as taxable at this lower rate.
In January, the Fund provides tax information to shareholders for the preceding calendar year.
26
Morgan Stanley Institutional Fund, Inc.
Annual Report — December 31, 2017
Privacy Notice (unaudited)
MORGAN STANLEY INVESTMENT MANAGEMENT INC.
AN IMPORTANT NOTICE CONCERNING OUR U.S. PRIVACY POLICY
We are required by federal law to provide you with a copy of our privacy policy annually. This policy applies to current and former individual investors in funds managed or sponsored by Morgan Stanley Investment Management Inc. ("MSIM") as well as current and former individual clients of MSIM. This policy is not applicable to partnerships, corporations, trusts or other non-individual clients or investors. Please note that we may amend this policy at any time, and will inform you of any changes as required by law.
WE RESPECT YOUR PRIVACY
We appreciate that you have provided us with your personal financial information. We strive to maintain the privacy of such information while we help you achieve your financial objectives. This Notice describes what non-public personal information we collect about you, why we collect it, when we may share it with others and how certain others may use it. It discusses the steps you may take to limit our sharing of certain information about you to affiliated companies in the Morgan Stanley family of companies ("other Morgan Stanley companies"). It also discloses how you may limit use of certain shared information for marketing purposes by other Morgan Stanley branded companies. Throughout this policy, we refer to the non-public information that personally identifies you or your accounts as "personal information.''
1. WHAT PERSONAL INFORMATION DO WE COLLECT ABOUT YOU?
We obtain personal information from applications and other forms you submit to us, from your dealings with us, from consumer reporting agencies, from our Web sites and from third parties and other sources.
For example:
• We may collect information such as your name, address, e-mail address, telephone/fax numbers, assets, income and investment objectives through subscription documents, applications and other forms you submit to us.
• We may obtain information about account balances, your use of account(s) and the types of products and services you prefer to receive from us through your dealings and transactions with us and other sources.
• We may obtain information about your creditworthiness and credit history from consumer reporting agencies.
• We may collect background information from and through third-party vendors to verify representations you have made and to comply with various regulatory requirements.
• If you interact with us through our public and private Web sites, we may collect information that you provide directly through online communications (such as an e-mail address). We may also collect information about your Internet service provider, your domain name, your computer's operating system and Web browser, your use of our Web sites and your product and service preferences, through the use of "cookies." Please consult the Terms of Use of these sites for more details.
2. WHEN DO WE DISCLOSE PERSONAL INFORMATION WE COLLECT ABOUT YOU?
We may disclose personal information we collect about you to other Morgan Stanley companies and to non-affiliated third parties.
a. Information We Disclose to Other Morgan Stanley Companies.
We may disclose personal information to other Morgan Stanley companies for a variety of reasons, including to manage your account(s) effectively, to service and process your transactions, to let you know about products and services offered by us and other Morgan Stanley companies, to manage our business, and as otherwise required or permitted by law. Offers for products and services from other Morgan Stanley companies are developed under conditions designed to safeguard your personal information.
27
Morgan Stanley Institutional Fund, Inc.
Annual Report — December 31, 2017
Privacy Notice (unaudited) (cont'd)
b. Information We Disclose to Non-affiliated Third Parties.
We do not disclose personal information that we collect about you to non-affiliated third parties except to those who provide marketing services on our behalf, to financial institutions with whom we have joint marketing agreements, and as otherwise required or permitted by law. For example, we may disclose personal information to non-affiliated third parties for servicing and processing transactions, to offer our own products and services, to protect against fraud, for institutional risk control, to respond to judicial process or to perform services on our behalf. When we share personal information with a non-affiliated third party, they are required to limit their use of personal information to the particular purpose for which it was shared and they are not allowed to share personal information with others except to fulfill that limited purpose or as may be permitted or required by law.
3. HOW DO WE PROTECT THE SECURITY AND CONFIDENTIALITY OF PERSONAL INFORMATION WE COLLECT ABOUT YOU?
We maintain physical, electronic and procedural security measures to help safeguard the personal information we collect about you. We have internal policies governing the proper handling of client information. Third parties that provide support or marketing services on our behalf may also receive personal information, and we require them to adhere to confidentiality standards with respect to such information.
4. HOW CAN YOU LIMIT THE SHARING OF CERTAIN TYPES OF PERSONAL INFORMATION WITH OTHER MORGAN STANLEY COMPANIES?
We offer you choices as to whether we share with other Morgan Stanley companies the personal information that was collected to determine your eligibility for products and services you request ("eligibility information"). Eligibility information does not include your identification information or personal information pertaining to our transactions or experiences with you. Please note that, even if you direct us not to share eligibility information with other Morgan Stanley companies ("opt-out"), we may still share personal information, including eligibility information, with those companies in circumstances excluded from the opt-out under applicable law, such as to process transactions or to service your account.
5. HOW CAN YOU LIMIT THE USE OF CERTAIN TYPES OF PERSONAL INFORMATION BY OTHER MORGAN STANLEY COMPANIES FOR MARKETING?
By following the opt-out instructions in Section 6 below, you may limit other Morgan Stanley branded companies from marketing their products or services to you based on personal information we disclose to them. This information may include, for example, your income and account history with us. Please note that, even if you choose to limit Other Morgan Stanley Companies from using personal information about you that we may share with them for marketing their products and services to you, Other Morgan Stanley Companies may use your personal information that they obtain from us to market to you in circumstances permitted by law, such as if the Other Morgan Stanley Company has its own relationship with you.
6. HOW CAN YOU SEND US AN OPT-OUT INSTRUCTION?
If you wish to limit our sharing of eligibility information about you with other Morgan Stanley companies or other Morgan Stanley companies' use of personal information for marketing purposes, as described in this notice, you may do so by:
• Calling us at (800) 548-7786
Monday–Friday between 8a.m. and 6p.m.(EST)
• Writing to us at the following address:
DST Asset Manager Solutions, Inc.
c/o Privacy Coordinator
P.O. Box 219804
Kansas City, Missouri 64121
28
Morgan Stanley Institutional Fund, Inc.
Annual Report — December 31, 2017
Privacy Notice (unaudited) (cont'd)
Your written request should include your name, address, telephone number and account number(s) to which the opt-out applies and whether you are opting out with respect to sharing of eligibility information (Section 4 above), or if information used for Marketing (Section 5 above) or both. Written opt-out requests should not be sent with any other correspondence. In order to process your request, we require that the request be provided by you directly and not through a third party.
Your opt-out preference will remain in effect with respect to this policy (as it may be amended) until you notify us otherwise. If you have a joint account, your direction for us not to share this information with other Morgan Stanley companies and for those other Morgan Stanley companies not to use your personal information for marketing will be applied to all account holders on that account. Please understand that if you limit our sharing or our affiliated companies' use of personal information, you and any joint account holder(s) may not receive information about Morgan Stanley products and services, including products or services that could help you manage your financial resources and achieve your investment objectives.
7. WHAT IF AN AFFILIATED COMPANY BECOMES A NON-AFFILIATED THIRD PARTY?
If, at any time in the future, an affiliated company becomes a non-affiliated third party, further disclosures of personal information made to the former affiliated company will be limited to those described in Section 2(b) above relating to non-affiliated third parties. If you elected under Section 6 to limit disclosures we make to affiliated companies, or use of personal information by affiliated companies, your election will not apply to use by any former affiliated company of your personal information in their possession once it becomes a non-affiliated third party.
SPECIAL NOTICE TO RESIDENTS OF VERMONT
The following section supplements our policy with respect to our individual clients who have a Vermont address and supersedes anything to the contrary in the above policy with respect to those clients only.
The state of Vermont requires financial institutions to obtain your consent prior to sharing personal information that they collect about you with affiliated companies and non-affiliated third parties other than in certain limited circumstances. Except as permitted by law, we will not share personal information we collect about you with non-affiliated third parties or other Morgan Stanley companies unless you provide us with your written consent to share such information ("opt-in").
If you wish to receive offers for investment products and services offered by or through other Morgan Stanley companies, please notify us in writing at the following address:
DST Asset Manager Solutions, Inc.
c/o Privacy Coordinator
P.O. Box 219804
Kansas City, Missouri 64121
Your authorization should include your name, address, telephone number and account number(s) to which the opt-in applies and should not be sent with any other correspondence. In order to process your authorization, we require that the authorization be provided by you directly and not through a third party.
SPECIAL NOTICE TO RESIDENTS OF CALIFORNIA
The following section supplements our policy with respect to our individual clients who have a California address and supersedes anything to the contrary in the above policy with respect to those clients only.
In response to a California law, if your account has a California home address, your personal information will not be disclosed to non-affiliated third parties except as permitted by applicable California law, and we will limit sharing such information with our affiliates to comply with California privacy laws that apply to us.
29
Morgan Stanley Institutional Fund, Inc.
Annual Report — December 31, 2017
Director and Officer Information (unaudited)
Independent Directors:
Name, Age and Address of
Independent Director | | Position(s)
Held with
Registrant | | Length of Time
Served* | | Principal Occupation(s) During Past 5 Years
and Other Relevant Professional Experience | | Number of
Portfolios in
Fund Complex
Overseen by
Independent
Director** | | Other Directorships
Held by Independent
Director*** | |
Frank L. Bowman (73)
c/o Perkins Coie LLP
Counsel to the Independent
Directors
30 Rockefeller Plaza
New York, NY 10112 | | Director | | Since
August
2006 | | President, Strategic Decisions, LLC (consulting) (since February 2009); Director or Trustee of various Morgan Stanley Funds (since August 2006); Chairperson of the Compliance and Insurance Committee (since October 2015); formerly, Chairperson of the Insurance Sub-Committee of the Compliance and Insurance Committee (2007-2015); served as President and Chief Executive Officer of the Nuclear Energy Institute (policy organization) (February 2005-November 2008); retired as Admiral, U.S. Navy after serving over 38 years on active duty including 8 years as Director of the Naval Nuclear Propulsion Program in the Department of the Navy and the U.S. Department of Energy (1996-2004); served as Chief of Naval Personnel (July 1994-September 1996) and on the Joint Staff as Director of Political Military Affairs (June 1992-July 1994); knighted as Honorary Knight Commander of the Most Excellent Order of the British Empire; awarded the Officier de l'Orde National du Mérite by the French Government; elected to the National Academy of Engineering (2009). | | | 88 | | | Director of BP p.l.c.; Director of Naval and Nuclear Technologies LLP; Director Emeritus of the Armed Services YMCA; Director of the U.S. Naval Submarine League; Member of the National Security Advisory Council of the Center for U.S. Global Engagement and a member of the CNA Military Advisory Board; Trustee of Fairhaven United Methodist Church; and Director of other various non-profit organizations. | |
Kathleen A. Dennis (64)
c/o Perkins Coie LLP
Counsel to the Independent Directors
30 Rockefeller Plaza
New York, NY 10112 | | Director | | Since
August
2006 | | President, Cedarwood Associates (mutual fund and investment management consulting) (since July 2006); Chairperson of the Liquidity and Alternatives Sub-Committee of the Investment Committee (since October 2006) and Director or Trustee of various Morgan Stanley Funds (since August 2006); formerly, Senior Managing Director of Victory Capital Management (1993-2006). | | | 89 | | | Director of various non-profit organizations. | |
Nancy C. Everett (62)
c/o Perkins Coie LLP
Counsel to the Independent Directors
30 Rockefeller Plaza
New York, NY 10112 | | Director | | Since
January
2015 | | Chief Executive Officer, Virginia Commonwealth University Investment Company (since November 2015); Owner, OBIR, LLC (institutional investment management consulting) (since June 2014); formerly, Managing Director, BlackRock Inc. (February 2011-December 2013); and Chief Executive Officer, General Motors Asset Management (a/k/a Promark Global Advisors, Inc.) (June 2005-May 2010). | | | 90 | | | Formerly, Member of Virginia Commonwealth University School of Business Foundation (2005-2016); Member of Virginia Commonwealth University Board of Visitors (2013-2015); Member of Committee on Directors for Emerging Markets Growth Fund, Inc. (2007-2010); Chairperson of Performance Equity Management, LLC (2006-2010); and Chairperson, GMAM Absolute Return Strategies Fund, LLC (2006-2010). | |
30
Morgan Stanley Institutional Fund, Inc.
Annual Report — December 31, 2017
Director and Officer Information (unaudited) (cont'd)
Independent Directors: (cont'd)
Name, Age and Address of
Independent Director | | Position(s)
Held with
Registrant | | Length of Time
Served* | | Principal Occupation(s) During Past 5 Years
and Other Relevant Professional Experience | | Number of
Portfolios in
Fund Complex
Overseen by
Independent
Director** | | Other Directorships
Held by Independent
Director*** | |
Jakki L. Haussler (60)
c/o Perkins Coie LLP
Counsel to the Independent Directors
30 Rockefeller Plaza
New York, NY 10112 | | Director | | Since
January
2015 | | Chairman and Chief Executive Officer, Opus Capital Group (since January 1996); formerly, Director, Capvest Venture Fund, LP (May 2000-December 2011); Partner, Adena Ventures, LP (July 1999-December 2010); Director, The Victory Funds (February 2005- July 2008). | | | 90 | | | Director of Cincinnati Bell Inc. and Member, Audit Committee and Compensation Committee; Director of Northern Kentucky University Foundation and Member, Investment Committee; Member of Chase College of Law Transactional Law Practice Center Board of Advisors; Director of Best Transport; Director of Chase College of Law Board of Visitors; formerly, Member, University of Cincinnati Foundation Investment Committee; Member, Miami University Board of Visitors (2008-2011); Trustee of Victory Funds (2005-2008) and Chairman, Investment Committee (2007-2008) and Member, Service Provider Committee (2005-2008). | |
Dr. Manuel H. Johnson (68)
c/o Johnson Smick
International, Inc.
220 I Street, NE — Suite 200
Washington, D.C. 20002 | | Director | | Since
July
1991 | | Senior Partner, Johnson Smick International, Inc. (consulting firm); Chairperson of the Investment Committee (since October 2006) and Director or Trustee of various Morgan Stanley Funds (since July 1991); Co-Chairman and a founder of the Group of Seven Council (G7C) (international economic commission); formerly, Chairperson of the Audit Committee (July 1991-September 2006), Vice Chairman of the Board of Governors of the Federal Reserve System and Assistant Secretary of the U.S. Treasury. | | | 88 | | | Director of NVR, Inc. (home construction). | |
Joseph J. Kearns (75)
c/o Kearns & Associates LLC
46 E Peninsula Center #385
Rolling Hills Estates, CA
90274-3712 | | Director | | Since
August
1994 | | Senior Adviser, Kearns & Associates LLC (investment consulting); Chairperson of the Audit Committee (since October 2006) and Director or Trustee of various Morgan Stanley Funds (since August 1994); formerly, Deputy Chairperson of the Audit Committee (July 2003-September 2006) and Chairperson of the Audit Committee of various Morgan Stanley Funds (since August 1994); CFO of the J. Paul Getty Trust. | | | 89 | | | Prior to August 10, 2016, Director of Electro Rent Corporation (equipment leasing); Prior to December 31, 2013, Director of The Ford Family Foundation. | |
31
Morgan Stanley Institutional Fund, Inc.
Annual Report — December 31, 2017
Director and Officer Information (unaudited) (cont'd)
Independent Directors: (cont'd)
Name, Age and Address of
Independent Director | | Position(s)
Held with
Registrant | | Length of Time
Served* | | Principal Occupation(s) During Past 5 Years
and Other Relevant Professional Experience | | Number of
Portfolios in
Fund Complex
Overseen by
Independent
Director** | | Other Directorships
Held by Independent
Director*** | |
Michael F. Klein (59)
c/o Perkins Coie LLP
Counsel to the Independent Directors
30 Rockefeller Plaza
New York, NY 10112 | | Director | | Since
August
2006 | | Managing Director, Aetos Capital, LLC (since March 2000); Co-President, Aetos Alternatives Management, LLC (since January 2004) and Co-Chief Executive Officer of Aetos Capital LLC (since August 2013); Chairperson of the Fixed Income Sub-Committee of the Investment Committee (since October 2006) and Director or Trustee of various Morgan Stanley Funds (since August 2006); formerly, Managing Director, Morgan Stanley & Co. Inc. and Morgan Stanley Dean Witter Investment Management, President, various Morgan Stanley Funds (June 1998-March 2000) and Principal, Morgan Stanley & Co. Inc. and Morgan Stanley Dean Witter Investment Management (August 1997-December 1999). | | | 88 | | | Director of certain investment funds managed or sponsored by Aetos Capital, LLC; Director of Sanitized AG and Sanitized Marketing AG (specialty chemicals). | |
Patricia Maleski (57)
c/o Perkins Coie LLP
Counsel to the Independent Directors
30 Rockefeller Plaza
New York, NY 10112 | | Director | | Since
January
2017 | | Managing Director, JPMorgan Asset Management (2004-2016); Oversight and Control Head of Fiduciary and Conflicts of Interest Program (2015-2016); Chief Control Officer-Global Asset Management (2013-2015); President, JPMorgan Funds (2010-2013); Chief Administrative Officer (2004-2013); various other positions including Treasurer and Board Liaison (since 2001). | | | 90 | | | None. | |
Michael E. Nugent (81)
522 Fifth Avenue
New York, NY 10036 | | Chair of the Board and Director | | Chair of the Boards since July 2006 and Director since July 1991 | | Chair of the Boards of various Morgan Stanley Funds (since July 2006); Chairperson of the Closed-End Fund Committee (since June 2012) and Director or Trustee of various Morgan Stanley Funds (since July 1991); formerly, Chairperson of the Insurance Committee (until July 2006); General Partner, Triumph Capital, L.P. (private investment partnership) (1988-2013). | | | 88 | | | None. | |
W. Allen Reed (70)
c/o Perkins Coie LLP
Counsel to the Independent Directors
30 Rockefeller Plaza
New York, NY 10112 | | Director | | Since
August
2006 | | Chairperson of the Equity Sub-Committee of the Investment Committee (since October 2006) and Director or Trustee of various Morgan Stanley Funds (since August 2006); formerly, President and CEO of General Motors Asset Management; Chairman and Chief Executive Officer of the GM Trust Bank and Corporate Vice President of General Motors Corporation (August 1994-December 2005). | | | 89 | | | Director of Legg Mason, Inc.; formerly, Director of the Auburn University Foundation (2010-2015). | |
Fergus Reid (85)
c/o Joe Pietryka, Inc.
85 Charles Colman Blvd.
Pawling, NY 12564 | | Director | | Since
June
1992 | | Chairman, Joe Pietryka, Inc.; Chairperson of the Governance Committee and Director or Trustee of various Morgan Stanley Funds (since June 1992). | | | 89 | | | Formerly, Trustee and Director of certain investment companies in the JP Morgan Fund Complex managed by JP Morgan Investment Management Inc. (1987-2012). | |
* This is the earliest date the Director began serving the Morgan Stanley Funds. Each Director serves an indefinite term, until his or her successor is elected.
** The Fund Complex includes (as of December 31, 2017) all open-end and closed-end funds (including all of their portfolios) advised by Morgan Stanley Investment Management Inc. (the "Adviser") and any funds that have an adviser that is an affiliated person of the Adviser (including, but not limited to, Morgan Stanley AIP GP LP).
*** This includes any directorships at public companies and registered investment companies held by the Director at any time during the past five years.
32
Morgan Stanley Institutional Fund, Inc.
Annual Report — December 31, 2017
Director and Officer Information (unaudited) (cont'd)
Executive Officers:
Name, Age and Address of Executive Officer | | Position(s) Held
with
Registrant | | Length of Time
Served* | | Principal Occupation(s) During Past 5 Years | |
John H. Gernon (54)
522 Fifth Avenue
New York, NY 10036 | | President and Principal Executive Officer | | Since
September
2013 | | President and Principal Executive Officer of the Equity and Fixed Income Funds and the Morgan Stanley AIP Funds (since September 2013) and the Liquidity Funds and various money market funds (since May 2014) in the Fund Complex; Managing Director of the Adviser; Head of Product (since 2006). | |
Timothy J. Knierim (58)
522 Fifth Avenue
New York, NY 10036 | | Chief Compliance Officer | | Since
December
2016 | | Managing Director of the Adviser and various entities affiliated with the Adviser; Chief Compliance Officer of various Morgan Stanley Funds and the Adviser (since December 2016) and Chief Compliance Officer of Morgan Stanley AIP GP LP (since 2014). Formerly, Managing Director and Deputy Chief Compliance Officer of the Adviser (2014-2016); and formerly, Chief Compliance Officer of Prudential Investment Management, Inc. (2007-2014). | |
Francis J. Smith (52)
522 Fifth Avenue
New York, NY 10036 | | Treasurer and Principal Financial Officer | | Treasurer since July 2003 and Principal Financial Officer since September 2002 | | Manging Director of the Adviser and various entities affiliated with the Adviser; Treasurer (since July 2003) and Principal Financial Officer of various Morgan Stanley Funds (since September 2002). | |
Mary E. Mullin (50)
522 Fifth Avenue
New York, NY 10036 | | Secretary | | Since
June
1999 | | Managing Director of the Adviser; Secretary of various Morgan Stanley Funds (since June 1999). | |
Michael J. Key (38)
522 Fifth Avenue
New York, NY 10036 | | Vice President | | Since
June
2017 | | Vice President of the Equity and Fixed Income Funds, Liquidity Funds, various money market funds and the Morgan Stanley AIP Funds in the Fund Complex (since June 2017); Executive Director of the Adviser; Head of Product Development for Equity and Fixed Income Funds (since August 2013). | |
* This is the earliest date the officer began serving the Morgan Stanley Funds. Each officer serves a one-year term, until his or her successor is elected and qualifies.
33
Morgan Stanley Institutional Fund, Inc.
Annual Report — December 31, 2017
Adviser and Administrator
Morgan Stanley Investment Management Inc.
522 Fifth Avenue
New York, New York 10036
Distributor
Morgan Stanley Distribution, Inc.
522 Fifth Avenue
New York, New York 10036
Dividend Disbursing and Transfer Agent
DST Asset Manager Solutions, Inc.
2000 Crown Colony Drive
Quincy, Massachusetts 02169
Custodian
State Street Bank and Trust Company
One Lincoln Street
Boston, Massachusetts 02111
Legal Counsel
Dechert LLP
1095 Avenue of the Americas
New York, New York 10036
Counsel to the Independent Directors
Perkins Coie LLP
30 Rockefeller Plaza
New York, New York 10112
Independent Registered Public Accounting Firm
Ernst & Young LLP
200 Clarendon Street
Boston, Massachusetts 02116
Reporting to Shareholders
Each Morgan Stanley Fund provides a complete schedule of portfolio holdings in its semi-annual and annual reports within 60 days of the end of the fund's second and fourth fiscal quarters. The semi-annual and annual reports are filed electronically with the Securities and Exchange Commission (SEC) on Form N-CSRS and Form N-CSR, respectively. Morgan Stanley also delivers the semi-annual and annual reports to fund shareholders and makes these reports available on its public website, www.morganstanley.com/im. Each Morgan Stanley fund also files a complete schedule of portfolio holdings with the SEC for the fund's first and third fiscal quarters on Form N-Q. Morgan Stanley does not deliver the reports for the first and third fiscal quarters to shareholders, nor are the reports posted to the Morgan Stanley public website. You may, however, obtain the Form N-Q filings (as well as the Form N-CSR and N-CSRS filings) by accessing the SEC's website, www.sec.gov. You may also review and copy them at the SEC's Public Reference Room in Washington, DC. Information on the operation of the SEC's Public Reference Room may be obtained by calling the SEC toll free at 1 (800) SEC-0330. You can also request copies of these materials, upon payment of a duplicating fee, by electronic request at the SEC's email address (publicinfo@sec.gov) or by writing to the SEC's Public Reference Section, Washington, D.C. 20549-1520.
Proxy Voting Policies and Procedures and Proxy Voting Record
You may obtain a copy of the Company's Proxy Voting Policy and Procedures and information regarding how the Company voted proxies relating to portfolio securities during the most recent twelve-month period ended June 30, without charge, upon request, by calling toll free 1 (800) 548-7786 or by visiting our website at www.morganstanley.com/im. This information is also available on the SEC's website at www.sec.gov.
This report is authorized for distribution only when preceded or accompanied by a prospectus or summary prospectus of the applicable Fund of Morgan Stanley Institutional Fund, Inc., which describes in detail the Fund's investment policies, risks, fees and expenses. Please read the prospectus carefully before you invest or send money. For additional information, including information regarding the investments comprising the Fund, please visit our website at www.morganstanley.com/im or call toll free 1 (800) 548-7786.
34
Printed in U.S.A.
This Report has been prepared for shareholders and may be distributed to others only if preceded or accompanied by a current prospectus.
Morgan Stanley Investment Management Inc.
522 Fifth Avenue
New York, New York 10036
© 2018 Morgan Stanley. Morgan Stanley Distribution, Inc.

IFIGAANN
2008497 EXP. 02.28.19

Morgan Stanley Institutional Fund, Inc.
Global Concentrated Portfolio
Annual Report
December 31, 2017

Morgan Stanley Institutional Fund, Inc.
Annual Report — December 31, 2017
Shareholders' Letter | | | 2 | | |
Expense Example | | | 3 | | |
Investment Overview | | | 4 | | |
Portfolio of Investments | | | 6 | | |
Statement of Assets and Liabilities | | | 7 | | |
Statement of Operations | | | 8 | | |
Statements of Changes in Net Assets | | | 9 | | |
Financial Highlights | | | 10 | | |
Notes to Financial Statements | | | 14 | | |
Report of Independent Registered Public Accounting Firm | | | 19 | | |
Federal Tax Notice | | | 20 | | |
Privacy Notice | | | 21 | | |
Director and Officer Information | | | 24 | | |
This report is authorized for distribution only when preceded or accompanied by a prospectus or summary prospectus of the applicable Fund of Morgan Stanley Institutional Fund, Inc. To receive a prospectus and/or statement of additional information (SAI), which contains more complete information such as investment objectives, charges, expenses, policies for voting proxies, risk considerations, and describes in detail each of the Fund's investment policies to the prospective investor, please call toll free 1 (800) 548-7786. Please read the prospectuses carefully before you invest or send money.
Additionally, you can access information about the Fund including performance, characteristics, and investment team commentary, through Morgan Stanley Investment Management's website: www.morganstanley.com/im.
Market forecasts provided in this report may not necessarily come to pass. There is no guarantee that any sectors mentioned will continue to perform as discussed herein or that securities in such sectors will be held by the Fund in the future. There is no assurance that a fund will achieve its investment objective. Funds are subject to market risk, which is the possibility that market values of securities owned by the Fund will decline and, therefore, the value of the Fund's shares may be less than what you paid for them. Accordingly, you can lose money investing in this Fund. Please see the prospectus for more complete information on investment risks.
1
Morgan Stanley Institutional Fund, Inc.
Annual Report — December 31, 2017
Shareholders' Letter (unaudited)
Dear Shareholders,
We are pleased to provide this Annual report, in which you will learn how your investment in Global Concentrated Portfolio (the "Fund") performed during the latest twelve-month period.
Morgan Stanley Investment Management is a client-centric, investor-led organization. Our global presence, intellectual capital, and breadth of products and services enable us to partner with investors to meet the evolving challenges of today's financial markets. We aim to deliver superior investment service and to empower our clients to make the informed decisions that help them reach their investment goals.
As always, we thank you for selecting Morgan Stanley Investment Management, and look forward to working with you in the months and years ahead.
Sincerely,

John H. Gernon
President and Principal Executive Officer
January 2018
2
Morgan Stanley Institutional Fund, Inc.
Annual Report — December 31, 2017
Expense Example (unaudited)
Global Concentrated Portfolio
As a shareholder of the Fund, you incur two types of costs: (1) transactional costs; and (2) ongoing costs, which may include advisory fees, administration fees, distribution and shareholder services fees and other Fund expenses. This example is intended to help you understand your ongoing costs (in dollars) of investing in the Fund and to compare these costs with the ongoing costs of investing in other mutual funds.
This example is based on an investment of $1,000 invested at the beginning of the six-month period ended December 31, 2017 and held for the entire six-month period.
Actual Expenses
The table below provides information about actual account values and actual expenses. You may use the information in this table, together with the amount you invested, to estimate the expenses that you paid over the period. Simply divide your account value by $1,000 (for example, an $8,600 account value divided by $1,000 = 8.6), then multiply the result by the number in the table under the heading entitled "Actual Expenses Paid During Period" to estimate the expenses you paid on your account during this period.
Hypothetical Example for Comparison Purposes
The table below provides information about hypothetical account values and hypothetical expenses based on the Fund's actual expense ratio and an assumed rate of return of 5% per year before expenses, which is not the Fund's actual return. The hypothetical account values and expenses may not be used to estimate the actual ending account balance or expenses you paid for the period. You may use this information to compare the ongoing costs of investing in the Fund and other funds. To do so, compare this 5% hypothetical example with the 5% hypothetical examples that appear in the shareholder reports of the other funds.
Please note that the expenses shown in the table are meant to highlight your ongoing costs only and do not reflect any transactional costs, such as sales charges (loads). Therefore, the information for each class in the table is useful in comparing ongoing costs only, and will not help you determine the relative total costs of owning different funds. In addition, if these transactional costs were included, your costs would have been higher.
| | | Beginning
Account
Value
7/1/17 | | Actual Ending
Account
Value
12/31/17 | | Hypothetical
Ending Account
Value | | Actual
Expenses
Paid
During
Period* | | Hypothetical
Expenses Paid
During Period* | | Net
Expense
Ratio
During
Period** | |
Global Concentrated Portfolio Class I | | $ | 1,000.00 | | | $ | 1,101.70 | | | $ | 1,020.27 | | | $ | 5.19 | | | $ | 4.99 | | | | 0.98 | % | |
Global Concentrated Portfolio Class A | | | 1,000.00 | | | | 1,099.30 | | | | 1,018.40 | | | | 7.14 | | | | 6.87 | | | | 1.35 | | |
Global Concentrated Portfolio Class C | | | 1,000.00 | | | | 1,095.30 | | | | 1,014.62 | | | | 11.09 | | | | 10.66 | | | | 2.10 | | |
Global Concentrated Portfolio Class IS | | | 1,000.00 | | | | 1,101.00 | | | | 1,020.42 | | | | 5.03 | | | | 4.84 | | | | 0.95 | | |
* Expenses are calculated using each Fund Class' annualized net expense ratio (as disclosed), multiplied by the average account value over the period, and multiplied by 184/365 (to reflect the most recent one-half year period).
** Annualized.
3
Morgan Stanley Institutional Fund, Inc.
Annual Report — December 31, 2017
Investment Overview (unaudited)
Global Concentrated Portfolio
The Fund seeks long-term capital appreciation.
Performance
For the year ended December 31, 2017, the Fund's Class I shares had a total return based on net asset value and reinvestment of distributions per share of 22.64%, net of fees. The Fund's Class I shares outperformed the Fund's benchmark, the MSCI World Net Index (the "Index"), which returned 22.40%.
Please keep in mind that double-digit returns are highly unusual and cannot be sustained. Investors should also be aware that these returns were primarily achieved during favorable market conditions.
Factors Affecting Performance
• Following the 2016 U.S. presidential election campaign, the market re-focused on company earnings, beginning its 2017 ascent. 2017 also saw economic recovery accelerate in regions outside the U.S., namely Europe and Asia ex-Japan. The surprise for many in 2017 was the strength of the global equity markets.
• The greatest returns within the Index over the reporting period came from outside the U.S., particularly Asia ex-Japan and Europe, with Japan close behind. The information technology sector showed the strongest performance around the globe. The worst performers within the Index were U.S. stocks in the energy and relatively low volatility sectors such as telecommunication services, real estate, utilities and consumer staples.
• The Fund benefited during the period from its overweight regional allocation in Asia ex-Japan. An underweight to the European region detracted from performance. Also detracting from performance was the euro strengthening versus the U.S. dollar, particularly in the final days of 2017.
• Within stock selection, the largest detractor for the period was a U.S.-based biopharmaceutical company that reported weaker-than-expected sales for a new drug and had one of its stronger pipelines of drugs affected by a compound that the U.S. Food and Drug Administration pulled. Two other U.S. stocks weighed significantly on performance, a financial private-label card issuer that experienced higher-than-expected provisions for write-offs and
future loss provisions, and a multinational semiconductor and telecommunications equipment company that was negatively affected by its ongoing disputes with large clients.
• The Fund benefited the most from stock positions in Asia ex-Japan, most notably from a leading provider of internet value-added services into China, a Taiwan-based global semiconductor manufacturer that sells its chips into major manufacturers of mobile devices and internet connectivity devices, and a Chinese education and technology enterprise. Other top contributors to performance for the period were a U.S.-based leader in cloud infrastructure and digital workspace technology and a U.S.-based global payments and technology company.
Management Strategies
• There have been no changes to our investment process during the period. Statistically, the majority of a portfolio's annual return can be explained by its common factor exposures (which we categorize as regional and style selection). The tilting of these exposures is highly correlated to alpha generation (that is, a portfolio's excess return over a benchmark). Therefore, the team begins with a quantitative process to identify the common factors we believe are likely to prevail in each region of the world going forward. The rest of a portfolio's annual returns is explained by its company-specific results, meaning that stock selection is also a key determinant to alpha generation. We employ a bottom-up fundamental stock selection process to capture idiosyncratic returns. The result is a highly active portfolio of fundamentally attractive stocks which we believe could benefit from what we have identified to be quantitative investment styles likely to outperform in each region.
• Entering 2018, the Fund is positioned with weightings in growth and value stocks and continues to be underweight low volatility, high dividend yielding sectors that remain expensive relative to their historic valuations. We believe that the financial sector in particular offers opportunities in an environment of rising interest rates following a decade of underperformance. As an offset, we remain overweight in technology. The Fund begins the year with higher weights in Europe and Japan
4
Morgan Stanley Institutional Fund, Inc.
Annual Report — December 31, 2017
Investment Overview (unaudited) (cont'd)
Global Concentrated Portfolio
than in 2017, as we are seeing indications that non-U.S. stocks could continue to do well and these regions of the world are more value-oriented. Additionally, we continue to have an overweight to Asia ex-Japan, where we see selective opportunities offering inexpensive valuations. Non-U.S. markets have lagged the U.S. over the last several years and offer good potential for returns in 2018.
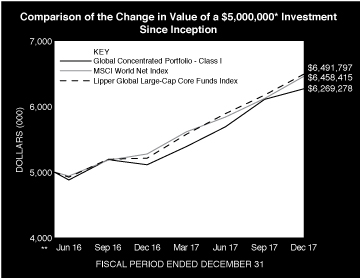
* Minimum Investment for Class I shares
** Commenced Operations on May 27, 2016.
In accordance with SEC regulations, the Fund's performance shown assumes that all recurring fees (including management fees) were deducted and all dividends and distributions were reinvested. The performance of Class A, C and IS shares will vary from the performance of Class I shares and will be impacted by additional fees assessed to those classes (if applicable).
Performance Compared to the MSCI World Net Index(1) and the Lipper Global Large-Cap Core Funds Index(2)
| | | Period Ended December 31, 2017
Total Returns(3) | |
| | | | | Average Annual | |
| | | One
Year | | Five
Years | | Ten
Years | | Since
Inception(5) | |
Fund — Class I Shares
w/o sales charges(4) | | | 22.64 | % | | | — | | | | — | | | | 15.22 | % | |
Fund — Class A Shares
w/o sales charges(4) | | | 22.17 | | | | — | | | | — | | | | 14.78 | | |
Fund — Class A Shares with
maximum 5.25% sales charges(4) | | | 15.78 | | | | — | | | | — | | | | 11.00 | | |
Fund — Class C Shares
w/o sales charges(4) | | | 21.18 | | | | — | | | | — | | | | 13.98 | | |
Fund — Class C Shares with
maximum 1.00% deferred
sales charges(4) | | | 20.18 | | | | — | | | | — | | | | 13.98 | | |
Fund — Class IS Shares
w/o sales charges(4) | | | 22.67 | | | | — | | | | — | | | | 15.24 | | |
MSCI World Net Index | | | 22.40 | | | | — | | | | — | | | | 17.44 | | |
Lipper Global Large-Cap
Core Funds Index | | | 24.54 | | | | — | | | | — | | | | 17.80 | | |
Performance data quoted represents past performance, which is no guarantee of future results, and current performance may be lower or higher than the figures shown. Performance assumes that all dividends and distributions, if any, were reinvested. For the most recent month-end performance figures, please visit www.morganstanley.com/im. Investment return and principal value will fluctuate so that Fund shares, when redeemed, may be worth more or less than their original cost. Total returns do not reflect the deduction of taxes that a shareholder would pay on Fund distributions or the redemption of Fund shares. Performance of share classes will vary due to difference in sales charges and expenses.
(1) The MSCI World Net Index is a free float-adjusted market capitalization weighted index designed to measure the equity market performance of developed markets. The term "free float" represents the portion of shares outstanding that are deemed to be available for purchase in the public equity markets by investors. The MSCI World Net Index currently consists of 23 developed market country indices. The performance of the Index is listed in US dollars and assumes reinvestment of net dividends. The Index is unmanaged and its returns do not include any sales charges or fees. Such costs would lower performance. It is not possible to invest directly in an index.
(2) The Lipper Global Large-Cap Core Funds Index is an equally weighted performance index of the largest qualifying funds (based on net assets) in the Lipper Global Large-Cap Core Funds classification. The Index, which is adjusted for capital gains distributions and income dividends, is unmanaged and should not be considered an investment. There are currently 10 funds represented in this Index. As of the date of this report, the Fund is in the Lipper Global Large-Cap Core Funds classification.
(3) Total returns for the Fund reflect fees waived and expenses reimbursed, if applicable, by the Adviser. Without such waivers and reimbursements, total returns would have been lower.
(4) Commenced operations on May 27, 2016.
(5) For comparative purposes, average annual since inception returns listed for the Indexes refer to the inception date of the Fund, not the inception of the Index.
5
Morgan Stanley Institutional Fund, Inc.
Annual Report — December 31, 2017
Portfolio of Investments
Global Concentrated Portfolio
| | | Shares | | Value
(000) | |
Common Stocks (97.9%) | |
China (14.2%) | |
TAL Education Group ADR | | | 25,448 | | | $ | 756 | | |
Tencent Holdings Ltd. ADR | | | 27,109 | | | | 1,408 | | |
| | | | 2,164 | | |
Ireland (6.0%) | |
Ryanair Holdings PLC ADR (a) | | | 8,786 | | | | 915 | | |
Japan (8.8%) | |
Nintendo Co., Ltd. ADR | | | 16,501 | | | | 744 | | |
Nippon Telegraph & Telephone Corp. ADR | | | 12,606 | | | | 595 | | |
| | | | 1,339 | | |
Spain (4.7%) | |
Banco Bilbao Vizcaya Argentaria SA ADR | | | 84,777 | | | | 721 | | |
Switzerland (8.2%) | |
ABB Ltd. ADR | | | 30,398 | | | | 815 | | |
UBS Group AG (Registered) (a) | | | 23,154 | | | | 426 | | |
| | | | 1,241 | | |
Taiwan (5.5%) | |
Taiwan Semiconductor Manufacturing Co., Ltd. ADR | | | 21,155 | | | | 839 | | |
United Kingdom (4.9%) | |
Diageo PLC ADR | | | 5,104 | | | | 745 | | |
United States (45.6%) | |
Alphabet, Inc., Class A (a) | | | 466 | | | | 491 | | |
Ameriprise Financial, Inc. | | | 3,613 | | | | 612 | | |
Comcast Corp., Class A | | | 17,913 | | | | 718 | | |
Franklin Resources, Inc. | | | 13,912 | | | | 603 | | |
Illinois Tool Works, Inc. | | | 4,742 | | | | 791 | | |
JPMorgan Chase & Co. | | | 7,015 | | | | 750 | | |
Mastercard, Inc., Class A | | | 6,574 | | | | 995 | | |
National Oilwell Varco, Inc. | | | 18,581 | | | | 669 | | |
QUALCOMM, Inc. | | | 6,145 | | | | 393 | | |
VMware, Inc., Class A (a) | | | 7,277 | | | | 912 | | |
| | | | 6,934 | | |
Total Common Stocks (Cost $12,663) | | | 14,898 | | |
Short-Term Investment (2.8%) | |
Investment Company (2.8%) | |
Morgan Stanley Institutional Liquidity
Funds — Treasury Securities Portfolio —
Institutional Class (See Note G)
(Cost $426) | | | 425,529 | | | | 426 | | |
Total Investments (100.7%) (Cost $13,089) (b) | | | 15,324 | | |
Liabilities in Excess of Other Assets (–0.7%) | | | (104 | ) | |
Net Assets (100.0%) | | $ | 15,220 | | |
Country assignments and aggregations are based generally on third party vendor classifications and information, and may be different from the assignments and aggregations under the policies set forth in the Fund's prospectus and/or statement of additional information relating to geographic classifications.
(a) Non-income producing security.
(b) At December 31, 2017, the aggregate cost for federal income tax purposes is approximately $13,115,000. The aggregate gross unrealized appreciation is approximately $2,297,000 and the aggregate gross unrealized depreciation is approximately $88,000, resulting in net unrealized appreciation of approximately $2,209,000.
ADR American Depositary Receipt.
Portfolio Composition
Classification | | Percentage of
Total Investments | |
Other* | | | 25.5 | % | |
Internet Software & Services | | | 12.4 | | |
Software | | | 10.8 | | |
Capital Markets | | | 10.7 | | |
Banks | | | 9.6 | | |
Semiconductors & Semiconductor Equipment | | | 8.0 | | |
Information Technology Services | | | 6.5 | | |
Airlines | | | 6.0 | | |
Electrical Equipment | | | 5.3 | | |
Machinery | | | 5.2 | | |
Total Investments | | | 100.0 | % | |
* Industries and/or investment types representing less than 5% of total investments.
The accompanying notes are an integral part of the financial statements.
6
Morgan Stanley Institutional Fund, Inc.
Annual Report — December 31, 2017
Global Concentrated Portfolio
Statement of Assets and Liabilities | | December 31, 2017
(000) | |
Assets: | |
Investments in Securities of Unaffiliated Issuers, at Value (Cost $12,663) | | $ | 14,898 | | |
Investment in Security of Affiliated Issuer, at Value (Cost $426) | | | 426 | | |
Total Investments in Securities, at Value (Cost $13,089) | | | 15,324 | | |
Receivable for Investments Sold | | | 82 | | |
Due from Adviser | | | 41 | | |
Receivable for Fund Shares Sold | | | 25 | | |
Dividends Receivable | | | 7 | | |
Receivable from Affiliate | | | — | @ | |
Other Assets | | | 25 | | |
Total Assets | | | 15,504 | | |
Liabilities: | |
Payable for Investments Purchased | | | 219 | | |
Payable for Professional Fees | | | 54 | | |
Payable for Custodian Fees | | | 2 | | |
Payable for Shareholder Services Fees — Class A | | | — | @ | |
Payable for Distribution and Shareholder Services Fees — Class C | | | 1 | | |
Payable for Transfer Agency Fees — Class I | | | 1 | | |
Payable for Transfer Agency Fees — Class A | | | 1 | | |
Payable for Transfer Agency Fees — Class C | | | — | @ | |
Payable for Transfer Agency Fees — Class IS | | | — | @ | |
Payable for Administration Fees | | | 1 | | |
Payable for Sub Transfer Agency Fees — Class I | | | — | @ | |
Payable for Sub Transfer Agency Fees — Class A | | | — | @ | |
Payable for Sub Transfer Agency Fees — Class C | | | — | @ | |
Other Liabilities | | | 5 | | |
Total Liabilities | | | 284 | | |
Net Assets | | $ | 15,220 | | |
Net Assets Consist Of: | |
Paid-in-Capital | | $ | 13,185 | | |
Distributions in Excess of Net Investment Income | | | (51 | ) | |
Accumulated Net Realized Loss | | | (149 | ) | |
Unrealized Appreciation (Depreciation) on: | |
Investments | | | 2,235 | | |
Net Assets | | $ | 15,220 | | |
CLASS I: | |
Net Assets | | $ | 11,814 | | |
| Shares Outstanding $0.001 par value shares of beneficial interest (unlimited shares authorized) (not in 000's) | | | 951,191 | | |
Net Asset Value, Offering and Redemption Price Per Share | | $ | 12.42 | | |
CLASS A: | |
Net Assets | | $ | 1,666 | | |
| Shares Outstanding $0.001 par value shares of beneficial interest (unlimited shares authorized) (not in 000's) | | | 134,703 | | |
Net Asset Value, Redemption Price Per Share | | $ | 12.37 | | |
Maximum Sales Load | | | 5.25 | % | |
Maximum Sales Charge | | $ | 0.69 | | |
Maximum Offering Price Per Share | | $ | 13.06 | | |
CLASS C: | |
Net Assets | | $ | 1,728 | | |
| Shares Outstanding $0.001 par value shares of beneficial interest (unlimited shares authorized) (not in 000's) | | | 140,844 | | |
Net Asset Value, Offering and Redemption Price Per Share | | $ | 12.27 | | |
CLASS IS: | |
Net Assets | | $ | 12 | | |
| Shares Outstanding $0.001 par value shares of beneficial interest (unlimited shares authorized) (not in 000's) | | | 1,000 | | |
Net Asset Value, Offering and Redemption Price Per Share | | $ | 12.42 | | |
@ Amount is less than $500.
The accompanying notes are an integral part of the financial statements.
7
Morgan Stanley Institutional Fund, Inc.
Annual Report — December 31, 2017
Global Concentrated Portfolio
Statement of Operations | | Year Ended
December 31, 2017
(000) | |
Investment Income: | |
Dividends from Securities of Unaffiliated Issuers (Net of $7 of Foreign Taxes Withheld) | | $ | 116 | | |
Dividends from Security of Affiliated Issuer (Note G) | | | 2 | | |
Total Investment Income | | | 118 | | |
Expenses: | |
Professional Fees | | | 142 | | |
Advisory Fees (Note B) | | | 78 | | |
Registration Fees | | | 36 | | |
Offering Costs | | | 22 | | |
Shareholder Services Fees — Class A (Note D) | | | 3 | | |
Distribution and Shareholder Services Fees — Class C (Note D) | | | 12 | | |
Shareholder Reporting Fees | | | 14 | | |
Administration Fees (Note C) | | | 8 | | |
Transfer Agency Fees — Class I (Note E) | | | 2 | | |
Transfer Agency Fees — Class A (Note E) | | | 2 | | |
Transfer Agency Fees — Class C (Note E) | | | 2 | | |
Transfer Agency Fees — Class IS (Note E) | | | 2 | | |
Custodian Fees (Note F) | | | 3 | | |
Sub Transfer Agency Fees — Class I | | | 1 | | |
Sub Transfer Agency Fees — Class A | | | 1 | | |
Sub Transfer Agency Fees — Class C | | | 1 | | |
Directors' Fees and Expenses | | | 2 | | |
Other Expenses | | | 15 | | |
Total Expenses | | | 346 | | |
Expenses Reimbursed by Adviser (Note B) | | | (144 | ) | |
Waiver of Advisory Fees (Note B) | | | (78 | ) | |
Reimbursement of Class Specific Expenses — Class A (Note B) | | | (1 | ) | |
Reimbursement of Class Specific Expenses — Class C (Note B) | | | (1 | ) | |
Reimbursement of Class Specific Expenses — Class IS (Note B) | | | (2 | ) | |
Rebate from Morgan Stanley Affiliate (Note G) | | | (— | @) | |
Net Expenses | | | 120 | | |
Net Investment Loss | | | (2 | ) | |
Realized Gain: | |
Investments Sold | | | 36 | | |
Change in Unrealized Appreciation (Depreciation): | |
Investments | | | 1,963 | | |
Net Realized Gain and Change in Unrealized Appreciation (Depreciation) | | | 1,999 | | |
Net Increase in Net Assets Resulting from Operations | | $ | 1,997 | | |
@ Amount is less than $500.
The accompanying notes are an integral part of the financial statements.
8
Morgan Stanley Institutional Fund, Inc.
Annual Report — December 31, 2017
Global Concentrated Portfolio
Statements of Changes in Net Assets | | Year Ended
December 31, 2017
(000) | | Period from
May 27, 2016^ to
December 31, 2016
(000) | |
Increase (Decrease) in Net Assets: | |
Operations: | |
Net Investment Loss | | $ | (2 | ) | | $ | 17 | | |
Net Realized Gain (Loss) | | | 36 | | | | (185 | ) | |
Net Change in Unrealized Appreciation (Depreciation) | | | 1,963 | | | | 272 | | |
Net Increase in Net Assets Resulting from Operations | | | 1,997 | | | | 104 | | |
Distributions from and/or in Excess of: | |
Class I: | |
Net Investment Income | | | (18 | ) | | | (43 | ) | |
Paid-in-Capital | | | (9 | ) | | | — | | |
Class A: | |
Net Investment Income | | | (2 | ) | | | (4 | ) | |
Class C: | |
Net Investment Income | | | (3 | ) | | | (2 | ) | |
Class IS: | |
Net Investment Income | | | (— | @) | | | (— | @) | |
Paid-in-Capital | | | (— | @) | | | — | | |
Total Distributions | | | (32 | ) | | | (49 | ) | |
Capital Share Transactions:(1) | |
Class I: | |
Subscribed | | | 4,032 | | | | 8,440 | | |
Distributions Reinvested | | | 9 | | | | 11 | | |
Redeemed | | | (686 | ) | | | (1,574 | ) | |
Class A: | |
Subscribed | | | 891 | | | | 789 | | |
Distributions Reinvested | | | 2 | | | | 4 | | |
Redeemed | | | (216 | ) | | | (12 | ) | |
Class C: | |
Subscribed | | | 970 | | | | 870 | | |
Distributions Reinvested | | | 3 | | | | 2 | | |
Redeemed | | | (341 | ) | | | (4 | ) | |
Class IS: | |
Subscribed | | | — | | | | 10 | | |
Net Increase in Net Assets Resulting from Capital Share Transactions | | | 4,664 | | | | 8,536 | | |
Total Increase in Net Assets | | | 6,629 | | | | 8,591 | | |
Net Assets: | |
Beginning of Period | | | 8,591 | | | | — | | |
End of Period (Including Distributions in Excess of Net Investment Income of $(51) and $(32)) | | $ | 15,220 | | | $ | 8,591 | | |
(1) Capital Share Transactions: | |
Class I: | |
Shares Subscribed | | | 331 | | | | 837 | | |
Shares Issued on Distributions Reinvested | | | 1 | | | | 1 | | |
Shares Redeemed | | | (62 | ) | | | (157 | ) | |
Net Increase in Class I Shares Outstanding | | | 270 | | | | 681 | | |
Class A: | |
Shares Subscribed | | | 77 | | | | 78 | | |
Shares Issued on Distributions Reinvested | | | — | @@ | | | — | @@ | |
Shares Redeemed | | | (19 | ) | | | (1 | ) | |
Net Increase in Class A Shares Outstanding | | | 58 | | | | 77 | | |
Class C: | |
Shares Subscribed | | | 83 | | | | 86 | | |
Shares Issued on Distributions Reinvested | | | — | @@ | | | — | @@ | |
Shares Redeemed | | | (29 | ) | | | (— | @@) | |
Net Increase in Class C Shares Outstanding | | | 54 | | | | 86 | | |
Class IS: | |
Shares Subscribed | | | — | | | | 1 | | |
^ Commencement of Operations.
@ Amount is less than $500.
@@ Amount is less than 500 shares.
The accompanying notes are an integral part of the financial statements.
9
Morgan Stanley Institutional Fund, Inc.
Annual Report — December 31, 2017
Financial Highlights
Global Concentrated Portfolio
| | | Class I | |
Selected Per Share Data and Ratios | | Year Ended
December 31, 2017 | | Period from
May 27, 2016(1) to
December 31, 2016 | |
Net Asset Value, Beginning of Period | | $ | 10.16 | | | $ | 10.00 | | |
Income from Investment Operations: | |
Net Investment Income(2) | | | 0.02 | | | | 0.03 | | |
Net Realized and Unrealized Gain | | | 2.28 | | | | 0.19 | | |
Total from Investment Operations | | | 2.30 | | | | 0.22 | | |
Distributions from and/or in Excess of: | |
Net Investment Income | | | (0.03 | ) | | | (0.06 | ) | |
Paid-in-Capital | | | (0.01 | ) | | | — | | |
Total Distributions | | | (0.04 | ) | | | (0.06 | ) | |
Net Asset Value, End of Period | | $ | 12.42 | | | $ | 10.16 | | |
Total Return(3) | | | 22.64 | % | | | 2.24 | %(6) | |
Ratios and Supplemental Data: | |
Net Assets, End of Period (Thousands) | | $ | 11,814 | | | $ | 6,922 | | |
Ratio of Expenses to Average Net Assets(8) | | | 0.98 | %(4) | | | 0.97 | %(4)(7) | |
Ratio of Net Investment Income to Average Net Assets(8) | | | 0.15 | %(4) | | | 0.48 | %(4)(7) | |
Ratio of Rebate from Morgan Stanley Affiliates to Average Net Assets | | | 0.00 | %(5) | | | 0.00 | %(5)(7) | |
Portfolio Turnover Rate | | | 68 | % | | | 44 | %(6) | |
(8) Supplemental Information on the Ratios to Average Net Assets: | |
Ratios Before Expense Limitation: | |
Expenses to Average Net Assets | | | 3.13 | % | | | 3.57 | %(7) | |
Net Investment Loss to Average Net Assets | | | (2.00 | )% | | | (2.12 | )%(7) | |
(1) Commencement of Operations.
(2) Per share amount is based on average shares outstanding.
(3) Calculated based on the net asset value as of the last business day of the period.
(4) The Ratios of Expenses and Net Investment Income reflect the rebate of certain Fund expenses in connection with the investments in Morgan Stanley affiliates during the period. The effect of the rebate on the ratios is disclosed in the above table as "Ratio of Rebate from Morgan Stanley Affiliates to Average Net Assets."
(5) Amount is less than 0.005%.
(6) Not annualized.
(7) Annualized.
The accompanying notes are an integral part of the financial statements.
10
Morgan Stanley Institutional Fund, Inc.
Annual Report — December 31, 2017
Financial Highlights
Global Concentrated Portfolio
| | | Class A | |
Selected Per Share Data and Ratios | | Year Ended
December 31, 2017 | | Period from
May 27, 2016(1) to
December 31, 2016 | |
Net Asset Value, Beginning of Period | | $ | 10.15 | | | $ | 10.00 | | |
Income (Loss) from Investment Operations: | |
Net Investment Income (Loss)(2) | | | (0.03 | ) | | | 0.01 | | |
Net Realized and Unrealized Gain | | | 2.28 | | | | 0.19 | | |
Total from Investment Operations | | | 2.25 | | | | 0.20 | | |
Distributions from and/or in Excess of: | |
Net Investment Income | | | (0.03 | ) | | | (0.05 | ) | |
Net Asset Value, End of Period | | $ | 12.37 | | | $ | 10.15 | | |
Total Return(3) | | | 22.17 | % | | | 2.02 | %(6) | |
Ratios and Supplemental Data: | |
Net Assets, End of Period (Thousands) | | $ | 1,666 | | | $ | 782 | | |
Ratio of Expenses to Average Net Assets(8) | | | 1.35 | %(4) | | | 1.35 | %(4)(7) | |
Ratio of Net Investment Income (Loss) to Average Net Assets(8) | | | (0.25 | )%(4) | | | 0.16 | %(4)(7) | |
Ratio of Rebate from Morgan Stanley Affiliates to Average Net Assets | | | 0.00 | %(5) | | | 0.00 | %(5)(7) | |
Portfolio Turnover Rate | | | 68 | % | | | 44 | %(6) | |
(8) Supplemental Information on the Ratios to Average Net Assets: | |
Ratios Before Expense Limitation: | |
Expenses to Average Net Assets | | | 3.61 | % | | | 4.23 | %(7) | |
Net Investment Loss to Average Net Assets | | | (2.51 | )% | | | (2.72 | )%(7) | |
(1) Commencement of Operations.
(2) Per share amount is based on average shares outstanding.
(3) Calculated based on the net asset value which does not reflect sales charges, if applicable, as of the last business day of the period.
(4) The Ratios of Expenses and Net Investment Income (Loss) reflect the rebate of certain Fund expenses in connection with the investments in Morgan Stanley affiliates during the period. The effect of the rebate on the ratios is disclosed in the above table as "Ratio of Rebate from Morgan Stanley Affiliates to Average Net Assets."
(5) Amount is less than 0.005%.
(6) Not annualized.
(7) Annualized.
The accompanying notes are an integral part of the financial statements.
11
Morgan Stanley Institutional Fund, Inc.
Annual Report — December 31, 2017
Financial Highlights
Global Concentrated Portfolio
| | | Class C | |
Selected Per Share Data and Ratios | | Year Ended
December 31, 2017 | | Period from
May 27, 2016(1) to
December 31, 2016 | |
Net Asset Value, Beginning of Period | | $ | 10.15 | | | $ | 10.00 | | |
Income (Loss) from Investment Operations: | |
Net Investment Loss(2) | | | (0.11 | ) | | | (0.04 | ) | |
Net Realized and Unrealized Gain | | | 2.26 | | | | 0.21 | | |
Total from Investment Operations | | | 2.15 | | | | 0.17 | | |
Distributions from and/or in Excess of: | |
Net Investment Income | | | (0.03 | ) | | | (0.02 | ) | |
Net Asset Value, End of Period | | $ | 12.27 | | | $ | 10.15 | | |
Total Return(3) | | | 21.18 | % | | | 1.69 | %(6) | |
Ratios and Supplemental Data: | |
Net Assets, End of Period (Thousands) | | $ | 1,728 | | | $ | 877 | | |
Ratio of Expenses to Average Net Assets(8) | | | 2.10 | %(4) | | | 2.10 | %(4)(7) | |
Ratio of Net Investment Loss to Average Net Assets(8) | | | (0.95 | )%(4) | | | (0.69 | )%(4)(7) | |
Ratio of Rebate from Morgan Stanley Affiliates to Average Net Assets | | | 0.00 | %(5) | | | 0.00 | %(5)(7) | |
Portfolio Turnover Rate | | | 68 | % | | | 44 | %(6) | |
(8) Supplemental Information on the Ratios to Average Net Assets: | |
Ratios Before Expense Limitation: | |
Expenses to Average Net Assets | | | 4.36 | % | | | 4.81 | %(7) | |
Net Investment Loss to Average Net Assets | | | (3.21 | )% | | | (3.40 | )%(7) | |
(1) Commencement of Operations.
(2) Per share amount is based on average shares outstanding.
(3) Calculated based on the net asset value which does not reflect sales charges, if applicable, as of the last business day of the period.
(4) The Ratios of Expenses and Net Investment Loss reflect the rebate of certain Fund expenses in connection with the investments in Morgan Stanley affiliates during the period. The effect of the rebate on the ratios is disclosed in the above table as "Ratio of Rebate from Morgan Stanley Affiliates to Average Net Assets."
(5) Amount is less than 0.005%.
(6) Not annualized.
(7) Annualized.
The accompanying notes are an integral part of the financial statements.
12
Morgan Stanley Institutional Fund, Inc.
Annual Report — December 31, 2017
Financial Highlights
Global Concentrated Portfolio
| | | Class IS | |
Selected Per Share Data and Ratios | | Year Ended
December 31, 2017 | | Period from
May 27, 2016(1) to
December 31, 2016 | |
Net Asset Value, Beginning of Period | | $ | 10.16 | | | $ | 10.00 | | |
Income from Investment Operations: | |
Net Investment Income(2) | | | 0.02 | | | | 0.03 | | |
Net Realized and Unrealized Gain | | | 2.28 | | | | 0.20 | | |
Total from Investment Operations | | | 2.30 | | | | 0.23 | | |
Distributions from and/or in Excess of: | |
Net Investment Income | | | (0.03 | ) | | | (0.07 | ) | |
Paid-in-Capital | | | (0.01 | ) | | | — | | |
Total Distributions | | | (0.04 | ) | | | (0.07 | ) | |
Net Asset Value, End of Period | | $ | 12.42 | | | $ | 10.16 | | |
Total Return(3) | | | 22.67 | % | | | 2.25 | %(6) | |
Ratios and Supplemental Data: | |
Net Assets, End of Period (Thousands) | | $ | 12 | | | $ | 10 | | |
Ratio of Expenses to Average Net Assets(8) | | | 0.95 | %(4) | | | 0.95 | %(4)(7) | |
Ratio of Net Investment Income to Average Net Assets(8) | | | 0.22 | %(4) | | | 0.56 | %(4)(7) | |
Ratio of Rebate from Morgan Stanley Affiliates to Average Net Assets | | | 0.00 | %(5) | | | 0.00 | %(5)(7) | |
Portfolio Turnover Rate | | | 68 | % | | | 44 | %(6) | |
(8) Supplemental Information on the Ratios to Average Net Assets: | |
Ratios Before Expense Limitation: | |
Expenses to Average Net Assets | | | 18.61 | % | | | 19.43 | %(7) | |
Net Investment Loss to Average Net Assets | | | (17.44 | )% | | | (17.92 | )%(7) | |
(1) Commencement of Operations.
(2) Per share amount is based on average shares outstanding.
(3) Calculated based on the net asset value as of the last business day of the period.
(4) The Ratios of Expenses and Net Investment Income reflect the rebate of certain Fund expenses in connection with the investments in Morgan Stanley affiliates during the period. The effect of the rebate on the ratios is disclosed in the above table as "Ratio of Rebate from Morgan Stanley Affiliates to Average Net Assets."
(5) Amount is less than 0.005%.
(6) Not annualized.
(7) Annualized.
The accompanying notes are an integral part of the financial statements.
13
Morgan Stanley Institutional Fund, Inc.
Annual Report — December 31, 2017
Notes to Financial Statements
Morgan Stanley Institutional Fund, Inc. (the "Company") is registered under the Investment Company Act of 1940, as amended (the "Act"), as an open-end management investment company. The Company is comprised of twenty-nine separate, active, diversified and non-diversified funds (individually referred to as a "Fund", collectively as the "Funds"). The Company applies investment company accounting and reporting guidance.
The accompanying financial statements relate to the Global Concentrated Portfolio. The Fund seeks long-term capital appreciation.
The Fund offers four classes of shares — Class I, Class A, Class C and Class IS.
A. Significant Accounting Policies: The following significant accounting policies are in conformity with U.S. generally accepted accounting principles ("GAAP"). Such policies are consistently followed by the Company in the preparation of its financial statements. GAAP may require management to make estimates and assumptions that affect the reported amounts and disclosures in the financial statements. Actual results may differ from those estimates.
1. Security Valuation: (1) An equity portfolio security listed or traded on an exchange is valued at its latest reported sales price (or at the exchange official closing price if such exchange reports an official closing price), and if there were no sales on a given day and if there is no official exchange closing price for that day, the security is valued at the mean between the last reported bid and asked prices if such bid and asked prices are available on the relevant exchanges. Listed equity securities not traded on the valuation date with no reported bid and asked prices available on the exchange are valued at the mean between the current bid and asked prices obtained from one or more reputable brokers or dealers. In cases where a security is traded on more than one exchange, the security is valued on the exchange designated as the primary market; (2) all other equity portfolio securities for which over-the-counter ("OTC") market quotations are readily available are valued at the latest reported sales price (or at the market official closing price if such market reports an official closing price), and if there was no trading in the security on a given day and if there is no official closing price from relevant markets for that day, the security is valued at the mean between the last reported bid and asked prices if such bid and asked prices are available on
the relevant markets. An unlisted equity security that does not trade on the valuation date and for which bid and asked prices from the relevant markets are unavailable is valued at the mean between the current bid and asked prices obtained from one or more reputable brokers or dealers; (3) certain portfolio securities may be valued by an outside pricing service/vendor approved by the Company's Board of Directors (the "Directors"). The pricing service/vendor may employ a pricing model that takes into account, among other things, bids, yield spreads, and/or other market data and specific security characteristics. Alternatively, if a valuation is not available from an outside pricing service/vendor, and the security trades on an exchange, the security may be valued at its latest reported sale price (or at the exchange official closing price if such exchange reports an official closing price), prior to the time when assets are valued. If there are no sales on a given day and if there is no official exchange closing price for that day, the security is valued at the mean between the last reported bid and asked prices if such bid and asked prices are available in the relevant exchanges; (4) when market quotations are not readily available, including circumstances under which Morgan Stanley Investment Management Inc. (the "Adviser") determines that the closing price, last sale price or the mean between the last reported bid and asked prices are not reflective of a security's market value, portfolio securities are valued at their fair value as determined in good faith under procedures established by and under the general supervision of the Directors. Occasionally, developments affecting the closing prices of securities and other assets may occur between the times at which valuations of such securities are determined (that is, close of the foreign market on which the securities trade) and the close of business of the New York Stock Exchange ("NYSE"). If developments occur during such periods that are expected to materially affect the value of such securities, such valuations may be adjusted to reflect the estimated fair value of such securities as of the close of the NYSE, as determined in good faith by the Directors or by the Adviser using a pricing service and/or procedures approved by the Directors; and (5) investments in mutual funds, including the Morgan Stanley Institutional Liquidity Funds, are valued at the net asset value ("NAV") as of the close of each business day.
The Directors have responsibility for determining in good faith the fair value of the investments, and the
14
Morgan Stanley Institutional Fund, Inc.
Annual Report — December 31, 2017
Notes to Financial Statements (cont'd)
Directors may appoint others, such as the Company's Adviser or a valuation committee, to assist the Directors in determining fair value and to make the actual calculations pursuant to the fair valuation methodologies previously approved by the Directors. Under procedures approved by the Directors, the Company's Adviser has formed a Valuation Committee whose members are approved by the Directors. The Valuation Committee provides administration and oversight of the Company's valuation policies and procedures, which are reviewed at least annually by the Directors. These procedures allow the Company to utilize independent pricing services, quotations from securities and financial instrument dealers, and other market sources to determine fair value.
The Company has procedures to determine the fair value of securities and other financial instruments for which market prices are not readily available. Under these procedures, the Valuation Committee convenes on a regular and ad hoc basis to review such securities and considers a number of factors, including valuation methodologies and significant unobservable valuation inputs, when arriving at fair value. The Valuation Committee may employ a market-based approach which may use related or comparable assets or liabilities, recent transactions, market multiples, book values, and other relevant information for the investment to determine the fair value of the investment. An income-based valuation approach may also be used in which the anticipated future cash flows of the investment are discounted to calculate fair value. Discounts may also be applied due to the nature or duration of any restrictions on the disposition of the investments. Due to the inherent uncertainty of valuations of such investments, the fair values may differ significantly from the values that would have been used had an active market existed. The Valuation Committee employs various methods for calibrating these valuation approaches including a regular review of valuation methodologies, key inputs and assumptions, transactional back-testing or disposition analysis, and reviews of any related market activity.
2. Fair Value Measurement: Financial Accounting Standards Board ("FASB") Accounting Standards CodificationTM ("ASC") 820, "Fair Value Measurement" ("ASC 820"), defines fair value as the value that the Fund
would receive to sell an investment or pay to transfer a liability in a timely transaction with an independent buyer in the principal market, or in the absence of a principal market, the most advantageous market for the investment or liability. ASC 820 establishes a three-tier hierarchy to distinguish between (1) inputs that reflect the assumptions market participants would use in valuing an asset or liability developed based on market data obtained from sources independent of the reporting entity (observable inputs) and (2) inputs that reflect the reporting entity's own assumptions about the assumptions market participants would use in valuing an asset or liability developed based on the best information available in the circumstances (unobservable inputs) and to establish classification of fair value measurements for disclosure purposes. Various inputs are used in determining the value of the Fund's investments. The inputs are summarized in the three broad levels listed below.
• Level 1 – unadjusted quoted prices in active markets for identical investments
• Level 2 – other significant observable inputs (including quoted prices for similar investments, interest rates, prepayment speeds, credit risk, etc.)
• Level 3 – significant unobservable inputs including the Fund's own assumptions in determining the fair value of investments. Factors considered in making this determination may include, but are not limited to, information obtained by contacting the issuer, analysts, or the appropriate stock exchange (for exchange-traded securities), analysis of the issuer's financial statements or other available documents and, if necessary, available information concerning other securities in similar circumstances
The inputs or methodology used for valuing securities are not necessarily an indication of the risk associated with investing in those securities and the determination of the significance of a particular input to the fair value measurement in its entirety requires judgment and considers factors specific to each security.
15
Morgan Stanley Institutional Fund, Inc.
Annual Report — December 31, 2017
Notes to Financial Statements (cont'd)
The following is a summary of the inputs used to value the Fund's investments as of December 31, 2017.
Investment Type | | Level 1
Unadjusted
quoted
prices
(000) | | Level 2
Other
significant
observable
inputs
(000) | | Level 3
Significant
unobservable
inputs
(000) | | Total
(000) | |
Assets: | |
Common Stocks | |
Airlines | | $ | 915 | | | $ | — | | | $ | — | | | $ | 915 | | |
Banks | | | 1,471 | | | | — | | | | — | | | | 1,471 | | |
Beverages | | | 745 | | | | — | | | | — | | | | 745 | | |
Capital Markets | | | 1,641 | | | | — | | | | — | | | | 1,641 | | |
Diversified Consumer
Services | | | 756 | | | | — | | | | — | | | | 756 | | |
Diversified Telecommunication
Services | | | 595 | | | | — | | | | — | | | | 595 | | |
Electrical Equipment | | | 815 | | | | — | | | | — | | | | 815 | | |
Energy Equipment & Services | | | 669 | | | | — | | | | — | | | | 669 | | |
Information Technology
Services | | | 995 | | | | — | | | | — | | | | 995 | | |
Internet Software & Services | | | 1,899 | | | | — | | | | — | | | | 1,899 | | |
Machinery | | | 791 | | | | — | | | | — | | | | 791 | | |
Media | | | 718 | | | | — | | | | — | | | | 718 | | |
Semiconductors &
Semiconductor Equipment | | | 1,232 | | | | — | | | | — | | | | 1,232 | | |
Software | | | 1,656 | | | | — | | | | — | | | | 1,656 | | |
Total Common Stocks | | | 14,898 | | | | — | | | | — | | | | 14,898 | | |
Short-Term Investment | |
Investment Company | | | 426 | | | | — | | | | — | | | | 426 | | |
Total Assets | | $ | 15,324 | | | $ | — | | | $ | — | | | $ | 15,324 | | |
Transfers between investment levels may occur as the markets fluctuate and/or the availability of data used in an investment's valuation changes. The Fund recognizes transfers between the levels as of the end of the period. As of December 31, 2017, the Fund did not have any investments transfer between investment levels.
3. Indemnifications: The Company enters into contracts that contain a variety of indemnifications. The Company's maximum exposure under these arrangements is unknown. However, the Company has not had prior claims or losses pursuant to these contracts and expects the risk of loss to be remote.
4. Dividends and Distributions to Shareholders: Dividends and distributions to shareholders are recorded on the ex-dividend date. Dividends from net investment income, if any, are declared and paid annually. Net realized capital gains, if any, are distributed at least annually.
5. Security Transactions, Income and Expenses: Security transactions are accounted for on the trade date (date the order to buy or sell is executed). Realized gains and losses on the sale of investment securities are
determined on the specific identified cost method. Dividend income and other distributions are recorded on the ex-dividend date (except for certain foreign dividends which may be recorded as soon as the Fund is informed of such dividends) net of applicable withholding taxes. Interest income is recognized on the accrual basis except where collection is in doubt. Discounts are accreted and premiums are amortized over the life of the respective securities. Most expenses of the Company can be directly attributed to a particular Fund. Expenses which cannot be directly attributed are apportioned among the Funds based upon relative net assets or other appropriate methods. Income, expenses (other than class specific expenses — distribution and shareholder services, transfer agency and sub transfer agency fees) and realized and unrealized gains or losses are allocated to each class of shares based upon their relative net assets.
B. Advisory Fees: The Adviser, a wholly-owned subsidiary of Morgan Stanley, provides the Fund with advisory services under the terms of an Investment Advisory Agreement, paid quarterly, at the annual rate based on the daily net assets as follows:
First $750
million | | Next $750
million | | Over $1.5
billion | |
| | 0.75 | % | | | 0.70 | % | | | 0.65 | % | |
For the year ended December 31, 2017, the advisory fee rate (net of waiver/rebate) was equivalent to an annual effective rate of 0.00% of the Fund's average daily net assets.
The Adviser has agreed to reduce its advisory fee and/or reimburse the Fund so that total annual portfolio operating expenses, excluding certain investment related expenses, taxes, interest and other extraordinary expenses (including litigation), will not exceed 1.00% for Class I shares, 1.35% for Class A shares, 2.10% for Class C shares and 0.95% for Class IS shares. The fee waivers and/or expense reimbursements will continue for at least one year from the date of the Fund's prospectus or until such time as the Directors act to discontinue all or a portion of such waivers and/or reimbursements when they deem such action is appropriate. For the year ended December 31, 2017, approximately $78,000 of advisory fees were waived and approximately $148,000 of other expenses were reimbursed by the Adviser pursuant to this arrangement.
C. Administration Fees: The Adviser also serves as Administrator to the Company and provides administrative services pursuant to an Administration Agreement for an annual fee,
16
Morgan Stanley Institutional Fund, Inc.
Annual Report — December 31, 2017
Notes to Financial Statements (cont'd)
accrued daily and paid monthly, of 0.08% of the Fund's average daily net assets.
Under a Sub-Administration Agreement between the Administrator and State Street Bank and Trust Company ("State Street"), State Street provides certain administrative services to the Company. For such services, the Administrator pays State Street a portion of the fee the Administrator receives from the Fund.
D. Distribution and Shareholder Services Fees: Morgan Stanley Distribution, Inc. ("MSDI" or the "Distributor"), a wholly-owned subsidiary of the Adviser and an indirect subsidiary of Morgan Stanley, serves as the Company's Distributor of Fund shares pursuant to a Distribution Agreement. The Company has adopted a Shareholder Services Plan with respect to Class A shares pursuant to Rule 12b-1 under the Act. Under the Shareholder Services Plan, the Fund pays the Distributor a shareholder services fee, accrued daily and paid monthly, at an annual rate of 0.25% of the Fund's average daily net assets attributable to Class A shares.
The Company has adopted a Distribution and Shareholder Services Plan with respect to Class C shares pursuant to Rule 12b-1 under the Act. Under the Distribution and Shareholder Services Plan, the Fund pays the Distributor a distribution fee, accrued daily and paid monthly, at an annual rate of 0.75% and a shareholder services fee, accrued daily and paid monthly, at an annual rate of 0.25% of the Fund's average daily net assets attributable to Class C shares.
The distribution and shareholder services fees are used to support the expenses associated with servicing and maintaining accounts. The Distributor may compensate other parties for providing shareholder support services to investors who purchase Class A and Class C shares.
E. Dividend Disbursing and Transfer Agent: The Company's dividend disbursing and transfer agent is Boston Financial Data Services, Inc. ("BFDS"). Pursuant to a Transfer Agency Agreement, the Company pays BFDS a fee based on the number of classes, accounts and transactions relating to the Funds of the Company. Effective January 1, 2018, BFDS changed its name to DST Asset Manager Solutions, Inc.
F. Custodian Fees: State Street (the "Custodian") also serves as Custodian for the Company in accordance with a Custodian Agreement. The Custodian holds cash, securities, and other assets of the Company as required by the Act. Custody fees are payable monthly based on assets held in custody, investment purchases and sales activity and account maintenance fees, plus reimbursement for certain out-of-pocket expenses.
G. Security Transactions and Transactions with Affiliates: For the year ended December 31, 2017, purchases and sales of investment securities for the Fund, other than long-term U.S. Government securities and short-term investments, were approximately $11,477,000 and $7,003,000, respectively. There were no purchases and sales of long-term U.S. Government securities for the year ended December 31, 2017.
The Fund invests in the Institutional Class of the Morgan Stanley Institutional Liquidity Funds — Treasury Securities Portfolio (the "Liquidity Funds"), an open-end management investment company managed by the Adviser. Advisory fees paid by the Fund are reduced by an amount equal to its pro-rata share of the advisory and administration fees paid by the Fund due to its investment in the Liquidity Funds. For the year ended December 31, 2017, advisory fees paid were reduced by less than $500 relating to the Fund's investment in the Liquidity Funds.
A summary of the Fund's transactions in shares of the Liquidity Funds during the year ended December 31, 2017 is as follows:
Affiliated
Investment
Company | | Value
December 31,
2016
(000) | | Purchases
at Cost
(000) | | Proceeds
from Sales
(000) | | Dividend
Income
(000) | |
Liquidity Funds | | $ | 107 | | | $ | 5,387 | | | $ | 5,068 | | | $ | 2 | | |
Affiliated
Investment
Company (cont'd) | | Realized
Gain (Loss)
(000) | | Change in
Unrealized
Appreciation
(Depreciation)
(000) | | Value
December 31,
2017
(000) | |
Liquidity Funds | | $ | — | | | $ | — | | | $ | 426 | | |
The Fund is permitted to purchase and sell securities ("cross-trade") from and to other Morgan Stanley Funds as well as other funds and client accounts for which the Adviser or an affiliate of the Adviser serves as investment adviser, pursuant to procedures approved by the Directors in compliance with Rule 17a-7 under the Act (the "Rule"). Each cross-trade is executed at the current market price in compliance with provisions of the Rule. For the year ended December 31, 2017, the Fund did not engage in any cross-trade transactions.
The Fund has an unfunded Deferred Compensation Plan (the "Compensation Plan"), which allows each independent Director to defer payment of all, or a portion, of the fees he or she receives for serving on the Board of Directors. Each eligible Director generally may elect to have the deferred amounts credited with a return equal to the total return on one or more of the Morgan Stanley funds that are offered as investment options under the Compensation Plan. Appreciation/depreciation and distributions received from these investments are recorded with
17
Morgan Stanley Institutional Fund, Inc.
Annual Report — December 31, 2017
Notes to Financial Statements (cont'd)
an offsetting increase/decrease in the deferred compensation obligation and do not affect the NAV of the Fund.
H. Federal Income Taxes: It is the Fund's intention to continue to qualify as a regulated investment company and distribute all of its taxable and tax-exempt income. Accordingly, no provision for federal income taxes is required in the financial statements.
The Fund may be subject to taxes imposed by countries in which it invests. Such taxes are generally based on income and/or capital gains earned or repatriated. Taxes are accrued based on net investment income, net realized gains and net unrealized appreciation as such income and/or gains are earned. Taxes may also be based on transactions in foreign currency and are accrued based on the value of investments denominated in such currency.
FASB ASC 740-10, "Income Taxes — Overall", sets forth a minimum threshold for financial statement recognition of the benefit of a tax position taken or expected to be taken in a tax return. Management has concluded there are no significant uncertain tax positions that would require recognition in the financial statements. If applicable, the Fund recognizes interest accrued related to unrecognized tax benefits in "Interest Expense" and penalties in "Other Expenses" in the Statement of Operations. The Fund files tax returns with the U.S. Internal Revenue Service, New York and various states. Generally, each of the tax years in the two-year period ended December 31, 2017, remains subject to examination by taxing authorities.
The tax character of distributions paid may differ from the character of distributions shown in the Statements of Changes in Net Assets due to short-term capital gains being treated as ordinary income for tax purposes. The tax character of distributions paid during fiscal years 2017 and 2016 was as follows:
2017
Distributions
Paid From: | | 2016
Distributions
Paid From: | |
Ordinary
Income
(000) | | Long-Term
Capital Gain
(000) | | Paid-in-
Capital
(000) | | Ordinary
Income
(000) | | Long-Term
Capital Gain
(000) | |
| $ | 23 | | | $ | — | | | $ | 9 | | | $ | 49 | | | $ | — | | |
The amount and character of income and gains to be distributed are determined in accordance with income tax regulations which may differ from GAAP. These book/tax differences are either considered temporary or permanent in nature.
Temporary differences are primarily due to differing book and tax treatments for the timing of the recognition of gains (losses) on certain investment transactions and the timing of the deductibility of certain expenses.
Permanent differences, primarily due to a net operating loss and a nondeductible expense, resulted in the following reclassifications among the components of net assets at December 31, 2017:
Distributions in
Excess of
Net Investment
Income
(000) | | Accumulated
Net Realized
Loss
(000) | | Paid-in-
Capital
(000) | |
| $ | 6 | | | $ | — | | | $ | (6 | ) | |
At December 31, 2017, the Fund had no distributable earnings on a tax basis.
At December 31, 2017, the Fund had available for federal income tax purposes unused short term capital losses of approximately $123,000 that do not have an expiration date.
To the extent that capital loss carryforwards are used to offset any future capital gains realized, no capital gains tax liability will be incurred by the Fund for gains realized and not distributed. To the extent that capital gains are offset, such gains will not be distributed to the shareholders.
I. Credit Facility: The Company and other Morgan Stanley funds participated in a $150,000,000 committed, unsecured revolving line of credit facility (the "Facility") with State Street. This Facility is to be used for temporary emergency purposes or funding of shareholder redemption requests. The interest rate on borrowings is based on the federal funds rate or 1 month LIBOR rate plus a spread. The Facility also has a commitment fee of 0.25% per annum based on the unused portion of the Facility. During the year ended December 31, 2017, the Fund did not have any borrowings under the Facility.
J. Other: At December 31, 2017, the Fund had record owners of 10% or greater. Investment activities of these shareholders could have a material impact on the Fund. The aggregate percentage of such owners was 50.1%.
18
Morgan Stanley Institutional Fund, Inc.
Annual Report — December 31, 2017
Report of Independent Registered Public Accounting Firm
To the Shareholders and Board of Directors of
Morgan Stanley Institutional Fund, Inc. —
Global Concentrated Portfolio
Opinion on the Financial Statements
We have audited the accompanying statement of assets and liabilities of Global Concentrated Portfolio (the "Fund") (one of the funds constituting the Morgan Stanley Institutional Fund, Inc. (the "Company")), including the portfolio of investments, as of December 31, 2017, and the related statement of operations for the year then ended, the statements of changes in net assets and the financial highlights for the year ended December 31, 2017 and the period from May 27, 2016 (commencement of operations) through December 31, 2016 and the related notes (collectively referred to as the "financial statements"). In our opinion, the financial statements present fairly, in all material respects, the financial position of Global Concentrated Portfolio (one of the funds constituting Morgan Stanley Institutional Fund, Inc.) at December 31, 2017, the results of its operations for the year then ended, the changes in its net assets and its financial highlights for the year then ended and the period from May 27, 2016 (commencement of operations) through December 31, 2016, in conformity with U.S. generally accepted accounting principles.
Basis for Opinion
These financial statements are the responsibility of the Company's management. Our responsibility is to express an opinion on the Fund's financial statements based on our audits. We are a public accounting firm registered with the Public Company Accounting Oversight Board (United States) ("PCAOB") and are required to be independent with respect to the Company in accordance with the U.S. federal securities law and the applicable rules and regulations of the Securities and Exchange Commission and the PCAOB.
We conducted our audits in accordance with the standards of the PCAOB. Those standards require that we plan and perform the audit to obtain reasonable assurance about whether the financial statements are free of material misstatement, whether due to error or fraud. The Company is not required to have, nor were we engaged to perform, an audit of the Company's internal control over financial reporting. As part of our audits, we are required to obtain an understanding of internal control over financial reporting, but not for the purpose of expressing an opinion on the effectiveness of the Company's internal control over financial reporting. Accordingly, we express no such opinion.
Our audits included performing procedures to assess the risks of material misstatement of the financial statements, whether due to error or fraud, and performing procedures that respond to those risks. Such procedures included examining, on a test basis, evidence regarding the amounts and disclosures in the financial statements. Our procedures included confirmation of securities owned as of December 31, 2017 by correspondence with the custodian and others or by other appropriate auditing procedures where replies from others were not received. Our audits also included evaluating the accounting principles used and significant estimates made by management, as well as evaluating the overall presentation of the financial statements. We believe that our audits provide a reasonable basis for our opinion.

We have served as the auditor of one or more Morgan Stanley investment companies since 2000.
Boston, Massachusetts
February 26, 2018
19
Morgan Stanley Institutional Fund, Inc.
Annual Report — December 31, 2017
Federal Tax Notice (unaudited)
For federal income tax purposes, the following information is furnished with respect to the distributions paid by the Fund during its taxable year ended December 31, 2017. For corporate shareholders 45.5% of the dividends qualified for the dividends received deduction.
For federal income tax purposes, the following information is furnished with respect to the Fund's earnings for its taxable year ended December 31, 2017. When distributed, certain earnings may be subject to a maximum tax rate of 15% as provided for by the Jobs and Growth Tax Relief Reconciliation Act of 2003. The Fund designated up to a maximum of approximately $36,000 as taxable at this lower rate.
In January, the Fund provides tax information to shareholders for the preceding calendar year.
20
Morgan Stanley Institutional Fund, Inc.
Annual Report — December 31, 2017
Privacy Notice (unaudited)
MORGAN STANLEY INVESTMENT MANAGEMENT INC.
AN IMPORTANT NOTICE CONCERNING OUR U.S. PRIVACY POLICY
We are required by federal law to provide you with a copy of our privacy policy annually. This policy applies to current and former individual investors in funds managed or sponsored by Morgan Stanley Investment Management Inc. ("MSIM") as well as current and former individual clients of MSIM. This policy is not applicable to partnerships, corporations, trusts or other non-individual clients or investors. Please note that we may amend this policy at any time, and will inform you of any changes as required by law.
WE RESPECT YOUR PRIVACY
We appreciate that you have provided us with your personal financial information. We strive to maintain the privacy of such information while we help you achieve your financial objectives. This Notice describes what non-public personal information we collect about you, why we collect it, when we may share it with others and how certain others may use it. It discusses the steps you may take to limit our sharing of certain information about you to affiliated companies in the Morgan Stanley family of companies ("other Morgan Stanley companies"). It also discloses how you may limit use of certain shared information for marketing purposes by other Morgan Stanley branded companies. Throughout this policy, we refer to the non-public information that personally identifies you or your accounts as "personal information."
1. WHAT PERSONAL INFORMATION DO WE COLLECT ABOUT YOU?
We obtain personal information from applications and other forms you submit to us, from your dealings with us, from consumer reporting agencies, from our Web sites and from third parties and other sources.
For example:
• We may collect information such as your name, address, e-mail address, telephone/fax numbers, assets, income and investment objectives through subscription documents, applications and other forms you submit to us.
• We may obtain information about account balances, your use of account(s) and the types of products and services you prefer to receive from us through your dealings and transactions with us and other sources.
• We may obtain information about your creditworthiness and credit history from consumer reporting agencies.
• We may collect background information from and through third-party vendors to verify representations you have made and to comply with various regulatory requirements.
• If you interact with us through our public and private Web sites, we may collect information that you provide directly through online communications (such as an e-mail address). We may also collect information about your Internet service provider, your domain name, your computer's operating system and Web browser, your use of our Web sites and your product and service preferences, through the use of "cookies." Please consult the Terms of Use of these sites for more details.
2. WHEN DO WE DISCLOSE PERSONAL INFORMATION WE COLLECT ABOUT YOU?
We may disclose personal information we collect about you to other Morgan Stanley companies and to non-affiliated third parties.
a. Information We Disclose to Other Morgan Stanley Companies.
We may disclose personal information to other Morgan Stanley companies for a variety of reasons, including to manage your account(s) effectively, to service and process your transactions, to let you know about products and services offered by us and other Morgan Stanley companies, to manage our business, and as otherwise required or permitted by law. Offers for products and services from other Morgan Stanley companies are developed under conditions designed to safeguard your personal information.
21
Morgan Stanley Institutional Fund, Inc.
Annual Report — December 31, 2017
Privacy Notice (unaudited) (cont'd)
b. Information We Disclose to Non-affiliated Third Parties.
We do not disclose personal information that we collect about you to non-affiliated third parties except to those who provide marketing services on our behalf, to financial institutions with whom we have joint marketing agreements, and as otherwise required or permitted by law. For example, we may disclose personal information to non-affiliated third parties for servicing and processing transactions, to offer our own products and services, to protect against fraud, for institutional risk control, to respond to judicial process or to perform services on our behalf. When we share personal information with a non-affiliated third party, they are required to limit their use of personal information to the particular purpose for which it was shared and they are not allowed to share personal information with others except to fulfill that limited purpose or as may be permitted or required by law.
3. HOW DO WE PROTECT THE SECURITY AND CONFIDENTIALITY OF PERSONAL INFORMATION WE COLLECT ABOUT YOU?
We maintain physical, electronic and procedural security measures to help safeguard the personal information we collect about you. We have internal policies governing the proper handling of client information. Third parties that provide support or marketing services on our behalf may also receive personal information, and we require them to adhere to confidentiality standards with respect to such information.
4. HOW CAN YOU LIMIT THE SHARING OF CERTAIN TYPES OF PERSONAL INFORMATION WITH OTHER MORGAN STANLEY COMPANIES?
We offer you choices as to whether we share with other Morgan Stanley companies the personal information that was collected to determine your eligibility for products and services you request ("eligibility information"). Eligibility information does not include your identification information or personal information pertaining to our transactions or experiences with you. Please note that, even if you direct us not to share eligibility information with other Morgan Stanley companies ("opt-out"), we may still share personal information, including eligibility information, with those companies in circumstances excluded from the opt-out under applicable law, such as to process transactions or to service your account.
5. HOW CAN YOU LIMIT THE USE OF CERTAIN TYPES OF PERSONAL INFORMATION BY OTHER MORGAN STANLEY COMPANIES FOR MARKETING?
By following the opt-out instructions in Section 6 below, you may limit other Morgan Stanley branded companies from marketing their products or services to you based on personal information we disclose to them. This information may include, for example, your income and account history with us. Please note that, even if you choose to limit Other Morgan Stanley Companies from using personal information about you that we may share with them for marketing their products and services to you, Other Morgan Stanley Companies may use your personal information that they obtain from us to market to you in circumstances permitted by law, such as if the Other Morgan Stanley Company has its own relationship with you.
6. HOW CAN YOU SEND US AN OPT-OUT INSTRUCTION?
If you wish to limit our sharing of eligibility information about you with other Morgan Stanley companies or other Morgan Stanley companies' use of personal information for marketing purposes, as described in this notice, you may do so by:
• Calling us at (800) 548-7786
Monday–Friday between 8a.m. and 6p.m.(EST)
• Writing to us at the following address:
DST Asset Manager Solutions, Inc.
c/o Privacy Coordinator
P.O. Box 219804
Kansas City, Missouri 64121
22
Morgan Stanley Institutional Fund, Inc.
Annual Report — December 31, 2017
Privacy Notice (unaudited) (cont'd)
Your written request should include your name, address, telephone number and account number(s) to which the opt-out applies and whether you are opting out with respect to sharing of eligibility information (Section 4 above), or if information used for Marketing (Section 5 above) or both. Written opt-out requests should not be sent with any other correspondence. In order to process your request, we require that the request be provided by you directly and not through a third party.
Your opt-out preference will remain in effect with respect to this policy (as it may be amended) until you notify us otherwise. If you have a joint account, your direction for us not to share this information with other Morgan Stanley companies and for those other Morgan Stanley companies not to use your personal information for marketing will be applied to all account holders on that account. Please understand that if you limit our sharing or our affiliated companies' use of personal information, you and any joint account holder(s) may not receive information about Morgan Stanley products and services, including products or services that could help you manage your financial resources and achieve your investment objectives.
7. WHAT IF AN AFFILIATED COMPANY BECOMES A NON-AFFILIATED THIRD PARTY?
If, at any time in the future, an affiliated company becomes a non-affiliated third party, further disclosures of personal information made to the former affiliated company will be limited to those described in Section 2(b) above relating to non-affiliated third parties. If you elected under Section 6 to limit disclosures we make to affiliated companies, or use of personal information by affiliated companies, your election will not apply to use by any former affiliated company of your personal information in their possession once it becomes a non-affiliated third party.
SPECIAL NOTICE TO RESIDENTS OF VERMONT
The following section supplements our policy with respect to our individual clients who have a Vermont address and supersedes anything to the contrary in the above policy with respect to those clients only.
The state of Vermont requires financial institutions to obtain your consent prior to sharing personal information that they collect about you with affiliated companies and non-affiliated third parties other than in certain limited circumstances. Except as permitted by law, we will not share personal information we collect about you with non-affiliated third parties or other Morgan Stanley companies unless you provide us with your written consent to share such information ("opt-in").
If you wish to receive offers for investment products and services offered by or through other Morgan Stanley companies, please notify us in writing at the following address:
DST Asset Manager Solutions, Inc.
c/o Privacy Coordinator
P.O. Box 219804
Kansas City, Missouri 64121
Your authorization should include your name, address, telephone number and account number(s) to which the opt-in applies and should not be sent with any other correspondence. In order to process your authorization, we require that the authorization be provided by you directly and not through a third party.
SPECIAL NOTICE TO RESIDENTS OF CALIFORNIA
The following section supplements our policy with respect to our individual clients who have a California address and supersedes anything to the contrary in the above policy with respect to those clients only.
In response to a California law, if your account has a California home address, your personal information will not be disclosed to non-affiliated third parties except as permitted by applicable California law, and we will limit sharing such information with our affiliates to comply with California privacy laws that apply to us.
23
Morgan Stanley Institutional Fund, Inc.
Annual Report — December 31, 2017
Director and Officer Information (unaudited)
Independent Directors:
Name, Age and Address of
Independent Director | | Position(s)
Held with
Registrant | | Length of Time
Served* | | Principal Occupation(s) During Past 5 Years
and Other Relevant Professional Experience | | Number of
Portfolios in
Fund Complex
Overseen by
Independent
Director** | | Other Directorships
Held by Independent
Director*** | |
Frank L. Bowman (73)
c/o Perkins Coie LLP
Counsel to the Independent
Directors
30 Rockefeller Plaza
New York, NY 10112 | | Director | | Since
August
2006 | | President, Strategic Decisions, LLC (consulting) (since February 2009); Director or Trustee of various Morgan Stanley Funds (since August 2006); Chairperson of the Compliance and Insurance Committee (since October 2015); formerly, Chairperson of the Insurance Sub-Committee of the Compliance and Insurance Committee (2007-2015); served as President and Chief Executive Officer of the Nuclear Energy Institute (policy organization) (February 2005-November 2008); retired as Admiral, U.S. Navy after serving over 38 years on active duty including 8 years as Director of the Naval Nuclear Propulsion Program in the Department of the Navy and the U.S. Department of Energy (1996-2004); served as Chief of Naval Personnel (July 1994-September 1996) and on the Joint Staff as Director of Political Military Affairs (June 1992-July 1994); knighted as Honorary Knight Commander of the Most Excellent Order of the British Empire; awarded the Officier de l'Orde National du Mérite by the French Government; elected to the National Academy of Engineering (2009). | | | 88 | | | Director of BP p.l.c.; Director of Naval and Nuclear Technologies LLP; Director Emeritus of the Armed Services YMCA; Director of the U.S. Naval Submarine League; Member of the National Security Advisory Council of the Center for U.S. Global Engagement and a member of the CNA Military Advisory Board; Trustee of Fairhaven United Methodist Church; and Director of other various non-profit organizations. | |
Kathleen A. Dennis (64)
c/o Perkins Coie LLP
Counsel to the Independent Directors
30 Rockefeller Plaza
New York, NY 10112 | | Director | | Since
August
2006 | | President, Cedarwood Associates (mutual fund and investment management consulting) (since July 2006); Chairperson of the Liquidity and Alternatives Sub-Committee of the Investment Committee (since October 2006) and Director or Trustee of various Morgan Stanley Funds (since August 2006); formerly, Senior Managing Director of Victory Capital Management (1993-2006). | | | 89 | | | Director of various non-profit organizations. | |
Nancy C. Everett (62)
c/o Perkins Coie LLP
Counsel to the Independent Directors
30 Rockefeller Plaza
New York, NY 10112 | | Director | | Since
January
2015 | | Chief Executive Officer, Virginia Commonwealth University Investment Company (since November 2015); Owner, OBIR, LLC (institutional investment management consulting) (since June 2014); formerly, Managing Director, BlackRock Inc. (February 2011-December 2013); and Chief Executive Officer, General Motors Asset Management (a/k/a Promark Global Advisors, Inc.) (June 2005-May 2010). | | | 90 | | | Formerly, Member of Virginia Commonwealth University School of Business Foundation (2005-2016); Member of Virginia Commonwealth University Board of Visitors (2013-2015); Member of Committee on Directors for Emerging Markets Growth Fund, Inc. (2007-2010); Chairperson of Performance Equity Management, LLC (2006-2010); and Chairperson, GMAM Absolute Return Strategies Fund, LLC (2006-2010). | |
24
Morgan Stanley Institutional Fund, Inc.
Annual Report — December 31, 2017
Director and Officer Information (unaudited) (cont'd)
Independent Directors: (cont'd)
Name, Age and Address of
Independent Director | | Position(s)
Held with
Registrant | | Length of Time
Served* | | Principal Occupation(s) During Past 5 Years
and Other Relevant Professional Experience | | Number of
Portfolios in
Fund Complex
Overseen by
Independent
Director** | | Other Directorships
Held by Independent
Director*** | |
Jakki L. Haussler (60)
c/o Perkins Coie LLP
Counsel to the Independent Directors
30 Rockefeller Plaza
New York, NY 10112 | | Director | | Since
January
2015 | | Chairman and Chief Executive Officer, Opus Capital Group (since January 1996); formerly, Director, Capvest Venture Fund, LP (May 2000-December 2011); Partner, Adena Ventures, LP (July 1999-December 2010); Director, The Victory Funds (February 2005-July 2008). | | | 90 | | | Director of Cincinnati Bell Inc. and Member, Audit Committee and Compensation Committee; Director of Northern Kentucky University Foundation and Member, Investment Committee; Member of Chase College of Law Transactional Law Practice Center Board of Advisors; Director of Best Transport; Director of Chase College of Law Board of Visitors; formerly, Member, University of Cincinnati Foundation Investment Committee; Member, Miami University Board of Visitors (2008-2011); Trustee of Victory Funds (2005-2008) and Chairman, Investment Committee (2007-2008) and Member, Service Provider Committee (2005-2008). | |
Dr. Manuel H. Johnson (68)
c/o Johnson Smick
International, Inc.
220 I Street, NE — Suite 200
Washington, D.C. 20002 | | Director | | Since
July
1991 | | Senior Partner, Johnson Smick International, Inc. (consulting firm); Chairperson of the Investment Committee (since October 2006) and Director or Trustee of various Morgan Stanley Funds (since July 1991); Co-Chairman and a founder of the Group of Seven Council (G7C) (international economic commission); formerly, Chairperson of the Audit Committee (July 1991-September 2006), Vice Chairman of the Board of Governors of the Federal Reserve System and Assistant Secretary of the U.S. Treasury. | | | 88 | | | Director of NVR, Inc. (home construction). | |
Joseph J. Kearns (75)
c/o Kearns & Associates LLC
46 E Peninsula Center #385
Rolling Hills Estates, CA
90274-3712 | | Director | | Since
August
1994 | | Senior Adviser, Kearns & Associates LLC (investment consulting); Chairperson of the Audit Committee (since October 2006) and Director or Trustee of various Morgan Stanley Funds (since August 1994); formerly, Deputy Chairperson of the Audit Committee (July 2003-September 2006) and Chairperson of the Audit Committee of various Morgan Stanley Funds (since August 1994); CFO of the J. Paul Getty Trust. | | | 89 | | | Prior to August 10, 2016, Director of Electro Rent Corporation (equipment leasing); Prior to December 31, 2013, Director of The Ford Family Foundation. | |
25
Morgan Stanley Institutional Fund, Inc.
Annual Report — December 31, 2017
Director and Officer Information (unaudited) (cont'd)
Independent Directors: (cont'd)
Name, Age and Address of
Independent Director | | Position(s)
Held with
Registrant | | Length of Time
Served* | | Principal Occupation(s) During Past 5 Years
and Other Relevant Professional Experience | | Number of
Portfolios in
Fund Complex
Overseen by
Independent
Director** | | Other Directorships
Held by Independent
Director*** | |
Michael F. Klein (59)
c/o Perkins Coie LLP
Counsel to the Independent Directors
30 Rockefeller Plaza
New York, NY 10112 | | Director | | Since
August
2006 | | Managing Director, Aetos Capital, LLC (since March 2000); Co-President, Aetos Alternatives Management, LLC (since January 2004) and Co-Chief Executive Officer of Aetos Capital LLC (since August 2013); Chairperson of the Fixed Income Sub-Committee of the Investment Committee (since October 2006) and Director or Trustee of various Morgan Stanley Funds (since August 2006); formerly, Managing Director, Morgan Stanley & Co. Inc. and Morgan Stanley Dean Witter Investment Management, President, various Morgan Stanley Funds (June 1998-March 2000) and Principal, Morgan Stanley & Co. Inc. and Morgan Stanley Dean Witter Investment Management (August 1997-December 1999). | | | 88 | | | Director of certain investment funds managed or sponsored by Aetos Capital, LLC; Director of Sanitized AG and Sanitized Marketing AG (specialty chemicals). | |
Patricia Maleski (57)
c/o Perkins Coie LLP
Counsel to the Independent Directors
30 Rockefeller Plaza
New York, NY 10112 | | Director | | Since
January
2017 | | Managing Director, JPMorgan Asset Management (2004-2016); Oversight and Control Head of Fiduciary and Conflicts of Interest Program (2015-2016); Chief Control Officer-Global Asset Management (2013-2015); President, JPMorgan Funds (2010-2013); Chief Administrative Officer (2004-2013); various other positions including Treasurer and Board Liaison (since 2001). | | | 90 | | | None. | |
Michael E. Nugent (81)
522 Fifth Avenue
New York, NY 10036 | | Chair of the Board and Director | | Chair of the Boards since July 2006 and Director since July 1991 | | Chair of the Boards of various Morgan Stanley Funds (since July 2006); Chairperson of the Closed-End Fund Committee (since June 2012) and Director or Trustee of various Morgan Stanley Funds (since July 1991); formerly, Chairperson of the Insurance Committee (until July 2006); General Partner, Triumph Capital, L.P. (private investment partnership) (1988-2013). | | | 88 | | | None. | |
W. Allen Reed (70)
c/o Perkins Coie LLP
Counsel to the Independent Directors
30 Rockefeller Plaza
New York, NY 10112 | | Director | | Since
August
2006 | | Chairperson of the Equity Sub-Committee of the Investment Committee (since October 2006) and Director or Trustee of various Morgan Stanley Funds (since August 2006); formerly, President and CEO of General Motors Asset Management; Chairman and Chief Executive Officer of the GM Trust Bank and Corporate Vice President of General Motors Corporation (August 1994-December 2005). | | | 89 | | | Director of Legg Mason, Inc.; formerly, Director of the Auburn University Foundation (2010-2015). | |
Fergus Reid (85)
c/o Joe Pietryka, Inc.
85 Charles Colman Blvd.
Pawling, NY 12564 | | Director | | Since
June
1992 | | Chairman, Joe Pietryka, Inc.; Chairperson of the Governance Committee and Director or Trustee of various Morgan Stanley Funds (since June 1992). | | | 89 | | | Formerly, Trustee and Director of certain investment companies in the JP Morgan Fund Complex managed by JP Morgan Investment Management Inc. (1987-2012). | |
* This is the earliest date the Director began serving the Morgan Stanley Funds. Each Director serves an indefinite term, until his or her successor is elected.
** The Fund Complex includes (as of December 31, 2017) all open-end and closed-end funds (including all of their portfolios) advised by Morgan Stanley Investment Management Inc. (the "Adviser") and any funds that have an adviser that is an affiliated person of the Adviser (including, but not limited to, Morgan Stanley AIP GP LP).
*** This includes any directorships at public companies and registered investment companies held by the Director at any time during the past five years.
26
Morgan Stanley Institutional Fund, Inc.
Annual Report — December 31, 2017
Director and Officer Information (unaudited) (cont'd)
Executive Officers:
Name, Age and Address of Executive Officer | | Position(s) Held
with
Registrant | | Length of Time
Served* | | Principal Occupation(s) During Past 5 Years | |
John H. Gernon (54)
522 Fifth Avenue
New York, NY 10036 | | President and Principal Executive Officer | | Since
September
2013 | | President and Principal Executive Officer of the Equity and Fixed Income Funds and the Morgan Stanley AIP Funds (since September 2013) and the Liquidity Funds and various money market funds (since May 2014) in the Fund Complex; Managing Director of the Adviser; Head of Product (since 2006). | |
Timothy J. Knierim (58)
522 Fifth Avenue
New York, NY 10036 | | Chief Compliance Officer | | Since
December
2016 | | Managing Director of the Adviser and various entities affiliated with the Adviser; Chief Compliance Officer of various Morgan Stanley Funds and the Adviser (since December 2016) and Chief Compliance Officer of Morgan Stanley AIP GP LP (since 2014). Formerly, Managing Director and Deputy Chief Compliance Officer of the Adviser (2014-2016); and formerly, Chief Compliance Officer of Prudential Investment Management, Inc. (2007-2014). | |
Francis J. Smith (52)
522 Fifth Avenue
New York, NY 10036 | | Treasurer and Principal Financial Officer | | Treasurer since July 2003 and Principal Financial Officer since September 2002 | | Managing Director of the Adviser and various entities affiliated with the Adviser; Treasurer (since July 2003) and Principal Financial Officer of various Morgan Stanley Funds (since September 2002). | |
Mary E. Mullin (50)
522 Fifth Avenue
New York, NY 10036 | | Secretary | | Since
June
1999 | | Managing Director of the Adviser; Secretary of various Morgan Stanley Funds (since June 1999). | |
Michael J. Key (38)
522 Fifth Avenue
New York, NY 10036 | | Vice President | | Since
June
2017 | | Vice President of the Equity and Fixed Income Funds, Liquidity Funds, various money market funds and the Morgan Stanley AIP Funds in the Fund Complex (since June 2017); Executive Director of the Adviser; Head of Product Development for Equity and Fixed Income Funds (since August 2013). | |
* This is the earliest date the officer began serving the Morgan Stanley Funds. Each officer serves a one-year term, until his or her successor is elected and qualifies.
27
Morgan Stanley Institutional Fund, Inc.
Annual Report — December 31, 2017
Adviser and Administrator
Morgan Stanley Investment Management Inc.
522 Fifth Avenue
New York, New York 10036
Distributor
Morgan Stanley Distribution, Inc.
522 Fifth Avenue
New York, New York 10036
Dividend Disbursing and Transfer Agent
DST Asset Manager Solutions, Inc.
2000 Crown Colony Drive
Quincy, Massachusetts 02169
Custodian
State Street Bank and Trust Company
One Lincoln Street
Boston, Massachusetts 02111
Legal Counsel
Dechert LLP
1095 Avenue of the Americas
New York, New York 10036
Counsel to the Independent Directors
Perkins Coie LLP
30 Rockefeller Plaza
New York, New York 10112
Independent Registered Public Accounting Firm
Ernst & Young LLP
200 Clarendon Street
Boston, Massachusetts 02116
Reporting to Shareholders
Each Morgan Stanley Fund provides a complete schedule of portfolio holdings in its semi-annual and annual reports within 60 days of the end of the fund's second and fourth fiscal quarters. The semi-annual and annual reports are filed electronically with the Securities and Exchange Commission (SEC) on Form N-CSRS and Form N-CSR, respectively. Morgan Stanley also delivers the semi-annual and annual reports to fund shareholders and makes these reports available on its public website, www.morganstanley.com/im. Each Morgan Stanley fund also files a complete schedule of portfolio holdings with the SEC for the fund's first and third fiscal quarters on Form N-Q. Morgan Stanley does not deliver the reports for the first and third fiscal quarters to shareholders, nor are the reports posted to the Morgan Stanley public website. You may, however, obtain the Form N-Q filings (as well as the Form N-CSR and N-CSRS filings) by accessing the SEC's website, www.sec.gov. You may also review and copy them at the SEC's Public Reference Room in Washington, DC. Information on the operation of the SEC's Public Reference Room may be obtained by calling the SEC toll free at 1 (800) SEC-0330. You can also request copies of these materials, upon payment of a duplicating fee, by electronic request at the SEC's email address (publicinfo@sec.gov) or by writing to the SEC's Public Reference Section, Washington, D.C. 20549-1520.
Proxy Voting Policies and Procedures and Proxy Voting Record
You may obtain a copy of the Company's Proxy Voting Policy and Procedures and information regarding how the Company voted proxies relating to portfolio securities during the most recent twelve-month period ended June 30, without charge, upon request, by calling toll free 1 (800) 548-7786 or by visiting our website at www.morganstanley.com/im. This information is also available on the SEC's website at www.sec.gov.
This report is authorized for distribution only when preceded or accompanied by a prospectus or summary prospectus of the applicable Fund of Morgan Stanley Institutional Fund, Inc., which describes in detail the Fund's investment policies, risks, fees and expenses. Please read the prospectus carefully before you invest or send money. For additional information, including information regarding the investments comprising the Fund, please visit our website at www.morganstanley.com/im or call toll free 1 (800) 548-7786.
28
Printed in U.S.A.
This Report has been prepared for shareholders and may be distributed to others only if preceded or accompanied by a current prospectus.
Morgan Stanley Investment Management Inc.
522 Fifth Avenue
New York, New York 10036
© 2018 Morgan Stanley. Morgan Stanley Distribution, Inc.

IFIGCNPANN
2007741 EXP. 02.28.19

Morgan Stanley Institutional Fund, Inc.
Global Core Portfolio
Annual Report
December 31, 2017

Morgan Stanley Institutional Fund, Inc.
Annual Report — December 31, 2017
Shareholders' Letter | | | 2 | | |
Expense Example | | | 3 | | |
Investment Overview | | | 4 | | |
Portfolio of Investments | | | 6 | | |
Statement of Assets and Liabilities | | | 7 | | |
Statement of Operations | | | 8 | | |
Statements of Changes in Net Assets | | | 9 | | |
Financial Highlights | | | 10 | | |
Notes to Financial Statements | | | 14 | | |
Report of Independent Registered Public Accounting Firm | | | 20 | | |
Federal Tax Notice | | | 21 | | |
Privacy Notice | | | 22 | | |
Director and Officer Information | | | 25 | | |
This report is authorized for distribution only when preceded or accompanied by a prospectus or summary prospectus of the applicable Fund of Morgan Stanley Institutional Fund, Inc. To receive a prospectus and/or statement of additional information (SAI), which contains more complete information such as investment objectives, charges, expenses, policies for voting proxies, risk considerations, and describes in detail each of the Fund's investment policies to the prospective investor, please call toll free 1 (800) 548-7786. Please read the prospectuses carefully before you invest or send money.
Additionally, you can access information about the Fund including performance, characteristics, and investment team commentary, through Morgan Stanley Investment Management's website: www.morganstanley.com/im.
Market forecasts provided in this report may not necessarily come to pass. There is no guarantee that any sectors mentioned will continue to perform as discussed herein or that securities in such sectors will be held by the Fund in the future. There is no assurance that a fund will achieve its investment objective. Funds are subject to market risk, which is the possibility that market values of securities owned by the Fund will decline and, therefore, the value of the Fund's shares may be less than what you paid for them. Accordingly, you can lose money investing in this Fund. Please see the prospectus for more complete information on investment risks.
1
Morgan Stanley Institutional Fund, Inc.
Annual Report — December 31, 2017
Shareholders' Letter (unaudited)
Dear Shareholders,
We are pleased to provide this Annual report, in which you will learn how your investment in Global Core Portfolio (the "Fund") performed during the latest twelve-month period.
Morgan Stanley Investment Management is a client-centric, investor-led organization. Our global presence, intellectual capital, and breadth of products and services enable us to partner with investors to meet the evolving challenges of today's financial markets. We aim to deliver superior investment service and to empower our clients to make the informed decisions that help them reach their investment goals.
As always, we thank you for selecting Morgan Stanley Investment Management, and look forward to working with you in the months and years ahead.
Sincerely,

John H. Gernon
President and Principal Executive Officer
January 2018
2
Morgan Stanley Institutional Fund, Inc.
Annual Report — December 31, 2017
Expense Example (unaudited)
Global Core Portfolio
As a shareholder of the Fund, you incur two types of costs: (1) transactional costs; and (2) ongoing costs, which may include advisory fees, administration fees, distribution and shareholder services fees and other Fund expenses. This example is intended to help you understand your ongoing costs (in dollars) of investing in the Fund and to compare these costs with the ongoing costs of investing in other mutual funds.
This example is based on an investment of $1,000 invested at the beginning of the six-month period ended December 31, 2017 and held for the entire six-month period.
Actual Expenses
The table below provides information about actual account values and actual expenses. You may use the information in this table, together with the amount you invested, to estimate the expenses that you paid over the period. Simply divide your account value by $1,000 (for example, an $8,600 account value divided by $1,000 = 8.6), then multiply the result by the number in the table under the heading entitled "Actual Expenses Paid During Period" to estimate the expenses you paid on your account during this period.
Hypothetical Example for Comparison Purposes
The table below provides information about hypothetical account values and hypothetical expenses based on the Fund's actual expense ratio and an assumed rate of return of 5% per year before expenses, which is not the Fund's actual return. The hypothetical account values and expenses may not be used to estimate the actual ending account balance or expenses you paid for the period. You may use this information to compare the ongoing costs of investing in the Fund and other funds. To do so, compare this 5% hypothetical example with the 5% hypothetical examples that appear in the shareholder reports of the other funds.
Please note that the expenses shown in the table are meant to highlight your ongoing costs only and do not reflect any transactional costs, such as sales charges (loads). Therefore, the information for each class in the table is useful in comparing ongoing costs only, and will not help you determine the relative total costs of owning different funds. In addition, if these transactional costs were included, your costs would have been higher.
| | | Beginning
Account
Value
7/1/17 | | Actual Ending
Account
Value
12/31/17 | | Hypothetical
Ending Account
Value | | Actual
Expenses
Paid
During
Period* | | Hypothetical
Expenses Paid
During Period* | | Net
Expense
Ratio
During
Period** | |
Global Core Portfolio Class I | | $ | 1,000.00 | | | $ | 1,102.80 | | | $ | 1,020.32 | | | $ | 5.14 | | | $ | 4.94 | | | | 0.97 | % | |
Global Core Portfolio Class A | | | 1,000.00 | | | | 1,100.60 | | | | 1,018.40 | | | | 7.15 | | | | 6.87 | | | | 1.35 | | |
Global Core Portfolio Class C | | | 1,000.00 | | | | 1,097.30 | | | | 1,014.62 | | | | 11.10 | | | | 10.66 | | | | 2.10 | | |
Global Core Portfolio Class IS | | | 1,000.00 | | | | 1,103.10 | | | | 1,020.42 | | | | 5.04 | | | | 4.84 | | | | 0.95 | | |
* Expenses are calculated using each Fund Class' annualized net expense ratio (as disclosed), multiplied by the average account value over the period, and multiplied by 184/365 (to reflect the most recent one-half year period).
** Annualized.
3
Morgan Stanley Institutional Fund, Inc.
Annual Report — December 31, 2017
Investment Overview (unaudited)
Global Core Portfolio
The Fund seeks long-term capital appreciation.
Performance
For the year ended December 31, 2017, the Fund's Class I shares had a total return based on net asset value and reinvestment of distributions per share of 22.27%, net of fees. The Fund's Class I shares underperformed the Fund's benchmark, the MSCI World Net Index (the "Index"), which returned 22.40%.
Please keep in mind that double-digit returns are highly unusual and cannot be sustained. Investors should also be aware that these returns were primarily achieved during favorable market conditions.
Factors Affecting Performance
• Following the 2016 U.S. presidential election campaign, the market re-focused on company earnings, beginning its 2017 ascent. 2017 also saw economic recovery accelerate in regions outside the U.S., namely Europe and Asia ex-Japan. The surprise for many in 2017 was the strength of the global equity markets.
• The greatest returns within the Index over the reporting period came from outside the U.S., particularly Asia ex-Japan and Europe, with Japan close behind. The information technology sector showed the strongest performance around the globe. The worst performers within the Index were U.S. stocks in the energy and relatively low volatility sectors such as telecommunication services, real estate, utilities and consumer staples.
• The Fund benefited during the period from its overweight regional allocation in Asia ex-Japan. An underweight to the European region detracted from performance. Also detracting from performance was the euro strengthening versus the U.S. dollar, particularly in the final days of 2017.
• For stock selection, the largest detractors for the period were two diversified oil services companies, a small position in a Mexican banking group, a British telecommunications holding company, and a multinational semiconductor and telecommunications equipment company that was negatively affected by its ongoing disputes with large clients.
• The Fund benefited the most from its overweight and stock selection in information technology. These positions included a U.S.-based multinational company specializing in consumer electronics, computer software and online services, and two stock positions in Asia ex-Japan, a leading provider of internet value-added services into China and a Taiwan-based global semiconductor manufacturer that sells its chips into major manufacturers of mobile devices and internet connectivity devices. A diversified financial services company was also a strong contributor to performance.
Management Strategies
• There have been no changes to our investment process during the period. Statistically, the majority of a portfolio's annual return can be explained by its common factor exposures (which we categorize as regional and style selection). The tilting of these exposures is highly correlated to alpha generation (that is, a portfolio's excess return over a benchmark). Therefore, the team begins with a quantitative process to identify the common factors we believe are likely to prevail in each region of the world going forward. The rest of a portfolio's annual returns is explained by its company-specific results, meaning that stock selection is also a key determinant to alpha generation. We employ a bottom-up fundamental stock selection process to capture idiosyncratic returns. The result is a highly active portfolio of fundamentally attractive stocks which we believe could benefit from what we have identified to be quantitative investment styles likely to outperform in each region.
• Entering 2018, the Fund is positioned with weightings in growth and value stocks and continues to be underweight low volatility, high dividend yielding sectors that remain expensive relative to their historic valuations. We believe that the financial sector in particular offers opportunities in an environment of rising interest rates following a decade of underperformance. As an offset, we remain overweight in technology. The Fund begins the year with higher weights in Europe and Japan than in 2017, as we are seeing indications that non-U.S. stocks could continue to do well and these parts of the world are more value-oriented. Additionally, we continue to have an overweight to
4
Morgan Stanley Institutional Fund, Inc.
Annual Report — December 31, 2017
Investment Overview (unaudited) (cont'd)
Global Core Portfolio
Asia ex-Japan, where we see selective opportunities offering inexpensive valuations. Non-U.S. markets have lagged the U.S. over the last several years and offer good potential for returns in 2018.
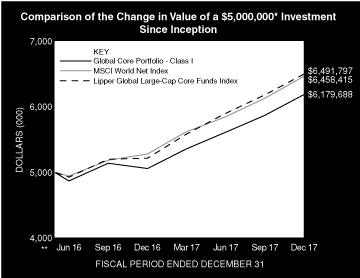
* Minimum Investment for Class I shares
** Commenced Operations on May 27, 2016.
In accordance with SEC regulations, the Fund's performance shown assumes that all recurring fees (including management fees) were deducted and all dividends and distributions were reinvested. The performance of Class A, C and IS shares will vary from the performance of Class I shares and will be impacted by additional fees assessed to those classes (if applicable).
Performance Compared to the MSCI World Net Index(1) and the Lipper Global Large-Cap Core Funds Index(2)
| | | Period Ended December 31, 2017
Total Returns(3) | |
| | | | | Average Annual | |
| | | One
Year | | Five
Years | | Ten
Years | | Since
Inception(5) | |
Fund — Class I Shares w/o
sales charges(4) | | | 22.27 | % | | | — | | | | — | | | | 14.18 | % | |
Fund — Class A Shares w/o
sales charges(4) | | | 21.82 | | | | — | | | | — | | | | 13.74 | | |
Fund — Class A Shares with
maximum 5.25% sales charges(4) | | | 15.37 | | | | — | | | | — | | | | 9.99 | | |
Fund — Class C Shares w/o
sales charges(4) | | | 20.92 | | | | — | | | | — | | | | 12.92 | | |
Fund — Class C Shares with
maximum 1.00% deferred
sales charges(4) | | | 19.92 | | | | — | | | | — | | | | 12.92 | | |
Fund — Class IS Shares w/o
sales charges(4) | | | 22.29 | | | | — | | | | — | | | | 14.21 | | |
MSCI World Net Index | | | 22.40 | | | | — | | | | — | | | | 17.44 | | |
Lipper Global Large-Cap Core
Funds Index | | | 24.54 | | | | — | | | | — | | | | 17.80 | | |
Performance data quoted represents past performance, which is no guarantee of future results, and current performance may be lower or higher than the figures shown. Performance assumes that all dividends and distributions, if any, were reinvested. For the most recent month-end performance figures, please visit www.morganstanley.com/im. Investment return and principal value will fluctuate so that Fund shares, when redeemed, may be worth more or less than their original cost. Total returns do not reflect the deduction of taxes that a shareholder would pay on Fund distributions or the redemption of Fund shares. Performance of share classes will vary due to difference in sales charges and expenses.
(1) The MSCI World Net Index is a free float-adjusted market capitalization weighted index designed to measure the equity market performance of developed markets. The term "free float" represents the portion of shares outstanding that are deemed to be available for purchase in the public equity markets by investors. The MSCI World Net Index currently consists of 23 developed market country indices. The performance of the Index is listed in US dollars and assumes reinvestment of net dividends. The Index is unmanaged and its returns do not include any sales charges or fees. Such costs would lower performance. It is not possible to invest directly in an index.
(2) The Lipper Global Large-Cap Core Funds Index is an equally weighted performance index of the largest qualifying funds (based on net assets) in the Lipper Global Large-Cap Core Funds classification. The Index, which is adjusted for capital gains distributions and income dividends, is unmanaged and should not be considered an investment. There are currently 10 funds represented in this Index. As of the date of this report, the Fund is in the Lipper Global Large-Cap Core Funds classification.
(3) Total returns for the Fund reflect fees waived and expenses reimbursed, if applicable, by the Adviser. Without such waivers and reimbursements, total returns would have been lower.
(4) Commenced operations on May 27, 2016.
(5) For comparative purposes, average annual since inception returns listed for the Indexes refer to the inception date of the Fund, not the inception of the Index.
5
Morgan Stanley Institutional Fund, Inc.
Annual Report — December 31, 2017
Portfolio of Investments
Global Core Portfolio
| | | Shares | | Value
(000) | |
Common Stocks (98.5%) | |
China (7.9%) | |
NetEase, Inc. ADR | | | 379 | | | $ | 131 | | |
TAL Education Group ADR | | | 5,275 | | | | 157 | | |
Tencent Holdings Ltd. ADR | | | 15,243 | | | | 791 | | |
| | | | 1,079 | | |
Germany (1.9%) | |
BASF SE ADR | | | 9,491 | | | | 261 | | |
Ireland (4.0%) | |
Ryanair Holdings PLC ADR (a) | | | 5,221 | | | | 544 | | |
Japan (6.4%) | |
Nintendo Co., Ltd. ADR | | | 6,369 | | | | 287 | | |
Nippon Telegraph & Telephone Corp. ADR | | | 12,207 | | | | 577 | | |
| | | | 864 | | |
Netherlands (1.3%) | |
AerCap Holdings N.V. (a) | | | 3,461 | | | | 182 | | |
Spain (3.3%) | |
Banco Bilbao Vizcaya Argentaria SA ADR | | | 53,194 | | | | 452 | | |
Switzerland (8.1%) | |
ABB Ltd. ADR | | | 20,846 | | | | 559 | | |
Logitech International SA (Registered) | | | 3,528 | | | | 119 | | |
UBS Group AG (Registered) (a) | | | 22,895 | | | | 421 | | |
| | | | 1,099 | | |
Taiwan (4.1%) | |
Taiwan Semiconductor Manufacturing Co., Ltd. ADR | | | 14,009 | | | | 555 | | |
United Kingdom (3.9%) | |
British American Tobacco PLC ADR | | | 5,706 | | | | 382 | | |
Diageo PLC ADR | | | 1,028 | | | | 150 | | |
| | | | 532 | | |
United States (57.6%) | |
Alphabet, Inc., Class A (a) | | | 403 | | | | 425 | | |
Ameriprise Financial, Inc. | | | 3,125 | | | | 530 | | |
Apple, Inc. | | | 3,992 | | | | 676 | | |
Broadcom Ltd. | | | 2,017 | | | | 518 | | |
Cigna Corp. | | | 2,496 | | | | 507 | | |
Comcast Corp., Class A | | | 14,195 | | | | 568 | | |
Danaher Corp. | | | 1,246 | | | | 116 | | |
Emerson Electric Co. | | | 4,664 | | | | 325 | | |
Franklin Resources, Inc. | | | 7,625 | | | | 330 | | |
Illinois Tool Works, Inc. | | | 3,113 | | | | 519 | | |
JPMorgan Chase & Co. | | | 6,581 | | | | 704 | | |
Mastercard, Inc., Class A | | | 3,192 | | | | 483 | | |
McDonald's Corp. | | | 1,034 | | | | 178 | | |
National Oilwell Varco, Inc. | | | 7,857 | | | | 283 | | |
Northrop Grumman Corp. | | | 1,386 | | | | 425 | | |
Priceline Group, Inc. (The) (a) | | | 253 | | | | 440 | | |
QUALCOMM, Inc. | | | 4,988 | | | | 319 | | |
Target Corp. | | | 964 | | | | 63 | | |
VMware, Inc., Class A (a) | | | 3,433 | | | | 430 | | |
| | | | 7,839 | | |
Total Common Stocks (Cost $10,778) | | | 13,407 | | |
| | | Shares | | Value
(000) | |
Short-Term Investment (3.8%) | |
Investment Company (3.8%) | |
Morgan Stanley Institutional Liquidity
Funds — Treasury Securities Portfolio —
Institutional Class (See Note G)
(Cost $524) | | | 524,071 | | | $ | 524 | | |
Total Investments (102.3%) (Cost $11,302) (b) | | | 13,931 | | |
Liabilities in Excess of Other Assets (–2.3%) | | | (313 | ) | |
Net Assets (100.0%) | | $ | 13,618 | | |
Country assignments and aggregations are based generally on third party vendor classifications and information, and may be different from the assignments and aggregations under the policies set forth in the Fund's prospectus and/or statement of additional information relating to geographic classifications.
(a) Non-income producing security.
(b) At December 31, 2017, the aggregate cost for federal income tax purposes is approximately $11,302,000. The aggregate gross unrealized appreciation is approximately $2,652,000 and the aggregate gross unrealized depreciation is approximately $23,000, resulting in net unrealized appreciation of approximately $2,629,000.
ADR American Depositary Receipt.
Portfolio Composition
Classification | | Percentage of
Total Investments | |
Other* | | | 45.6 | % | |
Semiconductors & Semiconductor Equipment | | | 10.0 | | |
Internet Software & Services | | | 9.7 | | |
Capital Markets | | | 9.2 | | |
Banks | | | 8.3 | | |
Electrical Equipment | | | 6.3 | | |
Tech Hardware, Storage & Peripherals | | | 5.7 | | |
Software | | | 5.2 | | |
Total Investments | | | 100.0 | % | |
* Industries and/or investment types representing less than 5% of total investments.
The accompanying notes are an integral part of the financial statements.
6
Morgan Stanley Institutional Fund, Inc.
Annual Report — December 31, 2017
Statement of Assets and Liabilities | | December 31, 2017
(000) | |
Assets: | |
Investments in Securities of Unaffiliated Issuers, at Value (Cost $10,778) | | $ | 13,407 | | |
Investment in Security of Affiliated Issuer, at Value (Cost $524) | | | 524 | | |
Total Investments in Securities, at Value (Cost $11,302) | | | 13,931 | | |
Receivable for Investments Sold | | | 40 | | |
Due from Adviser | | | 39 | | |
Dividends Receivable | | | 9 | | |
Receivable from Affiliate | | | — | @ | |
Other Assets | | | 26 | | |
Total Assets | | | 14,045 | | |
Liabilities: | |
Payable for Investments Purchased | | | 361 | | |
Payable for Professional Fees | | | 54 | | |
Payable for Custodian Fees | | | 2 | | |
Payable for Transfer Agency Fees — Class I | | | 1 | | |
Payable for Transfer Agency Fees — Class A | | | 1 | | |
Payable for Transfer Agency Fees — Class C | | | — | @ | |
Payable for Transfer Agency Fees — Class IS | | | — | @ | |
Payable for Shareholder Services Fees — Class A | | | — | @ | |
Payable for Distribution and Shareholder Services Fees — Class C | | | 1 | | |
Payable for Sub Transfer Agency Fees — Class A | | | — | @ | |
Payable for Sub Transfer Agency Fees — Class C | | | 1 | | |
Payable for Administration Fees | | | 1 | | |
Other Liabilities | | | 5 | | |
Total Liabilities | | | 427 | | |
Net Assets | | $ | 13,618 | | |
Net Assets Consist of: | |
Paid-in-Capital | | $ | 11,401 | | |
Distributions in Excess of Net Investment Income | | | (43 | ) | |
Accumulated Net Realized Loss | | | (369 | ) | |
Unrealized Appreciation (Depreciation) on: | |
Investments | | | 2,629 | | |
Net Assets | | $ | 13,618 | | |
CLASS I: | |
Net Assets | | $ | 10,398 | | |
| Shares Outstanding $0.001 par value shares of beneficial interest (unlimited shares authorized) (not in 000's) | | | 852,198 | | |
Net Asset Value, Offering and Redemption Price Per Share | | $ | 12.20 | | |
CLASS A: | |
Net Assets | | $ | 1,962 | | |
| Shares Outstanding $0.001 par value shares of beneficial interest (unlimited shares authorized) (not in 000's) | | | 161,118 | | |
Net Asset Value, Redemption Price Per Share | | $ | 12.18 | | |
Maximum Sales Load | | | 5.25 | % | |
Maximum Sales Charge | | $ | 0.67 | | |
Maximum Offering Price Per Share | | $ | 12.85 | | |
CLASS C: | |
Net Assets | | $ | 1,246 | | |
| Shares Outstanding $0.001 par value shares of beneficial interest (unlimited shares authorized) (not in 000's) | | | 103,178 | | |
Net Asset Value, Offering and Redemption Price Per Share | | $ | 12.08 | | |
CLASS IS: | |
Net Assets | | $ | 12 | | |
| Shares Outstanding $0.001 par value shares of beneficial interest (unlimited shares authorized) (not in 000's) | | | 1,000 | | |
Net Asset Value, Offering and Redemption Price Per Share | | $ | 12.20 | | |
@ Amount is less than $500.
The accompanying notes are an integral part of the financial statements.
7
Morgan Stanley Institutional Fund, Inc.
Annual Report — December 31, 2017
Statement of Operations | | Year Ended
December 31, 2017
(000) | |
Investment Income: | |
Dividends from Securities of Unaffiliated Issuers (Net of $8 of Foreign Taxes Withheld) | | $ | 187 | | |
Dividends from Security of Affiliated Issuer (Note G) | | | 1 | | |
Total Investment Income | | | 188 | | |
Expenses: | |
Professional Fees | | | 142 | | |
Advisory Fees (Note B) | | | 88 | | |
Registration Fees | | | 36 | | |
Offering Costs | | | 22 | | |
Shareholder Services Fees — Class A (Note D) | | | 4 | | |
Distribution and Shareholder Services Fees — Class C (Note D) | | | 11 | | |
Shareholder Reporting Fees | | | 13 | | |
Administration Fees (Note C) | | | 9 | | |
Transfer Agency Fees — Class I (Note E) | | | 2 | | |
Transfer Agency Fees — Class A (Note E) | | | 2 | | |
Transfer Agency Fees — Class C (Note E) | | | 2 | | |
Transfer Agency Fees — Class IS (Note E) | | | 2 | | |
Custodian Fees (Note F) | | | 3 | | |
Directors' Fees and Expenses | | | 3 | | |
Sub Transfer Agency Fees — Class I | | | — | @ | |
Sub Transfer Agency Fees — Class A | | | 1 | | |
Sub Transfer Agency Fees — Class C | | | 2 | | |
Pricing Fees | | | 2 | | |
Other Expenses | | | 17 | | |
Total Expenses | | | 361 | | |
Expenses Reimbursed by Adviser (Note B) | | | (137 | ) | |
Waiver of Advisory Fees (Note B) | | | (88 | ) | |
Reimbursement of Class Specific Expenses — Class A (Note B) | | | (1 | ) | |
Reimbursement of Class Specific Expenses — Class C (Note B) | | | (2 | ) | |
Reimbursement of Class Specific Expenses — Class IS (Note B) | | | (2 | ) | |
Rebate from Morgan Stanley Affiliate (Note G) | | | (— | @) | |
Net Expenses | | | 131 | | |
Net Investment Income | | | 57 | | |
Realized Loss: | |
Investments Sold | | | (278 | ) | |
Change in Unrealized Appreciation (Depreciation): | |
Investments | | | 2,493 | | |
Net Realized Loss and Change in Unrealized Appreciation (Depreciation) | | | 2,215 | | |
Net Increase in Net Assets Resulting from Operations | | $ | 2,272 | | |
@ Amount is less than $500.
The accompanying notes are an integral part of the financial statements.
8
Morgan Stanley Institutional Fund, Inc.
Annual Report — December 31, 2017
Statements of Changes in Net Assets | | Year Ended
December 31, 2017
(000) | | Period from
May 27, 2016^ to
December 31, 2016
(000) | |
Increase (Decrease) in Net Assets: | |
Operations: | |
Net Investment Income | | $ | 57 | | | $ | 28 | | |
Net Realized Loss | | | (278 | ) | | | (104 | ) | |
Net Change in Unrealized Appreciation (Depreciation) | | | 2,493 | | | | 136 | | |
Net Increase in Net Assets Resulting from Operations | | | 2,272 | | | | 60 | | |
Distributions from and/or in Excess of: | |
Class I: | |
Net Investment Income | | | (51 | ) | | | (50 | ) | |
Paid-in-Capital | | | (3 | ) | | | — | | |
Class A: | |
Net Investment Income | | | (2 | ) | | | (8 | ) | |
Paid-in-Capital | | | (1 | ) | | | — | | |
Class C: | |
Net Investment Income | | | (1 | ) | | | (4 | ) | |
Paid-in-Capital | | | — | | | | — | | |
Class IS: | |
Net Investment Income | | | (— | @) | | | (— | @) | |
Paid-in-Capital | | | (— | @) | | | — | | |
Total Distributions | | | (58 | ) | | | (62 | ) | |
Capital Share Transactions:(1) | |
Class I: | |
Subscribed | | | 2,235 | | | | 6,525 | | |
Distributions Reinvested | | | 22 | | | | 11 | | |
Redeemed | | | (109 | ) | | | (31 | ) | |
Class A: | |
Subscribed | | | 652 | | | | 1,365 | | |
Distributions Reinvested | | | 3 | | | | 8 | | |
Redeemed | | | (233 | ) | | | (102 | ) | |
Class C: | |
Subscribed | | | 240 | | | | 904 | | |
Distributions Reinvested | | | 1 | | | | 4 | | |
Redeemed | | | (98 | ) | | | (1 | ) | |
Class IS: | |
Subscribed | | | — | | | | 10 | | |
Net Increase in Net Assets Resulting from Capital Share Transactions | | | 2,713 | | | | 8,693 | | |
Total Increase in Net Assets | | | 4,927 | | | | 8,691 | | |
Net Assets: | |
Beginning of Period | | | 8,691 | | | | — | | |
End of Period (Including Distributions in Excess of Net Investment Income of $(43) and $(34)) | | $ | 13,618 | | | $ | 8,691 | | |
(1) Capital Share Transactions: | |
Class I: | |
Shares Subscribed | | | 210 | | | | 652 | | |
Shares Issued on Distributions Reinvested | | | 2 | | | | 1 | | |
Shares Redeemed | | | (10 | ) | | | (3 | ) | |
Net Increase in Class I Shares Outstanding | | | 202 | | | | 650 | | |
Class A: | |
Shares Subscribed | | | 55 | | | | 135 | | |
Shares Issued on Distributions Reinvested | | | — | @@ | | | 1 | | |
Shares Redeemed | | | (20 | ) | | | (10 | ) | |
Net Increase in Class A Shares Outstanding | | | 35 | | | | 126 | | |
Class C: | |
Shares Subscribed | | | 22 | | | | 90 | | |
Shares Issued on Distributions Reinvested | | | — | @@ | | | — | @@ | |
Shares Redeemed | | | (9 | ) | | | (— | @@) | |
Net Increase in Class C Shares Outstanding | | | 13 | | | | 90 | | |
Class IS: | |
Shares Subscribed | | | — | | | | 1 | | |
^ Commencement of Operations.
@ Amount is less than $500.
@@ Amount is less than 500 shares.
The accompanying notes are an integral part of the financial statements.
9
Morgan Stanley Institutional Fund, Inc.
Annual Report — December 31, 2017
Financial Highlights
Global Core Portfolio
| | | Class I | |
Selected Per Share Data and Ratios | | Year Ended
December 31, 2017 | | Period from
May 27, 2016(1) to
December 31, 2016 | |
Net Asset Value, Beginning of Period | | $ | 10.03 | | | $ | 10.00 | | |
Income from Investment Operations: | |
Net Investment Income(2) | | | 0.07 | | | | 0.05 | | |
Net Realized and Unrealized Gain | | | 2.16 | | | | 0.06 | | |
Total from Investment Operations | | | 2.23 | | | | 0.11 | | |
Distributions from and/or in Excess of: | |
Net Investment Income | | | (0.06 | ) | | | (0.08 | ) | |
Paid-in-Capital | | | (0.00 | )(3) | | | — | | |
Total Distributions | | | (0.06 | ) | | | (0.08 | ) | |
Net Asset Value, End of Period | | $ | 12.20 | | | $ | 10.03 | | |
Total Return(4) | | | 22.27 | % | | | 1.08 | %(7) | |
Ratios and Supplemental Data: | |
Net Assets, End of Period (Thousands) | | $ | 10,398 | | | $ | 6,517 | | |
Ratio of Expenses to Average Net Assets(9) | | | 0.97 | %(5) | | | 0.98 | %(5)(8) | |
Ratio of Net Investment Income to Average Net Assets(9) | | | 0.64 | %(5) | | | 0.82 | %(5)(8) | |
Ratio of Rebate from Morgan Stanley Affiliates to Average Net Assets | | | 0.00 | %(6) | | | 0.01 | %(8) | |
Portfolio Turnover Rate | | | 41 | % | | | 22 | %(7) | |
(9) Supplemental Information on the Ratios to Average Net Assets: | |
Ratios Before Expense Limitation: | |
Expenses to Average Net Assets | | | 2.89 | % | | | 3.73 | %(8) | |
Net Investment Loss to Average Net Assets | | | (1.28 | )% | | | (1.93 | )%(8) | |
(1) Commencement of Operations.
(2) Per share amount is based on average shares outstanding.
(3) Amount is less than $0.005 per share.
(4) Calculated based on the net asset value as of the last business day of the period.
(5) The Ratios of Expenses and Net Investment Income reflect the rebate of certain Fund expenses in connection with the investments in Morgan Stanley affiliates during the period. The effect of the rebate on the ratios is disclosed in the above table as "Ratio of Rebate from Morgan Stanley Affiliates to Average Net Assets."
(6) Amount is less than 0.005%.
(7) Not annualized.
(8) Annualized.
The accompanying notes are an integral part of the financial statements.
10
Morgan Stanley Institutional Fund, Inc.
Annual Report — December 31, 2017
Financial Highlights
Global Core Portfolio
| | | Class A | |
Selected Per Share Data and Ratios | | Year Ended
December 31, 2017 | | Period from
May 27, 2016(1) to
December 31, 2016 | |
Net Asset Value, Beginning of Period | | $ | 10.02 | | | $ | 10.00 | | |
Income from Investment Operations: | |
Net Investment Income(2) | | | 0.03 | | | | 0.02 | | |
Net Realized and Unrealized Gain | | | 2.15 | | | | 0.06 | | |
Total from Investment Operations | | | 2.18 | | | | 0.08 | | |
Distributions from and/or in Excess of: | |
Net Investment Income | | | (0.02 | ) | | | (0.06 | ) | |
Paid-in-Capital | | | (0.00 | )(3) | | | — | | |
Total Distributions | | | (0.02 | ) | | | (0.06 | ) | |
Net Asset Value, End of Period | | $ | 12.18 | | | $ | 10.02 | | |
Total Return(4) | | | 21.82 | % | | | 0.83 | %(7) | |
Ratios and Supplemental Data: | |
Net Assets, End of Period (Thousands) | | $ | 1,962 | | | $ | 1,263 | | |
Ratio of Expenses to Average Net Assets(9) | | | 1.35 | %(5) | | | 1.35 | %(5)(8) | |
Ratio of Net Investment Income to Average Net Assets(9) | | | 0.25 | %(5) | | | 0.39 | %(5)(8) | |
Ratio of Rebate from Morgan Stanley Affiliates to Average Net Assets | | | 0.00 | %(6) | | | 0.00 | %(6)(8) | |
Portfolio Turnover Rate | | | 41 | % | | | 22 | %(7) | |
(9) Supplemental Information on the Ratios to Average Net Assets: | |
Ratios Before Expense Limitation: | |
Expenses to Average Net Assets | | | 3.36 | % | | | 4.16 | %(8) | |
Net Investment Loss to Average Net Assets | | | (1.76 | )% | | | (2.42 | )%(8) | |
(1) Commencement of Operations.
(2) Per share amount is based on average shares outstanding.
(3) Amount is less than $0.005 per share.
(4) Calculated based on the net asset value which does not reflect sales charges, if applicable, as of the last business day of the period.
(5) The Ratios of Expenses and Net Investment Income reflect the rebate of certain Fund expenses in connection with the investments in Morgan Stanley affiliates during the period. The effect of the rebate on the ratios is disclosed in the above table as "Ratio of Rebate from Morgan Stanley Affiliates to Average Net Assets."
(6) Amount is less than 0.005%.
(7) Not annualized.
(8) Annualized.
The accompanying notes are an integral part of the financial statements.
11
Morgan Stanley Institutional Fund, Inc.
Annual Report — December 31, 2017
Financial Highlights
Global Core Portfolio
| | | Class C | |
Selected Per Share Data and Ratios | | Year Ended
December 31, 2017 | | Period from
May 27, 2016(1) to
December 31, 2016 | |
Net Asset Value, Beginning of Period | | $ | 10.00 | | | $ | 10.00 | | |
Income (Loss) from Investment Operations: | |
Net Investment Loss(2) | | | (0.06 | ) | | | (0.02 | ) | |
Net Realized and Unrealized Gain | | | 2.15 | | | | 0.06 | | |
Total from Investment Operations | | | 2.09 | | | | 0.04 | | |
Distributions from and/or in Excess of: | |
Net Investment Income | | | (0.01 | ) | | | (0.04 | ) | |
Net Asset Value, End of Period | | $ | 12.08 | | | $ | 10.00 | | |
Total Return(3) | | | 20.92 | % | | | 0.41 | %(6) | |
Ratios and Supplemental Data: | |
Net Assets, End of Period (Thousands) | | $ | 1,246 | | | $ | 901 | | |
Ratio of Expenses to Average Net Assets(8) | | | 2.10 | %(4) | | | 2.10 | %(4)(7) | |
Ratio of Net Investment Loss to Average Net Assets(8) | | | (0.50 | )%(4) | | | (0.36 | )%(4)(7) | |
Ratio of Rebate from Morgan Stanley Affiliates to Average Net Assets | | | 0.00 | %(5) | | | 0.00 | %(5)(7) | |
Portfolio Turnover Rate | | | 41 | % | | | 22 | %(6) | |
(8) Supplemental Information on the Ratios to Average Net Assets: | |
Ratios Before Expense Limitation: | |
Expenses to Average Net Assets | | | 4.19 | % | | | 5.02 | %(7) | |
Net Investment Loss to Average Net Assets | | | (2.59 | )% | | | (3.28 | )%(7) | |
(1) Commencement of Operations.
(2) Per share amount is based on average shares outstanding.
(3) Calculated based on the net asset value which does not reflect sales charges, if applicable, as of the last business day of the period.
(4) The Ratios of Expenses and Net Investment Loss reflect the rebate of certain Fund expenses in connection with the investments in Morgan Stanley affiliates during the period. The effect of the rebate on the ratios is disclosed in the above table as "Ratio of Rebate from Morgan Stanley Affiliates to Average Net Assets."
(5) Amount is less than 0.005%.
(6) Not annualized.
(7) Annualized.
The accompanying notes are an integral part of the financial statements.
12
Morgan Stanley Institutional Fund, Inc.
Annual Report — December 31, 2017
Financial Highlights
Global Core Portfolio
| | | Class IS | |
Selected Per Share Data and Ratios | | Year Ended
December 31, 2017 | | Period from
May 27, 2016(1) to
December 31, 2016 | |
Net Asset Value, Beginning of Period | | $ | 10.03 | | | $ | 10.00 | | |
Income from Investment Operations: | |
Net Investment Income(2) | | | 0.07 | | | | 0.05 | | |
Net Realized and Unrealized Gain | | | 2.17 | | | | 0.06 | | |
Total from Investment Operations | | | 2.24 | | | | 0.11 | | |
Distributions from and/or in Excess of: | |
Net Investment Income | | | (0.07 | ) | | | (0.08 | ) | |
Paid-in-Capital | | | (0.00 | )(3) | | | — | | |
Total Distributions | | | (0.07 | ) | | | (0.08 | ) | |
Net Asset Value, End of Period | | $ | 12.20 | | | $ | 10.03 | | |
Total Return(4) | | | 22.29 | % | | | 1.10 | %(7) | |
Ratios and Supplemental Data: | |
Net Assets, End of Period (Thousands) | | $ | 12 | | | $ | 10 | | |
Ratio of Expenses to Average Net Assets(9) | | | 0.95 | %(5) | | | 0.95 | %(5)(8) | |
Ratio of Net Investment Income to Average Net Assets(9) | | | 0.66 | %(5) | | | 0.84 | %(5)(8) | |
Ratio of Rebate from Morgan Stanley Affiliates to Average Net Assets | | | 0.00 | %(6) | | | 0.00 | %(6)(8) | |
Portfolio Turnover Rate | | | 41 | % | | | 22 | %(7) | |
(9) Supplemental Information on the Ratios to Average Net Assets: | |
Ratios Before Expense Limitation: | |
Expenses to Average Net Assets | | | 18.67 | % | | | 19.70 | %(8) | |
Net Investment Loss to Average Net Assets | | | (17.06 | )% | | | (17.91 | )%(8) | |
(1) Commencement of Operations.
(2) Per share amount is based on average shares outstanding.
(3) Amount is less than $0.005 per share.
(4) Calculated based on the net asset value as of the last business day of the period.
(5) The Ratios of Expenses and Net Investment Income reflect the rebate of certain Fund expenses in connection with the investments in Morgan Stanley affiliates during the period. The effect of the rebate on the ratios is disclosed in the above table as "Ratio of Rebate from Morgan Stanley Affiliates to Average Net Assets."
(6) Amount is less than 0.005%.
(7) Not annualized.
(8) Annualized.
The accompanying notes are an integral part of the financial statements.
13
Morgan Stanley Institutional Fund, Inc.
Annual Report — December 31, 2017
Notes to Financial Statements
Morgan Stanley Institutional Fund, Inc. (the "Company") is registered under the Investment Company Act of 1940, as amended (the "Act"), as an open-end management investment company. The Company is comprised of twenty-nine separate, active, diversified and non-diversified funds (individually referred to as a "Fund", collectively as the "Funds"). The Company applies investment company accounting and reporting guidance.
The accompanying financial statements relate to the Global Core Portfolio. The Fund seeks long-term capital appreciation.
The Fund offers four classes of shares — Class I, Class A, Class C and Class IS.
A. Significant Accounting Policies: The following significant accounting policies are in conformity with U.S. generally accepted accounting principles ("GAAP"). Such policies are consistently followed by the Company in the preparation of its financial statements. GAAP may require management to make estimates and assumptions that affect the reported amounts and disclosures in the financial statements. Actual results may differ from those estimates.
1. Security Valuation: (1) An equity portfolio security listed or traded on an exchange is valued at its latest reported sales price (or at the exchange official closing price if such exchange reports an official closing price), and if there were no sales on a given day and if there is no official exchange closing price for that day, the security is valued at the mean between the last reported bid and asked prices if such bid and asked prices are available on the relevant exchanges. Listed equity securities not traded on the valuation date with no reported bid and asked prices available on the exchange are valued at the mean between the current bid and asked prices obtained from one or more reputable brokers or dealers. In cases where a security is traded on more than one exchange, the security is valued on the exchange designated as the primary market; (2) all other equity portfolio securities for which over-the-counter ("OTC") market quotations are readily available are valued at the latest reported sales price (or at the market official closing price if such market reports an official closing price), and if there was no trading in the security on a given day and if there is no official closing price from relevant markets for that day, the security is valued at the mean between the last reported bid and asked prices if such bid and asked prices are available on the relevant markets. An unlisted equity security that does
not trade on the valuation date and for which bid and asked prices from the relevant markets are unavailable is valued at the mean between the current bid and asked prices obtained from one or more reputable brokers or dealers; (3) certain portfolio securities may be valued by an outside pricing service/vendor approved by the Company's Board of Directors (the "Directors"). The pricing service/vendor may employ a pricing model that takes into account, among other things, bids, yield spreads, and/or other market data and specific security characteristics. Alternatively, if a valuation is not available from an outside pricing service/vendor, and the security trades on an exchange, the security may be valued at its latest reported sale price (or at the exchange official closing price if such exchange reports an official closing price), prior to the time when assets are valued. If there are no sales on a given day and if there is no official exchange closing price for that day, the security is valued at the mean between the last reported bid and asked prices if such bid and asked prices are available in the relevant exchanges; (4) when market quotations are not readily available, including circumstances under which Morgan Stanley Investment Management Inc. (the "Adviser") determines that the closing price, last sale price or the mean between the last reported bid and asked prices are not reflective of a security's market value, portfolio securities are valued at their fair value as determined in good faith under procedures established by and under the general supervision of the Directors. Occasionally, developments affecting the closing prices of securities and other assets may occur between the times at which valuations of such securities are determined (that is, close of the foreign market on which the securities trade) and the close of business of the New York Stock Exchange ("NYSE"). If developments occur during such periods that are expected to materially affect the value of such securities, such valuations may be adjusted to reflect the estimated fair value of such securities as of the close of the NYSE, as determined in good faith by the Directors or by the Adviser using a pricing service and/or procedures approved by the Directors; and (5) investments in mutual funds, including the Morgan Stanley Institutional Liquidity Funds, are valued at the net asset value ("NAV") as of the close of each business day.
The Directors have responsibility for determining in good faith the fair value of the investments, and the Directors may appoint others, such as the Company's
14
Morgan Stanley Institutional Fund, Inc.
Annual Report — December 31, 2017
Notes to Financial Statements (cont'd)
Adviser or a valuation committee, to assist the Directors in determining fair value and to make the actual calculations pursuant to the fair valuation methodologies previously approved by the Directors. Under procedures approved by the Directors, the Company's Adviser has formed a Valuation Committee whose members are approved by the Directors. The Valuation Committee provides administration and oversight of the Company's valuation policies and procedures, which are reviewed at least annually by the Directors. These procedures allow the Company to utilize independent pricing services, quotations from securities and financial instrument dealers, and other market sources to determine fair value.
The Company has procedures to determine the fair value of securities and other financial instruments for which market prices are not readily available. Under these procedures, the Valuation Committee convenes on a regular and ad hoc basis to review such securities and considers a number of factors, including valuation methodologies and significant unobservable valuation inputs, when arriving at fair value. The Valuation Committee may employ a market-based approach which may use related or comparable assets or liabilities, recent transactions, market multiples, book values, and other relevant information for the investment to determine the fair value of the investment. An income-based valuation approach may also be used in which the anticipated future cash flows of the investment are discounted to calculate fair value. Discounts may also be applied due to the nature or duration of any restrictions on the disposition of the investments. Due to the inherent uncertainty of valuations of such investments, the fair values may differ significantly from the values that would have been used had an active market existed. The Valuation Committee employs various methods for calibrating these valuation approaches including a regular review of valuation methodologies, key inputs and assumptions, transactional back-testing or disposition analysis, and reviews of any related market activity.
2. Fair Value Measurement: Financial Accounting Standards Board ("FASB") Accounting Standards CodificationTM ("ASC") 820, "Fair Value Measurement" ("ASC 820"), defines fair value as the value that the Fund
would receive to sell an investment or pay to transfer a liability in a timely transaction with an independent buyer in the principal market, or in the absence of a principal market, the most advantageous market for the investment or liability. ASC 820 establishes a three-tier hierarchy to distinguish between (1) inputs that reflect the assumptions market participants would use in valuing an asset or liability developed based on market data obtained from sources independent of the reporting entity (observable inputs) and (2) inputs that reflect the reporting entity's own assumptions about the assumptions market participants would use in valuing an asset or liability developed based on the best information available in the circumstances (unobservable inputs) and to establish classification of fair value measurements for disclosure purposes. Various inputs are used in determining the value of the Fund's investments. The inputs are summarized in the three broad levels listed below.
• Level 1 – unadjusted quoted prices in active markets for identical investments
• Level 2 – other significant observable inputs (including quoted prices for similar investments, interest rates, prepayment speeds, credit risk, etc.)
• Level 3 – significant unobservable inputs including the Fund's own assumptions in determining the fair value of investments. Factors considered in making this determination may include, but are not limited to, information obtained by contacting the issuer, analysts, or the appropriate stock exchange (for exchange-traded securities), analysis of the issuer's financial statements or other available documents and, if necessary, available information concerning other securities in similar circumstances
The inputs or methodology used for valuing securities are not necessarily an indication of the risk associated with investing in those securities and the determination of the significance of a particular input to the fair value measurement in its entirety requires judgment and considers factors specific to each security.
15
Morgan Stanley Institutional Fund, Inc.
Annual Report — December 31, 2017
Notes to Financial Statements (cont'd)
The following is a summary of the inputs used to value the Fund's investments as of December 31, 2017.
Investment Type | | Level 1
Unadjusted
quoted
prices
(000) | | Level 2
Other
significant
observable
inputs
(000) | | Level 3
Significant
unobservable
inputs
(000) | | Total
(000) | |
Assets: | |
Common Stocks | |
Aerospace & Defense | | $ | 425 | | | $ | — | | | $ | — | | | $ | 425 | | |
Airlines | | | 544 | | | | — | | | | — | | | | 544 | | |
Banks | | | 1,156 | | | | — | | | | — | | | | 1,156 | | |
Beverages | | | 150 | | | | — | | | | — | | | | 150 | | |
Capital Markets | | | 1,281 | | | | — | | | | — | | | | 1,281 | | |
Chemicals | | | 261 | | | | — | | | | — | | | | 261 | | |
Diversified Consumer
Services | | | 157 | | | | — | | | | — | | | | 157 | | |
Diversified
Telecommunication
Services | | | 577 | | | | — | | | | — | | | | 577 | | |
Electrical Equipment | | | 884 | | | | — | | | | — | | | | 884 | | |
Energy Equipment &
Services | | | 283 | | | | — | | | | — | | | | 283 | | |
Health Care Equipment &
Supplies | | | 116 | | | | — | | | | — | | | | 116 | | |
Health Care Providers &
Services | | | 507 | | | | — | | | | — | | | | 507 | | |
Hotels, Restaurants &
Leisure | | | 178 | | | | — | | | | — | | | | 178 | | |
Information Technology
Services | | | 483 | | | | — | | | | — | | | | 483 | | |
Internet & Direct
Marketing Retail | | | 440 | | | | — | | | | — | | | | 440 | | |
Internet Software &
Services | | | 1,347 | | | | — | | | | — | | | | 1,347 | | |
Machinery | | | 519 | | | | — | | | | — | | | | 519 | | |
Media | | | 568 | | | | — | | | | — | | | | 568 | | |
Multi-Line Retail | | | 63 | | | | — | | | | — | | | | 63 | | |
Semiconductors &
Semiconductor
Equipment | | | 1,392 | | | | — | | | | — | | | | 1,392 | | |
Software | | | 717 | | | | — | | | | — | | | | 717 | | |
Tech Hardware,
Storage & Peripherals | | | 795 | | | | — | | | | — | | | | 795 | | |
Tobacco | | | 382 | | | | — | | | | — | | | | 382 | | |
Trading Companies &
Distributors | | | 182 | | | | — | | | | — | | | | 182 | | |
Total Common Stocks | | | 13,407 | | | | — | | | | — | | | | 13,407 | | |
Short-Term Investment | |
Investment Company | | | 524 | | | | — | | | | — | | | | 524 | | |
Total Assets | | $ | 13,931 | | | $ | — | | | $ | — | | | $ | 13,931 | | |
Transfers between investment levels may occur as the markets fluctuate and/or the availability of data used in an investment's valuation changes. The Fund recognizes transfers between the levels as of the end of the period. As of December 31, 2017, the Fund did not have any investments transfer between investment levels.
3. Indemnifications: The Company enters into contracts that contain a variety of indemnifications. The Company's maximum exposure under these arrangements is unknown. However, the Company has not had prior claims or losses pursuant to these contracts and expects the risk of loss to be remote.
4. Dividends and Distributions to Shareholders: Dividends and distributions to shareholders are recorded on the ex-dividend date. Dividends from net investment income, if any, are declared and paid annually. Net realized capital gains, if any, are distributed at least annually.
5. Security Transactions, Income and Expenses: Security transactions are accounted for on the trade date (date the order to buy or sell is executed). Realized gains and losses on the sale of investment securities are determined on the specific identified cost method. Dividend income and other distributions are recorded on the ex-dividend date (except for certain foreign dividends which may be recorded as soon as the Fund is informed of such dividends) net of applicable withholding taxes. Interest income is recognized on the accrual basis except where collection is in doubt. Discounts are accreted and premiums are amortized over the life of the respective securities. Most expenses of the Company can be directly attributed to a particular Fund. Expenses which cannot be directly attributed are apportioned among the Funds based upon relative net assets or other appropriate methods. Income, expenses (other than class specific expenses — distribution and shareholder services, transfer agency and sub transfer agency fees) and realized and unrealized gains or losses are allocated to each class of shares based upon their relative net assets.
B. Advisory Fees: The Adviser, a wholly-owned subsidiary of Morgan Stanley, provides the Fund with advisory services under the terms of an Investment Advisory Agreement, paid quarterly, at the annual rate based on the daily net assets as follows:
First $750
million | | Next $750
million | | Over $1.5
billion | |
| | 0.75 | % | | | 0.70 | % | | | 0.65 | % | |
For the year ended December 31, 2017, the advisory fee rate (net of waiver/rebate) was equivalent to an annual effective rate of 0.00% of the Fund's average daily net assets.
16
Morgan Stanley Institutional Fund, Inc.
Annual Report — December 31, 2017
Notes to Financial Statements (cont'd)
The Adviser has agreed to reduce its advisory fee and/or reimburse the Fund so that total annual portfolio operating expenses, excluding certain investment related expenses, taxes, interest and other extraordinary expenses (including litigation), will not exceed 1.00% for Class I shares, 1.35% for Class A shares, 2.10% for Class C shares and 0.95% for Class IS shares. The fee waivers and/or expense reimbursements will continue for at least one year from the date of the Fund's prospectus or until such time as the Directors act to discontinue all or a portion of such waivers and/or reimbursements when they deem such action is appropriate. For the year ended December 31, 2017, approximately $88,000 of advisory fees were waived and approximately $142,000 of other expenses were reimbursed by the Adviser pursuant to this arrangement.
C. Administration Fees: The Adviser also serves as Administrator to the Company and provides administrative services pursuant to an Administration Agreement for an annual fee, accrued daily and paid monthly, of 0.08% of the Fund's average daily net assets.
Under a Sub-Administration Agreement between the Administrator and State Street Bank and Trust Company ("State Street"), State Street provides certain administrative services to the Company. For such services, the Administrator pays State Street a portion of the fee the Administrator receives from the Fund.
D. Distribution and Shareholder Services Fees: Morgan Stanley Distribution, Inc. ("MSDI" or the "Distributor"), a wholly-owned subsidiary of the Adviser and an indirect subsidiary of Morgan Stanley, serves as the Company's Distributor of Fund shares pursuant to a Distribution Agreement. The Company has adopted a Shareholder Services Plan with respect to Class A shares pursuant to Rule 12b-1 under the Act. Under the Shareholder Services Plan, the Fund pays the Distributor a shareholder services fee, accrued daily and paid monthly, at an annual rate of 0.25% of the Fund's average daily net assets attributable to Class A shares.
The Company has adopted a Distribution and Shareholder Services Plan with respect to Class C shares pursuant to Rule 12b-1 under the Act. Under the Distribution and Shareholder Services Plan, the Fund pays the Distributor a distribution fee, accrued daily and paid monthly, at an annual rate of 0.75% and a shareholder services fee, accrued daily and paid
monthly, at an annual rate of 0.25% of the Fund's average daily net assets attributable to Class C shares.
The distribution and shareholder services fees are used to support the expenses associated with servicing and maintaining accounts. The Distributor may compensate other parties for providing shareholder support services to investors who purchase Class A and Class C shares.
E. Dividend Disbursing and Transfer Agent: The Company's dividend disbursing and transfer agent is Boston Financial Data Services, Inc. ("BFDS"). Pursuant to a Transfer Agency Agreement, the Company pays BFDS a fee based on the number of classes, accounts and transactions relating to the Funds of the Company. Effective January 1, 2018, BFDS changed its name to DST Asset Manager Solutions, Inc.
F. Custodian Fees: State Street (the "Custodian") also serves as Custodian for the Company in accordance with a Custodian Agreement. The Custodian holds cash, securities, and other assets of the Company as required by the Act. Custody fees are payable monthly based on assets held in custody, investment purchases and sales activity and account maintenance fees, plus reimbursement for certain out-of-pocket expenses.
G. Security Transactions and Transactions with Affiliates: For the year ended December 31, 2017, purchases and sales of investment securities for the Fund, other than long-term U.S. Government securities and short-term investments, were approximately $7,312,000 and $4,698,000, respectively. There were no purchases and sales of long-term U.S. Government securities for the year ended December 31, 2017.
The Fund invests in the Institutional Class of the Morgan Stanley Institutional Liquidity Funds — Treasury Securities Portfolio (the "Liquidity Funds"), an open-end management investment company managed by the Adviser. Advisory fees paid by the Fund are reduced by an amount equal to its pro-rata share of the advisory and administration fees paid by the Fund due to its investment in the Liquidity Funds. For the year ended December 31, 2017, advisory fees paid were reduced by less than $500 relating to the Fund's investment in the Liquidity Funds.
17
Morgan Stanley Institutional Fund, Inc.
Annual Report — December 31, 2017
Notes to Financial Statements (cont'd)
A summary of the Fund's transactions in shares of the Liquidity Funds during the year ended December 31, 2017 is as follows:
Affiliated
Investment
Company | | Value
December 31,
2016
(000) | | Purchases
at Cost
(000) | | Proceeds
from Sales
(000) | | Dividend
Income
(000) | |
Liquidity Funds | | $ | 61 | | | $ | 3,166 | | | $ | 2,703 | | | $ | 1 | | |
Affiliated
Investment
Company (cont'd) | | Realized
Gain
(Loss)
(000) | | Change in
Unrealized
Appreciation
(Depreciation)
(000) | | Value
December 31,
2017
(000) | |
Liquidity Funds | | $ | — | | | $ | — | | | $ | 524 | | |
The Fund is permitted to purchase and sell securities ("cross-trade") from and to other Morgan Stanley Funds as well as other funds and client accounts for which the Adviser or an affiliate of the Adviser serves as investment adviser, pursuant to procedures approved by the Directors in compliance with Rule 17a-7 under the Act (the "Rule"). Each cross-trade is executed at the current market price in compliance with provisions of the Rule. For the year ended December 31, 2017, the Fund did not engage in any cross-trade transactions.
The Fund has an unfunded Deferred Compensation Plan (the "Compensation Plan"), which allows each independent Director to defer payment of all, or a portion, of the fees he or she receives for serving on the Board of Directors. Each eligible Director generally may elect to have the deferred amounts credited with a return equal to the total return on one or more of the Morgan Stanley funds that are offered as investment options under the Compensation Plan. Appreciation/depreciation and distributions received from these investments are recorded with an offsetting increase/decrease in the deferred compensation obligation and do not affect the NAV of the Fund.
H. Federal Income Taxes: It is the Fund's intention to continue to qualify as a regulated investment company and distribute all of its taxable and tax-exempt income. Accordingly, no provision for federal income taxes is required in the financial statements.
The Fund may be subject to taxes imposed by countries in which it invests. Such taxes are generally based on income and/or capital gains earned or repatriated. Taxes are accrued based on net investment income, net realized gains and net unrealized appreciation as such income and/or gains are earned. Taxes may also be based on transactions in foreign currency and are accrued based on the value of investments denominated in such currency.
FASB ASC 740-10, "Income Taxes — Overall", sets forth a minimum threshold for financial statement recognition of the benefit of a tax position taken or expected to be taken in a tax return. Management has concluded there are no significant uncertain tax positions that would require recognition in the financial statements. If applicable, the Fund recognizes interest accrued related to unrecognized tax benefits in "Interest Expense" and penalties in "Other Expenses" in the Statement of Operations. The Fund files tax returns with the U.S. Internal Revenue Service, New York and various states. Generally, each of the tax years in the two-year period ended December 31, 2017, remains subject to examination by taxing authorities.
The tax character of distributions paid may differ from the character of distributions shown in the Statements of Changes in Net Assets due to short-term capital gains being treated as ordinary income for tax purposes. The tax character of distributions paid during fiscal years 2017 and 2016 was as follows:
2017
Distributions
Paid From: | | 2016
Distributions
Paid From: | |
Ordinary
Income
(000) | | Paid-in-
Capital
(000) | | Ordinary
Income
(000) | |
| $ | 54 | | | $ | 4 | | | $ | 62 | | |
The amount and character of income and gains to be distributed are determined in accordance with income tax regulations which may differ from GAAP. These book/tax differences are either considered temporary or permanent in nature.
Temporary differences are primarily due to differing book and tax treatments for the timing of the recognition of gains (losses) on certain investment transactions and the timing of the deductibility of certain expenses.
Permanent differences, primarily due to return of capital distributions from real estate investment trusts, and a nondeductible expense, resulted in the following reclassifications among the components of net assets at December 31, 2017:
Distributions
in Excess of Net
Investment
Income
(000) | | Accumulated
Net Realized
Loss
(000) | | Paid-in-
Capital
(000) | |
| $ | (12 | ) | | $ | 13 | | | $ | (1 | ) | |
At December 31, 2017, the Fund had no distributable earnings on a tax basis.
At December 31, 2017, the Fund had available for federal income tax purposes unused short term capital losses of approximately $370,000 that do not have an expiration date.
18
Morgan Stanley Institutional Fund, Inc.
Annual Report — December 31, 2017
Notes to Financial Statements (cont'd)
To the extent that capital loss carryforwards are used to offset any future capital gains realized, no capital gains tax liability will be incurred by the Fund for gains realized and not distributed. To the extent that capital gains are offset, such gains will not be distributed to the shareholders.
I. Credit Facility: The Company and other Morgan Stanley funds participated in a $150,000,000 committed, unsecured revolving line of credit facility (the "Facility") with State Street. This Facility is to be used for temporary emergency purposes or funding of shareholder redemption requests. The interest rate on borrowings is based on the federal funds rate or 1 month LIBOR rate plus a spread. The Facility also has a commitment fee of 0.25% per annum based on the unused portion of the Facility. During the year ended December 31, 2017, the Fund did not have any borrowings under the Facility.
J. Other: At December 31, 2017, the Fund had record owners of 10% or greater. Investment activities of these shareholders could have a material impact on the Fund. The aggregate percentage of such owners was 45.9%.
19
Morgan Stanley Institutional Fund, Inc.
Annual Report — December 31, 2017
Report of Independent Registered Public Accounting Firm
To the Shareholders and Board of Directors of
Morgan Stanley Institutional Fund, Inc. —
Global Core Portfolio
Opinion on the Financial Statements
We have audited the accompanying statement of assets and liabilities of Global Core Portfolio (the "Fund") (one of the funds constituting the Morgan Stanley Institutional Fund, Inc. (the "Company")), including the portfolio of investments, as of December 31, 2017, and the related statement of operations for the year then ended, the statements of changes in net assets and the financial highlights for the year ended December 31, 2017 and the period from May 27, 2016 (commencement of operations) through December 31, 2016 and the related notes (collectively referred to as the "financial statements"). In our opinion, the financial statements present fairly, in all material respects, the financial position of Global Core Portfolio (one of the funds constituting Morgan Stanley Institutional Fund, Inc.) at December 31, 2017, the results of its operations for the year then ended and the changes in its net assets and its financial highlights for the year ended December 31, 2017 and the period from May 27, 2016 (commencement of operations) through December 31, 2016, in conformity with U.S. generally accepted accounting principles.
Basis for Opinion
These financial statements are the responsibility of the Company's management. Our responsibility is to express an opinion on the Fund's financial statements based on our audits. We are a public accounting firm registered with the Public Company Accounting Oversight Board (United States) ("PCAOB") and are required to be independent with respect to the Company in accordance with the U.S. federal securities law and the applicable rules and regulations of the Securities and Exchange Commission and the PCAOB.
We conducted our audits in accordance with the standards of the PCAOB. Those standards require that we plan and perform the audit to obtain reasonable assurance about whether the financial statements are free of material misstatement, whether due to error or fraud. The Company is not required to have, nor were we engaged to perform, an audit of the Company's internal control over financial reporting. As part of our audits, we are required to obtain an understanding of internal control over financial reporting, but not for the purpose of expressing an opinion on the effectiveness of the Company's internal control over financial reporting. Accordingly, we express no such opinion.
Our audits included performing procedures to assess the risks of material misstatement of the financial statements, whether due to error or fraud, and performing procedures that respond to those risks. Such procedures included examining, on a test basis, evidence regarding the amounts and disclosures in the financial statements. Our procedures included confirmation of securities owned as of December 31, 2017 by correspondence with the custodian and others or by other appropriate auditing procedures where replies from others were not received. Our audits also included evaluating the accounting principles used and significant estimates made by management, as well as evaluating the overall presentation of the financial statements. We believe that our audits provide a reasonable basis for our opinion.

We have served as the auditor of one or more Morgan Stanley investment companies since 2000.
Boston, Massachusetts
February 26, 2018
20
Morgan Stanley Institutional Fund, Inc.
Annual Report — December 31, 2017
Federal Tax Notice (unaudited)
For federal income tax purposes, the following information is furnished with respect to the distributions paid by the Fund during its taxable year ended December 31, 2017. For corporate shareholders 10.2% of the dividends qualified for the dividends received deduction.
For federal income tax purposes, the following information is furnished with respect to the Fund's earnings for its taxable year ended December 31, 2017. When distributed, certain earnings may be subject to a maximum tax rate of 15% as provided for by the Jobs and Growth Tax Relief Reconciliation Act of 2003. The Fund designated up to a maximum of approximately $58,000 as taxable at this lower rate.
In January, the Fund provides tax information to shareholders for the preceding calendar year.
21
Morgan Stanley Institutional Fund, Inc.
Annual Report — December 31, 2017
Privacy Notice (unaudited)
MORGAN STANLEY INVESTMENT MANAGEMENT INC.
AN IMPORTANT NOTICE CONCERNING OUR U.S. PRIVACY POLICY
We are required by federal law to provide you with a copy of our privacy policy annually. This policy applies to current and former individual investors in funds managed or sponsored by Morgan Stanley Investment Management Inc. ("MSIM") as well as current and former individual clients of MSIM. This policy is not applicable to partnerships, corporations, trusts or other non-individual clients or investors. Please note that we may amend this policy at any time, and will inform you of any changes as required by law.
WE RESPECT YOUR PRIVACY
We appreciate that you have provided us with your personal financial information. We strive to maintain the privacy of such information while we help you achieve your financial objectives. This Notice describes what non-public personal information we collect about you, why we collect it, when we may share it with others and how certain others may use it. It discusses the steps you may take to limit our sharing of certain information about you to affiliated companies in the Morgan Stanley family of companies ("other Morgan Stanley companies"). It also discloses how you may limit use of certain shared information for marketing purposes by other Morgan Stanley branded companies. Throughout this policy, we refer to the non-public information that personally identifies you or your accounts as "personal information.''
1. WHAT PERSONAL INFORMATION DO WE COLLECT ABOUT YOU?
We obtain personal information from applications and other forms you submit to us, from your dealings with us, from consumer reporting agencies, from our Web sites and from third parties and other sources.
For example:
• We may collect information such as your name, address, e-mail address, telephone/fax numbers, assets, income and investment objectives through subscription documents, applications and other forms you submit to us.
• We may obtain information about account balances, your use of account(s) and the types of products and services you prefer to receive from us through your dealings and transactions with us and other sources.
• We may obtain information about your creditworthiness and credit history from consumer reporting agencies.
• We may collect background information from and through third-party vendors to verify representations you have made and to comply with various regulatory requirements.
• If you interact with us through our public and private Web sites, we may collect information that you provide directly through online communications (such as an e-mail address). We may also collect information about your Internet service provider, your domain name, your computer's operating system and Web browser, your use of our Web sites and your product and service preferences, through the use of "cookies." Please consult the Terms of Use of these sites for more details.
2. WHEN DO WE DISCLOSE PERSONAL INFORMATION WE COLLECT ABOUT YOU?
We may disclose personal information we collect about you to other Morgan Stanley companies and to non-affiliated third parties.
a. Information We Disclose to Other Morgan Stanley Companies.
We may disclose personal information to other Morgan Stanley companies for a variety of reasons, including to manage your account(s) effectively, to service and process your transactions, to let you know about products and services offered by us and other Morgan Stanley companies, to manage our business, and as otherwise required or permitted by law. Offers for products and services from other Morgan Stanley companies are developed under conditions designed to safeguard your personal information.
22
Morgan Stanley Institutional Fund, Inc.
Annual Report — December 31, 2017
Privacy Notice (unaudited) (cont'd)
b. Information We Disclose to Non-affiliated Third Parties.
We do not disclose personal information that we collect about you to non-affiliated third parties except to those who provide marketing services on our behalf, to financial institutions with whom we have joint marketing agreements, and as otherwise required or permitted by law. For example, we may disclose personal information to non-affiliated third parties for servicing and processing transactions, to offer our own products and services, to protect against fraud, for institutional risk control, to respond to judicial process or to perform services on our behalf. When we share personal information with a non-affiliated third party, they are required to limit their use of personal information to the particular purpose for which it was shared and they are not allowed to share personal information with others except to fulfill that limited purpose or as may be permitted or required by law.
3. HOW DO WE PROTECT THE SECURITY AND CONFIDENTIALITY OF PERSONAL INFORMATION WE COLLECT ABOUT YOU?
We maintain physical, electronic and procedural security measures to help safeguard the personal information we collect about you. We have internal policies governing the proper handling of client information. Third parties that provide support or marketing services on our behalf may also receive personal information, and we require them to adhere to confidentiality standards with respect to such information.
4. HOW CAN YOU LIMIT THE SHARING OF CERTAIN TYPES OF PERSONAL INFORMATION WITH OTHER MORGAN STANLEY COMPANIES?
We offer you choices as to whether we share with other Morgan Stanley companies the personal information that was collected to determine your eligibility for products and services you request ("eligibility information"). Eligibility information does not include your identification information or personal information pertaining to our transactions or experiences with you. Please note that, even if you direct us not to share eligibility information with other Morgan Stanley companies ("opt-out"), we may still share personal information, including eligibility information, with those companies in circumstances excluded from the opt-out under applicable law, such as to process transactions or to service your account.
5. HOW CAN YOU LIMIT THE USE OF CERTAIN TYPES OF PERSONAL INFORMATION BY OTHER MORGAN STANLEY COMPANIES FOR MARKETING?
By following the opt-out instructions in Section 6 below, you may limit other Morgan Stanley branded companies from marketing their products or services to you based on personal information we disclose to them. This information may include, for example, your income and account history with us. Please note that, even if you choose to limit Other Morgan Stanley Companies from using personal information about you that we may share with them for marketing their products and services to you, Other Morgan Stanley Companies may use your personal information that they obtain from us to market to you in circumstances permitted by law, such as if the Other Morgan Stanley Company has its own relationship with you.
6. HOW CAN YOU SEND US AN OPT-OUT INSTRUCTION?
If you wish to limit our sharing of eligibility information about you with other Morgan Stanley companies or other Morgan Stanley companies' use of personal information for marketing purposes, as described in this notice, you may do so by:
• Calling us at (800) 548-7786
Monday–Friday between 8a.m. and 6p.m.(EST)
• Writing to us at the following address:
DST Asset Manager Solutions, Inc.
c/o Privacy Coordinator
P.O. Box 219804
Kansas City, Missouri 64121
23
Morgan Stanley Institutional Fund, Inc.
Annual Report — December 31, 2017
Privacy Notice (unaudited) (cont'd)
Your written request should include your name, address, telephone number and account number(s) to which the opt-out applies and whether you are opting out with respect to sharing of eligibility information (Section 4 above), or if information used for Marketing (Section 5 above) or both. Written opt-out requests should not be sent with any other correspondence. In order to process your request, we require that the request be provided by you directly and not through a third party.
Your opt-out preference will remain in effect with respect to this policy (as it may be amended) until you notify us otherwise. If you have a joint account, your direction for us not to share this information with other Morgan Stanley companies and for those other Morgan Stanley companies not to use your personal information for marketing will be applied to all account holders on that account. Please understand that if you limit our sharing or our affiliated companies' use of personal information, you and any joint account holder(s) may not receive information about Morgan Stanley products and services, including products or services that could help you manage your financial resources and achieve your investment objectives.
7. WHAT IF AN AFFILIATED COMPANY BECOMES A NON-AFFILIATED THIRD PARTY?
If, at any time in the future, an affiliated company becomes a non-affiliated third party, further disclosures of personal information made to the former affiliated company will be limited to those described in Section 2(b) above relating to non-affiliated third parties. If you elected under Section 6 to limit disclosures we make to affiliated companies, or use of personal information by affiliated companies, your election will not apply to use by any former affiliated company of your personal information in their possession once it becomes a non-affiliated third party.
SPECIAL NOTICE TO RESIDENTS OF VERMONT
The following section supplements our policy with respect to our individual clients who have a Vermont address and supersedes anything to the contrary in the above policy with respect to those clients only.
The state of Vermont requires financial institutions to obtain your consent prior to sharing personal information that they collect about you with affiliated companies and non-affiliated third parties other than in certain limited circumstances. Except as permitted by law, we will not share personal information we collect about you with non-affiliated third parties or other Morgan Stanley companies unless you provide us with your written consent to share such information ("opt-in").
If you wish to receive offers for investment products and services offered by or through other Morgan Stanley companies, please notify us in writing at the following address:
DST Asset Manager Solutions, Inc.
c/o Privacy Coordinator
P.O. Box 219804
Kansas City, Missouri 64121
Your authorization should include your name, address, telephone number and account number(s) to which the opt-in applies and should not be sent with any other correspondence. In order to process your authorization, we require that the authorization be provided by you directly and not through a third party.
SPECIAL NOTICE TO RESIDENTS OF CALIFORNIA
The following section supplements our policy with respect to our individual clients who have a California address and supersedes anything to the contrary in the above policy with respect to those clients only.
In response to a California law, if your account has a California home address, your personal information will not be disclosed to non-affiliated third parties except as permitted by applicable California law, and we will limit sharing such information with our affiliates to comply with California privacy laws that apply to us.
24
Morgan Stanley Institutional Fund, Inc.
Annual Report — December 31, 2017
Director and Officer Information (unaudited)
Independent Directors:
Name, Age and Address of
Independent Director | | Position(s)
Held with
Registrant | | Length of Time
Served* | | Principal Occupation(s) During Past 5 Years
and Other Relevant Professional Experience | | Number of
Portfolios in
Fund Complex
Overseen by
Independent
Director** | | Other Directorships
Held by Independent
Director*** | |
Frank L. Bowman (73)
c/o Perkins Coie LLP
Counsel to the Independent
Directors
30 Rockefeller Plaza
New York, NY 10112 | | Director | | Since
August
2006 | | President, Strategic Decisions, LLC (consulting) (since February 2009); Director or Trustee of various Morgan Stanley Funds (since August 2006); Chairperson of the Compliance and Insurance Committee (since October 2015); formerly, Chairperson of the Insurance Sub-Committee of the Compliance and Insurance Committee (2007-2015); served as President and Chief Executive Officer of the Nuclear Energy Institute (policy organization) (February 2005-November 2008); retired as Admiral, U.S. Navy after serving over 38 years on active duty including 8 years as Director of the Naval Nuclear Propulsion Program in the Department of the Navy and the U.S. Department of Energy (1996-2004); served as Chief of Naval Personnel (July 1994-September 1996) and on the Joint Staff as Director of Political Military Affairs (June 1992-July 1994); knighted as Honorary Knight Commander of the Most Excellent Order of the British Empire; awarded the Officier de l'Orde National du Mérite by the French Government; elected to the National Academy of Engineering (2009). | | | 88 | | | Director of BP p.l.c.; Director of Naval and Nuclear Technologies LLP; Director Emeritus of the Armed Services YMCA; Director of the U.S. Naval Submarine League; Member of the National Security Advisory Council of the Center for U.S. Global Engagement and a member of the CNA Military Advisory Board; Trustee of Fairhaven United Methodist Church; and Director of other various non-profit organizations. | |
Kathleen A. Dennis (64)
c/o Perkins Coie LLP
Counsel to the Independent Directors
30 Rockefeller Plaza
New York, NY 10112 | | Director | | Since
August
2006 | | President, Cedarwood Associates (mutual fund and investment management consulting) (since July 2006); Chairperson of the Liquidity and Alternatives Sub-Committee of the Investment Committee (since October 2006) and Director or Trustee of various Morgan Stanley Funds (since August 2006); formerly, Senior Managing Director of Victory Capital Management (1993-2006). | | | 89 | | | Director of various non-profit organizations. | |
Nancy C. Everett (62)
c/o Perkins Coie LLP
Counsel to the Independent Directors
30 Rockefeller Plaza
New York, NY 10112 | | Director | | Since
January
2015 | | Chief Executive Officer, Virginia Commonwealth University Investment Company (since November 2015); Owner, OBIR, LLC (institutional investment management consulting) (since June 2014); formerly, Managing Director, BlackRock Inc. (February 2011-December 2013); and Chief Executive Officer, General Motors Asset Management (a/k/a Promark Global Advisors, Inc.) (June 2005-May 2010). | | | 90 | | | Formerly, Member of Virginia Commonwealth University School of Business Foundation (2005-2016); Member of Virginia Commonwealth University Board of Visitors (2013-2015); Member of Committee on Directors for Emerging Markets Growth Fund, Inc. (2007-2010); Chairperson of Performance Equity Management, LLC (2006-2010); and Chairperson, GMAM Absolute Return Strategies Fund, LLC (2006-2010). | |
25
Morgan Stanley Institutional Fund, Inc.
Annual Report — December 31, 2017
Director and Officer Information (unaudited) (cont'd)
Independent Directors: (cont'd)
Name, Age and Address of
Independent Director | | Position(s)
Held with
Registrant | | Length of Time
Served* | | Principal Occupation(s) During Past 5 Years
and Other Relevant Professional Experience | | Number of
Portfolios in
Fund Complex
Overseen by
Independent
Director** | | Other Directorships
Held by Independent
Director*** | |
Jakki L. Haussler (60)
c/o Perkins Coie LLP
Counsel to the Independent Directors
30 Rockefeller Plaza
New York, NY 10112 | | Director | | Since
January
2015 | | Chairman and Chief Executive Officer, Opus Capital Group (since January 1996); formerly, Director, Capvest Venture Fund, LP (May 2000-December 2011); Partner, Adena Ventures, LP (July 1999-December 2010); Director, The Victory Funds (February 2005-July 2008). | | | 90 | | | Director of Cincinnati Bell Inc. and Member, Audit Committee and Compensation Committee; Director of Northern Kentucky University Foundation and Member, Investment Committee; Member of Chase College of Law Transactional Law Practice Center Board of Advisors; Director of Best Transport; Director of Chase College of Law Board of Visitors; formerly, Member, University of Cincinnati Foundation Investment Committee; Member, Miami University Board of Visitors (2008-2011); Trustee of Victory Funds (2005-2008) and Chairman, Investment Committee (2007-2008) and Member, Service Provider Committee (2005-2008). | |
Dr. Manuel H. Johnson (68)
c/o Johnson Smick
International, Inc.
220 I Street, NE — Suite 200
Washington, D.C. 20002 | | Director | | Since
July
1991 | | Senior Partner, Johnson Smick International, Inc. (consulting firm); Chairperson of the Investment Committee (since October 2006) and Director or Trustee of various Morgan Stanley Funds (since July 1991); Co-Chairman and a founder of the Group of Seven Council (G7C) (international economic commission); formerly, Chairperson of the Audit Committee (July 1991-September 2006), Vice Chairman of the Board of Governors of the Federal Reserve System and Assistant Secretary of the U.S. Treasury. | | | 88 | | | Director of NVR, Inc. (home construction). | |
Joseph J. Kearns (75)
c/o Kearns & Associates LLC
46 E Peninsula Center #385
Rolling Hills Estates, CA 90274-3712 | | Director | | Since
August
1994 | | Senior Adviser, Kearns & Associates LLC (investment consulting); Chairperson of the Audit Committee (since October 2006) and Director or Trustee of various Morgan Stanley Funds (since August 1994); formerly, Deputy Chairperson of the Audit Committee (July 2003-September 2006) and Chairperson of the Audit Committee of various Morgan Stanley Funds (since August 1994); CFO of the J. Paul Getty Trust. | | | 89 | | | Prior to August 10, 2016, Director of Electro Rent Corporation (equipment leasing); Prior to December 31, 2013, Director of The Ford Family Foundation. | |
26
Morgan Stanley Institutional Fund, Inc.
Annual Report — December 31, 2017
Director and Officer Information (unaudited) (cont'd)
Independent Directors: (cont'd)
Name, Age and Address of
Independent Director | | Position(s)
Held with
Registrant | | Length of Time
Served* | | Principal Occupation(s) During Past 5 Years
and Other Relevant Professional Experience | | Number of
Portfolios in
Fund Complex
Overseen by
Independent
Director** | | Other Directorships
Held by Independent
Director*** | |
Michael F. Klein (59)
c/o Perkins Coie LLP
Counsel to the Independent Directors
30 Rockefeller Plaza
New York, NY 10112 | | Director | | Since
August
2006 | | Managing Director, Aetos Capital, LLC (since March 2000); Co-President, Aetos Alternatives Management, LLC (since January 2004) and Co-Chief Executive Officer of Aetos Capital LLC (since August 2013); Chairperson of the Fixed Income Sub-Committee of the Investment Committee (since October 2006) and Director or Trustee of various Morgan Stanley Funds (since August 2006); formerly, Managing Director, Morgan Stanley & Co. Inc. and Morgan Stanley Dean Witter Investment Management, President, various Morgan Stanley Funds (June 1998-March 2000) and Principal, Morgan Stanley & Co. Inc. and Morgan Stanley Dean Witter Investment Management (August 1997-December 1999). | | | 88 | | | Director of certain investment funds managed or sponsored by Aetos Capital, LLC; Director of Sanitized AG and Sanitized Marketing AG (specialty chemicals). | |
Patricia Maleski (57)
c/o Perkins Coie LLP
Counsel to the Independent Directors
30 Rockefeller Plaza
New York, NY 10112 | | Director | | Since
January
2017 | | Managing Director, JPMorgan Asset Management (2004-2016); Oversight and Control Head of Fiduciary and Conflicts of Interest Program (2015-2016); Chief Control Officer-Global Asset Management (2013-2015); President, JPMorgan Funds (2010-2013); Chief Administrative Officer (2004-2013); various other positions including Treasurer and Board Liaison (since 2001). | | | 90 | | | None. | |
Michael E. Nugent (81)
522 Fifth Avenue
New York, NY 10036 | | Chair of the Board and Director | | Chair of the Boards since July 2006 and Director since July 1991 | | Chair of the Boards of various Morgan Stanley Funds (since July 2006); Chairperson of the Closed-End Fund Committee (since June 2012) and Director or Trustee of various Morgan Stanley Funds (since July 1991); formerly, Chairperson of the Insurance Committee (until July 2006); General Partner, Triumph Capital, L.P. (private investment partnership) (1988-2013). | | | 88 | | | None. | |
W. Allen Reed (70)
c/o Perkins Coie LLP
Counsel to the Independent Directors
30 Rockefeller Plaza
New York, NY 10112 | | Director | | Since
August
2006 | | Chairperson of the Equity Sub-Committee of the Investment Committee (since October 2006) and Director or Trustee of various Morgan Stanley Funds (since August 2006); formerly, President and CEO of General Motors Asset Management; Chairman and Chief Executive Officer of the GM Trust Bank and Corporate Vice President of General Motors Corporation (August 1994-December 2005). | | | 89 | | | Director of Legg Mason, Inc.; formerly, Director of the Auburn University Foundation (2010-2015). | |
Fergus Reid (85)
c/o Joe Pietryka, Inc.
85 Charles Colman Blvd.
Pawling, NY 12564 | | Director | | Since
June
1992 | | Chairman, Joe Pietryka, Inc.; Chairperson of the Governance Committee and Director or Trustee of various Morgan Stanley Funds (since June 1992). | | | 89 | | | Formerly, Trustee and Director of certain investment companies in the JP Morgan Fund Complex managed by JP Morgan Investment Management Inc. (1987-2012). | |
* This is the earliest date the Director began serving the Morgan Stanley Funds. Each Director serves an indefinite term, until his or her successor is elected.
** The Fund Complex includes (as of December 31, 2017) all open-end and closed-end funds (including all of their portfolios) advised by Morgan Stanley Investment Management Inc. (the "Adviser") and any funds that have an adviser that is an affiliated person of the Adviser (including, but not limited to, Morgan Stanley AIP GP LP).
*** This includes any directorships at public companies and registered investment companies held by the Director at any time during the past five years.
27
Morgan Stanley Institutional Fund, Inc.
Annual Report — December 31, 2017
Director and Officer Information (unaudited) (cont'd)
Executive Officers:
Name, Age and Address of Executive Officer | | Position(s) Held
with
Registrant | | Length of Time
Served* | | Principal Occupation(s) During Past 5 Years | |
John H. Gernon (54)
522 Fifth Avenue
New York, NY 10036 | | President and Principal Executive Officer | | Since
September
2013 | | President and Principal Executive Officer of the Equity and Fixed Income Funds and the Morgan Stanley AIP Funds (since September 2013) and the Liquidity Funds and various money market funds (since May 2014) in the Fund Complex; Managing Director of the Adviser; Head of Product (since 2006). | |
Timothy J. Knierim (58)
522 Fifth Avenue
New York, NY 10036 | | Chief Compliance Officer | | Since
December
2016 | | Managing Director of the Adviser and various entities affiliated with the Adviser; Chief Compliance Officer of various Morgan Stanley Funds and the Adviser (since December 2016) and Chief Compliance Officer of Morgan Stanley AIP GP LP (since 2014). Formerly, Managing Director and Deputy Chief Compliance Officer of the Adviser (2014-2016); and formerly, Chief Compliance Officer of Prudential Investment Management, Inc. (2007-2014). | |
Francis J. Smith (52)
522 Fifth Avenue
New York, NY 10036 | | Treasurer and Principal Financial Officer | | Treasurer since July 2003 and Principal Financial Officer since September 2002 | | Managing Director of the Adviser and various entities affiliated with the Adviser; Treasurer (since July 2003) and Principal Financial Officer of various Morgan Stanley Funds (since September 2002). | |
Mary E. Mullin (50)
522 Fifth Avenue
New York, NY 10036 | | Secretary | | Since
June
1999 | | Managing Director of the Adviser; Secretary of various Morgan Stanley Funds (since June 1999). | |
Michael J. Key (38)
522 Fifth Avenue
New York, NY 10036 | | Vice President | | Since
June
2017 | | Vice President of the Equity and Fixed Income Funds, Liquidity Funds, various money market funds and the Morgan Stanley AIP Funds in the Fund Complex (since June 2017); Executive Director of the Adviser; Head of Product Development for Equity and Fixed Income Funds (since August 2013). | |
* This is the earliest date the officer began serving the Morgan Stanley Funds. Each officer serves a one-year term, until his or her successor is elected and qualifies.
28
Morgan Stanley Institutional Fund, Inc.
Annual Report — December 31, 2017
Adviser and Administrator
Morgan Stanley Investment Management Inc.
522 Fifth Avenue
New York, New York 10036
Distributor
Morgan Stanley Distribution, Inc.
522 Fifth Avenue
New York, New York 10036
Dividend Disbursing and Transfer Agent
DST Asset Manager Solutions, Inc.
2000 Crown Colony Drive
Quincy, Massachusetts 02169
Custodian
State Street Bank and Trust Company
One Lincoln Street
Boston, Massachusetts 02111
Legal Counsel
Dechert LLP
1095 Avenue of the Americas
New York, New York 10036
Counsel to the Independent Directors
Perkins Coie LLP
30 Rockefeller Plaza
New York, New York 10112
Independent Registered Public Accounting Firm
Ernst & Young LLP
200 Clarendon Street
Boston, Massachusetts 02116
Reporting to Shareholders
Each Morgan Stanley Fund provides a complete schedule of portfolio holdings in its semi-annual and annual reports within 60 days of the end of the fund's second and fourth fiscal quarters. The semi-annual and annual reports are filed electronically with the Securities and Exchange Commission (SEC) on Form N-CSRS and Form N-CSR, respectively. Morgan Stanley also delivers the semi-annual and annual reports to fund shareholders and makes these reports available on its public website, www.morganstanley.com/im. Each Morgan Stanley fund also files a complete schedule of portfolio holdings with the SEC for the fund's first and third fiscal quarters on Form N-Q. Morgan Stanley does not deliver the reports for the first and third fiscal quarters to shareholders, nor are the reports posted to the Morgan Stanley public website. You may, however, obtain the Form N-Q filings (as well as the Form N-CSR and N-CSRS filings) by accessing the SEC's website, www.sec.gov. You may also review and copy them at the SEC's Public Reference Room in Washington, DC. Information on the operation of the SEC's Public Reference Room may be obtained by calling the SEC toll free at 1 (800) SEC-0330. You can also request copies of these materials, upon payment of a duplicating fee, by electronic request at the SEC's email address (publicinfo@sec.gov) or by writing to the SEC's Public Reference Section, Washington, D.C. 20549-1520.
Proxy Voting Policies and Procedures and Proxy Voting Record
You may obtain a copy of the Company's Proxy Voting Policy and Procedures and information regarding how the Company voted proxies relating to portfolio securities during the most recent twelve-month period ended June 30, without charge, upon request, by calling toll free 1 (800) 548-7786 or by visiting our website at www.morganstanley.com/im. This information is also available on the SEC's website at www.sec.gov.
This report is authorized for distribution only when preceded or accompanied by a prospectus or summary prospectus of the applicable Fund of Morgan Stanley Institutional Fund, Inc., which describes in detail the Fund's investment policies, risks, fees and expenses. Please read the prospectus carefully before you invest or send money. For additional information, including information regarding the investments comprising the Fund, please visit our website at www.morganstanley.com/im or call toll free 1 (800) 548-7786.
29
Printed in U.S.A.
This Report has been prepared for shareholders and may be distributed to others only if preceded or accompanied by a current prospectus.
Morgan Stanley Investment Management Inc.
522 Fifth Avenue
New York, New York 10036
© 2018 Morgan Stanley. Morgan Stanley Distribution, Inc.

IFIGCPANN
2007729 EXP. 02.28.19

Morgan Stanley Institutional Fund, Inc.
Global Discovery Portfolio
Annual Report
December 31, 2017

Morgan Stanley Institutional Fund, Inc.
Annual Report — December 31, 2017
Shareholders' Letter | | | 2 | | |
Expense Example | | | 3 | | |
Investment Overview | | | 4 | | |
Portfolio of Investments | | | 6 | | |
Statement of Assets and Liabilities | | | 9 | | |
Statement of Operations | | | 11 | | |
Statements of Changes in Net Assets | | | 12 | | |
Financial Highlights | | | 14 | | |
Notes to Financial Statements | | | 18 | | |
Report of Independent Registered Public Accounting Firm | | | 30 | | |
Federal Tax Notice | | | 31 | | |
Privacy Notice | | | 32 | | |
Director and Officer Information | | | 35 | | |
This report is authorized for distribution only when preceded or accompanied by a prospectus or summary prospectus of the applicable Fund of Morgan Stanley Institutional Fund, Inc. To receive a prospectus and/or statement of additional information (SAI), which contains more complete information such as investment objectives, charges, expenses, policies for voting proxies, risk considerations, and describes in detail each of the Fund's investment policies to the prospective investor, please call toll free 1 (800) 548-7786. Please read the prospectuses carefully before you invest or send money.
Additionally, you can access information about the Fund, including performance, characteristics, and investment team commentary, through Morgan Stanley Investment Management's website: www.morganstanley.com/im.
Market forecasts provided in this report may not necessarily come to pass. There is no guarantee that any sectors mentioned will continue to perform as discussed herein or that securities in such sectors will be held by the Fund in the future. There is no assurance that a fund will achieve its investment objective. Funds are subject to market risk, which is the possibility that market values of securities owned by the Fund will decline and, therefore, the value of the Fund's shares may be less than what you paid for them. Accordingly, you can lose money investing in this Fund. Please see the prospectus for more complete information on investment risks.
1
Morgan Stanley Institutional Fund, Inc.
Annual Report — December 31, 2017
Shareholders' Letter (unaudited)
Dear Shareholders,
We are pleased to provide this Annual report, in which you will learn how your investment in Global Discovery Portfolio (the "Fund") performed during the latest twelve-month period.
Morgan Stanley Investment Management is a client-centric, investor-led organization. Our global presence, intellectual capital, and breadth of products and services enable us to partner with investors to meet the evolving challenges of today's financial markets. We aim to deliver superior investment service and to empower our clients to make the informed decisions that help them reach their investment goals.
As always, we thank you for selecting Morgan Stanley Investment Management, and look forward to working with you in the months and years ahead.
Sincerely,

John H. Gernon
President and Principal Executive Officer
January 2018
2
Morgan Stanley Institutional Fund, Inc.
Annual Report — December 31, 2017
Expense Example (unaudited)
Global Discovery Portfolio
As a shareholder of the Fund, you incur two types of costs: (1) transactional costs; and (2) ongoing costs, which may include advisory fees, administration fees, distribution and shareholder services fees and other Fund expenses. This example is intended to help you understand your ongoing costs (in dollars) of investing in the Fund and to compare these costs with the ongoing costs of investing in other mutual funds.
This example is based on an investment of $1,000 invested at the beginning of the six-month period ended December 31, 2017 and held for the entire six-month period.
Actual Expenses
The table below provides information about actual account values and actual expenses. You may use the information in this table, together with the amount you invested, to estimate the expenses that you paid over the period. Simply divide your account value by $1,000 (for example, an $8,600 account value divided by $1,000 = 8.6), then multiply the result by the number in the table under the heading entitled "Actual Expenses Paid During Period" to estimate the expenses you paid on your account during this period.
Hypothetical Example for Comparison Purposes
The table below provides information about hypothetical account values and hypothetical expenses based on the Fund's actual expense ratio and an assumed rate of return of 5% per year before expenses, which is not the Fund's actual return. The hypothetical account values and expenses may not be used to estimate the actual ending account balance or expenses you paid for the period. You may use this information to compare the ongoing costs of investing in the Fund and other funds. To do so, compare this 5% hypothetical example with the 5% hypothetical examples that appear in the shareholder reports of the other funds.
Please note that the expenses shown in the table are meant to highlight your ongoing costs only and do not reflect any transactional costs, such as sales charges (loads). Therefore, the information for each class in the table is useful in comparing ongoing costs only, and will not help you determine the relative total costs of owning different funds. In addition, if these transactional costs were included, your costs would have been higher.
| | | Beginning
Account
Value
7/1/17 | | Actual Ending
Account
Value
12/31/17 | | Hypothetical
Ending Account
Value | | Actual
Expenses
Paid
During
Period* | | Hypothetical
Expenses Paid
During Period* | | Net
Expense
Ratio
During
Period** | |
Global Discovery Portfolio Class I | | $ | 1,000.00 | | | $ | 1,090.50 | | | $ | 1,018.45 | | | $ | 7.06 | | | $ | 6.82 | | | | 1.34 | % | |
Global Discovery Portfolio Class A | | | 1,000.00 | | | | 1,088.50 | | | | 1,016.64 | | | | 8.95 | | | | 8.64 | | | | 1.70 | | |
Global Discovery Portfolio Class L | | | 1,000.00 | | | | 1,085.60 | | | | 1,014.17 | | | | 11.51 | | | | 11.12 | | | | 2.19 | | |
Global Discovery Portfolio Class C | | | 1,000.00 | | | | 1,083.90 | | | | 1,012.85 | | | | 12.87 | | | | 12.43 | | | | 2.45 | | |
* Expenses are calculated using each Fund Class' annualized net expense ratio (as disclosed), multiplied by the average account value over the period, and multiplied by 184/365 (to reflect the most recent one-half year period).
** Annualized.
3
Morgan Stanley Institutional Fund, Inc.
Annual Report — December 31, 2017
Investment Overview (unaudited)
Global Discovery Portfolio
The Fund seeks long-term capital appreciation.
Performance
For the year ended December 31, 2017, the Fund's Class I shares had a total return based on net asset value and reinvestment of distributions per share of 25.39%, net of fees. The Fund's Class I shares outperformed the Fund's benchmark, the MSCI All Country World Index (the "Index"), which returned 23.97%.
Please keep in mind that double-digit returns are highly unusual and cannot be sustained. Investors should also be aware that these returns were primarily achieved during favorable market conditions.
Factors Affecting Performance
• Better-than-expected global economic growth and strong corporate profits provided a positive backdrop for global equity markets. Central bank policy remained largely accommodative as inflation stayed muted, recoveries continued in U.S., Europe and Japan, and China's economy stabilized. Although the U.S. Federal Reserve raised its interest rate three times during 2017, interest rate levels were still historically low, further boosting demand for equities. Political risk abated as key elections across Europe voted in more mainstream candidates, and trade negotiation fears also diminished somewhat, although the North American Free Trade Agreement ("NAFTA") and Brexit talks are ongoing. In the U.S., sweeping tax reforms were signed into law in December 2017, fueling a sharp rally in U.S. share prices at year-end. These events helped global equities shrug off geopolitical tensions in North Korea and the Middle East, and natural disasters in the U.S., to end the year sharply higher.
• The long-term investment horizon and conviction-weighted investment approach embraced by the team can result in periods of performance deviation from the benchmark and peers. In this reporting period, stock selection contributed to the Fund's outperformance, while sector allocations modestly detracted.
• All sectors in the Index showed positive performance for the year. The information technology ("IT") sector led, followed by the materials and industrials sectors. Conversely, the
energy, telecommunication services and utilities sectors were the biggest laggards in the Index.
• The health care sector contributed the largest relative gain. Both stock selection and an overweight allocation in the sector were beneficial, led by the portfolio's holding in a Danish pharmaceutical company.
• Stock selection and an overweight exposure in the industrials sector added to relative results. A leading provider of prepaid corporate services, which is based in France, was the portfolio's top contributor to in the industrials sector.
• Stock selection in financials was favorable to performance, with standout performance from a Brazilian car insurance provider.
• At the sector level, the information technology sector was the only detractor from performance in the period. Both stock selection and an underweight allocation dampened relative performance. The Fund's underperformance was driven by an out-of-benchmark holding in a French commerce marketing technology leader, which helps internet retailers retarget online advertising toward consumers, as well as having less exposure to the overall IT sector, the Index's top-performing sector.
Management Strategies
• There were no changes to our bottom-up investment process during the period. We continued to look for franchises with sustainable competitive advantages. We typically favor companies with strong cash generation, attractive returns on capital, hard-to-replicate assets and a favorable risk/reward profile. Our emphasis is on long-term results, and hence short-term market events are not as meaningful in the stock selection process.
4
Morgan Stanley Institutional Fund, Inc.
Annual Report — December 31, 2017
Investment Overview (unaudited) (cont'd)
Global Discovery Portfolio
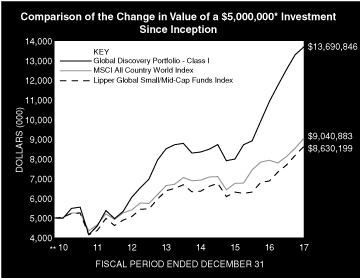
* Minimum Investment for Class I shares
** Commenced Operations on December 28, 2010.
In accordance with SEC regulations, the Fund's performance shown assumes that all recurring fees (including management fees) were deducted and all dividends and distributions were reinvested. The performance of Class A, L and C shares will vary from the performance of Class I shares and will be impacted by additional fees assessed to those classes.
Performance Compared to the MSCI All Country World Index(1) and the Lipper Global Small/Mid-Cap Funds Index(2)
| | Period Ended December 31, 2017
Total Returns(3) | |
| | | | Average Annual | |
| | One
Year | | Five
Years | | Ten
Years | | Since
Inception(6) | |
Fund — Class I Shares
w/o sales charges(4) | | | 25.39 | % | | | 17.72 | % | | | — | | | | 15.46 | % | |
Fund — Class A Shares
w/o sales charges(4) | | | 24.89 | | | | 17.33 | | | | — | | | | 15.11 | | |
Fund — Class A Shares with
maximum 5.25% sales charges(4) | | | 18.34 | | | | 16.06 | | | | — | | | | 14.23 | | |
Fund — Class L Shares
w/o sales charges(4) | | | 24.26 | | | | 16.74 | | | | — | | | | 14.52 | | |
Fund — Class C Shares
w/o sales charges(5) | | | 23.89 | | | | — | | | | — | | | | 16.90 | | |
Fund — Class C Shares with
maximum 1.00% deferred
sales charges(5) | | | 22.89 | | | | — | | | | — | | | | 16.90 | | |
MSCI All Country World Index | | | 23.97 | | | | 10.80 | | | | — | | | | 8.82 | | |
Lipper Global Small/Mid-Cap
Funds Index | | | 25.38 | | | | 11.22 | | | | — | | | | 8.10 | | |
Performance data quoted represents past performance, which is no guarantee of future results, and current performance may be lower or higher than the figures shown. Performance assumes that all dividends and distributions, if any, were reinvested. For the most recent month-end performance figures, please visit www.morganstanley.com/im. Investment return and principal value will fluctuate so that Fund shares, when redeemed, may be worth more or less than their original cost. Total returns do not reflect the deduction of taxes that a shareholder would pay on Fund distributions or the redemption of Fund shares. Performance of share classes will vary due to difference in sales charges and expenses.
(1) The MSCI All Country World Index (ACWI) is a free float-adjusted market capitalization weighted index designed to measure the equity market performance of developed and emerging markets. The term "free float" represents the portion of shares outstanding that are deemed to be available for purchase in the public equity markets by investors. The Index is unmanaged and its returns do not include any sales charges or fees. Such costs would lower performance. It is not possible to invest directly in an index.
(2) The Lipper Global Small/Mid Cap Funds Index is an equally weighted performance index of the largest qualifying funds (based on net assets) in the Lipper Global Small/Mid-Cap Funds classification. The Index, which is adjusted for capital gains distributions and income dividends, is unmanaged and should not be considered an investment. There are currently 30 funds represented in this Index. As of the date of this report, the Fund is in the Lipper Global Small/Mid-Cap Funds classification.
(3) Total returns for the Fund reflect fees waived and expenses reimbursed, if applicable, by the Adviser. Without such waivers and reimbursements, total returns would have been lower.
(4) Commenced operations on December 28, 2010.
(5) Commenced offering on April 30, 2015.
(6) For comparative purposes, average annual since inception returns listed for the Indexes refer to the inception date Class I of the Fund, not the inception of the Index.
5
Morgan Stanley Institutional Fund, Inc.
Annual Report — December 31, 2017
Portfolio of Investments
Global Discovery Portfolio
| | | Shares | | Value
(000) | |
Common Stocks (92.0%) | |
Brazil (4.9%) | |
JHSF Participacoes SA | | | 917,814 | | | $ | 484 | | |
Ouro Fino Saude Animal Participacoes SA | | | 144,651 | | | | 1,047 | | |
Porto Seguro SA | | | 395,401 | | | | 4,331 | | |
| | | | 5,862 | | |
Canada (6.4%) | |
Agrium, Inc. | | | 67,048 | | | | 7,712 | | |
Denmark (4.0%) | |
Novo Nordisk A/S Series B | | | 90,143 | | | | 4,845 | | |
France (12.0%) | |
Christian Dior SE | | | 22,988 | | | | 8,390 | | |
Criteo SA ADR (a) | | | 84,150 | | | | 2,190 | | |
Edenred | | | 131,542 | | | | 3,811 | | |
| | | | 14,391 | | |
Germany (2.8%) | |
ThyssenKrupp AG | | | 73,469 | | | | 2,133 | | |
Vapiano SE (a)(b) | | | 43,354 | | | | 1,261 | | |
| | | | 3,394 | | |
Italy (1.6%) | |
Gima TT SpA (a)(b) | | | 20,377 | | | | 406 | | |
Tamburi Investment Partners SpA | | | 224,090 | | | | 1,493 | | |
| | | | 1,899 | | |
New Zealand (0.3%) | |
Kathmandu Holdings Ltd. | | | 172,414 | | | | 296 | | |
United Kingdom (8.4%) | |
BBA Aviation PLC | | | 323,062 | | | | 1,525 | | |
Clarkson PLC | | | 52,701 | | | | 2,035 | | |
Whitbread PLC | | | 120,734 | | | | 6,520 | | |
| | | | 10,080 | | |
United States (51.6%) | |
Autoliv, Inc. | | | 37,703 | | | | 4,792 | | |
Biogen, Inc. (a) | | | 6,841 | | | | 2,179 | | |
CarMax, Inc. (a) | | | 149,774 | | | | 9,605 | | |
Container Store Group, Inc. (The) (a) | | | 47,759 | | | | 226 | | |
Dillard's, Inc., Class A (c) | | | 52,278 | | | | 3,139 | | |
Dril-Quip, Inc. (a) | | | 33,921 | | | | 1,618 | | |
Dropbox, Inc. (a)(d)(e)(f)
(acquisition cost — $25; acquired 5/1/12) | | | 2,743 | | | | 25 | | |
Habit Restaurants, Inc. (The) (a) | | | 4,964 | | | | 47 | | |
Harley-Davidson, Inc. | | | 188,621 | | | | 9,597 | | |
Mosaic Co. (The) | | | 152,767 | | | | 3,920 | | |
Potbelly Corp. (a) | | | 154,574 | | | | 1,901 | | |
RenaissanceRe Holdings Ltd. | | | 18,354 | | | | 2,305 | | |
Time Warner, Inc. | | | 130,179 | | | | 11,908 | | |
Ulta Salon Cosmetics & Fragrance, Inc. | | | 12,218 | | | | 2,733 | | |
Welbilt, Inc. (a) | | | 325,817 | | | | 7,660 | | |
YogaWorks, Inc. (a) | | | 62,461 | | | | 177 | | |
| | | | 61,832 | | |
Total Common Stocks (Cost $99,635) | | | 110,311 | | |
| | | Shares | | Value
(000) | |
Preferred Stocks (0.4%) | |
India (0.2%) | |
Flipkart Online Services Pvt Ltd. Series D (a)(d)(e)(f)
(acquisition cost — $44; acquired 10/4/13) | | | 1,910 | | | $ | 168 | | |
United States (0.2%) | |
Airbnb, Inc. Series D (a)(d)(e)(f)
(acquisition cost — $78; acquired 4/16/14) | | | 1,917 | | | | 203 | | |
DOMO, Inc. (a)(d)(e)(f)
(acquisition cost — $37;
acquired 1/31/14 — 2/7/14) | | | 9,082 | | | | 24 | | |
Lookout, Inc. Series F (a)(d)(e)(f)
(acquisition cost — $73; acquired 6/17/14) | | | 6,374 | | | | 13 | | |
Palantir Technologies, Inc. Series G (a)(d)(e)(f)
(acquisition cost — $9; acquired 7/19/12) | | | 2,935 | | | | 9 | | |
Palantir Technologies, Inc. Series H (a)(d)(e)(f)
(acquisition cost — $6; acquired 10/25/13) | | | 1,572 | | | | 6 | | |
Palantir Technologies, Inc. Series H1 (a)(d)(e)(f)
(acquisition cost — $6; acquired 10/25/13) | | | 1,572 | | | | 6 | | |
| | | | 261 | | |
Total Preferred Stocks (Cost $253) | | | 429 | | |
Convertible Preferred Stock (0.0%) | |
United States (0.0%) | |
Dropbox, Inc. Series A (a)(d)(e)(f)
(acquisition cost — $3; acquired 5/25/12)
(Cost $3) | | | 277 | | | | 2 | | |
Short-Term Investments (9.1%) | |
Securities held as Collateral on Loaned Securities (2.7%) | |
Investment Company (2.0%) | |
Morgan Stanley Institutional Liquidity
Funds — Treasury Securities Portfolio —
Institutional Class (See Note G) | | | 2,382,724 | | | | 2,383 | | |
| | | Face
Amount
(000) | | | |
Repurchase Agreements (0.7%) | |
Barclays Capital, Inc., (1.37%, dated
12/29/17, due 1/2/18; proceeds $548;
fully collateralized by a U.S. Government
obligation; 1.75% due 5/15/23; valued
at $559) | | $ | 548 | | | | 548 | | |
HSBC Securities USA, Inc., (1.30%, dated
12/29/17, due 1/2/18; proceeds $42;
fully collateralized by a U.S. Government
obligation; 3.00% due 2/15/47; valued
at $43) | | | 42 | | | | 42 | | |
Merrill Lynch & Co., Inc., (1.42%, dated
12/29/17, due 1/2/18; proceeds $281;
fully collateralized by a U.S. Government
obligation; 2.00% due 12/31/21; valued
at $286) | | | 281 | | | | 281 | | |
| | | | 871 | | |
Total Securities held as Collateral on Loaned
Securities (Cost $3,254) | | | 3,254 | | |
The accompanying notes are an integral part of the financial statements.
6
Morgan Stanley Institutional Fund, Inc.
Annual Report — December 31, 2017
Portfolio of Investments (cont'd)
Global Discovery Portfolio
| | | Shares | | Value
(000) | |
Investment Company (6.4%) | |
Morgan Stanley Institutional Liquidity
Funds — Treasury Securities Portfolio —
Institutional Class (See Note G)
(Cost $7,674) | | | 7,674,477 | | | $ | 7,674 | | |
Total Short-Term Investments
(Cost $10,928) | | | 10,928 | | |
Total Investments Excluding Purchased
Options (101.5%) (Cost $110,819) | | | | | 121,670 | | |
Total Purchased Options Outstanding (0.4%)
(Cost $708) | | | 499 | | |
Total Investments (101.9%) (Cost $111,527)
Including $3,139 of Securities Loaned (g)(h)(i) | | | 122,169 | | |
Liabilities in Excess of Other Assets (-1.9%) | | | (2,253 | ) | |
Net Assets (100.0%) | | $ | 119,916 | | |
Country assignments and aggregations are based generally on third party vendor classifications and information, and may be different from the assignments and aggregations under the policies set forth in the Fund's prospectus and/or statement of additional information relating to geographic classifications.
(a) Non-income producing security.
(b) 144A security — Certain conditions for public sale may exist. Unless otherwise noted, these securities are deemed to be liquid.
(c) All or a portion of this security was on loan at December 31, 2017.
(d) At December 31, 2017, the Fund held fair valued securities valued at approximately $456,000, representing 0.4% of net assets. These securities have been fair valued as determined in good faith under procedures established by and under the general supervision of the Company's Directors.
(e) Security has been deemed illiquid at December 31, 2017.
(f) Security cannot be offered for public resale without first being registered under the Securities Act of 1933 and related rules ("restricted security"). Acquisition date represents the day on which an enforceable right to acquire such security is obtained and is presented along with related cost in the security description. The Fund has registration rights for certain restricted securities. Any costs related to such registration are borne by the issuer. The aggregate value of restricted securities (excluding 144A holdings) at December 31, 2017, amounts to approximately $456,000 and represents 0.4% of net assets.
(g) Securities are available for collateral in connection with open foreign currency forward exchange contracts.
(h) The approximate fair value and percentage of net assets, $38,577,000 and 32.2%, respectively, represent the securities that have been fair valued under the fair valuation policy for international investments as described in Note A-1 within the Notes to the Financial Statements.
(i) At December 31, 2017, the aggregate cost for federal income tax purposes is approximately $111,865,000. The aggregate gross unrealized appreciation is approximately $13,293,000 and the aggregate gross unrealized depreciation is approximately $3,053,000, resulting in net unrealized appreciation of approximately $10,240,000.
ADR American Depositary Receipt.
The accompanying notes are an integral part of the financial statements.
7
Morgan Stanley Institutional Fund, Inc.
Annual Report — December 31, 2017
Portfolio of Investments (cont'd)
Global Discovery Portfolio
Call Options Purchased:
The Fund had the following call options purchased open at December 31, 2017:
Counterparty | | Description | | Strike
Price | | Expiration
Date | | Number of
Contracts | | Notional
Amount
(000) | | Value
(000) | | Premiums
Paid
(000) | | Unrealized
Appreciation
(Depreciation)
(000) | |
UBS Securities, LLC* | | Harley-Davidson, Inc. | | USD | 45.00 | | | Jan-19 | | | 400 | | | | 40 | | | $ | 385 | | | $ | 666 | | | $ | (281 | ) | |
UBS Securities, LLC* | | United Technologies Corp. | | USD | 120.00 | | | Jan-18 | | | 140 | | | | 14 | | | | 114 | | | | 42 | | | | 72 | | |
| | | | | | | | | | | | | $ | 499 | | | $ | 708 | | | $ | (209 | ) | |
* Cleared option.
Foreign Currency Forward Exchange Contracts:
The Fund had the following foreign currency forward exchange contracts open at December 31, 2017:
Counterparty | | Contracts to
Deliver
(000) | | In Exchange
For
(000) | | Delivery
Date | | Unrealized
Depreciation
(000) | |
UBS AG | | EUR | 601 | | | $ | 716 | | | 2/22/18 | | $ | (8 | ) | |
UBS AG | | EUR | 106 | | | $ | 126 | | | 2/22/18 | | | (2 | ) | |
UBS AG | | KRW | 765,055 | | | $ | 669 | | | 2/22/18 | | | (46 | ) | |
UBS AG | | KRW | 133,872 | | | $ | 118 | | | 2/22/18 | | | (7 | ) | |
| | | | | | | | | $ | (63 | ) | |
EUR — Euro
KRW — South Korean Won
USD — United States Dollar
Portfolio Composition**
Classification | | Percentage of
Total Investments | |
Other*** | | | 21.8 | % | |
Specialty Retail | | | 10.9 | | |
Media | | | 10.0 | | |
Chemicals | | | 9.8 | | |
Hotels, Restaurants & Leisure | | | 8.4 | | |
Automobiles | | | 8.1 | | |
Textiles, Apparel & Luxury Goods | | | 7.1 | | |
Machinery | | | 6.8 | | |
Short-Term Investments | | | 6.5 | | |
Insurance | | | 5.6 | | |
Pharmaceuticals | | | 5.0 | | |
Total Investments | | | 100.0 | %**** | |
** Percentages indicated are based upon total investments (excluding Securities held as Collateral on Loaned Securities) as of December 31, 2017.
*** Industries and/or investment types representing less than 5% of total investments.
**** Does not include open foreign currency forward exchange contracts with net unrealized depreciation of approximately $63,000.
The accompanying notes are an integral part of the financial statements.
8
Morgan Stanley Institutional Fund, Inc.
Annual Report — December 31, 2017
Global Discovery Portfolio
Statement of Assets and Liabilities | | December 31, 2017
(000) | |
Assets: | |
Investments in Securities of Unaffiliated Issuers, at Value(1) (Cost $101,470) | | $ | 112,112 | | |
Investment in Security of Affiliated Issuer, at Value (Cost $10,057) | | | 10,057 | | |
Total Investments in Securities, at Value (Cost $111,527) | | | 122,169 | | |
Foreign Currency, at Value (Cost $4) | | | 4 | | |
Receivable for Fund Shares Sold | | | 1,294 | | |
Receivable for Investments Sold | | | 556 | | |
Dividends Receivable | | | 205 | | |
Tax Reclaim Receivable | | | 27 | | |
Receivable from Affiliate | | | 11 | | |
Receivable from Securities Lending Income | | | 6 | | |
Other Assets | | | 54 | | |
Total Assets | | | 124,326 | | |
Liabilities: | |
Collateral on Securities Loaned, at Value | | | 3,254 | | |
Payable for Investments Purchased | | | 589 | | |
Payable for Advisory Fees | | | 204 | | |
Payable for Fund Shares Redeemed | | | 149 | | |
Unrealized Depreciation on Foreign Currency Forward Exchange Contracts | | | 63 | | |
Payable for Professional Fees | | | 59 | | |
Payable for Custodian Fees | | | 32 | | |
Payable for Shareholder Services Fees — Class A | | | 8 | | |
Payable for Distribution and Shareholder Services Fees — Class L | | | — | @ | |
Payable for Distribution and Shareholder Services Fees — Class C | | | 8 | | |
Payable for Sub Transfer Agency Fees — Class I | | | 4 | | |
Payable for Sub Transfer Agency Fees — Class A | | | 8 | | |
Payable for Sub Transfer Agency Fees — Class L | | | — | @ | |
Payable for Sub Transfer Agency Fees — Class C | | | 1 | | |
Payable for Administration Fees | | | 8 | | |
Payable for Transfer Agency Fees — Class I | | | 1 | | |
Payable for Transfer Agency Fees — Class A | | | 1 | | |
Payable for Transfer Agency Fees — Class L | | | — | @ | |
Payable for Transfer Agency Fees — Class C | | | 3 | | |
Other Liabilities | | | 18 | | |
Total Liabilities | | | 4,410 | | |
Net Assets | | $ | 119,916 | | |
Net Assets Consist Of: | |
Paid-in-Capital | | $ | 107,154 | | |
Distributions in Excess of Net Investment Income | | | (309 | ) | |
Accumulated Undistributed Net Realized Gain | | | 2,489 | | |
Unrealized Appreciation (Depreciation) on: | |
Investments | | | 10,642 | | |
Foreign Currency Forward Exchange Contracts | | | (63 | ) | |
Foreign Currency Translations | | | 3 | | |
Net Assets | | $ | 119,916 | | |
The accompanying notes are an integral part of the financial statements.
9
Morgan Stanley Institutional Fund, Inc.
Annual Report — December 31, 2017
Global Discovery Portfolio
Statement of Assets and Liabilities (cont'd) | | December 31, 2017
(000) | |
CLASS I: | |
Net Assets | | $ | 70,343 | | |
| Shares Outstanding $0.001 par value shares of beneficial interest (unlimited shares authorized) (not in 000's) | | | 4,433,666 | | |
Net Asset Value, Offering and Redemption Price Per Share | | $ | 15.87 | | |
CLASS A: | |
Net Assets | | $ | 39,791 | | |
| Shares Outstanding $0.001 par value shares of beneficial interest (unlimited shares authorized) (not in 000's) | | | 2,519,141 | | |
Net Asset Value, Redemption Price Per Share | | $ | 15.80 | | |
Maximum Sales Load | | | 5.25 | % | |
Maximum Sales Charge | | $ | 0.88 | | |
Maximum Offering Price Per Share | | $ | 16.68 | | |
CLASS L: | |
Net Assets | | $ | 327 | | |
| Shares Outstanding $0.001 par value shares of beneficial interest (unlimited shares authorized) (not in 000's) | | | 20,944 | | |
Net Asset Value, Offering and Redemption Price Per Share | | $ | 15.62 | | |
CLASS C: | |
Net Assets | | $ | 9,455 | | |
| Shares Outstanding $0.001 par value shares of beneficial interest (unlimited shares authorized) (not in 000's) | | | 613,426 | | |
Net Asset Value, Offering and Redemption Price Per Share | | $ | 15.41 | | |
(1) Including:
Securities on Loan, at Value: | | $ | 3,139 | | |
@ Amount is less than $500.
The accompanying notes are an integral part of the financial statements.
10
Morgan Stanley Institutional Fund, Inc.
Annual Report — December 31, 2017
Global Discovery Portfolio
Statement of Operations | | Year Ended
December 31, 2017
(000) | |
Investment Income: | |
Dividends from Securities of Unaffiliated Issuers (Net of $107 of Foreign Taxes Withheld) | | $ | 1,194 | | |
Dividends from Security of Affiliated Issuer (Note G) | | | 43 | | |
Income from Securities Loaned — Net | | | 24 | | |
Total Investment Income | | | 1,261 | | |
Expenses: | |
Advisory Fees (Note B) | | | 693 | | |
Shareholder Services Fees — Class A (Note D) | | | 80 | | |
Distribution and Shareholder Services Fees — Class L (Note D) | | | 2 | | |
Distribution and Shareholder Services Fees — Class C (Note D) | | | 79 | | |
Professional Fees | | | 133 | | |
Sub Transfer Agency Fees — Class I | | | 23 | | |
Sub Transfer Agency Fees — Class A | | | 42 | | |
Sub Transfer Agency Fees — Class L | | | — | @ | |
Sub Transfer Agency Fees — Class C | | | 2 | | |
Administration Fees (Note C) | | | 62 | | |
Registration Fees | | | 59 | | |
Custodian Fees (Note F) | | | 54 | | |
Transfer Agency Fees — Class I (Note E) | | | 5 | | |
Transfer Agency Fees — Class A (Note E) | | | 3 | | |
Transfer Agency Fees — Class L (Note E) | | | 2 | | |
Transfer Agency Fees — Class C (Note E) | | | 12 | | |
Shareholder Reporting Fees | | | 21 | | |
Pricing Fees | | | 7 | | |
Directors' Fees and Expenses | | | 5 | | |
Other Expenses | | | 24 | | |
Total Expenses | | | 1,308 | | |
Reimbursement of Class Specific Expenses — Class I (Note B) | | | (28 | ) | |
Reimbursement of Class Specific Expenses — Class A (Note B) | | | (13 | ) | |
Reimbursement of Class Specific Expenses — Class L (Note B) | | | (2 | ) | |
Reimbursement of Class Specific Expenses — Class C (Note B) | | | (6 | ) | |
Waiver of Advisory Fees (Note B) | | | (19 | ) | |
Rebate from Morgan Stanley Affiliate (Note G) | | | (10 | ) | |
Net Expenses | | | 1,230 | | |
Net Investment Income | | | 31 | | |
Realized Gain (Loss): | |
Investments Sold | | | 7,956 | | |
Foreign Currency Forward Exchange Contracts | | | (67 | ) | |
Foreign Currency Transactions | | | 22 | | |
Net Realized Gain | | | 7,911 | | |
Change in Unrealized Appreciation (Depreciation): | |
Investments | | | 7,566 | | |
Foreign Currency Forward Exchange Contracts | | | (180 | ) | |
Foreign Currency Translations | | | 3 | | |
Net Change in Unrealized Appreciation (Depreciation) | | | 7,389 | | |
Net Realized Gain and Change in Unrealized Appreciation (Depreciation) | | | 15,300 | | |
Net Increase in Net Assets Resulting from Operations | | $ | 15,331 | | |
@ Amount is less than $500.
The accompanying notes are an integral part of the financial statements.
11
Morgan Stanley Institutional Fund, Inc.
Annual Report — December 31, 2017
Global Discovery Portfolio
Statements of Changes in Net Assets | | Year Ended
December 31, 2017
(000) | | Year Ended
December 31, 2016
(000) | |
Increase (Decrease) in Net Assets: | |
Operations: | |
Net Investment Income (Loss) | | $ | 31 | | | $ | (17 | ) | |
Net Realized Gain | | | 7,911 | | | | 1,068 | | |
Net Change in Unrealized Appreciation (Depreciation) | | | 7,389 | | | | 3,676 | | |
Net Increase in Net Assets Resulting from Operations | | | 15,331 | | | | 4,727 | | |
Distributions from and/or in Excess of: | |
Class I: | |
Net Investment Income | | | (277 | ) | | | (21 | ) | |
Net Realized Gain | | | (3,179 | ) | | | (204 | ) | |
Class A: | |
Net Investment Income | | | (68 | ) | | | (3 | ) | |
Net Realized Gain | | | (2,006 | ) | | | (265 | ) | |
Class L: | |
Net Investment Income | | | (— | @) | | | — | | |
Net Realized Gain | | | (17 | ) | | | (4 | ) | |
Class C: | |
Net Investment Income | | | (9 | ) | | | — | | |
Net Realized Gain | | | (483 | ) | | | (82 | ) | |
Total Distributions | | | (6,039 | ) | | | (579 | ) | |
Capital Share Transactions:(1) | |
Class I: | |
Subscribed | | | 68,096 | | | | 8,858 | | |
Distributions Reinvested | | | 3,453 | | | | 224 | | |
Redeemed | | | (17,616 | ) | | | (2,138 | ) | |
Class A: | |
Subscribed | | | 29,000 | | | | 15,954 | | |
Distributions Reinvested | | | 2,071 | | | | 269 | | |
Redeemed | | | (14,422 | ) | | | (4,793 | ) | |
Class L: | |
Exchanged | | | 34 | | | | 7 | | |
Distributions Reinvested | | | 16 | | | | 4 | | |
Redeemed | | | — | | | | (115 | ) | |
Class C: | |
Subscribed | | | 5,273 | | | | 3,903 | | |
Distributions Reinvested | | | 483 | | | | 82 | | |
Redeemed | | | (2,082 | ) | | | (29 | ) | |
Net Increase in Net Assets Resulting from Capital Share Transactions | | | 74,306 | | | | 22,226 | | |
Total Increase in Net Assets | | | 83,598 | | | | 26,374 | | |
Net Assets: | |
Beginning of Period | | | 36,318 | | | | 9,944 | | |
End of Period (Including Distributions in Excess of Net Investment Income of $(309) and $(46)) | | $ | 119,916 | | | $ | 36,318 | | |
The accompanying notes are an integral part of the financial statements.
12
Morgan Stanley Institutional Fund, Inc.
Annual Report — December 31, 2017
Global Discovery Portfolio
Statements of Changes in Net Assets (cont'd) | | Year Ended
December 31, 2017
(000) | | Year Ended
December 31, 2016
(000) | |
(1) Capital Share Transactions: | |
Class I: | |
Shares Subscribed | | | 4,404 | | | | 731 | | |
Shares Issued on Distributions Reinvested | | | 221 | | | | 17 | | |
Shares Redeemed | | | (1,146 | ) | | | (180 | ) | |
Net Increase in Class I Shares Outstanding | | | 3,479 | | | | 568 | | |
Class A: | |
Shares Subscribed | | | 1,931 | | | | 1,277 | | |
Shares Issued on Distributions Reinvested | | | 133 | | | | 20 | | |
Shares Redeemed | | | (935 | ) | | | (444 | ) | |
Net Increase in Class A Shares Outstanding | | | 1,129 | | | | 853 | | |
Class L: | |
Shares Exchanged | | | 2 | | | | 1 | | |
Shares Issued on Distributions Reinvested | | | 1 | | | | — | @@ | |
Shares Redeemed | | | — | | | | (9 | ) | |
Net Increase (Decrease) in Class L Shares Outstanding | | | 3 | | | | (8 | ) | |
Class C: | |
Shares Subscribed | | | 360 | | | | 309 | | |
Shares Issued on Distributions Reinvested | | | 32 | | | | 6 | | |
Shares Redeemed | | | (137 | ) | | | (2 | ) | |
Net Increase in Class C Shares Outstanding | | | 255 | | | | 313 | | |
@ Amount is less than $500.
@@ Amount is less than 500 shares.
The accompanying notes are an integral part of the financial statements.
13
Morgan Stanley Institutional Fund, Inc.
Annual Report — December 31, 2017
Financial Highlights
Global Discovery Portfolio
| | | Class I | |
| | | Year Ended December 31, | |
Selected Per Share Data and Ratios | | 2017 | | 2016(1) | | 2015 | | 2014 | | 2013 | |
Net Asset Value, Beginning of Period | | $ | 13.42 | | | $ | 10.02 | | | $ | 10.62 | | | $ | 13.70 | | | $ | 11.11 | | |
Income (Loss) from Investment Operations: | |
Net Investment Income (Loss)(2) | | | 0.05 | | | | 0.02 | | | | 0.10 | | | | 0.48 | | | | (0.01 | ) | |
Net Realized and Unrealized Gain (Loss) | | | 3.33 | | | | 3.64 | | | | (0.55 | ) | | | (0.77 | ) | | | 4.43 | | |
Total from Investment Operations | | | 3.38 | | | | 3.66 | | | | (0.45 | ) | | | (0.29 | ) | | | 4.42 | | |
Distributions from and/or in Excess of: | |
Net Investment Income | | | (0.08 | ) | | | (0.02 | ) | | | (0.15 | ) | | | (0.55 | ) | | | (0.07 | ) | |
Net Realized Gain | | | (0.85 | ) | | | (0.24 | ) | | | — | | | | (1.95 | ) | | | (1.76 | ) | |
Paid-in-Capital | | | — | | | | — | | | | — | | | | (0.29 | ) | | | — | | |
Total Distributions | | | (0.93 | ) | | | (0.26 | ) | | | (0.15 | ) | | | (2.79 | ) | | | (1.83 | ) | |
Net Asset Value, End of Period | | $ | 15.87 | | | $ | 13.42 | | | $ | 10.02 | | | $ | 10.62 | | | $ | 13.70 | | |
Total Return(3) | | | 25.39 | % | | | 36.51 | % | | | (4.27 | )% | | | (1.96 | )% | | | 40.72 | % | |
Ratios and Supplemental Data: | |
Net Assets, End of Period (Thousands) | | $ | 70,343 | | | $ | 12,802 | | | $ | 3,867 | | | $ | 6,421 | | | $ | 8,493 | | |
Ratio of Expenses to Average Net Assets(5) | | | 1.34 | %(4) | | | 1.34 | %(4) | | | 1.34 | %(4) | | | 1.34 | %(4) | | | 1.34 | %(4) | |
Ratio of Net Investment Income (Loss) to Average Net Assets(5) | | | 0.30 | %(4) | | | 0.17 | %(4) | | | 0.88 | %(4) | | | 3.70 | %(4) | | | (0.07 | )%(4) | |
Ratio of Rebate from Morgan Stanley Affiliates to Average Net Assets | | | 0.01 | % | | | 0.01 | % | | | 0.01 | % | | | 0.01 | % | | | 0.01 | % | |
Portfolio Turnover Rate | | | 65 | % | | | 64 | % | | | 118 | % | | | 84 | % | | | 100 | % | |
(5) Supplemental Information on the Ratios to Average Net Assets: | |
Ratios Before Expense Limitation: | |
Expenses to Average Net Assets | | | 1.45 | % | | | 2.38 | % | | | 3.09 | % | | | 2.65 | % | | | 3.65 | % | |
Net Investment Income (Loss) to Average Net Assets | | | 0.19 | % | | | (0.87 | )% | | | (0.87 | )% | | | 2.39 | % | | | (2.38 | )% | |
(1) Reflects prior period custodian out-of-pocket expenses that were reimbursed in September 2016. The amount of the reimbursement was immaterial on a per share basis and did not impact the total return of Class I shares. The Ratio of Expenses to Average Net Assets and the Ratio of Net Investment Income to Average Net Assets would be unchanged as the reimbursement of custodian fees was offset against expense waivers/reimbursements with no impact to net expenses or net investment income.
(2) Per share amount is based on average shares outstanding.
(3) Calculated based on the net asset value as of the last business day of the period.
(4) The Ratios of Expenses and Net Investment Income (Loss) reflect the rebate of certain Fund expenses in connection with the investments in Morgan Stanley affiliates during the period. The effect of the rebate on the ratios is disclosed in the above table as "Ratio of Rebate from Morgan Stanley Affiliates to Average Net Assets."
The accompanying notes are an integral part of the financial statements.
14
Morgan Stanley Institutional Fund, Inc.
Annual Report — December 31, 2017
Financial Highlights
Global Discovery Portfolio
| | | Class A | |
| | | Year Ended December 31, | |
Selected Per Share Data and Ratios | | 2017 | | 2016(1) | | 2015 | | 2014 | | 2013 | |
Net Asset Value, Beginning of Period | | $ | 13.37 | | | $ | 10.01 | | | $ | 10.62 | | | $ | 13.69 | | | $ | 11.11 | | |
Income (Loss) from Investment Operations: | |
Net Investment Income (Loss)(2) | | | (0.01 | ) | | | (0.03 | ) | | | 0.02 | | | | 0.44 | | | | (0.09 | ) | |
Net Realized and Unrealized Gain (Loss) | | | 3.32 | | | | 3.63 | | | | (0.51 | ) | | | (0.76 | ) | | | 4.47 | | |
Total from Investment Operations | | | 3.31 | | | | 3.60 | | | | (0.49 | ) | | | (0.32 | ) | | | 4.38 | | |
Distributions from and/or in Excess of: | |
Net Investment Income | | | (0.03 | ) | | | (0.00 | )(3) | | | (0.12 | ) | | | (0.51 | ) | | | (0.04 | ) | |
Net Realized Gain | | | (0.85 | ) | | | (0.24 | ) | | | — | | | | (1.95 | ) | | | (1.76 | ) | |
Paid-in-Capital | | | — | | | | — | | | | — | | | | (0.29 | ) | | | — | | |
Total Distributions | | | (0.88 | ) | | | (0.24 | ) | | | (0.12 | ) | | | (2.75 | ) | | | (1.80 | ) | |
Net Asset Value, End of Period | | $ | 15.80 | | | $ | 13.37 | | | $ | 10.01 | | | $ | 10.62 | | | $ | 13.69 | | |
Total Return(4) | | | 24.89 | % | | | 36.04 | % | | | (4.59 | )% | | | (2.25 | )% | | | 40.33 | % | |
Ratios and Supplemental Data: | |
Net Assets, End of Period (Thousands) | | $ | 39,791 | | | $ | 18,574 | | | $ | 5,375 | | | $ | 2,965 | | | $ | 1,455 | | |
Ratio of Expenses to Average Net Assets(7) | | | 1.69 | %(5) | | | 1.69 | %(5) | | | 1.69 | %(5) | | | 1.69 | %(5) | | | 1.65 | %(5)(6) | |
Ratio of Net Investment Income (Loss) to Average Net Assets(7) | | | (0.05 | )%(5) | | | (0.28 | )%(5) | | | 0.16 | %(5) | | | 3.35 | %(5) | | | (0.66 | )%(5) | |
Ratio of Rebate from Morgan Stanley Affiliates to Average Net Assets | | | 0.01 | % | | | 0.01 | % | | | 0.01 | % | | | 0.01 | % | | | 0.01 | % | |
Portfolio Turnover Rate | | | 65 | % | | | 64 | % | | | 118 | % | | | 84 | % | | | 100 | % | |
(7) Supplemental Information on the Ratios to Average Net Assets: | |
Ratios Before Expense Limitation: | |
Expenses to Average Net Assets | | | 1.76 | % | | | 2.67 | % | | | 3.52 | % | | | 3.02 | % | | | 3.87 | % | |
Net Investment Income (Loss) to Average Net Assets | | | (0.12 | )% | | | (1.26 | )% | | | (1.67 | )% | | | 2.02 | % | | | (2.88 | )% | |
(1) Reflects prior period custodian out-of-pocket expenses that were reimbursed in September 2016. The amount of the reimbursement was immaterial on a per share basis and did not impact the total return of Class A shares. The Ratio of Expenses to Average Net Assets and the Ratio of Net Investment Loss to Average Net Assets would be unchanged as the reimbursement of custodian fees was offset against expense waivers/reimbursements with no impact to net expenses or net investment loss.
(2) Per share amount is based on average shares outstanding.
(3) Amount is less than $0.005 per share.
(4) Calculated based on the net asset value which does not reflect sales charges, if applicable, as of the last business day of the period.
(5) The Ratios of Expenses and Net Investment Income (Loss) reflect the rebate of certain Fund expenses in connection with the investments in Morgan Stanley affiliates during the period. The effect of the rebate on the ratios is disclosed in the above table as "Ratio of Rebate from Morgan Stanley Affiliates to Average Net Assets."
(6) Effective September 16, 2013, the Adviser has agreed to limit the ratio of expenses to average net assets to the maximum ratio of 1.70% for Class A shares. Prior to September 16, 2013, the maximum ratio was 1.60% for Class A shares.
The accompanying notes are an integral part of the financial statements.
15
Morgan Stanley Institutional Fund, Inc.
Annual Report — December 31, 2017
Financial Highlights
Global Discovery Portfolio
| | | Class L | |
| | | Year Ended December 31, | |
Selected Per Share Data and Ratios | | 2017 | | 2016(1) | | 2015 | | 2014 | | 2013 | |
Net Asset Value, Beginning of Period | | $ | 13.28 | | | $ | 9.99 | | | $ | 10.59 | | | $ | 13.64 | | | $ | 11.11 | | |
Income (Loss) from Investment Operations: | |
Net Investment Income (Loss)(2) | | | (0.08 | ) | | | (0.09 | ) | | | (0.03 | ) | | | 0.37 | | | | (0.14 | ) | |
Net Realized and Unrealized Gain (Loss) | | | 3.29 | | | | 3.62 | | | | (0.51 | ) | | | (0.76 | ) | | | 4.45 | | |
Total from Investment Operations | | | 3.21 | | | | 3.53 | | | | (0.54 | ) | | | (0.39 | ) | | | 4.31 | | |
Distributions from and/or in Excess of: | |
Net Investment Income | | | (0.02 | ) | | | — | | | | (0.06 | ) | | | (0.42 | ) | | | (0.02 | ) | |
Net Realized Gain | | | (0.85 | ) | | | (0.24 | ) | | | — | | | | (1.95 | ) | | | (1.76 | ) | |
Paid-in-Capital | | | — | | | | — | | | | — | | | | (0.29 | ) | | | — | | |
Total Distributions | | | (0.87 | ) | | | (0.24 | ) | | | (0.06 | ) | | | (2.66 | ) | | | (1.78 | ) | |
Net Asset Value, End of Period | | $ | 15.62 | | | $ | 13.28 | | | $ | 9.99 | | | $ | 10.59 | | | $ | 13.64 | | |
| Total Return(3) | | | 24.26 | % | | | 35.38 | % | | | (5.05 | )% | | | (2.81 | )% | | | 39.68 | % | |
Ratios and Supplemental Data: | |
Net Assets, End of Period (Thousands) | | $ | 327 | | | $ | 233 | | | $ | 259 | | | $ | 226 | | | $ | 269 | | |
Ratio of Expenses to Average Net Assets(6) | | | 2.19 | %(4) | | | 2.19 | %(4) | | | 2.19 | %(4) | | | 2.19 | %(4) | | | 2.13 | %(4)(5) | |
Ratio of Net Investment Income (Loss) to Average Net Assets(6) | | | (0.56 | )%(4) | | | (0.80 | )%(4) | | | (0.26 | )%(4) | | | 2.85 | %(4) | | | (1.05 | )%(4) | |
Ratio of Rebate from Morgan Stanley Affiliates to Average Net Assets | | | 0.01 | % | | | 0.01 | % | | | 0.01 | % | | | 0.01 | % | | | 0.01 | % | |
Portfolio Turnover Rate | | | 65 | % | | | 64 | % | | | 118 | % | | | 84 | % | | | 100 | % | |
(6) Supplemental Information on the Ratios to Average Net Assets: | |
Ratios Before Expense Limitation: | |
Expenses to Average Net Assets | | | 2.86 | % | | | 3.81 | % | | | 4.55 | % | | | 4.08 | % | | | 4.62 | % | |
Net Investment Income (Loss) to Average Net Assets | | | (1.23 | )% | | | (2.42 | )% | | | (2.62 | )% | | | 0.96 | % | | | (3.54 | )% | |
(1) Reflects prior period custodian out-of-pocket expenses that were reimbursed in September 2016. The amount of the reimbursement was immaterial on a per share basis and did not impact the total return of Class L shares. The Ratio of Expenses to Average Net Assets and the Ratio of Net Investment Loss to Average Net Assets would be unchanged as the reimbursement of custodian fees was offset against expense waivers/reimbursements with no impact to net expenses or net investment loss.
(2) Per share amount is based on average shares outstanding.
(3) Calculated based on the net asset value as of the last business day of the period.
(4) The Ratios of Expenses and Net Investment Income (Loss) reflect the rebate of certain Fund expenses in connection with the investments in Morgan Stanley affiliates during the period. The effect of the rebate on the ratios is disclosed in the above table as "Ratio of Rebate from Morgan Stanley Affiliates to Average Net Assets."
(5) Effective September 16, 2013, the Adviser has agreed to limit the ratio of expenses to average net assets to the maximum ratio of 2.20% for Class L shares. Prior to September 16, 2013, the maximum ratio was 2.10% for Class L shares.
The accompanying notes are an integral part of the financial statements.
16
Morgan Stanley Institutional Fund, Inc.
Annual Report — December 31, 2017
Financial Highlights
Global Discovery Portfolio
| | | Class C | |
| | | Year Ended December 31, | | Period from
April 30, 2015(2) to | |
Selected Per Share Data and Ratios | | 2017 | | 2016(1) | | December 31, 2015 | |
Net Asset Value, Beginning of Period | | $ | 13.15 | | | $ | 9.92 | | | $ | 11.07 | | |
Income (Loss) from Investment Operations: | |
Net Investment Loss(3) | | | (0.12 | ) | | | (0.10 | ) | | | (0.08 | ) | |
Net Realized and Unrealized Gain | | | 3.25 | | | | 3.57 | | | | (0.95 | ) | |
Total from Investment Operations | | | 3.13 | | | | 3.47 | | | | (1.03 | ) | |
Distributions from and/or in Excess of: | |
Net Investment Income | | | (0.02 | ) | | | — | | | | (0.12 | ) | |
Net Realized Gain | | | (0.85 | ) | | | (0.24 | ) | | | — | | |
Total Distributions | | | (0.87 | ) | | | (0.24 | ) | | | (0.12 | ) | |
Net Asset Value, End of Period | | $ | 15.41 | | | $ | 13.15 | | | $ | 9.92 | | |
Total Return(4) | | | 23.89 | % | | | 35.03 | % | | | (9.28 | )%(7) | |
Ratios and Supplemental Data: | |
Net Assets, End of Period (Thousands) | | $ | 9,455 | | | $ | 4,709 | | | $ | 443 | | |
Ratio of Expenses to Average Net Assets(9) | | | 2.44 | %(5) | | | 2.43 | %(5) | | | 2.45 | %(5)(8) | |
Ratio of Net Investment Loss to Average Net Assets(9) | | | (0.79 | )%(5) | | | (0.83 | )%(5) | | | (1.21 | )%(5)(8) | |
Ratio of Rebate from Morgan Stanley Affiliates to Average Net Assets | | | 0.01 | % | | | 0.02 | % | | | 0.00 | %(6)(8) | |
Portfolio Turnover Rate | | | 65 | % | | | 64 | % | | | 118 | % | |
(9) Supplemental Information on the Ratios to Average Net Assets: | |
Ratios Before Expense Limitation: | |
Expense to Average Net Assets | | | 2.55 | % | | | 3.53 | % | | | 5.66 | %(8) | |
Net Investment Loss to Average Net Assets | | | (0.90 | )% | | | (1.93 | )% | | | (4.42 | )%(8) | |
(1) Reflects prior period custodian out-of-pocket expenses that were reimbursed in September 2016. The amount of the reimbursement was immaterial on a per share basis and did not impact the total return of Class C shares. The Ratio of Expenses to Average Net Assets and the Ratio of Net Investment Loss to Average Net Assets would be unchanged as the reimbursement of custodian fees was offset against expense waivers/reimbursements with no impact to net expenses or net investment loss.
(2) Commencement of Offering.
(3) Per share amount is based on average shares outstanding.
(4) Calculated based on the net asset value which does not reflect sales charges, if applicable, as of the last business day of the period.
(5) The Ratios of Expenses and Net Investment Loss reflect the rebate of certain Fund expenses in connection with the investments in Morgan Stanley affiliates during the period. The effect of the rebate on the ratios is disclosed in the above table as "Ratio of Rebate from Morgan Stanley Affiliates to Average Net Assets."
(6) Amount is less than 0.005%.
(7) Not annualized.
(8) Annualized.
The accompanying notes are an integral part of the financial statements.
17
Morgan Stanley Institutional Fund, Inc.
Annual Report — December 31, 2017
Notes to Financial Statements
Morgan Stanley Institutional Fund, Inc. (the "Company") is registered under the Investment Company Act of 1940, as amended (the "Act"), as an open-end management investment company. The Company is comprised of twenty-nine separate, active, diversified and non-diversified funds (individually referred to as a "Fund", collectively as the "Funds"). The Company applies investment company accounting and reporting guidance.
The accompanying financial statements relate to the Global Discovery Portfolio. The Fund seeks long-term capital appreciation.
The Fund offers four classes of shares — Class I, Class A, Class L and Class C. On April 30, 2015, the Fund suspended offering Class L shares. Existing Class L shareholders may invest through reinvestment of dividends and distributions.
A. Significant Accounting Policies: The following significant accounting policies are in conformity with U.S. generally accepted accounting principles ("GAAP"). Such policies are consistently followed by the Company in the preparation of its financial statements. GAAP may require management to make estimates and assumptions that affect the reported amounts and disclosures in the financial statements. Actual results may differ from those estimates.
1. Security Valuation: (1) An equity portfolio security listed or traded on an exchange is valued at its latest reported sales price (or at the exchange official closing price if such exchange reports an official closing price), and if there were no sales on a given day and if there is no official exchange closing price for that day, the security is valued at the mean between the last reported bid and asked prices if such bid and asked prices are available on the relevant exchanges. Listed equity securities not traded on the valuation date with no reported bid and asked prices available on the exchange are valued at the mean between the current bid and asked prices obtained from one or more reputable brokers or dealers. In cases where a security is traded on more than one exchange, the security is valued on the exchange designated as the primary market; (2) all other equity portfolio securities for which over-the-counter ("OTC") market quotations are readily available are valued at the latest reported sales price (or at the market official closing price if such market reports an official closing price), and if there was no trading in the security on a given day and if there is no official closing price from relevant markets for that day, the security is valued at the mean between the last reported bid and
asked prices if such bid and asked prices are available on the relevant markets. An unlisted equity security that does not trade on the valuation date and for which bid and asked prices from the relevant markets are unavailable is valued at the mean between the current bid and asked prices obtained from one or more reputable brokers or dealers; (3) listed options are valued at the last reported sales price on the exchange on which they are listed (or at the exchange official closing price if such exchange reports an official closing price). If an official closing price or last reported sales price is unavailable, the listed option should be fair valued at the mean between its latest bid and ask prices. Unlisted options are valued at the mean between their latest bid and ask prices from a broker/dealer or valued by a pricing service/vendor; (4) certain portfolio securities may be valued by an outside pricing service/vendor approved by the Company's Board of Directors (the "Directors"). The pricing service/vendor may employ a pricing model that takes into account, among other things, bids, yield spreads, and/or other market data and specific security characteristics. Alternatively, if a valuation is not available from an outside pricing service/vendor, and the security trades on an exchange, the security may be valued at its latest reported sale price (or at the exchange official closing price if such exchange reports an official closing price), prior to the time when assets are valued. If there are no sales on a given day and if there is no official exchange closing price for that day, the security is valued at the mean between the last reported bid and asked prices if such bid and asked prices are available in the relevant exchanges; (5) when market quotations are not readily available, including circumstances under which Morgan Stanley Investment Management Inc. (the "Adviser") determines that the closing price, last sale price or the mean between the last reported bid and asked prices are not reflective of a security's market value, portfolio securities are valued at their fair value as determined in good faith under procedures established by and under the general supervision of the Directors. Occasionally, developments affecting the closing prices of securities and other assets may occur between the times at which valuations of such securities are determined (that is, close of the foreign market on which the securities trade) and the close of business of the New York Stock Exchange ("NYSE"). If developments occur during such periods that are expected to materially affect the value of such securities, such valuations may be adjusted to reflect the estimated fair value of such
18
Morgan Stanley Institutional Fund, Inc.
Annual Report — December 31, 2017
Notes to Financial Statements (cont'd)
securities as of the close of the NYSE, as determined in good faith by the Directors or by the Adviser using a pricing service and/or procedures approved by the Directors; (6) quotations of foreign portfolio securities, other assets and liabilities and forward contracts stated in foreign currency are translated into U.S. dollar equivalents at the prevailing market rates prior to the close of the NYSE; and (7) investments in mutual funds, including the Morgan Stanley Institutional Liquidity Funds, are valued at the net asset value ("NAV") as of the close of each business day.
The Directors have responsibility for determining in good faith the fair value of the investments, and the Directors may appoint others, such as the Company's Adviser or a valuation committee, to assist the Directors in determining fair value and to make the actual calculations pursuant to the fair valuation methodologies previously approved by the Directors. Under procedures approved by the Directors, the Company's Adviser has formed a Valuation Committee whose members are approved by the Directors. The Valuation Committee provides administration and oversight of the Company's valuation policies and procedures, which are reviewed at least annually by the Directors. These procedures allow the Company to utilize independent pricing services, quotations from securities and financial instrument dealers, and other market sources to determine fair value.
The Company has procedures to determine the fair value of securities and other financial instruments for which market prices are not readily available. Under these procedures, the Valuation Committee convenes on a regular and ad hoc basis to review such securities and considers a number of factors, including valuation methodologies and significant unobservable valuation inputs, when arriving at fair value. The Valuation Committee may employ a market-based approach which may use related or comparable assets or liabilities, recent transactions, market multiples, book values, and other relevant information for the investment to determine the fair value of the investment. An income-based valuation approach may also be used in which the anticipated future cash flows of the investment are discounted to calculate fair value. Discounts may also be applied due to the nature or duration of any restrictions on the disposition of the investments. Due to the inherent uncertainty of valuations of such investments, the fair values may differ significantly from the values that would have
been used had an active market existed. The Valuation Committee employs various methods for calibrating these valuation approaches including a regular review of valuation methodologies, key inputs and assumptions, transactional back-testing or disposition analysis, and reviews of any related market activity.
2. Fair Value Measurement: Financial Accounting Standards Board ("FASB") Accounting Standards CodificationTM ("ASC") 820, "Fair Value Measurement" ("ASC 820"), defines fair value as the value that the Fund would receive to sell an investment or pay to transfer a liability in a timely transaction with an independent buyer in the principal market, or in the absence of a principal market, the most advantageous market for the investment or liability. ASC 820 establishes a three-tier hierarchy to distinguish between (1) inputs that reflect the assumptions market participants would use in valuing an asset or liability developed based on market data obtained from sources independent of the reporting entity (observable inputs) and (2) inputs that reflect the reporting entity's own assumptions about the assumptions market participants would use in valuing an asset or liability developed based on the best information available in the circumstances (unobservable inputs) and to establish classification of fair value measurements for disclosure purposes. Various inputs are used in determining the value of the Fund's investments. The inputs are summarized in the three broad levels listed below.
• Level 1 – unadjusted quoted prices in active markets for identical investments
• Level 2 – other significant observable inputs (including quoted prices for similar investments, interest rates, prepayment speeds, credit risk, etc.)
• Level 3 – significant unobservable inputs including the Fund's own assumptions in determining the fair value of investments. Factors considered in making this determination may include, but are not limited to, information obtained by contacting the issuer, analysts, or the appropriate stock exchange (for exchange-traded securities), analysis of the issuer's financial statements or other available documents and, if necessary, available information concerning other securities in similar circumstances
19
Morgan Stanley Institutional Fund, Inc.
Annual Report — December 31, 2017
Notes to Financial Statements (cont'd)
The inputs or methodology used for valuing securities are not necessarily an indication of the risk associated with investing in those securities and the determination of the significance of a particular input to the fair value measurement in its entirety requires judgment and considers factors specific to each security.
The following is a summary of the inputs used to value the Fund's investments as of December 31, 2017.
Investment Type | | Level 1
Unadjusted
quoted
prices
(000) | | Level 2
Other
significant
observable
inputs
(000) | | Level 3
Significant
unobservable
inputs
(000) | | Total
(000) | |
Assets: | |
Common Stocks | |
Auto Components | | $ | 4,792 | | | $ | — | | | $ | — | | | $ | 4,792 | | |
Automobiles | | | 9,597 | | | | — | | | | — | | | | 9,597 | | |
Biotechnology | | | 2,179 | | | | — | | | | — | | | | 2,179 | | |
Capital Markets | | | — | | | | 1,493 | | | | — | | | | 1,493 | | |
Chemicals | | | 11,632 | | | | — | | | | — | | | | 11,632 | | |
Commercial Services &
Supplies | | | — | | | | 3,811 | | | | — | | | | 3,811 | | |
Energy Equipment &
Services | | | 1,618 | | | | — | | | | — | | | | 1,618 | | |
Hotels, Restaurants &
Leisure | | | 2,125 | | | | 7,781 | | | | — | | | | 9,906 | | |
Insurance | | | 2,305 | | | | 4,331 | | | | — | | | | 6,636 | | |
Internet Software &
Services | | | 2,190 | | | | — | | | | 25 | | | | 2,215 | | |
Machinery | | | 7,660 | | | | 406 | | | | — | | | | 8,066 | | |
Marine | | | — | | | | 2,035 | | | | — | | | | 2,035 | | |
Media | | | 11,908 | | | | — | | | | — | | | | 11,908 | | |
Metals & Mining | | | — | | | | 2,133 | | | | — | | | | 2,133 | | |
Multi-Line Retail | | | 3,139 | | | | — | | | | — | | | | 3,139 | | |
Pharmaceuticals | | | — | | | | 5,892 | | | | — | | | | 5,892 | | |
Real Estate Management &
Development | | | — | | | | 484 | | | | — | | | | 484 | | |
Specialty Retail | | | 12,564 | | | | 296 | | | | — | | | | 12,860 | | |
Textiles, Apparel &
Luxury Goods | | | — | | | | 8,390 | | | | — | | | | 8,390 | | |
Transportation Infrastructure | | | — | | | | 1,525 | | | | — | | | | 1,525 | | |
Total Common Stocks | | | 71,709 | | | | 38,577 | | | | 25 | | | | 110,311 | | |
Preferred Stocks | |
Internet & Direct Marketing
Retail | | | — | | | | — | | | | 371 | | | | 371 | | |
Software | | | — | | | | — | | | | 58 | | | | 58 | | |
Total Preferred Stocks | | | — | | | | — | | | | 429 | | | | 429 | | |
Convertible Preferred Stock | | | — | | | | — | | | | 2 | | | | 2 | | |
Call Options Purchased | | | 499 | | | | — | | | | — | | | | 499 | | |
Short-Term Investments | |
Investment Company | | | 10,057 | | | | — | | | | — | | | | 10,057 | | |
Repurchase Agreements | | | — | | | | 871 | | | | — | | | | 871 | | |
Total Short-Term
Investments | | | 10,057 | | | | 871 | | | | — | | | | 10,928 | | |
Total Assets | | | 82,265 | | | | 39,448 | | | | 456 | | | | 122,169 | | |
Investment Type | | Level 1
Unadjusted
quoted
prices
(000) | | Level 2
Other
significant
observable
inputs
(000) | | Level 3
Significant
unobservable
inputs
(000) | | Total
(000) | |
Liabilities: | |
Foreign Currency
Forward Exchange
Contracts | | $ | — | | | $ | (63 | ) | | $ | — | | | $ | (63 | ) | |
Total | | $ | 82,265 | | | $ | 39,385 | | | $ | 456 | | | $ | 122,106 | | |
Transfers between investment levels may occur as the markets fluctuate and/or the availability of data used in an investment's valuation changes. The Fund recognizes transfers between the levels as of the end of the period. As of December 31, 2017, securities with a total value of approximately $31,018,000 transferred from Level 1 to Level 2 Securities that were valued using unadjusted quoted prices at December 31, 2016 were valued using other significant observable inputs at December 31, 2017. At December 31, 2017, the fair value of certain securities were adjusted due to developments which occurred between the time of the close of the foreign markets on which they trade and the close of business on the NYSE which resulted in their Level 2 classification.
Following is a reconciliation of investments in which significant unobservable inputs (Level 3) were used in determining fair value.
| | | Common
Stock
(000) | | Preferred
Stocks
(000) | | Convertible
Preferred
Stock
(000) | |
Beginning Balance | | $ | 24 | | | $ | 440 | | | $ | 2 | | |
Purchases | | | — | | | | — | | | | — | | |
Sales | | | — | | | | (174 | ) | | | — | | |
Amortization of discount | | | — | | | | — | | | | — | | |
Transfers in | | | — | | | | — | | | | — | | |
Transfers out | | | — | | | | — | | | | — | | |
Corporate actions | | | — | | | | — | | | | — | | |
Change in unrealized appreciation
(depreciation) | | | 1 | | | | 46 | | | | — | @ | |
Realized gains (losses) | | | — | | | | 117 | | | | — | | |
Ending Balance | | $ | 25 | | | $ | 429 | | | $ | 2 | | |
Net change in unrealized appreciation
(depreciation) from investments still
held as of December 31, 2017 | | $ | 1 | | | $ | 54 | | | $ | — | @ | |
@ Value is less than $500.
20
Morgan Stanley Institutional Fund, Inc.
Annual Report — December 31, 2017
Notes to Financial Statements (cont'd)
The following table presents additional information about valuation techniques and inputs used for investments that are measured at fair value and categorized within Level 3 as of December 31, 2017. Various valuation techniques were used in the valuation of certain investments and weighted based on the level of significance.
| | | Fair Value at
December 31, 2017
(000) | | Valuation
Technique | | Unobservable
Input | | Range | | Selected
Value | | Impact to
Valuation from an
increase in input | |
Internet & Direct Marketing Retail | |
Preferred Stocks | | $ | 203 | | | Discounted Cash Flow | | Weighted Average
Cost of Capital | | | 15.5 | % | | | 17.5 | % | | | 16.5 | % | | Decrease | |
| | | | | | | Perpetual Growth Rate | | | 3.0 | % | | | 4.0 | % | | | 3.5 | % | | Increase | |
| | | | | Market Comparable
Companies | | Enterprise Value/
Revenue | | | 8.7 | x | | | 14.1 | x | | | 10.1 | x | | Increase | |
| | | | | | | Discount for Lack of
Marketability | | | 20.0 | % | | | 20.0 | % | | | 20.0 | % | | Decrease | |
| | | $ | 168 | | | Market Transaction
Method | | Precedent Transaction | | $ | 88.11 | | | $ | 88.11 | | | $ | 88.11 | | | Increase | |
Internet Software & Services | |
Common Stock | | $ | 25 | | | Discounted Cash Flow | | Weighted Average
Cost of Capital | | | 16.0 | % | | | 18.0 | % | | | 17.0 | % | | Decrease | |
Convertible Preferred
Stock | | $ | 2 | | | | | Perpetual Growth Rate | | | 2.5 | % | | | 3.5 | % | | | 3.0 | % | | Increase | |
| | | | | Market Comparable
Companies | | Enterprise Value/
Revenue | | | 3.4 | x | | | 10.1 | x | | | 5.0 | x | | Increase | |
| | | | | | | Discount for Lack of
Marketability | | | 20.0 | % | | | 20.0 | % | | | 20.0 | % | | Decrease | |
Software | |
Preferred Stocks | | $ | 24 | | | Discounted Cash Flow | | Weighted Average
Cost of Capital | | | 16.5 | % | | | 18.5 | % | | | 17.5 | % | | Decrease | |
| | | | | | | Perpetual Growth Rate | | | 3.0 | % | | | 4.0 | % | | | 3.5 | % | | Increase | |
| | | | | Market Comparable
Companies | | Enterprise Value/
Revenue | | | 1.7 | x | | | 8.8 | x | | | 6.2 | x | | Increase | |
| | | | | | | Discount for Lack of
Marketability | | | 15.0 | % | | | 15.0 | % | | | 15.0 | % | | Decrease | |
| | | $ | 13 | | | Discounted Cash Flow | | Weighted Average
Cost of Capital | | | 17.5 | % | | | 19.5 | % | | | 18.5 | % | | Decrease | |
| | | | | | | Perpetual Growth Rate | | | 3.0 | % | | | 4.0 | % | | | 3.5 | % | | Increase | |
| | | | | Market Comparable
Companies | | Enterprise Value/
Revenue | | | 1.6 | x | | | 7.7 | x | | | 5.3 | x | | Increase | |
| | | | | | | Discount for Lack of
Marketability | | | 20.0 | % | | | 20.0 | % | | | 20.0 | % | | Decrease | |
| | | $ | 21 | | | Discounted Cash Flow | | Weighted Average
Cost of Capital | | | 16.5 | % | | | 18.5 | % | | | 17.5 | % | | Decrease | |
| | | | | | | Perpetual Growth Rate | | | 3.0 | % | | | 4.0 | % | | | 3.5 | % | | Increase | |
| | | | | Market Comparable
Companies | | Enterprise Value/
Revenue | | | 8.5 | x | | | 12.1 | x | | | 9.2 | x | | Increase | |
| | | | | | | Discount for Lack of
Marketability | | | 20.0 | % | | | 20.0 | % | | | 20.0 | % | | Decrease | |
21
Morgan Stanley Institutional Fund, Inc.
Annual Report — December 31, 2017
Notes to Financial Statements (cont'd)
3. Repurchase Agreements: The Fund may enter into repurchase agreements under which the Fund lends cash and takes possession of securities with an agreement that the counterparty will repurchase such securities. In connection with transactions in repurchase agreements, a bank as custodian for the Fund takes possession of the underlying securities which are held as collateral, with a market value at least equal to the amount of the repurchase transaction, including principal and accrued interest. To the extent that any repurchase transaction exceeds one business day, the value of the collateral is marked-to-market on a daily basis to determine that the value of the collateral does not decrease below the repurchase price plus accrued interest as earned. If such a decrease occurs, additional collateral will be requested and, when received, will be added to the account to maintain full collateralization. In the event of default on the obligation to repurchase, the Fund has the right to liquidate the collateral and apply the proceeds in satisfaction of the obligation. In the event of default or bankruptcy by the counterparty to the agreement, realization of the collateral proceeds may be subject to cost and delays. The Fund, along with other affiliated investment companies, may utilize a joint trading account for the purpose of entering into repurchase agreements.
4. Foreign Currency Translation and Foreign Investments: The books and records of the Fund are maintained in U.S. dollars. Foreign currency amounts are translated into U.S. dollars as follows:
– investments, other assets and liabilities at the prevailing rate of exchange on the valuation date;
– investment transactions and investment income at the prevailing rates of exchange on the dates of such transactions.
Although the net assets of the Fund are presented at the foreign exchange rates and market values at the close of the period, the Fund does not isolate that portion of the results of operations arising as a result of changes in the foreign exchange rates from the fluctuations arising from changes in the market prices of securities held at period end. Similarly, the Fund does not isolate the effect of changes in foreign exchange rates from the fluctuations arising from changes in the market prices of securities sold during the period. Accordingly, realized and unrealized foreign currency gains (losses) on
investments in securities are included in the reported net realized and unrealized gains (losses) on investment transactions and balances. However, pursuant to U.S. federal income tax regulations, gains and losses from certain foreign currency transactions and the foreign currency portion of gains and losses realized on sales and maturities of foreign denominated debt securities are treated as ordinary income for U.S. federal income tax purposes.
Net realized gains (losses) on foreign currency transactions represent net foreign exchange gains (losses) from foreign currency forward exchange contracts, disposition of foreign currencies, currency gains (losses) realized between the trade and settlement dates on securities transactions, and the difference between the amount of investment income and foreign withholding taxes recorded on the Fund's books and the U.S. dollar equivalent amounts actually received or paid. Net unrealized currency gains (losses) from valuing foreign currency denominated assets and liabilities at period end exchange rates are reflected as a component of unrealized appreciation (depreciation) in the Statement of Assets and Liabilities. The change in unrealized currency gains (losses) on foreign currency translations for the period is reflected in the Statement of Operations.
Foreign security and currency transactions may involve certain considerations and risks not typically associated with those of U.S. dollar denominated transactions as a result of, among other factors, fluctuations of exchange rates in relation to the U.S. dollar, the possibility of lower levels of governmental supervision and regulation of foreign securities markets and the possibility of political or economic instability.
Governmental approval for foreign investments may be required in advance of making an investment under certain circumstances in some countries, and the extent of foreign investments in domestic companies may be subject to limitation in other countries. Foreign ownership limitations also may be imposed by the charters of individual companies to prevent, among other concerns, violations of foreign investment limitations. As a result, an additional class of shares (identified as "Foreign" in the Portfolio of Investments) may be created and offered for investment. The "local" and "foreign shares" market values may differ. In the absence of trading of the foreign shares in such markets, the Fund values the
22
Morgan Stanley Institutional Fund, Inc.
Annual Report — December 31, 2017
Notes to Financial Statements (cont'd)
foreign shares at the closing exchange price of the local shares.
5. Derivatives: The Fund may, but is not required to, use derivative instruments for a variety of purposes, including hedging, risk management, portfolio management or to earn income. Derivatives are financial instruments whose value is based, in part, on the value of an underlying asset, interest rate, index or financial instrument. Prevailing interest rates and volatility levels, among other things, also affect the value of derivative instruments. A derivative instrument often has risks similar to its underlying asset and may have additional risks, including imperfect correlation between the value of the derivative and the underlying asset, risks of default by the counterparty to certain transactions, magnification of losses incurred due to changes in the market value of the securities, instruments, indices or interest rates to which the derivative instrument relates, risks that the transactions may not be liquid and risks arising from margin requirements. The use of derivatives involves risks that are different from, and possibly greater than, the risks associated with other portfolio investments. Derivatives may involve the use of highly specialized instruments that require investment techniques and risk analyses different from those associated with other portfolio investments. All of the Fund's holdings, including derivative instruments, are marked-to-market each day with the change in value reflected in unrealized appreciation (depreciation). Upon disposition, a realized gain or loss is recognized.
Certain derivative transactions may give rise to a form of leverage. Leverage magnifies the potential for gain and the risk of loss. Leverage associated with derivative transactions may cause the Fund to liquidate portfolio positions when it may not be advantageous to do so to satisfy its obligations or to meet earmarking or segregation requirements, pursuant to applicable Securities and Exchange Commission ("SEC") rules and regulations, or may cause the Fund to be more volatile than if the Fund had not been leveraged. Although the Adviser seeks to use derivatives to further the Fund's investment objectives, there is no assurance that the use of derivatives will achieve this result.
Following is a description of the derivative instruments and techniques that the Fund used during the period and their associated risks:
Foreign Currency Forward Exchange Contracts: In connection with its investments in foreign securities, the Fund also entered into contracts with banks, brokers or dealers to purchase or sell securities or foreign currencies at a future date. A foreign currency forward exchange contract ("currency contract") is a negotiated agreement between the contracting parties to exchange a specified amount of currency at a specified future time at a specified rate. The rate can be higher or lower than the spot rate between the currencies that are the subject of the contract. Currency contracts may be used to protect against uncertainty in the level of future foreign currency exchange rates or to gain or modify exposure to a particular currency. To the extent hedged by the use of currency contracts, the precise matching of the currency contract amounts and the value of the securities involved will not generally be possible because the future value of such securities in foreign currencies will change as a consequence of market movements in the value of those securities between the date on which the contract is entered into and the date it matures. Furthermore, such transactions may reduce or preclude the opportunity for gain if the value of the currency should move in the direction opposite to the position taken. There is additional risk to the extent that currency contracts create exposure to currencies in which the Fund's securities are not denominated. Unanticipated changes in currency prices may result in poorer overall performance for the Fund than if it had not entered into such contracts. The use of currency contracts involves the risk of loss from the insolvency or bankruptcy of the counterparty to the contract or the failure of the counterparty to make payments or otherwise comply with the terms of the contract. A currency contract is marked-to-market daily and the change in market value is recorded by the Fund as unrealized gain or loss. The Fund records realized gains (losses) when the currency contract is closed equal to the difference between the value of the currency contract at the time it was opened and the value at the time it was closed.
23
Morgan Stanley Institutional Fund, Inc.
Annual Report — December 31, 2017
Notes to Financial Statements (cont'd)
Options: With respect to options, the Fund is subject to equity risk, interest rate risk and foreign currency exchange risk in the normal course of pursuing its investment objectives. If the Fund buys an option, it buys a legal contract giving it the right to buy or sell a specific amount of the underlying instrument or foreign currency, or futures contract on the underlying instrument or foreign currency, at an agreed-upon price during a period of time or on a specified date typically in exchange for a premium paid by the Fund. The Fund may purchase and/or sell put and call options. Purchasing call options tends to increase the Fund's exposure to the underlying (or similar) instrument. Purchasing put options tends to decrease the Fund's exposure to the underlying (or similar) instrument. When entering into purchased option contracts, the Fund bears the risk of interest or exchange rates or securities prices moving unexpectedly, in which case, the Fund may not achieve the anticipated benefits of the purchased option contracts; however the risk of loss is limited to the premium paid. Purchased options are reported as part of "Total Investments in Securities" in the Statement of Assets and Liabilities. Premium paid for purchasing options which expired are treated as realized losses. If the Fund sells an option, it sells to another party the right to buy from or sell to the Fund a specific amount of the underlying instrument or foreign currency, or futures contract on the underlying instrument or foreign currency, at an agreed-upon price during a period of time or on a specified date typically in exchange for a premium received by the Fund. When options are purchased OTC, the Fund bears the risk that the counterparty that wrote the option will be unable or unwilling to perform its obligations under the option contract. Options may also be illiquid and the Fund may have difficulty closing out its position. A decision as to whether, when and how to use options involves the exercise of skill and judgment and even a well-conceived option transaction may be unsuccessful because of market behavior or unexpected events. The prices of options can be highly volatile and the use of options can lower total returns.
FASB ASC 815, "Derivatives and Hedging" ("ASC 815"), is intended to improve financial reporting about derivative instruments by requiring enhanced disclosures to enable investors to better understand how and why the Fund uses derivative instruments, how these derivative instruments
are accounted for and their effects on the Fund's financial position and results of operations.
The following table sets forth the fair value of the Fund's derivative contracts by primary risk exposure as of December 31, 2017.
| | | Asset Derivatives
Statement of Assets and
Liabilities Location | | Primary Risk
Exposure | | Value
(000) | |
Options Purchased
| | Investments, at Value
(Options Purchased) | | Equity Risk | | | $499(a) | | |
(a) Amounts are included in Investments in Securities in the Statement of Assets and Liabilities.
| | | Liability Derivatives
Statement of Assets and
Liabilities Location | | Primary Risk
Exposure | | Value
(000) | |
Foreign Currency
Forward Exchange
Contracts | | Unrealized Depreciation on
Foreign Currency Forward
Exchange Contracts | |
Currency Risk | | $ | (63 | ) | |
The following table sets forth by primary risk exposure the Fund's change in unrealized appreciation (depreciation) by type of derivative contract for the year ended December 31, 2017 in accordance with ASC 815.
Realized Gain (Loss) | |
Primary Risk Exposure | | Derivative Type | | Value
(000) | |
Currency Risk | | Foreign Currency Forward
Exchange Contracts | | $ | (67 | ) | |
Change in Unrealized Appreciation (Depreciation) | |
Primary Risk Exposure | | Derivative Type | | Value
(000) | |
Equity Risk | | Investments
(Options Purchased) | | $ | (150 | )(b) | |
Currency Risk | | Foreign Currency Forward
Exchange Contracts | | | (180 | ) | |
| | | Total | | $ | (330 | ) | |
(b) Amounts are included in Investments in the Statement of Operations.
At December 31, 2017, the Fund's derivative assets and liabilities are as follows:
Presented in the Statement of Assets and Liabilities | | Gross Amounts of Assets and Liabilities | |
Derivatives(c) | | Assets(d)
(000) | | Liabilities(d)
(000) | |
Foreign Currency Forward Exchange Contracts | | $ | — | | | $ | (63 | ) | |
(c) Excludes exchange traded derivatives.
(d) Absent an event of default or early termination, OTC derivative assets and liabilities are presented gross and not offset in the Statement of Assets and Liabilities.
The Fund typically enters into International Swaps and Derivatives Association, Inc. Master Agreements ("ISDA Master Agreements") or similar master agreements (collectively, "Master Agreements") with its contract counterparties for certain OTC derivatives in order to,
24
Morgan Stanley Institutional Fund, Inc.
Annual Report — December 31, 2017
Notes to Financial Statements (cont'd)
among other things, reduce its credit risk to counterparties. ISDA Master Agreements include provisions for general obligations, representations, collateral and events of default or termination. Under an ISDA Master Agreement, the Fund typically may offset with the counterparty certain OTC derivative financial instruments' payables and/or receivables with collateral held and/or posted and create one single net payment (close-out netting) in the event of default, termination and/or potential deterioration in the credit quality of the counterparty. Various Master Agreements govern the terms of certain transactions with counterparties, including transactions such as swap, forward, repurchase and reverse repurchase agreements. These Master Agreements typically attempt to reduce the counterparty risk associated with such transactions by specifying credit protection mechanisms and providing standardization that improves legal certainty. Cross-termination provisions under Master Agreements typically provide that a default in connection with one transaction between the Fund and a counterparty gives the non-defaulting party the right to terminate any other transactions in place with the defaulting party to create one single net payment due to/due from the defaulting party and may be a feature in certain Master Agreements. In the event the Fund exercises its right to terminate a Master Agreement after a counterparty experiences a termination event as defined in the Master Agreement, the return of collateral with market value in excess of the Fund's net liability may be delayed or denied.
The following table presents derivative financial instruments that are subject to enforceable netting arrangements as of December 31, 2017.
Gross Amounts Not Offset in the Statement of Assets and Liabilities | |
Counterparty | | Gross Liability
Derivatives
Presented in
Statement of
Assets and
Liabilities
(000) | | Financial
Instrument
(000) | | Collateral
Received
(000) | | Net Amount
(not less
than $0)
(000) | |
UBS AG | | $ | 63 | | | $ | — | | | $ | — | | | $ | 63 | | |
For the year ended December 31, 2017, the approximate average monthly amount outstanding for each derivative type is as follows:
Foreign Currency Forward Exchange Contracts: | |
Average monthly principal amount | | $ | 2,174,000 | | |
Options Purchased: | |
Average monthly notional amount | | | 52,000 | | |
6. Securities Lending: The Fund lends securities to qualified financial institutions, such as broker-dealers, to earn additional income. Any increase or decrease in the fair value of the securities loaned that might occur and any interest earned or dividends declared on those securities during the term of the loan would remain in the Fund. The Fund would receive cash or securities as collateral in an amount equal to or exceeding 100% of the current fair value of the loaned securities. The collateral is marked-to-market daily by State Street Bank and Trust Company ("State Street"), the securities lending agent, to ensure that a minimum of 100% collateral coverage is maintained.
Based on pre-established guidelines, the securities lending agent invests any cash collateral that is received in an affiliated money market portfolio and repurchase agreements. Securities lending income is generated from the earnings on the invested collateral and borrowing fees, less any rebates owed to the borrowers and compensation to the lending agent, and is recorded as "Income from Securities Loaned — Net" in the Fund's Statement of Operations. Risks in securities lending transactions are that a borrower may not provide additional collateral when required or return the securities when due, and that the value of the short-term investments will be less than the amount of cash collateral plus any rebate that is required to be returned to the borrower.
The Fund has the right under the securities lending agreement to recover the securities from the borrower on demand.
The following table presents financial instruments that are subject to enforceable netting arrangements as of December 31, 2017.
Gross Amounts Not Offset in the Statement of Assets and Liabilities | |
Gross Asset
Amounts
Presented in
Statement of
Assets and
Liabilities
(000) | | Financial
Instrument
(000) | | Collateral
Received
(000) | | Net Amount
(not less
than $0)
(000) | |
| $ | 3,139 | (e) | | $ | — | | | $ | (3,139 | )(f)(g) | | $ | 0 | | |
(e) Represents market value of loaned securities at year end.
(f) The Fund received cash collateral of approximately $3,254,000, which was subsequently invested in Repurchase Agreements and Morgan Stanley Institutional Liquidity Funds as reported in the Portfolio of Investments.
(g) The actual collateral received is greater than the amount shown here due to overcollateralization.
25
Morgan Stanley Institutional Fund, Inc.
Annual Report — December 31, 2017
Notes to Financial Statements (cont'd)
FASB ASC 860 "Transfers & Servicing: Repurchase-to-Maturity Transactions, Repurchase Financings, and Disclosures", is intended to provide increased transparency about the types of collateral pledged in securities lending transactions and other similar transactions that are accounted for as secured borrowing.
The following table displays a breakdown of transactions accounted for as secured borrowings, the gross obligations by class of collateral pledged, and the remaining contractual maturity of those transactions as of December 31, 2017.
Remaining Contractual Maturity of the Agreements | |
| | | Overnight and
Continuous
(000) | | <30 days
(000) | | Between
30 &
90 days
(000) | | >90 days
(000) | | Total
(000) | |
Securities Lending
Transactions | |
Common Stocks | | $ | 3,254 | | | $ | — | | | $ | — | | | $ | — | | | $ | 3,254 | | |
Total Borrowings | | $ | 3,254 | | | $ | — | | | $ | — | | | $ | — | | | $ | 3,254 | | |
Gross amount of
recognized liabilities
for securities lending
transactions | | | | | | | | | | $ | 3,254 | | |
7. Restricted Securities: The Fund invests in unregistered or otherwise restricted securities. The term "restricted securities" refers to securities that are unregistered or are held by control persons of the issuer and securities that are subject to contractual restrictions on their resale. As a result, restricted securities may be more difficult to value and the Fund may have difficulty disposing of such assets either in a timely manner or for a reasonable price. In order to dispose of an unregistered security, the Fund, where it has contractual rights to do so, may have to cause such security to be registered. A considerable period may elapse between the time the decision is made to sell the security and the time the security is registered so that the Fund can sell it. Contractual restrictions on the resale of securities vary in length and scope and are generally the result of a negotiation between the issuer and the acquirer of the securities. The Fund would, in either case, bear market risks during that period. Restricted securities are identified in the Portfolio of Investments.
8. Indemnifications: The Company enters into contracts that contain a variety of indemnifications. The Company's maximum exposure under these arrangements is unknown. However, the Company has not had prior claims or losses pursuant to these contracts and expects the risk of loss to be remote.
9. Dividends and Distributions to Shareholders: Dividends and distributions to shareholders are recorded on the ex-dividend date. Dividends from net investment income, if any, are declared and paid annually. Net realized capital gains, if any, are distributed at least annually.
10. Security Transactions, Income and Expenses: Security transactions are accounted for on the trade date (date the order to buy or sell is executed). Realized gains and losses on the sale of investment securities are determined on the specific identified cost method. Dividend income and other distributions are recorded on the ex-dividend date (except for certain foreign dividends which may be recorded as soon as the Fund is informed of such dividends) net of applicable withholding taxes. Interest income is recognized on the accrual basis except where collection is in doubt. Discounts are accreted and premiums are amortized over the life of the respective securities. Most expenses of the Company can be directly attributed to a particular Fund. Expenses which cannot be directly attributed are apportioned among the Funds based upon relative net assets or other appropriate methods. Income, expenses (other than class specific expenses — distribution and shareholder services, transfer agency and sub transfer agency fees) and realized and unrealized gains or losses are allocated to each class of shares based upon their relative net assets.
B. Advisory Fees: The Adviser, a wholly-owned subsidiary of Morgan Stanley, provides the Fund with advisory services under the terms of an Investment Advisory Agreement, paid quarterly, at the annual rate based on the daily net assets as follows:
First $1
billion | | Over $1
billion | |
| | 0.90 | % | | | 0.85 | % | |
For the year ended December 31, 2017, the advisory fee rate (net of waiver/rebate) was equivalent to an annual effective rate of 0.86% of the Fund's average daily net assets.
The Adviser has agreed to reduce its advisory fee and/or reimburse the Fund so that total annual portfolio operating expenses, excluding certain investment related expenses, taxes, interest and other extraordinary expenses (including litigation), will not exceed 1.35% for Class I shares, 1.70% for Class A shares, 2.20% for Class L shares and 2.45% for Class C shares. The fee waivers and/or expense reimbursements will continue for at least one year from the date of the Fund's prospectus or until such time as the Directors act to discontinue all or a
26
Morgan Stanley Institutional Fund, Inc.
Annual Report — December 31, 2017
Notes to Financial Statements (cont'd)
portion of such waivers and/or reimbursements when they deem such action is appropriate. For the year ended December 31, 2017, approximately $19,000 of advisory fees were waived and approximately $49,000 of other expenses were reimbursed by the Adviser pursuant to this arrangement.
C. Administration Fees: The Adviser also serves as Administrator to the Company and provides administrative services pursuant to an Administration Agreement for an annual fee, accrued daily and paid monthly, of 0.08% of the Fund's average daily net assets.
Under a Sub-Administration Agreement between the Administrator and State Street, State Street provides certain administrative services to the Company. For such services, the Administrator pays State Street a portion of the fee the Administrator receives from the Fund.
D. Distribution and Shareholder Services Fees: Morgan Stanley Distribution, Inc. ("MSDI" or the "Distributor"), a wholly-owned subsidiary of the Adviser and an indirect subsidiary of Morgan Stanley, serves as the Company's Distributor of Fund shares pursuant to a Distribution Agreement. The Company has adopted a Shareholder Services Plan with respect to Class A shares pursuant to Rule 12b-1 under the Act. Under the Shareholder Services Plan, the Fund pays the Distributor a shareholder services fee, accrued daily and paid monthly, at an annual rate of 0.25% of the Fund's average daily net assets attributable to Class A shares.
The Company has adopted a Distribution and Shareholder Services Plan with respect to Class L shares pursuant to Rule 12b-1 under the Act. Under the Distribution and Shareholder Services Plan, the Fund pays the Distributor a distribution fee, accrued daily and paid monthly, at an annual rate of 0.50% and a shareholder services fee, accrued daily and paid monthly, at an annual rate of 0.25% of the Fund's average daily net assets attributable to Class L shares.
The Company has adopted a Distribution and Shareholder Services Plan with respect to Class C shares pursuant to Rule 12b-1 under the Act. Under the Distribution and Shareholder Services Plan, the Fund pays the Distributor a distribution fee, accrued daily and paid monthly, at an annual rate of 0.75% and a shareholder services fee, accrued daily and paid monthly, at an annual rate of 0.25% of the Fund's average daily net assets attributable to Class C shares.
The distribution and shareholder services fees are used to support the expenses associated with servicing and maintaining
accounts. The Distributor may compensate other parties for providing shareholder support services to investors who purchase Class A, Class L and Class C shares.
E. Dividend Disbursing and Transfer Agent: The Company's dividend disbursing and transfer agent is Boston Financial Data Services, Inc. ("BFDS"). Pursuant to a Transfer Agency Agreement, the Company pays BFDS a fee based on the number of classes, accounts and transactions relating to the Funds of the Company. Effective January 1, 2018, BFDS changed its name to DST Asset Manager Solutions, Inc.
F. Custodian Fees: State Street (the "Custodian") also serves as Custodian for the Company in accordance with a Custodian Agreement. The Custodian holds cash, securities, and other assets of the Company as required by the Act. Custody fees are payable monthly based on assets held in custody, investment purchases and sales activity and account maintenance fees, plus reimbursement for certain out-of-pocket expenses.
G. Security Transactions and Transactions with Affiliates: For the year ended December 31, 2017, purchases and sales of investment securities for the Fund, other than long-term U.S. Government securities and short-term investments, were approximately $111,517,000 and $47,005,000, respectively. There were no purchases and sales of long-term U.S. Government securities for the year ended December 31, 2017.
The Fund invests in the Institutional Class of the Morgan Stanley Institutional Liquidity Funds — Treasury Securities Portfolio (the "Liquidity Funds"), an open-end management investment company managed by the Adviser, both directly and as a portion of the securities held as collateral on loaned securities. Advisory fees paid by the Fund are reduced by an amount equal to its pro-rata share of the advisory and administration fees paid by the Fund due to its investment in the Liquidity Funds. For the year ended December 31, 2017, advisory fees paid were reduced by approximately $10,000 relating to the Fund's investment in the Liquidity Funds.
A summary of the Fund's transactions in shares of the Liquidity Funds during the year ended December 31, 2017 is as follows:
Affiliated
Investment
Company | | Value
December 31,
2016
(000) | | Purchases
at Cost
(000) | | Proceeds
from Sales
(000) | | Dividend
Income
(000) | |
Liquidity Funds | | $ | 4,886 | | | $ | 80,813 | | | $ | 75,642 | | | $ | 43 | | |
27
Morgan Stanley Institutional Fund, Inc.
Annual Report — December 31, 2017
Notes to Financial Statements (cont'd)
Affiliated
Investment
Company (cont'd) | | Realized
Gain
(Loss)
(000) | | Change in
Unrealized
Appreciation
(Depreciation)
(000) | | Value
December 31,
2017
(000) | |
Liquidity Funds | | $ | — | | | $ | — | | | $ | 10,057 | | |
During the year ended December 31, 2017, the Fund incurred less than $500 in brokerage commissions with Morgan Stanley & Co., LLC, an affiliate of the Adviser/Administrator and Distributor, for portfolio transactions executed on behalf of the Fund.
The Fund is permitted to purchase and sell securities ("cross-trade") from and to other Morgan Stanley Funds as well as other funds and client accounts for which the Adviser or an affiliate of the Adviser serves as investment adviser, pursuant to procedures approved by the Directors in compliance with Rule 17a-7 under the Act (the "Rule"). Each cross-trade is executed at the current market price in compliance with provisions of the Rule. For the year ended December 31, 2017, the Fund did not engage in any cross-trade transactions.
The Fund has an unfunded Deferred Compensation Plan (the "Compensation Plan"), which allows each independent Director to defer payment of all, or a portion, of the fees he or she receives for serving on the Board of Directors. Each eligible Director generally may elect to have the deferred amounts credited with a return equal to the total return on one or more of the Morgan Stanley funds that are offered as investment options under the Compensation Plan. Appreciation/depreciation and distributions received from these investments are recorded with an offsetting increase/decrease in the deferred compensation obligation and do not affect the NAV of the Fund.
H. Federal Income Taxes: It is the Fund's intention to continue to qualify as a regulated investment company and distribute all of its taxable and tax-exempt income. Accordingly, no provision for federal income taxes is required in the financial statements.
The Fund may be subject to taxes imposed by countries in which it invests. Such taxes are generally based on income and/or capital gains earned or repatriated. Taxes are accrued based on net investment income, net realized gains and net unrealized appreciation as such income and/or gains are earned. Taxes may also be based on transactions in foreign currency and are accrued based on the value of investments denominated in such currency.
FASB ASC 740-10, "Income Taxes — Overall", sets forth a minimum threshold for financial statement recognition of the
benefit of a tax position taken or expected to be taken in a tax return. Management has concluded there are no significant uncertain tax positions that would require recognition in the financial statements. If applicable, the Fund recognizes interest accrued related to unrecognized tax benefits in "Interest Expense" and penalties in "Other Expenses" in the Statement of Operations. The Fund files tax returns with the U.S. Internal Revenue Service, New York and various states. Generally, each of the tax years in the four-year period ended December 31, 2017, remains subject to examination by taxing authorities.
The tax character of distributions paid may differ from the character of distributions shown in the Statements of Changes in Net Assets due to short-term capital gains being treated as ordinary income for tax purposes. The tax character of distributions paid during fiscal years 2017 and 2016 was as follows:
2017
Distributions
Paid From: | | 2016
Distributions
Paid From: | |
Ordinary
Income
(000) | | Long-Term
Capital Gain
(000) | | Ordinary
Income
(000) | | Long-Term
Capital Gain
(000) | |
| $ | 3,437 | | | $ | 2,602 | | | $ | 377 | | | $ | 202 | | |
The amount and character of income and gains to be distributed are determined in accordance with income tax regulations which may differ from GAAP. These book/tax differences are either considered temporary or permanent in nature.
Temporary differences are primarily due to differing book and tax treatments for the timing of the recognition of gains (losses) on certain investment transactions and the timing of the deductibility of certain expenses.
Permanent differences, primarily due to differing treatments of gains (losses) related to foreign currency transactions and a distribution redesignation, resulted in the following reclassifications among the components of net assets at December 31, 2017:
Distributions
in Excess of Net
Investment
Income
(000) | | Accumulated
Undistributed
Net Realized
Gain
(000) | | Paid-in-
Capital
(000) | |
| $ | 60 | | | $ | (60 | ) | | $ | — | | |
At December 31, 2017, the components of distributable earnings for the Fund on a tax basis were as follows:
Undistributed
Ordinary
Income
(000) | | Undistributed
Long-Term
Capital Gain
(000) | |
| $ | 1,738 | | | $ | 783 | | |
28
Morgan Stanley Institutional Fund, Inc.
Annual Report — December 31, 2017
Notes to Financial Statements (cont'd)
I. Credit Facility: The Company and other Morgan Stanley funds participated in a $150,000,000 committed, unsecured revolving line of credit facility (the "Facility") with State Street. This Facility is to be used for temporary emergency purposes or funding of shareholder redemption requests. The interest rate on borrowings is based on the federal funds rate or 1 month LIBOR rate plus a spread. The Facility also has a commitment fee of 0.25% per annum based on the unused portion of the Facility. During the year ended December 31, 2017, the Fund did not have any borrowings under the Facility.
J. Other: At December 31, 2017, the Fund had record owners of 10% or greater. Investment activities of these shareholders could have a material impact on the Fund. The aggregate percentage of such owners was 51.5%.
29
Morgan Stanley Institutional Fund, Inc.
Annual Report — December 31, 2017
Report of Independent Registered Public Accounting Firm
To the Shareholders and Board of Directors of
Morgan Stanley Institutional Fund, Inc. —
Global Discovery Portfolio
Opinion on the Financial Statements
We have audited the accompanying statement of assets and liabilities of Global Discovery Portfolio (the "Fund") (one of the funds constituting the Morgan Stanley Institutional Fund, Inc. (the "Company")), including the portfolio of investments, as of December 31, 2017, and the related statement of operations for the year then ended, the statements of changes in net assets for each of the two years in the period then ended, the financial highlights for each of the five years in the period then ended and the related notes (collectively referred to as the "financial statements"). In our opinion, the financial statements present fairly, in all material respects, the financial position of Global Discovery Portfolio (one of the funds constituting Morgan Stanley Institutional Fund, Inc.) at December 31, 2017, the results of its operations for the year then ended, the changes in its net assets for each of the two years in the period then ended and its financial highlights for each of the five years in the period then ended, in conformity with U.S. generally accepted accounting principles.
Basis for Opinion
These financial statements are the responsibility of the Company's management. Our responsibility is to express an opinion on the Fund's financial statements based on our audits. We are a public accounting firm registered with the Public Company Accounting Oversight Board (United States) ("PCAOB") and are required to be independent with respect to the Company in accordance with the U.S. federal securities law and the applicable rules and regulations of the Securities and Exchange Commission and the PCAOB.
We conducted our audits in accordance with the standards of the PCAOB. Those standards require that we plan and perform the audit to obtain reasonable assurance about whether the financial statements are free of material misstatement, whether due to error or fraud. The Company is not required to have, nor were we engaged to perform, an audit of the Company's internal control over financial reporting. As part of our audits, we are required to obtain an understanding of internal control over financial reporting, but not for the purpose of expressing an opinion on the effectiveness of the Company's internal control over financial reporting. Accordingly, we express no such opinion.
Our audits included performing procedures to assess the risks of material misstatement of the financial statements, whether due to error or fraud, and performing procedures that respond to those risks. Such procedures included examining, on a test basis, evidence regarding the amounts and disclosures in the financial statements. Our procedures included confirmation of securities owned as of December 31, 2017 by correspondence with the custodian and others or by other appropriate auditing procedures where replies from others were not received. Our audits also included evaluating the accounting principles used and significant estimates made by management, as well as evaluating the overall presentation of the financial statements. We believe that our audits provide a reasonable basis for our opinion.

We have served as the auditor of one or more Morgan Stanley investment companies since 2000.
Boston, Massachusetts
February 26, 2018
30
Morgan Stanley Institutional Fund, Inc.
Annual Report — December 31, 2017
Federal Tax Notice (unaudited)
For federal income tax purposes, the following information is furnished with respect to the distributions paid by the Fund during its taxable year ended December 31, 2017. For corporate shareholders 8.3% of the dividends qualified for the dividends received deduction.
The Fund designated and paid approximately $2,602,000 as a long-term capital gain distribution.
For federal income tax purposes, the following information is furnished with respect to the Fund's earnings for its taxable year ended December 31, 2017. When distributed, certain earnings may be subject to a maximum tax rate of 15% as provided for by the Jobs and Growth Tax Relief Reconciliation Act of 2003. The Fund designated up to a maximum of approximately $3,437,000 as taxable at this lower rate.
In January, the Fund provides tax information to shareholders for the preceding calendar year.
31
Morgan Stanley Institutional Fund, Inc.
Annual Report — December 31, 2017
Privacy Notice (unaudited)
MORGAN STANLEY INVESTMENT MANAGEMENT INC.
AN IMPORTANT NOTICE CONCERNING OUR U.S. PRIVACY POLICY
We are required by federal law to provide you with a copy of our privacy policy annually. This policy applies to current and former individual investors in funds managed or sponsored by Morgan Stanley Investment Management Inc. ("MSIM") as well as current and former individual clients of MSIM. This policy is not applicable to partnerships, corporations, trusts or other non-individual clients or investors. Please note that we may amend this policy at any time, and will inform you of any changes as required by law.
WE RESPECT YOUR PRIVACY
We appreciate that you have provided us with your personal financial information. We strive to maintain the privacy of such information while we help you achieve your financial objectives. This Notice describes what non-public personal information we collect about you, why we collect it, when we may share it with others and how certain others may use it. It discusses the steps you may take to limit our sharing of certain information about you to affiliated companies in the Morgan Stanley family of companies ("other Morgan Stanley companies"). It also discloses how you may limit use of certain shared information for marketing purposes by other Morgan Stanley branded companies. Throughout this policy, we refer to the non-public information that personally identifies you or your accounts as "personal information.''
1. WHAT PERSONAL INFORMATION DO WE COLLECT ABOUT YOU?
We obtain personal information from applications and other forms you submit to us, from your dealings with us, from consumer reporting agencies, from our Web sites and from third parties and other sources.
For example:
• We may collect information such as your name, address, e-mail address, telephone/fax numbers, assets, income and investment objectives through subscription documents, applications and other forms you submit to us.
• We may obtain information about account balances, your use of account(s) and the types of products and services you prefer to receive from us through your dealings and transactions with us and other sources.
• We may obtain information about your creditworthiness and credit history from consumer reporting agencies.
• We may collect background information from and through third-party vendors to verify representations you have made and to comply with various regulatory requirements.
• If you interact with us through our public and private Web sites, we may collect information that you provide directly through online communications (such as an e-mail address). We may also collect information about your Internet service provider, your domain name, your computer's operating system and Web browser, your use of our Web sites and your product and service preferences, through the use of "cookies." Please consult the Terms of Use of these sites for more details.
2. WHEN DO WE DISCLOSE PERSONAL INFORMATION WE COLLECT ABOUT YOU?
We may disclose personal information we collect about you to other Morgan Stanley companies and to non-affiliated third parties.
a. Information We Disclose to Other Morgan Stanley Companies.
We may disclose personal information to other Morgan Stanley companies for a variety of reasons, including to manage your account(s) effectively, to service and process your transactions, to let you know about products and services offered by us and other Morgan Stanley companies, to manage our business, and as otherwise required or permitted by law. Offers for products and services from other Morgan Stanley companies are developed under conditions designed to safeguard your personal information.
32
Morgan Stanley Institutional Fund, Inc.
Annual Report — December 31, 2017
Privacy Notice (unaudited) (cont'd)
b. Information We Disclose to Non-affiliated Third Parties.
We do not disclose personal information that we collect about you to non-affiliated third parties except to those who provide marketing services on our behalf, to financial institutions with whom we have joint marketing agreements, and as otherwise required or permitted by law. For example, we may disclose personal information to non-affiliated third parties for servicing and processing transactions, to offer our own products and services, to protect against fraud, for institutional risk control, to respond to judicial process or to perform services on our behalf. When we share personal information with a non-affiliated third party, they are required to limit their use of personal information to the particular purpose for which it was shared and they are not allowed to share personal information with others except to fulfill that limited purpose or as may be permitted or required by law.
3. HOW DO WE PROTECT THE SECURITY AND CONFIDENTIALITY OF PERSONAL INFORMATION WE COLLECT ABOUT YOU?
We maintain physical, electronic and procedural security measures to help safeguard the personal information we collect about you. We have internal policies governing the proper handling of client information. Third parties that provide support or marketing services on our behalf may also receive personal information, and we require them to adhere to confidentiality standards with respect to such information.
4. HOW CAN YOU LIMIT THE SHARING OF CERTAIN TYPES OF PERSONAL INFORMATION WITH OTHER MORGAN STANLEY COMPANIES?
We offer you choices as to whether we share with other Morgan Stanley companies the personal information that was collected to determine your eligibility for products and services you request ("eligibility information"). Eligibility information does not include your identification information or personal information pertaining to our transactions or experiences with you. Please note that, even if you direct us not to share eligibility information with other Morgan Stanley companies ("opt-out"), we may still share personal information, including eligibility information, with those companies in circumstances excluded from the opt-out under applicable law, such as to process transactions or to service your account.
5. HOW CAN YOU LIMIT THE USE OF CERTAIN TYPES OF PERSONAL INFORMATION BY OTHER MORGAN STANLEY COMPANIES FOR MARKETING?
By following the opt-out instructions in Section 6 below, you may limit other Morgan Stanley branded companies from marketing their products or services to you based on personal information we disclose to them. This information may include, for example, your income and account history with us. Please note that, even if you choose to limit Other Morgan Stanley Companies from using personal information about you that we may share with them for marketing their products and services to you, Other Morgan Stanley Companies may use your personal information that they obtain from us to market to you in circumstances permitted by law, such as if the Other Morgan Stanley Company has its own relationship with you.
6. HOW CAN YOU SEND US AN OPT-OUT INSTRUCTION?
If you wish to limit our sharing of eligibility information about you with other Morgan Stanley companies or other Morgan Stanley companies' use of personal information for marketing purposes, as described in this notice, you may do so by:
• Calling us at (800) 548-7786
Monday–Friday between 8a.m. and 6p.m.(EST)
• Writing to us at the following address:
DST Asset Manager Solutions, Inc.
c/o Privacy Coordinator
P.O. Box 219804
Kansas City, Missouri 64121
33
Morgan Stanley Institutional Fund, Inc.
Annual Report — December 31, 2017
Privacy Notice (unaudited) (cont'd)
Your written request should include your name, address, telephone number and account number(s) to which the opt-out applies and whether you are opting out with respect to sharing of eligibility information (Section 4 above), or if information used for Marketing (Section 5 above) or both. Written opt-out requests should not be sent with any other correspondence. In order to process your request, we require that the request be provided by you directly and not through a third party.
Your opt-out preference will remain in effect with respect to this policy (as it may be amended) until you notify us otherwise. If you have a joint account, your direction for us not to share this information with other Morgan Stanley companies and for those other Morgan Stanley companies not to use your personal information for marketing will be applied to all account holders on that account. Please understand that if you limit our sharing or our affiliated companies' use of personal information, you and any joint account holder(s) may not receive information about Morgan Stanley products and services, including products or services that could help you manage your financial resources and achieve your investment objectives.
7. WHAT IF AN AFFILIATED COMPANY BECOMES A NON-AFFILIATED THIRD PARTY?
If, at any time in the future, an affiliated company becomes a non-affiliated third party, further disclosures of personal information made to the former affiliated company will be limited to those described in Section 2(b) above relating to non-affiliated third parties. If you elected under Section 6 to limit disclosures we make to affiliated companies, or use of personal information by affiliated companies, your election will not apply to use by any former affiliated company of your personal information in their possession once it becomes a non-affiliated third party.
SPECIAL NOTICE TO RESIDENTS OF VERMONT
The following section supplements our policy with respect to our individual clients who have a Vermont address and supersedes anything to the contrary in the above policy with respect to those clients only.
The state of Vermont requires financial institutions to obtain your consent prior to sharing personal information that they collect about you with affiliated companies and non-affiliated third parties other than in certain limited circumstances. Except as permitted by law, we will not share personal information we collect about you with non-affiliated third parties or other Morgan Stanley companies unless you provide us with your written consent to share such information ("opt-in").
If you wish to receive offers for investment products and services offered by or through other Morgan Stanley companies, please notify us in writing at the following address:
DST Asset Manager Solutions, Inc.
c/o Privacy Coordinator
P.O. Box 219804
Kansas City, Missouri 64121
Your authorization should include your name, address, telephone number and account number(s) to which the opt-in applies and should not be sent with any other correspondence. In order to process your authorization, we require that the authorization be provided by you directly and not through a third party.
SPECIAL NOTICE TO RESIDENTS OF CALIFORNIA
The following section supplements our policy with respect to our individual clients who have a California address and supersedes anything to the contrary in the above policy with respect to those clients only.
In response to a California law, if your account has a California home address, your personal information will not be disclosed to non-affiliated third parties except as permitted by applicable California law, and we will limit sharing such information with our affiliates to comply with California privacy laws that apply to us.
34
Morgan Stanley Institutional Fund, Inc.
Annual Report — December 31, 2017
Director and Officer Information (unaudited)
Independent Directors:
Name, Age and Address of
Independent Director | | Position(s)
Held with
Registrant | | Length of Time
Served* | | Principal Occupation(s) During Past 5 Years
and Other Relevant Professional Experience | | Number of
Portfolios in
Fund Complex
Overseen by
Independent
Director** | | Other Directorships
Held by Independent
Director*** | |
Frank L. Bowman (73)
c/o Perkins Coie LLP
Counsel to the Independent
Directors
30 Rockefeller Plaza
New York, NY 10112 | | Director | | Since
August
2006 | | President, Strategic Decisions, LLC (consulting) (since February 2009); Director or Trustee of various Morgan Stanley Funds (since August 2006); Chairperson of the Compliance and Insurance Committee (since October 2015); formerly, Chairperson of the Insurance Sub-Committee of the Compliance and Insurance Committee (2007-2015); served as President and Chief Executive Officer of the Nuclear Energy Institute (policy organization) (February 2005-November 2008); retired as Admiral, U.S. Navy after serving over 38 years on active duty including 8 years as Director of the Naval Nuclear Propulsion Program in the Department of the Navy and the U.S. Department of Energy (1996-2004); served as Chief of Naval Personnel (July 1994-September 1996) and on the Joint Staff as Director of Political Military Affairs (June 1992-July 1994); knighted as Honorary Knight Commander of the Most Excellent Order of the British Empire; awarded the Officier de l'Orde National du Mérite by the French Government; elected to the National Academy of Engineering (2009). | | | 88 | | | Director of BP p.l.c.; Director of Naval and Nuclear Technologies LLP; Director Emeritus of the Armed Services YMCA; Director of the U.S. Naval Submarine League; Member of the National Security Advisory Council of the Center for U.S. Global Engagement and a member of the CNA Military Advisory Board; Trustee of Fairhaven United Methodist Church; and Director of other various non-profit organizations. | |
Kathleen A. Dennis (64)
c/o Perkins Coie LLP
Counsel to the Independent Directors
30 Rockefeller Plaza
New York, NY 10112 | | Director | | Since
August
2006 | | President, Cedarwood Associates (mutual fund and investment management consulting) (since July 2006); Chairperson of the Liquidity and Alternatives Sub-Committee of the Investment Committee (since October 2006) and Director or Trustee of various Morgan Stanley Funds (since August 2006); formerly, Senior Managing Director of Victory Capital Management (1993-2006). | | | 89 | | | Director of various non-profit organizations. | |
Nancy C. Everett (62)
c/o Perkins Coie LLP
Counsel to the Independent Directors
30 Rockefeller Plaza
New York, NY 10112 | | Director | | Since
January
2015 | | Chief Executive Officer, Virginia Commonwealth University Investment Company (since November 2015); Owner, OBIR, LLC (institutional investment management consulting) (since June 2014); formerly, Managing Director, BlackRock Inc. (February 2011-December 2013); and Chief Executive Officer, General Motors Asset Management (a/k/a Promark Global Advisors, Inc.) (June 2005-May 2010). | | | 90 | | | Formerly, Member of Virginia Commonwealth University School of Business Foundation (2005-2016); Member of Virginia Commonwealth University Board of Visitors (2013-2015); Member of Committee on Directors for Emerging Markets Growth Fund, Inc. (2007-2010); Chairperson of Performance Equity Management, LLC (2006-2010); and Chairperson, GMAM Absolute Return Strategies Fund, LLC (2006-2010). | |
35
Morgan Stanley Institutional Fund, Inc.
Annual Report — December 31, 2017
Director and Officer Information (unaudited) (cont'd)
Independent Directors: (cont'd)
Name, Age and Address of
Independent Director | | Position(s)
Held with
Registrant | | Length of Time
Served* | | Principal Occupation(s) During Past 5 Years
and Other Relevant Professional Experience | | Number of
Portfolios in
Fund Complex
Overseen by
Independent
Director** | | Other Directorships
Held by Independent
Director*** | |
Jakki L. Haussler (60)
c/o Perkins Coie LLP
Counsel to the Independent Directors
30 Rockefeller Plaza
New York, NY 10112 | | Director | | Since
January
2015 | | Chairman and Chief Executive Officer, Opus Capital Group (since January 1996); formerly, Director, Capvest Venture Fund, LP (May 2000-December 2011); Partner, Adena Ventures, LP (July 1999-December 2010); Director, The Victory Funds (February 2005-July 2008). | | | 90 | | | Director of Cincinnati Bell Inc. and Member, Audit Committee and Compensation Committee; Director of Northern Kentucky University Foundation and Member, Investment Committee; Member of Chase College of Law Transactional Law Practice Center Board of Advisors; Director of Best Transport; Director of Chase College of Law Board of Visitors; formerly, Member, University of Cincinnati Foundation Investment Committee; Member, Miami University Board of Visitors (2008-2011); Trustee of Victory Funds (2005-2008) and Chairman, Investment Committee (2007-2008) and Member, Service Provider Committee (2005-2008). | |
Dr. Manuel H. Johnson (68)
c/o Johnson Smick
International, Inc.
220 I Street, NE — Suite 200
Washington, D.C. 20002 | | Director | | Since
July
1991 | | Senior Partner, Johnson Smick International, Inc. (consulting firm); Chairperson of the Investment Committee (since October 2006) and Director or Trustee of various Morgan Stanley Funds (since July 1991); Co-Chairman and a founder of the Group of Seven Council (G7C) (international economic commission); formerly, Chairperson of the Audit Committee (July 1991-September 2006), Vice Chairman of the Board of Governors of the Federal Reserve System and Assistant Secretary of the U.S. Treasury. | | | 88 | | | Director of NVR, Inc. (home construction). | |
Joseph J. Kearns (75)
c/o Kearns & Associates LLC
46 E Peninsula Center #385
Rolling Hills Estates,
CA 90274-3712 | | Director | | Since
August
1994 | | Senior Adviser, Kearns & Associates LLC (investment consulting); Chairperson of the Audit Committee (since October 2006) and Director or Trustee of various Morgan Stanley Funds (since August 1994); formerly, Deputy Chairperson of the Audit Committee (July 2003-September 2006) and Chairperson of the Audit Committee of various Morgan Stanley Funds (since August 1994); CFO of the J. Paul Getty Trust. | | | 89 | | | Prior to August 10, 2016, Director of Electro Rent Corporation (equipment leasing); Prior to December 31, 2013, Director of The Ford Family Foundation. | |
36
Morgan Stanley Institutional Fund, Inc.
Annual Report — December 31, 2017
Director and Officer Information (unaudited) (cont'd)
Independent Directors: (cont'd)
Name, Age and Address of
Independent Director | | Position(s)
Held with
Registrant | | Length of Time
Served* | | Principal Occupation(s) During Past 5 Years
and Other Relevant Professional Experience | | Number of
Portfolios in
Fund Complex
Overseen by
Independent
Director** | | Other Directorships
Held by Independent
Director*** | |
Michael F. Klein (59)
c/o Perkins Coie LLP
Counsel to the Independent Directors
30 Rockefeller Plaza
New York, NY 10112 | | Director | | Since
August
2006 | | Managing Director, Aetos Capital, LLC (since March 2000); Co-President, Aetos Alternatives Management, LLC (since January 2004) and Co-Chief Executive Officer of Aetos Capital LLC (since August 2013); Chairperson of the Fixed Income Sub-Committee of the Investment Committee (since October 2006) and Director or Trustee of various Morgan Stanley Funds (since August 2006); formerly, Managing Director, Morgan Stanley & Co. Inc. and Morgan Stanley Dean Witter Investment Management, President, various Morgan Stanley Funds (June 1998-March 2000) and Principal, Morgan Stanley & Co. Inc. and Morgan Stanley Dean Witter Investment Management (August 1997-December 1999). | | | 88 | | | Director of certain investment funds managed or sponsored by Aetos Capital, LLC; Director of Sanitized AG and Sanitized Marketing AG (specialty chemicals). | |
Patricia Maleski (57)
c/o Perkins Coie LLP
Counsel to the Independent Directors
30 Rockefeller Plaza
New York, NY 10112 | | Director | | Since
January
2017 | | Managing Director, JPMorgan Asset Management (2004-2016); Oversight and Control Head of Fiduciary and Conflicts of Interest Program (2015-2016); Chief Control Officer-Global Asset Management (2013-2015); President, JPMorgan Funds (2010-2013); Chief Administrative Officer (2004-2013); various other positions including Treasurer and Board Liaison (since 2001). | | | 90 | | | | None. | | |
Michael E. Nugent (81)
522 Fifth Avenue
New York, NY 10036 | | Chair of the Board and Director | | Chair of the Boards since July 2006 and Director since July 1991 | | Chair of the Boards of various Morgan Stanley Funds (since July 2006); Chairperson of the Closed-End Fund Committee (since June 2012) and Director or Trustee of various Morgan Stanley Funds (since July 1991); formerly, Chairperson of the Insurance Committee (until July 2006); General Partner, Triumph Capital, L.P. (private investment partnership) (1988-2013). | | | 88 | | | | None. | | |
W. Allen Reed (70)
c/o Perkins Coie LLP
Counsel to the Independent Directors
30 Rockefeller Plaza
New York, NY 10112 | | Director | | Since
August
2006 | | Chairperson of the Equity Sub-Committee of the Investment Committee (since October 2006) and Director or Trustee of various Morgan Stanley Funds (since August 2006); formerly, President and CEO of General Motors Asset Management; Chairman and Chief Executive Officer of the GM Trust Bank and Corporate Vice President of General Motors Corporation (August 1994-December 2005). | | | 89 | | | Director of Legg Mason, Inc.; formerly, Director of the Auburn University Foundation (2010-2015). | |
Fergus Reid (85)
c/o Joe Pietryka, Inc.
85 Charles Colman Blvd.
Pawling, NY 12564 | | Director | | Since
June
1992 | | Chairman, Joe Pietryka, Inc.; Chairperson of the Governance Committee and Director or Trustee of various Morgan Stanley Funds (since June 1992). | | | 89 | | | Formerly, Trustee and Director of certain investment companies in the JP Morgan Fund Complex managed by JP Morgan Investment Management Inc. (1987-2012). | |
* This is the earliest date the Director began serving the Morgan Stanley Funds. Each Director serves an indefinite term, until his or her successor is elected.
** The Fund Complex includes (as of December 31, 2017) all open-end and closed-end funds (including all of their portfolios) advised by Morgan Stanley Investment Management Inc. (the "Adviser") and any funds that have an adviser that is an affiliated person of the Adviser (including, but not limited to, Morgan Stanley AIP GP LP).
*** This includes any directorships at public companies and registered investment companies held by the Director at any time during the past five years.
37
Morgan Stanley Institutional Fund, Inc.
Annual Report — December 31, 2017
Director and Officer Information (unaudited) (cont'd)
Executive Officers:
Name, Age and Address of Executive Officer | | Position(s) Held
with
Registrant | | Length of Time
Served* | | Principal Occupation(s) During Past 5 Years | |
John H. Gernon (54)
522 Fifth Avenue
New York, NY 10036 | | President and Principal Executive Officer | | Since
September
2013 | | President and Principal Executive Officer of the Equity and Fixed Income Funds and the Morgan Stanley AIP Funds (since September 2013) and the Liquidity Funds and various money market funds (since May 2014) in the Fund Complex; Managing Director of the Adviser; Head of Product (since 2006). | |
Timothy J. Knierim (58)
522 Fifth Avenue
New York, NY 10036 | | Chief Compliance Officer | | Since
December
2016 | | Managing Director of the Adviser and various entities affiliated with the Adviser; Chief Compliance Officer of various Morgan Stanley Funds and the Adviser (since December 2016) and Chief Compliance Officer of Morgan Stanley AIP GP LP (since 2014). Formerly, Managing Director and Deputy Chief Compliance Officer of the Adviser (2014-2016); and formerly, Chief Compliance Officer of Prudential Investment Management, Inc. (2007-2014). | |
Francis J. Smith (52)
522 Fifth Avenue
New York, NY 10036 | | Treasurer and Principal Financial Officer | | Treasurer since July 2003 and Principal Financial Officer since September 2002 | | Manging Director of the Adviser and various entities affiliated with the Adviser; Treasurer (since July 2003) and Principal Financial Officer of various Morgan Stanley Funds (since September 2002). | |
Mary E. Mullin (50)
522 Fifth Avenue
New York, NY 10036 | | Secretary | | Since
June
1999 | | Managing Director of the Adviser; Secretary of various Morgan Stanley Funds (since June 1999). | |
Michael J. Key (38)
522 Fifth Avenue
New York, NY 10036 | | Vice President | | Since
June
2017 | | Vice President of the Equity and Fixed Income Funds, Liquidity Funds, various money market funds and the Morgan Stanley AIP Funds in the Fund Complex (since June 2017); Executive Director of the Adviser; Head of Product Development for Equity and Fixed Income Funds (since August 2013). | |
* This is the earliest date the officer began serving the Morgan Stanley Funds. Each officer serves a one-year term, until his or her successor is elected and qualifies.
38
Morgan Stanley Institutional Fund, Inc.
Annual Report — December 31, 2017
Adviser and Administrator
Morgan Stanley Investment Management Inc.
522 Fifth Avenue
New York, New York 10036
Distributor
Morgan Stanley Distribution, Inc.
522 Fifth Avenue
New York, New York 10036
Dividend Disbursing and Transfer Agent
DST Asset Manager Solutions, Inc.
2000 Crown Colony Drive
Quincy, Massachusetts 02169
Custodian
State Street Bank and Trust Company
One Lincoln Street
Boston, Massachusetts 02111
Legal Counsel
Dechert LLP
1095 Avenue of the Americas
New York, New York 10036
Counsel to the Independent Directors
Perkins Coie LLP
30 Rockefeller Plaza
New York, New York 10112
Independent Registered Public Accounting Firm
Ernst & Young LLP
200 Clarendon Street
Boston, Massachusetts 02116
Reporting to Shareholders
Each Morgan Stanley Fund provides a complete schedule of portfolio holdings in its semi-annual and annual reports within 60 days of the end of the fund's second and fourth fiscal quarters. The semi-annual and annual reports are filed electronically with the Securities and Exchange Commission (SEC) on Form N-CSRS and Form N-CSR, respectively. Morgan Stanley also delivers the semi-annual and annual reports to fund shareholders and makes these reports available on its public website, www.morganstanley.com/im. Each Morgan Stanley fund also files a complete schedule of portfolio holdings with the SEC for the fund's first and third fiscal quarters on Form N-Q. Morgan Stanley does not deliver the reports for the first and third fiscal quarters to shareholders, nor are the reports posted to the Morgan Stanley public website. You may, however, obtain the Form N-Q filings (as well as the Form N-CSR and N-CSRS filings) by accessing the SEC's website, www.sec.gov. You may also review and copy them at the SEC's Public Reference Room in Washington, DC. Information on the operation of the SEC's Public Reference Room may be obtained by calling the SEC toll free at 1 (800) SEC-0330. You can also request copies of these materials, upon payment of a duplicating fee, by electronic request at the SEC's email address (publicinfo@sec.gov) or by writing to the SEC's Public Reference Section, Washington, D.C. 20549-1520.
Proxy Voting Policies and Procedures and Proxy Voting Record
You may obtain a copy of the Company's Proxy Voting Policy and Procedures and information regarding how the Company voted proxies relating to portfolio securities during the most recent twelve-month period ended June 30, without charge, upon request, by calling toll free 1 (800) 548-7786 or by visiting our website at www.morganstanley.com/im. This information is also available on the SEC's website at www.sec.gov.
This report is authorized for distribution only when preceded or accompanied by a prospectus or summary prospectus of the applicable Fund of Morgan Stanley Institutional Fund, Inc., which describes in detail the Fund's investment policies, risks, fees and expenses. Please read the prospectus carefully before you invest or send money. For additional information, including information regarding the investments comprising the Fund, please visit our website at www.morganstanley.com/im or call toll free 1 (800) 548-7786.
39
Printed in U.S.A.
This Report has been prepared for shareholders and may be distributed to others only if preceded or accompanied by a current prospectus.
Morgan Stanley Investment Management Inc.
522 Fifth Avenue
New York, New York 10036
© 2018 Morgan Stanley. Morgan Stanley Distribution, Inc.

IFIGDANN
2008001 EXP. 02.28.19

Morgan Stanley Institutional Fund, Inc.
Global Franchise Portfolio
Annual Report
December 31, 2017

Morgan Stanley Institutional Fund, Inc.
Annual Report — December 31, 2017
Shareholders' Letter | | | 2 | | |
Expense Example | | | 3 | | |
Investment Overview | | | 4 | | |
Portfolio of Investments | | | 8 | | |
Statement of Assets and Liabilities | | | 9 | | |
Statement of Operations | | | 11 | | |
Statements of Changes in Net Assets | | | 12 | | |
Financial Highlights | | | 14 | | |
Notes to Financial Statements | | | 19 | | |
Report of Independent Registered Public Accounting Firm | | | 25 | | |
Federal Tax Notice | | | 26 | | |
Privacy Notice | | | 27 | | |
Director and Officer Information | | | 30 | | |
This report is authorized for distribution only when preceded or accompanied by a prospectus or summary prospectus of the applicable Fund of Morgan Stanley Institutional Fund, Inc. To receive a prospectus and/or statement of additional information (SAI), which contains more complete information such as investment objectives, charges, expenses, policies for voting proxies, risk considerations, and describes in detail each of the Fund's investment policies to the prospective investor, please call toll free 1 (800) 548-7786. Please read the prospectuses carefully before you invest or send money.
Additionally, you can access information about the Fund, including performance, characteristics, and investment team commentary, through Morgan Stanley Investment Management's website: www.morganstanley.com/im.
Market forecasts provided in this report may not necessarily come to pass. There is no guarantee that any sectors mentioned will continue to perform as discussed herein or that securities in such sectors will be held by the Fund in the future. There is no assurance that a fund will achieve its investment objective. Funds are subject to market risk, which is the possibility that market values of securities owned by the Fund will decline and, therefore, the value of the Fund's shares may be less than what you paid for them. Accordingly, you can lose money investing in this Fund. Please see the prospectus for more complete information on investment risks.
1
Morgan Stanley Institutional Fund, Inc.
Annual Report — December 31, 2017
Shareholders' Letter (unaudited)
Dear Shareholders,
We are pleased to provide this Annual report, in which you will learn how your investment in Global Franchise Portfolio (the "Fund") performed during the latest twelve-month period.
Morgan Stanley Investment Management is a client-centric, investor-led organization. Our global presence, intellectual capital, and breadth of products and services enable us to partner with investors to meet the evolving challenges of today's financial markets. We aim to deliver superior investment service and to empower our clients to make the informed decisions that help them reach their investment goals.
As always, we thank you for selecting Morgan Stanley Investment Management, and look forward to working with you in the months and years ahead.
Sincerely,

John H. Gernon
President and Principal Executive Officer
January 2018
2
Morgan Stanley Institutional Fund, Inc.
Annual Report — December 31, 2017
Expense Example (unaudited)
Global Franchise Portfolio
As a shareholder of the Fund, you incur two types of costs: (1) transactional costs; and (2) ongoing costs, which may include advisory fees, administration fees, distribution and shareholder services fees and other Fund expenses. This example is intended to help you understand your ongoing costs (in dollars) of investing in the Fund and to compare these costs with the ongoing costs of investing in other mutual funds.
This example is based on an investment of $1,000 invested at the beginning of the six-month period ended December 31, 2017 and held for the entire six-month period.
Actual Expenses
The table below provides information about actual account values and actual expenses. You may use the information in this table, together with the amount you invested, to estimate the expenses that you paid over the period. Simply divide your account value by $1,000 (for example, an $8,600 account value divided by $1,000 = 8.6), then multiply the result by the number in the table under the heading entitled "Actual Expenses Paid During Period" to estimate the expenses you paid on your account during this period.
Hypothetical Example for Comparison Purposes
The table below provides information about hypothetical account values and hypothetical expenses based on the Fund's actual expense ratio and an assumed rate of return of 5% per year before expenses, which is not the Fund's actual return. The hypothetical account values and expenses may not be used to estimate the actual ending account balance or expenses you paid for the period. You may use this information to compare the ongoing costs of investing in the Fund and other funds. To do so, compare this 5% hypothetical example with the 5% hypothetical examples that appear in the shareholder reports of the other funds.
Please note that the expenses shown in the table are meant to highlight your ongoing costs only and do not reflect any transactional costs, such as sales charges (loads). Therefore, the information for each class in the table is useful in comparing ongoing costs only, and will not help you determine the relative total costs of owning different funds. In addition, if these transactional costs were included, your costs would have been higher.
| | | Beginning
Account
Value
7/1/17 | | Actual Ending
Account
Value
12/31/17 | | Hypothetical
Ending Account
Value | | Actual
Expenses
Paid
During
Period* | | Hypothetical
Expenses Paid
During Period* | | Net
Expense
Ratio
During
Period** | |
Global Franchise Portfolio Class I | | $ | 1,000.00 | | | $ | 1,080.80 | | | $ | 1,020.21 | | | $ | 5.19 | | | $ | 5.04 | | | | 0.99 | % | |
Global Franchise Portfolio Class A | | | 1,000.00 | | | | 1,079.60 | | | | 1,019.11 | | | | 6.34 | | | | 6.16 | | | | 1.21 | | |
Global Franchise Portfolio Class L | | | 1,000.00 | | | | 1,077.00 | | | | 1,016.64 | | | | 8.90 | | | | 8.64 | | | | 1.70 | | |
Global Franchise Portfolio Class C | | | 1,000.00 | | | | 1,075.30 | | | | 1,015.17 | | | | 10.41 | | | | 10.11 | | | | 1.99 | | |
Global Franchise Portfolio Class IS | | | 1,000.00 | | | | 1,081.60 | | | | 1,020.62 | | | | 4.77 | | | | 4.63 | | | | 0.91 | | |
* Expenses are calculated using each Fund Class' annualized net expense ratio (as disclosed), multiplied by the average account value over the period, and multiplied by 184/365 (to reflect the most recent one-half year period).
** Annualized.
3
Morgan Stanley Institutional Fund, Inc.
Annual Report — December 31, 2017
Investment Overview (unaudited)
Global Franchise Portfolio
The Fund seeks long-term capital appreciation.
Performance
For the year ended December 31, 2017, the Fund's Class I shares had a total return based on net asset value and reinvestment of distributions per share of 25.85%, net of fees. The Fund's Class I shares outperformed against the Fund's benchmark, the MSCI World Index (the "Index"), which returned 22.40%.
Please keep in mind that double-digit returns are highly unusual and cannot be sustained. Investors should also be aware that these returns were primarily achieved during favorable market conditions.
Factors Affecting Performance
• Completing a strong year in 2017, markets continued to forge ahead in the fourth quarter, helped by a solid earnings season and clarity on U.S. tax cuts. Anticipated political risks failed to materialize. Asia and the emerging markets outperformed developed markets given the weak dollar and a recovery in industrial commodity prices. U.S. equities, as represented by the S&P 500 Index, delivered positive returns every month of 2017, with the technology sector leading the pack. Japan also did well, underpinned by strong earnings. After Macron's election victory in France, European equities performed well, but were held back by euro strength. U.K. equities underperformed relative to other regions, weighed down by sterling strength and continued uncertainty around the Brexit transition arrangements. At a sector level, over the year information technology (+38.2%), materials (+27.9%) and industrials (+25.2%) led the Index, while energy (4.97%), telecommunications (+5.8%) and utilities (+13.7%) lagged the Index. (Regional and country performance is represented by the respective MSCI Indexes, unless otherwise noted.)
• For the year, the Fund's outperformance was driven by stock selection in consumer staples, an overweight to the strongly performing technology sector, and not owning the underperforming energy, telecommunications and utilities sectors.
Stock selection in technology and consumer discretionary, as well as the underweight in materials and industrials, detracted.
• Over the year, the largest absolute contributors were Unilever, Microsoft and Accenture. Fidelity National Information Services, Time Warner and FactSet contributed the least.(i) There were no absolute negative detractors in 2017.
Management Strategies
• Our central concern at the start of 2017 was a backdrop of generally high valuations coinciding with some significant macro/political concerns for the then-forthcoming year, including China, the risk of U.S. and European politics going wrong and the vulnerability of the financial system to shocks due to the sharp increase in debt and general stagnation. We observed that if some of these major concerns went wrong, there was little margin of safety generally and probably quite a lot of downside given the nature of some of the potential risks. As bottom-up stock pickers, we found little margin of safety in stocks more or less across the board. 2017 ended with most major country indices up 20 to 25% or more (in U.S. dollar terms), making such concerns look at best premature, at worst just plain wrong.(ii) However, enthused U.S. dollar-based investors getting excited about markets in 2017 may have forgotten that markets went up a lot in something that went down a lot (i.e., the dollar).
• As we start 2018, we are more concerned about valuation and on balance less concerned about macro conditions, although there is still plenty that can go wrong. In a nutshell, the market has re-rated on the basis that 2017's expected earnings increase of 15% for the MSCI World Index actually delivered for the first time in five years, as growth for once did not disappoint.(ii) Although there is growing evidence of gross domestic product growth across the board, should these proverbial green shoots fail to bloom, the market will de-rate multiples on lower actual earnings, the proverbial double-hit.(iii)
(i) The information contained in this overview regarding specific securities is for informational purposes only and should not be construed as a recommendation to purchase or sell the securities mentioned.
(ii) Source: Morgan Stanley Investment Management and FactSet. Data as of December 31, 2017.
(iii) Forecast/estimates are based on current market conditions, subject to change and may not necessarily come to pass.
4
Morgan Stanley Institutional Fund, Inc.
Annual Report — December 31, 2017
Investment Overview (unaudited) (cont'd)
Global Franchise Portfolio
• In the U.S., despite the sturm und drang and the flying of a lot of liberal feathers, the market has broadly seen the benefits of Trump (tax reform being the biggest win) without any of the major risks eventuating as yet (an unholy cocktail of awfulness ranging from a trade war with China to nuclear war with North Korea). To the credit of Congress, it has passed, after much drama, the single measure we thought would have the biggest long-term positive impact on the U.S. economy, namely tax reform. Although its impact on overall U.S. corporations may be muted in the short term (few major U.S. companies pay a full U.S. tax charge unless they are purely domestic), the big long-term question is whether the combination of the tax reform and short-term capital expenditure (capex) and cash repatriation packages will be enough to get a capex cycle going, leading to a pick-up in productivity from current lows. In recent years, U.S. corporates have generally chosen to buy back shares rather than increase capex, so productivity has generally suffered as a result. A bull would say the combination of tax reform and opportunities provided by the internet of things (IoT) and artificial intelligence (AI) will kick off a long cycle of investment to drive waste out of many sectors, with massive potential cost savings, a good chunk of which will come through in margins, which will be propelled to permanent new highs. A bear would respond that there may be some positive impact, but U.S. corporations will just continue to buy back shares and margins may normalize as labor seeks to get its hands on a larger share of corporate profits from a still historically low starting point, leaving aside the risks from the aging U.S. economic cycle.
• Add to this that the U.S. market is anticipating a repeat of the 12% earnings growth in the S&P 500 Index it saw in 2017, and it is hardly a surprise that the market has not been over-concerned with valuation.(ii) A bull (no shortage of those) would say that, at 18.2x, the next 12 months price-to-earnings ("P/E") ratio of the S&P 500 Index is only about 14% above the long-term mean of 16.0x from 1997 to 2017, so why the fuss?(ii) A bear (count us as one) would point out that even leaving aside quality of earnings (given the largest ever cycle of U.S. earnings manipulation), corporate debt after a buyback binge is near record highs, as are margins,
which means that the debt-adjusted price-to-sales (EV/sales) ratio at 2.44 for the S&P 500 Index is getting close to the 2000 peak of 2.98, which is a clear amber light, even leaving aside outdated notions of earnings reversion to the mean or the risk of a turn down in the U.S. economy.(ii)
• If one takes a longer-term view of valuations as per the Schiller P/E, the U.S. market has gone from expensive on 27.9x at the start of 2017 to very expensive on 32.4x at the end of 2017.(ii) Unless the visionary tech bulls are right that a heady cocktail of AI, IoT, e-commerce et al. will propel already peak margins ever higher, leading to a ton of earnings growth, this is also a dark amber light for valuation, with a lot of expectations baked into prices. No bull market ever bursts purely from valuation alone, but when markets do focus on valuation once more, it matters.
• The other major geopolitical risk facing the world at the start of 2017 (aside from Trump) was the risk of political disruption in Europe, possibly leading to a scenario of a break-up of the eurozone if the politics went wrong. After a few awkward moments, the market shrugged off such concerns following the Dutch and (in particular) the French elections and, even after nasty surprises in the German election, continued to concentrate on the growing evidence of a eurozone economic recovery. So far, the market has been right, with some entirely unexpected positive results such as a big majority in parliament for President Macron in France, which (miracle of miracles) means that reform (particularly labor market reform) has actually progressed in France and looks set to continue. Our concerns that Brexit could inspire a cascade of falling euro-dominos have been hitherto wrong: the only domino to fall flat on its face has been the U.K. itself after doing what Michael Bloomberg memorably described as "the single stupidest thing any country has ever done." In fact, the only wobble of the dominos to date has been a positive impact — the U.K.'s self-immolation probably inspired France to rally round Macron to avoid the fate of its much loved European partner. However, our concerns for the European elections were not that there was a high probability of things going horribly wrong in France or Germany; rather that the risk was Italy, which managed not to have its general election in
(ii) Source: Morgan Stanley Investment Management and FactSet. Data as of December 31, 2017.
5
Morgan Stanley Institutional Fund, Inc.
Annual Report — December 31, 2017
Investment Overview (unaudited) (cont'd)
Global Franchise Portfolio
2017. Italy has been the big loser of the euro, with its economy not growing for 20 years due to an inability to reform itself and (mostly) to it losing its historic ability to depreciate its currency (the lira) to keep its competitive plates spinning. Furthermore, Italy has the strongest eurosceptic forces of the major European countries going into its electoral cycle. The risk, now, is that Italy with its election in March 2018, elects a government who decides to do something about the euro — if so, political risk will be back in Europe in spades.
• Looking forward to 2018, there does seem to be a synchronized global expansion. However, it isn't that large, has quite a lot of risk and seems to be priced in by markets. We see that few of the major structural problems in the world (debt, the unknowns of a quantitative easing ("QE") unwind, political uncertainty, China et al.) have gone away. In simple terms, a goldilocks scenario has been priced in but there remain elevated risks and no apparent margin of safety in valuations. Such growth as there is looks unlikely to drive a sharp pick-up in inflation. Even though the U.S. is pressing the reflation button of tax cuts, this does not guarantee that that the U.S. will reflate, especially given its starting point of one of the longest economic expansions in recent memory and already record-high margins. One might also point out that giving the wrong people (corporates and the wealthy) tax cuts does not in itself amount to a conventional hitting of the reflation button via fiscal policy. General use of fiscal policy to reflate Europe also looks questionable, given the Germans have to agree to it, which looks far from a foregone conclusion with a weakened Mrs. Merkel in discussions with the (socialist) Social Democratic Party (SPD) for a renewed Grand Coalition. However, even if there is very little probability of systematic German-led reflation in Europe, at least European fiscal policy as a whole no longer looks like a future drag and could be mildly expansionary.
• Despite its many problems (debt, demographics, QE ad nauseam) Japan does not face the same political risk as the West, given that Prime Minister
Abe has just been re-elected with a large majority. Furthermore, the Japanese cabinet approved a draft tax measure to incentivize companies to increase wages and raise capex in December 2017, potentially lowering Japanese corporate tax rates from the current 30% to 20%. There is even some evidence that Japanese companies are at last taking measures to run themselves better, although this is very much on a stock-by-stock basis and generally their number is few. Japan just may have the ability to surprise on the upside from reflation, particularly as there is growing evidence of labor shortages driving up wages. However, as always in Japan, there are a frustratingly small number of investible companies that can benefit from this.
• As bottom-up stock pickers, the substantial general rally in markets in 2017 aggravates the problem we have faced over the last few years of generally not having a sufficient margin of safety in the form of price to compensate us for potential risks, be they cyclical, macro or the threat of disruptive change. Certainly the market does not see a margin of safety as a principal concern, with the VIX, a common gauge of stock price volatility, trading near all-time lows.(iv)
• This means it has generally been difficult to find new holdings for all portfolios and there have been no obvious sectors which have been dramatically mispriced, so 2017 has been about stock picking rifle shots. Nonetheless, by casting the net wide and intensifying our search for new holdings, we have found four new holdings for Global Franchise this year (and two in 2016). We are broadly encouraged by the performance of these holdings in 2017. To us, the risks look skewed more to the downside than upside. If widespread hopes of a continuation of the current synchronized pick-up in world growth fail to materialize, the current backdrop of high valuation and low concern for risk make preservation of capital the key concern. To us, high-quality companies, which should still be better able to grow sales and profits in a downturn, look the best relative bet, even if they are unexciting in absolute terms.
(iv) Source: Chicago Board Options Exchange Market Volatility Index, December 31, 2017.
6
Morgan Stanley Institutional Fund, Inc.
Annual Report — December 31, 2017
Investment Overview (unaudited) (cont'd)
Global Franchise Portfolio
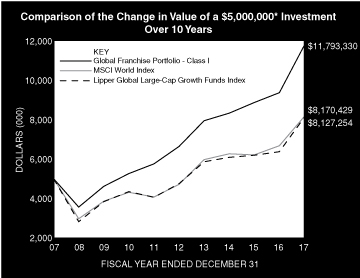
* Minimum Investment for Class I shares
In accordance with SEC regulations, the Fund's performance shown assumes that all recurring fees (including management fees) were deducted and all dividends and distributions were reinvested. The performance of Class A, L , C and IS shares will vary from Class I shares based upon their different inception dates and will be negatively impacted by additional fees assessed to those classes (if applicable).
Performance Compared to the MSCI World Index(1) and the Lipper Global Large-Cap Growth Funds Index(2)
| | Period Ended December 31, 2017
Total Returns(3) | |
| | | | Average Annual | |
| | One
Year | | Five
Years | | Ten
Years | | Since
Inception(8) | |
Fund — Class I Shares
w/o sales charges(4) | | | 25.85 | % | | | 12.18 | % | | | 8.96 | % | | | 11.54 | % | |
Fund — Class A Shares
w/o sales charges(4) | | | 25.58 | | | | 11.89 | | | | 8.68 | | | | 11.24 | | |
Fund — Class A Shares with
maximum 5.25% sales charges(4) | | | 18.97 | | | | 10.69 | | | | 8.09 | | | | 10.87 | | |
Fund — Class L Shares
w/o sales charges(5) | | | 24.98 | | | | 11.34 | | | | — | | | | 10.18 | | |
Fund — Class C Shares
w/o sales charges(7) | | | 24.63 | | | | — | | | | — | | | | 15.00 | | |
Fund — Class C Shares with
maximum 1.00% deferred
sales charges(7) | | | 23.63 | | | | — | | | | — | | | | 15.00 | | |
Fund — Class IS Shares w/o
sales charges(6) | | | 26.00 | | | | — | | | | — | | | | 11.88 | | |
MSCI World Index | | | 22.40 | | | | 11.64 | | | | 5.03 | | | | 6.87 | | |
Lipper Global Large-Cap
Growth Funds Index | | | 27.57 | | | | 11.37 | | | | 4.98 | | | | 6.49 | | |
Performance data quoted represents past performance, which is no guarantee of future results, and current performance may be lower or higher than the figures shown. Performance assumes that all dividends and distributions, if any, were reinvested. For the most recent month-end performance figures, please visit www.morganstanley.com/im. Investment return and principal value will fluctuate so that Fund shares, when redeemed, may be worth more or less than their original cost. Total returns do not reflect the deduction of taxes that a shareholder would pay on Fund distributions or the redemption of Fund shares. Performance of share classes will vary due to difference in sales charges and expenses.
(1) The MSCI World Index is a free float-adjusted market capitalization weighted index that is designed to measure the global equity market performance of developed markets. The term "free float" represents the portion of shares outstanding that are deemed to be available for purchase in the public equity markets by investors. The MSCI World Index currently consists of 23 developed market country indices. The performance of the Index is listed in U.S. dollars and assumes reinvestment of net dividends. The Index is unmanaged and its returns do not include any sales charges or fees. Such costs would lower performance. It is not possible to invest directly in an index.
(2) The Lipper Global Large-Cap Growth Funds Index is an equally weighted performance index of the largest qualifying funds (based on net assets) in the Lipper Global Large-Cap Growth Funds classification. The Index, which is adjusted for capital gains distributions and income dividends, is unmanaged and should not be considered an investment. There are currently 10 funds represented in this Index. As of the date of this report, the Fund is in the Lipper Global Large-Cap Growth Funds classification.
(3) Total returns for the Fund reflect fees waived and expenses reimbursed, if applicable, by the Adviser. Without such waivers and reimbursements, total returns would have been lower.
(4) Commenced operations on November 28, 2001.
(5) Commenced offering on April 27, 2012.
(6) Commenced offering on May 29, 2015.
(7) Commenced offering on September 30, 2015.
(8) For comparative purposes, average annual since inception returns listed for the Indexes refer to the inception date of Class I of the Fund, not the inception of the Index.
7
Morgan Stanley Institutional Fund, Inc.
Annual Report — December 31, 2017
Portfolio of Investments
Global Franchise Portfolio
| | | Shares | | Value
(000) | |
Common Stocks (97.6%) | |
France (8.5%) | |
L'Oreal SA | | | 214,835 | | | $ | 47,592 | | |
Pernod Ricard SA | | | 259,406 | | | | 41,062 | | |
| | | | 88,654 | | |
Germany (4.4%) | |
SAP SE | | | 409,910 | | | | 45,963 | | |
Italy (1.7%) | |
Davide Campari-Milano SpA | | | 2,221,410 | | | | 17,173 | | |
Netherlands (1.2%) | |
RELX N.V. | | | 559,508 | | | | 12,863 | | |
Switzerland (0.8%) | |
Nestle SA (Registered) | | | 99,970 | | | | 8,591 | | |
United Kingdom (26.0%) | |
British American Tobacco PLC | | | 1,026,494 | | | | 69,279 | | |
British American Tobacco PLC ADR | | | 288,472 | | | | 19,325 | | |
Experian PLC | | | 987,489 | | | | 21,702 | | |
Reckitt Benckiser Group PLC | | | 714,119 | | | | 66,705 | | |
RELX PLC | | | 1,224,549 | | | | 28,688 | | |
Unilever PLC | | | 1,189,506 | | | | 65,898 | | |
| | | | 271,597 | | |
United States (55.0%) | |
Accenture PLC, Class A | | | 527,465 | | | | 80,750 | | |
Altria Group, Inc. | | | 385,752 | | | | 27,547 | | |
Automatic Data Processing, Inc. | | | 209,014 | | | | 24,494 | | |
Coca-Cola Co. (The) | | | 668,568 | | | | 30,674 | | |
Danaher Corp. | | | 171,229 | | | | 15,893 | | |
Factset Research Systems, Inc. | | | 69,523 | | | | 13,401 | | |
Fidelity National Information Services, Inc. | | | 213,080 | | | | 20,049 | | |
International Flavors & Fragrances, Inc. | | | 57,605 | | | | 8,791 | | |
Intuit, Inc. | | | 100,019 | | | | 15,781 | | |
Microsoft Corp. | | | 943,373 | | | | 80,696 | | |
Moody's Corp. | | | 81,547 | | | | 12,037 | | |
NIKE, Inc., Class B | | | 546,747 | | | | 34,199 | | |
Philip Morris International, Inc. | | | 395,725 | | | | 41,808 | | |
Twenty-First Century Fox, Inc., Class A | | | 579,895 | | | | 20,024 | | |
Twenty-First Century Fox, Inc., Class B | | | 693,496 | | | | 23,662 | | |
Visa, Inc., Class A | | | 430,634 | | | | 49,101 | | |
Walt Disney Co. (The) | | | 326,373 | | | | 35,088 | | |
Zoetis, Inc. | | | 576,481 | | | | 41,530 | | |
| | | | 575,525 | | |
Total Common Stocks (Cost $754,636) | | | 1,020,366 | | |
Short-Term Investment (2.4%) | |
Investment Company (2.4%) | |
Morgan Stanley Institutional Liquidity
Funds — Treasury Securities Portfolio —
Institutional Class (See Note G)
(Cost $25,156) | | | 25,156,089 | | | | 25,156 | | |
Total Investments (100.0%) (Cost $779,792) (a)(b) | | | 1,045,522 | | |
Other Assets in Excess of Liabilities (0.0%) | | | 514 | | |
Net Assets (100.0%) | | $ | 1,046,036 | | |
Country assignments and aggregations are based generally on third party vendor classifications and information, and may be different from the assignments and aggregations under the policies set forth in the Fund's prospectus and/or statement of additional information relating to geographic classifications.
(a) The approximate fair value and percentage of net assets, $425,516,000 and 40.7%, respectively, represent the securities that have been fair valued under the fair valuation policy for international investments as described in Note A-1 within the Notes to the Financial Statements.
(b) At December 31, 2017, the aggregate cost for federal income tax purposes is approximately $782,638,000. The aggregate gross unrealized appreciation is approximately $263,513,000 and the aggregate gross unrealized depreciation is approximately $629,000, resulting in net unrealized appreciation of approximately $262,884,000.
ADR American Depositary Receipt.
Portfolio Composition
Classification | | Percentage of
Total Investments | |
Information Technology Services | | | 16.7 | % | |
Other* | | | 15.3 | | |
Tobacco | | | 15.1 | | |
Software | | | 13.6 | | |
Personal Products | | | 10.9 | | |
Beverages | | | 8.5 | | |
Media | | | 7.5 | | |
Household Products | | | 6.4 | | |
Professional Services | | | 6.0 | | |
Total Investments | | | 100.0 | % | |
* Industries and/or investment types representing less than 5% of total investments.
The accompanying notes are an integral part of the financial statements.
8
Morgan Stanley Institutional Fund, Inc.
Annual Report — December 31, 2017
Global Franchise Portfolio
Statement of Assets and Liabilities | | December 31, 2017
(000) | |
Assets: | |
Investments in Securities of Unaffiliated Issuers, at Value (Cost $754,636) | | $ | 1,020,366 | | |
Investment in Security of Affiliated Issuer, at Value (Cost $25,156) | | | 25,156 | | |
Total Investments in Securities, at Value (Cost $779,792) | | | 1,045,522 | | |
Foreign Currency, at Value (Cost —@) | | | — | @ | |
Dividends Receivable | | | 2,072 | | |
Receivable for Fund Shares Sold | | | 539 | | |
Tax Reclaim Receivable | | | 519 | | |
Receivable from Affiliate | | | 20 | | |
Other Assets | | | 96 | | |
Total Assets | | | 1,048,768 | | |
Liabilities: | |
Payable for Advisory Fees | | | 1,974 | | |
Payable for Fund Shares Redeemed | | | 260 | | |
Payable for Sub Transfer Agency Fees — Class I | | | 144 | | |
Payable for Sub Transfer Agency Fees — Class A | | | 12 | | |
Payable for Sub Transfer Agency Fees — Class L | | | 1 | | |
Payable for Sub Transfer Agency Fees — Class C | | | 8 | | |
Payable for Shareholder Services Fees — Class A | | | 31 | | |
Payable for Distribution and Shareholder Services Fees — Class L | | | 5 | | |
Payable for Distribution and Shareholder Services Fees — Class C | | | 40 | | |
Payable for Administration Fees | | | 71 | | |
Payable for Professional Fees | | | 51 | | |
Payable for Custodian Fees | | | 47 | | |
Payable for Directors' Fees and Expenses | | | 13 | | |
Payable for Transfer Agency Fees — Class I | | | 6 | | |
Payable for Transfer Agency Fees — Class A | | | 1 | | |
Payable for Transfer Agency Fees — Class L | | | — | @ | |
Payable for Transfer Agency Fees — Class C | | | 2 | | |
Payable for Transfer Agency Fees — Class IS | | | 1 | | |
Other Liabilities | | | 65 | | |
Total Liabilities | | | 2,732 | | |
Net Assets | | $ | 1,046,036 | | |
Net Assets Consist of: | |
Paid-in-Capital | | $ | 773,891 | | |
Accumulated Undistributed Net Investment Income | | | 903 | | |
Accumulated Net Realized Gain | | | 5,494 | | |
Unrealized Appreciation (Depreciation) on: | |
Investments | | | 265,730 | | |
Foreign Currency Translations | | | 18 | | |
Net Assets | | $ | 1,046,036 | | |
The accompanying notes are an integral part of the financial statements.
9
Morgan Stanley Institutional Fund, Inc.
Annual Report — December 31, 2017
Global Franchise Portfolio
Statement of Assets and Liabilities (cont'd) | | December 31, 2017
(000) | |
CLASS I: | |
Net Assets | | $ | 753,107 | | |
| Shares Outstanding $0.001 par value shares of beneficial interest (unlimited shares authorized) (not in 000's) | | | 30,461,886 | | |
Net Asset Value, Offering and Redemption Price Per Share | | $ | 24.72 | | |
CLASS A: | |
Net Assets | | $ | 146,722 | | |
| Shares Outstanding $0.001 par value shares of beneficial interest (unlimited shares authorized) (not in 000's) | | | 6,061,302 | | |
Net Asset Value, Redemption Price Per Share | | $ | 24.21 | | |
Maximum Sales Load | | | 5.25 | % | |
Maximum Sales Charge | | $ | 1.34 | | |
Maximum Offering Price Per Share | | $ | 25.55 | | |
CLASS L: | |
Net Assets | | $ | 7,993 | | |
| Shares Outstanding $0.001 par value shares of beneficial interest (unlimited shares authorized) (not in 000's) | | | 330,535 | | |
Net Asset Value, Offering and Redemption Price Per Share | | $ | 24.18 | | |
CLASS C: | |
Net Assets | | $ | 47,726 | | |
| Shares Outstanding $0.001 par value shares of beneficial interest (unlimited shares authorized) (not in 000's) | | | 2,003,828 | | |
Net Asset Value, Offering and Redemption Price Per Share | | $ | 23.82 | | |
CLASS IS: | |
Net Assets | | $ | 90,488 | | |
| Shares Outstanding $0.001 par value shares of beneficial interest (unlimited shares authorized) (not in 000's) | | | 3,660,762 | | |
Net Asset Value, Offering and Redemption Price Per Share | | $ | 24.72 | | |
@ Amount is less than $500.
The accompanying notes are an integral part of the financial statements.
10
Morgan Stanley Institutional Fund, Inc.
Annual Report — December 31, 2017
Global Franchise Portfolio
Statement of Operations | | Year Ended
December 31, 2017
(000) | |
Investment Income: | |
Dividends from Securities of Unaffiliated Issuers (Net of $376 of Foreign Taxes Withheld) | | $ | 19,519 | | |
Dividends from Security of Affiliated Issuer (Note G) | | | 147 | | |
Total Investment Income | | | 19,666 | | |
Expenses: | |
Advisory Fees (Note B) | | | 7,121 | | |
Shareholder Services Fees — Class A (Note D) | | | 310 | | |
Distribution and Shareholder Services Fees — Class L (Note D) | | | 59 | | |
Distribution and Shareholder Services Fees — Class C (Note D) | | | 387 | | |
Administration Fees (Note C) | | | 733 | | |
Sub Transfer Agency Fees — Class I | | | 527 | | |
Sub Transfer Agency Fees — Class A | | | 73 | | |
Sub Transfer Agency Fees — Class L | | | 2 | | |
Sub Transfer Agency Fees — Class C | | | 26 | | |
Professional Fees | | | 114 | | |
Registration Fees | | | 111 | | |
Custodian Fees (Note F) | | | 69 | | |
Shareholder Reporting Fees | | | 49 | | |
Transfer Agency Fees — Class I (Note E) | | | 19 | | |
Transfer Agency Fees — Class A (Note E) | | | 5 | | |
Transfer Agency Fees — Class L (Note E) | | | 2 | | |
Transfer Agency Fees — Class C (Note E) | | | 7 | | |
Transfer Agency Fees — Class IS (Note E) | | | 2 | | |
Directors' Fees and Expenses | | | 25 | | |
Pricing Fees | | | 5 | | |
Other Expenses | | | 50 | | |
Total Expenses | | | 9,696 | | |
Rebate from Morgan Stanley Affiliate (Note G) | | | (35 | ) | |
Net Expenses | | | 9,661 | | |
Net Investment Income | | | 10,005 | | |
Realized Gain: | |
Investments Sold | | | 45,619 | | |
Foreign Currency Transactions | | | 18 | | |
Realized Gain | | | 45,637 | | |
Change in Unrealized Appreciation (Depreciation): | |
Investments | | | 148,963 | | |
Foreign Currency Translations | | | 105 | | |
Net Change in Unrealized Appreciation (Depreciation) | | | 149,068 | | |
Net Realized Gain and Change in Unrealized Appreciation (Depreciation) | | | 194,705 | | |
Net Increase in Net Assets Resulting from Operations | | $ | 204,710 | | |
The accompanying notes are an integral part of the financial statements.
11
Morgan Stanley Institutional Fund, Inc.
Annual Report — December 31, 2017
Global Franchise Portfolio
Statements of Changes in Net Assets | | Year Ended
December 31, 2017
(000) | | Year Ended
December 31, 2016
(000) | |
Increase (Decrease) in Net Assets: | |
Operations: | |
Net Investment Income | | $ | 10,005 | | | $ | 9,545 | | |
Net Realized Gain | | | 45,637 | | | | 19,757 | | |
Net Change in Unrealized Appreciation (Depreciation) | | | 149,068 | | | | 8,577 | | |
Net Increase in Net Assets Resulting from Operations | | | 204,710 | | | | 37,879 | | |
Distributions from and/or in Excess of: | |
Class I: | |
Net Investment Income | | | (6,924 | ) | | | (7,868 | ) | |
Net Realized Gain | | | (26,998 | ) | | | (18,038 | ) | |
Class A: | |
Net Investment Income | | | (1,097 | ) | | | (1,154 | ) | |
Net Realized Gain | | | (5,332 | ) | | | (3,160 | ) | |
Class L: | |
Net Investment Income | | | (19 | ) | | | (37 | ) | |
Net Realized Gain | | | (297 | ) | | | (234 | ) | |
Class C: | |
Net Investment Income | | | (70 | ) | | | (198 | ) | |
Net Realized Gain | | | (1,761 | ) | | | (898 | ) | |
Class IS: | |
Net Investment Income | | | (890 | ) | | | (255 | ) | |
Net Realized Gain | | | (3,140 | ) | | | (495 | ) | |
Total Distributions | | | (46,528 | ) | | | (32,337 | ) | |
Capital Share Transactions:(1) | |
Class I: | |
Subscribed | | | 189,194 | | | | 202,282 | | |
Distributions Reinvested | | | 33,421 | | | | 24,953 | | |
Redeemed | | | (196,533 | ) | | | (137,931 | ) | |
Class A: | |
Subscribed | | | 47,508 | | | | 52,962 | | |
Distributions Reinvested | | | 6,389 | | | | 4,282 | | |
Redeemed | | | (32,934 | ) | | | (28,456 | ) | |
Class L: | |
Exchanged | | | 239 | | | | 348 | | |
Distributions Reinvested | | | 316 | | | | 271 | | |
Redeemed | | | (1,440 | ) | | | (2,167 | ) | |
Class C: | |
Subscribed | | | 17,089 | | | | 27,106 | | |
Distributions Reinvested | | | 1,831 | | | | 1,094 | | |
Redeemed | | | (7,145 | ) | | | (3,734 | ) | |
Class IS: | |
Subscribed | | | 63,818 | | | | 19,487 | | |
Distributions Reinvested | | | 4,030 | | | | 750 | | |
Redeemed | | | (8 | ) | | | (— | @) | |
Net Increase in Net Assets Resulting from Capital Share Transactions | | | 125,775 | | | | 161,247 | | |
Total Increase in Net Assets | | | 283,957 | | | | 166,789 | | |
Net Assets: | |
Beginning of Period | | | 762,079 | | | | 595,290 | | |
End of Period (Including Accumulated Undistributed Net Investment Income of $903 and $26) | | $ | 1,046,036 | | | $ | 762,079 | | |
The accompanying notes are an integral part of the financial statements.
12
Morgan Stanley Institutional Fund, Inc.
Annual Report — December 31, 2017
Global Franchise Portfolio
Statements of Changes in Net Assets (cont'd) | | Year Ended
December 31, 2017
(000) | | Year Ended
December 31, 2016
(000) | |
(1) Capital Share Transactions: | |
Class I: | |
Shares Subscribed | | | 8,054 | | | | 9,702 | | |
Shares Issued on Distributions Reinvested | | | 1,349 | | | | 1,219 | | |
Shares Redeemed | | | (8,191 | ) | | | (6,525 | ) | |
Net Increase in Class I Shares Outstanding | | | 1,212 | | | | 4,396 | | |
Class A: | |
Shares Subscribed | | | 2,055 | | | | 2,566 | | |
Shares Issued on Distributions Reinvested | | | 263 | | | | 213 | | |
Shares Redeemed | | | (1,431 | ) | | | (1,378 | ) | |
Net Increase in Class A Shares Outstanding | | | 887 | | | | 1,401 | | |
Class L: | |
Shares Exchanged | | | 11 | | | | 17 | | |
Shares Issued on Distributions Reinvested | | | 13 | | | | 13 | | |
Shares Redeemed | | | (63 | ) | | | (107 | ) | |
Net Decrease in Class L Shares Outstanding | | | (39 | ) | | | (77 | ) | |
Class C: | |
Shares Subscribed | | | 750 | | | | 1,330 | | |
Shares Issued on Distributions Reinvested | | | 77 | | | | 55 | | |
Shares Redeemed | | | (315 | ) | | | (185 | ) | |
Net Increase in Class C Shares Outstanding | | | 512 | | | | 1,200 | | |
Class IS: | |
Shares Subscribed | | | 2,557 | | | | 903 | | |
Shares Issued on Distributions Reinvested | | | 163 | | | | 37 | | |
Shares Redeemed | | | (— | @@) | | | (— | @@) | |
Net Increase in Class IS Shares Outstanding | | | 2,720 | | | | 940 | | |
@ Amount is less than $500.
@@ Amount is less than 500 shares.
The accompanying notes are an integral part of the financial statements.
13
Morgan Stanley Institutional Fund, Inc.
Annual Report — December 31, 2017
Financial Highlights
Global Franchise Portfolio
| | | Class I | |
| | | Year Ended December 31, | |
Selected Per Share Data and Ratios | | 2017 | | 2016(1) | | 2015 | | 2014 | | 2013 | |
Net Asset Value, Beginning of Period | | $ | 20.56 | | | $ | 20.33 | | | $ | 20.27 | | | $ | 20.77 | | | $ | 18.13 | | |
Income from Investment Operations: | |
Net Investment Income(2) | | | 0.27 | | | | 0.30 | | | | 0.31 | | | | 0.41 | | | | 0.36 | | |
Net Realized and Unrealized Gain | | | 5.05 | | | | 0.84 | | | | 1.02 | | | | 0.57 | | | | 3.17 | | |
Total from Investment Operations | | | 5.32 | | | | 1.14 | | | | 1.33 | | | | 0.98 | | | | 3.53 | | |
Distributions from and/or in Excess of: | |
Net Investment Income | | | (0.24 | ) | | | (0.28 | ) | | | (0.35 | ) | | | (0.37 | ) | | | (0.35 | ) | |
Net Realized Gain | | | (0.92 | ) | | | (0.63 | ) | | | (0.92 | ) | | | (1.11 | ) | | | (0.54 | ) | |
Total Distributions | | | (1.16 | ) | | | (0.91 | ) | | | (1.27 | ) | | | (1.48 | ) | | | (0.89 | ) | |
Net Asset Value, End of Period | | $ | 24.72 | | | $ | 20.56 | | | $ | 20.33 | | | $ | 20.27 | | | $ | 20.77 | | |
Total Return(3) | | | 25.85 | % | | | 5.64 | % | | | 6.50 | % | | | 4.82 | % | | | 19.71 | % | |
Ratios and Supplemental Data: | |
Net Assets, End of Period (Thousands) | | $ | 753,107 | | | $ | 601,340 | | | $ | 505,321 | | | $ | 515,012 | | | $ | 570,261 | | |
Ratio of Expenses to Average Net Assets(6) | | | 0.98 | %(4) | | | 0.97 | %(4) | | | 0.98 | %(4) | | | 0.97 | %(4) | | | 0.95 | %(4) | |
Ratio of Net Investment Income to Average Net Assets(6) | | | 1.17 | %(4) | | | 1.40 | %(4) | | | 1.46 | %(4) | | | 1.94 | %(4) | | | 1.79 | %(4) | |
Ratio of Rebate from Morgan Stanley Affiliates to Average Net Assets | | | 0.00 | %(5) | | | 0.00 | %(5) | | | 0.00 | %(5) | | | 0.00 | %(5) | | | 0.00 | %(5) | |
Portfolio Turnover Rate | | | 28 | % | | | 30 | % | | | 37 | % | | | 33 | % | | | 24 | % | |
(6) Supplemental Information on the Ratios to Average Net Assets: | |
Ratios Before Expense Limitation: | |
Expenses to Average Net Assets | | | N/A | | | | 0.98 | % | | | 0.99 | % | | | N/A | | | | N/A | | |
Net Investment Income to Average Net Assets | | | N/A | | | | 1.39 | % | | | 1.45 | % | | | N/A | | | | N/A | | |
(1) Reflects prior period custodian out-of-pocket expenses that were reimbursed in September 2016. The amount of the reimbursement was immaterial on a per share basis and did not impact the total return of Class I shares. The Ratio of Expenses to Average Net Assets would have been 0.01% higher and the Ratio of Net Investment Income to Average Net Assets would have been 0.01% lower had the custodian not reimbursed the Fund.
(2) Per share amount is based on average shares outstanding.
(3) Calculated based on the net asset value as of the last business day of the period.
(4) The Ratios of Expenses and Net Investment Income reflect the rebate of certain Fund expenses in connection with the investments in Morgan Stanley affiliates during the period. The effect of the rebate on the ratios is disclosed in the above table as "Ratio of Rebate from Morgan Stanley Affiliates to Average Net Assets."
(5) Amount is less than 0.005%.
The accompanying notes are an integral part of the financial statements.
14
Morgan Stanley Institutional Fund, Inc.
Annual Report — December 31, 2017
Financial Highlights
Global Franchise Portfolio
| | | Class A | |
| | | Year Ended December 31, | |
Selected Per Share Data and Ratios | | 2017 | | 2016(1) | | 2015 | | 2014 | | 2013 | |
Net Asset Value, Beginning of Period | | $ | 20.16 | | | $ | 19.96 | | | $ | 19.92 | | | $ | 20.44 | | | $ | 17.86 | | |
Income from Investment Operations: | |
Net Investment Income(2) | | | 0.22 | | | | 0.23 | | | | 0.24 | | | | 0.34 | | | | 0.28 | | |
Net Realized and Unrealized Gain | | | 4.94 | | | | 0.83 | | | | 1.02 | | | | 0.55 | | | | 3.14 | | |
Total from Investment Operations | | | 5.16 | | | | 1.06 | | | | 1.26 | | | | 0.89 | | | | 3.42 | | |
Distributions from and/or in Excess of: | |
Net Investment Income | | | (0.19 | ) | | | (0.23 | ) | | | (0.30 | ) | | | (0.30 | ) | | | (0.30 | ) | |
Net Realized Gain | | | (0.92 | ) | | | (0.63 | ) | | | (0.92 | ) | | | (1.11 | ) | | | (0.54 | ) | |
Total Distributions | | | (1.11 | ) | | | (0.86 | ) | | | (1.22 | ) | | | (1.41 | ) | | | (0.84 | ) | |
Net Asset Value, End of Period | | $ | 24.21 | | | $ | 20.16 | | | $ | 19.96 | | | $ | 19.92 | | | $ | 20.44 | | |
Total Return(3) | | | 25.58 | % | | | 5.36 | % | | | 6.25 | % | | | 4.45 | % | | | 19.42 | % | |
Ratios and Supplemental Data: | |
Net Assets, End of Period (Thousands) | | $ | 146,722 | | | $ | 104,306 | | | $ | 75,297 | | | $ | 64,515 | | | $ | 83,135 | | |
Ratio of Expenses to Average Net Assets(7) | | | 1.21 | %(4) | | | 1.22 | %(4) | | | 1.25 | %(4) | | | 1.27 | %(4) | | | 1.20 | %(4)(5) | |
Ratio of Net Investment Income to Average Net Assets(7) | | | 0.94 | %(4) | | | 1.13 | %(4) | | | 1.15 | %(4) | | | 1.64 | %(4) | | | 1.42 | %(4) | |
Ratio of Rebate from Morgan Stanley Affiliates to Average Net Assets | | | 0.00 | %(6) | | | 0.00 | %(6) | | | 0.00 | %(6) | | | 0.00 | %(6) | | | 0.00 | %(6) | |
Portfolio Turnover Rate | | | 28 | % | | | 30 | % | | | 37 | % | | | 33 | % | | | 24 | % | |
(7) Supplemental Information on the Ratios to Average Net Assets: | |
Ratios Before Expense Limitation: | |
Expenses to Average Net Assets | | | N/A | | | | 1.23 | % | | | 1.25 | % | | | N/A | | | | N/A | | |
Net Investment Income to Average Net Assets | | | N/A | | | | 1.12 | % | | | 1.15 | % | | | N/A | | | | N/A | | |
(1) Reflects prior period custodian out-of-pocket expenses that were reimbursed in September 2016. The amount of the reimbursement was immaterial on a per share basis and did not impact the total return of Class A shares. The Ratio of Expenses to Average Net Assets would have been 0.01% higher and the Ratio of Net Investment Income to Average Net Assets would have been 0.01% lower had the custodian not reimbursed the Fund.
(2) Per share amount is based on average shares outstanding.
(3) Calculated based on the net asset value which does not reflect sales charges, if applicable, as of the last business day of the period.
(4) The Ratios of Expenses and Net Investment Income reflect the rebate of certain Fund expenses in connection with the investments in Morgan Stanley affiliates during the period. The effect of the rebate on the ratios is disclosed in the above table as "Ratio of Rebate from Morgan Stanley Affiliates to Average Net Assets."
(5) Effective September 16, 2013, the Adviser has agreed to limit the ratio of expenses to average net assets to the maximum ratio of 1.35% for Class A shares. Prior to September 16, 2013, the maximum ratio was 1.25% for Class A shares.
(6) Amount is less than 0.005%.
The accompanying notes are an integral part of the financial statements.
15
Morgan Stanley Institutional Fund, Inc.
Annual Report — December 31, 2017
Financial Highlights
Global Franchise Portfolio
| | | Class L | |
| | | Year Ended December 31, | |
Selected Per Share Data and Ratios | | 2017 | | 2016(1) | | 2015 | | 2014 | | 2013 | |
Net Asset Value, Beginning of Period | | $ | 20.13 | | | $ | 19.91 | | | $ | 19.87 | | | $ | 20.39 | | | $ | 17.83 | | |
Income from Investment Operations: | |
Net Investment Income(2) | | | 0.10 | | | | 0.13 | | | | 0.15 | | | | 0.25 | | | | 0.20 | | |
Net Realized and Unrealized Gain | | | 4.93 | | | | 0.82 | | | | 1.00 | | | | 0.55 | | | | 3.11 | | |
Total from Investment Operations | | | 5.03 | | | | 0.95 | | | | 1.15 | | | | 0.80 | | | | 3.31 | | |
Distributions from and/or in Excess of: | |
Net Investment Income | | | (0.06 | ) | | | (0.10 | ) | | | (0.19 | ) | | | (0.21 | ) | | | (0.21 | ) | |
Net Realized Gain | | | (0.92 | ) | | | (0.63 | ) | | | (0.92 | ) | | | (1.11 | ) | | | (0.54 | ) | |
Total Distributions | | | (0.98 | ) | | | (0.73 | ) | | | (1.11 | ) | | | (1.32 | ) | | | (0.75 | ) | |
Net Asset Value, End of Period | | $ | 24.18 | | | $ | 20.13 | | | $ | 19.91 | | | $ | 19.87 | | | $ | 20.39 | | |
Total Return(3) | | | 24.98 | % | | | 4.82 | % | | | 5.72 | % | | | 4.00 | % | | | 18.78 | % | |
Ratios and Supplemental Data: | |
Net Assets, End of Period (Thousands) | | $ | 7,993 | | | $ | 7,449 | | | $ | 8,898 | | | $ | 9,315 | | | $ | 9,112 | | |
Ratio of Expenses to Average Net Assets(7) | | | 1.70 | %(4) | | | 1.71 | %(4) | | | 1.72 | %(4) | | | 1.72 | %(4) | | | 1.70 | %(4)(5) | |
Ratio of Net Investment Income to Average Net Assets(7) | | | 0.44 | %(4) | | | 0.65 | %(4) | | | 0.72 | %(4) | | | 1.19 | %(4) | | | 1.03 | %(4) | |
Ratio of Rebate from Morgan Stanley Affiliates to Average Net Assets | | | 0.00 | %(6) | | | 0.00 | %(6) | | | 0.00 | %(6) | | | 0.00 | %(6) | | | 0.00 | %(6) | |
Portfolio Turnover Rate | | | 28 | % | | | 30 | % | | | 37 | % | | | 33 | % | | | 24 | % | |
(7) Supplemental Information on the Ratios to Average Net Assets: | |
Ratios Before Expense Limitation: | |
Expenses to Average Net Assets | | | N/A | | | | 1.72 | % | | | 1.73 | % | | | N/A | | | | N/A | | |
Net Investment Income to Average Net Assets | | | N/A | | | | 0.64 | % | | | 0.71 | % | | | N/A | | | | N/A | | |
(1) Reflects prior period custodian out-of-pocket expenses that were reimbursed in September 2016. The amount of the reimbursement was immaterial on a per share basis and did not impact the total return of Class L shares. The Ratio of Expenses to Average Net Assets would have been 0.01% higher and the Ratio of Net Investment Income to Average Net Assets would have been 0.01% lower had the custodian not reimbursed the Fund.
(2) Per share amount is based on average shares outstanding.
(3) Calculated based on the net asset value as of the last business day of the period.
(4) The Ratios of Expenses and Net Investment Income reflect the rebate of certain Fund expenses in connection with the investments in Morgan Stanley affiliates during the period. The effect of the rebate on the ratios is disclosed in the above table as "Ratio of Rebate from Morgan Stanley Affiliates to Average Net Assets."
(5) Effective September 16, 2013, the Adviser has agreed to limit the ratio of expenses to average net assets to the maximum ratio of 1.85% for Class L shares. Prior to September 16, 2013, the maximum ratio was 1.75% for Class L shares.
(6) Amount is less than 0.005%.
The accompanying notes are an integral part of the financial statements.
16
Morgan Stanley Institutional Fund, Inc.
Annual Report — December 31, 2017
Financial Highlights
Global Franchise Portfolio
| | | Class C | |
| | | Year Ended December 31, | | Period from
September 30, 2015(2) to | |
Selected Per Share Data and Ratios | | 2017 | | 2016(1) | | December 31, 2015 | |
Net Asset Value, Beginning of Period | | $ | 19.88 | | | $ | 19.75 | | | $ | 19.79 | | |
Income from Investment Operations: | |
Net Investment Income(3) | | | 0.04 | | | | 0.06 | | | | 0.01 | | |
Net Realized and Unrealized Gain | | | 4.86 | | | | 0.84 | | | | 1.02 | | |
Total from Investment Operations | | | 4.90 | | | | 0.90 | | | | 1.03 | | |
Distributions from and/or in Excess of: | |
Net Investment Income | | | (0.04 | ) | | | (0.14 | ) | | | (0.28 | ) | |
Net Realized Gain | | | (0.92 | ) | | | (0.63 | ) | | | (0.79 | ) | |
Total Distributions | | | (0.96 | ) | | | (0.77 | ) | | | (1.07 | ) | |
Net Asset Value, End of Period | | $ | 23.82 | | | $ | 19.88 | | | $ | 19.75 | | |
Total Return(4) | | | 24.63 | % | | | 4.58 | % | | | 5.11 | %(7) | |
Ratios and Supplemental Data: | |
Net Assets, End of Period (Thousands) | | $ | 47,726 | | | $ | 29,650 | | | $ | 5,765 | | |
Ratio of Expenses to Average Net Assets(9) | | | 1.98 | %(5) | | | 1.99 | %(5) | | | 2.03 | %(5)(8) | |
Ratio of Net Investment Income to Average Net Assets(9) | | | 0.16 | %(5) | | | 0.29 | %(5) | | | 0.11 | %(5)(8) | |
Ratio of Rebate from Morgan Stanley Affiliates to Average Net Assets | | | 0.00 | %(6) | | | 0.00 | %(6) | | | 0.00 | %(6)(8) | |
Portfolio Turnover Rate | | | 28 | % | | | 30 | % | | | 37 | % | |
(9) Supplemental Information on the Ratios to Average Net Assets: | |
Ratios Before Expense Limitation: | |
Expense to Average Net Assets | | | N/A | | | | 2.00 | % | | | N/A | | |
Net Investment Income to Average Net Assets | | | N/A | | | | 0.28 | % | | | N/A | | |
(1) Reflects prior period custodian out-of-pocket expenses that were reimbursed in September 2016. The amount of the reimbursement was immaterial on a per share basis and did not impact the total return of Class C shares. The Ratio of Expenses to Average Net Assets would have been 0.01% higher and the Ratio of Net Investment Income to Average Net Assets would have been 0.01% lower had the custodian not reimbursed the Fund.
(2) Commencement of Offering.
(3) Per share amount is based on average shares outstanding.
(4) Calculated based on the net asset value which does not reflect sales charges, if applicable, as of the last business day of the period.
(5) The Ratios of Expenses and Net Investment Income reflect the rebate of certain Fund expenses in connection with the investments in Morgan Stanley affiliates during the period. The effect of the rebate on the ratios is disclosed in the above table as "Ratio of Rebate from Morgan Stanley Affiliates to Average Net Assets."
(6) Amount is less than 0.005%.
(7) Not annualized.
(8) Annualized.
The accompanying notes are an integral part of the financial statements.
17
Morgan Stanley Institutional Fund, Inc.
Annual Report — December 31, 2017
Financial Highlights
Global Franchise Portfolio
| | | Class IS | |
| | | Year Ended December 31, | | Period from
May 29, 2015(2) to | |
Selected Per Share Data and Ratios | | 2017 | | 2016(1) | | December 31, 2015 | |
Net Asset Value, Beginning of Period | | $ | 20.55 | | | $ | 20.33 | | | $ | 21.49 | | |
Income from Investment Operations: | |
Net Investment Income(3) | | | 0.29 | | | | 0.21 | | | | 0.12 | | |
Net Realized and Unrealized Gain | | | 5.05 | | | | 0.93 | | | | 0.00 | (4) | |
Total from Investment Operations | | | 5.34 | | | | 1.14 | | | | 0.12 | | |
Distributions from and/or in Excess of: | |
Net Investment Income | | | (0.25 | ) | | | (0.29 | ) | | | (0.36 | ) | |
Net Realized Gain | | | (0.92 | ) | | | (0.63 | ) | | | (0.92 | ) | |
Total Distributions | | | (1.17 | ) | | | (0.92 | ) | | | (1.28 | ) | |
Net Asset Value, End of Period | | $ | 24.72 | | | $ | 20.55 | | | $ | 20.33 | | |
Total Return(5) | | | 26.00 | % | | | 5.70 | % | | | 0.45 | %(8) | |
Ratios and Supplemental Data: | |
Net Assets, End of Period (Thousands) | | $ | 90,488 | | | $ | 19,334 | | | $ | 9 | | |
Ratio of Expenses to Average Net Assets(10) | | | 0.91 | %(6) | | | 0.92 | %(6) | | | 0.94 | %(6)(9) | |
Ratio of Net Investment Income to Average Net Assets(10) | | | 1.23 | %(6) | | | 0.99 | %(6) | | | 0.95 | %(6)(9) | |
Ratio of Rebate from Morgan Stanley Affiliates to Average Net Assets | | | 0.00 | %(7) | | | 0.00 | %(7) | | | 0.00 | %(7)(9) | |
Portfolio Turnover Rate | | | 28 | % | | | 30 | % | | | 37 | % | |
(10) Supplemental Information on the Ratios to Average Net Assets: | |
Ratios Before Expense Limitation: | |
Expenses to Average Net Assets | | | N/A | | | | 0.94 | % | | | 16.54 | %(9) | |
Net Investment Income (Loss) to Average Net Assets | | | N/A | | | | 0.97 | % | | | (14.65 | )%(9) | |
(1) Reflects prior period custodian out-of-pocket expenses that were reimbursed in September 2016. The amount of the reimbursement was immaterial on a per share basis and did not impact the total return of Class IS shares. The Ratio of Expenses to Average Net Assets would have been 0.01% higher and the Ratio of Net Investment Income to Average Net Assets would have been 0.01% lower had the custodian not reimbursed the Fund.
(2) Commencement of Offering.
(3) Per share amount is based on average shares outstanding.
(4) Amount is less than $0.005 per share.
(5) Calculated based on the net asset value as of the last business day of the period.
(6) The Ratios of Expenses and Net Investment Income reflect the rebate of certain Fund expenses in connection with the investments in Morgan Stanley affiliates during the period. The effect of the rebate on the ratios is disclosed in the above table as "Ratio of Rebate from Morgan Stanley Affiliates to Average Net Assets."
(7) Amount is less than 0.005%.
(8) Not annualized.
(9) Annualized.
The accompanying notes are an integral part of the financial statements.
18
Morgan Stanley Institutional Fund, Inc.
Annual Report — December 31, 2017
Notes to Financial Statements
Morgan Stanley Institutional Fund, Inc. (the "Company") is registered under the Investment Company Act of 1940, as amended (the "Act"), as an open-end management investment company. The Company is comprised of twenty-nine separate, active, diversified and non-diversified funds (individually referred to as a "Fund", collectively as the "Funds"). The Company applies investment company accounting and reporting guidance.
The accompanying financial statements relate to the Global Franchise Portfolio. The Fund seeks long-term capital appreciation.
During the year ended December 31, 2017, Morgan Stanley Investment Management Company ("MSIM Company") served as the Sub-Adviser to the Fund. Effective December 31, 2017, MSIM Company is no longer a Sub-Adviser to the Fund.
The Fund offers five classes of shares — Class I, Class A, Class L, Class C and Class IS. On April 30, 2015, the Fund suspended offering of Class L shares. Existing Class L shareholders may invest through reinvestment of dividends and distributions.
A. Significant Accounting Policies: The following significant accounting policies are in conformity with U.S. generally accepted accounting principles ("GAAP"). Such policies are consistently followed by the Company in the preparation of its financial statements. GAAP may require management to make estimates and assumptions that affect the reported amounts and disclosures in the financial statements. Actual results may differ from those estimates.
1. Security Valuation: (1) An equity portfolio security listed or traded on an exchange is valued at its latest reported sales price (or at the exchange official closing price if such exchange reports an official closing price), and if there were no sales on a given day and if there is no official exchange closing price for that day, the security is valued at the mean between the last reported bid and asked prices if such bid and asked prices are available on the relevant exchanges. Listed equity securities not traded on the valuation date with no reported bid and asked prices available on the exchange are valued at the mean between the current bid and asked prices obtained from one or more reputable brokers or dealers. In cases where a security is traded on more than one exchange, the security is valued on the exchange designated as the primary market; (2) all other equity portfolio securities for which over-the-counter ("OTC") market quotations are readily available
are valued at the latest reported sales price (or at the market official closing price if such market reports an official closing price), and if there was no trading in the security on a given day and if there is no official closing price from relevant markets for that day, the security is valued at the mean between the last reported bid and asked prices if such bid and asked prices are available on the relevant markets. An unlisted equity security that does not trade on the valuation date and for which bid and asked prices from the relevant markets are unavailable is valued at the mean between the current bid and asked prices obtained from one or more reputable brokers or dealers; (3) certain portfolio securities may be valued by an outside pricing service/vendor approved by the Company's Board of Directors (the "Directors"). The pricing service/vendor may employ a pricing model that takes into account, among other things, bids, yield spreads, and/or other market data and specific security characteristics. Alternatively, if a valuation is not available from an outside pricing service/vendor, and the security trades on an exchange, the security may be valued at its latest reported sale price (or at the exchange official closing price if such exchange reports an official closing price), prior to the time when assets are valued. If there are no sales on a given day and if there is no official exchange closing price for that day, the security is valued at the mean between the last reported bid and asked prices if such bid and asked prices are available in the relevant exchanges; (4) when market quotations are not readily available, including circumstances under which Morgan Stanley Investment Management Inc. (the "Adviser") or Morgan Stanley Investment Management Limited ("MSIM Limited") and Morgan Stanley Investment Management Company ("MSIM Company") (together, the "Sub-Advisers"), each a wholly-owned subsidiary of Morgan Stanley, determine that the closing price, last sale price or the mean between the last reported bid and asked prices are not reflective of a security's market value, portfolio securities are valued at their fair value as determined in good faith under procedures established by and under the general supervision of the Directors. Occasionally, developments affecting the closing prices of securities and other assets may occur between the times at which valuations of such securities are determined (that is, close of the foreign market on which the securities trade) and the close of business of the New York Stock Exchange ("NYSE"). If developments occur during such periods that are expected to materially affect the value of such securities, such valuations may be
19
Morgan Stanley Institutional Fund, Inc.
Annual Report — December 31, 2017
Notes to Financial Statements (cont'd)
adjusted to reflect the estimated fair value of such securities as of the close of the NYSE, as determined in good faith by the Directors or by the Adviser using a pricing service and/or procedures approved by the Directors; (5) quotations of foreign portfolio securities, other assets and liabilities and forward contracts stated in foreign currency are translated into U.S. dollar equivalents at the prevailing market rates prior to the close of the NYSE; and (6) investments in mutual funds, including the Morgan Stanley Institutional Liquidity Funds, are valued at the net asset value ("NAV") as of the close of each business day.
The Directors have responsibility for determining in good faith the fair value of the investments, and the Directors may appoint others, such as the Company's Adviser or a valuation committee, to assist the Directors in determining fair value and to make the actual calculations pursuant to the fair valuation methodologies previously approved by the Directors. Under procedures approved by the Directors, the Company's Adviser has formed a Valuation Committee whose members are approved by the Directors. The Valuation Committee provides administration and oversight of the Company's valuation policies and procedures, which are reviewed at least annually by the Directors. These procedures allow the Company to utilize independent pricing services, quotations from securities and financial instrument dealers, and other market sources to determine fair value.
The Company has procedures to determine the fair value of securities and other financial instruments for which market prices are not readily available. Under these procedures, the Valuation Committee convenes on a regular and ad hoc basis to review such securities and considers a number of factors, including valuation methodologies and significant unobservable valuation inputs, when arriving at fair value. The Valuation Committee may employ a market-based approach which may use related or comparable assets or liabilities, recent transactions, market multiples, book values, and other relevant information for the investment to determine the fair value of the investment. An income-based valuation approach may also be used in which the anticipated future cash flows of the investment are discounted to calculate fair value. Discounts may also be applied due to the nature or duration of any restrictions on the disposition of the investments. Due to the inherent uncertainty of valuations of such investments, the fair values may differ significantly from the values that would have been used had an active market existed. The
Valuation Committee employs various methods for calibrating these valuation approaches including a regular review of valuation methodologies, key inputs and assumptions, transactional back-testing or disposition analysis, and reviews of any related market activity.
2. Fair Value Measurement: Financial Accounting Standards Board ("FASB") Accounting Standards CodificationTM ("ASC") 820, "Fair Value Measurement" ("ASC 820"), defines fair value as the value that the Fund would receive to sell an investment or pay to transfer a liability in a timely transaction with an independent buyer in the principal market, or in the absence of a principal market, the most advantageous market for the investment or liability. ASC 820 establishes a three-tier hierarchy to distinguish between (1) inputs that reflect the assumptions market participants would use in valuing an asset or liability developed based on market data obtained from sources independent of the reporting entity (observable inputs) and (2) inputs that reflect the reporting entity's own assumptions about the assumptions market participants would use in valuing an asset or liability developed based on the best information available in the circumstances (unobservable inputs) and to establish classification of fair value measurements for disclosure purposes. Various inputs are used in determining the value of the Fund's investments. The inputs are summarized in the three broad levels listed below.
• Level 1 – unadjusted quoted prices in active markets for identical investments
• Level 2 – other significant observable inputs (including quoted prices for similar investments, interest rates, prepayment speeds, credit risk, etc.)
• Level 3 – significant unobservable inputs including the Fund's own assumptions in determining the fair value of investments. Factors considered in making this determination may include, but are not limited to, information obtained by contacting the issuer, analysts, or the appropriate stock exchange (for exchange-traded securities), analysis of the issuer's financial statements or other available documents and, if necessary, available information concerning other securities in similar circumstances
20
Morgan Stanley Institutional Fund, Inc.
Annual Report — December 31, 2017
Notes to Financial Statements (cont'd)
The inputs or methodology used for valuing securities are not necessarily an indication of the risk associated with investing in those securities and the determination of the significance of a particular input to the fair value measurement in its entirety requires judgment and considers factors specific to each security.
The following is a summary of the inputs used to value the Fund's investments as of December 31, 2017.
Investment Type | | Level 1
Unadjusted
quoted
prices
(000) | | Level 2
Other
significant
observable
inputs
(000) | | Level 3
Significant
unobservable
inputs
(000) | | Total
(000) | |
Assets: | |
Common Stocks | |
Beverages | | $ | 30,674 | | | $ | 58,235 | | | $ | — | | | $ | 88,909 | | |
Capital Markets | | | 25,438 | | | | — | | | | — | | | | 25,438 | | |
Chemicals | | | 8,791 | | | | — | | | | — | | | | 8,791 | | |
Food Products | | | — | | | | 8,591 | | | | — | | | | 8,591 | | |
Health Care Equipment &
Supplies | | | 15,893 | | | | — | | | | — | | | | 15,893 | | |
Household Products | | | — | | | | 66,705 | | | | — | | | | 66,705 | | |
Information Technology
Services | | | 174,394 | | | | — | | | | — | | | | 174,394 | | |
Media | | | 78,774 | | | | — | | | | — | | | | 78,774 | | |
Personal Products | | | — | | | | 113,490 | | | | — | | | | 113,490 | | |
Pharmaceuticals | | | 41,530 | | | | — | | | | — | | | | 41,530 | | |
Professional Services | | | — | | | | 63,253 | | | | — | | | | 63,253 | | |
Software | | | 96,477 | | | | 45,963 | | | | — | | | | 142,440 | | |
Textiles, Apparel &
Luxury Goods | | | 34,199 | | | | — | | | | — | | | | 34,199 | | |
Tobacco | | | 88,680 | | | | 69,279 | | | | — | | | | 157,959 | | |
Total Common Stocks | | | 594,850 | | | | 425,516 | | | | — | | | | 1,020,366 | | |
Short-Term Investment | |
Investment Company | | | 25,156 | | | | — | | | | — | | | | 25,156 | | |
Total Assets | | $ | 620,006 | | | $ | 425,516 | | | $ | — | | | $ | 1,045,522 | | |
Transfers between investment levels may occur as the markets fluctuate and/or the availability of data used in an investment's valuation changes. The Fund recognizes transfers between the levels as of the end of the period. As of December 31, 2017, securities with a total value of approximately $408,343,000 transferred from Level 1 to Level 2. Securities that were valued using unadjusted quoted prices at December 31, 2016 were valued using other significant observable inputs at December 31, 2017. At December 31, 2017, the fair value of certain securities were adjusted due to developments which occurred between the time of the close of the foreign markets on which they trade and the close of business on the NYSE which resulted in their Level 2 classification.
3. Foreign Currency Translation and Foreign Investments: The books and records of the Fund are
maintained in U.S. dollars. Foreign currency amounts are translated into U.S. dollars as follows:
– investments, other assets and liabilities at the prevailing rate of exchange on the valuation date;
– investment transactions and investment income at the prevailing rates of exchange on the dates of such transactions.
Although the net assets of the Fund are presented at the foreign exchange rates and market values at the close of the period, the Fund does not isolate that portion of the results of operations arising as a result of changes in the foreign exchange rates from the fluctuations arising from changes in the market prices of securities held at period end. Similarly, the Fund does not isolate the effect of changes in foreign exchange rates from the fluctuations arising from changes in the market prices of securities sold during the period. Accordingly, realized and unrealized foreign currency gains (losses) on investments in securities are included in the reported net realized and unrealized gains (losses) on investment transactions and balances. However, pursuant to U.S. federal income tax regulations, gains and losses from certain foreign currency transactions and the foreign currency portion of gains and losses realized on sales and maturities of foreign denominated debt securities are treated as ordinary income for U.S. federal income tax purposes.
Net realized gains (losses) on foreign currency transactions represent net foreign exchange gains (losses) from foreign currency forward exchange contracts, disposition of foreign currencies, currency gains (losses) realized between the trade and settlement dates on securities transactions, and the difference between the amount of investment income and foreign withholding taxes recorded on the Fund's books and the U.S. dollar equivalent amounts actually received or paid. Net unrealized currency gains (losses) from valuing foreign currency denominated assets and liabilities at period end exchange rates are reflected as a component of unrealized appreciation (depreciation) in the Statement of Assets and Liabilities. The change in unrealized currency gains (losses) on foreign currency translations for the period is reflected in the Statement of Operations.
Foreign security and currency transactions may involve certain considerations and risks not typically associated with those of U.S. dollar denominated transactions as a result of, among other factors, fluctuations of exchange
21
Morgan Stanley Institutional Fund, Inc.
Annual Report — December 31, 2017
Notes to Financial Statements (cont'd)
rates in relation to the U.S. dollar, the possibility of lower levels of governmental supervision and regulation of foreign securities markets and the possibility of political or economic instability.
Governmental approval for foreign investments may be required in advance of making an investment under certain circumstances in some countries, and the extent of foreign investments in domestic companies may be subject to limitation in other countries. Foreign ownership limitations also may be imposed by the charters of individual companies to prevent, among other concerns, violations of foreign investment limitations. As a result, an additional class of shares (identified as "Foreign" in the Portfolio of Investments) may be created and offered for investment. The "local" and "foreign shares" market values may differ. In the absence of trading of the foreign shares in such markets, the Fund values the foreign shares at the closing exchange price of the local shares.
4. Indemnifications: The Company enters into contracts that contain a variety of indemnifications. The Company's maximum exposure under these arrangements is unknown. However, the Company has not had prior claims or losses pursuant to these contracts and expects the risk of loss to be remote.
5. Dividends and Distributions to Shareholders: Dividends and distributions to shareholders are recorded on the ex-dividend date. Dividends from net investment income, if any, are declared and paid annually. Net realized capital gains, if any, are distributed at least annually.
6. Security Transactions, Income and Expenses: Security transactions are accounted for on the trade date (date the order to buy or sell is executed). Realized gains and losses on the sale of investment securities are determined on the specific identified cost method. Dividend income and other distributions are recorded on the ex-dividend date (except for certain foreign dividends which may be recorded as soon as the Fund is informed of such dividends) net of applicable withholding taxes. Interest income is recognized on the accrual basis except where collection is in doubt. Discounts are accreted and premiums are amortized over the life of the respective securities. Most expenses of the Company can be directly attributed to a particular Fund. Expenses which cannot be directly attributed are apportioned among the Funds based upon relative net assets or other appropriate methods. Income,
expenses (other than class specific expenses — distribution and shareholder services, transfer agency and sub transfer agency fees) and realized and unrealized gains or losses are allocated to each class of shares based upon their relative net assets.
B. Advisory/Sub-Advisory Fees: The Adviser, a wholly-owned subsidiary of Morgan Stanley, provides the Fund with advisory services under the terms of an Investment Advisory Agreement, paid quarterly, at the annual rate based on the daily net assets as follows:
First $500
million | | Next $500
million | | Over $1
billion | |
| | 0.80 | % | | | 0.75 | % | | | 0.70 | % | |
For the year ended December 31, 2017, the advisory fee rate (net of rebate) was equivalent to an annual effective rate of 0.77% of the Fund's average daily net assets.
The Adviser has agreed to reduce its advisory fee and/or reimburse the Fund so that total annual portfolio operating expenses, excluding certain investment related expenses, taxes, interest and other extraordinary expenses (including litigation), will not exceed 1.00% for Class I shares, 1.35% for Class A shares, 1.85% for Class L shares, 2.10% for Class C shares and 0.95% for Class IS shares. The fee waivers and/or expense reimbursements will continue for at least one year from the date of the Fund's prospectus or until such time as the Directors act to discontinue all or a portion of such waivers and/or reimbursements when they deem such action is appropriate. This arrangement had no effect for the year ended December 31, 2017.
The Adviser has entered into a Sub-Advisory Agreement with the Sub-Advisers, each a wholly-owned subsidiary of Morgan Stanley. The Sub-Advisers provide the Fund with advisory services subject to the overall supervision of the Adviser and the Fund's Officers and Directors. The Adviser pays the Sub-Advisers on a monthly basis a portion of the net advisory fees the Adviser receives from the Fund.
Effective December 31, 2017, MSIM Company is no longer a Sub-Adviser to the Fund.
C. Administration Fees: The Adviser also serves as Administrator to the Company and provides administrative services pursuant to an Administration Agreement for an annual fee, accrued daily and paid monthly, of 0.08% of the Fund's average daily net assets.
Under a Sub-Administration Agreement between the Administrator and State Street Bank and Trust Company
22
Morgan Stanley Institutional Fund, Inc.
Annual Report — December 31, 2017
Notes to Financial Statements (cont'd)
("State Street"), State Street provides certain administrative services to the Company. For such services, the Administrator pays State Street a portion of the fee the Administrator receives from the Fund.
D. Distribution and Shareholder Services Fees: Morgan Stanley Distribution, Inc. ("MSDI" or the "Distributor"), a wholly-owned subsidiary of the Adviser and an indirect subsidiary of Morgan Stanley, serves as the Company's Distributor of Fund shares pursuant to a Distribution Agreement. The Company has adopted a Shareholder Services Plan with respect to Class A shares pursuant to Rule 12b-1 under the Act. Under the Shareholder Services Plan, the Fund pays the Distributor a shareholder services fee, accrued daily and paid monthly, at an annual rate of 0.25% of the Fund's average daily net assets attributable to Class A shares.
The Company has adopted a Distribution and Shareholder Services Plan with respect to Class L shares pursuant to Rule 12b-1 under the Act. Under the Distribution and Shareholder Services Plan, the Fund pays the Distributor a distribution fee, accrued daily and paid monthly, at an annual rate of 0.50% and a shareholder services fee, accrued daily and paid monthly, at an annual rate of 0.25% of the Fund's average daily net assets attributable to Class L shares.
The Company has adopted a Distribution and Shareholder Services Plan with respect to Class C shares pursuant to Rule 12b-1 under the Act. Under the Distribution and Shareholder Services Plan, the Fund pays the Distributor a distribution fee, accrued daily and paid monthly, at an annual rate of 0.75% and a shareholder services fee, accrued daily and paid monthly, at an annual rate of 0.25% of the Fund's average daily net assets attributable to Class C shares.
The distribution and shareholder services fees are used to support the expenses associated with servicing and maintaining accounts. The Distributor may compensate other parties for providing shareholder support services to investors who purchase Class A, Class L and Class C shares.
E. Dividend Disbursing and Transfer Agent: The Company's dividend disbursing and transfer agent is Boston Financial Data Services, Inc. ("BFDS"). Pursuant to a Transfer Agency Agreement, the Company pays BFDS a fee based on the number of classes, accounts and transactions relating to the Funds of the Company. Effective January 1, 2018, BFDS changed its name to DST Asset Manager Solutions, Inc.
F. Custodian Fees: State Street (the "Custodian") also serves as Custodian for the Company in accordance with a
Custodian Agreement. The Custodian holds cash, securities, and other assets of the Company as required by the Act. Custody fees are payable monthly based on assets held in custody, investment purchases and sales activity and account maintenance fees, plus reimbursement for certain out-of-pocket expenses.
G. Security Transactions and Transactions with Affiliates: For the year ended December 31, 2017, purchases and sales of investment securities for the Fund, other than long-term U.S. Government securities and short-term investments, were approximately $343,092,000 and $247,033,000, respectively. There were no purchases and sales of long-term U.S. Government securities for the year ended December 31, 2017.
The Fund invests in the Institutional Class of the Morgan Stanley Institutional Liquidity Funds — Treasury Securities Portfolio (the "Liquidity Funds"), an open-end management investment company managed by the Adviser. Advisory fees paid by the Fund are reduced by an amount equal to its pro-rata share of the advisory and administration fees paid by the Fund due to its investment in the Liquidity Funds. For the year ended December 31, 2017, advisory fees paid were reduced by approximately $35,000 relating to the Fund's investment in the Liquidity Funds.
A summary of the Fund's transactions in shares of the Liquidity Funds during the year ended December 31, 2017 is as follows:
Affiliated
Investment
Company | | Value
December 31,
2016
(000) | | Purchases
at Cost
(000) | | Proceeds
from Sales
(000) | | Dividend
Income
(000) | |
Liquidity Funds | | $ | 14,913 | | | $ | 211,105 | | | $ | 200,862 | | | $ | 147 | | |
Affiliated
Investment
Company (cont'd) | | Realized
Gain (Loss)
(000) | | Change in
Unrealized
Appreciation
(Depreciation)
(000) | | Value
December 31,
2017
(000) | |
Liquidity Funds | | $ | — | | | $ | — | | | $ | 25,156 | | |
The Fund is permitted to purchase and sell securities ("cross-trade") from and to other Morgan Stanley Funds as well as other funds and client accounts for which the Adviser or an affiliate of the Adviser serves as investment adviser, pursuant to procedures approved by the Directors in compliance with Rule 17a-7 under the Act (the "Rule"). Each cross-trade is executed at the current market price in compliance with provisions of the Rule. For the year ended December 31, 2017, the Fund did not engage in any cross-trade transactions.
The Fund has an unfunded Deferred Compensation Plan (the "Compensation Plan"), which allows each independent Director
23
Morgan Stanley Institutional Fund, Inc.
Annual Report — December 31, 2017
Notes to Financial Statements (cont'd)
to defer payment of all, or a portion, of the fees he or she receives for serving on the Board of Directors. Each eligible Director generally may elect to have the deferred amounts credited with a return equal to the total return on one or more of the Morgan Stanley funds that are offered as investment options under the Compensation Plan. Appreciation/depreciation and distributions received from these investments are recorded with an offsetting increase/decrease in the deferred compensation obligation and do not affect the NAV of the Fund.
H. Federal Income Taxes: It is the Fund's intention to continue to qualify as a regulated investment company and distribute all of its taxable and tax-exempt income. Accordingly, no provision for federal income taxes is required in the financial statements.
The Fund may be subject to taxes imposed by countries in which it invests. Such taxes are generally based on income and/or capital gains earned or repatriated. Taxes are accrued based on net investment income, net realized gains and net unrealized appreciation as such income and/or gains are earned. Taxes may also be based on transactions in foreign currency and are accrued based on the value of investments denominated in such currency.
FASB ASC 740-10, "Income Taxes — Overall", sets forth a minimum threshold for financial statement recognition of the benefit of a tax position taken or expected to be taken in a tax return. Management has concluded there are no significant uncertain tax positions that would require recognition in the financial statements. If applicable, the Fund recognizes interest accrued related to unrecognized tax benefits in "Interest Expense" and penalties in "Other Expenses" in the Statement of Operations. The Fund files tax returns with the U.S. Internal Revenue Service, New York and various states. Generally, each of the tax years in the four-year period ended December 31, 2017, remains subject to examination by taxing authorities.
The tax character of distributions paid may differ from the character of distributions shown in the Statements of Changes in Net Assets due to short-term capital gains being treated as ordinary income for tax purposes. The tax character of distributions paid during fiscal years 2017 and 2016 was as follows:
2017
Distributions
Paid From: | | 2016
Distributions
Paid From: | |
Ordinary
Income
(000) | | Long-Term
Capital Gain
(000) | | Ordinary
Income
(000) | | Long-Term
Capital Gain
(000) | |
| $ | 11,212 | | | $ | 35,316 | | | $ | 9,564 | | | $ | 22,773 | | |
The amount and character of income and gains to be distributed are determined in accordance with income tax regulations which may differ from GAAP. These book/tax differences are either considered temporary or permanent in nature.
Temporary differences are primarily due to differing book and tax treatments for the timing of the recognition of gains (losses) on certain investment transactions and the timing of the deductibility of certain expenses.
Permanent differences, primarily due to differing treatments of gains (losses) related to foreign currency transactions and a dividend redesignation, resulted in the following reclassifications among the components of net assets at December 31, 2017:
Accumulated
Undistributed
Net Investment
Income
(000) | | Accumulated
Net Realized
Gain
(000) | | Paid-in-
Capital
(000) | |
| $ | (128 | ) | | $ | 128 | | | $ | — | | |
At December 31, 2017, the components of distributable earnings for the Fund on a tax basis were as follows:
Undistributed
Ordinary
Income
(000) | | Undistributed
Long-Term
Capital Gain
(000) | |
| $ | 935 | | | $ | 8,340 | | |
I. Credit Facility: The Company and other Morgan Stanley funds participated in a $150,000,000 committed, unsecured revolving line of credit facility (the "Facility") with State Street. This Facility is to be used for temporary emergency purposes or funding of shareholder redemption requests. The interest rate on borrowings is based on the federal funds rate or 1 month LIBOR rate plus a spread. The Facility also has a commitment fee of 0.25% per annum based on the unused portion of the Facility. During the year ended December 31, 2017, the Fund did not have any borrowings under the Facility.
J. Other: At December 31, 2017, the Fund had record owners of 10% or greater. Investment activities of these shareholders could have a material impact on the Fund. The aggregate percentage of such owners was 32.5%.
24
Morgan Stanley Institutional Fund, Inc.
Annual Report — December 31, 2017
Report of Independent Registered Public Accounting Firm
To the Shareholders and Board of Directors of
Morgan Stanley Institutional Fund, Inc. —
Global Franchise Portfolio
Opinion on the Financial Statements
We have audited the accompanying statement of assets and liabilities of Global Franchise Portfolio (the "Fund") (one of the funds constituting the Morgan Stanley Institutional Fund, Inc. (the "Company")), including the portfolio of investments, as of December 31, 2017, and the related statement of operations for the year then ended, the statements of changes in net assets for each of the two years in the period then ended, the financial highlights for each of the five years in the period then ended and the related notes (collectively referred to as the "financial statements"). In our opinion, the financial statements present fairly, in all material respects, the financial position of Global Franchise Portfolio (one of the funds constituting Morgan Stanley Institutional Fund, Inc.) at December 31, 2017, the results of its operations for the year then ended, the changes in its net assets for each of the two years in the period then ended and its financial highlights for each of the five years in the period then ended, in conformity with U.S. generally accepted accounting principles.
Basis for Opinion
These financial statements are the responsibility of the Company's management. Our responsibility is to express an opinion on the Fund's financial statements based on our audits. We are a public accounting firm registered with the Public Company Accounting Oversight Board (United States) ("PCAOB") and are required to be independent with respect to the Company in accordance with the U.S. federal securities law and the applicable rules and regulations of the Securities and Exchange Commission and the PCAOB.
We conducted our audits in accordance with the standards of the PCAOB. Those standards require that we plan and perform the audit to obtain reasonable assurance about whether the financial statements are free of material misstatement, whether due to error or fraud. The Company is not required to have, nor were we engaged to perform, an audit of the Company's internal control over financial reporting. As part of our audits, we are required to obtain an understanding of internal control over financial reporting, but not for the purpose of expressing an opinion on the effectiveness of the Company's internal control over financial reporting. Accordingly, we express no such opinion.
Our audits included performing procedures to assess the risks of material misstatement of the financial statements, whether due to error or fraud, and performing procedures that respond to those risks. Such procedures included examining, on a test basis, evidence regarding the amounts and disclosures in the financial statements. Our procedures included confirmation of securities owned as of December 31, 2017 by correspondence with the custodian and others or by other appropriate auditing procedures where replies from others were not received. Our audits also included evaluating the accounting principles used and significant estimates made by management, as well as evaluating the overall presentation of the financial statements. We believe that our audits provide a reasonable basis for our opinion.

We have served as the auditor of one or more Morgan Stanley investment companies since 2000.
Boston, Massachusetts
February 26, 2018
25
Morgan Stanley Institutional Fund, Inc.
Annual Report — December 31, 2017
Federal Tax Notice (unaudited)
For federal income tax purposes, the following information is furnished with respect to the distributions paid by the Fund during its taxable year ended December 31, 2017. For corporate shareholders, 72.4% of the dividends qualified for the dividends received deduction.
The Fund designated and paid approximately $35,316,000 as a long-term capital gain distribution.
For federal income tax purposes, the following information is furnished with respect to the Fund's earnings for its taxable year ended December 31, 2017. When distributed, certain earnings may be subject to a maximum tax rate of 15% as provided for the Jobs and Growth Tax Relief Reconciliation Act of 2003. The Fund designated up to a maximum of approximately $11,599,000 as taxable at this lower rate.
The Fund intends to pass through foreign tax credits of approximately $376,000 and has derived net income from sources within foreign countries amounting to approximately $10,141,000.
In January, the Fund provides tax information to shareholders for the preceding calendar year.
26
Morgan Stanley Institutional Fund, Inc.
Annual Report — December 31, 2017
Privacy Notice (unaudited)
MORGAN STANLEY INVESTMENT MANAGEMENT INC.
AN IMPORTANT NOTICE CONCERNING OUR U.S. PRIVACY POLICY
We are required by federal law to provide you with a copy of our privacy policy annually. This policy applies to current and former individual investors in funds managed or sponsored by Morgan Stanley Investment Management Inc. ("MSIM") as well as current and former individual clients of MSIM. This policy is not applicable to partnerships, corporations, trusts or other non-individual clients or investors. Please note that we may amend this policy at any time, and will inform you of any changes as required by law.
WE RESPECT YOUR PRIVACY
We appreciate that you have provided us with your personal financial information. We strive to maintain the privacy of such information while we help you achieve your financial objectives. This Notice describes what non-public personal information we collect about you, why we collect it, when we may share it with others and how certain others may use it. It discusses the steps you may take to limit our sharing of certain information about you to affiliated companies in the Morgan Stanley family of companies ("other Morgan Stanley companies"). It also discloses how you may limit use of certain shared information for marketing purposes by other Morgan Stanley branded companies. Throughout this policy, we refer to the non-public information that personally identifies you or your accounts as "personal information.''
1. WHAT PERSONAL INFORMATION DO WE COLLECT ABOUT YOU?
We obtain personal information from applications and other forms you submit to us, from your dealings with us, from consumer reporting agencies, from our Web sites and from third parties and other sources.
For example:
• We may collect information such as your name, address, e-mail address, telephone/fax numbers, assets, income and investment objectives through subscription documents, applications and other forms you submit to us.
• We may obtain information about account balances, your use of account(s) and the types of products and services you prefer to receive from us through your dealings and transactions with us and other sources.
• We may obtain information about your creditworthiness and credit history from consumer reporting agencies.
• We may collect background information from and through third-party vendors to verify representations you have made and to comply with various regulatory requirements.
• If you interact with us through our public and private Web sites, we may collect information that you provide directly through online communications (such as an e-mail address). We may also collect information about your Internet service provider, your domain name, your computer's operating system and Web browser, your use of our Web sites and your product and service preferences, through the use of "cookies." Please consult the Terms of Use of these sites for more details.
2. WHEN DO WE DISCLOSE PERSONAL INFORMATION WE COLLECT ABOUT YOU?
We may disclose personal information we collect about you to other Morgan Stanley companies and to non-affiliated third parties.
a. Information We Disclose to Other Morgan Stanley Companies.
We may disclose personal information to other Morgan Stanley companies for a variety of reasons, including to manage your account(s) effectively, to service and process your transactions, to let you know about products and services offered by us and other Morgan Stanley companies, to manage our business, and as otherwise required or permitted by law. Offers for products and services from other Morgan Stanley companies are developed under conditions designed to safeguard your personal information.
27
Morgan Stanley Institutional Fund, Inc.
Annual Report — December 31, 2017
Privacy Notice (unaudited) (cont'd)
b. Information We Disclose to Non-affiliated Third Parties.
We do not disclose personal information that we collect about you to non-affiliated third parties except to those who provide marketing services on our behalf, to financial institutions with whom we have joint marketing agreements, and as otherwise required or permitted by law. For example, we may disclose personal information to non-affiliated third parties for servicing and processing transactions, to offer our own products and services, to protect against fraud, for institutional risk control, to respond to judicial process or to perform services on our behalf. When we share personal information with a non-affiliated third party, they are required to limit their use of personal information to the particular purpose for which it was shared and they are not allowed to share personal information with others except to fulfill that limited purpose or as may be permitted or required by law.
3. HOW DO WE PROTECT THE SECURITY AND CONFIDENTIALITY OF PERSONAL INFORMATION WE COLLECT ABOUT YOU?
We maintain physical, electronic and procedural security measures to help safeguard the personal information we collect about you. We have internal policies governing the proper handling of client information. Third parties that provide support or marketing services on our behalf may also receive personal information, and we require them to adhere to confidentiality standards with respect to such information.
4. HOW CAN YOU LIMIT THE SHARING OF CERTAIN TYPES OF PERSONAL INFORMATION WITH OTHER MORGAN STANLEY COMPANIES?
We offer you choices as to whether we share with other Morgan Stanley companies the personal information that was collected to determine your eligibility for products and services you request ("eligibility information"). Eligibility information does not include your identification information or personal information pertaining to our transactions or experiences with you. Please note that, even if you direct us not to share eligibility information with other Morgan Stanley companies ("opt-out"), we may still share personal information, including eligibility information, with those companies in circumstances excluded from the opt-out under applicable law, such as to process transactions or to service your account.
5. HOW CAN YOU LIMIT THE USE OF CERTAIN TYPES OF PERSONAL INFORMATION BY OTHER MORGAN STANLEY COMPANIES FOR MARKETING?
By following the opt-out instructions in Section 6 below, you may limit other Morgan Stanley branded companies from marketing their products or services to you based on personal information we disclose to them. This information may include, for example, your income and account history with us. Please note that, even if you choose to limit Other Morgan Stanley Companies from using personal information about you that we may share with them for marketing their products and services to you, Other Morgan Stanley Companies may use your personal information that they obtain from us to market to you in circumstances permitted by law, such as if the Other Morgan Stanley Company has its own relationship with you.
6. HOW CAN YOU SEND US AN OPT-OUT INSTRUCTION?
If you wish to limit our sharing of eligibility information about you with other Morgan Stanley companies or other Morgan Stanley companies' use of personal information for marketing purposes, as described in this notice, you may do so by:
• Calling us at (800) 548-7786
Monday–Friday between 8a.m. and 6p.m.(EST)
• Writing to us at the following address:
DST Asset Manager Solutions, Inc.
c/o Privacy Coordinator
P.O. Box 219804
Kansas City, Missouri 64121
28
Morgan Stanley Institutional Fund, Inc.
Annual Report — December 31, 2017
Privacy Notice (unaudited) (cont'd)
Your written request should include your name, address, telephone number and account number(s) to which the opt-out applies and whether you are opting out with respect to sharing of eligibility information (Section 4 above), or if information used for Marketing (Section 5 above) or both. Written opt-out requests should not be sent with any other correspondence. In order to process your request, we require that the request be provided by you directly and not through a third party.
Your opt-out preference will remain in effect with respect to this policy (as it may be amended) until you notify us otherwise. If you have a joint account, your direction for us not to share this information with other Morgan Stanley companies and for those other Morgan Stanley companies not to use your personal information for marketing will be applied to all account holders on that account. Please understand that if you limit our sharing or our affiliated companies' use of personal information, you and any joint account holder(s) may not receive information about Morgan Stanley products and services, including products or services that could help you manage your financial resources and achieve your investment objectives.
7. WHAT IF AN AFFILIATED COMPANY BECOMES A NON-AFFILIATED THIRD PARTY?
If, at any time in the future, an affiliated company becomes a non-affiliated third party, further disclosures of personal information made to the former affiliated company will be limited to those described in Section 2(b) above relating to non-affiliated third parties. If you elected under Section 6 to limit disclosures we make to affiliated companies, or use of personal information by affiliated companies, your election will not apply to use by any former affiliated company of your personal information in their possession once it becomes a non-affiliated third party.
SPECIAL NOTICE TO RESIDENTS OF VERMONT
The following section supplements our policy with respect to our individual clients who have a Vermont address and supersedes anything to the contrary in the above policy with respect to those clients only.
The state of Vermont requires financial institutions to obtain your consent prior to sharing personal information that they collect about you with affiliated companies and non-affiliated third parties other than in certain limited circumstances. Except as permitted by law, we will not share personal information we collect about you with non-affiliated third parties or other Morgan Stanley companies unless you provide us with your written consent to share such information ("opt-in").
If you wish to receive offers for investment products and services offered by or through other Morgan Stanley companies, please notify us in writing at the following address:
DST Asset Manager Solutions, Inc.
c/o Privacy Coordinator
P.O. Box 219804
Kansas City, Missouri 64121
Your authorization should include your name, address, telephone number and account number(s) to which the opt-in applies and should not be sent with any other correspondence. In order to process your authorization, we require that the authorization be provided by you directly and not through a third party.
SPECIAL NOTICE TO RESIDENTS OF CALIFORNIA
The following section supplements our policy with respect to our individual clients who have a California address and supersedes anything to the contrary in the above policy with respect to those clients only.
In response to a California law, if your account has a California home address, your personal information will not be disclosed to non-affiliated third parties except as permitted by applicable California law, and we will limit sharing such information with our affiliates to comply with California privacy laws that apply to us.
29
Morgan Stanley Institutional Fund, Inc.
Annual Report — December 31, 2017
Director and Officer Information (unaudited)
Independent Directors:
Name, Age and Address of
Independent Director | | Position(s)
Held with
Registrant | | Length of Time
Served* | | Principal Occupation(s) During Past 5 Years
and Other Relevant Professional Experience | | Number of
Portfolios in
Fund Complex
Overseen by
Independent
Director** | | Other Directorships
Held by Independent
Director*** | |
Frank L. Bowman (73)
c/o Perkins Coie LLP
Counsel to the Independent
Directors
30 Rockefeller Plaza
New York, NY 10112 | | Director | | Since
August
2006 | | President, Strategic Decisions, LLC (consulting) (since February 2009); Director or Trustee of various Morgan Stanley Funds (since August 2006); Chairperson of the Compliance and Insurance Committee (since October 2015); formerly, Chairperson of the Insurance Sub-Committee of the Compliance and Insurance Committee (2007-2015); served as President and Chief Executive Officer of the Nuclear Energy Institute (policy organization) (February 2005-November 2008); retired as Admiral, U.S. Navy after serving over 38 years on active duty including 8 years as Director of the Naval Nuclear Propulsion Program in the Department of the Navy and the U.S. Department of Energy (1996-2004); served as Chief of Naval Personnel (July 1994-September 1996) and on the Joint Staff as Director of Political Military Affairs (June 1992-July 1994); knighted as Honorary Knight Commander of the Most Excellent Order of the British Empire; awarded the Officier de l'Orde National du Mérite by the French Government; elected to the National Academy of Engineering (2009). | | | 88 | | | Director of BP p.l.c.; Director of Naval and Nuclear Technologies LLP; Director Emeritus of the Armed Services YMCA; Director of the U.S. Naval Submarine League; Member of the National Security Advisory Council of the Center for U.S. Global Engagement and a member of the CNA Military Advisory Board; Trustee of Fairhaven United Methodist Church; and Director of other various non-profit organizations. | |
Kathleen A. Dennis (64)
c/o Perkins Coie LLP
Counsel to the Independent Directors
30 Rockefeller Plaza
New York, NY 10112 | | Director | | Since
August
2006 | | President, Cedarwood Associates (mutual fund and investment management consulting) (since July 2006); Chairperson of the Liquidity and Alternatives Sub-Committee of the Investment Committee (since October 2006) and Director or Trustee of various Morgan Stanley Funds (since August 2006); formerly, Senior Managing Director of Victory Capital Management (1993-2006). | | | 89 | | | Director of various non-profit organizations. | |
Nancy C. Everett (62)
c/o Perkins Coie LLP
Counsel to the Independent Directors
30 Rockefeller Plaza
New York, NY 10112 | | Director | | Since
January
2015 | | Chief Executive Officer, Virginia Commonwealth University Investment Company (since November 2015); Owner, OBIR, LLC (institutional investment management consulting) (since June 2014); formerly, Managing Director, BlackRock Inc. (February 2011-December 2013); and Chief Executive Officer, General Motors Asset Management (a/k/a Promark Global Advisors, Inc.) (June 2005-May 2010). | | | 90 | | | Formerly, Member of Virginia Commonwealth University School of Business Foundation (2005-2016); Member of Virginia Commonwealth University Board of Visitors (2013-2015); Member of Committee on Directors for Emerging Markets Growth Fund, Inc. (2007-2010); Chairperson of Performance Equity Management, LLC (2006-2010); and Chairperson, GMAM Absolute Return Strategies Fund, LLC (2006-2010). | |
30
Morgan Stanley Institutional Fund, Inc.
Annual Report — December 31, 2017
Director and Officer Information (unaudited) (cont'd)
Independent Directors: (cont'd)
Name, Age and Address of
Independent Director | | Position(s)
Held with
Registrant | | Length of Time
Served* | | Principal Occupation(s) During Past 5 Years
and Other Relevant Professional Experience | | Number of
Portfolios in
Fund Complex
Overseen by
Independent
Director** | | Other Directorships
Held by Independent
Director*** | |
Jakki L. Haussler (60)
c/o Perkins Coie LLP
Counsel to the Independent Directors
30 Rockefeller Plaza
New York, NY 10112 | | Director | | Since
January
2015 | | Chairman and Chief Executive Officer, Opus Capital Group (since January 1996); formerly, Director, Capvest Venture Fund, LP (May 2000-December 2011); Partner, Adena Ventures, LP (July 1999-December 2010); Director, The Victory Funds (February 2005-July 2008). | | | 90 | | | Director of Cincinnati Bell Inc. and Member, Audit Committee and Compensation Committee; Director of Northern Kentucky University Foundation and Member, Investment Committee; Member of Chase College of Law Transactional Law Practice Center Board of Advisors; Director of Best Transport; Director of Chase College of Law Board of Visitors; formerly, Member, University of Cincinnati Foundation Investment Committee; Member, Miami University Board of Visitors (2008-2011); Trustee of Victory Funds (2005-2008) and Chairman, Investment Committee (2007-2008) and Member, Service Provider Committee (2005-2008). | |
Dr. Manuel H. Johnson (68)
c/o Johnson Smick
International, Inc.
220 I Street, NE — Suite 200
Washington, D.C. 20002 | | Director | | Since
July
1991 | | Senior Partner, Johnson Smick International, Inc. (consulting firm); Chairperson of the Investment Committee (since October 2006) and Director or Trustee of various Morgan Stanley Funds (since July 1991); Co-Chairman and a founder of the Group of Seven Council (G7C) (international economic commission); formerly, Chairperson of the Audit Committee (July 1991-September 2006), Vice Chairman of the Board of Governors of the Federal Reserve System and Assistant Secretary of the U.S. Treasury. | | | 88 | | | Director of NVR, Inc. (home construction). | |
Joseph J. Kearns (75)
c/o Kearns & Associates LLC
46 E Peninsula Center #385
Rolling Hills Estates, CA 90274-3712 | | Director | | Since
August
1994 | | Senior Adviser, Kearns & Associates LLC (investment consulting); Chairperson of the Audit Committee (since October 2006) and Director or Trustee of various Morgan Stanley Funds (since August 1994); formerly, Deputy Chairperson of the Audit Committee (July 2003-September 2006) and Chairperson of the Audit Committee of various Morgan Stanley Funds (since August 1994); CFO of the J. Paul Getty Trust. | | | 89 | | | Prior to August 10, 2016, Director of Electro Rent Corporation (equipment leasing); Prior to December 31, 2013, Director of The Ford Family Foundation. | |
31
Morgan Stanley Institutional Fund, Inc.
Annual Report — December 31, 2017
Director and Officer Information (unaudited) (cont'd)
Independent Directors: (cont'd)
Name, Age and Address of
Independent Director | | Position(s)
Held with
Registrant | | Length of Time
Served* | | Principal Occupation(s) During Past 5 Years
and Other Relevant Professional Experience | | Number of
Portfolios in
Fund Complex
Overseen by
Independent
Director** | | Other Directorships
Held by Independent
Director*** | |
Michael F. Klein (59)
c/o Perkins Coie LLP
Counsel to the Independent Directors
30 Rockefeller Plaza
New York, NY 10112 | | Director | | Since
August
2006 | | Managing Director, Aetos Capital, LLC (since March 2000); Co-President, Aetos Alternatives Management, LLC (since January 2004) and Co-Chief Executive Officer of Aetos Capital LLC (since August 2013); Chairperson of the Fixed Income Sub-Committee of the Investment Committee (since October 2006) and Director or Trustee of various Morgan Stanley Funds (since August 2006); formerly, Managing Director, Morgan Stanley & Co. Inc. and Morgan Stanley Dean Witter Investment Management, President, various Morgan Stanley Funds (June 1998-March 2000) and Principal, Morgan Stanley & Co. Inc. and Morgan Stanley Dean Witter Investment Management (August 1997-December 1999). | | | 88 | | | Director of certain investment funds managed or sponsored by Aetos Capital, LLC; Director of Sanitized AG and Sanitized Marketing AG (specialty chemicals). | |
Patricia Maleski (57)
c/o Perkins Coie LLP
Counsel to the Independent Directors
30 Rockefeller Plaza
New York, NY 10112 | | Director | | Since
January
2017 | | Managing Director, JPMorgan Asset Management (2004-2016); Oversight and Control Head of Fiduciary and Conflicts of Interest Program (2015-2016); Chief Control Officer-Global Asset Management (2013-2015); President, JPMorgan Funds (2010-2013); Chief Administrative Officer (2004-2013); various other positions including Treasurer and Board Liaison (since 2001). | | | 90 | | | None. | |
Michael E. Nugent (81)
522 Fifth Avenue
New York, NY 10036 | | Chair of the Board and Director | | Chair of the Boards since July 2006 and Director since July 1991 | | Chair of the Boards of various Morgan Stanley Funds (since July 2006); Chairperson of the Closed-End Fund Committee (since June 2012) and Director or Trustee of various Morgan Stanley Funds (since July 1991); formerly, Chairperson of the Insurance Committee (until July 2006); General Partner, Triumph Capital, L.P. (private investment partnership) (1988-2013). | | | 88 | | | None. | |
W. Allen Reed (70)
c/o Perkins Coie LLP
Counsel to the Independent Directors
30 Rockefeller Plaza
New York, NY 10112 | | Director | | Since
August
2006 | | Chairperson of the Equity Sub-Committee of the Investment Committee (since October 2006) and Director or Trustee of various Morgan Stanley Funds (since August 2006); formerly, President and CEO of General Motors Asset Management; Chairman and Chief Executive Officer of the GM Trust Bank and Corporate Vice President of General Motors Corporation (August 1994-December 2005). | | | 89 | | | Director of Legg Mason, Inc.; formerly, Director of the Auburn University Foundation (2010-2015). | |
Fergus Reid (85)
c/o Joe Pietryka, Inc.
85 Charles Colman Blvd.
Pawling, NY 12564 | | Director | | Since
June
1992 | | Chairman, Joe Pietryka, Inc.; Chairperson of the Governance Committee and Director or Trustee of various Morgan Stanley Funds (since June 1992). | | | 89 | | | Formerly, Trustee and Director of certain investment companies in the JP Morgan Fund Complex managed by JP Morgan Investment Management Inc. (1987-2012). | |
* This is the earliest date the Director began serving the Morgan Stanley Funds. Each Director serves an indefinite term, until his or her successor is elected.
** The Fund Complex includes (as of December 31, 2017) all open-end and closed-end funds (including all of their portfolios) advised by Morgan Stanley Investment Management Inc. (the "Adviser") and any funds that have an adviser that is an affiliated person of the Adviser (including, but not limited to, Morgan Stanley AIP GP LP).
*** This includes any directorships at public companies and registered investment companies held by the Director at any time during the past five years.
32
Morgan Stanley Institutional Fund, Inc.
Annual Report — December 31, 2017
Director and Officer Information (unaudited) (cont'd)
Executive Officers:
Name, Age and Address of Executive Officer | | Position(s) Held
with
Registrant | | Length of Time
Served* | | Principal Occupation(s) During Past 5 Years | |
John H. Gernon (54)
522 Fifth Avenue
New York, NY 10036 | | President and Principal Executive Officer | | Since
September
2013 | | President and Principal Executive Officer of the Equity and Fixed Income Funds and the Morgan Stanley AIP Funds (since September 2013) and the Liquidity Funds and various money market funds (since May 2014) in the Fund Complex; Managing Director of the Adviser; Head of Product (since 2006). | |
Timothy J. Knierim (58)
522 Fifth Avenue
New York, NY 10036 | | Chief Compliance Officer | | Since
December
2016 | | Managing Director of the Adviser and various entities affiliated with the Adviser; Chief Compliance Officer of various Morgan Stanley Funds and the Adviser (since December 2016) and Chief Compliance Officer of Morgan Stanley AIP GP LP (since 2014). Formerly, Managing Director and Deputy Chief Compliance Officer of the Adviser (2014-2016); and formerly, Chief Compliance Officer of Prudential Investment Management, Inc. (2007-2014). | |
Francis J. Smith (52)
522 Fifth Avenue
New York, NY 10036 | | Treasurer and Principal Financial Officer | | Treasurer since July 2003 and Principal Financial Officer since September 2002 | | Manging Director of the Adviser and various entities affiliated with the Adviser; Treasurer (since July 2003) and Principal Financial Officer of various Morgan Stanley Funds (since September 2002). | |
Mary E. Mullin (50)
522 Fifth Avenue
New York, NY 10036 | | Secretary | | Since
June
1999 | | Managing Director of the Adviser; Secretary of various Morgan Stanley Funds (since June 1999). | |
Michael J. Key (38)
522 Fifth Avenue
New York, NY 10036 | | Vice President | | Since
June
2017 | | Vice President of the Equity and Fixed Income Funds, Liquidity Funds, various money market funds and the Morgan Stanley AIP Funds in the Fund Complex (since June 2017); Executive Director of the Adviser; Head of Product Development for Equity and Fixed Income Funds (since August 2013). | |
* This is the earliest date the officer began serving the Morgan Stanley Funds. Each officer serves a one-year term, until his or her successor is elected and qualifies.
33
Morgan Stanley Institutional Fund, Inc.
Annual Report — December 31, 2017
Adviser and Administrator
Morgan Stanley Investment Management Inc.
522 Fifth Avenue
New York, New York 10036
Sub-Adviser
Morgan Stanley Investment Management Limited
25 Cabot Square, Canary Wharf
London, E14 4QA, England
Distributor
Morgan Stanley Distribution, Inc.
522 Fifth Avenue
New York, New York 10036
Dividend Disbursing and Transfer Agent
DST Asset Manager Solutions, Inc.
2000 Crown Colony Drive
Quincy, Massachusetts 02169
Custodian
State Street Bank and Trust Company
One Lincoln Street
Boston, Massachusetts 02111
Legal Counsel
Dechert LLP
1095 Avenue of the Americas
New York, New York 10036
Counsel to the Independent Directors
Perkins Coie LLP
30 Rockefeller Plaza
New York, New York 10112
Independent Registered Public Accounting Firm
Ernst & Young LLP
200 Clarendon Street
Boston, Massachusetts 02116
Reporting to Shareholders
Each Morgan Stanley Fund provides a complete schedule of portfolio holdings in its semi-annual and annual reports within 60 days of the end of the fund's second and fourth fiscal quarters. The semi-annual and annual reports are filed electronically with the Securities and Exchange Commission (SEC) on Form N-CSRS and Form N-CSR, respectively. Morgan Stanley also delivers the semi-annual and annual reports to fund shareholders and makes these reports available on its public website, www.morganstanley.com/im. Each Morgan Stanley fund also files a complete schedule of portfolio holdings with the SEC for the fund's first and third fiscal quarters on Form N-Q. Morgan Stanley does not deliver the reports for the first and third fiscal quarters to shareholders, nor are the reports posted to the Morgan Stanley public website. You may, however, obtain the Form N-Q filings (as well as the Form N-CSR and N-CSRS filings) by accessing the SEC's website, www.sec.gov. You may also review and copy them at the SEC's Public Reference Room in Washington, DC. Information on the operation of the SEC's Public Reference Room may be obtained by calling the SEC toll free at 1 (800) SEC-0330. You can also request copies of these materials, upon payment of a duplicating fee, by electronic request at the SEC's email address (publicinfo@sec.gov) or by writing to the SEC's Public Reference Section, Washington, D.C. 20549-1520.
Proxy Voting Policies and Procedures and Proxy Voting Record
You may obtain a copy of the Company's Proxy Voting Policy and Procedures and information regarding how the Company voted proxies relating to portfolio securities during the most recent twelve-month period ended June 30, without charge, upon request, by calling toll free 1 (800) 548-7786 or by visiting our website at www.morganstanley.com/im. This information is also available on the SEC's website at www.sec.gov.
This report is authorized for distribution only when preceded or accompanied by a prospectus or summary prospectus of the applicable Fund of Morgan Stanley Institutional Fund, Inc., which describes in detail the Fund's investment policies, risks, fees and expenses. Please read the prospectus carefully before you invest or send money. For additional information, including information regarding the investments comprising the Fund, please visit our website at www.morganstanley.com/im or call toll free 1 (800) 548-7786.
34
Printed in U.S.A.
This Report has been prepared for shareholders and may be distributed to others only if preceded or accompanied by a current prospectus.
Morgan Stanley Investment Management Inc.
522 Fifth Avenue
New York, New York 10036
© 2018 Morgan Stanley. Morgan Stanley Distribution, Inc.

IFIGFANN
2007464 EXP. 02.28.19

Morgan Stanley Institutional Fund, Inc.
Global Infrastructure Portfolio
Annual Report
December 31, 2017

Morgan Stanley Institutional Fund, Inc.
Annual Report — December 31, 2017
Shareholders' Letter | | | 2 | | |
Expense Example | | | 3 | | |
Investment Overview | | | 4 | | |
Portfolio of Investments | | | 7 | | |
Statement of Assets and Liabilities | | | 9 | | |
Statement of Operations | | | 11 | | |
Statements of Changes in Net Assets | | | 12 | | |
Financial Highlights | | | 14 | | |
Notes to Financial Statements | | | 19 | | |
Report of Independent Registered Public Accounting Firm | | | 27 | | |
Federal Tax Notice | | | 28 | | |
Privacy Notice | | | 29 | | |
Director and Officer Information | | | 32 | | |
This report is authorized for distribution only when preceded or accompanied by a prospectus or summary prospectus of the applicable Fund of Morgan Stanley Institutional Fund, Inc. To receive a prospectus and/or statement of additional information (SAI), which contains more complete information such as investment objectives, charges, expenses, policies for voting proxies, risk considerations, and describes in detail each of the Fund's investment policies to the prospective investor, please call toll free 1 (800) 548-7786. Please read the prospectuses carefully before you invest or send money.
Additionally, you can access information about the Fund, including performance, characteristics, and investment team commentary, through Morgan Stanley Investment Management's website: www.morganstanley.com/im.
Market forecasts provided in this report may not necessarily come to pass. There is no guarantee that any sectors mentioned will continue to perform as discussed herein or that securities in such sectors will be held by the Fund in the future. There is no assurance that a fund will achieve its investment objective. Funds are subject to market risk, which is the possibility that market values of securities owned by the Fund will decline and, therefore, the value of the Fund's shares may be less than what you paid for them. Accordingly, you can lose money investing in this Fund. Please see the prospectus for more complete information on investment risks.
1
Morgan Stanley Institutional Fund, Inc.
Annual Report — December 31, 2017
Shareholders' Letter (unaudited)
Dear Shareholders,
We are pleased to provide this Annual report, in which you will learn how your investment in Global Infrastructure Portfolio (the "Fund") performed during the latest twelve-month period.
Morgan Stanley Investment Management is a client-centric, investor-led organization. Our global presence, intellectual capital, and breadth of products and services enable us to partner with investors to meet the evolving challenges of today's financial markets. We aim to deliver superior investment service and to empower our clients to make the informed decisions that help them reach their investment goals.
As always, we thank you for selecting Morgan Stanley Investment Management, and look forward to working with you in the months and years ahead.
Sincerely,

John H. Gernon
President and Principal Executive Officer
January 2018
2
Morgan Stanley Institutional Fund, Inc.
Annual Report — December 31, 2017
Expense Example (unaudited)
Global Infrastructure Portfolio
As a shareholder of the Fund, you incur two types of costs: (1) transactional costs; and (2) ongoing costs, which may include advisory fees, administration fees, distribution and shareholder services fees and other Fund expenses. This example is intended to help you understand your ongoing costs (in dollars) of investing in the Fund and to compare these costs with the ongoing costs of investing in other mutual funds.
This example is based on an investment of $1,000 invested at the beginning of the six-month period ended December 31, 2017 and held for the entire six-month period.
Actual Expenses
The table below provides information about actual account values and actual expenses. You may use the information in this table, together with the amount you invested, to estimate the expenses that you paid over the period. Simply divide your account value by $1,000 (for example, an $8,600 account value divided by $1,000 = 8.6), then multiply the result by the number in the table under the heading entitled "Actual Expenses Paid During Period" to estimate the expenses you paid on your account during this period.
Hypothetical Example for Comparison Purposes
The table below provides information about hypothetical account values and hypothetical expenses based on the Fund's actual expense ratio and an assumed rate of return of 5% per year before expenses, which is not the Fund's actual return. The hypothetical account values and expenses may not be used to estimate the actual ending account balance or expenses you paid for the period. You may use this information to compare the ongoing costs of investing in the Fund and other funds. To do so, compare this 5% hypothetical example with the 5% hypothetical examples that appear in the shareholder reports of the other funds.
Please note that the expenses shown in the table are meant to highlight your ongoing costs only and do not reflect any transactional costs, such as sales charges (loads). Therefore, the information for each class in the table is useful in comparing ongoing costs only, and will not help you determine the relative total costs of owning different funds. In addition, if these transactional costs were included, your costs would have been higher.
| | | Beginning
Account
Value
7/1/17 | | Actual Ending
Account
Value
12/31/17 | | Hypothetical
Ending Account
Value | | Actual
Expenses
Paid
During
Period* | | Hypothetical
Expenses Paid
During Period* | | Net
Expense
Ratio
During
Period** | |
Global Infrastructure Portfolio Class I | | $ | 1,000.00 | | | $ | 1,035.40 | | | $ | 1,020.37 | | | $ | 4.93 | | | $ | 4.89 | | | | 0.96 | % | |
Global Infrastructure Portfolio Class A | | | 1,000.00 | | | | 1,033.60 | | | | 1,019.16 | | | | 6.15 | | | | 6.11 | | | | 1.20 | | |
Global Infrastructure Portfolio Class L | | | 1,000.00 | | | | 1,031.40 | | | | 1,016.28 | | | | 9.06 | | | | 9.00 | | | | 1.77 | | |
Global Infrastructure Portfolio Class C | | | 1,000.00 | | | | 1,029.20 | | | | 1,014.82 | | | | 10.54 | | | | 10.46 | | | | 2.06 | | |
Global Infrastructure Portfolio Class IS | | | 1,000.00 | | | | 1,035.00 | | | | 1,020.52 | | | | 4.77 | | | | 4.74 | | | | 0.93 | | |
* Expenses are calculated using each Fund Class' annualized net expense ratio (as disclosed), multiplied by the average account value over the period, and multiplied by 184/365 (to reflect the most recent one-half year period).
** Annualized.
3
Morgan Stanley Institutional Fund, Inc.
Annual Report — December 31, 2017
Investment Overview (unaudited)
Global Infrastructure Portfolio
The Fund seeks to provide both capital appreciation and income.
Performance
For the year ended December 31, 2017, the Fund's Class I shares had a total return based on net asset value and reinvestment of distributions per share of 12.70%, net of fees. The Fund's Class I shares underperformed against the Fund's benchmark, the Dow Jones Brookfield Global Infrastructure IndexSM (the "Index"), which returned 15.79%, and underperformed the S&P Global BMI Index, a proxy for global equities, which returned 24.69%.
Factors Affecting Performance
• Infrastructure shares appreciated 15.79% during the period, as measured by the Index. Amongst infrastructure sectors, toll roads, airports, diversified, communications, water, and gas distribution utilities outperformed the Index, while gas midstream, pipeline companies, electricity transmission & distribution, ports, and European regulated utilities underperformed.
• Following a positive year for the asset class in 2016, infrastructure securities continued their strong performance in 2017, albeit lagging global equity markets, which ended the year up 24.69% (as represented by the S&P Global BMI Index). All infrastructure sectors posted positive absolute performance in 2017, yet there was a wide dispersion in returns across sectors, with energy infrastructure the laggard for much of the year and transportation infrastructure (primarily toll roads and airports) leading the way.
• Though a strong year for the asset class overall (consistent with the broader equity markets), infrastructure did end the year with a relatively flat fourth quarter (+0.51%). Infrastructure's modest gains in the fourth quarter represented a divergence from the overall global equity markets (+5.85% for the S&P Global BMI Index in that period). We would note that the fourth-quarter performance for infrastructure was meaningfully negatively impacted by adverse events (both direct and derivative) brought on by wildfires in the state of California, as several large utilities operate there. Without this adverse impact, performance for infrastructure securities in the quarter may have been appreciably higher.
• For the reporting period, the Fund realized underperformance, caused primarily by unfavorable
bottom-up stock selection and somewhat offset by a positive contribution from top-down sector allocation. From a bottom-up perspective, the Fund benefited from favorable stock selection in the gas midstream and communications sectors, which was more than offset by the underperformance of our stock selection in the pipeline companies, toll roads, electricity transmission & distribution, and water sectors. From a top-down perspective, the Fund benefited from overweights to toll roads, renewables, railroads, and diversified, as well as underweights to gas midstream and electricity transmission & distribution, which was only modestly offset by disadvantageous underweights to communications, airports, and water. Cash held in the portfolio also served as a modest drag on performance for the year
Management Strategies
• We remain committed to our core investment philosophy as an infrastructure value investor. As value-oriented, bottom-up driven investors, our investment perspective is that over the medium and long term, the key factor in determining the performance of infrastructure securities will be underlying infrastructure asset values. Given the large and growing private infrastructure market, we believe that there are limits as to the level of premium or discount at which the public sector should trade relative to its underlying private infrastructure value. These limits can be viewed as the point at which the arbitrage opportunity between owning infrastructure in the private versus public markets becomes compelling. In aiming to achieve core infrastructure exposure in a cost effective manner, we invest in equity securities of publicly listed infrastructure companies we believe offer the best value relative to their underlying infrastructure value and net asset value growth prospects.
• Our research currently leads us to an overweighting in the fund to a group of companies in the toll roads and diversified sectors, and an underweighting to companies in the gas distribution utilities, electricity transmission & distribution, communications, gas midstream, European regulated utilities, airports, water, and ports sectors. Our position in pipeline companies is relatively in line with the benchmark. We continue to retain out-of-benchmark positions in renewables and railroads.
4
Morgan Stanley Institutional Fund, Inc.
Annual Report — December 31, 2017
Investment Overview (unaudited) (cont'd)
Global Infrastructure Portfolio
• Given the strong overall performance of infrastructure in 2017 and the particularly strong performance in certain subsectors outside of energy infrastructure (with some subsectors up greater than 30% in 2017), we begin 2018 with a more cautious stance. In general, we view no specific subsector as universally undervalued. However, we are encouraged by solid discounts to intrinsic value for select companies, and we view the recent sell-off in network utilities during December 2017 as a healthy acknowledgement of that area of market excess. Financial markets in general, including those for listed infrastructure, look stretched relative to historical norms, but fundamental trends remain sound to improving in most industry areas, reflecting a global economy growing in synchronized fashion for the first time since the financial crisis of 2008 and early 2009. For listed infrastructure industry groups, we believe these positive fundamental trends are likely to continue into 2018.
• We would note that while fewer companies are currently trading at attractive discounts to intrinsic value, we do believe our portfolio currently reflects a set of companies that remain attractive to core infrastructure investors over the medium to long term, and pockets of value are emerging in a number of areas, even in the absence of a broader market sell-off. Currently, we are closely monitoring developments in the areas of energy infrastructure in North America, network utilities in the U.K. and the state of California, and transportation infrastructure in Latin America, just to name a few examples. As always, we will look to position the portfolio in a fashion that provides our investors the best medium- to long-term value in the infrastructure universe.
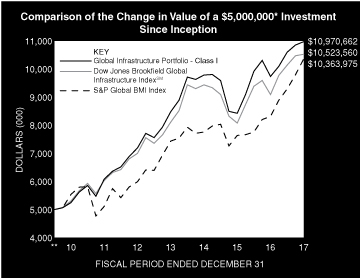
* Minimum Investment for Class I shares
** Commenced Operations on September 20, 2010.
In accordance with SEC regulations, the Fund's performance shown assumes that all recurring fees (including management fees) were deducted and all dividends and distributions were reinvested. The performance of Class A, L, C and IS shares will vary from the performance of Class I shares and will be impacted by additional fees assessed to those classes (if applicable).
5
Morgan Stanley Institutional Fund, Inc.
Annual Report — December 31, 2017
Investment Overview (unaudited) (cont'd)
Global Infrastructure Portfolio
Performance Compared to the Dow Jones Brookfield Global Infrastructure IndexSM(1), the S&P Global BMI Index(2), and the Lipper Global Infrastructure Funds Index(3)
| | Period Ended December 31, 2017
Total Returns(4) | |
| | | | Average Annual | |
| | One
Year | | Five
Years | | Ten
Years | | Since
Inception(8) | |
Fund — Class I Shares
w/o sales charges(5) | | | 12.70 | % | | | 8.81 | % | | | — | | | | 11.40 | % | |
Fund — Class A Shares
w/o sales charges(5) | | | 12.37 | | | | 8.53 | | | | — | | | | 11.11 | | |
Fund — Class A Shares with
maximum 5.25% sales charges(5) | | | 6.44 | | | | 7.37 | | | | — | | | | 10.29 | | |
Fund — Class L Shares
w/o sales charges(5) | | | 11.80 | | | | 7.90 | | | | — | | | | 10.50 | | |
Fund — Class C Shares
w/o sales charges(7) | | | 11.42 | | | | — | | | | — | | | | 1.83 | | |
Fund — Class C Shares with
maximum 1.00% deferred
sales charges(7) | | | 10.42 | | | | — | | | | — | | | | 1.83 | | |
Fund — Class IS Shares
w/o sales charges(6) | | | 12.65 | | | | — | | | | — | | | | 8.46 | | |
Dow Jones Brookfield Global
Infrastructure IndexSM | | | 15.79 | | | | 8.50 | | | | — | | | | 10.76 | | |
S&P Global BMI Index | | | 24.69 | | | | 11.59 | | | | — | | | | 10.53 | | |
Lipper Global Infrastructure
Funds Index | | | 18.84 | | | | 10.02 | | | | — | | | | N/A | | |
Performance data quoted represents past performance, which is no guarantee of future results, and current performance may be lower or higher than the figures shown. Performance assumes that all dividends and distributions, if any, were reinvested. For the most recent month-end performance figures, please visit www.morganstanley.com/im. Investment return and principal value will fluctuate so that Fund shares, when redeemed, may be worth more or less than their original cost. Total returns do not reflect the deduction of taxes that a shareholder would pay on Fund distributions or the redemption of Fund shares. Performance of share classes will vary due to difference in sales charges and expenses.
(1) The Dow Jones Brookfield Global Infrastructure IndexSM is a float-adjusted market capitalization weighted index that measures the stock performance of companies that exhibit strong infrastructure characteristics. The Index intends to measure all sectors of the infrastructure market. The Index is unmanaged and its returns do not include any sales charges or fees. Such costs would lower performance. It is not possible to invest directly in an index.
(2) The Standard & Poor's Global BMI Index (S&P Global BMI Index) is a broad market index designed to capture exposure to equities in all countries in the world that meet minimum size and liquidity requirements. As of the date of this Report, there are approximately 11,000 index members representing 25 developed and 22 emerging market countries. The Index is unmanaged and its returns do not
include any sales charges or fees. Such costs would lower performance. It is not possible to invest directly in an index.
(3) The Lipper Global Infrastructure Funds Index is an equally weighted performance index of the largest qualifying funds (based on net assets) in the Lipper Global Infrastructure Funds classification. The Index, which is adjusted for capital gains distributions and income dividends, is unmanaged and should not be considered an investment. There are currently 10 funds represented in this Index. As of the date of this report, the Fund is in the Lipper Global Infrastructure Funds classification.The history of this Index began in October 2011. Therefore, there is no "Since Inception" return data available and Lipper Index is not shown on the graph.
(4) Total returns for the Fund reflect fees waived and expenses reimbursed, if applicable, by the Adviser. Without such waivers and reimbursements, total returns would have been lower.
(5) Commenced operations on September 20, 2010.
(6) Commenced offering on September 13, 2013.
(7) Commenced offering on April 30, 2015.
(8) For comparative purposes, average annual since inception returns listed for the Indexes refer to the inception date of Class I of the Fund, not the inception of the Index.
6
Morgan Stanley Institutional Fund, Inc.
Annual Report — December 31, 2017
Portfolio of Investments
Global Infrastructure Portfolio
| | | Shares | | Value
(000) | |
Common Stocks (98.2%) | |
Australia (8.0%) | |
APA Group | | | 434,054 | | | $ | 2,817 | | |
Macquarie Atlas Roads Group | | | 1,215,668 | | | | 5,948 | | |
Spark Infrastructure Group | | | 2,802,030 | | | | 5,479 | | |
Sydney Airport | | | 1,244,695 | | | | 6,827 | | |
Transurban Group | | | 1,083,051 | | | | 10,483 | | |
| | | | 31,554 | | |
Canada (15.9%) | |
Canadian Pacific Railway Ltd. | | | 35,620 | | | | 6,508 | | |
Enbridge, Inc. | | | 530,735 | | | | 20,756 | | |
Hydro One Ltd. (a) | | | 203,356 | | | | 3,624 | | |
Inter Pipeline Ltd. (b) | | | 130,338 | | | | 2,699 | | |
Pembina Pipeline Corp. | | | 264,968 | | | | 9,593 | | |
TransCanada Corp. (b) | | | 397,229 | | | | 19,334 | | |
| | | | 62,514 | | |
China (4.7%) | |
ENN Energy Holdings Ltd. (c) | | | 378,000 | | | | 2,682 | | |
Guangdong Investment Ltd. (c) | | | 1,710,000 | | | | 2,289 | | |
Hopewell Highway Infrastructure Ltd. (c) | | | 21,128,000 | | | | 13,479 | | |
| | | | 18,450 | | |
France (7.4%) | |
Aeroports de Paris | | | 8,610 | | | | 1,636 | | |
Getlink SE | | | 584,570 | | | | 7,518 | | |
SES SA | | | 112,511 | | | | 1,753 | | |
Vinci SA | | | 179,760 | | | | 18,341 | | |
| | | | 29,248 | | |
Germany (0.4%) | |
Fraport AG Frankfurt Airport Services Worldwide | | | 15,100 | | | | 1,661 | | |
India (0.9%) | |
Azure Power Global Ltd. (d) | | | 234,999 | | | | 3,337 | | |
Italy (3.6%) | |
Atlantia SpA | | | 263,392 | | | | 8,308 | | |
Infrastrutture Wireless Italiane SpA (a) | | | 248,290 | | | | 1,846 | | |
Italgas SpA | | | 385,148 | | | | 2,350 | | |
Snam SpA | | | 326,300 | | | | 1,598 | | |
| | | | 14,102 | | |
Japan (1.5%) | |
East Japan Railway Co. | | | 41,700 | | | | 4,065 | | |
West Japan Railway Co. | | | 24,400 | | | | 1,780 | | |
| | | | 5,845 | | |
Mexico (2.8%) | |
Grupo Aeroportuario del Pacifico SAB de CV | | | 29,000 | | | | 298 | | |
Promotora y Operadora de Infraestructura SAB
de CV | | | 1,078,305 | | | | 10,654 | | |
| | | | 10,952 | | |
Netherlands (0.4%) | |
Koninklijke Vopak N.V. | | | 33,845 | | | | 1,485 | | |
New Zealand (0.3%) | |
Auckland International Airport Ltd. | | | 252,836 | | | | 1,161 | | |
| | | Shares | | Value
(000) | |
Spain (11.7%) | |
Abertis Infraestructuras SA | | | 295,339 | | | $ | 6,571 | | |
Aena SME SA (a) | | | 3,080 | | | | 624 | | |
Atlantica Yield PLC | | | 972,307 | | | | 20,623 | | |
Ferrovial SA | | | 306,088 | | | | 6,937 | | |
Saeta Yield SA | | | 948,527 | | | | 11,165 | | |
| | | | 45,920 | | |
Switzerland (0.2%) | |
Flughafen Zurich AG (Registered) | | | 3,415 | | | | 781 | | |
United Kingdom (11.4%) | |
John Laing Group PLC (a) | | | 4,402,995 | | | | 17,454 | | |
National Grid PLC | | | 1,408,309 | | | | 16,543 | | |
Pennon Group PLC | | | 245,401 | | | | 2,583 | | |
Severn Trent PLC | | | 100,640 | | | | 2,937 | | |
United Utilities Group PLC | | | 482,922 | | | | 5,405 | | |
| | | | 44,922 | | |
United States (29.0%) | |
American Tower Corp. REIT | | | 121,670 | | | | 17,359 | | |
American Water Works Co., Inc. | | | 43,690 | | | | 3,997 | | |
Atmos Energy Corp. | | | 41,032 | | | | 3,524 | | |
Cheniere Energy, Inc. (b)(d) | | | 54,670 | | | | 2,944 | | |
Crown Castle International Corp. REIT | | | 123,632 | | | | 13,724 | | |
Edison International | | | 114,090 | | | | 7,215 | | |
Enbridge Energy Management LLC (d) | | | 439,861 | | | | 5,890 | | |
Eversource Energy | | | 79,951 | | | | 5,051 | | |
Kinder Morgan, Inc. | | | 576,430 | | | | 10,416 | | |
NiSource, Inc. | | | 77,528 | | | | 1,990 | | |
Norfolk Southern Corp. | | | 15,504 | | | | 2,247 | | |
PG&E Corp. | | | 178,626 | | | | 8,008 | | |
SBA Communications Corp. REIT (d) | | | 23,140 | | | | 3,780 | | |
Sempra Energy | | | 105,436 | | | | 11,273 | | |
Targa Resources Corp. | | | 13,510 | | | | 654 | | |
Union Pacific Corp. | | | 31,140 | | | | 4,176 | | |
Williams Cos., Inc. (The) | | | 383,233 | | | | 11,685 | | |
| | | | 113,933 | | |
Total Common Stocks (Cost $321,565) | | | 385,865 | | |
| | | No. of
Rights | | | |
Right (0.0%) | |
Australia (0.0%) | |
| Transurban Group (Australia) (d) (Cost $—) | | | 84,542 | | | | 67 | | |
| | | Shares | | | |
Short-Term Investments (6.7%) | |
Securities held as Collateral on Loaned Securities (4.9%) | |
Investment Company (3.6%) | |
Morgan Stanley Institutional Liquidity
Funds — Treasury Securities Portfolio —
Institutional Class (See Note G) | | | 14,105,062 | | | | 14,105 | | |
The accompanying notes are an integral part of the financial statements.
7
Morgan Stanley Institutional Fund, Inc.
Annual Report — December 31, 2017
Portfolio of Investments (cont'd)
Global Infrastructure Portfolio
| | | Face
Amount
(000) | | Value
(000) | |
Repurchase Agreements (1.3%) | |
Barclays Capital, Inc., (1.37%,
dated 12/29/17, due 1/2/18;
proceeds $3,246; fully collateralized by a
U.S. Government obligation; 1.75%
due 5/15/23; valued at $3,311) | | $ | 3,246 | | | $ | 3,246 | | |
HSBC Securities USA, Inc., (1.30%,
dated 12/29/17, due 1/2/18;
proceeds $251; fully collateralized by a
U.S. Government obligation; 3.00%
due 2/15/47; valued at $256) | | | 251 | | | | 251 | | |
Merrill Lynch & Co., Inc., (1.42%,
dated 12/29/17, due 1/2/18;
proceeds $1,663; fully collateralized by a
U.S. Government obligation; 2.00%
due 12/31/21; valued at $1,696) | | | 1,663 | | | | 1,663 | | |
| | | | 5,160 | | |
Total Securities held as Collateral on Loaned
Securities (Cost $19,265) | | | 19,265 | | |
| | | Shares | | | |
Investment Company (1.8%) | |
Morgan Stanley Institutional Liquidity
Funds — Treasury Portfolio —
Institutional Class (See Note G)
(Cost $6,980) | | | 6,980,244 | | | | 6,980 | | |
Total Short-Term Investments (Cost $26,245) | | | 26,245 | | |
Total Investments (104.9%) (Cost $347,810)
Including $21,158 of Securities Loaned (e)(f) | | | 412,177 | | |
Liabilities in Excess of Other Assets (–4.9%) | | | (19,427 | ) | |
Net Assets (100.0%) | | $ | 392,750 | | |
Country assignments and aggregations are based generally on third party vendor classifications and information, and may be different from the assignments and aggregations under the policies set forth in the Fund's prospectus and/or statement of additional information relating to geographic classifications.
(a) 144A security — Certain conditions for public sale may exist. Unless otherwise noted, these securities are deemed to be liquid.
(b) All or a portion of this security was on loan at December 31, 2017.
(c) Security trades on the Hong Kong exchange.
(d) Non-income producing security.
(e) The approximate fair value and percentage of net assets, $174,506,000 and 44.4%, respectively, represent the securities that have been fair valued under the fair valuation policy for international investments as described in Note A-1 within the Notes to the Financial Statements.
(f) At December 31, 2017, the aggregate cost for federal income tax purposes is approximately $354,243,000. The aggregate gross unrealized appreciation is approximately $63,961,000 and the aggregate gross unrealized depreciation is approximately $6,028,000, resulting in net unrealized appreciation of approximately $57,933,000.
REIT Real Estate Investment Trust.
Portfolio Composition*
Classification | | Percentage of
Total Investments | |
Oil & Gas Storage & Transportation | | | 28.4 | % | |
Toll Roads | | | 16.0 | | |
Other** | | | 14.3 | | |
Electricity Transmission & Distribution | | | 11.7 | | |
Diversified | | | 10.9 | | |
Communications | | | 9.8 | | |
Renewables | | | 8.9 | | |
Total Investments | | | 100.0 | % | |
* Percentages indicated are based upon total investments (excluding Securities held as Collateral on Loaned Securities) as of December 31, 2017.
** Industries and/or investment types representing less than 5% of total investments.
The accompanying notes are an integral part of the financial statements.
8
Morgan Stanley Institutional Fund, Inc.
Annual Report — December 31, 2017
Global Infrastructure Portfolio
Statement of Assets and Liabilities | | December 31, 2017
(000) | |
Assets: | |
Investments in Securities of Unaffiliated Issuers, at Value(1) (Cost $326,725) | | $ | 391,092 | | |
Investment in Security of Affiliated Issuer, at Value (Cost $21,085) | | | 21,085 | | |
Total Investments in Securities, at Value (Cost $347,810) | | | 412,177 | | |
Foreign Currency, at Value (Cost $75) | | | 76 | | |
Receivable for Investments Sold | | | 1,413 | | |
Dividends Receivable | | | 1,186 | | |
Receivable for Fund Shares Sold | | | 180 | | |
Tax Reclaim Receivable | | | 47 | | |
Receivable from Affiliate | | | 8 | | |
Receivable from Securities Lending Income | | | — | @ | |
Other Assets | | | 62 | | |
Total Assets | | | 415,149 | | |
Liabilities: | |
Collateral on Securities Loaned, at Value | | | 19,265 | | |
Payable for Investments Purchased | | | 1,440 | | |
Payable for Fund Shares Redeemed | | | 644 | | |
Payable for Advisory Fees | | | 640 | | |
Payable for Sub Transfer Agency Fees — Class I | | | 6 | | |
Payable for Sub Transfer Agency Fees — Class A | | | 87 | | |
Payable for Sub Transfer Agency Fees — Class L | | | 3 | | |
Payable for Sub Transfer Agency Fees — Class C | | | 1 | | |
Payable for Shareholder Services Fees — Class A | | | 60 | | |
Payable for Distribution and Shareholder Services Fees — Class L | | | 4 | | |
Payable for Distribution and Shareholder Services Fees — Class C | | | 3 | | |
Payable for Custodian Fees | | | 59 | | |
Payable for Professional Fees | | | 52 | | |
Payable for Directors' Fees and Expenses | | | 49 | | |
Payable for Administration Fees | | | 27 | | |
Payable for Transfer Agency Fees — Class I | | | 2 | | |
Payable for Transfer Agency Fees — Class A | | | 19 | | |
Payable for Transfer Agency Fees — Class L | | | 1 | | |
Payable for Transfer Agency Fees — Class C | | | 1 | | |
Payable for Transfer Agency Fees — Class IS | | | 1 | | |
Other Liabilities | | | 35 | | |
Total Liabilities | | | 22,399 | | |
Net Assets | | $ | 392,750 | | |
Net Assets Consist of: | |
Paid-in-Capital | | $ | 329,037 | | |
Distributions in Excess of Net Investment Income | | | (72 | ) | |
Accumulated Net Realized Loss | | | (589 | ) | |
Unrealized Appreciation (Depreciation) on: | |
Investments | | | 64,367 | | |
Foreign Currency Translations | | | 7 | | |
Net Assets | | $ | 392,750 | | |
The accompanying notes are an integral part of the financial statements.
9
Morgan Stanley Institutional Fund, Inc.
Annual Report — December 31, 2017
Global Infrastructure Portfolio
Statement of Assets and Liabilities (cont'd) | | December 31, 2017
(000) | |
CLASS I: | |
Net Assets | | $ | 95,219 | | |
| Shares Outstanding $0.001 par value shares of beneficial interest (unlimited shares authorized) (not in 000's) | | | 6,505,143 | | |
Net Asset Value, Offering and Redemption Price Per Share | | $ | 14.64 | | |
CLASS A: | |
Net Assets | | $ | 278,780 | | |
| Shares Outstanding $0.001 par value shares of beneficial interest (unlimited shares authorized) (not in 000's) | | | 19,091,442 | | |
Net Asset Value, Redemption Price Per Share | | $ | 14.60 | | |
Maximum Sales Load | | | 5.25 | % | |
Maximum Sales Charge | | $ | 0.81 | | |
Maximum Offering Price Per Share | | $ | 15.41 | | |
CLASS L: | |
Net Assets | | $ | 5,634 | | |
| Shares Outstanding $0.001 par value shares of beneficial interest (unlimited shares authorized) (not in 000's) | | | 387,268 | | |
Net Asset Value, Offering and Redemption Price Per Share | | $ | 14.55 | | |
CLASS C: | |
Net Assets | | $ | 3,601 | | |
| Shares Outstanding $0.001 par value shares of beneficial interest (unlimited shares authorized) (not in 000's) | | | 250,733 | | |
Net Asset Value, Offering and Redemption Price Per Share | | $ | 14.36 | | |
CLASS IS: | |
Net Assets | | $ | 9,516 | | |
| Shares Outstanding $0.001 par value shares of beneficial interest (unlimited shares authorized) (not in 000's) | | | 650,371 | | |
Net Asset Value, Offering and Redemption Price Per Share | | $ | 14.63 | | |
(1) Including:
Securities on Loan, at Value: | | $ | 21,158 | | |
@ Amount is less than $500.
The accompanying notes are an integral part of the financial statements.
10
Morgan Stanley Institutional Fund, Inc.
Annual Report — December 31, 2017
Global Infrastructure Portfolio
Statement of Operations | | Year Ended
December 31, 2017
(000) | |
Investment Income: | |
Dividends from Securities of Unaffiliated Issuers (Net of $736 of Foreign Taxes Withheld) | | $ | 14,454 | | |
Dividends from Security of Affiliated Issuer (Note G) | | | 165 | | |
Income from Securities Loaned — Net | | | 90 | | |
Total Investment Income | | | 14,709 | | |
Expenses: | |
Advisory Fees (Note B) | | | 3,291 | | |
Shareholder Services Fees — Class A (Note D) | | | 724 | | |
Distribution and Shareholder Services Fees — Class L (Note D) | | | 43 | | |
Distribution and Shareholder Services Fees — Class C (Note D) | | | 29 | | |
Administration Fees (Note C) | | | 310 | | |
Sub Transfer Agency Fees — Class I | | | 31 | | |
Sub Transfer Agency Fees — Class A | | | 224 | | |
Sub Transfer Agency Fees — Class L | | | 6 | | |
Sub Transfer Agency Fees — Class C | | | 3 | | |
Professional Fees | | | 131 | | |
Custodian Fees (Note F) | | | 91 | | |
Transfer Agency Fees — Class I (Note E) | | | 7 | | |
Transfer Agency Fees — Class A (Note E) | | | 64 | | |
Transfer Agency Fees — Class L (Note E) | | | 3 | | |
Transfer Agency Fees — Class C (Note E) | | | 3 | | |
Transfer Agency Fees — Class IS (Note E) | | | 2 | | |
Registration Fees | | | 75 | | |
Shareholder Reporting Fees | | | 50 | | |
Directors' Fees and Expenses | | | 11 | | |
Pricing Fees | | | 7 | | |
Other Expenses | | | 33 | | |
Total Expenses | | | 5,138 | | |
Waiver of Advisory Fees (Note B) | | | (544 | ) | |
Reimbursement of Class Specific Expenses — Class I (Note B) | | | (15 | ) | |
Reimbursement of Class Specific Expenses — Class A (Note B) | | | (230 | ) | |
Reimbursement of Class Specific Expenses — Class L (Note B) | | | (5 | ) | |
Reimbursement of Class Specific Expenses — Class C (Note B) | | | (2 | ) | |
Reimbursement of Class Specific Expenses — Class IS (Note B) | | | (2 | ) | |
Rebate from Morgan Stanley Affiliate (Note G) | | | (39 | ) | |
Net Expenses | | | 4,301 | | |
Net Investment Income | | | 10,408 | | |
Realized Gain: | |
Investments Sold | | | 21,743 | | |
Foreign Currency Transactions | | | 70 | | |
Realized Gain | | | 21,813 | | |
Change in Unrealized Appreciation (Depreciation): | |
Investments | | | 12,775 | | |
Foreign Currency Translations | | | 12 | | |
Net Change in Unrealized Appreciation (Depreciation) | | | 12,787 | | |
Net Realized Gain and Change in Unrealized Appreciation (Depreciation) | | | 34,600 | | |
Net Increase in Net Assets Resulting from Operations | | $ | 45,008 | | |
The accompanying notes are an integral part of the financial statements.
11
Morgan Stanley Institutional Fund, Inc.
Annual Report — December 31, 2017
Global Infrastructure Portfolio
Statements of Changes in Net Assets | | Year Ended
December 31, 2017
(000) | | Year Ended
December 31, 2016
(000) | |
Increase (Decrease) in Net Assets: | |
Operations: | |
Net Investment Income | | $ | 10,408 | | | $ | 8,659 | | |
Net Realized Gain | | | 21,813 | | | | 8,648 | | |
Net Change in Unrealized Appreciation (Depreciation) | | | 12,787 | | | | 29,570 | | |
Net Increase in Net Assets Resulting from Operations | | | 45,008 | | | | 46,877 | | |
Distributions from and/or in Excess of: | |
Class I: | |
Net Investment Income | | | (2,582 | ) | | | (1,321 | ) | |
Net Realized Gain | | | (4,409 | ) | | | (551 | ) | |
Class A: | |
Net Investment Income | | | (6,976 | ) | | | (6,424 | ) | |
Net Realized Gain | | | (13,453 | ) | | | (2,972 | ) | |
Class L: | |
Net Investment Income | | | (110 | ) | | | (96 | ) | |
Net Realized Gain | | | (271 | ) | | | (60 | ) | |
Class C: | |
Net Investment Income | | | (69 | ) | | | (15 | ) | |
Net Realized Gain | | | (172 | ) | | | (8 | ) | |
Class IS: | |
Net Investment Income | | | (263 | ) | | | (144 | ) | |
Net Realized Gain | | | (444 | ) | | | (60 | ) | |
Total Distributions | | | (28,749 | ) | | | (11,651 | ) | |
Capital Share Transactions:(1) | |
Class I: | |
Subscribed | | | 39,687 | | | | 25,459 | | |
Distributions Reinvested | | | 6,963 | | | | 1,850 | | |
Redeemed | | | (12,446 | ) | | | (21,028 | ) | |
Class A: | |
Subscribed | | | 22,639 | | | | 14,084 | | |
Distributions Reinvested | | | 20,024 | | | | 9,192 | | |
Redeemed | | | (52,854 | ) | | | (41,210 | ) | |
Class L: | |
Exchanged | | | 34 | | | | 28 | | |
Distributions Reinvested | | | 370 | | | | 151 | | |
Redeemed | | | (555 | ) | | | (802 | ) | |
Class C: | |
Subscribed | | | 2,738 | | | | 493 | | |
Distributions Reinvested | | | 241 | | | | 23 | | |
Redeemed | | | (212 | ) | | | (261 | ) | |
Class IS: | |
Subscribed | | | 5,501 | | | | 4,333 | | |
Distributions Reinvested | | | 707 | | | | 203 | | |
Redeemed | | | (2,860 | ) | | | (1,019 | ) | |
Net Increase (Decrease) in Net Assets Resulting from Capital Share Transactions | | | 29,977 | | | | (8,504 | ) | |
Total Increase in Net Assets | | | 46,236 | | | | 26,722 | | |
Net Assets: | |
Beginning of Period | | | 346,514 | | | | 319,792 | | |
End of Period (Including Distributions in Excess of Net Investment Income and
Accumulated Undistributed Net Investment Income of $(72) and $483, respectively) | | $ | 392,750 | | | $ | 346,514 | | |
The accompanying notes are an integral part of the financial statements.
12
Morgan Stanley Institutional Fund, Inc.
Annual Report — December 31, 2017
Global Infrastructure Portfolio
Statements of Changes in Net Assets (cont'd) | | Year Ended
December 31, 2017
(000) | | Year Ended
December 31, 2016
(000) | |
(1) Capital Share Transactions: | |
Class I: | |
Shares Subscribed | | | 2,670 | | | | 1,792 | | |
Shares Issued on Distributions Reinvested | | | 474 | | | | 132 | | |
Shares Redeemed | | | (832 | ) | | | (1,534 | ) | |
Net Increase in Class I Shares Outstanding | | | 2,312 | | | | 390 | | |
Class A: | |
Shares Subscribed | | | 1,547 | | | | 993 | | |
Shares Issued on Distributions Reinvested | | | 1,368 | | | | 659 | | |
Shares Redeemed | | | (3,517 | ) | | | (2,953 | ) | |
Net Decrease in Class A Shares Outstanding | | | (602 | ) | | | (1,301 | ) | |
Class L: | |
Shares Exchanged | | | 2 | | | | 2 | | |
Shares Issued on Distributions Reinvested | | | 25 | | | | 11 | | |
Shares Redeemed | | | (37 | ) | | | (58 | ) | |
Net Decrease in Class L Shares Outstanding | | | (10 | ) | | | (45 | ) | |
Class C: | |
Shares Subscribed | | | 192 | | | | 35 | | |
Shares Issued on Distributions Reinvested | | | 17 | | | | 2 | | |
Shares Redeemed | | | (15 | ) | | | (22 | ) | |
Net Increase in Class C Shares Outstanding | | | 194 | | | | 15 | | |
Class IS: | |
Shares Subscribed | | | 368 | | | | 307 | | |
Shares Issued on Distributions Reinvested | | | 48 | | | | 15 | | |
Shares Redeemed | | | (188 | ) | | | (72 | ) | |
Net Increase in Class IS Shares Outstanding | | | 228 | | | | 250 | | |
The accompanying notes are an integral part of the financial statements.
13
Morgan Stanley Institutional Fund, Inc.
Annual Report — December 31, 2017
Financial Highlights
Global Infrastructure Portfolio
| | | Class I | |
| | | Year Ended December 31, | |
Selected Per Share Data and Ratios | | 2017 | | 2016(1) | | 2015 | | 2014 | | 2013 | |
Net Asset Value, Beginning of Period | | $ | 14.02 | | | $ | 12.59 | | | $ | 15.41 | | | $ | 14.26 | | | $ | 12.91 | | |
Income (Loss) from Investment Operations: | |
Net Investment Income(2) | | | 0.44 | | | | 0.40 | | | | 0.40 | | | | 0.28 | | | | 0.26 | | |
Net Realized and Unrealized Gain (Loss) | | | 1.33 | | | | 1.55 | | | | (2.54 | ) | | | 1.87 | | | | 2.00 | | |
Total from Investment Operations | | | 1.77 | | | | 1.95 | | | | (2.14 | ) | | | 2.15 | | | | 2.26 | | |
Distributions from and/or in Excess of: | |
Net Investment Income | | | (0.42 | ) | | | (0.37 | ) | | | (0.35 | ) | | | (0.22 | ) | | | (0.25 | ) | |
Net Realized Gain | | | (0.73 | ) | | | (0.15 | ) | | | (0.32 | ) | | | (0.78 | ) | | | (0.66 | ) | |
Paid-in-Capital | | | — | | | | — | | | | (0.01 | ) | | | — | | | | — | | |
Total Distributions | | | (1.15 | ) | | | (0.52 | ) | | | (0.68 | ) | | | (1.00 | ) | | | (0.91 | ) | |
Net Asset Value, End of Period | | $ | 14.64 | | | $ | 14.02 | | | $ | 12.59 | | | $ | 15.41 | | | $ | 14.26 | | |
Total Return(3) | | | 12.70 | % | | | 15.55 | % | | | (13.90 | )% | | | 15.38 | % | | | 17.91 | % | |
Ratios and Supplemental Data: | |
Net Assets, End of Period (Thousands) | | $ | 95,219 | | | $ | 58,794 | | | $ | 47,878 | | | $ | 40,477 | | | $ | 26,428 | | |
Ratio of Expenses to Average Net Assets(8) | | | 0.91 | %(4)(5) | | | 0.85 | %(4) | | | 0.88 | %(4)(6) | | | 1.08 | %(4) | | | 1.12 | %(4) | |
Ratio of Net Investment Income to Average Net Assets(8) | | | 2.93 | %(4) | | | 2.85 | %(4) | | | 2.70 | %(4) | | | 1.82 | %(4) | | | 1.87 | %(4) | |
Ratio of Rebate from Morgan Stanley Affiliates to Average Net Assets | | | 0.01 | % | | | 0.01 | % | | | 0.00 | %(7) | | | 0.00 | %(7) | | | 0.01 | % | |
Portfolio Turnover Rate | | | 45 | % | | | 48 | % | | | 48 | % | | | 40 | % | | | 30 | % | |
(8) Supplemental Information on the Ratios to Average Net Assets: | |
Ratios Before Expense Limitation: | |
Expenses to Average Net Assets | | | 1.08 | % | | | 1.04 | % | | | 1.10 | % | | | 1.42 | % | | | 2.04 | % | |
Net Investment Income to Average Net Assets | | | 2.76 | % | | | 2.66 | % | | | 2.48 | % | | | 1.48 | % | | | 0.95 | % | |
(1) Reflects prior period custodian out-of-pocket expenses that were reimbursed in September 2016. The amount of the reimbursement was immaterial on a per share basis and did not impact the total return of Class I shares. The Ratio of Expenses to Average Net Assets and the Ratio of Net Investment Income to Average Net Assets would be unchanged as the reimbursement of custodian fees was offset against expense waivers/reimbursements with no impact to net expenses or net investment income.
(2) Per share amount is based on average shares outstanding.
(3) Calculated based on the net asset value as of the last business day of the period.
(4) The Ratios of Expenses and Net Investment Income reflect the rebate of certain Fund expenses in connection with the investments in Morgan Stanley affiliates during the period. The effect of the rebate on the ratios is disclosed in the above table as "Ratio of Rebate from Morgan Stanley Affiliates to Average Net Assets."
(5) Effective July 1, 2017, the Adviser has agreed to limit the ratio of expenses to average net assets to the maximum ratio of 0.97% for Class I shares. Prior to July 1, 2017, the maximum ratio was 0.87% for Class I shares.
(6) Effective March 30, 2015, the Adviser has agreed to limit the ratio of expenses to average net assets to the maximum ratio of 0.87% for Class I shares. Prior to March 30, 2015, the maximum ratio was 1.15% for Class I shares.
(7) Amount is less than 0.005%.
The accompanying notes are an integral part of the financial statements.
14
Morgan Stanley Institutional Fund, Inc.
Annual Report — December 31, 2017
Financial Highlights
Global Infrastructure Portfolio
| | | Class A | |
| | | Year Ended December 31, | |
Selected Per Share Data and Ratios | | 2017 | | 2016(1) | | 2015 | | 2014 | | 2013 | |
Net Asset Value, Beginning of Period | | $ | 13.99 | | | $ | 12.56 | | | $ | 15.38 | | | $ | 14.25 | | | $ | 12.90 | | |
Income (Loss) from Investment Operations: | |
Net Investment Income(2) | | | 0.39 | | | | 0.36 | | | | 0.39 | | | | 0.24 | | | | 0.26 | | |
Net Realized and Unrealized Gain (Loss) | | | 1.33 | | | | 1.55 | | | | (2.56 | ) | | | 1.86 | | | | 1.97 | | |
Total from Investment Operations | | | 1.72 | | | | 1.91 | | | | (2.17 | ) | | | 2.10 | | | | 2.23 | | |
Distributions from and/or in Excess of: | |
Net Investment Income | | | (0.38 | ) | | | (0.33 | ) | | | (0.32 | ) | | | (0.19 | ) | | | (0.22 | ) | |
Net Realized Gain | | | (0.73 | ) | | | (0.15 | ) | | | (0.32 | ) | | | (0.78 | ) | | | (0.66 | ) | |
Paid-in-Capital | | | — | | | | — | | | | (0.01 | ) | | | — | | | | — | | |
Total Distributions | | | (1.11 | ) | | | (0.48 | ) | | | (0.65 | ) | | | (0.97 | ) | | | (0.88 | ) | |
Net Asset Value, End of Period | | $ | 14.60 | | | $ | 13.99 | | | $ | 12.56 | | | $ | 15.38 | | | $ | 14.25 | | |
Total Return(3) | | | 12.37 | % | | | 15.29 | % | | | (14.08 | )% | | | 14.94 | % | | | 17.69 | % | |
Ratios and Supplemental Data: | |
Net Assets, End of Period (Thousands) | | $ | 278,780 | | | $ | 275,481 | | | $ | 263,702 | | | $ | 20,815 | | | $ | 3,706 | | |
Ratio of Expenses to Average Net Assets(9) | | | 1.15 | %(4)(5) | | | 1.10 | %(4) | | | 1.12 | %(4)(6) | | | 1.42 | %(4) | | | 1.37 | %(4)(7) | |
Ratio of Net Investment Income to Average Net Assets(9) | | | 2.63 | %(4) | | | 2.60 | %(4) | | | 2.67 | %(4) | | | 1.53 | %(4) | | | 1.81 | %(4) | |
Ratio of Rebate from Morgan Stanley Affiliates to Average Net Assets | | | 0.01 | % | | | 0.01 | % | | | 0.00 | %(8) | | | 0.00 | %(8) | | | 0.01 | % | |
Portfolio Turnover Rate | | | 45 | % | | | 48 | % | | | 48 | % | | | 40 | % | | | 30 | % | |
(9) Supplemental Information on the Ratios to Average Net Assets: | |
Ratios Before Expense Limitation: | |
Expenses to Average Net Assets | | | 1.38 | % | | | 1.37 | % | | | 1.35 | % | | | 1.76 | % | | | 2.43 | % | |
Net Investment Income to Average Net Assets | | | 2.40 | % | | | 2.33 | % | | | 2.44 | % | | | 1.19 | % | | | 0.75 | % | |
(1) Reflects prior period custodian out-of-pocket expenses that were reimbursed in September 2016. The amount of the reimbursement was immaterial on a per share basis and did not impact the total return of Class A shares. The Ratio of Expenses to Average Net Assets and the Ratio of Net Investment Income to Average Net Assets would be unchanged as the reimbursement of custodian fees was offset against expense waivers/reimbursements with no impact to net expenses or net investment income.
(2) Per share amount is based on average shares outstanding.
(3) Calculated based on the net asset value which does not reflect sales charges, if applicable, as of the last business day of the period.
(4) The Ratios of Expenses and Net Investment Income reflect the rebate of certain Fund expenses in connection with the investments in Morgan Stanley affiliates during the period. The effect of the rebate on the ratios is disclosed in the above table as "Ratio of Rebate from Morgan Stanley Affiliates to Average Net Assets."
(5) Effective July 1, 2017, the Adviser has agreed to limit the ratio of expenses to average net assets to the maximum ratio of 1.21% for Class A shares. Prior to July 1, 2017, the maximum ratio was 1.11% for Class A shares.
(6) Effective March 30, 2015, the Adviser has agreed to limit the ratio of expenses to average net assets to the maximum ratio of 1.11% for Class A shares. Prior to March 30, 2015, the maximum ratio was 1.50% for Class A shares.
(7) Effective September 16, 2013, the Adviser has agreed to limit the ratio of expenses to average net assets to the maximum ratio of 1.50% for Class A shares. Prior to September 16, 2013, the maximum ratio was 1.40% for Class A shares.
(8) Amount is less than 0.005%.
The accompanying notes are an integral part of the financial statements.
15
Morgan Stanley Institutional Fund, Inc.
Annual Report — December 31, 2017
Financial Highlights
Global Infrastructure Portfolio
| | | Class L | |
| | | Year Ended December 31, | |
Selected Per Share Data and Ratios | | 2017 | | 2016(1) | | 2015 | | 2014 | | 2013 | |
Net Asset Value, Beginning of Period | | $ | 13.94 | | | $ | 12.52 | | | $ | 15.34 | | | $ | 14.22 | | | $ | 12.90 | | |
Income (Loss) from Investment Operations: | |
Net Investment Income(2) | | | 0.31 | | | | 0.28 | | | | 0.30 | | | | 0.14 | | | | 0.16 | | |
Net Realized and Unrealized Gain (Loss) | | | 1.33 | | | | 1.54 | | | | (2.55 | ) | | | 1.87 | | | | 1.98 | | |
Total from Investment Operations | | | 1.64 | | | | 1.82 | | | | (2.25 | ) | | | 2.01 | | | | 2.14 | | |
Distributions from and/or in Excess of: | |
Net Investment Income | | | (0.30 | ) | | | (0.25 | ) | | | (0.24 | ) | | | (0.11 | ) | | | (0.16 | ) | |
Net Realized Gain | | | (0.73 | ) | | | (0.15 | ) | | | (0.32 | ) | | | (0.78 | ) | | | (0.66 | ) | |
Paid-in-Capital | | | — | | | | — | | | | (0.01 | ) | | | — | | | | — | | |
Total Distributions | | | (1.03 | ) | | | (0.40 | ) | | | (0.57 | ) | | | (0.89 | ) | | | (0.82 | ) | |
Net Asset Value, End of Period | | $ | 14.55 | | | $ | 13.94 | | | $ | 12.52 | | | $ | 15.34 | | | $ | 14.22 | | |
Total Return(3) | | | 11.80 | % | | | 14.57 | % | | | (14.64 | )% | | | 14.35 | % | | | 16.98 | % | |
Ratios and Supplemental Data: | |
Net Assets, End of Period (Thousands) | | $ | 5,634 | | | $ | 5,534 | | | $ | 5,529 | | | $ | 1,115 | | | $ | 573 | | |
Ratio of Expenses to Average Net Assets(9) | | | 1.72 | %(4)(5) | | | 1.67 | %(4) | | | 1.69 | %(4)(6) | | | 2.00 | %(4) | | | 1.93 | %(4)(7) | |
Ratio of Net Investment Income to Average Net Assets(9) | | | 2.06 | %(4) | | | 2.03 | %(4) | | | 2.06 | %(4) | | | 0.91 | %(4) | | | 1.16 | %(4) | |
Ratio of Rebate from Morgan Stanley Affiliates to Average Net Assets | | | 0.01 | % | | | 0.01 | % | | | 0.00 | %(8) | | | 0.00 | %(8) | | | 0.00 | %(8) | |
Portfolio Turnover Rate | | | 45 | % | | | 48 | % | | | 48 | % | | | 40 | % | | | 30 | % | |
(9) Supplemental Information on the Ratios to Average Net Assets: | |
Ratios Before Expense Limitation: | |
Expenses to Average Net Assets | | | 1.95 | % | | | 1.95 | % | | | 1.95 | % | | | 2.41 | % | | | 2.86 | % | |
Net Investment Income to Average Net Assets | | | 1.83 | % | | | 1.75 | % | | | 1.80 | % | | | 0.50 | % | | | 0.23 | % | |
(1) Reflects prior period custodian out-of-pocket expenses that were reimbursed in September 2016. The amount of the reimbursement was immaterial on a per share basis and did not impact the total return of Class L shares. The Ratio of Expenses to Average Net Assets and the Ratio of Net Investment Income to Average Net Assets would be unchanged as the reimbursement of custodian fees was offset against expense waivers/reimbursements with no impact to net expenses or net investment income.
(2) Per share amount is based on average shares outstanding.
(3) Calculated based on the net asset value as of the last business day of the period.
(4) The Ratios of Expenses and Net Investment Income reflect the rebate of certain Fund expenses in connection with the investments in Morgan Stanley affiliates during the period. The effect of the rebate on the ratios is disclosed in the above table as "Ratio of Rebate from Morgan Stanley Affiliates to Average Net Assets."
(5) Effective July 1, 2017, the Adviser has agreed to limit the ratio of expenses to average net assets to the maximum ratio of 1.78% for Class L shares. Prior to July 1, 2017, the maximum ratio was 1.68% for Class L shares.
(6) Effective March 30, 2015, the Adviser has agreed to limit the ratio of expenses to average net assets to the maximum ratio of 1.68% for Class L shares. Prior to March 30, 2015, the maximum ratio was 2.00% for Class L shares.
(7) Effective September 16, 2013, the Adviser has agreed to limit the ratio of expenses to average net assets to the maximum ratio of 2.00% for Class L shares. Prior to September 16, 2013, the maximum ratio was 1.90% for Class L shares.
(8) Amount is less than 0.005%.
The accompanying notes are an integral part of the financial statements.
16
Morgan Stanley Institutional Fund, Inc.
Annual Report — December 31, 2017
Financial Highlights
Global Infrastructure Portfolio
| | | Class C | |
| | | Year Ended December 31, | | Period from
April 30, 2015(2) to | |
Selected Per Share Data and Ratios | | 2017 | | 2016(1) | | December 31, 2015 | |
Net Asset Value, Beginning of Period | | $ | 13.81 | | | $ | 12.47 | | | $ | 15.87 | | |
Income (Loss) from Investment Operations: | |
Net Investment Income(3) | | | 0.29 | | | | 0.26 | | | | 0.17 | | |
Net Realized and Unrealized Gain (Loss) | | | 1.28 | | | | 1.52 | | | | (2.97 | ) | |
Total from Investment Operations | | | 1.57 | | | | 1.78 | | | | (2.80 | ) | |
Distributions from and/or in Excess of: | |
Net Investment Income | | | (0.29 | ) | | | (0.29 | ) | | | (0.27 | ) | |
Net Realized Gain | | | (0.73 | ) | | | (0.15 | ) | | | (0.32 | ) | |
Paid-in-Capital | | | — | | | | — | | | | (0.01 | ) | |
Total Distributions | | | (1.02 | ) | | | (0.44 | ) | | | (0.60 | ) | |
Net Asset Value, End of Period | | $ | 14.36 | | | $ | 13.81 | | | $ | 12.47 | | |
Total Return(4) | | | 11.42 | % | | | 14.35 | % | | | (17.62 | )%(8) | |
Ratios and Supplemental Data: | |
Net Assets, End of Period (Thousands) | | $ | 3,601 | | | $ | 784 | | | $ | 516 | | |
Ratio of Expenses to Average Net Assets(10) | | | 2.02 | %(5)(6) | | | 1.96 | %(5) | | | 1.97 | %(5)(9) | |
Ratio of Net Investment Income to Average Net Assets(10) | | | 1.96 | %(5) | | | 1.90 | %(5) | | | 1.81 | %(5)(9) | |
Ratio of Rebate from Morgan Stanley Affiliates to Average Net Assets | | | 0.01 | % | | | 0.01 | % | | | 0.00 | %(7)(9) | |
Portfolio Turnover Rate | | | 45 | % | | | 48 | % | | | 48 | % | |
(10) Supplemental Information on the Ratios to Average Net Assets: | |
Ratios Before Expense Limitation: | |
Expense to Average Net Assets | | | 2.23 | % | | | 2.69 | % | | | 2.34 | %(9) | |
Net Investment Income to Average Net Assets | | | 1.75 | % | | | 1.17 | % | | | 1.44 | %(9) | |
(1) Reflects prior period custodian out-of-pocket expenses that were reimbursed in September 2016. The amount of the reimbursement was immaterial on a per share basis and did not impact the total return of Class C shares. The Ratio of Expenses to Average Net Assets and the Ratio of Net Investment Income to Average Net Assets would be unchanged as the reimbursement of custodian fees was offset against expense waivers/reimbursements with no impact to net expenses or net investment income.
(2) Commencement of Offering.
(3) Per share amount is based on average shares outstanding.
(4) Calculated based on the net asset value which does not reflect sales charges, if applicable, as of the last business day of the period.
(5) The Ratios of Expenses and Net Investment Income reflect the rebate of certain Fund expenses in connection with the investments in Morgan Stanley affiliates during the period. The effect of the rebate on the ratios is disclosed in the above table as "Ratio of Rebate from Morgan Stanley Affiliates to Average Net Assets."
(6) Effective July 1, 2017, the Adviser has agreed to limit the ratio of expenses to average net assets to the maximum ratio of 2.07% for Class C shares. Prior to July 1, 2017, the maximum ratio was 1.97% for Class C shares.
(7) Amount is less than 0.005%.
(8) Not annualized.
(9) Annualized.
The accompanying notes are an integral part of the financial statements.
17
Morgan Stanley Institutional Fund, Inc.
Annual Report — December 31, 2017
Financial Highlights
Global Infrastructure Portfolio
| | | Class IS | |
| | | Year Ended December 31, | | Period from
September 13, 2013(2) to | |
Selected Per Share Data and Ratios | | 2017 | | 2016(1) | | 2015 | | 2014 | | December 31, 2013 | |
Net Asset Value, Beginning of Period | | $ | 14.02 | | | $ | 12.58 | | | $ | 15.41 | | | $ | 14.26 | | | $ | 13.73 | | |
Income (Loss) from Investment Operations: | |
Net Investment Income(3) | | | 0.45 | | | | 0.43 | | | | 0.53 | | | | 0.28 | | | | 0.09 | | |
Net Realized and Unrealized Gain (Loss) | | | 1.32 | | | | 1.53 | | | | (2.68 | ) | | | 1.87 | | | | 1.20 | | |
Total from Investment Operations | | | 1.77 | | | | 1.96 | | | | (2.15 | ) | | | 2.15 | | | | 1.29 | | |
Distributions from and/or in Excess of: | |
Net Investment Income | | | (0.43 | ) | | | (0.37 | ) | | | (0.35 | ) | | | (0.22 | ) | | | (0.25 | ) | |
Net Realized Gain | | | (0.73 | ) | | | (0.15 | ) | | | (0.32 | ) | | | (0.78 | ) | | | (0.51 | ) | |
Paid-in-Capital | | | — | | | | — | | | | (0.01 | ) | | | — | | | | — | | |
Total Distributions | | | (1.16 | ) | | | (0.52 | ) | | | (0.68 | ) | | | (1.00 | ) | | | (0.76 | ) | |
Net Asset Value, End of Period | | $ | 14.63 | | | $ | 14.02 | | | $ | 12.58 | | | $ | 15.41 | | | $ | 14.26 | | |
Total Return(4) | | | 12.65 | % | | | 15.66 | % | | | (13.96 | )% | | | 15.38 | % | | | 9.60 | %(10) | |
Ratios and Supplemental Data: | |
Net Assets, End of Period (Thousands) | | $ | 9,516 | | | $ | 5,921 | | | $ | 2,167 | | | $ | 11 | | | $ | 10 | | |
Ratio of Expenses to Average Net Assets(12) | | | 0.89 | %(5)(6) | | | 0.83 | %(5) | | | 0.84 | %(5)(7) | | | 1.08 | %(5) | | | 1.07 | %(5)(8)(11) | |
Ratio of Net Investment Income to Average Net Assets(12) | | | 2.95 | %(5) | | | 3.02 | %(5) | | | 3.91 | %(5) | | | 1.79 | %(5) | | | 2.13 | %(5)(11) | |
Ratio of Rebate from Morgan Stanley Affiliates to Average Net Assets | | | 0.01 | % | | | 0.01 | % | | | 0.00 | %(9) | | | 0.00 | %(9) | | | 0.01 | %(11) | |
Portfolio Turnover Rate | | | 45 | % | | | 48 | % | | | 48 | % | | | 40 | % | | | 30 | % | |
(12) Supplemental Information on the Ratios to Average Net Assets: | |
Ratios Before Expense Limitation: | |
Expenses to Average Net Assets | | | 1.06 | % | | | 1.08 | % | | | 1.41 | % | | | 18.56 | % | | | 7.27 | %(11) | |
Net Investment Income (Loss) to Average Net Assets | | | 2.78 | % | | | 2.77 | % | | | 3.33 | % | | | (15.69 | )% | | | (4.07 | )%(11) | |
(1) Reflects prior period custodian out-of-pocket expenses that were reimbursed in September 2016. The amount of the reimbursement was immaterial on a per share basis and did not impact the total return of Class IS shares. The Ratio of Expenses to Average Net Assets and the Ratio of Net Investment Income to Average Net Assets would be unchanged as the reimbursement of custodian fees was offset against expense waivers/reimbursements with no impact to net expenses or net investment income.
(2) Commencement of Offering.
(3) Per share amount is based on average shares outstanding.
(4) Calculated based on the net asset value as of the last business day of the period.
(5) The Ratios of Expenses and Net Investment Income reflect the rebate of certain Fund expenses in connection with the investments in Morgan Stanley affiliates during the period. The effect of the rebate on the ratios is disclosed in the above table as "Ratio of Rebate from Morgan Stanley Affiliates to Average Net Assets."
(6) Effective July 1, 2017, the Adviser has agreed to limit the ratio of expenses to average net assets to the maximum ratio of 0.94% for Class IS shares. Prior to July 1, 2017, the maximum ratio was 0.84% for Class IS shares.
(7) Effective March 30, 2015, the Adviser has agreed to limit the ratio of expenses to average net assets to the maximum ratio of 0.84% for Class IS shares. Prior to March 30, 2015, the maximum ratio was 1.08% for Class IS shares.
(8) Effective September 16, 2013, the Adviser has agreed to limit the ratio of expenses to average net assets to the maximum ratio of 1.08% for Class IS shares.
(9) Amount is less than 0.005%.
(10) Not annualized.
(11) Annualized.
The accompanying notes are an integral part of the financial statements.
18
Morgan Stanley Institutional Fund, Inc.
Annual Report — December 31, 2017
Notes to Financial Statements
Morgan Stanley Institutional Fund, Inc. (the "Company") is registered under the Investment Company Act of 1940, as amended (the "Act"), as an open-end management investment company. The Company is comprised of twenty-nine separate, active, diversified and non-diversified funds (individually referred to as a "Fund", collectively as the "Funds"). The Company applies investment company accounting and reporting guidance.
The accompanying financial statements relate to the Global Infrastructure Portfolio. The Fund seeks to provide both capital appreciation and income.
The Fund offers five classes of shares — Class I, Class A, Class L, Class C and Class IS. On April 30, 2015, the Fund suspended offering of Class L shares. Existing Class L shareholders may invest through reinvestment of dividends and distributions.
A. Significant Accounting Policies: The following significant accounting policies are in conformity with U.S. generally accepted accounting principles ("GAAP"). Such policies are consistently followed by the Company in the preparation of its financial statements. GAAP may require management to make estimates and assumptions that affect the reported amounts and disclosures in the financial statements. Actual results may differ from those estimates.
1. Security Valuation: (1) An equity portfolio security listed or traded on an exchange is valued at its latest reported sales price (or at the exchange official closing price if such exchange reports an official closing price), and if there were no sales on a given day and if there is no official exchange closing price for that day, the security is valued at the mean between the last reported bid and asked prices if such bid and asked prices are available on the relevant exchanges. Listed equity securities not traded on the valuation date with no reported bid and asked prices available on the exchange are valued at the mean between the current bid and asked prices obtained from one or more reputable brokers or dealers. In cases where a security is traded on more than one exchange, the security is valued on the exchange designated as the primary market; (2) all other equity portfolio securities for which over-the-counter ("OTC") market quotations are readily available are valued at the latest reported sales price (or at the market official closing price if such market reports an official closing price), and if there was no trading in the security on a given day and if there is no official closing price from
relevant markets for that day, the security is valued at the mean between the last reported bid and asked prices if such bid and asked prices are available on the relevant markets. An unlisted equity security that does not trade on the valuation date and for which bid and asked prices from the relevant markets are unavailable is valued at the mean between the current bid and asked prices obtained from one or more reputable brokers or dealers; (3) certain portfolio securities may be valued by an outside pricing service/vendor approved by the Company's Board of Directors (the "Directors"). The pricing service/vendor may employ a pricing model that takes into account, among other things, bids, yield spreads, and/or other market data and specific security characteristics. Alternatively, if a valuation is not available from an outside pricing service/vendor, and the security trades on an exchange, the security may be valued at its latest reported sale price (or at the exchange official closing price if such exchange reports an official closing price), prior to the time when assets are valued. If there are no sales on a given day and if there is no official exchange closing price for that day, the security is valued at the mean between the last reported bid and asked prices if such bid and asked prices are available in the relevant exchanges; (4) when market quotations are not readily available, including circumstances under which Morgan Stanley Investment Management Inc. (the "Adviser") or Morgan Stanley Investment Management Limited ("MSIM Limited") and Morgan Stanley Investment Management Company ("MSIM Company") (together, the "Sub-Advisers"), each a wholly-owned subsidiary of Morgan Stanley, determine that the closing price, last sale price or the mean between the last reported bid and asked prices are not reflective of a security's market value, portfolio securities are valued at their fair value as determined in good faith under procedures established by and under the general supervision of the Directors. Occasionally, developments affecting the closing prices of securities and other assets may occur between the times at which valuations of such securities are determined (that is, close of the foreign market on which the securities trade) and the close of business of the New York Stock Exchange ("NYSE"). If developments occur during such periods that are expected to materially affect the value of such securities, such valuations may be adjusted to reflect the estimated fair value of such securities as of the close of the NYSE, as determined in good faith by the Directors or by the Adviser using a pricing service and/or procedures approved by the
19
Morgan Stanley Institutional Fund, Inc.
Annual Report — December 31, 2017
Notes to Financial Statements (cont'd)
Directors; (5) quotations of foreign portfolio securities, other assets and liabilities and forward contracts stated in foreign currency are translated into U.S. dollar equivalents at the prevailing market rates prior to the close of the NYSE; and (6) investments in mutual funds, including the Morgan Stanley Institutional Liquidity Funds, are valued at the net asset value ("NAV") as of the close of each business day.
The Directors have responsibility for determining in good faith the fair value of the investments, and the Directors may appoint others, such as the Company's Adviser or a valuation committee, to assist the Directors in determining fair value and to make the actual calculations pursuant to the fair valuation methodologies previously approved by the Directors. Under procedures approved by the Directors, the Company's Adviser has formed a Valuation Committee whose members are approved by the Directors. The Valuation Committee provides administration and oversight of the Company's valuation policies and procedures, which are reviewed at least annually by the Directors. These procedures allow the Company to utilize independent pricing services, quotations from securities and financial instrument dealers, and other market sources to determine fair value.
The Company has procedures to determine the fair value of securities and other financial instruments for which market prices are not readily available. Under these procedures, the Valuation Committee convenes on a regular and ad hoc basis to review such securities and considers a number of factors, including valuation methodologies and significant unobservable valuation inputs, when arriving at fair value. The Valuation Committee may employ a market-based approach which may use related or comparable assets or liabilities, recent transactions, market multiples, book values, and other relevant information for the investment to determine the fair value of the investment. An income-based valuation approach may also be used in which the anticipated future cash flows of the investment are discounted to calculate fair value. Discounts may also be applied due to the nature or duration of any restrictions on the disposition of the investments. Due to the inherent uncertainty of valuations of such investments, the fair values may differ significantly from the values that would have been used had an active market existed. The Valuation
Committee employs various methods for calibrating these valuation approaches including a regular review of valuation methodologies, key inputs and assumptions, transactional back-testing or disposition analysis, and reviews of any related market activity.
2. Fair Value Measurement: Financial Accounting Standards Board ("FASB") Accounting Standards CodificationTM ("ASC") 820, "Fair Value Measurement" ("ASC 820"), defines fair value as the value that the Fund would receive to sell an investment or pay to transfer a liability in a timely transaction with an independent buyer in the principal market, or in the absence of a principal market, the most advantageous market for the investment or liability. ASC 820 establishes a three-tier hierarchy to distinguish between (1) inputs that reflect the assumptions market participants would use in valuing an asset or liability developed based on market data obtained from sources independent of the reporting entity (observable inputs) and (2) inputs that reflect the reporting entity's own assumptions about the assumptions market participants would use in valuing an asset or liability developed based on the best information available in the circumstances (unobservable inputs) and to establish classification of fair value measurements for disclosure purposes. Various inputs are used in determining the value of the Fund's investments. The inputs are summarized in the three broad levels listed below.
• Level 1 – unadjusted quoted prices in active markets for identical investments
• Level 2 – other significant observable inputs (including quoted prices for similar investments, interest rates, prepayment speeds, credit risk, etc.)
• Level 3 – significant unobservable inputs including the Fund's own assumptions in determining the fair value of investments. Factors considered in making this determination may include, but are not limited to, information obtained by contacting the issuer, analysts, or the appropriate stock exchange (for exchange-traded securities), analysis of the issuer's financial statements or other available documents and, if necessary, available information concerning other securities in similar circumstances
20
Morgan Stanley Institutional Fund, Inc.
Annual Report — December 31, 2017
Notes to Financial Statements (cont'd)
The inputs or methodology used for valuing securities are not necessarily an indication of the risk associated with investing in those securities and the determination of the significance of a particular input to the fair value measurement in its entirety requires judgment and considers factors specific to each security.
The following is a summary of the inputs used to value the Fund's investments as of December 31, 2017.
Investment Type | | Level 1
Unadjusted
quoted
prices
(000) | | Level 2
Other
significant
observable
inputs
(000) | | Level 3
Significant
unobservable
inputs
(000) | | Total
(000) | |
Assets: | |
Common Stocks | |
Airports | | $ | 298 | | | $ | 12,690 | | | $ | — | | | $ | 12,988 | | |
Communications | | | 34,863 | | | | 3,599 | | | | — | | | | 38,462 | | |
Diversified | | | — | | | | 42,732 | | | | — | | | | 42,732 | | |
Electricity
Transmission &
Distribution | | | 23,898 | | | | 22,022 | | | | — | | | | 45,920 | | |
Oil & Gas Storage &
Transportation | | | 100,758 | | | | 10,932 | | | | — | | | | 111,690 | | |
Railroads | | | 12,931 | | | | 5,845 | | | | — | | | | 18,776 | | |
Renewables | | | 23,960 | | | | 11,165 | | | | — | | | | 35,125 | | |
Toll Roads | | | 10,654 | | | | 52,307 | | | | — | | | | 62,961 | | |
Water | | | 3,997 | | | | 13,214 | | | | — | | | | 17,211 | | |
Total Common Stocks | | | 211,359 | | | | 174,506 | | | | — | | | | 385,865 | | |
Right | | | 67 | | | | — | | | | — | | | | 67 | | |
Short-Term Investments | |
Investment Companies | | | 21,085 | | | | — | | | | — | | | | 21,085 | | |
Repurchase Agreements | | | — | | | | 5,160 | | | | — | | | | 5,160 | | |
Total Short-Term
Investments | | | 21,085 | | | | 5,160 | | | | — | | | | 26,245 | | |
Total Assets | | $ | 232,511 | | | $ | 179,666 | | | $ | — | | | $ | 412,177 | | |
Transfers between investment levels may occur as the markets fluctuate and/or the availability of data used in an investment's valuation changes. The Fund recognizes transfers between the levels as of the end of the period. As of December 31, 2017, securities with a total value of approximately $146,974,000 transferred from Level 1 to Level 2. Securities that were valued using unadjusted quoted prices at December 31, 2016 were valued using other significant observable inputs at December 31, 2017. At December 31, 2017, the fair value of certain securities were adjusted due to developments which occurred between the time of the close of the foreign markets on which they trade and the close of business on the NYSE which resulted in their Level 2 classification.
3. Repurchase Agreements: The Fund may enter into repurchase agreements under which the Fund lends cash and takes possession of securities with an agreement that
the counterparty will repurchase such securities. In connection with transactions in repurchase agreements, a bank as custodian for the Fund takes possession of the underlying securities which are held as collateral, with a market value at least equal to the amount of the repurchase transaction, including principal and accrued interest. To the extent that any repurchase transaction exceeds one business day, the value of the collateral is marked-to-market on a daily basis to determine that the value of the collateral does not decrease below the repurchase price plus accrued interest as earned. If such a decrease occurs, additional collateral will be requested and, when received, will be added to the account to maintain full collateralization. In the event of default on the obligation to repurchase, the Fund has the right to liquidate the collateral and apply the proceeds in satisfaction of the obligation. In the event of default or bankruptcy by the counterparty to the agreement, realization of the collateral proceeds may be subject to cost and delays. The Fund, along with other affiliated investment companies, may utilize a joint trading account for the purpose of entering into repurchase agreements.
4. Foreign Currency Translation and Foreign Investments: The books and records of the Fund are maintained in U.S. dollars. Foreign currency amounts are translated into U.S. dollars as follows:
– investments, other assets and liabilities at the prevailing rate of exchange on the valuation date;
– investment transactions and investment income at the prevailing rates of exchange on the dates of such transactions.
Although the net assets of the Fund are presented at the foreign exchange rates and market values at the close of the period, the Fund does not isolate that portion of the results of operations arising as a result of changes in the foreign exchange rates from the fluctuations arising from changes in the market prices of securities held at period end. Similarly, the Fund does not isolate the effect of changes in foreign exchange rates from the fluctuations arising from changes in the market prices of securities sold during the period. Accordingly, realized and unrealized foreign currency gains (losses) on investments in securities are included in the reported net realized and unrealized gains (losses) on investment transactions and balances. However, pursuant to U.S. federal income tax
21
Morgan Stanley Institutional Fund, Inc.
Annual Report — December 31, 2017
Notes to Financial Statements (cont'd)
regulations, gains and losses from certain foreign currency transactions and the foreign currency portion of gains and losses realized on sales and maturities of foreign denominated debt securities are treated as ordinary income for U.S. federal income tax purposes.
Net realized gains (losses) on foreign currency transactions represent net foreign exchange gains (losses) from foreign currency forward exchange contracts, disposition of foreign currencies, currency gains (losses) realized between the trade and settlement dates on securities transactions, and the difference between the amount of investment income and foreign withholding taxes recorded on the Fund's books and the U.S. dollar equivalent amounts actually received or paid. Net unrealized currency gains (losses) from valuing foreign currency denominated assets and liabilities at period end exchange rates are reflected as a component of unrealized appreciation (depreciation) in the Statement of Assets and Liabilities. The change in unrealized currency gains (losses) on foreign currency translations for the period is reflected in the Statement of Operations.
Foreign security and currency transactions may involve certain considerations and risks not typically associated with those of U.S. dollar denominated transactions as a result of, among other factors, fluctuations of exchange rates in relation to the U.S. dollar, the possibility of lower levels of governmental supervision and regulation of foreign securities markets and the possibility of political or economic instability.
Governmental approval for foreign investments may be required in advance of making an investment under certain circumstances in some countries, and the extent of foreign investments in domestic companies may be subject to limitation in other countries. Foreign ownership limitations also may be imposed by the charters of individual companies to prevent, among other concerns, violations of foreign investment limitations. As a result, an additional class of shares (identified as "Foreign" in the Portfolio of Investments) may be created and offered for investment. The "local" and "foreign shares" market values may differ. In the absence of trading of the foreign shares in such markets, the Fund values the foreign shares at the closing exchange price of the local shares.
5. Securities Lending: The Fund lends securities to qualified financial institutions, such as broker-dealers, to earn
additional income. Any increase or decrease in the fair value of the securities loaned that might occur and any interest earned or dividends declared on those securities during the term of the loan would remain in the Fund. The Fund would receive cash or securities as collateral in an amount equal to or exceeding 100% of the current fair value of the loaned securities. The collateral is marked-to-market daily by State Street Bank and Trust Company ("State Street"), the securities lending agent, to ensure that a minimum of 100% collateral coverage is maintained.
Based on pre-established guidelines, the securities lending agent invests any cash collateral that is received in an affiliated money market portfolio and repurchase agreements. Securities lending income is generated from the earnings on the invested collateral and borrowing fees, less any rebates owed to the borrowers and compensation to the lending agent, and is recorded as "Income from Securities Loaned — Net" in the Fund's Statement of Operations. Risks in securities lending transactions are that a borrower may not provide additional collateral when required or return the securities when due, and that the value of the short-term investments will be less than the amount of cash collateral plus any rebate that is required to be returned to the borrower.
The Fund has the right under the securities lending agreement to recover the securities from the borrower on demand.
The following table presents financial instruments that are subject to enforceable netting arrangements as of December 31, 2017.
Gross Amounts Not Offset in the Statement of Assets and Liabilities | |
Gross Asset
Amounts
Presented in
Statement of
Assets and
Liabilities
(000) | | Financial
Instrument
(000) | | Collateral
Received
(000) | | Net Amount
(not less
than $0)
(000) | |
| $ | 21,158 | (a) | | $ | — | | | $ | (21,158 | )(b)(c) | | $ | 0 | | |
(a) Represents market value of loaned securities at year end.
(b) The Fund received cash collateral of approximately $19,265,000, which was subsequently invested in Repurchase Agreements and Morgan Stanley Institutional Liquidity Funds as reported in the Portfolio of Investments. In addition, the Fund received non-cash collateral of approximately $2,875,000 in the form of U.S. Government obligations, which the Fund cannot sell or repledge, and accordingly are not reflected in the Portfolio of Investments.
(c) The actual collateral received is greater than the amount shown here due to overcollateralization.
22
Morgan Stanley Institutional Fund, Inc.
Annual Report — December 31, 2017
Notes to Financial Statements (cont'd)
FASB ASC 860 "Transfers & Servicing: Repurchase-to-Maturity Transactions, Repurchase Financings, and Disclosures", is intended to provide increased transparency about the types of collateral pledged in securities lending transactions and other similar transactions that are accounted for as secured borrowing.
The following table displays a breakdown of transactions accounted for as secured borrowings, the gross obligations by class of collateral pledged, and the remaining contractual maturity of those transactions as of December 31, 2017.
Remaining Contractual Maturity of the Agreements | |
| | | Overnight and
Continuous
(000) | | <30 days
(000) | | Between
30 &
90 days
(000) | | >90 days
(000) | | Total
(000) | |
Securities Lending
Transactions | |
Common Stocks | | $ | 19,265 | | | $ | — | | | $ | — | | | $ | — | | | $ | 19,265 | | |
Total Borrowings | | $ | 19,265 | | | $ | — | | | $ | — | | | $ | — | | | $ | 19,265 | | |
Gross amount of
recognized liabilities
for securities lending
transactions | | | | | | | | | | $ | 19,265 | | |
6. Indemnifications: The Company enters into contracts that contain a variety of indemnifications. The Company's maximum exposure under these arrangements is unknown. However, the Company has not had prior claims or losses pursuant to these contracts and expects the risk of loss to be remote.
7. Dividends and Distributions to Shareholders: Dividends and distributions to shareholders are recorded on the ex-dividend date. Dividends from net investment income, if any, are declared and paid annually. Net realized capital gains, if any, are distributed at least annually.
8. Security Transactions, Income and Expenses: Security transactions are accounted for on the trade date (date the order to buy or sell is executed). Realized gains and losses on the sale of investment securities are determined on the specific identified cost method. Dividend income and other distributions are recorded on the ex-dividend date (except for certain foreign dividends which may be recorded as soon as the Fund is informed of such dividends) net of applicable withholding taxes. Interest income is recognized on the accrual basis except where collection is in doubt. Discounts are accreted and premiums are amortized over the life of the respective securities. Most expenses of the Company can be directly attributed
to a particular Fund. Expenses which cannot be directly attributed are apportioned among the Funds based upon relative net assets or other appropriate methods. Income, expenses (other than class specific expenses — distribution and shareholder services, transfer agency and sub transfer agency fees) and realized and unrealized gains or losses are allocated to each class of shares based upon their relative net assets.
The Fund owns shares of real estate investment trusts ("REITs") which report information on the source of their distributions annually in the following calendar year. A portion of distributions received from REITs during the year is estimated to be a return of capital and is recorded as a reduction of their cost.
B. Advisory/Sub-Advisory Fees: The Adviser, a wholly-owned subsidiary of Morgan Stanley, provides the Fund with advisory services under the terms of an Investment Advisory Agreement, paid quarterly, at an annual rate of 0.85% of the average daily net assets of the Fund.
The Adviser has agreed to reduce its advisory fee and/or reimburse the Fund so that total annual portfolio operating expenses, excluding certain investment related expenses, taxes, interest and other extraordinary expenses (including litigation), will not exceed 0.87% for Class I shares, 1.11% for Class A shares, 1.68% for Class L shares, 1.97% for Class C shares and 0.84% for Class IS shares. Effective July 1, 2017, the Adviser has agreed to reduce its advisory fee and/or reimburse the Fund so that total annual portfolio operating expenses will not exceed 0.97% for Class I shares, 1.21% for Class A shares, 1.78% for Class L shares, 2.07% for Class C shares and 0.94% for Class IS shares. The fee waivers and/or expense reimbursements will continue for at least one year from the date of the Fund's prospectus or until such time as the Directors act to discontinue all or a portion of such waivers and/or reimbursements when they deem such action is appropriate. For the year ended December 31, 2017, approximately $544,000 of advisory fees were waived and approximately $254,000 of other expenses were reimbursed by the Adviser pursuant to this arrangement.
The Adviser has entered into Sub-Advisory Agreements with the Sub-Advisers, each a wholly-owned subsidiary of Morgan Stanley. The Sub-Advisers provide the Fund with advisory services subject to the overall supervision of the Adviser and the Company's Officers and Directors. The Adviser pays the
23
Morgan Stanley Institutional Fund, Inc.
Annual Report — December 31, 2017
Notes to Financial Statements (cont'd)
Sub-Advisers on a monthly basis a portion of the net advisory fees the Adviser receives from the Fund.
C. Administration Fees: The Adviser also serves as Administrator to the Company and provides administrative services pursuant to an Administration Agreement for an annual fee, accrued daily and paid monthly, of 0.08% of the Fund's average daily net assets.
Under a Sub-Administration Agreement between the Administrator and State Street, State Street provides certain administrative services to the Company. For such services, the Administrator pays State Street a portion of the fee the Administrator receives from the Fund.
D. Distribution and Shareholder Services Fees: Morgan Stanley Distribution, Inc. ("MSDI" or the "Distributor"), a wholly-owned subsidiary of the Adviser and Sub-Advisers and an indirect subsidiary of Morgan Stanley, serves as the Company's Distributor of Fund shares pursuant to a Distribution Agreement. The Company has adopted a Shareholder Services Plan with respect to Class A shares pursuant to Rule 12b-1 under the Act. Under the Shareholder Services Plan, the Fund pays the Distributor a shareholder services fee, accrued daily and paid monthly, at an annual rate of 0.25% of the Fund's average daily net assets attributable to Class A shares.
The Company has adopted a Distribution and Shareholder Services Plan with respect to Class L shares pursuant to Rule 12b-1 under the Act. Under the Distribution and Shareholder Services Plan, the Fund pays the Distributor a distribution fee, accrued daily and paid monthly, at an annual rate of 0.50% and a shareholder services fee, accrued daily and paid monthly, at an annual rate of 0.25% of the Fund's average daily net assets attributable to Class L shares.
The Company has adopted a Distribution and Shareholder Services Plan with respect to Class C shares pursuant to Rule 12b-1 under the Act. Under the Distribution and Shareholder Services Plan, the Fund pays the Distributor a distribution fee, accrued daily and paid monthly, at an annual rate of 0.75% and a shareholder services fee, accrued daily and paid monthly, at an annual rate of 0.25% of the Fund's average daily net assets attributable to Class C shares.
The distribution and shareholder services fees are used to support the expenses associated with servicing and maintaining accounts. The Distributor may compensate other parties for providing shareholder support services to investors who purchase Class A, Class L and Class C shares.
E. Dividend Disbursing and Transfer Agent: The Company's dividend disbursing and transfer agent is Boston Financial Data Services, Inc. ("BFDS"). Pursuant to a Transfer Agency Agreement, the Company pays BFDS a fee based on the number of classes, accounts and transactions relating to the Funds of the Company. Effective January 1, 2018, BFDS changed its name to DST Asset Manager Solutions, Inc.
F. Custodian Fees: State Street (the "Custodian") also serves as Custodian for the Company in accordance with a Custodian Agreement. The Custodian holds cash, securities, and other assets of the Company as required by the Act. Custody fees are payable monthly based on assets held in custody, investment purchases and sales activity and account maintenance fees, plus reimbursement for certain out-of-pocket expenses.
G. Security Transactions and Transactions with Affiliates: For the year ended December 31, 2017, purchases and sales of investment securities for the Fund, other than long-term U.S. Government securities and short-term investments, were approximately $187,341,000 and $165,410,000, respectively. There were no purchases and sales of long-term U.S. Government securities for the year ended December 31, 2017.
The Fund invests in the Institutional Class of the Morgan Stanley Institutional Liquidity Funds. (the "Liquidity Funds"), an open-end management investment company managed by the Adviser, both directly and as a portion of the securities held as collateral on loaned securities. Advisory fees paid by the Fund are reduced by an amount equal to its pro-rata share of the advisory and administration fees paid by the Fund due to its investment in the Liquidity Funds. For the year ended December 31, 2017, advisory fees paid were reduced by approximately $39,000 relating to the Fund's investment in the Liquidity Funds.
24
Morgan Stanley Institutional Fund, Inc.
Annual Report — December 31, 2017
Notes to Financial Statements (cont'd)
A summary of the Fund's transactions in shares of the Liquidity Funds during the year ended December 31, 2017 is as follows:
Affiliated
Investment
Company | | Value
December 31,
2016
(000) | | Purchases
at Cost
(000) | | Proceeds
from Sales
(000) | | Dividend
Income
(000) | |
Liquidity Funds | | $ | 29,957 | | | $ | 114,292 | | | $ | 123,164 | | | $ | 165 | | |
Affiliated
Investment
Company (cont'd) | | Realized
Gain (Loss)
(000) | | Change in
Unrealized
Appreciation
(Depreciation)
(000) | | Value
December 31,
2017
(000) | |
Liquidity Funds | | $ | — | | | $ | — | | | $ | 21,085 | | |
During the year ended December 31, 2017, the Fund incurred approximately $10,000 in brokerage commissions with Morgan Stanley & Co., LLC, an affiliate of the Adviser/Administrator, Sub-Advisers and Distributor, for portfolio transactions executed on behalf of the Fund.
The Fund is permitted to purchase and sell securities ("cross-trade") from and to other Morgan Stanley Funds as well as other funds and client accounts for which the Adviser or an affiliate of the Adviser serves as investment adviser, pursuant to procedures approved by the Directors in compliance with Rule 17a-7 under the Act (the "Rule"). Each cross-trade is executed at the current market price in compliance with provisions of the Rule. For the year ended December 31, 2017, the Fund did not engage in any cross-trade transactions.
The Fund has an unfunded Deferred Compensation Plan (the "Compensation Plan"), which allows each independent Director to defer payment of all, or a portion, of the fees he or she receives for serving on the Board of Directors. Each eligible Director generally may elect to have the deferred amounts credited with a return equal to the total return on one or more of the Morgan Stanley funds that are offered as investment options under the Compensation Plan. Appreciation/depreciation and distributions received from these investments are recorded with an offsetting increase/decrease in the deferred compensation obligation and do not affect the NAV of the Fund.
H. Federal Income Taxes: It is the Fund's intention to continue to qualify as a regulated investment company and distribute all of its taxable and tax-exempt income. Accordingly, no provision for federal income taxes is required in the financial statements.
The Fund may be subject to taxes imposed by countries in which it invests. Such taxes are generally based on income and/or capital gains earned or repatriated. Taxes are accrued based on net investment income, net realized gains and net un-
realized appreciation as such income and/or gains are earned. Taxes may also be based on transactions in foreign currency and are accrued based on the value of investments denominated in such currency.
FASB ASC 740-10, "Income Taxes — Overall", sets forth a minimum threshold for financial statement recognition of the benefit of a tax position taken or expected to be taken in a tax return. Management has concluded there are no significant uncertain tax positions that would require recognition in the financial statements. If applicable, the Fund recognizes interest accrued related to unrecognized tax benefits in "Interest Expense" and penalties in "Other Expenses" in the Statement of Operations. The Fund files tax returns with the U.S. Internal Revenue Service, New York and various states. Generally, each of the tax years in the four-year period ended December 31, 2017, remains subject to examination by taxing authorities.
The tax character of distributions paid may differ from the character of distributions shown in the Statements of Changes in Net Assets due to short-term capital gains being treated as ordinary income for tax purposes. The tax character of distributions paid during fiscal years 2017 and 2016 was as follows:
2017
Distributions
Paid From: | | 2016
Distributions
Paid From: | |
Ordinary
Income
(000) | | Long-Term
Capital Gain
(000) | | Ordinary
Income
(000) | | Long-Term
Capital Gain
(000) | |
| $ | 11,453 | | | $ | 17,296 | | | $ | 8,000 | | | $ | 3,651 | | |
The amount and character of income and gains to be distributed are determined in accordance with income tax regulations which may differ from GAAP. These book/tax differences are either considered temporary or permanent in nature.
Temporary differences are primarily due to differing book and tax treatments for the timing of the recognition of gains (losses) on certain investment transactions and the timing of the deductibility of certain expenses.
Permanent differences, primarily due to differing treatments of gains (losses) related to foreign currency transactions and a dividend redesignation, resulted in the following reclassifications among the components of net assets at December 31, 2017:
Distributions
in Excess of
Net Investment
Income
(000) | | Accumulated
Net Realized
Loss
(000) | | Paid-in-
Capital
(000) | |
| $ | (963 | ) | | $ | 963 | | | $ | — | | |
25
Morgan Stanley Institutional Fund, Inc.
Annual Report — December 31, 2017
Notes to Financial Statements (cont'd)
At December 31, 2017, the components of distributable earnings for the Fund on a tax basis were as follows:
Undistributed
Ordinary
Income
(000) | | Undistributed
Long-Term
Capital Gain
(000) | |
| $ | 577 | | | $ | 5,269 | | |
I. Credit Facility: The Company and other Morgan Stanley funds participated in a $150,000,000 committed, unsecured revolving line of credit facility (the "Facility") with State Street. This Facility is to be used for temporary emergency purposes or funding of shareholder redemption requests. The interest rate on borrowings is based on the federal funds rate or 1 month LIBOR rate plus a spread. The Facility also has a commitment fee of 0.25% per annum based on the unused portion of the Facility. During the year ended December 31, 2017, the Fund did not have any borrowings under the Facility.
J. Other: At December 31, 2017, the Fund had record owners of 10% or greater. Investment activities of these shareholders could have a material impact on the Fund. The aggregate percentage of such owners was 49.2%.
26
Morgan Stanley Institutional Fund, Inc.
Annual Report — December 31, 2017
Report of Independent Registered Public Accounting Firm
To the Shareholders and Board of Directors of
Morgan Stanley Institutional Fund, Inc. —
Global Infrastructure Portfolio
Opinion on the Financial Statements
We have audited the accompanying statement of assets and liabilities of Global Infrastructure Portfolio (the "Fund") (one of the funds constituting the Morgan Stanley Institutional Fund, Inc. (the "Company")), including the portfolio of investments, as of December 31, 2017, and the related statement of operations for the year then ended, the statements of changes in net assets for each of the two years in the period then ended, the financial highlights for each of the five years in the period then ended and the related notes (collectively referred to as the "financial statements"). In our opinion, the financial statements present fairly, in all material respects, the financial position of Global Infrastructure Portfolio (one of the funds constituting Morgan Stanley Institutional Fund, Inc.) at December 31, 2017, the results of its operations for the year then ended, the changes in its net assets for each of the two years in the period then ended and its financial highlights for each of the five years in the period then ended, in conformity with U.S. generally accepted accounting principles.
Basis for Opinion
These financial statements are the responsibility of the Company's management. Our responsibility is to express an opinion on the Fund's financial statements based on our audits. We are a public accounting firm registered with the Public Company Accounting Oversight Board (United States) ("PCAOB") and are required to be independent with respect to the Company in accordance with the U.S. federal securities law and the applicable rules and regulations of the Securities and Exchange Commission and the PCAOB.
We conducted our audits in accordance with the standards of the PCAOB. Those standards require that we plan and perform the audit to obtain reasonable assurance about whether the financial statements are free of material misstatement, whether due to error or fraud. The Company is not required to have, nor were we engaged to perform, an audit of the Company's internal control over financial reporting. As part of our audits, we are required to obtain an understanding of internal control over financial reporting, but not for the purpose of expressing an opinion on the effectiveness of the Company's internal control over financial reporting. Accordingly, we express no such opinion.
Our audits included performing procedures to assess the risks of material misstatement of the financial statements, whether due to error or fraud, and performing procedures that respond to those risks. Such procedures included examining, on a test basis, evidence regarding the amounts and disclosures in the financial statements. Our procedures included confirmation of securities owned as of December 31, 2017 by correspondence with the custodian and others or by other appropriate auditing procedures where replies from others were not received. Our audits also included evaluating the accounting principles used and significant estimates made by management, as well as evaluating the overall presentation of the financial statements. We believe that our audits provide a reasonable basis for our opinion.

We have served as the auditor of one or more Morgan Stanley investment companies since 2000.
Boston, Massachusetts
February 26, 2018
27
Morgan Stanley Institutional Fund, Inc.
Annual Report — December 31, 2017
Federal Tax Notice (unaudited)
For federal income tax purposes, the following information is furnished with respect to the distributions paid by the Fund during its taxable year ended December 31, 2017. For corporate shareholders 22.71% of the dividends qualified for the dividends received deduction.
The Fund designated and paid approximately $17,296,000 as a long-term capital gain distribution.
For federal income tax purposes, the following information is furnished with respect to the Fund's earnings for its taxable year ended December 31, 2017. When distributed, certain earnings may be subject to a maximum tax rate of 15% as provided for by the Jobs and Growth Tax Relief Reconciliation Act of 2003. The Fund designated up to a maximum of approximately $10,669,000 as taxable at this lower rate.
The Fund intends to pass through foreign tax credits of approximately $350,000 and has derived net income from sources within foreign countries amounting to approximately $15,145,000.
In January, the Fund provides tax information to shareholders for the preceding calendar year.
28
Morgan Stanley Institutional Fund, Inc.
Annual Report — December 31, 2017
Privacy Notice (unaudited)
MORGAN STANLEY INVESTMENT MANAGEMENT INC.
AN IMPORTANT NOTICE CONCERNING OUR U.S. PRIVACY POLICY
We are required by federal law to provide you with a copy of our privacy policy annually. This policy applies to current and former individual investors in funds managed or sponsored by Morgan Stanley Investment Management Inc. ("MSIM") as well as current and former individual clients of MSIM. This policy is not applicable to partnerships, corporations, trusts or other non-individual clients or investors. Please note that we may amend this policy at any time, and will inform you of any changes as required by law.
WE RESPECT YOUR PRIVACY
We appreciate that you have provided us with your personal financial information. We strive to maintain the privacy of such information while we help you achieve your financial objectives. This Notice describes what non-public personal information we collect about you, why we collect it, when we may share it with others and how certain others may use it. It discusses the steps you may take to limit our sharing of certain information about you to affiliated companies in the Morgan Stanley family of companies ("other Morgan Stanley companies"). It also discloses how you may limit use of certain shared information for marketing purposes by other Morgan Stanley branded companies. Throughout this policy, we refer to the non-public information that personally identifies you or your accounts as "personal information.''
1. WHAT PERSONAL INFORMATION DO WE COLLECT ABOUT YOU?
We obtain personal information from applications and other forms you submit to us, from your dealings with us, from consumer reporting agencies, from our Web sites and from third parties and other sources.
For example:
• We may collect information such as your name, address, e-mail address, telephone/fax numbers, assets, income and investment objectives through subscription documents, applications and other forms you submit to us.
• We may obtain information about account balances, your use of account(s) and the types of products and services you prefer to receive from us through your dealings and transactions with us and other sources.
• We may obtain information about your creditworthiness and credit history from consumer reporting agencies.
• We may collect background information from and through third-party vendors to verify representations you have made and to comply with various regulatory requirements.
• If you interact with us through our public and private Web sites, we may collect information that you provide directly through online communications (such as an e-mail address). We may also collect information about your Internet service provider, your domain name, your computer's operating system and Web browser, your use of our Web sites and your product and service preferences, through the use of "cookies." Please consult the Terms of Use of these sites for more details.
2. WHEN DO WE DISCLOSE PERSONAL INFORMATION WE COLLECT ABOUT YOU?
We may disclose personal information we collect about you to other Morgan Stanley companies and to non-affiliated third parties.
a. Information We Disclose to Other Morgan Stanley Companies.
We may disclose personal information to other Morgan Stanley companies for a variety of reasons, including to manage your account(s) effectively, to service and process your transactions, to let you know about products and services offered by us and other Morgan Stanley companies, to manage our business, and as otherwise required or permitted by law. Offers for products and services from other Morgan Stanley companies are developed under conditions designed to safeguard your personal information.
29
Morgan Stanley Institutional Fund, Inc.
Annual Report — December 31, 2017
Privacy Notice (unaudited) (cont'd)
b. Information We Disclose to Non-affiliated Third Parties.
We do not disclose personal information that we collect about you to non-affiliated third parties except to those who provide marketing services on our behalf, to financial institutions with whom we have joint marketing agreements, and as otherwise required or permitted by law. For example, we may disclose personal information to non-affiliated third parties for servicing and processing transactions, to offer our own products and services, to protect against fraud, for institutional risk control, to respond to judicial process or to perform services on our behalf. When we share personal information with a non-affiliated third party, they are required to limit their use of personal information to the particular purpose for which it was shared and they are not allowed to share personal information with others except to fulfill that limited purpose or as may be permitted or required by law.
3. HOW DO WE PROTECT THE SECURITY AND CONFIDENTIALITY OF PERSONAL INFORMATION WE COLLECT ABOUT YOU?
We maintain physical, electronic and procedural security measures to help safeguard the personal information we collect about you. We have internal policies governing the proper handling of client information. Third parties that provide support or marketing services on our behalf may also receive personal information, and we require them to adhere to confidentiality standards with respect to such information.
4. HOW CAN YOU LIMIT THE SHARING OF CERTAIN TYPES OF PERSONAL INFORMATION WITH OTHER MORGAN STANLEY COMPANIES?
We offer you choices as to whether we share with other Morgan Stanley companies the personal information that was collected to determine your eligibility for products and services you request ("eligibility information"). Eligibility information does not include your identification information or personal information pertaining to our transactions or experiences with you. Please note that, even if you direct us not to share eligibility information with other Morgan Stanley companies ("opt-out"), we may still share personal information, including eligibility information, with those companies in circumstances excluded from the opt-out under applicable law, such as to process transactions or to service your account.
5. HOW CAN YOU LIMIT THE USE OF CERTAIN TYPES OF PERSONAL INFORMATION BY OTHER MORGAN STANLEY COMPANIES FOR MARKETING?
By following the opt-out instructions in Section 6 below, you may limit other Morgan Stanley branded companies from marketing their products or services to you based on personal information we disclose to them. This information may include, for example, your income and account history with us. Please note that, even if you choose to limit Other Morgan Stanley Companies from using personal information about you that we may share with them for marketing their products and services to you, Other Morgan Stanley Companies may use your personal information that they obtain from us to market to you in circumstances permitted by law, such as if the Other Morgan Stanley Company has its own relationship with you.
6. HOW CAN YOU SEND US AN OPT-OUT INSTRUCTION?
If you wish to limit our sharing of eligibility information about you with other Morgan Stanley companies or other Morgan Stanley companies' use of personal information for marketing purposes, as described in this notice, you may do so by:
• Calling us at (800) 548-7786
Monday–Friday between 8a.m. and 6p.m.(EST)
• Writing to us at the following address:
DST Asset Manager Solutions, Inc.
c/o Privacy Coordinator
P.O. Box 219804
Kansas City, Missouri 64121
30
Morgan Stanley Institutional Fund, Inc.
Annual Report — December 31, 2017
Privacy Notice (unaudited) (cont'd)
Your written request should include your name, address, telephone number and account number(s) to which the opt-out applies and whether you are opting out with respect to sharing of eligibility information (Section 4 above), or if information used for Marketing (Section 5 above) or both. Written opt-out requests should not be sent with any other correspondence. In order to process your request, we require that the request be provided by you directly and not through a third party.
Your opt-out preference will remain in effect with respect to this policy (as it may be amended) until you notify us otherwise. If you have a joint account, your direction for us not to share this information with other Morgan Stanley companies and for those other Morgan Stanley companies not to use your personal information for marketing will be applied to all account holders on that account. Please understand that if you limit our sharing or our affiliated companies' use of personal information, you and any joint account holder(s) may not receive information about Morgan Stanley products and services, including products or services that could help you manage your financial resources and achieve your investment objectives.
7. WHAT IF AN AFFILIATED COMPANY BECOMES A NON-AFFILIATED THIRD PARTY?
If, at any time in the future, an affiliated company becomes a non-affiliated third party, further disclosures of personal information made to the former affiliated company will be limited to those described in Section 2(b) above relating to non-affiliated third parties. If you elected under Section 6 to limit disclosures we make to affiliated companies, or use of personal information by affiliated companies, your election will not apply to use by any former affiliated company of your personal information in their possession once it becomes a non-affiliated third party.
SPECIAL NOTICE TO RESIDENTS OF VERMONT
The following section supplements our policy with respect to our individual clients who have a Vermont address and supersedes anything to the contrary in the above policy with respect to those clients only.
The state of Vermont requires financial institutions to obtain your consent prior to sharing personal information that they collect about you with affiliated companies and non-affiliated third parties other than in certain limited circumstances. Except as permitted by law, we will not share personal information we collect about you with non-affiliated third parties or other Morgan Stanley companies unless you provide us with your written consent to share such information ("opt-in").
If you wish to receive offers for investment products and services offered by or through other Morgan Stanley companies, please notify us in writing at the following address:
DST Asset Manager Solutions, Inc.
c/o Privacy Coordinator
P.O. Box 219804
Kansas City, Missouri 64121
Your authorization should include your name, address, telephone number and account number(s) to which the opt-in applies and should not be sent with any other correspondence. In order to process your authorization, we require that the authorization be provided by you directly and not through a third party.
SPECIAL NOTICE TO RESIDENTS OF CALIFORNIA
The following section supplements our policy with respect to our individual clients who have a California address and supersedes anything to the contrary in the above policy with respect to those clients only.
In response to a California law, if your account has a California home address, your personal information will not be disclosed to non-affiliated third parties except as permitted by applicable California law, and we will limit sharing such information with our affiliates to comply with California privacy laws that apply to us.
31
Morgan Stanley Institutional Fund, Inc.
Annual Report — December 31, 2017
Director and Officer Information (unaudited)
Independent Directors:
Name, Age and Address of
Independent Director | | Position(s)
Held with
Registrant | | Length of Time
Served* | | Principal Occupation(s) During Past 5 Years
and Other Relevant Professional Experience | | Number of
Portfolios in
Fund Complex
Overseen by
Independent
Director** | | Other Directorships
Held by Independent
Director*** | |
Frank L. Bowman (73)
c/o Perkins Coie LLP
Counsel to the Independent
Directors
30 Rockefeller Plaza
New York, NY 10112 | | Director | | Since
August
2006 | | President, Strategic Decisions, LLC (consulting) (since February 2009); Director or Trustee of various Morgan Stanley Funds (since August 2006); Chairperson of the Compliance and Insurance Committee (since October 2015); formerly, Chairperson of the Insurance Sub-Committee of the Compliance and Insurance Committee (2007-2015); served as President and Chief Executive Officer of the Nuclear Energy Institute (policy organization) (February 2005-November 2008); retired as Admiral, U.S. Navy after serving over 38 years on active duty including 8 years as Director of the Naval Nuclear Propulsion Program in the Department of the Navy and the U.S. Department of Energy (1996-2004); served as Chief of Naval Personnel (July 1994-September 1996) and on the Joint Staff as Director of Political Military Affairs (June 1992-July 1994); knighted as Honorary Knight Commander of the Most Excellent Order of the British Empire; awarded the Officier de l'Orde National du Mérite by the French Government; elected to the National Academy of Engineering (2009). | | | 88 | | | Director of BP p.l.c.; Director of Naval and Nuclear Technologies LLP; Director Emeritus of the Armed Services YMCA; Director of the U.S. Naval Submarine League; Member of the National Security Advisory Council of the Center for U.S. Global Engagement and a member of the CNA Military Advisory Board; Trustee of Fairhaven United Methodist Church; and Director of other various non-profit organizations. | |
Kathleen A. Dennis (64)
c/o Perkins Coie LLP
Counsel to the Independent
Directors
30 Rockefeller Plaza
New York, NY 10112 | | Director | | Since
August
2006 | | President, Cedarwood Associates (mutual fund and investment management consulting) (since July 2006); Chairperson of the Liquidity and Alternatives Sub-Committee of the Investment Committee (since October 2006) and Director or Trustee of various Morgan Stanley Funds (since August 2006); formerly, Senior Managing Director of Victory Capital Management (1993-2006). | | | 89 | | | Director of various non-profit organizations. | |
Nancy C. Everett (62)
c/o Perkins Coie LLP
Counsel to the Independent
Directors
30 Rockefeller Plaza
New York, NY 10112 | | Director | | Since
January
2015 | | Chief Executive Officer, Virginia Commonwealth University Investment Company (since November 2015); Owner, OBIR, LLC (institutional investment management consulting) (since June 2014); formerly, Managing Director, BlackRock Inc. (February 2011-December 2013); and Chief Executive Officer, General Motors Asset Management (a/k/a Promark Global Advisors, Inc.) (June 2005-May 2010). | | | 90 | | | Formerly, Member of Virginia Commonwealth University School of Business Foundation (2005-2016); Member of Virginia Commonwealth University Board of Visitors (2013-2015); Member of Committee on Directors for Emerging Markets Growth Fund, Inc. (2007-2010); Chairperson of Performance Equity Management, LLC (2006-2010); and Chairperson, GMAM Absolute Return Strategies Fund, LLC (2006-2010). | |
32
Morgan Stanley Institutional Fund, Inc.
Annual Report — December 31, 2017
Director and Officer Information (unaudited) (cont'd)
Independent Directors: (cont'd)
Name, Age and Address of
Independent Director | | Position(s)
Held with
Registrant | | Length of Time
Served* | | Principal Occupation(s) During Past 5 Years
and Other Relevant Professional Experience | | Number of
Portfolios in
Fund Complex
Overseen by
Independent
Director** | | Other Directorships
Held by Independent
Director*** | |
Jakki L. Haussler (60)
c/o Perkins Coie LLP
Counsel to the Independent
Directors
30 Rockefeller Plaza
New York, NY 10112 | | Director | | Since
January
2015 | | Chairman and Chief Executive Officer, Opus Capital Group (since January 1996); formerly, Director, Capvest Venture Fund, LP (May 2000-December 2011); Partner, Adena Ventures, LP (July 1999-December 2010); Director, The Victory Funds (February 2005-July 2008). | | | 91 | | | Director of Cincinnati Bell Inc. and Member, Audit Committee and Compensation Committee; Director of Northern Kentucky University Foundation and Member, Investment Committee; Member of Chase College of Law Transactional Law Practice Center Board of Advisors; Director of Best Transport; Director of Chase College of Law Board of Visitors; formerly, Member, University of Cincinnati Foundation Investment Committee; Member, Miami University Board of Visitors (2008-2011); Trustee of Victory Funds (2005-2008) and Chairman, Investment Committee (2007-2008) and Member, Service Provider Committee (2005-2008). | |
Dr. Manuel H. Johnson (68)
c/o Johnson Smick
International, Inc.
220 I Street, NE — Suite 200
Washington, D.C. 20002 | | Director | | Since
July
1991 | | Senior Partner, Johnson Smick International, Inc. (consulting firm); Chairperson of the Investment Committee (since October 2006) and Director or Trustee of various Morgan Stanley Funds (since July 1991); Co-Chairman and a founder of the Group of Seven Council (G7C) (international economic commission); formerly, Chairperson of the Audit Committee (July 1991-September 2006), Vice Chairman of the Board of Governors of the Federal Reserve System and Assistant Secretary of the U.S. Treasury. | | | 91 | | | Director of NVR, Inc. (home construction). | |
Joseph J. Kearns (75)
c/o Kearns & Associates LLC
46 E Peninsula Center #385
Rolling Hills Estates, CA
90274-3712 | | Director | | Since
August
1994 | | Senior Adviser, Kearns & Associates LLC (investment consulting); Chairperson of the Audit Committee (since October 2006) and Director or Trustee of various Morgan Stanley Funds (since August 1994); formerly, Deputy Chairperson of the Audit Committee (July 2003-September 2006) and Chairperson of the Audit Committee of various Morgan Stanley Funds (since August 1994); CFO of the J. Paul Getty Trust. | | | 93 | | | Prior to August 10, 2016, Director of Electro Rent Corporation (equipment leasing); Prior to December 31, 2013, Director of The Ford Family Foundation. | |
33
Morgan Stanley Institutional Fund, Inc.
Annual Report — December 31, 2017
Director and Officer Information (unaudited) (cont'd)
Independent Directors: (cont'd)
Name, Age and Address of
Independent Director | | Position(s)
Held with
Registrant | | Length of Time
Served* | | Principal Occupation(s) During Past 5 Years
and Other Relevant Professional Experience | | Number of
Portfolios in
Fund Complex
Overseen by
Independent
Director** | | Other Directorships
Held by Independent
Director*** | |
Michael F. Klein (59)
c/o Perkins Coie LLP
Counsel to the Independent
Directors
30 Rockefeller Plaza
New York, NY 10112 | | Director | | Since
August
2006 | | Managing Director, Aetos Capital, LLC (since March 2000); Co-President, Aetos Alternatives Management, LLC (since January 2004) and Co-Chief Executive Officer of Aetos Capital LLC (since August 2013); Chairperson of the Fixed Income Sub-Committee of the Investment Committee (since October 2006) and Director or Trustee of various Morgan Stanley Funds (since August 2006); formerly, Managing Director, Morgan Stanley & Co. Inc. and Morgan Stanley Dean Witter Investment Management, President, various Morgan Stanley Funds (June 1998-March 2000) and Principal, Morgan Stanley & Co. Inc. and Morgan Stanley Dean Witter Investment Management (August 1997-December 1999). | | | 88 | | | Director of certain investment funds managed or sponsored by Aetos Capital, LLC; Director of Sanitized AG and Sanitized Marketing AG (specialty chemicals). | |
Patricia Maleski (57)
c/o Perkins Coie LLP
Counsel to the Independent
Directors
30 Rockefeller Plaza
New York, NY 10112 | | Director | | Since
January
2017 | | Managing Director, JPMorgan Asset Management (2004-2016); Oversight and Control Head of Fiduciary and Conflicts of Interest Program (2015-2016); Chief Control Officer-Global Asset Management (2013-2015); President, JPMorgan Funds (2010-2013); Chief Administrative Officer (2004-2013); various other positions including Treasurer and Board Liaison (since 2001). | | | 90 | | | None. | |
Michael E. Nugent (81)
522 Fifth Avenue
New York, NY 10036 | | Chair of the
Board and
Director | | Chair of the
Boards since
July 2006 and
Director since
July 1991 | | Chair of the Boards of various Morgan Stanley Funds (since July 2006); Chairperson of the Closed-End Fund Committee (since June 2012) and Director or Trustee of various Morgan Stanley Funds (since July 1991); formerly, Chairperson of the Insurance Committee (until July 2006); General Partner, Triumph Capital, L.P. (private investment partnership) (1988-2013). | | | 88 | | | None. | |
W. Allen Reed (70)
c/o Perkins Coie LLP
Counsel to the Independent
Directors
30 Rockefeller Plaza
New York, NY 10112 | | Director | | Since
August
2006 | | Chairperson of the Equity Sub-Committee of the Investment Committee (since October 2006) and Director or Trustee of various Morgan Stanley Funds (since August 2006); formerly, President and CEO of General Motors Asset Management; Chairman and Chief Executive Officer of the GM Trust Bank and Corporate Vice President of General Motors Corporation (August 1994-December 2005). | | | 89 | | | Director of Legg Mason, Inc.; formerly, Director of the Auburn University Foundation (2010-2015). | |
Fergus Reid (85)
c/o Joe Pietryka, Inc.
85 Charles Colman Blvd.
Pawling, NY 12564 | | Director | | Since
June
1992 | | Chairman, Joe Pietryka, Inc.; Chairperson of the Governance Committee and Director or Trustee of various Morgan Stanley Funds (since June 1992). | | | 89 | | | Formerly, Trustee and Director of certain investment companies in the JP Morgan Fund Complex managed by JP Morgan Investment Management Inc. (1987-2012). | |
* This is the earliest date the Director began serving the Morgan Stanley Funds. Each Director serves an indefinite term, until his or her successor is elected.
** The Fund Complex includes (as of December 31, 2017) all open-end and closed-end funds (including all of their portfolios) advised by Morgan Stanley Investment Management Inc. (the "Adviser") and any funds that have an adviser that is an affiliated person of the Adviser (including, but not limited to, Morgan Stanley AIP GP LP).
*** This includes any directorships at public companies and registered investment companies held by the Director at any time during the past five years.
34
Morgan Stanley Institutional Fund, Inc.
Annual Report — December 31, 2017
Director and Officer Information (unaudited) (cont'd)
Executive Officers:
Name, Age and Address of Executive Officer | | Position(s) Held
with
Registrant | | Length of Time
Served* | | Principal Occupation(s) During Past 5 Years | |
John H. Gernon (54)
522 Fifth Avenue
New York, NY 10036 | | President and
Principal
Executive
Officer | | Since
September
2013 | | President and Principal Executive Officer of the Equity and Fixed Income Funds and the Morgan Stanley AIP Funds (since September 2013) and the Liquidity Funds and various money market funds (since May 2014) in the Fund Complex; Managing Director of the Adviser; Head of Product (since 2006). | |
Timothy J. Knierim (58)
522 Fifth Avenue
New York, NY 10036 | | Chief
Compliance
Officer | | Since
December
2016 | | Managing Director of the Adviser and various entities affiliated with the Adviser; Chief Compliance Officer of various Morgan Stanley Funds and the Adviser (since December 2016) and Chief Compliance Officer of Morgan Stanley AIP GP LP (since 2014). Formerly, Managing Director and Deputy Chief Compliance Officer of the Adviser (2014-2016); and formerly, Chief Compliance Officer of Prudential Investment Management, Inc. (2007-2014). | |
Francis J. Smith (52)
522 Fifth Avenue
New York, NY 10036 | | Treasurer and
Principal
Financial
Officer | | Treasurer
since July
2003 and
Principal
Financial
Officer since
September
2002 | | Managing Director of the Adviser and various entities affiliated with the Adviser; Treasurer (since July 2003) and Principal Financial Officer of various Morgan Stanley Funds (since September 2002). | |
Mary E. Mullin (50)
522 Fifth Avenue
New York, NY 10036 | | Secretary | | Since
June
1999 | | Managing Director of the Adviser; Secretary of various Morgan Stanley Funds (since June 1999). | |
Michael J. Key (38)
522 Fifth Avenue
New York, NY 10036 | | Vice President | | Since
June
2017 | | Vice President of the Equity and Fixed Income Funds, Liquidity Funds, various money market funds and the Morgan Stanley AIP Funds in the Fund Complex (since June 2017); Executive Director of the Adviser; Head of Product Development for Equity and Fixed Income Funds (since August 2013). | |
* This is the earliest date the officer began serving the Morgan Stanley Funds. Each officer serves a one-year term, until his or her successor is elected and qualifies.
35
Morgan Stanley Institutional Fund Trust
Annual Report — December 31, 2017
Adviser and Administrator
Morgan Stanley Investment Management Inc.
522 Fifth Avenue
New York, New York 10036
Sub-Advisers
Morgan Stanley Investment Management Limited
25 Cabot Square, Canary Wharf
London, E14 4QA, England
Morgan Stanley Investment Management Company
23 Church Street
16-01 Capital Square, Singapore 049481
Distributor
Morgan Stanley Distribution, Inc.
522 Fifth Avenue
New York, New York 10036
Dividend Disbursing and Transfer Agent
DST Asset Manager Solutions, Inc.
2000 Crown Colony Drive
Quincy, Massachusetts 02169
Custodian
State Street Bank and Trust Company
One Lincoln Street
Boston, Massachusetts 02111
Legal Counsel
Dechert LLP
1095 Avenue of the Americas
New York, New York 10036
Counsel to the Independent Directors
Perkins Coie LLP
30 Rockefeller Plaza
New York, New York 10112
Independent Registered Public Accounting Firm
Ernst & Young LLP
200 Clarendon Street
Boston, Massachusetts 02116
Reporting to Shareholders
Each Morgan Stanley Fund provides a complete schedule of portfolio holdings in its semi-annual and annual reports within 60 days of the end of the fund's second and fourth fiscal quarters. The semi-annual and annual reports are filed electronically with the Securities and Exchange Commission (SEC) on Form N-CSRS and Form N-CSR, respectively. Morgan Stanley also delivers the semi-annual and annual reports to fund shareholders and makes these reports available on its public website, www.morganstanley.com/im. Each Morgan Stanley fund also files a complete schedule of portfolio holdings with the SEC for the fund's first and third fiscal quarters on Form N-Q. Morgan Stanley does not deliver the reports for the first and third fiscal quarters to shareholders, nor are the reports posted to the Morgan Stanley public website. You may, however, obtain the Form N-Q filings (as well as the Form N-CSR and N-CSRS filings) by accessing the SEC's website, www.sec.gov. You may also review and copy them at the SEC's Public Reference Room in Washington, DC. Information on the operation of the SEC's Public Reference Room may be obtained by calling the SEC toll free at 1 (800) SEC-0330. You can also request copies of these materials, upon payment of a duplicating fee, by electronic request at the SEC's email address (publicinfo@sec.gov) or by writing to the SEC's Public Reference Section, Washington, D.C. 20549-1520.
Proxy Voting Policies and Procedures and Proxy Voting Record
You may obtain a copy of the Company's Proxy Voting Policy and Procedures and information regarding how the Company voted proxies relating to portfolio securities during the most recent twelve-month period ended June 30, without charge, upon request, by calling toll free 1 (800) 548-7786 or by visiting our website at www.morganstanley.com/im. This information is also available on the SEC's website at www.sec.gov.
This report is authorized for distribution only when preceded or accompanied by a prospectus or summary prospectus of the applicable Fund of Morgan Stanley Institutional Fund, Inc., which describes in detail the Fund's investment policies, risks, fees and expenses. Please read the prospectus carefully before you invest or send money. For additional information, including information regarding the investments comprising the Fund, please visit our website at www.morganstanley.com/im or call toll free 1 (800) 548-7786.
36
Printed in U.S.A.
This Report has been prepared for shareholders and may be distributed to others only if preceded or accompanied by a current prospectus.
Morgan Stanley Investment Management Inc.
522 Fifth Avenue
New York, New York 10036
© 2018 Morgan Stanley. Morgan Stanley Distribution, Inc.

IFISGIANN
2008101 EXP. 02.28.19

Morgan Stanley Institutional Fund, Inc.
Global Insight Portfolio
Annual Report
December 31, 2017

Morgan Stanley Institutional Fund, Inc.
Annual Report — December 31, 2017
Shareholders' Letter | | | 2 | | |
Expense Example | | | 3 | | |
Investment Overview | | | 4 | | |
Portfolio of Investments | | | 6 | | |
Statement of Assets and Liabilities | | | 7 | | |
Statement of Operations | | | 9 | | |
Statements of Changes in Net Assets | | | 10 | | |
Financial Highlights | | | 12 | | |
Notes to Financial Statements | | | 16 | | |
Report of Independent Registered Public Accounting Firm | | | 23 | | |
Federal Tax Notice | | | 24 | | |
Privacy Notice | | | 25 | | |
Director and Officer Information | | | 28 | | |
This report is authorized for distribution only when preceded or accompanied by a prospectus or summary prospectus of the applicable Fund of Morgan Stanley Institutional Fund, Inc. To receive a prospectus and/or statement of additional information (SAI), which contains more complete information such as investment objectives, charges, expenses, policies for voting proxies, risk considerations, and describes in detail each of the Fund's investment policies to the prospective investor, please call toll free 1 (800) 548-7786. Please read the prospectuses carefully before you invest or send money.
Additionally, you can access information about the Fund, including performance, characteristics, and investment team commentary, through Morgan Stanley Investment Management's website: www.morganstanley.com/im.
Market forecasts provided in this report may not necessarily come to pass. There is no guarantee that any sectors mentioned will continue to perform as discussed herein or that securities in such sectors will be held by the Fund in the future. There is no assurance that a fund will achieve its investment objective. Funds are subject to market risk, which is the possibility that market values of securities owned by the Fund will decline and, therefore, the value of the Fund's shares may be less than what you paid for them. Accordingly, you can lose money investing in this Fund. Please see the prospectus for more complete information on investment risks.
1
Morgan Stanley Institutional Fund, Inc.
Annual Report — December 31, 2017
Shareholders' Letter (unaudited)
Dear Shareholders,
We are pleased to provide this Annual report, in which you will learn how your investment in Global Insight Portfolio (the "Fund") performed during the latest twelve-month period.
Morgan Stanley Investment Management is a client-centric, investor-led organization. Our global presence, intellectual capital, and breadth of products and services enable us to partner with investors to meet the evolving challenges of today's financial markets. We aim to deliver superior investment service and to empower our clients to make the informed decisions that help them reach their investment goals.
As always, we thank you for selecting Morgan Stanley Investment Management, and look forward to working with you in the months and years ahead.
Sincerely,

John H. Gernon
President and Principal Executive Officer
January 2018
2
Morgan Stanley Institutional Fund, Inc.
Annual Report — December 31, 2017
Expense Example (unaudited)
Global Insight Portfolio
As a shareholder of the Fund, you incur two types of costs: (1) transactional costs; and (2) ongoing costs, which may include advisory fees, administration fees, distribution and shareholder services fees and other Fund expenses. This example is intended to help you understand your ongoing costs (in dollars) of investing in the Fund and to compare these costs with the ongoing costs of investing in other mutual funds.
This example is based on an investment of $1,000 invested at the beginning of the six-month period ended December 31, 2017 and held for the entire six-month period.
Actual Expenses
The table below provides information about actual account values and actual expenses. You may use the information in this table, together with the amount you invested, to estimate the expenses that you paid over the period. Simply divide your account value by $1,000 (for example, an $8,600 account value divided by $1,000 = 8.6), then multiply the result by the number in the table under the heading entitled "Actual Expenses Paid During Period" to estimate the expenses you paid on your account during this period.
Hypothetical Example for Comparison Purposes
The table below provides information about hypothetical account values and hypothetical expenses based on the Fund's actual expense ratio and an assumed rate of return of 5% per year before expenses, which is not the Fund's actual return. The hypothetical account values and expenses may not be used to estimate the actual ending account balance or expenses you paid for the period. You may use this information to compare the ongoing costs of investing in the Fund and other funds. To do so, compare this 5% hypothetical example with the 5% hypothetical examples that appear in the shareholder reports of the other funds.
Please note that the expenses shown in the table are meant to highlight your ongoing costs only and do not reflect any transactional costs, such as sales charges (loads). Therefore, the information for each class in the table is useful in comparing ongoing costs only, and will not help you determine the relative total costs of owning different funds. In addition, if these transactional costs were included, your costs would have been higher.
| | | Beginning
Account
Value
7/1/17 | | Actual Ending
Account
Value
12/31/17 | | Hypothetical
Ending Account
Value | | Actual
Expenses
Paid
During
Period* | | Hypothetical
Expenses Paid
During Period* | | Net
Expense
Ratio
During
Period** | |
Global Insight Portfolio Class I | | $ | 1,000.00 | | | $ | 1,091.70 | | | $ | 1,018.45 | | | $ | 7.06 | | | $ | 6.82 | | | | 1.34 | % | |
Global Insight Portfolio Class A | | | 1,000.00 | | | | 1,089.30 | | | | 1,016.69 | | | | 8.90 | | | | 8.59 | | | | 1.69 | | |
Global Insight Portfolio Class L | | | 1,000.00 | | | | 1,086.80 | | | | 1,014.17 | | | | 11.52 | | | | 11.12 | | | | 2.19 | | |
Global Insight Portfolio Class C | | | 1,000.00 | | | | 1,086.00 | | | | 1,012.91 | | | | 12.83 | | | | 12.38 | | | | 2.44 | | |
* Expenses are calculated using each Fund Class' annualized net expense ratio (as disclosed), multiplied by the average account value over the period, and multiplied by 184/365 (to reflect the most recent one-half year period).
** Annualized.
3
Morgan Stanley Institutional Fund, Inc.
Annual Report — December 31, 2017
Investment Overview (unaudited)
Global Insight Portfolio
The Fund seeks long-term capital appreciation.
Performance
For the year ended December 31, 2017, the Fund's Class I shares had a total return based on net asset value and reinvestment of distributions per share of 27.38%, net of fees. The Fund's Class I shares outperformed against the Fund's benchmark, the MSCI All Country World Index (the "Index"), which returned 23.97%.
Please keep in mind that double-digit returns are highly unusual and cannot be sustained. Investors should also be aware that these returns were primarily achieved during favorable market conditions.
Factors Affecting Performance
• Better-than-expected global economic growth and strong corporate profits provided a positive backdrop for global equity markets. Central bank policy remained largely accommodative as inflation stayed muted, recoveries continued in U.S., Europe and Japan, and China's economy stabilized. Although the U.S. Federal Reserve raised its interest rate three times during 2017, interest rate levels were still historically low, further boosting demand for equities. Political risk abated as key elections across Europe voted in more mainstream candidates, and trade negotiation fears also diminished somewhat, although the North American Free Trade Agreement ("NAFTA") and Brexit talks are ongoing. In the U.S., sweeping tax reforms were signed into law in December 2017, fueling a sharp rally in U.S. share prices at year-end. These events helped global equities shrug off geopolitical tensions in North Korea and the Middle East, and natural disasters in the U.S., to end the year sharply higher.
• All sectors in the Index showed positive performance for the year. The information technology (IT) sector led, followed by the materials and industrials sectors. Conversely, the energy, telecommunication services and utilities sectors were the biggest laggards in the Index.
• The long-term investment horizon and conviction-weighted investment approach embraced by the team can result in periods of performance deviation from the benchmark and peers. In this reporting period, the Fund's outperformance was driven by stock selection. Sector allocations had a neutral impact on relative results.
• The health care sector contributed the largest relative gain. Both stock selection and an overweight allocation in the sector were beneficial, led by the portfolio's holding in a Danish pharmaceutical company.
• Stock selection and an overweight exposure in the industrials sector added to relative results. An out-of-benchmark holding in a U.K.-based multinational provider of flight services to business and private aircraft was the main contributor in the sector.
• The Fund outperformed in the consumer discretionary sector due to favorable stock selection and an overweight allocation in the sector. A luxury apparel and goods brand was the top contributor in the sector and across the whole portfolio for the reporting period.
• Both stock selection and an underweight allocation in the information technology sector dampened relative performance. The Fund's underperformance was driven by an out-of-benchmark holding in a French commerce marketing technology leader, which helps internet retailers retarget online advertising toward consumers, as well as having less exposure to the overall IT sector, the Index's top-performing sector.
• The Fund's stock selection in the energy sector was disadvantageous to performance. A U.S.-based supplier of deep sea well drilling and oil rig equipment, which is not represented in the Index, underperformed in the reporting period.
Management Strategies
• There were no changes to our bottom-up investment process during the period. We seek to invest primarily in established and cyclical franchise companies that we believe have strong name recognition, sustainable competitive advantages, ample growth prospects, and are trading at an attractive discount to future cash flow generation capacity or asset value. We typically favor companies with the ability to generate attractive free cash flow yields. We utilize a bottom-up stock selection process, seeking attractive investments on an individual company basis. Our emphasis is on long-term results, and hence short-term market events are not as meaningful in the stock selection process.
4
Morgan Stanley Institutional Fund, Inc.
Annual Report — December 31, 2017
Investment Overview (unaudited) (cont'd)
Global Insight Portfolio
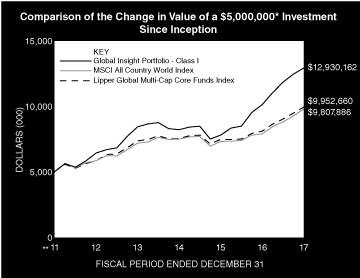
* Minimum Investment for Class I shares
** Commenced Operations on December 28, 2011.
In accordance with SEC regulations, the Fund's performance shown assumes that all recurring fees (including management fees) were deducted and all dividends and distributions were reinvested. The performance of Class A, L and C shares will vary from the performance of Class I shares and will be impacted by additional fees assessed to those classes.
Performance Compared to the MSCI All Country World Index(1) and the Lipper Global Multi-Cap Core Funds Index(2)
| | Period Ended December 31, 2017
Total Returns(3) | |
| | | | Average Annual | |
| | One
Year | | Five
Years | | Ten
Years | | Since
Inception(7) | |
Fund — Class I Shares
w/o sales charges(4) | | | 27.38 | % | | | 14.89 | % | | | — | | | | 17.13 | % | |
Fund — Class A Shares
w/o sales charges(4) | | | 26.99 | | | | 14.52 | | | | — | | | | 16.78 | | |
Fund — Class A Shares with
maximum 5.25% sales charges(4) | | | 20.28 | | | | 13.30 | | | | — | | | | 15.74 | | |
Fund — Class L Shares
w/o sales charges(4) | | | 26.35 | | | | 13.92 | | | | — | | | | 16.17 | | |
Fund — Class C Shares
w/o sales charges(5) | | | 26.09 | | | | — | | | | — | | | | 14.84 | | |
Fund — Class C Shares with
maximum 1.00% deferred
sales charges(5) | | | 25.09 | | | | — | | | | — | | | | 14.84 | | |
MSCI All Country World Index | | | 23.97 | | | | 10.80 | | | | — | | | | 11.87 | | |
Lipper Global Multi-Cap Core
Funds Index | | | 22.55 | | | | 11.16 | | | | — | | | | 12.14 | | |
Performance data quoted represents past performance, which is no guarantee of future results, and current performance may be lower or higher than the figures shown. Performance assumes that all dividends and distributions, if any, were reinvested. For the most recent month-end performance figures, please visit www.morganstanley.com/im. Investment return and principal value will fluctuate so that Fund shares, when redeemed, may be worth more or less than their original cost. Total returns do not reflect the deduction of taxes that a shareholder would pay on Fund distributions or the redemption of Fund shares. Performance of share classes will vary due to difference in sales charges and expenses.
(1) The MSCI All Country World Index (ACWI) is a free float-adjusted market capitalization weighted index designed to measure the equity market performance of developed and emerging markets. The term "free float" represents the portion of shares outstanding that are deemed to be available for purchase in the public equity markets by investors. The Index is unmanaged and its returns do not include any sales charges or fees. Such costs would lower performance. It is not possible to invest directly in an index.
(2) The Lipper Global Multi-Cap Core Funds Index is an equally weighted performance index of the largest qualifying funds (based on net assets) in the Lipper Global Multi-Cap Core Funds classification. The Index, which is adjusted for capital gains distributions and income dividends, is unmanaged and should not be considered an investment. There are currently 30 funds represented in this Index. As of the date of this report, the Fund is in the Lipper Global Multi-Cap Core Funds classification.
(3) Total returns for the Fund reflect fees waived and expenses reimbursed, if applicable, by the Adviser. Without such waivers and reimbursements, total returns would have been lower.
(4) Commenced operations on December 28, 2011.
(5) Commenced offering on April 30, 2015.
(6) For comparative purposes, average annual since inception returns listed for the Indexes refer to the inception date of Class I of the Fund, not the inception of the Index.
5
Morgan Stanley Institutional Fund, Inc.
Annual Report — December 31, 2017
Portfolio of Investments
Global Insight Portfolio
| | | Shares | | Value
(000) | |
Common Stocks (93.2%) | |
Brazil (5.5%) | |
JHSF Participacoes SA (a) | | | 90,283 | | | $ | 48 | | |
Ouro Fino Saude Animal Participacoes SA | | | 21,975 | | | | 159 | | |
Porto Seguro SA | | | 48,596 | | | | 532 | | |
| | | | 739 | | |
Canada (7.2%) | |
Agrium, Inc. | | | 5,673 | | | | 652 | | |
Ritchie Bros Auctioneers, Inc. | | | 10,250 | | | | 307 | | |
| | | | 959 | | |
Denmark (6.2%) | |
Novo Nordisk A/S Series B | | | 15,381 | | | | 827 | | |
France (14.6%) | |
Christian Dior SE | | | 3,219 | | | | 1,175 | | |
Criteo SA ADR (a) | | | 6,895 | | | | 179 | | |
Edenred | | | 20,819 | | | | 603 | | |
| | | | 1,957 | | |
Germany (6.1%) | |
ThyssenKrupp AG | | | 22,632 | | | | 657 | | |
Vapiano SE (a)(b) | | | 5,598 | | | | 163 | | |
| | | | 820 | | |
Italy (2.4%) | |
Brunello Cucinelli SpA | | | 3,826 | | | | 124 | | |
Gima TT SpA (a)(b) | | | 2,497 | | | | 49 | | |
Tamburi Investment Partners SpA | | | 22,621 | | | | 151 | | |
| | | | 324 | | |
New Zealand (0.8%) | |
Kathmandu Holdings Ltd. | | | 58,605 | | | | 101 | | |
Switzerland (4.2%) | |
Nestle SA (Registered) | | | 6,547 | | | | 563 | | |
United Kingdom (10.8%) | |
BBA Aviation PLC | | | 116,367 | | | | 549 | | |
Clarkson PLC | | | 6,168 | | | | 238 | | |
Whitbread PLC | | | 12,228 | | | | 661 | | |
| | | | 1,448 | | |
United States (35.4%) | |
Autoliv, Inc. | | | 4,049 | | | | 515 | | |
Biogen, Inc. (a) | | | 745 | | | | 237 | | |
Dril-Quip, Inc. (a) | | | 4,538 | | | | 216 | | |
Harley-Davidson, Inc. | | | 14,036 | | | | 714 | | |
Mosaic Co. (The) | | | 12,439 | | | | 319 | | |
Potbelly Corp. (a) | | | 5,760 | | | | 71 | | |
RenaissanceRe Holdings Ltd. | | | 4,657 | | | | 585 | | |
Time Warner, Inc. | | | 10,235 | | | | 936 | | |
United Technologies Corp. | | | 4,684 | | | | 598 | | |
Welbilt, Inc. (a) | | | 23,403 | | | | 550 | | |
| | | | 4,741 | | |
Total Common Stocks (Cost $10,476) | | | 12,479 | | |
| | | Shares | | Value
(000) | |
Short-Term Investment (5.3%) | |
Investment Company (5.3%) | |
Morgan Stanley Institutional Liquidity
Funds — Treasury Securities Portfolio —
Institutional Class (See Note G) (Cost $709) | | | 708,974 | | | $ | 709 | | |
Total Investments (98.5%) (Cost $11,185) (c)(d) | | | 13,188 | | |
Other Assets in Excess of Liabilities (1.5%) | | | 201 | | |
Net Assets (100.0%) | | $ | 13,389 | | |
Country assignments and aggregations are based generally on third party vendor classifications and information, and may be different from the assignments and aggregations under the policies set forth in the Fund's prospectus and/or statement of additional information relating to geographic classifications.
(a) Non-income producing security.
(b) 144A security — Certain conditions for public sale may exist. Unless otherwise noted, these securities are deemed to be liquid.
(c) The approximate fair value and percentage of net assets, $6,600,000 and 49.3%, respectively, represent the securities that have been fair valued under the fair valuation policy for international investments as described in Note A-1 within the Notes to the Financial Statements.
(d) At December 31, 2017, the aggregate cost for federal income tax purposes is approximately $11,311,000. The aggregate gross unrealized appreciation is approximately $2,060,000 and the aggregate gross unrealized depreciation is approximately $183,000, resulting in net unrealized appreciation of approximately $1,877,000.
ADR American Depositary Receipt.
Portfolio Composition
Classification | | Percentage of
Total Investments | |
Other* | | | 30.3 | % | |
Textiles, Apparel & Luxury Goods | | | 9.8 | | |
Insurance | | | 8.5 | | |
Pharmaceuticals | | | 7.5 | | |
Chemicals | | | 7.3 | | |
Media | | | 7.1 | | |
Commercial Services & Supplies | | | 6.9 | | |
Hotels, Restaurants & Leisure | | | 6.8 | | |
Automobiles | | | 5.4 | | |
Short-Term Investment | | | 5.4 | | |
Metals & Mining | | | 5.0 | | |
Total Investments | | | 100.0 | % | |
* Industries and/or investment types representing less than 5% of total investments.
The accompanying notes are an integral part of the financial statements.
6
Morgan Stanley Institutional Fund, Inc.
Annual Report — December 31, 2017
Statement of Assets and Liabilities | | December 31, 2017
(000) | |
Assets: | |
Investments in Securities of Unaffiliated Issuers, at Value (Cost $10,476) | | $ | 12,479 | | |
Investment in Security of Affiliated Issuer, at Value (Cost $709) | | | 709 | | |
Total Investments in Securities, at Value (Cost $11,185) | | | 13,188 | | |
Foreign Currency, at Value (Cost $1) | | | 1 | | |
Receivable for Investments Sold | | | 103 | | |
Due from Adviser | | | 56 | | |
Receivable for Fund Shares Sold | | | 51 | | |
Dividends Receivable | | | 22 | | |
Tax Reclaim Receivable | | | 7 | | |
Receivable from Affiliate | | | 1 | | |
Other Assets | | | 42 | | |
Total Assets | | | 13,471 | | |
Liabilities: | |
Payable for Professional Fees | | | 51 | | |
Payable for Custodian Fees | | | 19 | | |
Payable for Transfer Agency Fees — Class I | | | 1 | | |
Payable for Transfer Agency Fees — Class A | | | 1 | | |
Payable for Transfer Agency Fees — Class L | | | — | @ | |
Payable for Transfer Agency Fees — Class C | | | 1 | | |
Payable for Sub Transfer Agency Fees — Class I | | | 2 | | |
Payable for Sub Transfer Agency Fees — Class A | | | — | @ | |
Payable for Sub Transfer Agency Fees — Class L | | | — | @ | |
Payable for Sub Transfer Agency Fees — Class C | | | - | @ | |
Payable for Administration Fees | | | 1 | | |
Payable for Shareholder Services Fees- Class A | | | — | @ | |
Payable for Distribution and Shareholder Services Fees — Class L | | | — | @ | |
Payable for Distribution and Shareholder Services Fees — Class C | | | — | @ | |
Other Liabilities | | | 6 | | |
Total Liabilities | | | 82 | | |
Net Assets | | $ | 13,389 | | |
Net Assets Consist Of: | |
Paid-in-Capital | | $ | 11,363 | | |
Distributions in Excess of Net Investment Income | | | (57 | ) | |
Accumulated Undistributed Net Realized Gain | | | 79 | | |
Unrealized Appreciation (Depreciation) on: | |
Investments | | | 2,003 | | |
Foreign Currency Translations | | | 1 | | |
Net Assets | | $ | 13,389 | | |
The accompanying notes are an integral part of the financial statements.
7
Morgan Stanley Institutional Fund, Inc.
Annual Report — December 31, 2017
Statement of Assets and Liabilities (cont'd) | | December 31, 2017
(000) | |
CLASS I: | |
Net Assets | | $ | 10,680 | | |
| Shares Outstanding $0.001 par value shares of beneficial interest (unlimited shares authorized) (not in 000's) | | | 722,904 | | |
Net Asset Value, Offering and Redemption Price Per Share | | $ | 14.77 | | |
CLASS A: | |
Net Assets | | $ | 2,315 | | |
| Shares Outstanding $0.001 par value shares of beneficial interest (unlimited shares authorized) (not in 000's) | | | 156,580 | | |
Net Asset Value, Redemption Price Per Share | | $ | 14.78 | | |
Maximum Sales Load | | | 5.25 | % | |
Maximum Sales Charge | | $ | 0.82 | | |
Maximum Offering Price Per Share | | $ | 15.60 | | |
CLASS L: | |
Net Assets | | $ | 90 | | |
| Shares Outstanding $0.001 par value shares of beneficial interest (unlimited shares authorized) (not in 000's) | | | 6,157 | | |
Net Asset Value, Offering and Redemption Price Per Share | | $ | 14.56 | | |
CLASS C: | |
Net Assets | | $ | 304 | | |
| Shares Outstanding $0.001 par value shares of beneficial interest (unlimited shares authorized) (not in 000's) | | | 21,061 | | |
Net Asset Value, Offering and Redemption Price Per Share | | $ | 14.46 | | |
@ Amount is less than $500.
The accompanying notes are an integral part of the financial statements.
8
Morgan Stanley Institutional Fund, Inc.
Annual Report — December 31, 2017
Statement of Operations | | Year Ended
December 31, 2017
(000) | |
Investment Income: | |
Dividends from Securities of Unaffiliated Issuers (Net of $19 of Foreign Taxes Withheld) | | $ | 191 | | |
Dividends from Security of Affiliated Issuer (Note G) | | | 7 | | |
Income from Securities Loaned — Net | | | 2 | | |
Total Investment Income | | | 200 | | |
Expenses: | |
Professional Fees | | | 123 | | |
Advisory Fees (Note B) | | | 114 | | |
Registration Fees | | | 54 | | |
Custodian Fees (Note F) | | | 31 | | |
Shareholder Reporting Fees | | | 15 | | |
Sub Transfer Agency Fees — Class I | | | 9 | | |
Sub Transfer Agency Fees — Class A | | | 1 | | |
Sub Transfer Agency Fees — Class L | | | — | @ | |
Sub Transfer Agency Fees — Class C | | | — | @ | |
Transfer Agency Fees — Class I (Note E) | | | 3 | | |
Transfer Agency Fees — Class A (Note E) | | | 3 | | |
Transfer Agency Fees — Class L (Note E) | | | 2 | | |
Transfer Agency Fees — Class C (Note E) | | | 2 | | |
Administration Fees (Note C) | | | 9 | | |
Shareholder Services Fees — Class A (Note D) | | | 4 | | |
Distribution and Shareholder Services Fees — Class L (Note D) | | | 1 | | |
Distribution and Shareholder Services Fees — Class C (Note D) | | | 2 | | |
Pricing Fees | | | 6 | | |
Directors' Fees and Expenses | | | 4 | | |
Other Expenses | | | 18 | | |
Total Expenses | | | 401 | | |
Waiver of Advisory Fees (Note B) | | | (114 | ) | |
Expenses Reimbursed by Adviser (Note B) | | | (103 | ) | |
Reimbursement of Class Specific Expenses — Class I (Note B) | | | (12 | ) | |
Reimbursement of Class Specific Expenses — Class A (Note B) | | | (3 | ) | |
Reimbursement of Class Specific Expenses — Class L (Note B) | | | (2 | ) | |
Reimbursement of Class Specific Expenses — Class C (Note B) | | | (2 | ) | |
Rebate from Morgan Stanley Affiliate (Note G) | | | (2 | ) | |
Net Expenses | | | 163 | | |
Net Investment Income | | | 37 | | |
Realized Gain: | |
Investments Sold | | | 1,334 | | |
Foreign Currency Transactions | | | 2 | | |
Realized Gain | | | 1,336 | | |
Change in Unrealized Appreciation (Depreciation): | |
Investments | | | 1,332 | | |
Foreign Currency Translations | | | 1 | | |
Net Change in Unrealized Appreciation (Depreciation) | | | 1,333 | | |
Net Realized Gain and Change in Unrealized Appreciation (Depreciation) | | | 2,669 | | |
Net Increase in Net Assets Resulting from Operations | | $ | 2,706 | | |
@ Amount is less than $500.
The accompanying notes are an integral part of the financial statements.
9
Morgan Stanley Institutional Fund, Inc.
Annual Report — December 31, 2017
Statements of Changes in Net Assets | | Year Ended
December 31, 2017
(000) | | Year Ended
December 31, 2016
(000) | |
Increase in Net Assets: | |
Operations: | |
Net Investment Income | | $ | 37 | | | $ | 14 | | |
Net Realized Gain | | | 1,336 | | | | 88 | | |
Net Change in Unrealized Appreciation (Depreciation) | | | 1,333 | | | | 842 | | |
Net Increase in Net Assets Resulting from Operations | | | 2,706 | | | | 944 | | |
Distributions from and/or in Excess of: | |
Class I: | |
Net Investment Income | | | (88 | ) | | | (17 | ) | |
Net Realized Gain | | | (953 | ) | | | (85 | ) | |
Class A: | |
Net Investment Income | | | (14 | ) | | | — | | |
Net Realized Gain | | | (208 | ) | | | (6 | ) | |
Class L: | |
Net Investment Income | | | (— | @) | | | — | | |
Net Realized Gain | | | (9 | ) | | | (1 | ) | |
Class C: | |
Net Investment Income | | | (— | @) | | | — | | |
Net Realized Gain | | | (29 | ) | | | (1 | ) | |
Total Distributions | | | (1,301 | ) | | | (110 | ) | |
Capital Share Transactions:(1) | |
Class I: | |
Subscribed | | | 6,465 | | | | 5,646 | | |
Distributions Reinvested | | | 1,039 | | | | 102 | | |
Redeemed | | | (5,795 | ) | | | (308 | ) | |
Class A: | |
Subscribed | | | 1,911 | | | | 958 | | |
Distributions Reinvested | | | 220 | | | | 6 | | |
Redeemed | | | (426 | ) | | | (901 | ) | |
Class L: | |
Exchanged | | | — | | | | 23 | | |
Distributions Reinvested | | | 7 | | | | 1 | | |
Redeemed | | | (— | @) | | | (48 | ) | |
Class C: | |
Subscribed | | | 211 | | | | 225 | | |
Distributions Reinvested | | | 28 | | | | 1 | | |
Redeemed | | | (60 | ) | | | (152 | ) | |
Net Increase in Net Assets Resulting from Capital Share Transactions | | | 3,600 | | | | 5,553 | | |
Total Increase in Net Assets | | | 5,005 | | | | 6,387 | | |
Net Assets: | |
Beginning of Period | | | 8,384 | | | | 1,997 | | |
End of Period (Including Distributions in Excess of Net Investment Income of $(57) and $(13)) | | $ | 13,389 | | | $ | 8,384 | | |
The accompanying notes are an integral part of the financial statements.
10
Morgan Stanley Institutional Fund, Inc.
Annual Report — December 31, 2017
Statements of Changes in Net Assets (cont'd) | | Year Ended
December 31, 2017
(000) | | Year Ended
December 31, 2016
(000) | |
(1) Capital Share Transactions: | |
Class I: | |
Shares Subscribed | | | 443 | | | | 457 | | |
Shares Issued on Distributions Reinvested | | | 71 | | | | 8 | | |
Shares Redeemed | | | (387 | ) | | | (24 | ) | |
Net Increase in Class I Shares Outstanding | | | 127 | | | | 441 | | |
Class A: | |
Shares Subscribed | | | 129 | | | | 85 | | |
Shares Issued on Distributions Reinvested | | | 15 | | | | 1 | | |
Shares Redeemed | | | (29 | ) | | | (78 | ) | |
Net Increase in Class A Shares Outstanding | | | 115 | | | | 8 | | |
Class L: | |
Shares Exchanged | | | — | | | | 2 | | |
Shares Issued on Distributions Reinvested | | | — | @@ | | | — | @@ | |
Shares Redeemed | | | (— | @@) | | | (5 | ) | |
Net Increase (Decrease) in Class L Shares Outstanding | | | — | @@ | | | (3 | ) | |
Class C: | |
Shares Subscribed | | | 15 | | | | 19 | | |
Shares Issued on Distributions Reinvested | | | 2 | | | | — | @@ | |
Shares Redeemed | | | (4 | ) | | | (13 | ) | |
Net Increase in Class C Shares Outstanding | | | 13 | | | | 6 | | |
@ Amount is less than $500.
@@ Amount is less than 500 shares.
The accompanying notes are an integral part of the financial statements.
11
Morgan Stanley Institutional Fund, Inc.
Annual Report — December 31, 2017
Financial Highlights
Global Insight Portfolio
| | | Class I | |
| | | Year Ended December 31, | |
Selected Per Share Data and Ratios | | 2017 | | 2016(1) | | 2015 | | 2014 | | 2013 | |
Net Asset Value, Beginning of Period | | $ | 12.89 | | | $ | 10.07 | | | $ | 11.55 | | | $ | 13.42 | | | $ | 11.99 | | |
Income (Loss) from Investment Operations: | |
Net Investment Income(2) | | | 0.06 | | | | 0.06 | | | | 0.07 | | | | 0.20 | | | | 0.30 | | |
Net Realized and Unrealized Gain (Loss) | | | 3.44 | | | | 2.94 | | | | (0.62 | ) | | | (0.56 | ) | | | 3.32 | | |
Total from Investment Operations | | | 3.50 | | | | 3.00 | | | | (0.55 | ) | | | (0.36 | ) | | | 3.62 | | |
Distributions from and/or in Excess of: | |
Net Investment Income | | | (0.14 | ) | | | (0.03 | ) | | | (0.18 | ) | | | (0.11 | ) | | | (0.45 | ) | |
Net Realized Gain | | | (1.48 | ) | | | (0.15 | ) | | | (0.75 | ) | | | (1.40 | ) | | | (1.74 | ) | |
Total Distributions | | | (1.62 | ) | | | (0.18 | ) | | | (0.93 | ) | | | (1.51 | ) | | | (2.19 | ) | |
Net Asset Value, End of Period | | $ | 14.77 | | | $ | 12.89 | | | $ | 10.07 | | | $ | 11.55 | | | $ | 13.42 | | |
Total Return(3) | | | 27.38 | % | | | 29.83 | % | | | (5.02 | )% | | | (2.65 | )% | | | 30.89 | % | |
Ratios and Supplemental Data: | |
Net Assets, End of Period (Thousands) | | $ | 10,680 | | | $ | 7,676 | | | $ | 1,560 | | | $ | 1,490 | | | $ | 1,397 | | |
Ratio of Expenses to Average Net Assets(6) | | | 1.34 | %(4) | | | 1.34 | %(4) | | | 1.35 | %(4) | | | 1.35 | %(4) | | | 1.35 | %(4) | |
Ratio of Net Investment Income to Average Net Assets(6) | | | 0.41 | %(4) | | | 0.56 | %(4) | | | 0.58 | %(4) | | | 1.49 | %(4) | | | 2.17 | %(4) | |
Ratio of Rebate from Morgan Stanley Affiliates to Average Net Assets | | | 0.01 | % | | | 0.01 | % | | | 0.00 | %(5) | | | 0.00 | %(5) | | | 0.00 | %(5) | |
Portfolio Turnover Rate | | | 67 | % | | | 54 | % | | | 62 | % | | | 67 | % | | | 59 | % | |
(6) Supplemental Information on the Ratios to Average Net Assets: | |
Ratios Before Expense Limitation: | |
Expenses to Average Net Assets | | | 3.38 | % | | | 7.58 | % | | | 10.84 | % | | | 10.82 | % | | | 14.22 | % | |
Net Investment Loss to Average Net Assets | | | (1.63 | )% | | | (5.68 | )% | | | (8.91 | )% | | | (7.98 | )% | | | (10.70 | )% | |
(1) Reflects prior period custodian out-of-pocket expenses that were reimbursed in September 2016. The amount of the reimbursement was immaterial on a per share basis and did not impact the total return of Class I shares. The Ratio of Expenses to Average Net Assets and the Ratio of Net Investment Income to Average Net Assets would be unchanged as the reimbursement of custodian fees was offset against expense waivers/reimbursements with no impact to net expenses or net investment income.
(2) Per share amount is based on average shares outstanding.
(3) Calculated based on the net asset value as of the last business day of the period.
(4) The Ratios of Expenses and Net Investment Income reflect the rebate of certain Fund expenses in connection with the investments in Morgan Stanley affiliates during the period. The effect of the rebate on the ratios is disclosed in the above table as "Ratio of Rebate from Morgan Stanley Affiliates to Average Net Assets."
(5) Amount is less than 0.005%.
The accompanying notes are an integral part of the financial statements.
12
Morgan Stanley Institutional Fund, Inc.
Annual Report — December 31, 2017
Financial Highlights
Global Insight Portfolio
| | | Class A | |
| | | Year Ended December 31, | |
Selected Per Share Data and Ratios | | 2017 | | 2016(1) | | 2015 | | 2014 | | 2013 | |
Net Asset Value, Beginning of Period | | $ | 12.91 | | | $ | 10.10 | | | $ | 11.58 | | | $ | 13.45 | | | $ | 11.99 | | |
Income (Loss) from Investment Operations: | |
Net Investment Income (Loss)(2) | | | 0.00 | (3) | | | (0.01 | ) | | | 0.02 | | | | 0.15 | | | | 0.01 | | |
Net Realized and Unrealized Gain (Loss) | | | 3.45 | | | | 2.97 | | | | (0.61 | ) | | | (0.55 | ) | | | 3.56 | | |
Total from Investment Operations | | | 3.45 | | | | 2.96 | | | | (0.59 | ) | | | (0.40 | ) | | | 3.57 | | |
Distributions from and/or in Excess of: | |
Net Investment Income | | | (0.10 | ) | | | — | | | | (0.14 | ) | | | (0.07 | ) | | | (0.37 | ) | |
Net Realized Gain | | | (1.48 | ) | | | (0.15 | ) | | | (0.75 | ) | | | (1.40 | ) | | | (1.74 | ) | |
Total Distributions | | | (1.58 | ) | | | (0.15 | ) | | | (0.89 | ) | | | (1.47 | ) | | | (2.11 | ) | |
Net Asset Value, End of Period | | $ | 14.78 | | | $ | 12.91 | | | $ | 10.10 | | | $ | 11.58 | | | $ | 13.45 | | |
Total Return(4) | | | 26.99 | % | | | 29.34 | % | | | (5.32 | )% | | | (2.97 | )% | | | 30.52 | % | |
Ratios and Supplemental Data: | |
Net Assets, End of Period (Thousands) | | $ | 2,315 | | | $ | 535 | | | $ | 335 | | | $ | 199 | | | $ | 189 | | |
Ratio of Expenses to Average Net Assets(8) | | | 1.69 | %(5) | | | 1.69 | %(5) | | | 1.70 | %(5) | | | 1.70 | %(5) | | | 1.60 | %(5)(6) | |
Ratio of Net Investment Income (Loss) to Average Net Assets(8) | | | 0.02 | %(5) | | | (0.05 | )%(5) | | | 0.17 | %(5) | | | 1.14 | %(5) | | | 0.07 | %(5) | |
Ratio of Rebate from Morgan Stanley Affiliates to Average Net Assets | | | 0.01 | % | | | 0.01 | % | | | 0.00 | %(7) | | | 0.00 | %(7) | | | 0.01 | % | |
Portfolio Turnover Rate | | | 67 | % | | | 54 | % | | | 62 | % | | | 67 | % | | | 59 | % | |
(8) Supplemental Information on the Ratios to Average Net Assets: | |
Ratios Before Expense Limitation: | |
Expenses to Average Net Assets | | | 3.80 | % | | | 8.39 | % | | | 11.74 | % | | | 12.14 | % | | | 13.62 | % | |
Net Investment Loss to Average Net Assets | | | (2.09 | )% | | | (6.75 | )% | | | (9.87 | )% | | | (9.30 | )% | | | (11.95 | )% | |
(1) Reflects prior period custodian out-of-pocket expenses that were reimbursed in September 2016. The amount of the reimbursement was immaterial on a per share basis and did not impact the total return of Class A shares. The Ratio of Expenses to Average Net Assets and the Ratio of Net Investment Loss to Average Net Assets would be unchanged as the reimbursement of custodian fees was offset against expense waivers/reimbursements with no impact to net expenses or net investment loss.
(2) Per share amount is based on average shares outstanding.
(3) Amount is less than $0.005 per share.
(4) Calculated based on the net asset value which does not reflect sales charges, if applicable, as of the last business day of the period.
(5) The Ratios of Expenses and Net Investment Income (Loss) reflect the rebate of certain Fund expenses in connection with the investments in Morgan Stanley affiliates during the period. The effect of the rebate on the ratios is disclosed in the above table as "Ratio of Rebate from Morgan Stanley Affiliates to Average Net Assets."
(6) Effective September 16, 2013, the Adviser has agreed to limit the ratio of expenses to average net assets to the maximum ratio of 1.70% for Class A shares. Prior to September 16, 2013, the maximum ratio was 1.60% for Class A shares.
(7) Amount is less than 0.005%.
The accompanying notes are an integral part of the financial statements.
13
Morgan Stanley Institutional Fund, Inc.
Annual Report — December 31, 2017
Financial Highlights
Global Insight Portfolio
| | | Class L | |
| | | Year Ended December 31, | |
Selected Per Share Data and Ratios | | 2017 | | 2016(1) | | 2015 | | 2014 | | 2013 | |
Net Asset Value, Beginning of Period | | $ | 12.73 | | | $ | 10.01 | | | $ | 11.49 | | | $ | 13.39 | | | $ | 11.98 | | |
Income (Loss) from Investment Operations: | |
Net Investment Income (Loss)(2) | | | (0.07 | ) | | | (0.05 | ) | | | (0.03 | ) | | | 0.08 | | | | 0.12 | | |
Net Realized and Unrealized Gain (Loss) | | | 3.39 | | | | 2.92 | | | | (0.61 | ) | | | (0.54 | ) | | | 3.37 | | |
Total from Investment Operations | | | 3.32 | | | | 2.87 | | | | (0.64 | ) | | | (0.46 | ) | | | 3.49 | | |
Distributions from and/or in Excess of: | |
Net Investment Income | | | (0.01 | ) | | | — | | | | (0.09 | ) | | | (0.04 | ) | | | (0.34 | ) | |
Net Realized Gain | | | (1.48 | ) | | | (0.15 | ) | | | (0.75 | ) | | | (1.40 | ) | | | (1.74 | ) | |
Total Distributions | | | (1.49 | ) | | | (0.15 | ) | | | (0.84 | ) | | | (1.44 | ) | | | (2.08 | ) | |
Net Asset Value, End of Period | | $ | 14.56 | | | $ | 12.73 | | | $ | 10.01 | | | $ | 11.49 | | | $ | 13.39 | | |
Total Return(3) | | | 26.35 | % | | | 28.70 | % | | | (5.87 | )% | | | (3.43 | )% | | | 29.82 | % | |
Ratios and Supplemental Data: | |
Net Assets, End of Period (Thousands) | | $ | 90 | | | $ | 72 | | | $ | 86 | | | $ | 26 | | | $ | 13 | | |
Ratio of Expenses to Average Net Assets(7) | | | 2.19 | %(4) | | | 2.19 | %(4) | | | 2.20 | %(4) | | | 2.20 | %(4) | | | 2.13 | %(4)(5) | |
Ratio of Net Investment Income (Loss) to Average Net Assets(7) | | | (0.48 | )%(4) | | | (0.43 | )%(4) | | | (0.26 | )%(4) | | | 0.64 | %(4) | | | 0.93 | %(4) | |
Ratio of Rebate from Morgan Stanley Affiliates to Average Net Assets | | | 0.01 | % | | | 0.01 | % | | | 0.00 | %(6) | | | 0.00 | %(6) | | | 0.00 | %(6) | |
Portfolio Turnover Rate | | | 67 | % | | | 54 | % | | | 62 | % | | | 67 | % | | | 59 | % | |
(7) Supplemental Information on the Ratios to Average Net Assets: | |
Ratios Before Expense Limitation: | |
Expenses to Average Net Assets | | | 6.43 | % | | | 11.57 | % | | | 17.24 | % | | | 20.95 | % | | | 17.73 | % | |
Net Investment Loss to Average Net Assets | | | (4.72 | )% | | | (9.81 | )% | | | (15.30 | )% | | | (18.11 | )% | | | (14.67 | )% | |
(1) Reflects prior period custodian out-of-pocket expenses that were reimbursed in September 2016. The amount of the reimbursement was immaterial on a per share basis and did not impact the total return of Class L shares. The Ratio of Expenses to Average Net Assets and the Ratio of Net Investment Loss to Average Net Assets would be unchanged as the reimbursement of custodian fees was offset against expense waivers/reimbursements with no impact to net expenses or net investment loss.
(2) Per share amount is based on average shares outstanding.
(3) Calculated based on the net asset value as of the last business day of the period.
(4) The Ratios of Expenses and Net Investment Income (Loss) reflect the rebate of certain Fund expenses in connection with the investments in Morgan Stanley affiliates during the period. The effect of the rebate on the ratios is disclosed in the above table as "Ratio of Rebate from Morgan Stanley Affiliates to Average Net Assets."
(5) Effective September 16, 2013, the Adviser has agreed to limit the ratio of expenses to average net assets to the maximum ratio of 2.20% for Class L shares. Prior to September 16, 2013, the maximum ratio was 2.10% for Class L shares.
(6) Amount is less than 0.005%.
The accompanying notes are an integral part of the financial statements.
14
Morgan Stanley Institutional Fund, Inc.
Annual Report — December 31, 2017
Financial Highlights
Global Insight Portfolio
| | | Class C | |
| | | Year Ended December 31, | | Period from
April 30, 2015(2) to | |
Selected Per Share Data and Ratios | | 2017 | | 2016(1) | | December 31, 2015 | |
Net Asset Value, Beginning of Period | | $ | 12.67 | | | $ | 9.99 | | | $ | 12.10 | | |
Income (Loss) from Investment Operations: | |
Net Investment Loss(3) | | | (0.10 | ) | | | (0.11 | ) | | | (0.07 | ) | |
Net Realized and Unrealized Gain (Loss) | | | 3.38 | | | | 2.94 | | | | (1.19 | ) | |
Total from Investment Operations | | | 3.28 | | | | 2.83 | | | | (1.26 | ) | |
Distributions from and/or in Excess of: | |
Net Investment Income | | | (0.01 | ) | | | — | | | | (0.10 | ) | |
Net Realized Gain | | | (1.48 | ) | | | (0.15 | ) | | | (0.75 | ) | |
Total Distributions | | | (1.49 | ) | | | (0.15 | ) | | | (0.85 | ) | |
Net Asset Value, End of Period | | $ | 14.46 | | | $ | 12.67 | | | $ | 9.99 | | |
Total Return(4) | | | 26.09 | % | | | 28.49 | % | | | (10.67 | )%(7) | |
Ratios and Supplemental Data: | |
Net Assets, End of Period (Thousands) | | $ | 304 | | | $ | 101 | | | $ | 16 | | |
Ratio of Expenses to Average Net Assets(9) | | | 2.44 | %(5) | | | 2.44 | %(5) | | | 2.45 | %(5)(8) | |
Ratio of Net Investment Loss to Average Net Assets(9) | | | (0.71 | )%(5) | | | (0.89 | )%(5) | | | (0.94 | )%(5)(8) | |
Ratio of Rebate from Morgan Stanley Affiliates to Average Net Assets | | | 0.01 | % | | | 0.01 | % | | | 0.00 | %(6)(8) | |
Portfolio Turnover Rate | | | 67 | % | | | 54 | % | | | 62 | % | |
(9) Supplemental Information on the Ratios to Average Net Assets: | |
Ratios Before Expense Limitation: | |
Expenses to Average Net Assets | | | 5.29 | % | | | 12.17 | % | | | 23.24 | %(8) | |
Net Investment Loss to Average Net Assets | | | (3.56 | )% | | | (10.62 | )% | | | (21.73 | )%(8) | |
(1) Reflects prior period custodian out-of-pocket expenses that were reimbursed in September 2016. The amount of the reimbursement was immaterial on a per share basis and did not impact the total return of Class C shares. The Ratio of Expenses to Average Net Assets and the Ratio of Net Investment Loss to Average Net Assets would be unchanged as the reimbursement of custodian fees was offset against expense waivers/reimbursements with no impact to net expenses or net investment loss.
(2) Commencement of Offering.
(3) Per share amount is based on average shares outstanding.
(4) Calculated based on the net asset value which does not reflect sales charges, if applicable, as of the last business day of the period.
(5) The Ratios of Expenses and Net Investment Loss reflect the rebate of certain Fund expenses in connection with the investments in Morgan Stanley affiliates during the period. The effect of the rebate on the ratios is disclosed in the above table as "Ratio of Rebate from Morgan Stanley Affiliates to Average Net Assets."
(6) Amount is less than 0.005%.
(7) Not annualized.
(8) Annualized.
The accompanying notes are an integral part of the financial statements.
15
Morgan Stanley Institutional Fund, Inc.
Annual Report — December 31, 2017
Notes to Financial Statements
Morgan Stanley Institutional Fund, Inc. (the "Company") is registered under the Investment Company Act of 1940, as amended (the "Act"), as an open-end management investment company. The Company is comprised of twenty-nine separate, active, diversified and non-diversified funds (individually referred to as a "Fund", collectively as the "Funds"). The Company applies investment company accounting and reporting guidance.
The accompanying financial statements relate to the Global Insight Portfolio. The Fund seeks long-term capital appreciation.
The Fund offers four classes of shares — Class I, Class A, Class L and Class C. On April 30, 2015, the Fund suspended offering of Class L shares. Existing Class L shareholders may invest through reinvestment of dividends and distributions.
A. Significant Accounting Policies: The following significant accounting policies are in conformity with U.S. generally accepted accounting principles ("GAAP"). Such policies are consistently followed by the Company in the preparation of its financial statements. GAAP may require management to make estimates and assumptions that affect the reported amounts and disclosures in the financial statements. Actual results may differ from those estimates.
1. Security Valuation: (1) An equity portfolio security listed or traded on an exchange is valued at its latest reported sales price (or at the exchange official closing price if such exchange reports an official closing price), and if there were no sales on a given day and if there is no official exchange closing price for that day, the security is valued at the mean between the last reported bid and asked prices if such bid and asked prices are available on the relevant exchanges. Listed equity securities not traded on the valuation date with no reported bid and asked prices available on the exchange are valued at the mean between the current bid and asked prices obtained from one or more reputable brokers or dealers. In cases where a security is traded on more than one exchange, the security is valued on the exchange designated as the primary market; (2) all other equity portfolio securities for which over-the-counter ("OTC") market quotations are readily available are valued at the latest reported sales price (or at the market official closing price if such market reports an official closing price), and if there was no trading in the security on a given day and if there is no official closing price from relevant markets for that day, the security is valued at the
mean between the last reported bid and asked prices if such bid and asked prices are available on the relevant markets. An unlisted equity security that does not trade on the valuation date and for which bid and asked prices from the relevant markets are unavailable is valued at the mean between the current bid and asked prices obtained from one or more reputable brokers or dealers; (3) certain portfolio securities may be valued by an outside pricing service/vendor approved by the Company's Board of Directors (the "Directors"). The pricing service/vendor may employ a pricing model that takes into account, among other things, bids, yield spreads, and/or other market data and specific security characteristics. Alternatively, if a valuation is not available from an outside pricing service/vendor, and the security trades on an exchange, the security may be valued at its latest reported sale price (or at the exchange official closing price if such exchange reports an official closing price), prior to the time when assets are valued. If there are no sales on a given day and if there is no official exchange closing price for that day, the security is valued at the mean between the last reported bid and asked prices if such bid and asked prices are available in the relevant exchanges; (4) when market quotations are not readily available, including circumstances under which Morgan Stanley Investment Management Inc. (the "Adviser") determines that the closing price, last sale price or the mean between the last reported bid and asked prices are not reflective of a security's market value, portfolio securities are valued at their fair value as determined in good faith under procedures established by and under the general supervision of the Directors. Occasionally, developments affecting the closing prices of securities and other assets may occur between the times at which valuations of such securities are determined (that is, close of the foreign market on which the securities trade) and the close of business of the New York Stock Exchange ("NYSE"). If developments occur during such periods that are expected to materially affect the value of such securities, such valuations may be adjusted to reflect the estimated fair value of such securities as of the close of the NYSE, as determined in good faith by the Directors or by the Adviser using a pricing service and/or procedures approved by the Directors; (5) quotations of foreign portfolio securities, other assets and liabilities and forward contracts stated in foreign currency are translated into U.S. dollar equivalents at the prevailing market rates prior to the close of the NYSE; and
16
Morgan Stanley Institutional Fund, Inc.
Annual Report — December 31, 2017
Notes to Financial Statements (cont'd)
(6) investments in mutual funds, including the Morgan Stanley Institutional Liquidity Funds, are valued at the net asset value ("NAV") as of the close of each business day.
The Directors have responsibility for determining in good faith the fair value of the investments, and the Directors may appoint others, such as the Company's Adviser or a valuation committee, to assist the Directors in determining fair value and to make the actual calculations pursuant to the fair valuation methodologies previously approved by the Directors. Under procedures approved by the Directors, the Company's Adviser has formed a Valuation Committee whose members are approved by the Directors. The Valuation Committee provides administration and oversight of the Company's valuation policies and procedures, which are reviewed at least annually by the Directors. These procedures allow the Company to utilize independent pricing services, quotations from securities and financial instrument dealers, and other market sources to determine fair value.
The Company has procedures to determine the fair value of securities and other financial instruments for which market prices are not readily available. Under these procedures, the Valuation Committee convenes on a regular and ad hoc basis to review such securities and considers a number of factors, including valuation methodologies and significant unobservable valuation inputs, when arriving at fair value. The Valuation Committee may employ a market-based approach which may use related or comparable assets or liabilities, recent transactions, market multiples, book values, and other relevant information for the investment to determine the fair value of the investment. An income-based valuation approach may also be used in which the anticipated future cash flows of the investment are discounted to calculate fair value. Discounts may also be applied due to the nature or duration of any restrictions on the disposition of the investments. Due to the inherent uncertainty of valuations of such investments, the fair values may differ significantly from the values that would have been used had an active market existed. The Valuation Committee employs various methods for calibrating these valuation approaches including a regular review of valuation methodologies, key inputs and assumptions, transactional back-testing or disposition analysis, and reviews of any related market activity.
2. Fair Value Measurement: Financial Accounting Standards Board ("FASB") Accounting Standards CodificationTM ("ASC") 820, "Fair Value Measurement" ("ASC 820"), defines fair value as the value that the Fund would receive to sell an investment or pay to transfer a liability in a timely transaction with an independent buyer in the principal market, or in the absence of a principal market, the most advantageous market for the investment or liability. ASC 820 establishes a three-tier hierarchy to distinguish between (1) inputs that reflect the assumptions market participants would use in valuing an asset or liability developed based on market data obtained from sources independent of the reporting entity (observable inputs) and (2) inputs that reflect the reporting entity's own assumptions about the assumptions market participants would use in valuing an asset or liability developed based on the best information available in the circumstances (unobservable inputs) and to establish classification of fair value measurements for disclosure purposes. Various inputs are used in determining the value of the Fund's investments. The inputs are summarized in the three broad levels listed below.
• Level 1 – unadjusted quoted prices in active markets for identical investments
• Level 2 – other significant observable inputs (including quoted prices for similar investments, interest rates, prepayment speeds, credit risk, etc.)
• Level 3 – significant unobservable inputs including the Fund's own assumptions in determining the fair value of investments. Factors considered in making this determination may include, but are not limited to, information obtained by contacting the issuer, analysts, or the appropriate stock exchange (for exchange-traded securities), analysis of the issuer's financial statements or other available documents and, if necessary, available information concerning other securities in similar circumstances
The inputs or methodology used for valuing securities are not necessarily an indication of the risk associated with investing in those securities and the determination of the significance of a particular input to the fair value
17
Morgan Stanley Institutional Fund, Inc.
Annual Report — December 31, 2017
Notes to Financial Statements (cont'd)
measurement in its entirety requires judgment and considers factors specific to each security.
The following is a summary of the inputs used to value the Fund's investments as of December 31, 2017.
Investment Type | | Level 1
Unadjusted
quoted
prices
(000) | | Level 2
Other
significant
observable
inputs
(000) | | Level 3
Significant
unobservable
inputs
(000) | | Total
(000) | |
Assets: | |
Common Stocks | |
Aerospace & Defense | | $ | 598 | | | $ | — | | | $ | — | | | $ | 598 | | |
Auto Components | | | 515 | | | | — | | | | — | | | | 515 | | |
Automobiles | | | 714 | | | | — | | | | — | | | | 714 | | |
Biotechnology | | | 237 | | | | — | | | | — | | | | 237 | | |
Capital Markets | | | — | | | | 151 | | | | — | | | | 151 | | |
Chemicals | | | 971 | | | | — | | | | — | | | | 971 | | |
Commercial Services &
Supplies | | | 307 | | | | 603 | | | | — | | | | 910 | | |
Energy Equipment &
Services | | | 216 | | | | — | | | | — | | | | 216 | | |
Food Products | | | — | | | | 563 | | | | — | | | | 563 | | |
Hotels, Restaurants &
Leisure | | | 71 | | | | 824 | | | | — | | | | 895 | | |
Insurance | | | 585 | | | | 532 | | | | — | | | | 1,117 | | |
Internet Software &
Services | | | 179 | | | | — | | | | — | | | | 179 | | |
Machinery | | | 550 | | | | 49 | | | | — | | | | 599 | | |
Marine | | | — | | | | 238 | | | | — | | | | 238 | | |
Media | | | 936 | | | | — | | | | — | | | | 936 | | |
Metals & Mining | | | — | | | | 657 | | | | — | | | | 657 | | |
Pharmaceuticals | | | — | | | | 986 | | | | — | | | | 986 | | |
Real Estate Management &
Development | | | — | | | | 48 | | | | — | | | | 48 | | |
Specialty Retail | | | — | | | | 101 | | | | — | | | | 101 | | |
Textiles, Apparel & Luxury
Goods | | | — | | | | 1,299 | | | | — | | | | 1,299 | | |
Transportation
Infrastructure | | | — | | | | 549 | | | | — | | | | 549 | | |
Total Common Stocks | | | 5,879 | | | | 6,600 | | | | — | | | | 12,479 | | |
Short-Term Investment | |
Investment Company | | | 709 | | | | — | | | | — | | | | 709 | | |
Total Assets | | $ | 6,588 | | | $ | 6,600 | | | $ | — | | | $ | 13,188 | | |
Transfers between investment levels may occur as the markets fluctuate and/or the availability of data used in an investment's valuation changes. The Fund recognizes transfers between the levels as of the end of the period. As of December 31, 2017, securities with a total value of approximately $5,401,000 transferred from Level 1 to Level 2. Securities that were valued using unadjusted quoted prices at December 31, 2016 were valued using other significant observable inputs at December 31, 2017. At December 31, 2017, the fair value of certain securities were adjusted due to developments which occurred between the time of the close of the foreign markets on
which they trade and the close of business on the NYSE which resulted in their Level 2 classification.
3. Foreign Currency Translation and Foreign Investments: The books and records of the Fund are maintained in U.S. dollars. Foreign currency amounts are translated into U.S. dollars as follows:
– investments, other assets and liabilities at the prevailing rate of exchange on the valuation date;
– investment transactions and investment income at the prevailing rates of exchange on the dates of such transactions.
Although the net assets of the Fund are presented at the foreign exchange rates and market values at the close of the period, the Fund does not isolate that portion of the results of operations arising as a result of changes in the foreign exchange rates from the fluctuations arising from changes in the market prices of securities held at period end. Similarly, the Fund does not isolate the effect of changes in foreign exchange rates from the fluctuations arising from changes in the market prices of securities sold during the period. Accordingly, realized and unrealized foreign currency gains (losses) on investments in securities are included in the reported net realized and unrealized gains (losses) on investment transactions and balances. However, pursuant to U.S. federal income tax regulations, gains and losses from certain foreign currency transactions and the foreign currency portion of gains and losses realized on sales and maturities of foreign denominated debt securities are treated as ordinary income for U.S. federal income tax purposes.
Net realized gains (losses) on foreign currency transactions represent net foreign exchange gains (losses) from foreign currency forward exchange contracts, disposition of foreign currencies, currency gains (losses) realized between the trade and settlement dates on securities transactions, and the difference between the amount of investment income and foreign withholding taxes recorded on the Fund's books and the U.S. dollar equivalent amounts actually received or paid. Net unrealized currency gains (losses) from valuing foreign currency denominated assets and liabilities at period end exchange rates are reflected as a component of unrealized appreciation (depreciation) in the Statement of Assets and Liabilities. The change in unrealized currency gains (losses)
18
Morgan Stanley Institutional Fund, Inc.
Annual Report — December 31, 2017
Notes to Financial Statements (cont'd)
on foreign currency translations for the period is reflected in the Statement of Operations.
Foreign security and currency transactions may involve certain considerations and risks not typically associated with those of U.S. dollar denominated transactions as a result of, among other factors, fluctuations of exchange rates in relation to the U.S. dollar, the possibility of lower levels of governmental supervision and regulation of foreign securities markets and the possibility of political or economic instability.
Governmental approval for foreign investments may be required in advance of making an investment under certain circumstances in some countries, and the extent of foreign investments in domestic companies may be subject to limitation in other countries. Foreign ownership limitations also may be imposed by the charters of individual companies to prevent, among other concerns, violations of foreign investment limitations. As a result, an additional class of shares (identified as "Foreign" in the Portfolio of Investments) may be created and offered for investment. The "local" and "foreign shares" market values may differ. In the absence of trading of the foreign shares in such markets, the Fund values the foreign shares at the closing exchange price of the local shares.
4. Securities Lending: The Fund lends securities to qualified financial institutions, such as broker-dealers, to earn additional income. Any increase or decrease in the fair value of the securities loaned that might occur and any interest earned or dividends declared on those securities during the term of the loan would remain in the Fund. The Fund would receive cash or securities as collateral in an amount equal to or exceeding 100% of the current fair value of the loaned securities. The collateral is marked-to-market daily by State Street Bank and Trust Company ("State Street"), the securities lending agent, to ensure that a minimum of 100% collateral coverage is maintained.
Based on pre-established guidelines, the securities lending agent invests any cash collateral that is received in an affiliated money market portfolio and repurchase agreements. Securities lending income is generated from the earnings on the invested collateral and borrowing fees, less any rebates owed to the borrowers and compensation to the lending agent, and is recorded as "Income from Securities Loaned — Net" in the Fund's Statement of Operations. Risks in securities lending transactions
are that a borrower may not provide additional collateral when required or return the securities when due, and that the value of the short-term investments will be less than the amount of cash collateral plus any rebate that is required to be returned to the borrower.
The Fund has the right under the securities lending agreement to recover the securities from the borrower on demand.
At December 31, 2017, the Fund did not have any outstanding securities on loan.
5. Indemnifications: The Company enters into contracts that contain a variety of indemnifications. The Company's maximum exposure under these arrangements is unknown. However, the Company has not had prior claims or losses pursuant to these contracts and expects the risk of loss to be remote.
6. Dividends and Distributions to Shareholders: Dividends and distributions to shareholders are recorded on the ex-dividend date. Dividends from net investment income, if any, are declared and paid annually. Net realized capital gains, if any, are distributed at least annually.
7. Security Transactions, Income and Expenses: Security transactions are accounted for on the trade date (date the order to buy or sell is executed). Realized gains and losses on the sale of investment securities are determined on the specific identified cost method. Dividend income and other distributions are recorded on the ex-dividend date (except for certain foreign dividends which may be recorded as soon as the Fund is informed of such dividends) net of applicable withholding taxes. Interest income is recognized on the accrual basis except where collection is in doubt. Discounts are accreted and premiums are amortized over the life of the respective securities. Most expenses of the Company can be directly attributed to a particular Fund. Expenses which cannot be directly attributed are apportioned among the Funds based upon relative net assets or other appropriate methods. Income, expenses (other than class specific expenses — distribution and shareholder services, transfer agency and sub transfer agency fees) and realized and unrealized gains or losses are allocated to each class of shares based upon their relative net assets.
B. Advisory Fees: The Adviser, a wholly-owned subsidiary of Morgan Stanley, provides the Fund with advisory services
19
Morgan Stanley Institutional Fund, Inc.
Annual Report — December 31, 2017
Notes to Financial Statements (cont'd)
under the terms of an Investment Advisory Agreement, paid quarterly, at the annual rate based on the daily net assets as follows:
First $1
billion | | Over $1
billion | |
| | 1.00 | % | | | 0.95 | % | |
For the year ended December 31, 2017, the advisory fee rate (net of waiver/rebate) was equivalent to an annual effective rate of 0.00% of the Fund's average daily net assets.
The Adviser has agreed to reduce its advisory fee and/or reimburse the Fund so that total annual portfolio operating expenses, excluding certain investment related expenses, taxes, interest and other extraordinary expenses (including litigation), will not exceed 1.35% for Class I shares, 1.70% for Class A shares, 2.20% for Class L shares and 2.45% for Class C shares. The fee waivers and/or expense reimbursements will continue for at least one year from the date of the Fund's prospectus or until such time as the Directors act to discontinue all or a portion of such waivers and/or reimbursements when they deem such action is appropriate. For the year ended December 31, 2017, approximately $114,000 of advisory fees were waived and approximately $122,000 of other expenses were reimbursed by the Adviser pursuant to this arrangement.
C. Administration Fees: The Adviser also serves as Administrator to the Company and provides administrative services pursuant to an Administration Agreement for an annual fee, accrued daily and paid monthly, of 0.08% of the Fund's average daily net assets.
Under a Sub-Administration Agreement between the Administrator and State Street, State Street provides certain administrative services to the Company. For such services, the Administrator pays State Street a portion of the fee the Administrator receives from the Fund.
D. Distribution and Shareholder Services Fees: Morgan Stanley Distribution, Inc. ("MSDI" or the "Distributor"), a wholly-owned subsidiary of the Adviser and an indirect subsidiary of Morgan Stanley, serves as the Company's Distributor of Fund shares pursuant to a Distribution Agreement. The Company has adopted a Shareholder Services Plan with respect to Class A shares pursuant to Rule 12b-1 under the Act. Under the Shareholder Services Plan, the Fund pays the Distributor a shareholder services fee, accrued daily and paid monthly, at an annual rate of 0.25% of the Fund's average daily net assets attributable to Class A shares.
The Company has adopted a Distribution and Shareholder Services Plan with respect to Class L shares pursuant to Rule 12b-1 under the Act. Under the Distribution and Shareholder Services Plan, the Fund pays the Distributor a distribution fee, accrued daily and paid monthly, at an annual rate of 0.50% and a shareholder services fee, accrued daily and paid monthly, at an annual rate of 0.25% of the Fund's average daily net assets attributable to Class L shares.
The Company has adopted a Distribution and Shareholder Services Plan with respect to Class C shares pursuant to Rule 12b-1 under the Act. Under the Distribution and Shareholder Services Plan, the Fund pays the Distributor a distribution fee, accrued daily and paid monthly, at an annual rate of 0.75% and a shareholder services fee, accrued daily and paid monthly, at an annual rate of 0.25% of the Fund's average daily net assets attributable to Class C shares.
The distribution and shareholder services fees are used to support the expenses associated with servicing and maintaining accounts. The Distributor may compensate other parties for providing shareholder support services to investors who purchase Class A, Class L and Class C shares.
E. Dividend Disbursing and Transfer Agent: The Company's dividend disbursing and transfer agent is Boston Financial Data Services, Inc. ("BFDS"). Pursuant to a Transfer Agency Agreement, the Company pays BFDS a fee based on the number of classes, accounts and transactions relating to the Funds of the Company. Effective January 1, 2018, BFDS changed its name to DST Asset Manager Solutions, Inc.
F. Custodian Fees: State Street (the "Custodian") also serves as Custodian for the Company in accordance with a Custodian Agreement. The Custodian holds cash, securities, and other assets of the Company as required by the Act. Custody fees are payable monthly based on assets held in custody, investment purchases and sales activity and account maintenance fees, plus reimbursement for certain out-of-pocket expenses.
G. Security Transactions and Transactions with Affiliates: For the year ended December 31, 2017, purchases and sales of investment securities for the Fund, other than long-term U.S. Government securities and short-term investments, were approximately $8,876,000 and $7,090,000, respectively. There were no purchases and sales of long-term U.S. Government securities for the year ended December 31, 2017.
The Fund invests in the Institutional Class of the Morgan Stanley Institutional Liquidity Funds — Treasury Securities
20
Morgan Stanley Institutional Fund, Inc.
Annual Report — December 31, 2017
Notes to Financial Statements (cont'd)
Portfolio (the "Liquidity Funds"), an open-end management investment company managed by the Adviser. Advisory fees paid by the Fund are reduced by an amount equal to its pro-rata share of the advisory and administration fees paid by the Fund due to its investment in the Liquidity Funds. For the year ended December 31, 2017, advisory fees paid were reduced by approximately $2,000 relating to the Fund's investment in the Liquidity Funds.
A summary of the Fund's transactions in shares of the Liquidity Funds during the year ended December 31, 2017 is as follows:
Affiliated
Investment
Company | | Value
December 31,
2016
(000) | | Purchases
at Cost
(000) | | Proceeds
from Sales
(000) | | Dividend
Income
(000) | |
Liquidity Funds | | $ | 286 | | | $ | 9,838 | | | $ | 9,415 | | | $ | 7 | | |
Affiliated
Investment
Company (cont'd) | | Realized Gain
(Loss)
(000) | | Change in
Unrealized
Appreciation
(Depreciation)
(000) | | Value
December 31,
2017
(000) | |
Liquidity Funds | | $ | — | | | $ | — | | | $ | 709 | | |
The Fund is permitted to purchase and sell securities ("cross-trade") from and to other Morgan Stanley Funds as well as other funds and client accounts for which the Adviser or an affiliate of the Adviser serves as investment adviser, pursuant to procedures approved by the Directors in compliance with Rule 17a-7 under the Act (the "Rule"). Each cross-trade is executed at the current market price in compliance with provisions of the Rule. For the year ended December 31, 2017, the Fund did not engage in any cross-trade transactions.
The Fund has an unfunded Deferred Compensation Plan (the "Compensation Plan"), which allows each independent Director to defer payment of all, or a portion, of the fees he or she receives for serving on the Board of Directors. Each eligible Director generally may elect to have the deferred amounts credited with a return equal to the total return on one or more of the Morgan Stanley funds that are offered as investment options under the Compensation Plan. Appreciation/depreciation and distributions received from these investments are recorded with an offsetting increase/decrease in the deferred compensation obligation and do not affect the NAV of the Fund.
H. Federal Income Taxes: It is the Fund's intention to continue to qualify as a regulated investment company and dis-
tribute all of its taxable and tax-exempt income. Accordingly, no provision for federal income taxes is required in the financial statements.
The Fund may be subject to taxes imposed by countries in which it invests. Such taxes are generally based on income and/or capital gains earned or repatriated. Taxes are accrued based on net investment income, net realized gains and net unrealized appreciation as such income and/or gains are earned. Taxes may also be based on transactions in foreign currency and are accrued based on the value of investments denominated in such currency.
FASB ASC 740-10, "Income Taxes — Overall", sets forth a minimum threshold for financial statement recognition of the benefit of a tax position taken or expected to be taken in a tax return. Management has concluded there are no significant uncertain tax positions that would require recognition in the financial statements. If applicable, the Fund recognizes interest accrued related to unrecognized tax benefits in "Interest Expense" and penalties in "Other Expenses" in the Statement of Operations. The Fund files tax returns with the U.S. Internal Revenue Service, New York and various states. Generally, each of the tax years in the four-year period ended December 31, 2017, remains subject to examination by taxing authorities.
The tax character of distributions paid may differ from the character of distributions shown in the Statements of Changes in Net Assets due to short-term capital gains being treated as ordinary income for tax purposes. The tax character of distributions paid during fiscal years 2017 and 2016 was as follows:
2017
Distributions
Paid From: | | 2016
Distributions
Paid From: | |
Ordinary
Income
(000) | | Long-Term
Capital Gain
(000) | | Ordinary
Income
(000) | | Long-Term
Capital Gain
(000) | |
| $ | 728 | | | $ | 573 | | | $ | 101 | | | $ | 9 | | |
The amount and character of income and gains to be distributed are determined in accordance with income tax regulations which may differ from GAAP. These book/tax differences are either considered temporary or permanent in nature.
Temporary differences are primarily due to differing book and tax treatments for the timing of the recognition of gains (losses) on certain investment transactions and the timing of the deductibility of certain expenses.
21
Morgan Stanley Institutional Fund, Inc.
Annual Report — December 31, 2017
Notes to Financial Statements (cont'd)
Permanent differences, primarily due to differing treatments of gains (losses) related to foreign currency transactions, basis adjustments on certain equity securities designated as passive foreign investment companies, a distribution redesignation and a nondeductible expense, resulted in the following reclassifications among the components of net assets at December 31, 2017:
Distributions
in Excess of Net
Investment
Income
(000) | | Accumulated
Undistributed
Net Realized
Gain
(000) | | Paid-in-
Capital
(000) | |
| $ | 21 | | | $ | (21 | ) | | $ | (— | @) | |
@ Amount is less than $500.
At December 31, 2017, the components of distributable earnings for the Fund on a tax basis were as follows:
Undistributed
Ordinary
Income
(000) | | Undistributed
Long-Term
Capital Gain
(000) | |
| $ | 95 | | | $ | 54 | | |
I. Credit Facility: The Company and other Morgan Stanley funds participated in a $150,000,000 committed, unsecured revolving line of credit facility (the "Facility") with State Street. This Facility is to be used for temporary emergency purposes or funding of shareholder redemption requests. The interest rate on borrowings is based on the federal funds rate or 1 month LIBOR rate plus a spread. The Facility also has a commitment fee of 0.25% per annum based on the unused portion of the Facility. During the year ended December 31, 2017, the Fund did not have any borrowings under the Facility.
J. Other: At December 31, 2017, the Fund had record owners of 10% or greater. Investment activities of these shareholders could have a material impact on the Fund. The aggregate percentage of such owners was 57.4%.
22
Morgan Stanley Institutional Fund, Inc.
Annual Report — December 31, 2017
Report of Independent Registered Public Accounting Firm
To the Shareholders and Board of Directors of
Morgan Stanley Institutional Fund, Inc. —
Insight Portfolio
Opinion on the Financial Statements
We have audited the accompanying statement of assets and liabilities of Insight Portfolio (the "Fund") (one of the funds constituting the Morgan Stanley Institutional Fund, Inc. (the "Company")), including the portfolio of investments, as of December 31, 2017, and the related statement of operations for the year then ended, the statements of changes in net assets for each of the two years in the period then ended, the financial highlights for each of the five years in the period then ended and the related notes (collectively referred to as the "financial statements"). In our opinion, the financial statements present fairly, in all material respects, the financial position of Insight Portfolio (one of the funds constituting Morgan Stanley Institutional Fund, Inc.) at December 31, 2017, the results of its operations for the year then ended, the changes in its net assets for each of the two years in the period then ended and its financial highlights for each of the five years in the period then ended, in conformity with U.S. generally accepted accounting principles.
Basis for Opinion
These financial statements are the responsibility of the Company's management. Our responsibility is to express an opinion on the Fund's financial statements based on our audits. We are a public accounting firm registered with the Public Company Accounting Oversight Board (United States) ("PCAOB") and are required to be independent with respect to the Company in accordance with the U.S. federal securities law and the applicable rules and regulations of the Securities and Exchange Commission and the PCAOB.
We conducted our audits in accordance with the standards of the PCAOB. Those standards require that we plan and perform the audit to obtain reasonable assurance about whether the financial statements are free of material misstatement, whether due to error or fraud. The Company is not required to have, nor were we engaged to perform, an audit of the Company's internal control over financial reporting. As part of our audits, we are required to obtain an understanding of internal control over financial reporting, but not for the purpose of expressing an opinion on the effectiveness of the Company's internal control over financial reporting. Accordingly, we express no such opinion.
Our audits included performing procedures to assess the risks of material misstatement of the financial statements, whether due to error or fraud, and performing procedures that respond to those risks. Such procedures included examining, on a test basis, evidence regarding the amounts and disclosures in the financial statements. Our procedures included confirmation of securities owned as of December 31, 2017 by correspondence with the custodian and others or by other appropriate auditing procedures where replies from others were not received. Our audits also included evaluating the accounting principles used and significant estimates made by management, as well as evaluating the overall presentation of the financial statements. We believe that our audits provide a reasonable basis for our opinion.

We have served as the auditor of one or more Morgan Stanley investment companies since 2000.
Boston, Massachusetts
February 26, 2018
23
Morgan Stanley Institutional Fund, Inc.
Annual Report — December 31, 2017
Federal Tax Notice (unaudited)
For federal income tax purposes, the following information is furnished with respect to the distributions paid by the Fund during its taxable year ended December 31, 2017. For corporate shareholders 5.36% of the dividends qualified for the dividends received deduction.
The Fund designated and paid approximately $573,000 as a long-term capital gain distribution.
For federal income tax purposes, the following information is furnished with respect to the Fund's earnings for its taxable year ended December 31, 2017. When distributed, certain earnings may be subject to a maximum tax rate of 15% as provided for by the Jobs and Growth Tax Relief Reconciliation Act of 2003. The Fund designated up to a maximum of approximately $176,000 as taxable at this lower rate.
The Fund intends to pass through foreign tax credits of approximately $16,000 and has derived net income from sources within foreign countries amounting to approximately $208,000.
In January, the Fund provides tax information to shareholders for the preceding calendar year.
24
Morgan Stanley Institutional Fund, Inc.
Annual Report — December 31, 2017
Privacy Notice (unaudited)
MORGAN STANLEY INVESTMENT MANAGEMENT INC.
AN IMPORTANT NOTICE CONCERNING OUR U.S. PRIVACY POLICY
We are required by federal law to provide you with a copy of our privacy policy annually. This policy applies to current and former individual investors in funds managed or sponsored by Morgan Stanley Investment Management Inc. ("MSIM") as well as current and former individual clients of MSIM. This policy is not applicable to partnerships, corporations, trusts or other non-individual clients or investors. Please note that we may amend this policy at any time, and will inform you of any changes as required by law.
WE RESPECT YOUR PRIVACY
We appreciate that you have provided us with your personal financial information. We strive to maintain the privacy of such information while we help you achieve your financial objectives. This Notice describes what non-public personal information we collect about you, why we collect it, when we may share it with others and how certain others may use it. It discusses the steps you may take to limit our sharing of certain information about you to affiliated companies in the Morgan Stanley family of companies ("other Morgan Stanley companies"). It also discloses how you may limit use of certain shared information for marketing purposes by other Morgan Stanley branded companies. Throughout this policy, we refer to the non-public information that personally identifies you or your accounts as "personal information.''
1. WHAT PERSONAL INFORMATION DO WE COLLECT ABOUT YOU?
We obtain personal information from applications and other forms you submit to us, from your dealings with us, from consumer reporting agencies, from our Web sites and from third parties and other sources.
For example:
• We may collect information such as your name, address, e-mail address, telephone/fax numbers, assets, income and investment objectives through subscription documents, applications and other forms you submit to us.
• We may obtain information about account balances, your use of account(s) and the types of products and services you prefer to receive from us through your dealings and transactions with us and other sources.
• We may obtain information about your creditworthiness and credit history from consumer reporting agencies.
• We may collect background information from and through third-party vendors to verify representations you have made and to comply with various regulatory requirements.
• If you interact with us through our public and private Web sites, we may collect information that you provide directly through online communications (such as an e-mail address). We may also collect information about your Internet service provider, your domain name, your computer's operating system and Web browser, your use of our Web sites and your product and service preferences, through the use of "cookies." Please consult the Terms of Use of these sites for more details.
2. WHEN DO WE DISCLOSE PERSONAL INFORMATION WE COLLECT ABOUT YOU?
We may disclose personal information we collect about you to other Morgan Stanley companies and to non-affiliated third parties.
a. Information We Disclose to Other Morgan Stanley Companies.
We may disclose personal information to other Morgan Stanley companies for a variety of reasons, including to manage your account(s) effectively, to service and process your transactions, to let you know about products and services offered by us and other Morgan Stanley companies, to manage our business, and as otherwise required or permitted by law. Offers for products and services from other Morgan Stanley companies are developed under conditions designed to safeguard your personal information.
25
Morgan Stanley Institutional Fund, Inc.
Annual Report — December 31, 2017
Privacy Notice (unaudited) (cont'd)
b. Information We Disclose to Non-affiliated Third Parties.
We do not disclose personal information that we collect about you to non-affiliated third parties except to those who provide marketing services on our behalf, to financial institutions with whom we have joint marketing agreements, and as otherwise required or permitted by law. For example, we may disclose personal information to non-affiliated third parties for servicing and processing transactions, to offer our own products and services, to protect against fraud, for institutional risk control, to respond to judicial process or to perform services on our behalf. When we share personal information with a non-affiliated third party, they are required to limit their use of personal information to the particular purpose for which it was shared and they are not allowed to share personal information with others except to fulfill that limited purpose or as may be permitted or required by law.
3. HOW DO WE PROTECT THE SECURITY AND CONFIDENTIALITY OF PERSONAL INFORMATION WE COLLECT ABOUT YOU?
We maintain physical, electronic and procedural security measures to help safeguard the personal information we collect about you. We have internal policies governing the proper handling of client information. Third parties that provide support or marketing services on our behalf may also receive personal information, and we require them to adhere to confidentiality standards with respect to such information.
4. HOW CAN YOU LIMIT THE SHARING OF CERTAIN TYPES OF PERSONAL INFORMATION WITH OTHER MORGAN STANLEY COMPANIES?
We offer you choices as to whether we share with other Morgan Stanley companies the personal information that was collected to determine your eligibility for products and services you request ("eligibility information"). Eligibility information does not include your identification information or personal information pertaining to our transactions or experiences with you. Please note that, even if you direct us not to share eligibility information with other Morgan Stanley companies ("opt-out"), we may still share personal information, including eligibility information, with those companies in circumstances excluded from the opt-out under applicable law, such as to process transactions or to service your account.
5. HOW CAN YOU LIMIT THE USE OF CERTAIN TYPES OF PERSONAL INFORMATION BY OTHER MORGAN STANLEY COMPANIES FOR MARKETING?
By following the opt-out instructions in Section 6 below, you may limit other Morgan Stanley branded companies from marketing their products or services to you based on personal information we disclose to them. This information may include, for example, your income and account history with us. Please note that, even if you choose to limit Other Morgan Stanley Companies from using personal information about you that we may share with them for marketing their products and services to you, Other Morgan Stanley Companies may use your personal information that they obtain from us to market to you in circumstances permitted by law, such as if the Other Morgan Stanley Company has its own relationship with you.
6. HOW CAN YOU SEND US AN OPT-OUT INSTRUCTION?
If you wish to limit our sharing of eligibility information about you with other Morgan Stanley companies or other Morgan Stanley companies' use of personal information for marketing purposes, as described in this notice, you may do so by:
• Calling us at (800) 548-7786
Monday–Friday between 8a.m. and 6p.m.(EST)
• Writing to us at the following address:
DST Asset Manager Solutions, Inc.
c/o Privacy Coordinator
P.O. Box 219804
Kansas City, Missouri 64121
26
Morgan Stanley Institutional Fund, Inc.
Annual Report — December 31, 2017
Privacy Notice (unaudited) (cont'd)
Your written request should include your name, address, telephone number and account number(s) to which the opt-out applies and whether you are opting out with respect to sharing of eligibility information (Section 4 above), or if information used for Marketing (Section 5 above) or both. Written opt-out requests should not be sent with any other correspondence. In order to process your request, we require that the request be provided by you directly and not through a third party.
Your opt-out preference will remain in effect with respect to this policy (as it may be amended) until you notify us otherwise. If you have a joint account, your direction for us not to share this information with other Morgan Stanley companies and for those other Morgan Stanley companies not to use your personal information for marketing will be applied to all account holders on that account. Please understand that if you limit our sharing or our affiliated companies' use of personal information, you and any joint account holder(s) may not receive information about Morgan Stanley products and services, including products or services that could help you manage your financial resources and achieve your investment objectives.
7. WHAT IF AN AFFILIATED COMPANY BECOMES A NON-AFFILIATED THIRD PARTY?
If, at any time in the future, an affiliated company becomes a non-affiliated third party, further disclosures of personal information made to the former affiliated company will be limited to those described in Section 2(b) above relating to non-affiliated third parties. If you elected under Section 6 to limit disclosures we make to affiliated companies, or use of personal information by affiliated companies, your election will not apply to use by any former affiliated company of your personal information in their possession once it becomes a non-affiliated third party.
SPECIAL NOTICE TO RESIDENTS OF VERMONT
The following section supplements our policy with respect to our individual clients who have a Vermont address and supersedes anything to the contrary in the above policy with respect to those clients only.
The state of Vermont requires financial institutions to obtain your consent prior to sharing personal information that they collect about you with affiliated companies and non-affiliated third parties other than in certain limited circumstances. Except as permitted by law, we will not share personal information we collect about you with non-affiliated third parties or other Morgan Stanley companies unless you provide us with your written consent to share such information ("opt-in").
If you wish to receive offers for investment products and services offered by or through other Morgan Stanley companies, please notify us in writing at the following address:
DST Asset Manager Solutions, Inc.
c/o Privacy Coordinator
P.O. Box 219804
Kansas City, Missouri 64121
Your authorization should include your name, address, telephone number and account number(s) to which the opt-in applies and should not be sent with any other correspondence. In order to process your authorization, we require that the authorization be provided by you directly and not through a third party.
SPECIAL NOTICE TO RESIDENTS OF CALIFORNIA
The following section supplements our policy with respect to our individual clients who have a California address and supersedes anything to the contrary in the above policy with respect to those clients only.
In response to a California law, if your account has a California home address, your personal information will not be disclosed to non-affiliated third parties except as permitted by applicable California law, and we will limit sharing such information with our affiliates to comply with California privacy laws that apply to us.
27
Morgan Stanley Institutional Fund, Inc.
Annual Report — December 31, 2017
Director and Officer Information (unaudited)
Independent Directors:
Name, Age and Address of
Independent Director | | Position(s)
Held with
Registrant | | Length of Time
Served* | | Principal Occupation(s) During Past 5 Years
and Other Relevant Professional Experience | | Number of
Portfolios in
Fund Complex
Overseen by
Independent
Director** | | Other Directorships
Held by Independent
Director*** | |
Frank L. Bowman (73)
c/o Perkins Coie LLP
Counsel to the Independent
Directors
30 Rockefeller Plaza
New York, NY 10112 | | Director | | Since
August
2006 | | President, Strategic Decisions, LLC (consulting) (since February 2009); Director or Trustee of various Morgan Stanley Funds (since August 2006); Chairperson of the Compliance and Insurance Committee (since October 2015); formerly, Chairperson of the Insurance Sub-Committee of the Compliance and Insurance Committee (2007-2015); served as President and Chief Executive Officer of the Nuclear Energy Institute (policy organization) (February 2005-November 2008); retired as Admiral, U.S. Navy after serving over 38 years on active duty including 8 years as Director of the Naval Nuclear Propulsion Program in the Department of the Navy and the U.S. Department of Energy (1996-2004); served as Chief of Naval Personnel (July 1994-September 1996) and on the Joint Staff as Director of Political Military Affairs (June 1992-July 1994); knighted as Honorary Knight Commander of the Most Excellent Order of the British Empire; awarded the Officier de l'Orde National du Mérite by the French Government; elected to the National Academy of Engineering (2009). | | | 88 | | | Director of BP p.l.c.; Director of Naval and Nuclear Technologies LLP; Director Emeritus of the Armed Services YMCA; Director of the U.S. Naval Submarine League; Member of the National Security Advisory Council of the Center for U.S. Global Engagement and a member of the CNA Military Advisory Board; Trustee of Fairhaven United Methodist Church; and Director of other various non-profit organizations. | |
Kathleen A. Dennis (64)
c/o Perkins Coie LLP
Counsel to the Independent Directors
30 Rockefeller Plaza
New York, NY 10112 | | Director | | Since
August
2006 | | President, Cedarwood Associates (mutual fund and investment management consulting) (since July 2006); Chairperson of the Liquidity and Alternatives Sub-Committee of the Investment Committee (since October 2006) and Director or Trustee of various Morgan Stanley Funds (since August 2006); formerly, Senior Managing Director of Victory Capital Management (1993-2006). | | | 89 | | | Director of various non-profit organizations. | |
Nancy C. Everett (62)
c/o Perkins Coie LLP
Counsel to the Independent Directors
30 Rockefeller Plaza
New York, NY 10112 | | Director | | Since
January
2015 | | Chief Executive Officer, Virginia Commonwealth University Investment Company (since November 2015); Owner, OBIR, LLC (institutional investment management consulting) (since June 2014); formerly, Managing Director, BlackRock Inc. (February 2011-December 2013); and Chief Executive Officer, General Motors Asset Management (a/k/a Promark Global Advisors, Inc.) (June 2005-May 2010). | | | 90 | | | Formerly, Member of Virginia Commonwealth University School of Business Foundation (2005-2016); Member of Virginia Commonwealth University Board of Visitors (2013-2015); Member of Committee on Directors for Emerging Markets Growth Fund, Inc. (2007-2010); Chairperson of Performance Equity Management, LLC (2006-2010); and Chairperson, GMAM Absolute Return Strategies Fund, LLC (2006-2010). | |
28
Morgan Stanley Institutional Fund, Inc.
Annual Report — December 31, 2017
Director and Officer Information (unaudited) (cont'd)
Independent Directors: (cont'd)
Name, Age and Address of
Independent Director | | Position(s)
Held with
Registrant | | Length of Time
Served* | | Principal Occupation(s) During Past 5 Years
and Other Relevant Professional Experience | | Number of
Portfolios in
Fund Complex
Overseen by
Independent
Director** | | Other Directorships
Held by Independent
Director*** | |
Jakki L. Haussler (60)
c/o Perkins Coie LLP
Counsel to the Independent Directors
30 Rockefeller Plaza
New York, NY 10112 | | Director | | Since
January
2015 | | Chairman and Chief Executive Officer, Opus Capital Group (since January 1996); formerly, Director, Capvest Venture Fund, LP (May 2000-December 2011); Partner, Adena Ventures, LP (July 1999-December 2010); Director, The Victory Funds (February 2005-July 2008). | | | 90 | | | Director of Cincinnati Bell Inc. and Member, Audit Committee and Compensation Committee; Director of Northern Kentucky University Foundation and Member, Investment Committee; Member of Chase College of Law Transactional Law Practice Center Board of Advisors; Director of Best Transport; Director of Chase College of Law Board of Visitors; formerly, Member, University of Cincinnati Foundation Investment Committee; Member, Miami University Board of Visitors (2008-2011); Trustee of Victory Funds (2005-2008) and Chairman, Investment Committee (2007-2008) and Member, Service Provider Committee (2005-2008). | |
Dr. Manuel H. Johnson (68)
c/o Johnson Smick
International, Inc.
220 I Street, NE — Suite 200
Washington, D.C. 20002 | | Director | | Since
July
1991 | | Senior Partner, Johnson Smick International, Inc. (consulting firm); Chairperson of the Investment Committee (since October 2006) and Director or Trustee of various Morgan Stanley Funds (since July 1991); Co-Chairman and a founder of the Group of Seven Council (G7C) (international economic commission); formerly, Chairperson of the Audit Committee (July 1991-September 2006), Vice Chairman of the Board of Governors of the Federal Reserve System and Assistant Secretary of the U.S. Treasury. | | | 88 | | | Director of NVR, Inc. (home construction). | |
Joseph J. Kearns (75)
c/o Kearns & Associates LLC
46 E Peninsula Center #385
Rolling Hills Estates, CA
90274-3712 | | Director | | Since
August
1994 | | Senior Adviser, Kearns & Associates LLC (investment consulting); Chairperson of the Audit Committee (since October 2006) and Director or Trustee of various Morgan Stanley Funds (since August 1994); formerly, Deputy Chairperson of the Audit Committee (July 2003-September 2006) and Chairperson of the Audit Committee of various Morgan Stanley Funds (since August 1994); CFO of the J. Paul Getty Trust. | | | 89 | | | Prior to August 10, 2016, Director of Electro Rent Corporation (equipment leasing); Prior to December 31, 2013, Director of The Ford Family Foundation. | |
29
Morgan Stanley Institutional Fund, Inc.
Annual Report — December 31, 2017
Director and Officer Information (unaudited) (cont'd)
Independent Directors: (cont'd)
Name, Age and Address of
Independent Director | | Position(s)
Held with
Registrant | | Length of Time
Served* | | Principal Occupation(s) During Past 5 Years
and Other Relevant Professional Experience | | Number of
Portfolios in
Fund Complex
Overseen by
Independent
Director** | | Other Directorships
Held by Independent
Director*** | |
Michael F. Klein (59)
c/o Perkins Coie LLP
Counsel to the Independent Directors
30 Rockefeller Plaza
New York, NY 10112 | | Director | | Since
August
2006 | | Managing Director, Aetos Capital, LLC (since March 2000); Co-President, Aetos Alternatives Management, LLC (since January 2004) and Co-Chief Executive Officer of Aetos Capital LLC (since August 2013); Chairperson of the Fixed Income Sub-Committee of the Investment Committee (since October 2006) and Director or Trustee of various Morgan Stanley Funds (since August 2006); formerly, Managing Director, Morgan Stanley & Co. Inc. and Morgan Stanley Dean Witter Investment Management, President, various Morgan Stanley Funds (June 1998-March 2000) and Principal, Morgan Stanley & Co. Inc. and Morgan Stanley Dean Witter Investment Management (August 1997-December 1999). | | | 88 | | | Director of certain investment funds managed or sponsored by Aetos Capital, LLC; Director of Sanitized AG and Sanitized Marketing AG (specialty chemicals). | |
Patricia Maleski (57)
c/o Perkins Coie LLP
Counsel to the Independent Directors
30 Rockefeller Plaza
New York, NY 10112 | | Director | | Since
January
2017 | | Managing Director, JPMorgan Asset Management (2004-2016); Oversight and Control Head of Fiduciary and Conflicts of Interest Program (2015-2016); Chief Control Officer-Global Asset Management (2013-2015); President, JPMorgan Funds (2010-2013); Chief Administrative Officer (2004-2013); various other positions including Treasurer and Board Liaison (since 2001). | | | 90 | | | None. | |
Michael E. Nugent (81)
522 Fifth Avenue
New York, NY 10036 | | Chair of the Board and Director | | Chair of the Boards since July 2006 and Director since July 1991 | | Chair of the Boards of various Morgan Stanley Funds (since July 2006); Chairperson of the Closed-End Fund Committee (since June 2012) and Director or Trustee of various Morgan Stanley Funds (since July 1991); formerly, Chairperson of the Insurance Committee (until July 2006); General Partner, Triumph Capital, L.P. (private investment partnership) (1988-2013). | | | 88 | | | None. | |
W. Allen Reed (70)
c/o Perkins Coie LLP
Counsel to the Independent Directors
30 Rockefeller Plaza
New York, NY 10112 | | Director | | Since
August
2006 | | Chairperson of the Equity Sub-Committee of the Investment Committee (since October 2006) and Director or Trustee of various Morgan Stanley Funds (since August 2006); formerly, President and CEO of General Motors Asset Management; Chairman and Chief Executive Officer of the GM Trust Bank and Corporate Vice President of General Motors Corporation (August 1994-December 2005). | | | 89 | | | Director of Legg Mason, Inc.; formerly, Director of the Auburn University Foundation (2010-2015). | |
Fergus Reid (85)
c/o Joe Pietryka, Inc.
85 Charles Colman Blvd.
Pawling, NY 12564 | | Director | | Since
June
1992 | | Chairman, Joe Pietryka, Inc.; Chairperson of the Governance Committee and Director or Trustee of various Morgan Stanley Funds (since June 1992). | | | 89 | | | Formerly, Trustee and Director of certain investment companies in the JP Morgan Fund Complex managed by JP Morgan Investment Management Inc. (1987-2012). | |
* This is the earliest date the Director began serving the Morgan Stanley Funds. Each Director serves an indefinite term, until his or her successor is elected.
** The Fund Complex includes (as of December 31, 2017) all open-end and closed-end funds (including all of their portfolios) advised by Morgan Stanley Investment Management Inc. (the "Adviser") and any funds that have an adviser that is an affiliated person of the Adviser (including, but not limited to, Morgan Stanley AIP GP LP).
*** This includes any directorships at public companies and registered investment companies held by the Director at any time during the past five years.
30
Morgan Stanley Institutional Fund, Inc.
Annual Report — December 31, 2017
Director and Officer Information (unaudited) (cont'd)
Executive Officers:
Name, Age and Address of Executive Officer | | Position(s) Held
with
Registrant | | Length of Time
Served* | | Principal Occupation(s) During Past 5 Years | |
John H. Gernon (54)
522 Fifth Avenue
New York, NY 10036 | | President and Principal Executive Officer | | Since
September
2013 | | President and Principal Executive Officer of the Equity and Fixed Income Funds and the Morgan Stanley AIP Funds (since September 2013) and the Liquidity Funds and various money market funds (since May 2014) in the Fund Complex; Managing Director of the Adviser; Head of Product (since 2006). | |
Timothy J. Knierim (58)
522 Fifth Avenue
New York, NY 10036 | | Chief Compliance Officer | | Since
December
2016 | | Managing Director of the Adviser and various entities affiliated with the Adviser; Chief Compliance Officer of various Morgan Stanley Funds and the Adviser (since December 2016) and Chief Compliance Officer of Morgan Stanley AIP GP LP (since 2014). Formerly, Managing Director and Deputy Chief Compliance Officer of the Adviser (2014-2016); and formerly, Chief Compliance Officer of Prudential Investment Management, Inc. (2007-2014). | |
Francis J. Smith (52)
522 Fifth Avenue
New York, NY 10036 | | Treasurer and Principal Financial Officer | | Treasurer since July 2003 and Principal Financial Officer since September 2002 | | Manging Director of the Adviser and various entities affiliated with the Adviser; Treasurer (since July 2003) and Principal Financial Officer of various Morgan Stanley Funds (since September 2002). | |
Mary E. Mullin (50)
522 Fifth Avenue
New York, NY 10036 | | Secretary | | Since
June
1999 | | Managing Director of the Adviser; Secretary of various Morgan Stanley Funds (since June 1999). | |
Michael J. Key (38)
522 Fifth Avenue
New York, NY 10036 | | Vice President | | Since
June
2017 | | Vice President of the Equity and Fixed Income Funds, Liquidity Funds, various money market funds and the Morgan Stanley AIP Funds in the Fund Complex (since June 2017); Executive Director of the Adviser; Head of Product Development for Equity and Fixed Income Funds (since August 2013). | |
* This is the earliest date the officer began serving the Morgan Stanley Funds. Each officer serves a one-year term, until his or her successor is elected and qualifies.
31
Morgan Stanley Institutional Fund, Inc.
Annual Report — December 31, 2017
Adviser and Administrator
Morgan Stanley Investment Management Inc.
522 Fifth Avenue
New York, New York 10036
Distributor
Morgan Stanley Distribution, Inc.
522 Fifth Avenue
New York, New York 10036
Dividend Disbursing and Transfer Agent
DST Asset Manager Solutions, Inc.
2000 Crown Colony Drive
Quincy, Massachusetts 02169
Custodian
State Street Bank and Trust Company
One Lincoln Street
Boston, Massachusetts 02111
Legal Counsel
Dechert LLP
1095 Avenue of the Americas
New York, New York 10036
Counsel to the Independent Directors
Perkins Coie LLP
30 Rockefeller Plaza
New York, New York 10112
Independent Registered Public Accounting Firm
Ernst & Young LLP
200 Clarendon Street
Boston, Massachusetts 02116
Reporting to Shareholders
Each Morgan Stanley Fund provides a complete schedule of portfolio holdings in its semi-annual and annual reports within 60 days of the end of the fund's second and fourth fiscal quarters. The semi-annual and annual reports are filed electronically with the Securities and Exchange Commission (SEC) on Form N-CSRS and Form N-CSR, respectively. Morgan Stanley also delivers the semi-annual and annual reports to fund shareholders and makes these reports available on its public website, www.morganstanley.com/im. Each Morgan Stanley fund also files a complete schedule of portfolio holdings with the SEC for the fund's first and third fiscal quarters on Form N-Q. Morgan Stanley does not deliver the reports for the first and third fiscal quarters to shareholders, nor are the reports posted to the Morgan Stanley public website. You may, however, obtain the Form N-Q filings (as well as the Form N-CSR and N-CSRS filings) by accessing the SEC's website, www.sec.gov. You may also review and copy them at the SEC's Public Reference Room in Washington, DC. Information on the operation of the SEC's Public Reference Room may be obtained by calling the SEC toll free at 1 (800) SEC-0330. You can also request copies of these materials, upon payment of a duplicating fee, by electronic request at the SEC's email address (publicinfo@sec.gov) or by writing to the SEC's Public Reference Section, Washington, D.C. 20549-1520.
Proxy Voting Policies and Procedures and Proxy Voting Record
You may obtain a copy of the Company's Proxy Voting Policy and Procedures and information regarding how the Company voted proxies relating to portfolio securities during the most recent twelve-month period ended June 30, without charge, upon request, by calling toll free 1 (800) 548-7786 or by visiting our website at www.morganstanley.com/im. This information is also available on the SEC's website at www.sec.gov.
This report is authorized for distribution only when preceded or accompanied by a prospectus or summary prospectus of the applicable Fund of Morgan Stanley Institutional Fund, Inc., which describes in detail the Fund's investment policies, risks, fees and expenses. Please read the prospectus carefully before you invest or send money. For additional information, including information regarding the investments comprising the Fund, please visit our website at www.morganstanley.com/im or call toll free 1 (800) 548-7786.
32
Printed in U.S.A.
This Report has been prepared for shareholders and may be distributed to others only if preceded or accompanied by a current prospectus.
Morgan Stanley Investment Management Inc.
522 Fifth Avenue
New York, New York 10036
© 2018 Morgan Stanley. Morgan Stanley Distribution, Inc.

IFIGIANN
2007747 EXP. 02.28.19

Morgan Stanley Institutional Fund, Inc.
Global Opportunity Portfolio
Annual Report
December 31, 2017

Morgan Stanley Institutional Fund, Inc.
Annual Report — December 31, 2017
Shareholders' Letter | | | 2 | | |
Expense Example | | | 3 | | |
Investment Overview | | | 4 | | |
Portfolio of Investments | | | 6 | | |
Statement of Assets and Liabilities | | | 8 | | |
Statement of Operations | | | 10 | | |
Statements of Changes in Net Assets | | | 11 | | |
Financial Highlights | | | 13 | | |
Notes to Financial Statements | | | 18 | | |
Report of Independent Registered Public Accounting Firm | | | 28 | | |
Federal Tax Notice | | | 29 | | |
Privacy Notice | | | 30 | | |
Director and Officer Information | | | 33 | | |
This report is authorized for distribution only when preceded or accompanied by a prospectus or summary prospectus of the applicable Fund of Morgan Stanley Institutional Fund, Inc. To receive a prospectus and/or statement of additional information (SAI), which contains more complete information such as investment objectives, charges, expenses, policies for voting proxies, risk considerations, and describes in detail each of the Fund's investment policies to the prospective investor, please call toll free 1 (800) 548-7786. Please read the prospectuses carefully before you invest or send money.
Additionally, you can access information about the Fund including performance, characteristics, and investment team commentary, through Morgan Stanley Investment Management's website: www.morganstanley.com/im.
Market forecasts provided in this report may not necessarily come to pass. There is no guarantee that any sectors mentioned will continue to perform as discussed herein or that securities in such sectors will be held by the Fund in the future. There is no assurance that a fund will achieve its investment objective. Funds are subject to market risk, which is the possibility that market values of securities owned by the Fund will decline and, therefore, the value of the Fund's shares may be less than what you paid for them. Accordingly, you can lose money investing in this Fund. Please see the prospectus for more complete information on investment risks.
1
Morgan Stanley Institutional Fund, Inc.
Annual Report — December 31, 2017
Shareholders' Letter (unaudited)
Dear Shareholders,
We are pleased to provide this Annual report, in which you will learn how your investment in Global Opportunity Portfolio (the "Fund") performed during the latest twelve-month period.
Morgan Stanley Investment Management is a client-centric, investor-led organization. Our global presence, intellectual capital, and breadth of products and services enable us to partner with investors to meet the evolving challenges of today's financial markets. We aim to deliver superior investment service and to empower our clients to make the informed decisions that help them reach their investment goals.
As always, we thank you for selecting Morgan Stanley Investment Management, and look forward to working with you in the months and years ahead.
Sincerely,

John H. Gernon
President and Principal Executive Officer
January 2018
2
Morgan Stanley Institutional Fund, Inc.
Annual Report — December 31, 2017
Expense Example (unaudited)
Global Opportunity Portfolio
As a shareholder of the Fund, you incur two types of costs: (1) transactional costs; and (2) ongoing costs, which may include advisory fees, administration fees, distribution and shareholder services fees and other Fund expenses. This example is intended to help you understand your ongoing costs (in dollars) of investing in the Fund and to compare these costs with the ongoing costs of investing in other mutual funds.
This example is based on an investment of $1,000 invested at the beginning of the six-month period ended December 31, 2017 and held for the entire six-month period.
Actual Expenses
The table below provides information about actual account values and actual expenses. You may use the information in this table, together with the amount you invested, to estimate the expenses that you paid over the period. Simply divide your account value by $1,000 (for example, an $8,600 account value divided by $1,000 = 8.6), then multiply the result by the number in the table under the heading entitled "Actual Expenses Paid During Period" to estimate the expenses you paid on your account during this period.
Hypothetical Example for Comparison Purposes
The table below provides information about hypothetical account values and hypothetical expenses based on the Fund's actual expense ratio and an assumed rate of return of 5% per year before expenses, which is not the Fund's actual return. The hypothetical account values and expenses may not be used to estimate the actual ending account balance or expenses you paid for the period. You may use this information to compare the ongoing costs of investing in the Fund and other funds. To do so, compare this 5% hypothetical example with the 5% hypothetical examples that appear in the shareholder reports of the other funds.
Please note that the expenses shown in the table are meant to highlight your ongoing costs only and do not reflect any transactional costs, such as sales charges (loads). Therefore, the information for each class in the table is useful in comparing ongoing costs only, and will not help you determine the relative total costs of owning different funds. In addition, if these transactional costs were included, your costs would have been higher.
| | | Beginning
Account
Value
7/1/17 | | Actual Ending
Account
Value
12/31/17 | | Hypothetical
Ending Account
Value | | Actual
Expenses
Paid
During
Period* | | Hypothetical
Expenses Paid
During Period* | | Net
Expense
Ratio
During
Period** | |
Global Opportunity Portfolio Class I | | $ | 1,000.00 | | | $ | 1,179.80 | | | $ | 1,021.22 | | | $ | 4.34 | | | $ | 4.02 | | | | 0.79 | % | |
Global Opportunity Portfolio Class A | | | 1,000.00 | | | | 1,177.90 | | | | 1,019.56 | | | | 6.15 | | | | 5.70 | | | | 1.12 | | |
Global Opportunity Portfolio Class L | | | 1,000.00 | | | | 1,177.40 | | | | 1,019.21 | | | | 6.53 | | | | 6.06 | | | | 1.19 | | |
Global Opportunity Portfolio Class C | | | 1,000.00 | | | | 1,173.90 | | | | 1,016.13 | | | | 9.86 | | | | 9.15 | | | | 1.80 | | |
Global Opportunity Portfolio Class IS | | | 1,000.00 | | | | 1,180.40 | | | | 1,021.68 | | | | 3.85 | | | | 3.57 | | | | 0.70 | | |
* Expenses are calculated using each Fund Class' annualized net expense ratio (as disclosed), multiplied by the average account value over the period, and multiplied by 184/365 (to reflect the most recent one-half year period).
** Annualized.
3
Morgan Stanley Institutional Fund, Inc.
Annual Report — December 31, 2017
Investment Overview (unaudited)
Global Opportunity Portfolio
The Fund seeks long-term capital appreciation.
Performance
For the year ended December 31, 2017, the Fund's Class I shares had a total return based on net asset value and reinvestment of distributions per share of 49.44%, net of fees. The Fund's Class I shares outperformed the Fund's benchmark, the MSCI All Country World Index (the "Index"), which returned 23.97%.
Please keep in mind that double-digit returns are highly unusual and cannot be sustained. Investors should also be aware that these returns were primarily achieved during favorable market conditions.
Factors Affecting Performance
• Better-than-expected global economic growth and strong corporate profits provided a positive backdrop for global equity markets. Central bank policy remained largely accommodative as inflation stayed muted, recoveries continued in U.S., Europe and Japan, and China's economy stabilized. Although the U.S. Federal Reserve raised its interest rate three times during 2017, interest rate levels were still historically low, further boosting demand for equities. Political risk abated as key elections across Europe voted in more mainstream candidates, and trade negotiation fears also diminished somewhat, although the North American Free Trade Agreement (NAFTA) and Brexit talks are ongoing. In the U.S., sweeping tax reforms were signed into law in December 2017, fueling a sharp rally in U.S. share prices at year-end. These events helped global equities shrug off geopolitical tensions in North Korea and the Middle East, and natural disasters in the U.S., to end the year sharply higher.
• Global equity markets advanced 23.97% for the 12-month period ended December 31, 2017, as measured by the Index. Against this backdrop, our team remained focused on assessing company prospects over a longer-term period of three to five years, and owning a portfolio of high quality companies with diverse business drivers not tied to a particular market environment.
• The team manages focused portfolios that are highly differentiated from the benchmark, with securities weighted on our assessment of the quality of the company and our conviction. Our longer-term focus results in lower turnover than many of our peers. The value added or detracted in any period of time will typically result from stock selection, given our philosophy and process.
• For the 12-month period, the Fund outperformed the Index due to favorable stock selection and sector allocation.
• The chief contributors to the Fund's relative outperformance were stock selection in consumer discretionary, an overweight allocation in information technology and stock selection in consumer staples.
• Detracting from relative results were an overweight allocation to consumer staples and underweight exposures to materials and industrials.
Management Strategies
• There were no changes to our bottom-up investment process during the period. The team seeks high quality companies, which we define primarily as those with sustainable competitive advantages. Our team continues to focus on bottom-up stock selection and the long-term outlook for companies owned in the Fund; accordingly, we have had very limited turnover in the Fund to date, as our ongoing work reaffirms our assessment of quality and competitive advantage in the names we own.
• At the close of the period, information technology represented the largest sector weight in the Fund, followed by consumer discretionary and consumer staples. The team's bottom-up investment process resulted in sector overweight positions in information technology, consumer discretionary and consumer staples and underweight positions in financials, health care, energy, materials, industrials, real estate, telecommunication services and utilities.
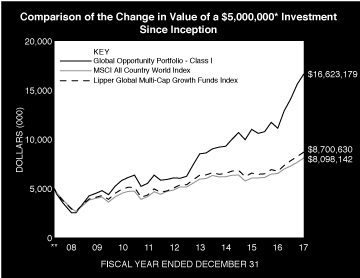
* Minimum Investment for Class I shares
** Commenced Operations on May 30, 2008.
In accordance with SEC regulations, the Fund's performance shown assumes that all recurring fees (including management fees) were deducted and all dividends and distributions were reinvested. The performance of Class A, L, C and IS shares will vary from the performance of Class I shares based upon their different inception dates and will be impacted by additional fees assessed to those classes (if applicable).
4
Morgan Stanley Institutional Fund, Inc.
Annual Report — December 31, 2017
Investment Overview (unaudited) (cont'd)
Global Opportunity Portfolio
Performance Compared to the MSCI All Country World Index(1) and the Lipper Global Multi-Cap Growth Funds Index(2)
| | | Period Ended December 31, 2017
Total Returns(3) | |
| | | | | Average Annual | |
| | | One
Year | | Five
Years | | Ten
Years | | Since
Inception(7) | |
Fund — Class I Shares
w/o sales charges(4) | | | 49.44 | % | | | 22.28 | % | | | — | | | | 13.35 | % | |
Fund — Class A Shares
w/o sales charges(4) | | | 49.03 | | | | 21.87 | | | | — | | | | 18.96 | | |
Fund — Class A Shares with
maximum 5.25% sales charges(4) | | | 41.22 | | | | 20.56 | | | | — | | | | 18.11 | | |
Fund — Class L Shares
w/o sales charges(4) | | | 48.91 | | | | 21.79 | | | | — | | | | 12.93 | | |
Fund — Class C Shares
w/o sales charges(6) | | | 47.92 | | | | — | | | | — | | | | 17.92 | | |
Fund — Class C Shares with
maximum 1.00% deferred
sales charges(6) | | | 46.92 | | | | — | | | | — | | | | 17.92 | | |
Fund — Class IS Shares
w/o sales charges(5) | | | 49.54 | | | | — | | | | — | | | | 21.54 | | |
MSCI All Country World Index | | | 23.97 | | | | 10.80 | | | | — | | | | 5.16 | | |
Lipper Global Multi-Cap Growth
Funds Index | | | 28.87 | | | | 11.49 | | | | — | | | | 5.95 | | |
Performance data quoted represents past performance, which is no guarantee of future results, and current performance may be lower or higher than the figures shown. Performance assumes that all dividends and distributions, if any, were reinvested. For the most recent month-end performance figures, please visit www.morganstanley.com/im. Investment return and principal value will fluctuate so that Fund shares, when redeemed, may be worth more or less than their original cost. Total returns do not reflect the deduction of taxes that a shareholder would pay on Fund distributions or the redemption of Fund shares. Performance of share classes will vary due to difference in sales charges and expenses.
(1) The MSCI All Country World Index (ACWI) is a free float-adjusted market capitalization weighted index designed to measure the equity market performance of developed and emerging markets. The term "free float" represents the portion of shares outstanding that are deemed to be available for purchase in the public equity markets by investors. The Index is unmanaged and its returns do not include any sales charges or fees. Such costs would lower performance. It is not possible to invest directly in an index.
(2) The Lipper Global Multi-Cap Growth Funds Index is an equally weighted performance index of the largest qualifying funds (based on net assets) in the Lipper Global Multi-Cap Growth Funds classification. The Index, which is adjusted for capital gains distributions and income dividends, is unmanaged and should not be considered an investment. There are currently 30 funds represented in this Index. As of the date of this report, the Fund is in the Lipper Global Multi-Cap Growth Funds classification.
(3) Total returns for the Fund reflect fees waived and expenses reimbursed, if applicable, by the Adviser. Without such waivers and reimbursements, total returns would have been lower.
(4) On May 21, 2010, Class C and Class I shares of Van Kampen Global Growth Fund ("the Predecessor Fund") were reorganized into Class L and Class I shares of Morgan Stanley Global Growth Portfolio ("the Fund"), respectively. Class L and Class I shares' returns of the Fund will differ from the Predecessor Fund as they have different expenses. Performance shown for the Fund's Class I and Class L shares reflects the performance of the shares of the Predecessor Fund for periods prior to May 21, 2010. The Class C and I shares of the Predecessor Fund commenced operations on May 30, 2008. Class P shares, which were renamed Class A shares effective September 9, 2013, commenced operations on May 21, 2010. In October 2010, the Morgan Stanley Global Growth Portfolio changed its name to the Morgan Stanley Global Opportunity Portfolio.
(5) Commenced offering on September 13, 2013.
(6) Commenced offering on April 30, 2015.
(7) For comparative purposes, average annual since inception returns listed for the Indexes refer to the inception date of Class I of the Fund, not the inception of the Index.
5
Morgan Stanley Institutional Fund, Inc.
Annual Report — December 31, 2017
Portfolio of Investments
Global Opportunity Portfolio
| | | Shares | | Value
(000) | |
Common Stocks (89.7%) | |
Argentina (1.0%) | |
Globant SA (a) | | | 409,917 | | | $ | 19,045 | | |
Belgium (1.1%) | |
Anheuser-Busch InBev N.V. | | | 189,312 | | | | 21,116 | | |
China (17.1%) | |
Alibaba Group Holding Ltd. ADR (a) | | | 300,653 | | | | 51,842 | | |
China Lodging Group Ltd. ADR | | | 94,303 | | | | 13,620 | | |
China Resources Beer Holdings Co., Ltd. (b) | | | 6,795,333 | | | | 24,389 | | |
Foshan Haitian Flavouring & Food Co., Ltd.,
Class A | | | 3,813,052 | | | | 31,495 | | |
Jiangsu Yanghe Brewery Joint-Stock Co., Ltd.,
Class A | | | 1,228,303 | | | | 21,686 | | |
Oppein Home Group, Inc., Class A (a) | | | 107,672 | | | | 1,951 | | |
Suofeiya Home Collection Co., Ltd.,
Class A | | | 1,834,606 | | | | 10,363 | | |
TAL Education Group ADR | | | 2,899,143 | | | | 86,133 | | |
Tencent Holdings Ltd. (b) | | | 1,354,600 | | | | 70,026 | | |
| | | | 311,505 | | |
Denmark (4.6%) | |
DSV A/S | | | 1,057,169 | | | | 83,233 | | |
France (3.8%) | |
Hermes International | | | 130,663 | | | | 69,943 | | |
India (2.2%) | |
HDFC Bank Ltd. | | | 1,352,941 | | | | 40,064 | | |
Italy (3.0%) | |
Moncler SpA | | | 1,754,360 | | | | 54,811 | | |
Japan (4.4%) | |
Calbee, Inc. | | | 1,031,400 | | | | 33,555 | | |
Keyence Corp. | | | 57,400 | | | | 32,050 | | |
Nihon M&A Center, Inc. | | | 323,800 | | | | 15,434 | | |
| | | | 81,039 | | |
Korea, Republic of (1.4%) | |
Loen Entertainment, Inc. (a) | | | 107,304 | | | | 11,276 | | |
NAVER Corp. | | | 17,263 | | | | 14,016 | | |
| | | | 25,292 | | |
South Africa (2.1%) | |
Naspers Ltd., Class N | | | 134,984 | | | | 37,610 | | |
Switzerland (0.9%) | |
Chocoladefabriken Lindt & Spruengli AG
(Registered) | | | 237 | | | | 17,137 | | |
United Kingdom (6.0%) | |
Fevertree Drinks PLC | | | 1,051,352 | | | | 32,377 | | |
Reckitt Benckiser Group PLC | | | 818,375 | | | | 76,444 | | |
| | | | 108,821 | | |
United States (42.1%) | |
Alphabet, Inc., Class C (a) | | | 72,144 | | | | 75,492 | | |
Amazon.com, Inc. (a) | | | 112,965 | | | | 132,109 | | |
EPAM Systems, Inc. (a) | | | 791,159 | | | | 84,994 | | |
Facebook, Inc., Class A (a) | | | 918,021 | | | | 161,994 | | |
Luxoft Holding, Inc. (a) | | | 257,717 | | | | 14,355 | | |
| | | Shares | | Value
(000) | |
Mastercard, Inc., Class A | | | 615,541 | | | $ | 93,168 | | |
Priceline Group, Inc. (The) (a) | | | 49,561 | | | | 86,124 | | |
Starbucks Corp. | | | 923,715 | | | | 53,049 | | |
Visa, Inc., Class A | | | 586,291 | | | | 66,849 | | |
| | | | 768,134 | | |
Total Common Stocks (Cost $1,137,524) | | | 1,637,750 | | |
Preferred Stocks (0.8%) | |
United States (0.8%) | |
Airbnb, Inc. Series D (a)(c)(d)(e)
(acquisition cost — $1,594;
acquired 4/16/14) | | | 39,153 | | | | 4,152 | | |
Magic Leap Series C (a)(c)(d)(e)
(acquisition cost — $3,175;
acquired 12/22/15) | | | 137,829 | | | | 3,721 | | |
Uber Technologies Series G (a)(c)(d)(e)
(acquisition cost — $8,232;
acquired 12/3/15) | | | 168,793 | | | | 5,925 | | |
Total Preferred Stocks (Cost $13,001) | | | 13,798 | | |
Participation Note (1.2%) | |
China (1.2%) | |
Jiangsu Yanghe Brewery, Class A,
Equity Linked Notes, expires 1/10/18 (a)
(Cost $12,648) | | | 1,230,704 | | | | 21,728 | | |
Short-Term Investment (9.6%) | |
Investment Company (9.6%) | |
Morgan Stanley Institutional Liquidity
Funds — Treasury Securities Portfolio —
Institutional Class (See Note G)
(Cost $174,925) | | | 174,925,259 | | | | 174,925 | | |
Total Investments Excluding Purchased
Options (101.3%) (Cost $1,338,099) | | | 1,848,201 | | |
Total Purchased Options Outstanding (0.0%)
(Cost $2,988) | | | 470 | | |
Total Investments (101.3%)
(Cost $1,341,086) (f)(g) | | | 1,848,671 | | |
Liabilities in Excess of Other Assets (–1.3%) | | | (23,965 | ) | |
Net Assets (100.0%) | | $ | 1,824,706 | | |
Country assignments and aggregations are based generally on third party vendor classifications and information, and may be different from the assignments and aggregations under the policies set forth in the Fund's prospectus and/or statement of additional information relating to geographic classifications.
(a) Non-income producing security.
(b) Security trades on the Hong Kong exchange.
(c) At December 31, 2017, the Fund held fair valued securities valued at approximately $13,798,000, representing 0.8% of net assets. These securities have been fair valued as determined in good faith under procedures established by and under the general supervision of the Company's Directors.
(d) Security has been deemed illiquid at December 31, 2017.
(e) Security cannot be offered for public resale without first being registered under the Securities Act of 1933 and related rules ("restricted security"). Acquisition date represents the day on which an enforceable right to acquire such security is obtained and is presented along with related cost in the security description. The Fund has registration rights for
The accompanying notes are an integral part of the financial statements.
6
Morgan Stanley Institutional Fund, Inc.
Annual Report — December 31, 2017
Portfolio of Investments (cont'd)
Global Opportunity Portfolio
certain restricted securities. Any costs related to such registration are borne by the issuer. The aggregate value of restricted securities (excluding 144A holdings) at December 31, 2017, amounts to approximately $13,798,000 and represents 0.8% of net assets.
(f) The approximate fair value and percentage of net assets, $658,913,000 and 36.1%, respectively, represent the securities that have been fair valued under the fair valuation policy for international investments as described in Note A-1 within the Notes to the Financial Statements.
(g) At December 31, 2017, the aggregate cost for federal income tax purposes is approximately $1,342,619,000. The aggregate gross unrealized appreciation is approximately $516,527,000 and the aggregate gross unrealized depreciation is approximately $10,475,000, resulting in net unrealized appreciation of approximately $506,052,000.
ADR American Depositary Receipt.
Call Options Purchased:
The Fund had the following call options purchased open at December 31, 2017:
Counterparty | | Description | | Strike
Price | | Expiration
Date | | Number of
Contracts | | Notional
Amount
(000) | | Value
(000) | | Premiums
Paid
(000) | | Unrealized
Depreciation
(000) | |
Royal Bank of Scotland | | USD/CNH | | CNH | 7.52 | | | Nov-18 | | | 391,476,372 | | | | 391,476 | | | $ | 382 | | | $ | 1,621 | | | $ | (1,239 | ) | |
Royal Bank of Scotland | | USD/CNH | | CNH | 7.55 | | | Aug-18 | | | 257,945,530 | | | | 257,946 | | | | 88 | | | | 1,367 | | | | (1,279 | ) | |
| | | | | | | | | | | | | $ | 470 | | | $ | 2,988 | | | $ | (2,518 | ) | |
CNH — Chinese Yuan Renminbi Offshore
USD — United States Dollar
Portfolio Composition
Classification | | Percentage of
Total Investments | |
Other* | | | 30.6 | % | |
Internet Software & Services | | | 20.2 | | |
Information Technology Services | | | 14.0 | | |
Internet & Direct Marketing Retail | | | 12.4 | | |
Short-Term Investments | | | 9.5 | | |
Textiles, Apparel & Luxury Goods | | | 6.7 | | |
Beverages | | | 6.6 | | |
Total Investments | | | 100.0 | % | |
* Industries and/or investment types representing less than 5% of total investments.
The accompanying notes are an integral part of the financial statements.
7
Morgan Stanley Institutional Fund, Inc.
Annual Report — December 31, 2017
Global Opportunity Portfolio
Statement of Assets and Liabilities | | December 31, 2017
(000) | |
Assets: | |
Investments in Securities of Unaffiliated Issuers, at Value (Cost $1,166,161) | | $ | 1,673,746 | | |
Investment in Security of Affiliated Issuer, at Value (Cost $174,925) | | | 174,925 | | |
Total Investments in Securities, at Value (Cost $1,341,086) | | | 1,848,671 | | |
Foreign Currency, at Value (Cost $3) | | | 3 | | |
Receivable for Fund Shares Sold | | | 7,024 | | |
Receivable for Investments Sold | | | 254 | | |
Receivable from Affiliate | | | 142 | | |
Tax Reclaim Receivable | | | 63 | | |
Dividends Receivable | | | 1 | | |
Other Assets | | | 146 | | |
Total Assets | | | 1,856,304 | | |
Liabilities: | |
Payable for Investments Purchased | | | 26,218 | | |
Payable for Advisory Fees | | | 2,412 | | |
Deferred Capital Gain Country Tax | | | 710 | | |
Due to Broker | | | 684 | | |
Payable for Fund Shares Redeemed | | | 662 | | |
Payable for Shareholder Services Fees — Class A | | | 160 | | |
Payable for Distribution and Shareholder Services Fees — Class L | | | 10 | | |
Payable for Distribution and Shareholder Services Fees — Class C | | | 85 | | |
Payable for Sub Transfer Agency Fees — Class I | | | 76 | | |
Payable for Sub Transfer Agency Fees — Class A | | | 115 | | |
Payable for Sub Transfer Agency Fees — Class L | | | 9 | | |
Payable for Sub Transfer Agency Fees — Class C | | | 14 | | |
Payable for Administration Fees | | | 120 | | |
Payable for Transfer Agency Fees — Class I | | | 4 | | |
Payable for Transfer Agency Fees — Class A | | | 91 | | |
Payable for Transfer Agency Fees — Class L | | | 13 | | |
Payable for Transfer Agency Fees — Class C | | | 2 | | |
Payable for Transfer Agency Fees — Class IS | | | 1 | | |
Payable for Custodian Fees | | | 84 | | |
Payable for Professional Fees | | | 61 | | |
Other Liabilities | | | 67 | | |
Total Liabilities | | | 31,598 | | |
Net Assets | | $ | 1,824,706 | | |
Net Assets Consist Of: | |
Paid-in-Capital | | $ | 1,300,237 | | |
Accumulated Net Investment Loss | | | (38 | ) | |
Accumulated Undistributed Net Realized Gain | | | 17,635 | | |
Unrealized Appreciation (Depreciation) on: | |
Investments (Net of $710 of Deferred Capital Gain Country Tax) | | | 506,875 | | |
Foreign Currency Translations | | | (3 | ) | |
Net Assets | | $ | 1,824,706 | | |
The accompanying notes are an integral part of the financial statements.
8
Morgan Stanley Institutional Fund, Inc.
Annual Report — December 31, 2017
Global Opportunity Portfolio
Statement of Assets and Liabilities (cont'd) | | December 31, 2017
(000) | |
CLASS I: | |
Net Assets | | $ | 898,008 | | |
| Shares Outstanding $0.001 par value shares of beneficial interest (unlimited shares authorized) (not in 000's) | | | 39,141,483 | | |
Net Asset Value, Offering and Redemption Price Per Share | | $ | 22.94 | | |
CLASS A: | |
Net Assets | | $ | 780,705 | | |
| Shares Outstanding $0.001 par value shares of beneficial interest (unlimited shares authorized) (not in 000's) | | | 35,043,621 | | |
Net Asset Value, Redemption Price Per Share | | $ | 22.28 | | |
Maximum Sales Load | | | 5.25 | % | |
Maximum Sales Charge | | $ | 1.23 | | |
Maximum Offering Price Per Share | | $ | 23.51 | | |
CLASS L: | |
Net Assets | | $ | 39,979 | | |
| Shares Outstanding $0.001 par value shares of beneficial interest (unlimited shares authorized) (not in 000's) | | | 1,816,733 | | |
Net Asset Value, Offering and Redemption Price Per Share | | $ | 22.01 | | |
CLASS C: | |
Net Assets | | $ | 104,364 | | |
| Shares Outstanding $0.001 par value shares of beneficial interest (unlimited shares authorized) (not in 000's) | | | 4,822,814 | | |
Net Asset Value, Offering and Redemption Price Per Share | | $ | 21.64 | | |
CLASS IS: | |
Net Assets | | $ | 1,650 | | |
| Shares Outstanding $0.001 par value shares of beneficial interest (unlimited shares authorized) (not in 000's) | | | 71,723 | | |
Net Asset Value, Offering and Redemption Price Per Share | | $ | 23.00 | | |
The accompanying notes are an integral part of the financial statements.
9
Morgan Stanley Institutional Fund, Inc.
Annual Report — December 31, 2017
Global Opportunity Portfolio
Statement of Operations | | Year Ended
December 31, 2017
(000) | |
Investment Income: | |
Dividends from Securities of Unaffiliated Issuers (Net of $450 of Foreign Taxes Withheld) | | $ | 5,045 | | |
Dividends from Security of Affiliated Issuer (Note G) | | | 724 | | |
Total Investment Income | | | 5,769 | | |
Expenses: | |
Advisory Fees (Note B) | | | 9,221 | | |
Shareholder Services Fees — Class A (Note D) | | | 1,343 | | |
Distribution and Shareholder Services Fees — Class L (Note D) | | | 271 | | |
Distribution and Shareholder Services Fees — Class C (Note D) | | | 619 | | |
Sub Transfer Agency Fees — Class I | | | 445 | | |
Sub Transfer Agency Fees — Class A | | | 561 | | |
Sub Transfer Agency Fees — Class L | | | 26 | | |
Sub Transfer Agency Fees — Class C | | | 53 | | |
Administration Fees (Note C) | | | 946 | | |
Transfer Agency Fees — Class I (Note E) | | | 14 | | |
Transfer Agency Fees — Class A (Note E) | | | 321 | | |
Transfer Agency Fees — Class L (Note E) | | | 45 | | |
Transfer Agency Fees — Class C (Note E) | | | 9 | | |
Transfer Agency Fees — Class IS (Note E) | | | 2 | | |
Registration Fees | | | 140 | | |
Professional Fees | | | 136 | | |
Custodian Fees (Note F) | | | 126 | | |
Shareholder Reporting Fees | | | 102 | | |
Directors' Fees and Expenses | | | 26 | | |
Pricing Fees | | | 6 | | |
Other Expenses | | | 59 | | |
Total Expenses | | | 14,471 | | |
Waiver of Advisory Fees (Note B) | | | (2,243 | ) | |
Distribution Fees — Class L Shares Waived (Note D) | | | (163 | ) | |
Rebate from Morgan Stanley Affiliate (Note G) | | | (159 | ) | |
Reimbursement of Class Specific Expenses — Class IS (Note B) | | | (2 | ) | |
Net Expenses | | | 11,904 | | |
Net Investment Loss | | | (6,135 | ) | |
Realized Gain: | |
Investments Sold | | | 35,394 | | |
Foreign Currency Transactions | | | 40 | | |
Realized Gain | | | 35,434 | | |
Change in Unrealized Appreciation (Depreciation): | |
Investments (Net of Increase in Deferred Capital Gain Country Tax of $710) | | | 391,702 | | |
Foreign Currency Translations | | | (3 | ) | |
Net Change in Unrealized Appreciation (Depreciation) | | | 391,699 | | |
Net Realized Gain and Change in Unrealized Appreciation (Depreciation) | | | 427,133 | | |
Net Increase in Net Assets Resulting from Operations | | $ | 420,998 | | |
The accompanying notes are an integral part of the financial statements.
10
Morgan Stanley Institutional Fund, Inc.
Annual Report — December 31, 2017
Global Opportunity Portfolio
Statements of Changes in Net Assets | | Year Ended
December 31, 2017
(000) | | Year Ended
December 31, 2016
(000) | |
Increase (Decrease) in Net Assets: | |
Operations: | |
Net Investment Loss | | $ | (6,135 | ) | | $ | (3,975 | ) | |
Net Realized Gain | | | 35,434 | | | | 1,145 | | |
Net Change in Unrealized Appreciation (Depreciation) | | | 391,699 | | | | 4,481 | | |
Net Increase in Net Assets Resulting from Operations | | | 420,998 | | | | 1,651 | | |
Distributions from and/or in Excess of: | |
Class I: | |
Net Realized Gain | | | (3,395 | ) | | | (16,271 | ) | |
Class A: | |
Net Realized Gain | | | (3,023 | ) | | | (24,570 | ) | |
Class L: | |
Net Realized Gain | | | (161 | ) | | | (2,200 | ) | |
Class C: | |
Net Realized Gain | | | (415 | ) | | | (2,241 | ) | |
Class IS: | |
Net Realized Gain | | | (6 | ) | | | (1 | ) | |
Total Distributions | | | (7,000 | ) | | | (45,283 | ) | |
Capital Share Transactions:(1) | |
Class I: | |
Subscribed | | | 586,150 | | | | 211,096 | | |
Distributions Reinvested | | | 3,383 | | | | 16,238 | | |
Redeemed | | | (134,747 | ) | | | (193,977 | ) | |
Class A: | |
Subscribed | | | 403,560 | | | | 141,333 | | |
Distributions Reinvested | | | 2,983 | | | | 24,039 | | |
Redeemed | | | (156,944 | ) | | | (150,389 | ) | |
Class L: | |
Exchanged | | | 7 | | | | 14 | | |
Distributions Reinvested | | | 150 | | | | 2,026 | | |
Redeemed | | | (4,146 | ) | | | (4,432 | ) | |
Class C: | |
Subscribed | | | 59,352 | | | | 21,727 | | |
Distributions Reinvested | | | 415 | | | | 2,240 | | |
Redeemed | | | (10,104 | ) | | | (8,851 | ) | |
Class IS: | |
Subscribed | | | 1,433 | | | | 39 | | |
Distributions Reinvested | | | 6 | | | | 1 | | |
Redeemed | | | (26 | ) | | | (746 | ) | |
Net Increase in Net Assets Resulting from Capital Share Transactions | | | 751,472 | | | | 60,358 | | |
Total Increase in Net Assets | | | 1,165,470 | | | | 16,726 | | |
Net Assets: | |
Beginning of Period | | | 659,236 | | | | 642,510 | | |
End of Period (Including Accumulated Net Investment Loss of $(38) and $(356)) | | $ | 1,824,706 | | | $ | 659,236 | | |
The accompanying notes are an integral part of the financial statements.
11
Morgan Stanley Institutional Fund, Inc.
Annual Report — December 31, 2017
Global Opportunity Portfolio
Statements of Changes in Net Assets (cont'd) | | Year Ended
December 31, 2017
(000) | | Year Ended
December 31, 2016
(000) | |
(1) Capital Share Transactions: | |
Class I: | |
Shares Subscribed | | | 29,176 | | | | 13,488 | | |
Shares Issued on Distributions Reinvested | | | 148 | | | | 1,084 | | |
Shares Redeemed | | | (6,742 | ) | | | (12,614 | ) | |
Net Increase in Class I Shares Outstanding | | | 22,582 | | | | 1,958 | | |
Class A: | |
Shares Subscribed | | | 20,282 | | | | 9,197 | | |
Shares Issued on Distributions Reinvested | | | 135 | | | | 1,646 | | |
Shares Redeemed | | | (8,024 | ) | | | (9,883 | ) | |
Net Increase in Class A Shares Outstanding | | | 12,393 | | | | 960 | | |
Class L: | |
Shares Exchanged | | | — | @@ | | | 1 | | |
Shares Issued on Distributions Reinvested | | | 7 | | | | 140 | | |
Shares Redeemed | | | (220 | ) | | | (293 | ) | |
Net Decrease in Class L Shares Outstanding | | | (213 | ) | | | (152 | ) | |
Class C: | |
Shares Subscribed | | | 3,047 | | | | 1,439 | | |
Shares Issued on Distributions Reinvested | | | 19 | | | | 156 | | |
Shares Redeemed | | | (545 | ) | | | (589 | ) | |
Net Increase in Class C Shares Outstanding | | | 2,521 | | | | 1,006 | | |
Class IS: | |
Shares Subscribed | | | 71 | | | | 3 | | |
Shares Issued on Distributions Reinvested | | | — | @@ | | | — | @@ | |
Shares Redeemed | | | (1 | ) | | | (51 | ) | |
Net Increase (Decrease) in Class IS Shares Outstanding | | | 70 | | | | (48 | ) | |
@@ Amount is less than 500 shares.
The accompanying notes are an integral part of the financial statements.
12
Morgan Stanley Institutional Fund, Inc.
Annual Report — December 31, 2017
Financial Highlights
Global Opportunity Portfolio
| | | Class I | |
| | | Year Ended December 31, | |
Selected Per Share Data and Ratios | | 2017 | | 2016(1) | | 2015 | | 2014 | | 2013 | |
Net Asset Value, Beginning of Period | | $ | 15.41 | | | $ | 16.36 | | | $ | 13.98 | | | $ | 13.65 | | | $ | 10.84 | | |
Income (Loss) from Investment Operations: | |
Net Investment Loss(2) | | | (0.06 | ) | | | (0.05 | ) | | | (0.05 | ) | | | (0.06 | ) | | | (0.02 | ) | |
Net Realized and Unrealized Gain | | | 7.68 | | | | 0.18 | | | | 2.64 | | | | 1.26 | | | | 4.21 | | |
Total from Investment Operations | | | 7.62 | | | | 0.13 | | | | 2.59 | | | | 1.20 | | | | 4.19 | | |
Distributions from and/or in Excess of: | |
Net Realized Gain | | | (0.09 | ) | | | (1.08 | ) | | | (0.21 | ) | | | (0.87 | ) | | | (1.38 | ) | |
Net Asset Value, End of Period | | $ | 22.94 | | | $ | 15.41 | | | $ | 16.36 | | | $ | 13.98 | | | $ | 13.65 | | |
Total Return(3) | | | 49.44 | % | | | 1.05 | % | | | 18.50 | % | | | 9.04 | % | | | 40.12 | % | |
Ratios and Supplemental Data: | |
Net Assets, End of Period (Thousands) | | $ | 898,008 | | | $ | 255,187 | | | $ | 238,920 | | | $ | 11,037 | | | $ | 7,293 | | |
Ratio of Expenses to Average Net Assets(7) | | | 0.79 | %(4) | | | 0.80 | %(4) | | | 0.98 | %(4)(5) | | | 1.17 | %(4) | | | 1.24 | %(4) | |
Ratio of Net Investment Loss to Average Net Assets(7) | | | (0.31 | )%(4) | | | (0.34 | )%(4) | | | (0.33 | )%(4) | | | (0.42 | )%(4) | | | (0.21 | )%(4) | |
Ratio of Rebate from Morgan Stanley Affiliates to Average Net Assets | | | 0.01 | % | | | 0.01 | % | | | 0.01 | % | | | 0.01 | % | | | 0.00 | %(6) | |
Portfolio Turnover Rate | | | 30 | % | | | 37 | % | | | 115 | % | | | 29 | % | | | 38 | % | |
(7) Supplemental Information on the Ratios to Average Net Assets: | |
Ratios Before Expense Limitation: | |
Expenses to Average Net Assets | | | 0.99 | % | | | 1.07 | % | | | 1.20 | % | | | 2.47 | % | | | 3.36 | % | |
Net Investment Loss to Average Net Assets | | | (0.51 | )% | | | (0.61 | )% | | | (0.55 | )% | | | (1.72 | )% | | | (2.33 | )% | |
(1) Reflects prior period custodian out-of-pocket expenses that were reimbursed in September 2016. The amount of the reimbursement was immaterial on a per share basis and did not impact the total return of Class I shares. The Ratio of Expenses to Average Net Assets and the Ratio of Net Investment Loss to Average Net Assets would be unchanged as the reimbursement of custodian fees was offset against expense waivers/reimbursements with no impact to net expenses or net investment loss.
(2) Per share amount is based on average shares outstanding.
(3) Calculated based on the net asset value as of the last business day of the period.
(4) The Ratios of Expenses and Net Investment Loss reflect the rebate of certain Fund expenses in connection with the investments in Morgan Stanley affiliates during the period. The effect of the rebate on the ratios is disclosed in the above table as "Ratio of Rebate from Morgan Stanley Affiliates to Average Net Assets."
(5) Effective December 7, 2015, the Adviser has agreed to limit the ratio of expenses to average net assets to the maximum ratio of 0.81% for Class I shares. Prior to December 7, 2015, the maximum ratio was 1.10% for Class I shares. Prior to January 23, 2015, the maximum ratio was 1.25% for Class I shares.
(6) Amount is less than 0.005%.
The accompanying notes are an integral part of the financial statements.
13
Morgan Stanley Institutional Fund, Inc.
Annual Report — December 31, 2017
Financial Highlights
Global Opportunity Portfolio
| | | Class A | |
| | | Year Ended December 31, | |
Selected Per Share Data and Ratios | | 2017 | | 2016(1) | | 2015 | | 2014 | | 2013 | |
Net Asset Value, Beginning of Period | | $ | 15.01 | | | $ | 16.03 | | | $ | 13.75 | | | $ | 13.48 | | | $ | 10.75 | | |
Income (Loss) from Investment Operations: | |
Net Investment Loss(2) | | | (0.12 | ) | | | (0.11 | ) | | | (0.10 | ) | | | (0.11 | ) | | | (0.15 | ) | |
Net Realized and Unrealized Gain | | | 7.48 | | | | 0.17 | | | | 2.59 | | | | 1.25 | | | | 4.26 | | |
Total from Investment Operations | | | 7.36 | | | | 0.06 | | | | 2.49 | | | | 1.14 | | | | 4.11 | | |
Distributions from and/or in Excess of: | |
Net Realized Gain | | | (0.09 | ) | | | (1.08 | ) | | | (0.21 | ) | | | (0.87 | ) | | | (1.38 | ) | |
Net Asset Value, End of Period | | $ | 22.28 | | | $ | 15.01 | | | $ | 16.03 | | | $ | 13.75 | | | $ | 13.48 | | |
Total Return(3) | | | 49.03 | % | | | 0.62 | % | | | 18.16 | % | | | 8.55 | % | | | 39.80 | % | |
Ratios and Supplemental Data: | |
Net Assets, End of Period (Thousands) | | $ | 780,705 | | | $ | 340,092 | | | $ | 347,683 | | | $ | 12,952 | | | $ | 4,057 | | |
Ratio of Expenses to Average Net Assets(8) | | | 1.12 | %(4) | | | 1.17 | %(4) | | | 1.25 | %(4)(6) | | | 1.56 | %(4) | | | 1.59 | %(4)(5) | |
Ratio of Net Investment Loss to Average Net Assets(8) | | | (0.63 | )%(4) | | | (0.70 | )%(4) | | | (0.64 | )%(4) | | | (0.82 | )%(4) | | | (1.15 | )%(4) | |
Ratio of Rebate from Morgan Stanley Affiliates to Average Net Assets | | | 0.01 | % | | | 0.01 | % | | | 0.01 | % | | | 0.01 | % | | | 0.00 | %(7) | |
Portfolio Turnover Rate | | | 30 | % | | | 37 | % | | | 115 | % | | | 29 | % | | | 38 | % | |
(8) Supplemental Information on the Ratios to Average Net Assets: | |
Ratios Before Expense Limitation: | |
Expenses to Average Net Assets | | | 1.32 | % | | | 1.41 | % | | | 1.50 | % | | | 2.86 | % | | | 3.93 | % | |
Net Investment Loss to Average Net Assets | | | (0.83 | )% | | | (0.94 | )% | | | (0.89 | )% | | | (2.12 | )% | | | (3.49 | )% | |
(1) Reflects prior period custodian out-of-pocket expenses that were reimbursed in September 2016. The amount of the reimbursement was immaterial on a per share basis and did not impact the total return of Class A shares. The Ratio of Expenses to Average Net Assets and the Ratio of Net Investment Loss to Average Net Assets would be unchanged as the reimbursement of custodian fees was offset against expense waivers/reimbursements with no impact to net expenses or net investment loss.
(2) Per share amount is based on average shares outstanding.
(3) Calculated based on the net asset value which does not reflect sales charges, if applicable, as of the last business day of the period.
(4) The Ratios of Expenses and Net Investment Loss reflect the rebate of certain Fund expenses in connection with the investments in Morgan Stanley affiliates during the period. The effect of the rebate on the ratios is disclosed in the above table as "Ratio of Rebate from Morgan Stanley Affiliates to Average Net Assets."
(5) Effective September 16, 2013, the Adviser has agreed to limit the ratio of expenses to average net assets to the maximum ratio of 1.60% for Class A shares. Prior to September 16, 2013, the maximum ratio was 1.50% for Class A shares.
(6) Effective December 7, 2015, the Adviser has agreed to limit the ratio of expenses to average net assets to the maximum ratio of 1.23% for Class A shares. Prior to January 23, 2015, the maximum ratio was 1.45% for Class A shares. Prior to January 23, 2015, the maximum ratio was 1.60% for Class A shares.
(7) Amount is less than 0.005%.
The accompanying notes are an integral part of the financial statements.
14
Morgan Stanley Institutional Fund, Inc.
Annual Report — December 31, 2017
Financial Highlights
Global Opportunity Portfolio
| | | Class L | |
| | | Year Ended December 31, | |
Selected Per Share Data and Ratios | | 2017 | | 2016(1) | | 2015 | | 2014 | | 2013 | |
Net Asset Value, Beginning of Period | | $ | 14.84 | | | $ | 15.87 | | | $ | 13.62 | | | $ | 13.38 | | | $ | 10.68 | | |
Income (Loss) from Investment Operations: | |
Net Investment Loss(2) | | | (0.13 | ) | | | (0.12 | ) | | | (0.11 | ) | | | (0.12 | ) | | | (0.07 | ) | |
Net Realized and Unrealized Gain | | | 7.39 | | | | 0.17 | | | | 2.57 | | | | 1.23 | | | | 4.15 | | |
Total from Investment Operations | | | 7.26 | | | | 0.05 | | | | 2.46 | | | | 1.11 | | | | 4.08 | | |
Distributions from and/or in Excess of: | |
Net Realized Gain | | | (0.09 | ) | | | (1.08 | ) | | | (0.21 | ) | | | (0.87 | ) | | | (1.38 | ) | |
Net Asset Value, End of Period | | $ | 22.01 | | | $ | 14.84 | | | $ | 15.87 | | | $ | 13.62 | | | $ | 13.38 | | |
Total Return(3) | | | 48.91 | % | | | 0.56 | % | | | 18.03 | % | | | 8.46 | % | | | 39.79 | % | |
Ratios and Supplemental Data: | |
Net Assets, End of Period (Thousands) | | $ | 39,979 | | | $ | 30,133 | | | $ | 34,628 | | | $ | 1,091 | | | $ | 527 | | |
Ratio of Expenses to Average Net Assets(8) | | | 1.20 | %(4) | | | 1.25 | %(4) | | | 1.30 | %(4)(6) | | | 1.64 | %(4) | | | 1.58 | %(4)(5) | |
Ratio of Net Investment Loss to Average Net Assets(8) | | | (0.67 | )%(4) | | | (0.79 | )%(4) | | | (0.70 | )%(4) | | | (0.87 | )%(4) | | | (0.57 | )%(4) | |
Ratio of Rebate from Morgan Stanley Affiliates to Average Net Assets | | | 0.01 | % | | | 0.01 | % | | | 0.01 | % | | | 0.01 | % | | | 0.00 | %(7) | |
Portfolio Turnover Rate | | | 30 | % | | | 37 | % | | | 115 | % | | | 29 | % | | | 38 | % | |
(8) Supplemental Information on the Ratios to Average Net Assets: | |
Ratios Before Expense Limitation: | |
Expenses to Average Net Assets | | | 1.86 | % | | | 1.93 | % | | | 2.03 | % | | | 3.52 | % | | | 4.23 | % | |
Net Investment Loss to Average Net Assets | | | (1.33 | )% | | | (1.47 | )% | | | (1.43 | )% | | | (2.75 | )% | | | (3.22 | )% | |
(1) Reflects prior period custodian out-of-pocket expenses that were reimbursed in September 2016. The amount of the reimbursement was immaterial on a per share basis and did not impact the total return of Class L shares. The Ratio of Expenses to Average Net Assets and the Ratio of Net Investment Loss to Average Net Assets would be unchanged as the reimbursement of custodian fees was offset against expense waivers/reimbursements with no impact to net expenses or net investment loss.
(2) Per share amount is based on average shares outstanding.
(3) Calculated based on the net asset value as of the last business day of the period.
(4) The Ratios of Expenses and Net Investment Loss reflect the rebate of certain Fund expenses in connection with the investments in Morgan Stanley affiliates during the period. The effect of the rebate on the ratios is disclosed in the above table as "Ratio of Rebate from Morgan Stanley Affiliates to Average Net Assets."
(5) Effective September 16, 2013, the Adviser has agreed to limit the ratio of expenses to average net assets to the maximum ratio of 1.65% for Class L shares. Prior to September 16, 2013, the maximum ratio was 1.55% for Class L shares.
(6) Effective January 23, 2015, the Adviser has agreed to limit the ratio of expenses to average net assets to the maximum ratio of 1.50% for Class L shares. Prior to January 23, 2015, the maximum ratio was 1.65% for Class L shares.
(7) Amount is less than 0.005%.
The accompanying notes are an integral part of the financial statements.
15
Morgan Stanley Institutional Fund, Inc.
Annual Report — December 31, 2017
Financial Highlights
Global Opportunity Portfolio
| | | Class C | |
| | | Year Ended December 31, | | Period from
April 30, 2015(2) to | |
Selected Per Share Data and Ratios | | 2017 | | 2016(1) | | December 31, 2015 | |
Net Asset Value, Beginning of Period | | $ | 14.69 | | | $ | 15.80 | | | $ | 15.25 | | |
Income (Loss) from Investment Operations: | |
Net Investment Loss(3) | | | (0.26 | ) | | | (0.21 | ) | | | (0.15 | ) | |
Net Realized and Unrealized Gain | | | 7.30 | | | | 0.18 | | | | 0.91 | | |
Total from Investment Operations | | | 7.04 | | | | (0.03 | ) | | | 0.76 | | |
Distributions from and/or in Excess of: | |
Net Realized Gain | | | (0.09 | ) | | | (1.08 | ) | | | (0.21 | ) | |
Net Asset Value, End of Period | | $ | 21.64 | | | $ | 14.69 | | | $ | 15.80 | | |
Total Return(4) | | | 47.92 | % | | | 0.05 | % | | | 4.95 | %(6) | |
Ratios and Supplemental Data: | |
Net Assets, End of Period (Thousands) | | $ | 104,364 | | | $ | 33,801 | | | $ | 20,475 | | |
Ratio of Expenses to Average Net Assets(8) | | | 1.81 | %(5) | | | 1.84 | %(5) | | | 2.03 | %(5)(7) | |
Ratio of Net Investment Loss to Average Net Assets(8) | | | (1.33 | )%(5) | | | (1.38 | )%(5) | | | (1.40 | )%(5)(7) | |
Ratio of Rebate from Morgan Stanley Affiliates to Average Net Assets | | | 0.01 | % | | | 0.01 | % | | | 0.01 | %(7) | |
Portfolio Turnover Rate | | | 30 | % | | | 37 | % | | | 115 | % | |
(8) Supplemental Information on the Ratios to Average Net Assets: | |
Ratios Before Expense Limitation: | |
Expenses to Average Net Assets | | | 2.01 | % | | | 2.08 | % | | | 2.22 | %(7) | |
Net Investment Loss to Average Net Assets | | | (1.53 | )% | | | (1.62 | )% | | | (1.59 | )%(7) | |
(1) Reflects prior period custodian out-of-pocket expenses that were reimbursed in September 2016. The amount of the reimbursement was immaterial on a per share basis and did not impact the total return of Class C shares. The Ratio of Expenses to Average Net Assets and the Ratio of Net Investment Loss to Average Net Assets would be unchanged as the reimbursement of custodian fees was offset against expense waivers/reimbursements with no impact to net expenses or net investment loss.
(2) Commencement of Offering.
(3) Per share amount is based on average shares outstanding.
(4) Calculated based on the net asset value which does not reflect sales charges, if applicable, as of the last business day of the period.
(5) The Ratios of Expenses and Net Investment Loss reflect the rebate of certain Fund expenses in connection with the investments in Morgan Stanley affiliates during the period. The effect of the rebate on the ratios is disclosed in the above table as "Ratio of Rebate from Morgan Stanley Affiliates to Average Net Assets."
(6) Not annualized.
(7) Annualized.
The accompanying notes are an integral part of the financial statements.
16
Morgan Stanley Institutional Fund, Inc.
Annual Report — December 31, 2017
Financial Highlights
Global Opportunity Portfolio
| | | Class IS | |
| | | Year Ended December 31, | | Period from
September 13, 2013(2) to | |
Selected Per Share Data and Ratios | | 2017 | | 2016(1) | | 2015 | | 2014 | | December 31, 2013 | |
Net Asset Value, Beginning of Period | | $ | 15.44 | | | $ | 16.38 | | | $ | 13.99 | | | $ | 13.65 | | | $ | 12.43 | | |
Income (Loss) from Investment Operations: | |
Net Investment Loss(3) | | | (0.05 | ) | | | (0.06 | ) | | | (0.05 | ) | | | (0.06 | ) | | | (0.03 | ) | |
Net Realized and Unrealized Gain | | | 7.70 | | | | 0.20 | | | | 2.65 | | | | 1.27 | | | | 2.27 | | |
Total from Investment Operations | | | 7.65 | | | | 0.14 | | | | 2.60 | | | | 1.21 | | | | 2.24 | | |
Distributions from and/or in Excess of: | |
Net Realized Gain | | | (0.09 | ) | | | (1.08 | ) | | | (0.21 | ) | | | (0.87 | ) | | | (1.02 | ) | |
Net Asset Value, End of Period | | $ | 23.00 | | | $ | 15.44 | | | $ | 16.38 | | | $ | 13.99 | | | $ | 13.65 | | |
Total Return(4) | | | 49.54 | % | | | 1.11 | % | | | 18.64 | % | | | 8.96 | % | | | 18.35 | %(9) | |
Ratios and Supplemental Data: | |
Net Assets, End of Period (Thousands) | | $ | 1,650 | | | $ | 23 | | | $ | 804 | | | $ | 11 | | | $ | 11 | | |
Ratio of Expenses to Average Net Assets(11) | | | 0.71 | %(5) | | | 0.71 | %(5) | | | 0.77 | %(5)(7) | | | 1.17 | %(5) | | | 1.18 | %(5)(6)(10) | |
Ratio of Net Investment Loss to Average Net Assets(11) | | | (0.23 | )%(5) | | | (0.41 | )%(5) | | | (0.28 | )%(5) | | | (0.42 | )%(5) | | | (0.74 | )%(5)(10) | |
Ratio of Rebate from Morgan Stanley Affiliates to Average Net Assets | | | 0.01 | % | | | 0.01 | % | | | 0.01 | % | | | 0.01 | % | | | 0.00 | %(8)(10) | |
Portfolio Turnover Rate | | | 30 | % | | | 37 | % | | | 115 | % | | | 29 | % | | | 38 | % | |
(11) Supplemental Information on the Ratios to Average Net Assets: | |
Ratios Before Expense Limitation: | |
Expenses to Average Net Assets | | | 1.24 | % | | | 3.82 | % | | | 3.56 | % | | | 19.50 | % | | | 8.44 | %(10) | |
Net Investment Loss to Average Net Assets | | | (0.76 | )% | | | (3.52 | )% | | | (3.07 | )% | | | (18.75 | )% | | | (8.00 | )%(10) | |
(1) Reflects prior period custodian out-of-pocket expenses that were reimbursed in September 2016. The amount of the reimbursement was immaterial on a per share basis and did not impact the total return of Class IS shares. The Ratio of Expenses to Average Net Assets and the Ratio of Net Investment Loss to Average Net Assets would be unchanged as the reimbursement of custodian fees was offset against expense waivers/reimbursements with no impact to net expenses or net investment loss.
(2) Commencement of Offering.
(3) Per share amount is based on average shares outstanding.
(4) Calculated based on the net asset value as of the last business day of the period.
(5) The Ratios of Expenses and Net Investment Loss reflect the rebate of certain Fund expenses in connection with the investments in Morgan Stanley affiliates during the period. The effect of the rebate on the ratios is disclosed in the above table as "Ratio of Rebate from Morgan Stanley Affiliates to Average Net Assets."
(6) Effective September 16, 2013, the Adviser has agreed to limit the ratio of expenses to average net assets to the maximum ratio of 1.18% for Class IS shares.
(7) Effective December 7, 2015, the Adviser has agreed to limit the ratio of expenses to average net assets to the maximum ratio of 0.72% for Class IS shares. Prior to December 7, 2015, the maximum ratio was 1.03% for Class IS shares. Prior to January 23, 2015, the maximum ratio was 1.18% for Class IS shares.
(8) Amount is less than 0.005%.
(9) Not annualized.
(10) Annualized.
The accompanying notes are an integral part of the financial statements.
17
Morgan Stanley Institutional Fund, Inc.
Annual Report — December 31, 2017
Notes to Financial Statements
Morgan Stanley Institutional Fund, Inc. (the "Company") is registered under the Investment Company Act of 1940, as amended (the "Act"), as an open-end management investment company. The Company is comprised of twenty-nine separate, active, diversified and non-diversified funds (individually referred to as a "Fund", collectively as the "Funds"). The Company applies investment company accounting and reporting guidance.
The accompanying financial statements relate to the Global Opportunity Portfolio. The Fund seeks long-term capital appreciation.
The Fund offers five classes of shares — Class I, Class A, Class L, Class C and Class IS. On April 30, 2015, the Fund suspended offering of Class L shares. Existing Class L shareholders may invest through reinvestment of dividends and distributions.
A. Significant Accounting Policies: The following significant accounting policies are in conformity with U.S. generally accepted accounting principles ("GAAP"). Such policies are consistently followed by the Company in the preparation of its financial statements. GAAP may require management to make estimates and assumptions that affect the reported amounts and disclosures in the financial statements. Actual results may differ from those estimates.
1. Security Valuation: (1) An equity portfolio security listed or traded on an exchange is valued at its latest reported sales price (or at the exchange official closing price if such exchange reports an official closing price), and if there were no sales on a given day and if there is no official exchange closing price for that day, the security is valued at the mean between the last reported bid and asked prices if such bid and asked prices are available on the relevant exchanges. Listed equity securities not traded on the valuation date with no reported bid and asked prices available on the exchange are valued at the mean between the current bid and asked prices obtained from one or more reputable brokers or dealers. In cases where a security is traded on more than one exchange, the security is valued on the exchange designated as the primary market; (2) all other equity portfolio securities for which over-the-counter ("OTC") market quotations are readily available are valued at the latest reported sales price (or at the market official closing price if such market reports an official closing price), and if there was no trading in the security on a given day and if there is no official closing
price from relevant markets for that day, the security is valued at the mean between the last reported bid and asked prices if such bid and asked prices are available on the relevant markets. An unlisted equity security that does not trade on the valuation date and for which bid and asked prices from the relevant markets are unavailable is valued at the mean between the current bid and asked prices obtained from one or more reputable brokers or dealers; (3) certain portfolio securities may be valued by an outside pricing service/vendor approved by the Company's Board of Directors (the "Directors"). The pricing service/vendor may employ a pricing model that takes into account, among other things, bids, yield spreads, and/or other market data and specific security characteristics. Alternatively, if a valuation is not available from an outside pricing service/vendor, and the security trades on an exchange, the security may be valued at its latest reported sale price (or at the exchange official closing price if such exchange reports an official closing price), prior to the time when assets are valued. If there are no sales on a given day and if there is no official exchange closing price for that day, the security is valued at the mean between the last reported bid and asked prices if such bid and asked prices are available in the relevant exchanges; (4) listed options are valued at the last reported sales price on the exchange on which they are listed (or at the exchange official closing price if such exchange reports an official closing price). If an official closing price or last reported sales price is unavailable, the listed option should be fair valued at the mean between its latest bid and ask prices. Unlisted options are valued at the mean between their latest bid and ask prices from a broker/dealer or valued by a pricing service/vendor; (5) when market quotations are not readily available, including circumstances under which Morgan Stanley Investment Management Inc. (the "Adviser") determines that the closing price, last sale price or the mean between the last reported bid and asked prices are not reflective of a security's market value, portfolio securities are valued at their fair value as determined in good faith under procedures established by and under the general supervision of the Directors. Occasionally, developments affecting the closing prices of securities and other assets may occur between the times at which valuations of such securities are determined (that is, close of the foreign market on which the securities trade) and the close of business of the New York Stock Exchange ("NYSE"). If developments occur during such periods that are expected
18
Morgan Stanley Institutional Fund, Inc.
Annual Report — December 31, 2017
Notes to Financial Statements (cont'd)
to materially affect the value of such securities, such valuations may be adjusted to reflect the estimated fair value of such securities as of the close of the NYSE, as determined in good faith by the Directors or by the Adviser using a pricing service and/or procedures approved by the Directors; (6) quotations of foreign portfolio securities, other assets and liabilities and forward contracts stated in foreign currency are translated into U.S. dollar equivalents at the prevailing market rates prior to the close of the NYSE; and (7) investments in mutual funds, including the Morgan Stanley Institutional Liquidity Funds, are valued at the net asset value ("NAV") as of the close of each business day.
The Directors have responsibility for determining in good faith the fair value of the investments, and the Directors may appoint others, such as the Company's Adviser or a valuation committee, to assist the Directors in determining fair value and to make the actual calculations pursuant to the fair valuation methodologies previously approved by the Directors. Under procedures approved by the Directors, the Company's Adviser has formed a Valuation Committee whose members are approved by the Directors. The Valuation Committee provides administration and oversight of the Company's valuation policies and procedures, which are reviewed at least annually by the Directors. These procedures allow the Company to utilize independent pricing services, quotations from securities and financial instrument dealers, and other market sources to determine fair value.
The Company has procedures to determine the fair value of securities and other financial instruments for which market prices are not readily available. Under these procedures, the Valuation Committee convenes on a regular and ad hoc basis to review such securities and considers a number of factors, including valuation methodologies and significant unobservable valuation inputs, when arriving at fair value. The Valuation Committee may employ a market-based approach which may use related or comparable assets or liabilities, recent transactions, market multiples, book values, and other relevant information for the investment to determine the fair value of the investment. An income-based valuation approach may also be used in which the anticipated future cash flows of the investment are discounted to calculate fair value. Discounts may also be applied due to the nature or duration of any restrictions on the disposition of the investments. Due to the
inherent uncertainty of valuations of such investments, the fair values may differ significantly from the values that would have been used had an active market existed. The Valuation Committee employs various methods for calibrating these valuation approaches including a regular review of valuation methodologies, key inputs and assumptions, transactional back-testing or disposition analysis, and reviews of any related market activity.
2. Fair Value Measurement: Financial Accounting Standards Board ("FASB") Accounting Standards CodificationTM ("ASC") 820, "Fair Value Measurement" ("ASC 820"), defines fair value as the value that the Fund would receive to sell an investment or pay to transfer a liability in a timely transaction with an independent buyer in the principal market, or in the absence of a principal market, the most advantageous market for the investment or liability. ASC 820 establishes a three-tier hierarchy to distinguish between (1) inputs that reflect the assumptions market participants would use in valuing an asset or liability developed based on market data obtained from sources independent of the reporting entity (observable inputs) and (2) inputs that reflect the reporting entity's own assumptions about the assumptions market participants would use in valuing an asset or liability developed based on the best information available in the circumstances (unobservable inputs) and to establish classification of fair value measurements for disclosure purposes. Various inputs are used in determining the value of the Fund's investments. The inputs are summarized in the three broad levels listed below.
• Level 1 – unadjusted quoted prices in active markets for identical investments
• Level 2 – other significant observable inputs (including quoted prices for similar investments, interest rates, prepayment speeds, credit risk, etc.)
• Level 3 – significant unobservable inputs including the Fund's own assumptions in determining the fair value of investments. Factors considered in making this determination may include, but are not limited to, information obtained by contacting the issuer, analysts, or the appropriate stock exchange (for exchange-traded securities), analysis of the issuer's financial statements or other available documents and, if necessary, available information concerning other securities in similar circumstances
19
Morgan Stanley Institutional Fund, Inc.
Annual Report — December 31, 2017
Notes to Financial Statements (cont'd)
The inputs or methodology used for valuing securities are not necessarily an indication of the risk associated with investing in those securities and the determination of the significance of a particular input to the fair value measurement in its entirety requires judgment and considers factors specific to each security.
The following is a summary of the inputs used to value the Fund's investments as of December 31, 2017.
Investment Type | | Level 1
Unadjusted
quoted
prices
(000) | | Level 2
Other
significant
observable
inputs
(000) | | Level 3
Significant
unobservable
inputs
(000) | | Total
(000) | |
Assets: | |
Common Stocks | |
Banks | | $ | — | | | $ | 40,064 | | | $ | — | | | $ | 40,064 | | |
Beverages | | | — | | | | 99,568 | | | | — | | | | 99,568 | | |
Diversified Consumer
Services | | | 86,133 | | | | — | | | | — | | | | 86,133 | | |
Electronic Equipment,
Instruments &
Components | | | — | | | | 32,050 | | | | — | | | | 32,050 | | |
Food Products | | | — | | | | 82,187 | | | | — | | | | 82,187 | | |
Hotels, Restaurants &
Leisure | | | 66,669 | | | | — | | | | — | | | | 66,669 | | |
Household Durables | | | — | | | | 12,314 | | | | — | | | | 12,314 | | |
Household Products | | | — | | | | 76,444 | | | | — | | | | 76,444 | | |
Information
Technology
Services | | | 259,366 | | | | — | | | | — | | | | 259,366 | | |
Internet & Direct
Marketing Retail | | | 218,233 | | | | — | | | | — | | | | 218,233 | | |
Internet Software &
Services | | | 289,328 | | | | 84,042 | | | | — | | | | 373,370 | | |
Media | | | — | | | | 48,886 | | | | — | | | | 48,886 | | |
Professional Services | | | — | | | | 15,434 | | | | — | | | | 15,434 | | |
Road & Rail | | | — | | | | 83,233 | | | | — | | | | 83,233 | | |
Software | | | 19,045 | | | | — | | | | — | | | | 19,045 | | |
Textiles, Apparel &
Luxury Goods | | | — | | | | 124,754 | | | | — | | | | 124,754 | | |
Total Common Stocks | | | 938,774 | | | | 698,976 | | | | — | | | | 1,637,750 | | |
Preferred Stocks | |
Electronic Equipment,
Instruments &
Components | | | — | | | | — | | | | 3,721 | | | | 3,721 | | |
Internet & Direct
Marketing Retail | | | — | | | | — | | | | 10,077 | | | | 10,077 | | |
Total Preferred
Stocks | | | — | | | | — | | | | 13,798 | | | | 13,798 | | |
Participation Notes | | | — | | | | 21,728 | | | | — | | | | 21,728 | | |
Call Options
Purchased | | | — | | | | 470 | | | | — | | | | 470 | | |
Short-Term
Investment | |
Investment Company | | | 174,925 | | | | — | | | | — | | | | 174,925 | | |
Total Assets | | $ | 1,113,699 | | | $ | 721,174 | | | $ | 13,798 | | | $ | 1,848,671 | | |
Transfers between investment levels may occur as the markets fluctuate and/or the availability of data used in an investment's valuation changes. The Fund recognizes transfers between the levels as of the end of the period. As of December 31, 2017, securities with a total value of approximately $523,515,000 transferred from Level 1 to Level 2. Securities that were valued using unadjusted quoted prices at December 31, 2016 were valued using other significant observable inputs at December 31, 2017. At December 31, 2017, the fair value of certain securities were adjusted due to developments which occurred between the time of the close of the foreign markets on which they trade and the close of business on the NYSE which resulted in their Level 2 classification.
Following is a reconciliation of investments in which significant unobservable inputs (Level 3) were used in determining fair value.
| | | Common
Stock
(000) | | Preferred
Stocks
(000) | |
Beginning Balance | | $ | — | † | | $ | 15,545 | | |
Purchases | | | — | | | | — | | |
Sales | | | — | † | | | (138 | ) | |
Amortization of discount | | | — | | | | — | | |
Transfers in | | | — | | | | — | | |
Transfers out | | | — | | | | — | | |
Corporate actions | | | — | | | | — | | |
Change in unrealized appreciation
(depreciation) | | | — | | | | (1,696 | ) | |
Realized gains (losses) | | | — | | | | 87 | | |
Ending Balance | | $ | — | | | $ | 13,798 | | |
Net change in unrealized appreciation
(depreciation) from investments
still held as of December 31, 2017 | | $ | — | | | $ | (1,634 | ) | |
† Includes one security which is valued at zero.
20
Morgan Stanley Institutional Fund, Inc.
Annual Report — December 31, 2017
Notes to Financial Statements (cont'd)
The following table presents additional information about valuation techniques and inputs used for investments that are measured at fair value and categorized within Level 3 as of December 31, 2017. Various valuation techniques were used in the valuation of certain investments and weighted based on the level of significance.
| | | Fair Value at
December 31, 2017
(000) | | Valuation
Technique | | Unobservable
Input | | Range | | Selected
Value | | Impact to
Valuation from an
increase in input | |
Electronic Equipment, Instuments & Components | |
Preferred Stock | | $ | 3,721 | | | Market Transaction
Method | | Precedent Transaction | | $ | 27.00 | | | $ | 27.00 | | | $ | 27.00 | | | Increase | |
| | | | | Discounted Cash Flow | | Weighted Average
Cost of Capital | | | 25.0 | % | | | 27.0 | % | | | 26.0 | % | | Decrease | |
| | | | | | | Perpetual Growth Rate | | | 3.0 | % | | | 4.0 | % | | | 3.5 | % | | Increase | |
| | | | | Market Comparable
Companies | | Enterprise Value/
Revenue | | | 12.0 | x | | | 34.2 | x | | | 12.3 | x | | Increase | |
| | | | | | | Discount for Lack
of Marketability | | | 20.0 | % | | | 20.0 | % | | | 20.0 | % | | Decrease | |
Internet & Direct Marketing Retail | |
Preferred Stocks | | $ | 4,152 | | | Discounted Cash Flow | | Weighted Average
Cost of Capital | | | 15.5 | % | | | 17.5 | % | | | 16.5 | % | | Decrease | |
| | | | | | | Perpetual Growth Rate | | | 3.0 | % | | | 4.0 | % | | | 3.5 | % | | Increase | |
| | | | | Market Comparable
Companies | | Enterprise Value/
Revenue | | | 8.7 | x | | | 14.1 | x | | | 10.1 | x | | Increase | |
| | | | | | | Discount for Lack
of Marketability | | | 20.0 | % | | | 20.0 | % | | | 20.0 | % | | Decrease | |
| | | $ | 5,925 | | | Market Transaction
Method | | Pending Transaction* | | $ | 32.97 | | | $ | 48.77 | | | $ | 35.10 | | | Increase | |
*Based on a market transaction announced prior to December 31, 2017 that closed subsequent to December 31, 2017.
3. Foreign Currency Translation and Foreign Investments: The books and records of the Fund are maintained in U.S. dollars. Foreign currency amounts are translated into U.S. dollars as follows:
– investments, other assets and liabilities at the prevailing rate of exchange on the valuation date;
– investment transactions and investment income at the prevailing rates of exchange on the dates of such transactions.
Although the net assets of the Fund are presented at the foreign exchange rates and market values at the close of the period, the Fund does not isolate that portion of the results of operations arising as a result of changes in the foreign exchange rates from the fluctuations arising from changes in the market prices of securities held at period end. Similarly, the Fund does not isolate the effect of changes in foreign exchange rates from the fluctuations arising from changes in the market prices of securities sold during the period. Accordingly, realized and unrealized foreign currency gains (losses) on investments in securities are included in the reported net
realized and unrealized gains (losses) on investment transactions and balances. However, pursuant to U.S. federal income tax regulations, gains and losses from certain foreign currency transactions and the foreign currency portion of gains and losses realized on sales and maturities of foreign denominated debt securities are treated as ordinary income for U.S. federal income tax purposes.
Net realized gains (losses) on foreign currency transactions represent net foreign exchange gains (losses) from foreign currency forward exchange contracts, disposition of foreign currencies, currency gains (losses) realized between the trade and settlement dates on securities transactions, and the difference between the amount of investment income and foreign withholding taxes recorded on the Fund's books and the U.S. dollar equivalent amounts actually received or paid. Net unrealized currency gains (losses) from valuing foreign currency denominated assets and liabilities at period end exchange rates are reflected as a component of unrealized appreciation (depreciation) in the Statement of Assets and Liabilities. The change in unrealized
21
Morgan Stanley Institutional Fund, Inc.
Annual Report — December 31, 2017
Notes to Financial Statements (cont'd)
currency gains (losses) on foreign currency translations for the period is reflected in the Statement of Operations.
Foreign security and currency transactions may involve certain considerations and risks not typically associated with those of U.S. dollar denominated transactions as a result of, among other factors, fluctuations of exchange rates in relation to the U.S. dollar, the possibility of lower levels of governmental supervision and regulation of foreign securities markets and the possibility of political or economic instability.
Governmental approval for foreign investments may be required in advance of making an investment under certain circumstances in some countries, and the extent of foreign investments in domestic companies may be subject to limitation in other countries. Foreign ownership limitations also may be imposed by the charters of individual companies to prevent, among other concerns, violations of foreign investment limitations. As a result, an additional class of shares (identified as "Foreign" in the Portfolio of Investments) may be created and offered for investment. The "local" and "foreign shares" market values may differ. In the absence of trading of the foreign shares in such markets, the Fund values the foreign shares at the closing exchange price of the local shares.
4. Derivatives: The Fund may, but is not required to, use derivative instruments for a variety of purposes, including hedging, risk management, portfolio management or to earn income. Derivatives are financial instruments whose value is based, in part, on the value of an underlying asset, interest rate, index or financial instrument. Prevailing interest rates and volatility levels, among other things, also affect the value of derivative instruments. A derivative instrument often has risks similar to its underlying asset and may have additional risks, including imperfect correlation between the value of the derivative and the underlying asset, risks of default by the counterparty to certain transactions, magnification of losses incurred due to changes in the market value of the securities, instruments, indices or interest rates to which the derivative instrument relates, risks that the transactions may not be liquid and risks arising from margin requirements. The use of derivatives involves risks that are different from, and possibly greater than, the risks associated with other portfolio investments. Derivatives may involve the use of highly specialized instruments that require investment
techniques and risk analyses different from those associated with other portfolio investments. All of the Fund's holdings, including derivative instruments, are marked-to-market each day with the change in value reflected in unrealized appreciation (depreciation). Upon disposition, a realized gain or loss is recognized.
Certain derivative transactions may give rise to a form of leverage. Leverage magnifies the potential for gain and the risk of loss. Leverage associated with derivative transactions may cause the Fund to liquidate portfolio positions when it may not be advantageous to do so to satisfy its obligations or to meet earmarking or segregation requirements, pursuant to applicable Securities and Exchange Commission ("SEC") rules and regulations, or may cause the Fund to be more volatile than if the Fund had not been leveraged. Although the Adviser seeks to use derivatives to further the Fund's investment objectives, there is no assurance that the use of derivatives will achieve this result.
Following is a description of the derivative instruments and techniques that the Fund used during the period and their associated risks:
Options: With respect to options, the Fund is subject to equity risk, interest rate risk and foreign currency exchange risk in the normal course of pursuing its investment objectives. If the Fund buys an option, it buys a legal contract giving it the right to buy or sell a specific amount of the underlying instrument or foreign currency, or futures contract on the underlying instrument or foreign currency, at an agreed-upon price during a period of time or on a specified date typically in exchange for a premium paid by the Fund. The Fund may purchase and/or sell put and call options. Purchasing call options tends to increase the Fund's exposure to the underlying (or similar) instrument. Purchasing put options tends to decrease the Fund's exposure to the underlying (or similar) instrument. When entering into purchased option contracts, the Fund bears the risk of interest or exchange rates or securities prices moving unexpectedly, in which case, the Fund may not achieve the anticipated benefits of the purchased option contracts; however the risk of loss is limited to the premium paid. Purchased options are reported as part of "Total Investments in Securities" in the Statement of Assets and Liabilities. Premium paid for purchasing options which expired are treated as realized losses. If the Fund sells an
22
Morgan Stanley Institutional Fund, Inc.
Annual Report — December 31, 2017
Notes to Financial Statements (cont'd)
option, it sells to another party the right to buy from or sell to the Fund a specific amount of the underlying instrument or foreign currency, or futures contract on the underlying instrument or foreign currency, at an agreed-upon price during a period of time or on a specified date typically in exchange for a premium received by the Fund. When options are purchased OTC, the Fund bears the risk that the counterparty that wrote the option will be unable or unwilling to perform its obligations under the option contract. Options may also be illiquid and the Fund may have difficulty closing out its position. A decision as to whether, when and how to use options involves the exercise of skill and judgment and even a well-conceived option transaction may be unsuccessful because of market behavior or unexpected events. The prices of options can be highly volatile and the use of options can lower total returns.
FASB ASC 815, "Derivatives and Hedging" ("ASC 815"), is intended to improve financial reporting about derivative instruments by requiring enhanced disclosures to enable investors to better understand how and why the Fund uses derivative instruments, how these derivative instruments are accounted for and their effects on the Fund's financial position and results of operations.
The following table sets forth the fair value of the Fund's derivative contracts by primary risk exposure as of December 31, 2017.
| | | Asset Derivatives
Statement of Assets and
Liabilities Location | | Primary Risk
Exposure | | Value
(000) | |
Options Purchased
| | Investments, at Value
(Options Purchased) | | Currency Risk | | | $470(a) | | |
(a) Amounts are included in Investments in Securities in the Statement of Assets and Liabilities.
The following tables set forth by primary risk exposure the Fund's realized gains (losses) and change in unrealized appreciation (depreciation) by type of derivative contract for the year ended December 31, 2017 in accordance with ASC 815.
Realized Gain (Loss) | |
Primary Risk Exposure | | Derivative Type | | Value
(000) | |
Currency Risk | | Investments
(Options Purchased) | | $ | (357 | )(b) | |
(b) Amounts are included in Investments Sold in the Statement of Operations.
Change in Unrealized Appreciation (Depreciation) | |
Primary Risk Exposure | | Derivative Type | | Value
(000) | |
Currency Risk | | Investments
(Options Purchased) | | $ | (2,487 | )(c) | |
(c) Amounts are included in Investments in the Statement of Operations.
At December 31, 2017, the Fund's derivative assets and liabilities are as follows:
Gross Amounts of Assets and Liabilities
Presented in the Statement of Assets and Liabilities | |
Derivatives | | Assets(d)
(000) | | Liabilities(d)
(000) | |
Options Purchased | | $ | 470 | (a) | | $ | — | | |
(a) Amounts are included in Investments in Securities in the Statement of Assets and Liabilities.
(d) Absent an event of default or early termination, OTC derivative assets and liabilities are presented gross and not offset in the Statement of Assets and Liabilities.
The Fund typically enters into International Swaps and Derivatives Association, Inc. Master Agreements ("ISDA Master Agreements") or similar master agreements (collectively, "Master Agreements") with its contract counterparties for certain OTC derivatives in order to, among other things, reduce its credit risk to counterparties. ISDA Master Agreements include provisions for general obligations, representations, collateral and events of default or termination. Under an ISDA Master Agreement, the Fund typically may offset with the counterparty certain OTC derivative financial instruments' payables and/or receivables with collateral held and/or posted and create one single net payment (close-out netting) in the event of default, termination and/or potential deterioration in the credit quality of the counterparty. Various Master Agreements govern the terms of certain transactions with counterparties, including transactions such as swap, forward, repurchase and reverse repurchase agreements. These Master Agreements typically attempt to reduce the counterparty risk associated with such transactions by specifying credit protection mechanisms and providing standardization that improves legal certainty. Cross-termination provisions under Master Agreements typically provide that a default in connection with one transaction between the Fund and a counterparty gives the non-defaulting party the right to terminate any other transactions in place with the defaulting party to create one single net payment due to/due from the defaulting party and may be a feature in certain Master Agreements. In the event the Fund exercises its right to terminate a Master Agreement after a counterparty experiences a termination event as defined in the
23
Morgan Stanley Institutional Fund, Inc.
Annual Report — December 31, 2017
Notes to Financial Statements (cont'd)
Master Agreement, the return of collateral with market value in excess of the Fund's net liability may be delayed or denied.
The following table presents derivative financial instruments that are subject to enforceable netting arrangements as of December 31, 2017.
Gross Amounts Not Offset in the Statement of Assets and Liabilities | |
Counterparty | | Gross Asset
Derivatives
Presented in
Statement of
Assets and
Liabilities
(000) | | Financial
Instrument
(000) | | Collateral
Received(e)
(000) | | Net Amount
(not less
than $0)
(000) | |
Royal Bank of Scotland | | $ | 470 | (a) | | $ | — | | | $ | (470 | ) | | | 0 | | |
(a) Amounts are included in Investments in Securities in the Statement of Assets and Liabilities.
(e) In some instances, the actual collateral received may be more than the amount shown here due to overcollateralization.
For the year ended December 31, 2017, the approximate average monthly amount outstanding for each derivative type is as follows:
Options Purchased: | |
Average monthly notional amount | | | 201,799,000 | | |
5. Structured Investments: The Fund invested a portion of its assets in structured investments. A structured investment is a derivative security designed to offer a return linked to a particular underlying security, currency, commodity or market. Structured investments may come in various forms including notes (such as exchange-traded notes), warrants and options to purchase securities. The Fund will typically use structured investments to gain exposure to a permitted underlying security, currency, commodity or market when direct access to a market is limited or inefficient from a tax or cost standpoint. There can be no assurance that structured investments will trade at the same price or have the same value as the underlying security, currency, commodity or market. Investments in structured investments involve risks including issuer risk, counterparty risk and market risk. Holders of structured investments bear risks of the underlying investment and are subject to issuer or counterparty risk because the Fund is relying on the creditworthiness of such issuer or counterparty and has no rights with respect to the underlying investment. Certain structured investments may be thinly traded or have a limited trading market and may have the effect of increasing the Fund's illiquidity to the extent that
the Fund, at a particular time, may be unable to find qualified buyers for these securities.
6. Restricted Securities: The Fund invests in unregistered or otherwise restricted securities. The term "restricted securities" refers to securities that are unregistered or are held by control persons of the issuer and securities that are subject to contractual restrictions on their resale. As a result, restricted securities may be more difficult to value and the Fund may have difficulty disposing of such assets either in a timely manner or for a reasonable price. In order to dispose of an unregistered security, the Fund, where it has contractual rights to do so, may have to cause such security to be registered. A considerable period may elapse between the time the decision is made to sell the security and the time the security is registered so that the Fund can sell it. Contractual restrictions on the resale of securities vary in length and scope and are generally the result of a negotiation between the issuer and the acquirer of the securities. The Fund would, in either case, bear market risks during that period. Restricted securities are identified in the Portfolio of Investments.
7. Indemnifications: The Company enters into contracts that contain a variety of indemnifications. The Company's maximum exposure under these arrangements is unknown. However, the Company has not had prior claims or losses pursuant to these contracts and expects the risk of loss to be remote.
8. Dividends and Distributions to Shareholders: Dividends and distributions to shareholders are recorded on the ex-dividend date. Dividends from net investment income, if any, are declared and paid annually. Net realized capital gains, if any, are distributed at least annually.
9. Security Transactions, Income and Expenses: Security transactions are accounted for on the trade date (date the order to buy or sell is executed). Realized gains and losses on the sale of investment securities are determined on the specific identified cost method. Dividend income and other distributions are recorded on the ex-dividend date (except for certain foreign dividends which may be recorded as soon as the Fund is informed of such dividends) net of applicable withholding taxes. Interest income is recognized on the accrual basis except where collection is in doubt. Discounts are accreted and premiums are amortized over the life of the respective securities. Most expenses of the Company can be directly
24
Morgan Stanley Institutional Fund, Inc.
Annual Report — December 31, 2017
Notes to Financial Statements (cont'd)
attributed to a particular Fund. Expenses which cannot be directly attributed are apportioned among the Funds based upon relative net assets or other appropriate methods. Income, expenses (other than class specific expenses — distribution and shareholder services, transfer agency and sub transfer agency fees) and realized and unrealized gains or losses are allocated to each class of shares based upon their relative net assets.
B. Advisory Fees: The Adviser, a wholly-owned subsidiary of Morgan Stanley, provides the Fund with advisory services under the terms of an Investment Advisory Agreement, paid quarterly, at the annual rate based on the daily net assets as follows:
First $750
million | | Next $750
million | | Over $1.5
billion | |
| | 0.80 | % | | | 0.75 | % | | | 0.70 | % | |
For the year ended December 31, 2017, the advisory fee rate (net of waiver/rebate) was equivalent to an annual effective rate of 0.58% of the Fund's average daily net assets.
The Adviser has agreed to reduce its advisory fee and/or reimburse the Fund so that total annual portfolio operating expenses, excluding certain investment related expenses, taxes, interest and other extraordinary expenses (including litigation), will not exceed 0.81% for Class I shares, 1.23% for Class A shares, 1.50% for Class L shares, 2.20% for Class C shares and 0.72% for Class IS shares. Effective January 1, 2018, the Adviser has agreed to reduce its advisory fee and/or reimburse the Fund so that the total annual portfolio operating expenses will not exceed 1.00% for Class I shares, 1.35% for Class A shares, 1.40% for Class L shares, 2.10% for Class C shares and 0.95% for Class IS. The fee waivers and/or expense reimbursements will continue for at least one year from the date of the Fund's prospectus or until such time as the Directors act to discontinue all or a portion of such waivers and/or reimbursements when they deem such action is appropriate. For the year ended December 31, 2017, approximately $2,243,000 of advisory fees were waived and approximately $2,000 of other expenses were reimbursed by the Adviser pursuant to this arrangement.
C. Administration Fees: The Adviser also serves as Administrator to the Company and provides administrative services pursuant to an Administration Agreement for an annual fee, accrued daily and paid monthly, of 0.08% of the Fund's average daily net assets.
Under a Sub-Administration Agreement between the Administrator and State Street Bank and Trust Company ("State Street"), State Street provides certain administrative services to
the Company. For such services, the Administrator pays State Street a portion of the fee the Administrator receives from the Fund.
D. Distribution and Shareholder Services Fees: Morgan Stanley Distribution, Inc. ("MSDI" or the "Distributor"), a wholly-owned subsidiary of the Adviser and an indirect subsidiary of Morgan Stanley, serves as the Company's Distributor of Fund shares pursuant to a Distribution Agreement. The Company has adopted a Shareholder Services Plan with respect to Class A shares pursuant to Rule 12b-1 under the Act. Under the Shareholder Services Plan, the Fund pays the Distributor a shareholder services fee, accrued daily and paid monthly, at an annual rate of 0.25% of the Fund's average daily net assets attributable to Class A shares.
The Company has adopted a Distribution and Shareholder Services Plan with respect to Class L shares pursuant to Rule 12b-1 under the Act. Under the Distribution and Shareholder Services Plan, the Fund pays the Distributor a distribution fee, accrued daily and paid monthly, at an annual rate of 0.50% and a shareholder services fee, accrued daily and paid monthly, at an annual rate of 0.25% of the Fund's average daily net assets attributable to Class L shares. The Distributor has agreed to waive for at least one year from the date of the Fund's prospectus, the 12b-1 fees on Class L shares of the Fund to the extent it exceeds 0.30% of the average daily net assets of such shares on an annualized basis. For the year ended December 31, 2017, this waiver amounted to approximately $163,000.
The Company has adopted a Distribution and Shareholder Services Plan with respect to Class C shares pursuant to Rule 12b-1 under the Act. Under the Distribution and Shareholder Services Plan, the Fund pays the Distributor a distribution fee, accrued daily and paid monthly, at an annual rate of 0.75% and a shareholder services fee, accrued daily and paid monthly, at an annual rate of 0.25% of the Fund's average daily net assets attributable to Class C shares.
The distribution and shareholder services fees are used to support the expenses associated with servicing and maintaining accounts. The Distributor may compensate other parties for providing shareholder support services to investors who purchase Class A, Class L and Class C shares.
E. Dividend Disbursing and Transfer Agent: The Company's dividend disbursing and transfer agent is Boston Financial Data Services, Inc. ("BFDS"). Pursuant to a Transfer Agency Agreement, the Company pays BFDS a fee based on
25
Morgan Stanley Institutional Fund, Inc.
Annual Report — December 31, 2017
Notes to Financial Statements (cont'd)
the number of classes, accounts and transactions relating to the Funds of the Company. Effective January 1, 2018, BFDS changed its name to DST Asset Manager Solutions, Inc.
F. Custodian Fees: State Street (the "Custodian") also serves as Custodian for the Company in accordance with a Custodian Agreement. The Custodian holds cash, securities, and other assets of the Company as required by the Act. Custody fees are payable monthly based on assets held in custody, investment purchases and sales activity and account maintenance fees, plus reimbursement for certain out-of-pocket expenses.
G. Security Transactions and Transactions with Affiliates: For the year ended December 31, 2017, purchases and sales of investment securities for the Fund, other than long-term U.S. Government securities and short-term investments, were approximately $910,717,000 and $320,214,000, respectively. There were no purchases and sales of long-term U.S. Government securities for the year ended December 31, 2017.
The Fund invests in the Institutional Class of the Morgan Stanley Institutional Liquidity Funds — Treasury Securities Portfolio (the "Liquidity Funds"), an open-end management investment company managed by the Adviser. Advisory fees paid by the Fund are reduced by an amount equal to its pro-rata share of the advisory and administration fees paid by the Liquidity Funds. Fund due to its investment in the For the year ended December 31, 2017, advisory fees paid were reduced by approximately $159,000 relating to the Fund's investment in the Liquidity Funds.
A summary of the Fund's transactions in shares of the Liquidity Funds during the year ended December 31, 2017 is as follows:
Affiliated
Investment
Company | | Value
December 31,
2016
(000) | | Purchases
at Cost
(000) | | Proceeds
from Sales
(000) | | Dividend
Income
(000) | |
Liquidity Funds | | $ | 18,397 | | | $ | 605,680 | | | $ | 449,152 | | | $ | 724 | | |
Affiliated
Investment
Company (cont'd) | | Realized
Gain
(Loss)
(000) | | Change in
Unrealized
Appreciation
(Depreciation)
(000) | | Value
December 31,
2017
(000) | |
Liquidity Funds | | $ | — | | | $ | — | | | $ | 174,925 | | |
During the year ended December 31, 2017, the Fund incurred less than $500 in brokerage commissions with Morgan Stanley & Co., LLC, an affiliate of the Adviser/Administrator and Distributor, for portfolio transactions executed on behalf of the Fund.
The Fund is permitted to purchase and sell securities ("cross-trade") from and to other Morgan Stanley Funds as well as other funds and client accounts for which the Adviser or an affiliate of the Adviser serves as investment adviser, pursuant to procedures approved by the Directors in compliance with Rule 17a-7 under the Act (the "Rule"). Each cross-trade is executed at the current market price in compliance with provisions of the Rule. For the year ended December 31, 2017, the Fund did not engage in any cross-trade transactions.
The Fund has an unfunded Deferred Compensation Plan (the "Compensation Plan"), which allows each independent Director to defer payment of all, or a portion, of the fees he or she receives for serving on the Board of Directors. Each eligible Director generally may elect to have the deferred amounts credited with a return equal to the total return on one or more of the Morgan Stanley funds that are offered as investment options under the Compensation Plan. Appreciation/depreciation and distributions received from these investments are recorded with an offsetting increase/decrease in the deferred compensation obligation and do not affect the NAV of the Fund.
H. Federal Income Taxes: It is the Fund's intention to continue to qualify as a regulated investment company and distribute all of its taxable and tax-exempt income. Accordingly, no provision for federal income taxes is required in the financial statements.
The Fund may be subject to taxes imposed by countries in which it invests. Such taxes are generally based on income and/or capital gains earned or repatriated. Taxes are accrued based on net investment income, net realized gains and net unrealized appreciation as such income and/or gains are earned. Taxes may also be based on transactions in foreign currency and are accrued based on the value of investments denominated in such currency.
FASB ASC 740-10, "Income Taxes — Overall", sets forth a minimum threshold for financial statement recognition of the benefit of a tax position taken or expected to be taken in a tax return. Management has concluded there are no significant uncertain tax positions that would require recognition in the financial statements. If applicable, the Fund recognizes interest accrued related to unrecognized tax benefits in "Interest Expense" and penalties in "Other Expenses" in the Statement of Operations. The Fund files tax returns with the U.S. Internal Revenue Service, New York and various states. Generally, each of the tax years in the four-year period ended December 31, 2017, remains subject to examination by taxing authorities.
26
Morgan Stanley Institutional Fund, Inc.
Annual Report — December 31, 2017
Notes to Financial Statements (cont'd)
The tax character of distributions paid may differ from the character of distributions shown in the Statements of Changes in Net Assets due to short-term capital gains being treated as ordinary income for tax purposes. The tax character of distributions paid during fiscal years 2017 and 2016 was as follows:
2017
Distributions
Paid From: | | 2016
Distributions
Paid From: | |
Ordinary
Income
(000) | | Long-Term
Capital Gain
(000) | | Ordinary
Income
(000) | | Long-Term
Capital Gain
(000) | |
| $ | 7,000 | | | $ | — | | | $ | — | | | $ | 45,283 | | |
The amount and character of income and gains to be distributed are determined in accordance with income tax regulations which may differ from GAAP. These book/tax differences are either considered temporary or permanent in nature.
Temporary differences are primarily due to differing book and tax treatments for the timing of the recognition of gains (losses) on certain investment transactions and the timing of the deductibility of certain expenses.
Permanent differences, primarily due to differing treatments of gains (losses) related to foreign currency transactions and a net operating loss, resulted in the following reclassifications among the components of net assets at December 31, 2017:
Accumulated
Net Investment
Loss
(000) | | Accumulated
Undistributed
Net Realized
Gain
(000) | | Paid-in-
Capital
(000) | |
| $ | 6,453 | | | $ | (6,475 | ) | | $ | 22 | | |
At December 31, 2017, the components of distributable earnings for the Fund on a tax basis were as follows:
Undistributed
Ordinary
Income
(000) | | Undistributed
Long-Term
Capital Gain
(000) | |
| $ | 12,719 | | | $ | 6,447 | | |
I. Credit Facility: The Company and other Morgan Stanley funds participated in a $150,000,000 committed, unsecured revolving line of credit facility (the "Facility") with State Street. This Facility is to be used for temporary emergency purposes or funding of shareholder redemption requests. The interest rate on borrowings is based on the federal funds rate or 1 month LIBOR rate plus a spread. The Facility also has a commitment fee of 0.25% per annum based on the unused portion of the Facility. During the year ended December 31, 2017, the Fund did not have any borrowings under the Facility.
J. Other: At December 31, 2017, the Fund had record owners of 10% or greater. Investment activities of these sharehold-
ers could have a material impact on the Fund. The aggregate percentage of such owners was 32.0%.
27
Morgan Stanley Institutional Fund, Inc.
Annual Report — December 31, 2017
Report of Independent Registered Public Accounting Firm
To the Shareholders and Board of Directors of
Morgan Stanley Institutional Fund, Inc. —
Global Opportunity Portfolio
Opinion on the Financial Statements
We have audited the accompanying statement of assets and liabilities of Global Opportunity Portfolio (the "Fund") (one of the funds constituting the Morgan Stanley Institutional Fund, Inc. (the "Company")), including the portfolio of investments, as of December 31, 2017, and the related statement of operations for the year then ended, the statements of changes in net assets for each of the two years in the period then ended, the financial highlights for each of the five years in the period then ended and the related notes (collectively referred to as the "financial statements"). In our opinion, the financial statements present fairly, in all material respects, the financial position of Global Opportunity Portfolio (one of the funds constituting Morgan Stanley Institutional Fund, Inc.) at December 31, 2017, the results of its operations for the year then ended, the changes in its net assets for each of the two years in the period then ended and its financial highlights for each of the five years in the period then ended, in conformity with U.S. generally accepted accounting principles.
Basis for Opinion
These financial statements are the responsibility of the Company's management. Our responsibility is to express an opinion on the Fund's financial statements based on our audits. We are a public accounting firm registered with the Public Company Accounting Oversight Board (United States) ("PCAOB") and are required to be independent with respect to the Company in accordance with the U.S. federal securities law and the applicable rules and regulations of the Securities and Exchange Commission and the PCAOB.
We conducted our audits in accordance with the standards of the PCAOB. Those standards require that we plan and perform the audit to obtain reasonable assurance about whether the financial statements are free of material misstatement, whether due to error or fraud. The Company is not required to have, nor were we engaged to perform, an audit of the Company's internal control over financial reporting. As part of our audits, we are required to obtain an understanding of internal control over financial reporting, but not for the purpose of expressing an opinion on the effectiveness of the Company's internal control over financial reporting. Accordingly, we express no such opinion.
Our audits included performing procedures to assess the risks of material misstatement of the financial statements, whether due to error or fraud, and performing procedures that respond to those risks. Such procedures included examining, on a test basis, evidence regarding the amounts and disclosures in the financial statements. Our procedures included confirmation of securities owned as of December 31, 2017 by correspondence with the custodian and others or by other appropriate auditing procedures where replies from others were not received. Our audits also included evaluating the accounting principles used and significant estimates made by management, as well as evaluating the overall presentation of the financial statements. We believe that our audits provide a reasonable basis for our opinion.

We have served as the auditor of one or more Morgan Stanley investment companies since 2000.
Boston, Massachusetts
February 26, 2018
28
Morgan Stanley Institutional Fund, Inc.
Annual Report — December 31, 2017
Federal Tax Notice (unaudited)
For federal income tax purposes, the following information is furnished with respect to the distributions paid by the Fund during its taxable year ended December 31, 2017. For corporate shareholders 5.12% of the dividends qualified for the dividends received deduction.
For federal income tax purposes, the following information is furnished with respect to the Fund's earnings for its taxable year ended December 31, 2017. When distributed, certain earnings may be subject to a maximum tax rate of 15% as provided for by the Jobs and Growth Tax Relief Reconciliation Act of 2003. The Fund designated up to a maximum of approximately $4,989,000 as taxable at this lower rate.
In January, the Fund provides tax information to shareholders for the preceding calendar year.
29
Morgan Stanley Institutional Fund, Inc.
Annual Report — December 31, 2017
Privacy Notice (unaudited)
MORGAN STANLEY INVESTMENT MANAGEMENT INC.
AN IMPORTANT NOTICE CONCERNING OUR U.S. PRIVACY POLICY
We are required by federal law to provide you with a copy of our privacy policy annually. This policy applies to current and former individual investors in funds managed or sponsored by Morgan Stanley Investment Management Inc. ("MSIM") as well as current and former individual clients of MSIM. This policy is not applicable to partnerships, corporations, trusts or other non-individual clients or investors. Please note that we may amend this policy at any time, and will inform you of any changes as required by law.
WE RESPECT YOUR PRIVACY
We appreciate that you have provided us with your personal financial information. We strive to maintain the privacy of such information while we help you achieve your financial objectives. This Notice describes what non-public personal information we collect about you, why we collect it, when we may share it with others and how certain others may use it. It discusses the steps you may take to limit our sharing of certain information about you to affiliated companies in the Morgan Stanley family of companies ("other Morgan Stanley companies"). It also discloses how you may limit use of certain shared information for marketing purposes by other Morgan Stanley branded companies. Throughout this policy, we refer to the non-public information that personally identifies you or your accounts as "personal information.''
1. WHAT PERSONAL INFORMATION DO WE COLLECT ABOUT YOU?
We obtain personal information from applications and other forms you submit to us, from your dealings with us, from consumer reporting agencies, from our Web sites and from third parties and other sources.
For example:
• We may collect information such as your name, address, e-mail address, telephone/fax numbers, assets, income and investment objectives through subscription documents, applications and other forms you submit to us.
• We may obtain information about account balances, your use of account(s) and the types of products and services you prefer to receive from us through your dealings and transactions with us and other sources.
• We may obtain information about your creditworthiness and credit history from consumer reporting agencies.
• We may collect background information from and through third-party vendors to verify representations you have made and to comply with various regulatory requirements.
• If you interact with us through our public and private Web sites, we may collect information that you provide directly through online communications (such as an e-mail address). We may also collect information about your Internet service provider, your domain name, your computer's operating system and Web browser, your use of our Web sites and your product and service preferences, through the use of "cookies." Please consult the Terms of Use of these sites for more details.
2. WHEN DO WE DISCLOSE PERSONAL INFORMATION WE COLLECT ABOUT YOU?
We may disclose personal information we collect about you to other Morgan Stanley companies and to non-affiliated third parties.
a. Information We Disclose to Other Morgan Stanley Companies.
We may disclose personal information to other Morgan Stanley companies for a variety of reasons, including to manage your account(s) effectively, to service and process your transactions, to let you know about products and services offered by us and other Morgan Stanley companies, to manage our business, and as otherwise required or permitted by law. Offers for products and services from other Morgan Stanley companies are developed under conditions designed to safeguard your personal information.
30
Morgan Stanley Institutional Fund, Inc.
Annual Report — December 31, 2017
Privacy Notice (unaudited) (cont'd)
b. Information We Disclose to Non-affiliated Third Parties.
We do not disclose personal information that we collect about you to non-affiliated third parties except to those who provide marketing services on our behalf, to financial institutions with whom we have joint marketing agreements, and as otherwise required or permitted by law. For example, we may disclose personal information to non-affiliated third parties for servicing and processing transactions, to offer our own products and services, to protect against fraud, for institutional risk control, to respond to judicial process or to perform services on our behalf. When we share personal information with a non-affiliated third party, they are required to limit their use of personal information to the particular purpose for which it was shared and they are not allowed to share personal information with others except to fulfill that limited purpose or as may be permitted or required by law.
3. HOW DO WE PROTECT THE SECURITY AND CONFIDENTIALITY OF PERSONAL INFORMATION WE COLLECT ABOUT YOU?
We maintain physical, electronic and procedural security measures to help safeguard the personal information we collect about you. We have internal policies governing the proper handling of client information. Third parties that provide support or marketing services on our behalf may also receive personal information, and we require them to adhere to confidentiality standards with respect to such information.
4. HOW CAN YOU LIMIT THE SHARING OF CERTAIN TYPES OF PERSONAL INFORMATION WITH OTHER MORGAN STANLEY COMPANIES?
We offer you choices as to whether we share with other Morgan Stanley companies the personal information that was collected to determine your eligibility for products and services you request ("eligibility information"). Eligibility information does not include your identification information or personal information pertaining to our transactions or experiences with you. Please note that, even if you direct us not to share eligibility information with other Morgan Stanley companies ("opt-out"), we may still share personal information, including eligibility information, with those companies in circumstances excluded from the opt-out under applicable law, such as to process transactions or to service your account.
5. HOW CAN YOU LIMIT THE USE OF CERTAIN TYPES OF PERSONAL INFORMATION BY OTHER MORGAN STANLEY COMPANIES FOR MARKETING?
By following the opt-out instructions in Section 6 below, you may limit other Morgan Stanley branded companies from marketing their products or services to you based on personal information we disclose to them. This information may include, for example, your income and account history with us. Please note that, even if you choose to limit Other Morgan Stanley Companies from using personal information about you that we may share with them for marketing their products and services to you, Other Morgan Stanley Companies may use your personal information that they obtain from us to market to you in circumstances permitted by law, such as if the Other Morgan Stanley Company has its own relationship with you.
6. HOW CAN YOU SEND US AN OPT-OUT INSTRUCTION?
If you wish to limit our sharing of eligibility information about you with other Morgan Stanley companies or other Morgan Stanley companies' use of personal information for marketing purposes, as described in this notice, you may do so by:
• Calling us at (800) 548-7786
Monday–Friday between 8a.m. and 6p.m.(EST)
• Writing to us at the following address:
DST Asset Manager Solutions, Inc.
c/o Privacy Coordinator
P.O. Box 219804
Kansas City, Missouri 64121
31
Morgan Stanley Institutional Fund, Inc.
Annual Report — December 31, 2017
Privacy Notice (unaudited) (cont'd)
Your written request should include your name, address, telephone number and account number(s) to which the opt-out applies and whether you are opting out with respect to sharing of eligibility information (Section 4 above), or if information used for Marketing (Section 5 above) or both. Written opt-out requests should not be sent with any other correspondence. In order to process your request, we require that the request be provided by you directly and not through a third party.
Your opt-out preference will remain in effect with respect to this policy (as it may be amended) until you notify us otherwise. If you have a joint account, your direction for us not to share this information with other Morgan Stanley companies and for those other Morgan Stanley companies not to use your personal information for marketing will be applied to all account holders on that account. Please understand that if you limit our sharing or our affiliated companies' use of personal information, you and any joint account holder(s) may not receive information about Morgan Stanley products and services, including products or services that could help you manage your financial resources and achieve your investment objectives.
7. WHAT IF AN AFFILIATED COMPANY BECOMES A NON-AFFILIATED THIRD PARTY?
If, at any time in the future, an affiliated company becomes a non-affiliated third party, further disclosures of personal information made to the former affiliated company will be limited to those described in Section 2(b) above relating to non-affiliated third parties. If you elected under Section 6 to limit disclosures we make to affiliated companies, or use of personal information by affiliated companies, your election will not apply to use by any former affiliated company of your personal information in their possession once it becomes a non-affiliated third party.
SPECIAL NOTICE TO RESIDENTS OF VERMONT
The following section supplements our policy with respect to our individual clients who have a Vermont address and supersedes anything to the contrary in the above policy with respect to those clients only.
The state of Vermont requires financial institutions to obtain your consent prior to sharing personal information that they collect about you with affiliated companies and non-affiliated third parties other than in certain limited circumstances. Except as permitted by law, we will not share personal information we collect about you with non-affiliated third parties or other Morgan Stanley companies unless you provide us with your written consent to share such information ("opt-in").
If you wish to receive offers for investment products and services offered by or through other Morgan Stanley companies, please notify us in writing at the following address:
DST Asset Manager Solutions, Inc.
c/o Privacy Coordinator
P.O. Box 219804
Kansas City, Missouri 64121
Your authorization should include your name, address, telephone number and account number(s) to which the opt-in applies and should not be sent with any other correspondence. In order to process your authorization, we require that the authorization be provided by you directly and not through a third party.
SPECIAL NOTICE TO RESIDENTS OF CALIFORNIA
The following section supplements our policy with respect to our individual clients who have a California address and supersedes anything to the contrary in the above policy with respect to those clients only.
In response to a California law, if your account has a California home address, your personal information will not be disclosed to non-affiliated third parties except as permitted by applicable California law, and we will limit sharing such information with our affiliates to comply with California privacy laws that apply to us.
32
Morgan Stanley Institutional Fund, Inc.
Annual Report — December 31, 2017
Director and Officer Information (unaudited)
Independent Directors:
Name, Age and Address of
Independent Director | | Position(s)
Held with
Registrant | | Length of Time
Served* | | Principal Occupation(s) During Past 5 Years
and Other Relevant Professional Experience | | Number of
Portfolios in
Fund Complex
Overseen by
Independent
Director** | | Other Directorships
Held by Independent
Director*** | |
Frank L. Bowman (73)
c/o Perkins Coie LLP
Counsel to the Independent
Directors
30 Rockefeller Plaza
New York, NY 10112 | | Director | | Since
August
2006 | | President, Strategic Decisions, LLC (consulting) (since February 2009); Director or Trustee of various Morgan Stanley Funds (since August 2006); Chairperson of the Compliance and Insurance Committee (since October 2015); formerly, Chairperson of the Insurance Sub-Committee of the Compliance and Insurance Committee (2007-2015); served as President and Chief Executive Officer of the Nuclear Energy Institute (policy organization) (February 2005-November 2008); retired as Admiral, U.S. Navy after serving over 38 years on active duty including 8 years as Director of the Naval Nuclear Propulsion Program in the Department of the Navy and the U.S. Department of Energy (1996-2004); served as Chief of Naval Personnel (July 1994-September 1996) and on the Joint Staff as Director of Political Military Affairs (June 1992-July 1994); knighted as Honorary Knight Commander of the Most Excellent Order of the British Empire; awarded the Officier de l'Orde National du Mérite by the French Government; elected to the National Academy of Engineering (2009). | | | 88 | | | Director of BP p.l.c.; Director of Naval and Nuclear Technologies LLP; Director Emeritus of the Armed Services YMCA; Director of the U.S. Naval Submarine League; Member of the National Security Advisory Council of the Center for U.S. Global Engagement and a member of the CNA Military Advisory Board; Trustee of Fairhaven United Methodist Church; and Director of other various non-profit organizations. | |
Kathleen A. Dennis (64)
c/o Perkins Coie LLP
Counsel to the Independent Directors
30 Rockefeller Plaza
New York, NY 10112 | | Director | | Since
August
2006 | | President, Cedarwood Associates (mutual fund and investment management consulting) (since July 2006); Chairperson of the Liquidity and Alternatives Sub-Committee of the Investment Committee (since October 2006) and Director or Trustee of various Morgan Stanley Funds (since August 2006); formerly, Senior Managing Director of Victory Capital Management (1993-2006). | | | 89 | | | Director of various non-profit organizations. | |
Nancy C. Everett (62)
c/o Perkins Coie LLP
Counsel to the Independent Directors
30 Rockefeller Plaza
New York, NY 10112 | | Director | | Since
January
2015 | | Chief Executive Officer, Virginia Commonwealth University Investment Company (since November 2015); Owner, OBIR, LLC (institutional investment management consulting) (since June 2014); formerly, Managing Director, BlackRock Inc. (February 2011-December 2013); and Chief Executive Officer, General Motors Asset Management (a/k/a Promark Global Advisors, Inc.) (June 2005-May 2010). | | | 90 | | | Formerly, Member of Virginia Commonwealth University School of Business Foundation (2005-2016); Member of Virginia Commonwealth University Board of Visitors (2013-2015); Member of Committee on Directors for Emerging Markets Growth Fund, Inc. (2007-2010); Chairperson of Performance Equity Management, LLC (2006-2010); and Chairperson, GMAM Absolute Return Strategies Fund, LLC (2006-2010). | |
33
Morgan Stanley Institutional Fund, Inc.
Annual Report — December 31, 2017
Director and Officer Information (unaudited) (cont'd)
Independent Directors: (cont'd)
Name, Age and Address of
Independent Director | | Position(s)
Held with
Registrant | | Length of Time
Served* | | Principal Occupation(s) During Past 5 Years
and Other Relevant Professional Experience | | Number of
Portfolios in
Fund Complex
Overseen by
Independent
Director** | | Other Directorships
Held by Independent
Director*** | |
Jakki L. Haussler (60)
c/o Perkins Coie LLP
Counsel to the Independent Directors
30 Rockefeller Plaza
New York, NY 10112 | | Director | | Since
January
2015 | | Chairman and Chief Executive Officer, Opus Capital Group (since January 1996); formerly, Director, Capvest Venture Fund, LP (May 2000-December 2011); Partner, Adena Ventures, LP (July 1999-December 2010); Director, The Victory Funds (February 2005-July 2008). | | | 90 | | | Director of Cincinnati Bell Inc. and Member, Audit Committee and Compensation Committee; Director of Northern Kentucky University Foundation and Member, Investment Committee; Member of Chase College of Law Transactional Law Practice Center Board of Advisors; Director of Best Transport; Director of Chase College of Law Board of Visitors; formerly, Member, University of Cincinnati Foundation Investment Committee; Member, Miami University Board of Visitors (2008-2011); Trustee of Victory Funds (2005-2008) and Chairman, Investment Committee (2007-2008) and Member, Service Provider Committee (2005-2008). | |
Dr. Manuel H. Johnson (68)
c/o Johnson Smick
International, Inc.
220 I Street, NE — Suite 200
Washington, D.C. 20002 | | Director | | Since
July
1991 | | Senior Partner, Johnson Smick International, Inc. (consulting firm); Chairperson of the Investment Committee (since October 2006) and Director or Trustee of various Morgan Stanley Funds (since July 1991); Co-Chairman and a founder of the Group of Seven Council (G7C) (international economic commission); formerly, Chairperson of the Audit Committee (July 1991-September 2006), Vice Chairman of the Board of Governors of the Federal Reserve System and Assistant Secretary of the U.S. Treasury. | | | 88 | | | Director of NVR, Inc. (home construction). | |
Joseph J. Kearns (75)
c/o Kearns & Associates LLC
46 E Peninsula Center #385
Rolling Hills Estates, CA
90274-3712 | | Director | | Since
August
1994 | | Senior Adviser, Kearns & Associates LLC (investment consulting); Chairperson of the Audit Committee (since October 2006) and Director or Trustee of various Morgan Stanley Funds (since August 1994); formerly, Deputy Chairperson of the Audit Committee (July 2003-September 2006) and Chairperson of the Audit Committee of various Morgan Stanley Funds (since August 1994); CFO of the J. Paul Getty Trust. | | | 89 | | | Prior to August 10, 2016, Director of Electro Rent Corporation (equipment leasing); Prior to December 31, 2013, Director of The Ford Family Foundation. | |
34
Morgan Stanley Institutional Fund, Inc.
Annual Report — December 31, 2017
Director and Officer Information (unaudited) (cont'd)
Independent Directors: (cont'd)
Name, Age and Address of
Independent Director | | Position(s)
Held with
Registrant | | Length of Time
Served* | | Principal Occupation(s) During Past 5 Years
and Other Relevant Professional Experience | | Number of
Portfolios in
Fund Complex
Overseen by
Independent
Director** | | Other Directorships
Held by Independent
Director*** | |
Michael F. Klein (59)
c/o Perkins Coie LLP
Counsel to the Independent Directors
30 Rockefeller Plaza
New York, NY 10112 | | Director | | Since
August
2006 | | Managing Director, Aetos Capital, LLC (since March 2000); Co-President, Aetos Alternatives Management, LLC (since January 2004) and Co-Chief Executive Officer of Aetos Capital LLC (since August 2013); Chairperson of the Fixed Income Sub-Committee of the Investment Committee (since October 2006) and Director or Trustee of various Morgan Stanley Funds (since August 2006); formerly, Managing Director, Morgan Stanley & Co. Inc. and Morgan Stanley Dean Witter Investment Management, President, various Morgan Stanley Funds (June 1998-March 2000) and Principal, Morgan Stanley & Co. Inc. and Morgan Stanley Dean Witter Investment Management (August 1997-December 1999). | | | 88 | | | Director of certain investment funds managed or sponsored by Aetos Capital, LLC; Director of Sanitized AG and Sanitized Marketing AG (specialty chemicals). | |
Patricia Maleski (57)
c/o Perkins Coie LLP
Counsel to the Independent Directors
30 Rockefeller Plaza
New York, NY 10112 | | Director | | Since
January
2017 | | Managing Director, JPMorgan Asset Management (2004-2016); Oversight and Control Head of Fiduciary and Conflicts of Interest Program (2015-2016); Chief Control Officer-Global Asset Management (2013-2015); President, JPMorgan Funds (2010-2013); Chief Administrative Officer (2004-2013); various other positions including Treasurer and Board Liaison (since 2001). | | | 90 | | | None. | |
Michael E. Nugent (81)
522 Fifth Avenue
New York, NY 10036 | | Chair of the Board and Director | | Chair of the Boards since July 2006 and Director since July 1991 | | Chair of the Boards of various Morgan Stanley Funds (since July 2006); Chairperson of the Closed-End Fund Committee (since June 2012) and Director or Trustee of various Morgan Stanley Funds (since July 1991); formerly, Chairperson of the Insurance Committee (until July 2006); General Partner, Triumph Capital, L.P. (private investment partnership) (1988-2013). | | | 88 | | | None. | |
W. Allen Reed (70)
c/o Perkins Coie LLP
Counsel to the Independent Directors
30 Rockefeller Plaza
New York, NY 10112 | | Director | | Since
August
2006 | | Chairperson of the Equity Sub-Committee of the Investment Committee (since October 2006) and Director or Trustee of various Morgan Stanley Funds (since August 2006); formerly, President and CEO of General Motors Asset Management; Chairman and Chief Executive Officer of the GM Trust Bank and Corporate Vice President of General Motors Corporation (August 1994-December 2005). | | | 89 | | | Director of Legg Mason, Inc.; formerly, Director of the Auburn University Foundation (2010-2015). | |
Fergus Reid (85)
c/o Joe Pietryka, Inc.
85 Charles Colman Blvd.
Pawling, NY 12564 | | Director | | Since
June
1992 | | Chairman, Joe Pietryka, Inc.; Chairperson of the Governance Committee and Director or Trustee of various Morgan Stanley Funds (since June 1992). | | | 89 | | | Formerly, Trustee and Director of certain investment companies in the JP Morgan Fund Complex managed by JP Morgan Investment Management Inc. (1987-2012). | |
* This is the earliest date the Director began serving the Morgan Stanley Funds. Each Director serves an indefinite term, until his or her successor is elected.
** The Fund Complex includes (as of December 31, 2017) all open-end and closed-end funds (including all of their portfolios) advised by Morgan Stanley Investment Management Inc. (the "Adviser") and any funds that have an adviser that is an affiliated person of the Adviser (including, but not limited to, Morgan Stanley AIP GP LP).
*** This includes any directorships at public companies and registered investment companies held by the Director at any time during the past five years.
35
Morgan Stanley Institutional Fund, Inc.
Annual Report — December 31, 2017
Director and Officer Information (unaudited) (cont'd)
Executive Officers:
Name, Age and Address of Executive Officer | | Position(s) Held
with
Registrant | | Length of Time
Served* | | Principal Occupation(s) During Past 5 Years | |
John H. Gernon (54)
522 Fifth Avenue
New York, NY 10036 | | President and Principal Executive Officer | | Since
September
2013 | | President and Principal Executive Officer of the Equity and Fixed Income Funds and the Morgan Stanley AIP Funds (since September 2013) and the Liquidity Funds and various money market funds (since May 2014) in the Fund Complex; Managing Director of the Adviser; Head of Product (since 2006). | |
Timothy J. Knierim (58)
522 Fifth Avenue
New York, NY 10036 | | Chief Compliance Officer | | Since
December
2016 | | Managing Director of the Adviser and various entities affiliated with the Adviser; Chief Compliance Officer of various Morgan Stanley Funds and the Adviser (since December 2016) and Chief Compliance Officer of Morgan Stanley AIP GP LP (since 2014). Formerly, Managing Director and Deputy Chief Compliance Officer of the Adviser (2014-2016); and formerly, Chief Compliance Officer of Prudential Investment Management, Inc. (2007-2014). | |
Francis J. Smith (52)
522 Fifth Avenue
New York, NY 10036 | | Treasurer and Principal Financial Officer | | Treasurer since July 2003 and Principal Financial Officer since September 2002 | | Managing Director of the Adviser and various entities affiliated with the Adviser; Treasurer (since July 2003) and Principal Financial Officer of various Morgan Stanley Funds (since September 2002). | |
Mary E. Mullin (50)
522 Fifth Avenue
New York, NY 10036 | | Secretary | | Since
June
1999 | | Managing Director of the Adviser; Secretary of various Morgan Stanley Funds (since June 1999). | |
Michael J. Key (38)
522 Fifth Avenue
New York, NY 10036 | | Vice President | | Since
June
2017 | | Vice President of the Equity and Fixed Income Funds, Liquidity Funds, various money market funds and the Morgan Stanley AIP Funds in the Fund Complex (since June 2017); Executive Director of the Adviser; Head of Product Development for Equity and Fixed Income Funds (since August 2013). | |
* This is the earliest date the officer began serving the Morgan Stanley Funds. Each officer serves a one-year term, until his or her successor is elected and qualifies.
36
Morgan Stanley Institutional Fund, Inc.
Annual Report — December 31, 2017
Adviser and Administrator
Morgan Stanley Investment Management Inc.
522 Fifth Avenue
New York, New York 10036
Distributor
Morgan Stanley Distribution, Inc.
522 Fifth Avenue
New York, New York 10036
Dividend Disbursing and Transfer Agent
DST Asset Manager Solutions, Inc.
2000 Crown Colony Drive
Quincy, Massachusetts 02169
Custodian
State Street Bank and Trust Company
One Lincoln Street
Boston, Massachusetts 02111
Legal Counsel
Dechert LLP
1095 Avenue of the Americas
New York, New York 10036
Counsel to the Independent Directors
Perkins Coie LLP
30 Rockefeller Plaza
New York, New York 10112
Independent Registered Public Accounting Firm
Ernst & Young LLP
200 Clarendon Street
Boston, Massachusetts 02116
Reporting to Shareholders
Each Morgan Stanley Fund provides a complete schedule of portfolio holdings in its semi-annual and annual reports within 60 days of the end of the fund's second and fourth fiscal quarters. The semi-annual and annual reports are filed electronically with the Securities and Exchange Commission (SEC) on Form N-CSRS and Form N-CSR, respectively. Morgan Stanley also delivers the semi-annual and annual reports to fund shareholders and makes these reports available on its public website, www.morganstanley.com/im. Each Morgan Stanley fund also files a complete schedule of portfolio holdings with the SEC for the fund's first and third fiscal quarters on Form N-Q. Morgan Stanley does not deliver the reports for the first and third fiscal quarters to shareholders, nor are the reports posted to the Morgan Stanley public website. You may, however, obtain the Form N-Q filings (as well as the Form N-CSR and N-CSRS filings) by accessing the SEC's website, www.sec.gov. You may also review and copy them at the SEC's Public Reference Room in Washington, DC. Information on the operation of the SEC's Public Reference Room may be obtained by calling the SEC toll free at 1 (800) SEC-0330. You can also request copies of these materials, upon payment of a duplicating fee, by electronic request at the SEC's email address (publicinfo@sec.gov) or by writing to the SEC's Public Reference Section, Washington, D.C. 20549-1520.
Proxy Voting Policies and Procedures and Proxy Voting Record
You may obtain a copy of the Company's Proxy Voting Policy and Procedures and information regarding how the Company voted proxies relating to portfolio securities during the most recent twelve-month period ended June 30, without charge, upon request, by calling toll free 1 (800) 548-7786 or by visiting our website at www.morganstanley.com/im. This information is also available on the SEC's website at www.sec.gov.
This report is authorized for distribution only when preceded or accompanied by a prospectus or summary prospectus of the applicable Fund of Morgan Stanley Institutional Fund, Inc., which describes in detail the Fund's investment policies, risks, fees and expenses. Please read the prospectus carefully before you invest or send money. For additional information, including information regarding the investments comprising the Fund, please visit our website at www.morganstanley.com/im or call toll free 1 (800) 548-7786.
37
Printed in U.S.A.
This Report has been prepared for shareholders and may be distributed to others only if preceded or accompanied by a current prospectus.
Morgan Stanley Investment Management Inc.
522 Fifth Avenue
New York, New York 10036
© 2018 Morgan Stanley. Morgan Stanley Distribution, Inc.

IFIGOANN
2007931 EXP. 02.28.19

Morgan Stanley Institutional Fund, Inc.
Global Quality Portfolio
Annual Report
December 31, 2017

Morgan Stanley Institutional Fund, Inc.
Annual Report — December 31, 2017
Shareholders' Letter | | | 2 | | |
Expense Example | | | 3 | | |
Investment Overview | | | 4 | | |
Portfolio of Investments | | | 8 | | |
Statement of Assets and Liabilities | | | 9 | | |
Statement of Operations | | | 11 | | |
Statements of Changes in Net Assets | | | 12 | | |
Financial Highlights | | | 14 | | |
Notes to Financial Statements | | | 19 | | |
Report of Independent Registered Public Accounting Firm | | | 25 | | |
Federal Tax Notice | | | 26 | | |
Privacy Notice | | | 27 | | |
Director and Officer Information | | | 30 | | |
This report is authorized for distribution only when preceded or accompanied by a prospectus or summary prospectus of the applicable Fund of Morgan Stanley Institutional Fund, Inc. To receive a prospectus and/or statement of additional information (SAI), which contains more complete information such as investment objectives, charges, expenses, policies for voting proxies, risk considerations, and describes in detail each of the Fund's investment policies to the prospective investor, please call toll free 1 (800) 548-7786. Please read the prospectuses carefully before you invest or send money.
Additionally, you can access information about the Fund, including performance, characteristics, and investment team commentary, through Morgan Stanley Investment Management's website: www.morganstanley.com/im.
Market forecasts provided in this report may not necessarily come to pass. There is no guarantee that any sectors mentioned will continue to perform as discussed herein or that securities in such sectors will be held by the Fund in the future. There is no assurance that a fund will achieve its investment objective. Funds are subject to market risk, which is the possibility that market values of securities owned by the Fund will decline and, therefore, the value of the Fund's shares may be less than what you paid for them. Accordingly, you can lose money investing in this Fund. Please see the prospectus for more complete information on investment risks.
1
Morgan Stanley Institutional Fund, Inc.
Annual Report — December 31, 2017
Shareholders' Letter (unaudited)
Dear Shareholders,
We are pleased to provide this Annual report, in which you will learn how your investment in Global Quality Portfolio (the "Fund") performed during the latest twelve-month period.
Morgan Stanley Investment Management is a client-centric, investor-led organization. Our global presence, intellectual capital, and breadth of products and services enable us to partner with investors to meet the evolving challenges of today's financial markets. We aim to deliver superior investment service and to empower our clients to make the informed decisions that help them reach their investment goals.
As always, we thank you for selecting Morgan Stanley Investment Management, and look forward to working with you in the months and years ahead.
Sincerely,

John H. Gernon
President and Principal Executive Officer
January 2018
2
Morgan Stanley Institutional Fund, Inc.
Annual Report — December 31, 2017
Expense Example (unaudited)
Global Quality Portfolio
As a shareholder of the Fund, you incur two types of costs: (1) transactional costs; and (2) ongoing costs, which may include advisory fees, administration fees, distribution and shareholder services fees and other Fund expenses. This example is intended to help you understand your ongoing costs (in dollars) of investing in the Fund and to compare these costs with the ongoing costs of investing in other mutual funds.
This example is based on an investment of $1,000 invested at the beginning of the six-month period ended December 31, 2017 and held for the entire six-month period.
Actual Expenses
The table below provides information about actual account values and actual expenses. You may use the information in this table, together with the amount you invested, to estimate the expenses that you paid over the period. Simply divide your account value by $1,000 (for example, an $8,600 account value divided by $1,000 = 8.6), then multiply the result by the number in the table under the heading entitled "Actual Expenses Paid During Period" to estimate the expenses you paid on your account during this period.
Hypothetical Example for Comparison Purposes
The table below provides information about hypothetical account values and hypothetical expenses based on the Fund's actual expense ratio and an assumed rate of return of 5% per year before expenses, which is not the Fund's actual return. The hypothetical account values and expenses may not be used to estimate the actual ending account balance or expenses you paid for the period. You may use this information to compare the ongoing costs of investing in the Fund and other funds. To do so, compare this 5% hypothetical example with the 5% hypothetical examples that appear in the shareholder reports of the other funds.
Please note that the expenses shown in the table are meant to highlight your ongoing costs only and do not reflect any transactional costs, such as sales charges (loads). Therefore, the information for each class in the table is useful in comparing ongoing costs only, and will not help you determine the relative total costs of owning different funds. In addition, if these transactional costs were included, your costs would have been higher.
| | | Beginning
Account
Value
7/1/17 | | Actual Ending
Account
Value
12/31/17 | | Hypothetical
Ending Account
Value | | Actual
Expenses
Paid
During
Period* | | Hypothetical
Expenses Paid
During Period* | | Net
Expense
Ratio
During
Period** | |
Global Quality Portfolio Class I | | $ | 1,000.00 | | | $ | 1,064.20 | | | $ | 1,020.16 | | | $ | 5.20 | | | $ | 5.09 | | | | 1.00 | % | |
Global Quality Portfolio Class A | | | 1,000.00 | | | | 1,062.90 | | | | 1,018.40 | | | | 7.02 | | | | 6.87 | | | | 1.35 | | |
Global Quality Portfolio Class L | | | 1,000.00 | | | | 1,060.30 | | | | 1,015.83 | | | | 9.66 | | | | 9.45 | | | | 1.86 | | |
Global Quality Portfolio Class C | | | 1,000.00 | | | | 1,058.80 | | | | 1,014.62 | | | | 10.90 | | | | 10.66 | | | | 2.10 | | |
Global Quality Portfolio Class IS | | | 1,000.00 | | | | 1,064.70 | | | | 1,020.42 | | | | 4.94 | | | | 4.84 | | | | 0.95 | | |
* Expenses are calculated using each Fund Class' annualized net expense ratio (as disclosed), multiplied by the average account value over the period, and multiplied by 184/365 (to reflect the most recent one-half year period).
** Annualized.
3
Morgan Stanley Institutional Fund, Inc.
Annual Report — December 31, 2017
Investment Overview (unaudited)
Global Quality Portfolio
The Fund seeks long-term capital appreciation.
Performance
For the year ended December 31, 2017, the Fund's Class I shares had a total return based on net asset value and reinvestment of distributions per share of 22.86%, net of fees. The Fund's Class I shares outperformed the Fund's benchmark, the MSCI World Index (the "Index"), which returned 22.40%.
Please keep in mind that double-digit returns are highly unusual and cannot be sustained. Investors should also be aware that these returns were primarily achieved during favorable market conditions.
Factors Affecting Performance
• Completing a strong year in 2017, global equity markets continued to forge ahead in the fourth quarter, helped by a solid earnings season and clarity on U.S. tax cuts. Anticipated political risks failed to materialize. Asia and the emerging markets outperformed developed markets given the weak dollar and a recovery in industrial commodity prices. U.S. equities, as measured by the S&P 500 Index, delivered positive returns every month of 2017, with the technology sector leading the pack. Japan also did well, underpinned by strong earnings. After Macron's election victory in France, European equities performed well, but were held back by euro strength. U.K. equities underperformed relative to other regions, weighed down by sterling strength and continued uncertainty around the Brexit transition arrangements. At a sector level, over the year information technology (+38.2%), materials (+28.9%) and industrials (+25.2%) led, while energy (4.97%), telecommunications (+5.8%) and utilities (+13.7%) lagged. (Regional and country performance is represented by the respective MSCI Indexes, unless otherwise noted.)
• For the year, the Fund's zero weight in energy was a key contributor, helped by stock selection in consumer staples, stock selection in financials and an overweight to the strongly performing technology sector. Stock selection in consumer
discretionary, health care and technology, and the underweights in materials and industrials detracted from performance. Over the year, the largest absolute contributors were Unilever, Microsoft and Accenture.(i) Fidelity National Information Services, Time Warner and Factset contributed the least — there were no absolute negative detractors in 2017.
Management Strategies
• Our central concern at the start of 2017 was a backdrop of generally high valuations coinciding with some significant macro/political concerns for the then forthcoming year, including China, the risk of U.S. and European politics going wrong and the vulnerability of the financial system to shocks due to the sharp increase in debt and general stagnation. We observed that if some of these major concerns went wrong, there was little margin of safety generally and probably quite a lot of downside given the nature of some of the potential risks. As bottom-up stock pickers, we found little margin of safety in stocks more or less across the board. 2017 ended with most major country indices up 20 to 25% or more (in U.S. dollar terms),(ii) making such concerns look at best premature, at worst just plain wrong. However, enthused U.S. dollar-based investors getting excited about markets in 2017 may have forgotten that markets went up a lot in something that went down a lot (i.e., the dollar).
• As we start 2018, we are more concerned about valuation and on balance less concerned about macro conditions, although there is still plenty that can go wrong. In a nutshell, the market has re-rated on the basis that 2017's expected earnings increase of 15% for the MSCI World Index actually delivered for the first time in five years, as growth for once did not disappoint.(ii) Although there is growing evidence of gross domestic product growth across the board, should these proverbial green shoots fail to bloom, the market will de-rate multiples on lower actual earnings, the proverbial double-hit.(iii)
(i) The information contained in this overview regarding specific securities is for informational purposes only and should not be construed as a recommendation to purchase or sell the securities mentioned.
(ii) Source: Morgan Stanley Investment Management and FactSet. Data as of December 31, 2017.
(iii) Forecast/estimates are based on current market conditions, subject to change and may not necessarily come to pass.
4
Morgan Stanley Institutional Fund, Inc.
Annual Report — December 31, 2017
Investment Overview (unaudited) (cont'd)
Global Quality Portfolio
• In the U.S., despite the sturm und drang and the flying of a lot of liberal feathers, the market has broadly seen the benefits of Trump (tax reform being the biggest win) without any of the major risks eventuating as yet (an unholy cocktail of awfulness ranging from a trade war with China to nuclear war with North Korea). To the credit of Congress, it has passed, after much drama, the single measure we thought would have the biggest long-term positive impact on the U.S. economy, namely tax reform. Although its impact on overall U.S. corporations may be muted in the short term (few major U.S. companies pay a full U.S. tax charge unless they are purely domestic), the big long-term question is whether the combination of the tax reform and short-term capital expenditures (capex) and cash repatriation packages will be enough to get a capex cycle going, leading to a pick-up in productivity from current lows. In recent years, U.S. corporates have generally chosen to buy back shares rather than increase capex, so productivity has generally suffered as a result. A bull would say the combination of tax reform and opportunities provided by the internet of things (IoT) and artificial intelligence (AI) will kick off a long cycle of investment to drive waste out of many sectors, with massive potential cost savings, a good chunk of which will come through in margins, which will be propelled to permanent new highs. A bear would respond that there may be some positive impact, but U.S. corporations will just continue to buy back shares and margins may normalize as labor seeks to get its hands on a larger share of corporate profits from a still historically low starting point, leaving aside the risks from the aging U.S. economic cycle.
• Add to this that the U.S. market is anticipating a repeat of the 12% earnings growth in the S&P 500 Index it saw in 2017, it is hardly a surprise that the market has not been over-concerned with valuation.(ii) A bull (no shortage of those) would say that at 18.2x, the next 12 months price-to-earnings ("P/E") ratio of the S&P 500 Index is only about 14% above the long-term mean of 16.0x from 1997 to 2017, so why the fuss?(ii) A bear (count us as one) would point out that even leaving aside quality of earnings (given the largest ever cycle of U.S. earnings manipulation), corporate debt after a buyback binge is near record highs, as are margins,
which means that the debt-adjusted price-to-sales ratio (EV/sales) at 2.44 for the S&P 500 Index is getting close to the 2000 peak of 2.98, which is a clear amber light, even leaving aside outdated notions of earnings reversion to the mean or the risk of a turn down in the U.S. economy.(ii)
• If one takes a longer-term view of valuations as per the Schiller P/E, the U.S. market has gone from expensive on 27.9x at the start of 2017 to very expensive on 32.4x at the end of 2017.(ii) Unless the visionary tech bulls are right that a heady cocktail of AI, IoT, e-commerce et al. will propel already peak margins ever higher, leading to a ton of earnings growth, this is also a dark amber light for valuation, with a lot of expectations baked into prices. No bull market ever bursts purely from valuation alone, but when markets do focus on valuation once more, it matters.
• The other major geopolitical risk facing the world at the start of 2017 (aside from Trump) was the risk of political disruption in Europe, possibly leading to a scenario of a break-up of the eurozone if the politics went wrong. After a few awkward moments, the market shrugged off such concerns following the Dutch and (in particular) the French elections and, even after nasty surprises in the German election, continued to concentrate on the growing evidence of a eurozone economic recovery. So far, the market has been right, with some entirely unexpected positive results such as a big majority in parliament for President Macron in France, which (miracle of miracles) means that reform (particularly labor market reform) has actually progressed in France and looks set to continue. Our concerns that Brexit could inspire a cascade of falling euro-dominos have been hitherto wrong: the only domino to fall flat on its face has been the U.K. itself after doing what Michael Bloomberg memorably described as "the single stupidest thing any country has ever done." In fact, the only wobble of the dominos to date has been a positive impact — the U.K.'s self-immolation probably inspired France to rally round Macron to avoid the fate of its much loved European partner. However, our concerns for the European elections were not that there was a high probability of things going horribly wrong in France or Germany; rather that the risk was Italy, which managed not to have
(ii) Source: Morgan Stanley Investment Management and FactSet. Data as of December 31, 2017.
5
Morgan Stanley Institutional Fund, Inc.
Annual Report — December 31, 2017
Investment Overview (unaudited) (cont'd)
Global Quality Portfolio
its general election in 2017. Italy has been the big loser of the euro, with its economy not growing for 20 years due to an inability to reform itself and (mostly) to it losing its historic ability to depreciate its currency (the lira) to keep its competitive plates spinning. Furthermore, Italy has the strongest eurosceptic forces of the major European countries going into its electoral cycle. The risk, now, is that Italy with its election in March 2018, elects a government who decides to do something about the euro — if so, political risk will be back in Europe in spades.
• Looking forward to 2018, there does seem to be a synchronized global expansion. However, it isn't that large, has quite a lot of risk and seems to be priced in by markets. We see that few of the major structural problems in the world (debt, the unknowns of a quantitative easing ("QE") unwind, political uncertainty, China et al.) have gone away. In simple terms, a goldilocks scenario has been priced in but there remain elevated risks and no apparent margin of safety in valuations. Such growth as there is looks unlikely to drive a sharp pick-up in inflation. Even though the U.S. is pressing the reflation button of tax cuts, this does not guarantee that that the U.S. will reflate, especially given its starting point of one of the longest economic expansions in recent memory and already record-high margins. One might also point out that giving the wrong people (corporates and the wealthy) tax cuts does not in itself amount to a conventional hitting of the reflation button via fiscal policy. General use of fiscal policy to reflate Europe also looks questionable, given the Germans have to agree to it, which looks far from a foregone conclusion with a weakened Mrs. Merkel in discussions with the (socialist) Social Democratic Party (SPD) for a renewed Grand Coalition. However, even if there is very little probability of systematic German-led reflation in Europe, at least European fiscal policy as a whole no longer looks like a future drag and could be mildly expansionary.
• Despite its many problems (debt, demographics, QE ad nauseam) Japan does not face the same political risk as the West, given that Prime Minister Abe has just been re-elected with a large majority.
Furthermore, the Japanese cabinet approved a draft tax measure to incentivize companies to increase wages and raise capex in December 2017, potentially lowering Japanese corporate tax rates from the current 30% to 20%. There is even some evidence that Japanese companies are at last taking measures to run themselves better, although this is very much on a stock-by-stock basis and generally their number is few. Japan just may have the ability to surprise on the upside from reflation, particularly as there is growing evidence of labor shortages driving up wages. However, as always in Japan, there are a frustratingly small number of investible companies that can benefit from this.
• As bottom-up stock pickers, the substantial general rally in markets in 2017 aggravates the problem we have faced over the last few years of generally not having a sufficient margin of safety in the form of price to compensate us for potential risks, be they cyclical, macro or the threat of disruptive change. Certainly the market does not see a margin of safety as a principal concern, with the VIX, a common gauge of stock volatility, trading near all-time lows.(iv)
• This means it has generally been difficult to find new holdings for all portfolios and there have been no obvious sectors which have been dramatically mispriced, so 2017 has been about stock picking rifle shots. Nonetheless, by casting the net wide and intensifying our search for new holdings, we have found five new holdings for Global Quality this year (and five in 2016). We are broadly encouraged by the performance of these holdings in 2017. To us, the risks look skewed more to the downside than upside. If widespread hopes of a continuation of the current synchronized pick-up in world growth fail to materialize, the current backdrop of high valuation and low concern for risk make preservation of capital the key concern. To us, high-quality companies, which should still be better able to grow sales and profits in a downturn, look the best relative bet, even if they are unexciting in absolute terms.
(iv) Source: Chicago Board Options Exchange Market Volatility Index, December 31, 2017.
6
Morgan Stanley Institutional Fund, Inc.
Annual Report — December 31, 2017
Investment Overview (unaudited) (cont'd)
Global Quality Portfolio
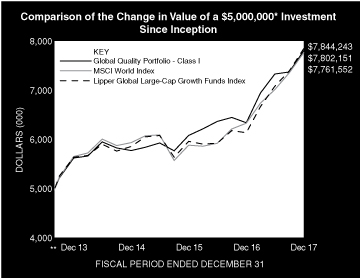
* Minimum Investment for Class I shares
** Commenced Operations on August 30, 2013.
In accordance with SEC regulations, the Fund's performance shown assumes that all recurring fees (including management fees) were deducted and all dividends and distributions were reinvested. The performance of Class A, L, C and IS shares will vary from the performance of Class I shares and will be impacted by additional fees assessed to those classes (if applicable).
Performance Compared to the MSCI World Index(1) and the Lipper Global Large-Cap Growth Funds Index(2)
| | Period Ended December 31, 2017
Total Returns(3) | |
| | One
Year | | Five
Years | | Ten
Years | | Since
Inception(7) | |
Fund — Class I Shares
w/o sales charges(4) | | | 22.86 | % | | | — | | | | — | | | | 10.80 | % | |
Fund — Class A Shares
w/o sales charges(4) | | | 22.45 | | | | — | | | | — | | | | 10.44 | | |
Fund — Class A Shares with
maximum 5.25% sales charges(4) | | | 16.00 | | | | — | | | | — | | | | 9.09 | | |
Fund — Class L Shares
w/o sales charges(4) | | | 21.80 | | | | — | | | | — | | | | 9.88 | | |
Fund — Class C Shares
w/o sales charges(6) | | | 21.46 | | | | — | | | | — | | | | 8.72 | | |
Fund — Class C Shares with
maximum 1.00% deferred sales
charges(6) | | | 20.46 | | | | — | | | | — | | | | 8.72 | | |
Fund — Class IS Shares
w/o sales charges(5) | | | 22.91 | | | | — | | | | — | | | | 10.23 | | |
MSCI World Index | | | 22.40 | | | | — | | | | — | | | | 10.67 | | |
Lipper Global Large-Cap Growth
Funds Index | | | 27.57 | | | | — | | | | — | | | | 10.95 | | |
Performance data quoted represents past performance, which is no guarantee of future results, and current performance may be lower or higher than the figures shown. Performance assumes that all dividends and distributions, if any, were reinvested. For the most recent month-end performance figures, please visit www.morganstanley.com/im. Investment return and principal value will fluctuate so that Fund shares, when redeemed, may be worth more or less than their original cost. Total returns do not reflect the deduction of taxes that a shareholder would pay on Fund distributions or the redemption of Fund shares. Performance of share classes will vary due to difference in sales charges and expenses.
(1) The MSCI World Index is a free float-adjusted market capitalization weighted index designed to measure the equity market performance of developed markets. The term "free float" represents the portion of shares outstanding that are deemed to be available for purchase in the public equity markets by investors. The MSCI World Index currently consists of 23 developed market country indices. The performance of the Index is listed in US dollars and assumes reinvestment of net dividends. The Index is unmanaged and its returns do not include any sales charges or fees. Such costs would lower performance. It is not possible to invest directly in an index.
(2) The Lipper Global Large-Cap Growth Funds Index is an equally weighted performance index of the largest qualifying funds (based on net assets) in the Lipper Global Large-Cap Growth Funds classification. The Index, which is adjusted for capital gains distributions and income dividends, is unmanaged and should not be considered an investment. There are currently 10 funds represented in this Index. As of the date of this report, the Fund is in the Lipper Global Large-Cap Growth Funds classification.
(3) Total returns for the Fund reflect fees waived and expenses reimbursed, if applicable, by the Adviser. Without such waivers and reimbursements, total returns would have been lower.
(4) Commenced operations on August 30, 2013.
(5) Commenced offering on September 13, 2013.
(6) Commenced offering on April 30, 2015.
(7) For comparative purposes, average annual since inception returns listed for the Indexes refer to the inception date of Class I of the Fund, not the inception of the Index.
7
Morgan Stanley Institutional Fund, Inc.
Annual Report — December 31, 2017
Portfolio of Investments
Global Quality Portfolio
| | | Shares | | Value
(000) | |
Common Stocks (96.3%) | |
Canada (0.8%) | |
Constellation Software, Inc. | | | 132 | | | $ | 80 | | |
France (6.6%) | |
L'Oreal SA | | | 1,460 | | | | 324 | | |
Pernod Ricard SA | | | 1,669 | | | | 264 | | |
Sanofi | | | 1,359 | | | | 117 | | |
| | | | 705 | | |
Germany (5.5%) | |
Bayer AG (Registered) | | | 1,064 | | | | 132 | | |
SAP SE | | | 4,004 | | | | 449 | | |
| | | | 581 | | |
Hong Kong (1.1%) | |
AIA Group Ltd. | | | 14,000 | | | | 119 | | |
Netherlands (0.9%) | |
RELX N.V. | | | 4,108 | | | | 95 | | |
Switzerland (3.9%) | |
Nestle SA (Registered) | | | 305 | | | | 26 | | |
Novartis AG (Registered) | | | 2,613 | | | | 221 | | |
Roche Holding AG (Genusschein) | | | 673 | | | | 170 | | |
| | | | 417 | | |
United Kingdom (20.0%) | |
British American Tobacco PLC | | | 5,034 | | | | 340 | | |
British American Tobacco PLC ADR | | | 2,625 | | | | 176 | | |
Experian PLC | | | 3,149 | | | | 69 | | |
GlaxoSmithKline PLC | | | 17,839 | | | | 315 | | |
Prudential PLC | | | 6,418 | | | | 165 | | |
Reckitt Benckiser Group PLC | | | 4,755 | | | | 444 | | |
RELX PLC | | | 9,599 | | | | 225 | | |
Unilever PLC | | | 6,961 | | | | 386 | | |
| | | | 2,120 | | |
United States (57.5%) | |
Accenture PLC, Class A | | | 4,552 | | | | 697 | | |
Alphabet, Inc., Class A (a) | | | 564 | | | | 594 | | |
Altria Group, Inc. | | | 2,648 | | | | 189 | | |
Automatic Data Processing, Inc. | | | 1,592 | | | | 187 | | |
Coca-Cola Co. (The) | | | 4,353 | | | | 200 | | |
Danaher Corp. | | | 2,172 | | | | 202 | | |
Factset Research Systems, Inc. | | | 701 | | | | 135 | | |
Fidelity National Information Services, Inc. | | | 1,480 | | | | 139 | | |
International Flavors & Fragrances, Inc. | | | 204 | | | | 31 | | |
Intuit, Inc. | | | 462 | | | | 73 | | |
Johnson & Johnson | | | 1,177 | | | | 165 | | |
Medtronic PLC | | | 2,691 | | | | 217 | | |
Microsoft Corp. | | | 7,247 | | | | 620 | | |
Moody's Corp. | | | 436 | | | | 64 | | |
Nielsen Holdings PLC | | | 2,778 | | | | 101 | | |
NIKE, Inc., Class B | | | 5,377 | | | | 336 | | |
Philip Morris International, Inc. | | | 2,943 | | | | 311 | | |
Priceline Group, Inc. (The) (a) | | | 216 | | | | 375 | | |
Twenty-First Century Fox, Inc., Class A | | | 6,748 | | | | 233 | | |
| | | Shares | | Value
(000) | |
Twenty-First Century Fox, Inc., Class B | | | 6,924 | | | $ | 236 | | |
Visa, Inc., Class A | | | 3,749 | | | | 428 | | |
Walt Disney Co. (The) | | | 2,539 | | | | 273 | | |
Zoetis, Inc. | | | 4,309 | | | | 310 | | |
| | | | 6,116 | | |
Total Common Stocks (Cost $8,192) | | | 10,233 | | |
Short-Term Investment (2.7%) | |
Investment Company (2.7%) | |
Morgan Stanley Institutional Liquidity
Funds — Treasury Securities Portfolio —
Institutional Class (See Note G)
(Cost $286) | | | 286,001 | | | | 286 | | |
Total Investments (99.0%) (Cost $8,478) (b)(c) | | | 10,519 | | |
Other Assets in Excess of Liabilities (1.0%) | | | 111 | | |
Net Assets (100.0%) | | $ | 10,630 | | |
Country assignments and aggregations are based generally on third party vendor classifications and information, and may be different from the assignments and aggregations under the policies set forth in the Fund's prospectus and/or statement of additional information relating to geographic classifications.
(a) Non-income producing security.
(b) The approximate fair value and percentage of net assets, $3,861,000 and 36.3%, respectively, represent the securities that have been fair valued under the fair valuation policy for international investments as described in Note A-1 within the Notes to the Financial Statements.
(c) At December 31, 2017, the aggregate cost for federal income tax purposes is approximately $8,652,000. The aggregate gross unrealized appreciation is approximately $1,925,000 and the aggregate gross unrealized depreciation is approximately $58,000, resulting in net unrealized appreciation of approximately $1,867,000.
ADR American Depositary Receipt.
Portfolio Composition
Classification | | Percentage of
Total Investments | |
Other* | | | 31.9 | % | |
Information Technology Services | | | 13.8 | | |
Pharmaceuticals | | | 13.6 | | |
Software | | | 11.6 | | |
Tobacco | | | 9.7 | | |
Media | | | 7.1 | | |
Personal Products | | | 6.7 | | |
Internet Software & Services | | | 5.6 | | |
Total Investments | | | 100.0 | % | |
* Industries and/or investment types representing less than 5% of total investments.
The accompanying notes are an integral part of the financial statements.
8
Morgan Stanley Institutional Fund, Inc.
Annual Report — December 31, 2017
Statement of Assets and Liabilities | | December 31, 2017
(000) | |
Assets: | |
Investments in Securities of Unaffiliated Issuers, at Value (Cost $8,192) | | $ | 10,233 | | |
Investment in Security of Affiliated Issuer, at Value (Cost $286) | | | 286 | | |
Total Investments in Securities, at Value (Cost $8,478) | | | 10,519 | | |
Foreign Currency, at Value (Cost $4) | | | 4 | | |
Due from Adviser | | | 71 | | |
Receivable for Fund Shares Sold | | | 35 | | |
Dividends Receivable | | | 21 | | |
Tax Reclaim Receivable | | | 20 | | |
Receivable from Affiliate | | | — | @ | |
Other Assets | | | 39 | | |
Total Assets | | | 10,709 | | |
Liabilities: | |
Payable for Professional Fees | | | 48 | | |
Payable for Custodian Fees | | | 16 | | |
Payable for Shareholder Services Fees — Class A | | | — | @ | |
Payable for Distribution and Shareholder Services Fees — Class L | | | 1 | | |
Payable for Distribution and Shareholder Services Fees — Class C | | | 1 | | |
Payable for Transfer Agency Fees — Class I | | | 1 | | |
Payable for Transfer Agency Fees — Class A | | | 1 | | |
Payable for Transfer Agency Fees — Class L | | | — | @ | |
Payable for Transfer Agency Fees — Class C | | | 1 | | |
Payable for Administration Fees | | | 1 | | |
Payable for Sub Transfer Agency Fees — Class I | | | — | @ | |
Payable for Sub Transfer Agency Fees — Class A | | | — | @ | |
Payable for Sub Transfer Agency Fees — Class L | | | — | @ | |
Payable for Sub Transfer Agency Fees — Class C | | | — | @ | |
Other Liabilities | | | 9 | | |
Total Liabilities | | | 79 | | |
Net Assets | | $ | 10,630 | | |
Net Assets Consist Of: | |
Paid-in-Capital | | $ | 8,646 | | |
Accumulated Net Investment Income | | | 5 | | |
Accumulated Net Realized Loss | | | (62 | ) | |
Unrealized Appreciation (Depreciation) on: | |
Investments | | | 2,041 | | |
Foreign Currency Translations | | | (— | @) | |
Net Assets | | $ | 10,630 | | |
The accompanying notes are an integral part of the financial statements.
9
Morgan Stanley Institutional Fund, Inc.
Annual Report — December 31, 2017
Statement of Assets and Liabilities (cont'd) | | December 31, 2017
(000) | |
CLASS I: | |
Net Assets | | $ | 5,334 | | |
| Shares Outstanding $0.001 par value shares of beneficial interest (unlimited shares authorized) (not in 000's) | | | 427,625 | | |
Net Asset Value, Offering and Redemption Price Per Share | | $ | 12.47 | | |
CLASS A: | |
Net Assets | | $ | 2,243 | | |
| Shares Outstanding $0.001 par value shares of beneficial interest (unlimited shares authorized) (not in 000's) | | | 180,270 | | |
Net Asset Value, Redemption Price Per Share | | $ | 12.44 | | |
Maximum Sales Load | | | 5.25 | % | |
Maximum Sales Charge | | $ | 0.69 | | |
Maximum Offering Price Per Share | | $ | 13.13 | | |
CLASS L: | |
Net Assets | | $ | 1,611 | | |
| Shares Outstanding $0.001 par value shares of beneficial interest (unlimited shares authorized) (not in 000's) | | | 129,838 | | |
Net Asset Value, Offering and Redemption Price Per Share | | $ | 12.41 | | |
CLASS C: | |
Net Assets | | $ | 1,430 | | |
| Shares Outstanding $0.001 par value shares of beneficial interest (unlimited shares authorized) (not in 000's) | | | 116,648 | | |
Net Asset Value, Offering and Redemption Price Per Share | | $ | 12.26 | | |
CLASS IS: | |
Net Assets | | $ | 12 | | |
| Shares Outstanding $0.001 par value shares of beneficial interest (unlimited shares authorized) (not in 000's) | | | 973 | | |
Net Asset Value, Offering and Redemption Price Per Share | | $ | 12.47 | | |
@ Amount is less than $500.
The accompanying notes are an integral part of the financial statements.
10
Morgan Stanley Institutional Fund, Inc.
Annual Report — December 31, 2017
Statement of Operations | | Year Ended
December 31, 2017
(000) | |
Investment Income: | |
Dividends from Securities of Unaffiliated Issuers (Net of $6 of Foreign Taxes Withheld) | | $ | 201 | | |
Dividends from Security of Affiliated Issuer (Note G) | | | 1 | | |
Total Investment Income | | | 202 | | |
Expenses: | |
Professional Fees | | | 121 | | |
Advisory Fees (Note B) | | | 78 | | |
Registration Fees | | | 64 | | |
Shareholder Services Fees — Class A (Note D) | | | 5 | | |
Distribution and Shareholder Services Fees — Class L (Note D) | | | 13 | | |
Distribution and Shareholder Services Fees — Class C (Note D) | | | 11 | | |
Custodian Fees (Note F) | | | 27 | | |
Shareholder Reporting Fees | | | 15 | | |
Transfer Agency Fees — Class I (Note E) | | | 2 | | |
Transfer Agency Fees — Class A (Note E) | | | 2 | | |
Transfer Agency Fees — Class L (Note E) | | | 2 | | |
Transfer Agency Fees — Class C (Note E) | | | 2 | | |
Transfer Agency Fees — Class IS (Note E) | | | 2 | | |
Administration Fees (Note C) | | | 8 | | |
Pricing Fees | | | 6 | | |
Directors' Fees and Expenses | | | 3 | | |
Sub Transfer Agency Fees — Class I | | | — | @ | |
Sub Transfer Agency Fees — Class A | | | 1 | | |
Sub Transfer Agency Fees — Class L | | | 1 | | |
Sub Transfer Agency Fees — Class C | | | — | @ | |
Other Expenses | | | 19 | | |
Total Expenses | | | 382 | | |
Expenses Reimbursed by Adviser (Note B) | | | (170 | ) | |
Waiver of Advisory Fees (Note B) | | | (78 | ) | |
Reimbursement of Class Specific Expenses — Class I (Note B) | | | (— | @) | |
Reimbursement of Class Specific Expenses — Class A (Note B) | | | (— | @) | |
Reimbursement of Class Specific Expenses — Class L (Note B) | | | (— | @) | |
Reimbursement of Class Specific Expenses — Class C (Note B) | | | (1 | ) | |
Reimbursement of Class Specific Expenses — Class IS (Note B) | | | (2 | ) | |
Rebate from Morgan Stanley Affiliate (Note G) | | | (— | @) | |
Net Expenses | | | 131 | | |
Net Investment Income | | | 71 | | |
Realized Gain: | |
Investments Sold | | | 675 | | |
Foreign Currency Transactions | | | 1 | | |
Realized Gain | | | 676 | | |
Change in Unrealized Appreciation (Depreciation): | |
Investments | | | 1,191 | | |
Foreign Currency Translations | | | 3 | | |
Net Change in Unrealized Appreciation (Depreciation) | | | 1,194 | | |
Net Realized Gain and Change in Unrealized Appreciation (Depreciation) | | | 1,870 | | |
Net Increase in Net Assets Resulting from Operations | | $ | 1,941 | | |
@ Amount is less than $500.
The accompanying notes are an integral part of the financial statements.
11
Morgan Stanley Institutional Fund, Inc.
Annual Report — December 31, 2017
Statements of Changes in Net Assets | | Year Ended
December 31, 2017
(000) | | Year Ended
December 31, 2016
(000) | |
Increase (Decrease) in Net Assets: | |
Operations: | |
Net Investment Income | | $ | 71 | | | $ | 142 | | |
Net Realized Gain | | | 676 | | | | 561 | | |
Net Change in Unrealized Appreciation (Depreciation) | | | 1,194 | | | | (78 | ) | |
Net Increase in Net Assets Resulting from Operations | | | 1,941 | | | | 625 | | |
Distributions from and/or in Excess of: | |
Class I: | |
Net Investment Income | | | (51 | ) | | | (80 | ) | |
Net Realized Gain | | | (283 | ) | | | (397 | ) | |
Class A: | |
Net Investment Income | | | (15 | ) | | | (29 | ) | |
Net Realized Gain | | | (114 | ) | | | (164 | ) | |
Class L: | |
Net Investment Income | | | (1 | ) | | | (20 | ) | |
Net Realized Gain | | | (87 | ) | | | (174 | ) | |
Class C: | |
Net Investment Income | | | (2 | ) | | | (7 | ) | |
Net Realized Gain | | | (76 | ) | | | (66 | ) | |
Class IS: | |
Net Investment Income | | | (— | @) | | | (— | @) | |
Net Realized Gain | | | (1 | ) | | | (1 | ) | |
Total Distributions | | | (630 | ) | | | (938 | ) | |
Capital Share Transactions:(1) | |
Class I: | |
Subscribed | | | 911 | | | | 1,322 | | |
Distributions Reinvested | | | 188 | | | | 281 | | |
Redeemed | | | (408 | ) | | | (6,116 | ) | |
Class A: | |
Subscribed | | | 623 | | | | 222 | | |
Distributions Reinvested | | | 121 | | | | 182 | | |
Redeemed | | | (939 | ) | | | (1,345 | ) | |
Class L: | |
Exchanged | | | — | | | | 13 | | |
Distributions Reinvested | | | 81 | | | | 184 | | |
Redeemed | | | (941 | ) | | | (733 | ) | |
Class C: | |
Subscribed | | | 543 | | | | 251 | | |
Distributions Reinvested | | | 77 | | | | 72 | | |
Redeemed | | | (136 | ) | | | (105 | ) | |
Net Increase (Decrease) in Net Assets Resulting from Capital Share Transactions | | | 120 | | | | (5,772 | ) | |
Total Increase (Decrease) in Net Assets | | | 1,431 | | | | (6,085 | ) | |
Net Assets: | |
Beginning of Period | | | 9,199 | | | | 15,284 | | |
End of Period (Including Accumulated Undistributed Net Investment Income of $5 and $4) | | $ | 10,630 | | | $ | 9,199 | | |
The accompanying notes are an integral part of the financial statements.
12
Morgan Stanley Institutional Fund, Inc.
Annual Report — December 31, 2017
Statements of Changes in Net Assets (cont'd) | | Year Ended
December 31, 2017
(000) | | Year Ended
December 31, 2016
(000) | |
(1) Capital Share Transactions: | |
Class I: | |
Shares Subscribed | | | 76 | | | | 114 | | |
Shares Issued on Distributions Reinvested | | | 15 | | | | 25 | | |
Shares Redeemed | | | (33 | ) | | | (516 | ) | |
Net Increase (Decrease) in Class I Shares Outstanding | | | 58 | | | | (377 | ) | |
Class A: | |
Shares Subscribed | | | 50 | | | | 20 | | |
Shares Issued on Distributions Reinvested | | | 10 | | | | 16 | | |
Shares Redeemed | | | (82 | ) | | | (118 | ) | |
Net Decrease in Class A Shares Outstanding | | | (22 | ) | | | (82 | ) | |
Class L: | |
Shares Exchanged | | | — | | | | 1 | | |
Shares Issued on Distributions Reinvested | | | 7 | | | | 17 | | |
Shares Redeemed | | | (81 | ) | | | (65 | ) | |
Net Decrease in Class L Shares Outstanding | | | (74 | ) | | | (47 | ) | |
Class C: | |
Shares Subscribed | | | 45 | | | | 22 | | |
Shares Issued on Distributions Reinvested | | | 6 | | | | 7 | | |
Shares Redeemed | | | (11 | ) | | | (10 | ) | |
Net Increase in Class C Shares Outstanding | | | 40 | | | | 19 | | |
@ Amount is less than $500.
The accompanying notes are an integral part of the financial statements.
13
Morgan Stanley Institutional Fund, Inc.
Annual Report — December 31, 2017
Financial Highlights
Global Quality Portfolio
| | | Class I | |
| | | Year Ended December 31, | | Period from
August 30, 2013(2) to | |
Selected Per Share Data and Ratios | | 2017 | | 2016(1) | | 2015 | | 2014 | | December 31, 2013 | |
Net Asset Value, Beginning of Period | | $ | 10.81 | | | $ | 11.43 | | | $ | 11.34 | | | $ | 11.28 | | | $ | 10.00 | | |
Income (Loss) from Investment Operations: | |
Net Investment Income (Loss)(3) | | | 0.13 | | | | 0.17 | | | | 0.15 | | | | 0.17 | | | | (0.00 | )(4) | |
Net Realized and Unrealized Gain | | | 2.35 | | | | 0.29 | | | | 0.46 | | | | 0.13 | | | | 1.28 | | |
Total from Investment Operations | | | 2.48 | | | | 0.46 | | | | 0.61 | | | | 0.30 | | | | 1.28 | | |
Distributions from and/or in Excess of: | |
Net Investment Income | | | (0.13 | ) | | | (0.20 | ) | | | (0.18 | ) | | | (0.13 | ) | | | — | | |
Net Realized Gain | | | (0.69 | ) | | | (0.88 | ) | | | (0.34 | ) | | | (0.11 | ) | | | — | | |
Total Distributions | | | (0.82 | ) | | | (1.08 | ) | | | (0.52 | ) | | | (0.24 | ) | | | — | | |
Net Asset Value, End of Period | | $ | 12.47 | | | $ | 10.81 | | | $ | 11.43 | | | $ | 11.34 | | | $ | 11.28 | | |
Total Return(5) | | | 22.86 | % | | | 4.20 | % | | | 5.27 | % | | | 2.66 | % | | | 12.80 | %(9) | |
Ratios and Supplemental Data: | |
Net Assets, End of Period (Thousands) | | $ | 5,334 | | | $ | 3,993 | | | $ | 8,531 | | | $ | 14,579 | | | $ | 7,440 | | |
Ratio of Expenses to Average Net Assets(11) | | | 1.00 | %(6) | | | 0.99 | %(6) | | | 0.97 | %(6) | | | 1.11 | %(6)(7) | | | 1.19 | %(6)(10) | |
Ratio of Net Investment Income (Loss) to Average
Net Assets(11) | | | 1.10 | %(6) | | | 1.46 | %(6) | | | 1.26 | %(6) | | | 1.49 | %(6) | | | (0.12 | )%(6)(10) | |
Ratio of Rebate from Morgan Stanley Affiliates to
Average Net Assets | | | 0.00 | %(8) | | | 0.00 | %(8) | | | 0.00 | %(8) | | | 0.00 | %(8) | | | 0.01 | %(10) | |
Portfolio Turnover Rate | | | 39 | % | | | 35 | % | | | 61 | % | | | 31 | % | | | 8 | %(9) | |
(11) Supplemental Information on the Ratios to Average Net Assets: | |
Ratios Before Expense Limitation: | |
Expenses to Average Net Assets | | | 3.54 | % | | | 2.45 | % | | | 2.21 | % | | | 2.34 | % | | | 4.86 | %(10) | |
Net Investment Income (Loss) to Average Net Assets | | | (1.44 | )% | | | (0.00 | )%(8) | | | 0.02 | % | | | 0.26 | % | | | (3.79 | )%(10) | |
(1) Reflects prior period custodian out-of-pocket expenses that were reimbursed in September 2016. The amount of the reimbursement was immaterial on a per share basis and did not impact the total return of Class I shares. The Ratio of Expenses to Average Net Assets and the Ratio of Net Investment Income to Average Net Assets would be unchanged as the reimbursement of custodian fees was offset against expense waivers/reimbursements with no impact to net expenses or net investment income.
(2) Commencement of Operations.
(3) Per share amount is based on average shares outstanding.
(4) Amount is less than $0.005 per share.
(5) Calculated based on the net asset value as of the last business day of the period.
(6) The Ratios of Expenses and Net Investment Income (Loss) reflect the rebate of certain Fund expenses in connection with the investments in Morgan Stanley affiliates during the period. The effect of the rebate on the ratios is disclosed in the above table as "Ratio of Rebate from Morgan Stanley Affiliates to Average Net Assets."
(7) Effective October 1, 2014, the Adviser has agreed to limit the ratio of expenses to average net assets to the maximum ratio of 1.00% for Class I shares. Prior to October 1, 2014, the maximum ratio was 1.20% for Class I shares.
(8) Amount is less than 0.005%.
(9) Not annualized.
(10) Annualized.
The accompanying notes are an integral part of the financial statements.
14
Morgan Stanley Institutional Fund, Inc.
Annual Report — December 31, 2017
Financial Highlights
Global Quality Portfolio
| | | Class A | |
| | | Year Ended December 31, | | Period from
August 30, 2013(2) to | |
Selected Per Share Data and Ratios | | 2017 | | 2016(1) | | 2015 | | 2014 | | December 31, 2013 | |
Net Asset Value, Beginning of Period | | $ | 10.79 | | | $ | 11.40 | | | $ | 11.32 | | | $ | 11.27 | | | $ | 10.00 | | |
Income (Loss) from Investment Operations: | |
Net Investment Income (Loss)(3) | | | 0.08 | | | | 0.11 | | | | 0.11 | | | | 0.12 | | | | (0.02 | ) | |
Net Realized and Unrealized Gain | | | 2.35 | | | | 0.32 | | | | 0.45 | | | | 0.14 | | | | 1.29 | | |
Total from Investment Operations | | | 2.43 | | | | 0.43 | | | | 0.56 | | | | 0.26 | | | | 1.27 | | |
Distributions from and/or in Excess of: | |
Net Investment Income | | | (0.09 | ) | | | (0.16 | ) | | | (0.14 | ) | | | (0.10 | ) | | | — | | |
Net Realized Gain | | | (0.69 | ) | | | (0.88 | ) | | | (0.34 | ) | | | (0.11 | ) | | | — | | |
Total Distributions | | | (0.78 | ) | | | (1.04 | ) | | | (0.48 | ) | | | (0.21 | ) | | | — | | |
Net Asset Value, End of Period | | $ | 12.44 | | | $ | 10.79 | | | $ | 11.40 | | | $ | 11.32 | | | $ | 11.27 | | |
Total Return(4) | | | 22.45 | % | | | 3.83 | % | | | 4.91 | % | | | 2.34 | % | | | 12.70 | %(8) | |
Ratios and Supplemental Data: | |
Net Assets, End of Period (Thousands) | | $ | 2,243 | | | $ | 2,182 | | | $ | 3,246 | | | $ | 4,331 | | | $ | 1,612 | | |
Ratio of Expenses to Average Net Assets(10) | | | 1.35 | %(5) | | | 1.33 | %(5) | | | 1.30 | %(5) | | | 1.40 | %(5)(6) | | | 1.54 | %(5)(9) | |
Ratio of Net Investment Income (Loss) to Average
Net Assets(10) | | | 0.66 | %(5) | | | 0.98 | %(5) | | | 0.98 | %(5) | | | 1.03 | %(5) | | | (0.45 | )%(5)(9) | |
Ratio of Rebate from Morgan Stanley Affiliates to
Average Net Assets | | | 0.00 | %(7) | | | 0.00 | %(7) | | | 0.00 | %(7) | | | 0.00 | %(7) | | | 0.01 | %(9) | |
Portfolio Turnover Rate | | | 39 | % | | | 35 | % | | | 61 | % | | | 31 | % | | | 8 | %(8) | |
(10) Supplemental Information on the Ratios to Average Net Assets: | |
Ratios Before Expense Limitation: | |
Expenses to Average Net Assets | | | 3.90 | % | | | 2.85 | % | | | 2.52 | % | | | 2.62 | % | | | 5.00 | %(9) | |
Net Investment Loss to Average Net Assets | | | (1.89 | )% | | | (0.54 | )% | | | (0.24 | )% | | | (0.19 | )% | | | (3.91 | )%(9) | |
(1) Reflects prior period custodian out-of-pocket expenses that were reimbursed in September 2016. The amount of the reimbursement was immaterial on a per share basis and did not impact the total return of Class A shares. The Ratio of Expenses to Average Net Assets and the Ratio of Net Investment Income to Average Net Assets would be unchanged as the reimbursement of custodian fees was offset against expense waivers/reimbursements with no impact to net expenses or net investment income.
(2) Commencement of Operations.
(3) Per share amount is based on average shares outstanding.
(4) Calculated based on the net asset value which does not reflect sales charges, if applicable, as of the last business day of the period.
(5) The Ratios of Expenses and Net Investment Income (Loss) reflect the rebate of certain Fund expenses in connection with the investments in Morgan Stanley affiliates during the period. The effect of the rebate on the ratios is disclosed in the above table as "Ratio of Rebate from Morgan Stanley Affiliates to Average Net Assets."
(6) Effective October 1, 2014, the Adviser has agreed to limit the ratio of expenses to average net assets to the maximum ratios of 1.35% for Class A shares. Prior to October 1, 2014, the maximum ratio was 1.55% for Class A shares.
(7) Amount is less than 0.005%.
(8) Not annualized.
(9) Annualized.
The accompanying notes are an integral part of the financial statements.
15
Morgan Stanley Institutional Fund, Inc.
Annual Report — December 31, 2017
Financial Highlights
Global Quality Portfolio
| | | Class L | |
| | | Year Ended December 31, | | Period from
August 30, 2013(2) to | |
Selected Per Share Data and Ratios | | 2017 | | 2016(1) | | 2015 | | 2014 | | December 31, 2013 | |
Net Asset Value, Beginning of Period | | $ | 10.76 | | | $ | 11.37 | | | $ | 11.29 | | | $ | 11.25 | | | $ | 10.00 | | |
Income (Loss) from Investment Operations: | |
Net Investment Income (Loss)(3) | | | 0.03 | | | | 0.06 | | | | 0.05 | | | | 0.06 | | | | (0.03 | ) | |
Net Realized and Unrealized Gain | | | 2.32 | | | | 0.31 | | | | 0.45 | | | | 0.14 | | | | 1.28 | | |
Total from Investment Operations | | | 2.35 | | | | 0.37 | | | | 0.50 | | | | 0.20 | | | | 1.25 | | |
Distributions from and/or in Excess of: | |
Net Investment Income | | | (0.01 | ) | | | (0.10 | ) | | | (0.08 | ) | | | (0.05 | ) | | | — | | |
Net Realized Gain | | | (0.69 | ) | | | (0.88 | ) | | | (0.34 | ) | | | (0.11 | ) | | | — | | |
Total Distributions | | | (0.70 | ) | | | (0.98 | ) | | | (0.42 | ) | | | (0.16 | ) | | | — | | |
Net Asset Value, End of Period | | $ | 12.41 | | | $ | 10.76 | | | $ | 11.37 | | | $ | 11.29 | | | $ | 11.25 | | |
Total Return(4) | | | 21.80 | % | | | 3.31 | % | | | 4.49 | % | | | 1.74 | % | | | 12.50 | %(8) | |
Ratios and Supplemental Data: | |
Net Assets, End of Period (Thousands) | | $ | 1,611 | | | $ | 2,194 | | | $ | 2,848 | | | $ | 2,723 | | | $ | 962 | | |
Ratio of Expenses to Average Net Assets(10) | | | 1.85 | %(5) | | | 1.81 | %(5) | | | 1.81 | %(5) | | | 1.93 | %(5)(6) | | | 2.04 | %(5)(9) | |
Ratio of Net Investment Income (Loss) to Average
Net Assets(10) | | | 0.24 | %(5) | | | 0.52 | %(5) | | | 0.46 | %(5) | | | 0.55 | %(5) | | | (0.80 | )%(5)(9) | |
Ratio of Rebate from Morgan Stanley Affiliates to
Average Net Assets | | | 0.00 | %(7) | | | 0.00 | %(7) | | | 0.00 | %(7) | | | 0.00 | %(7) | | | 0.01 | %(9) | |
Portfolio Turnover Rate | | | 39 | % | | | 35 | % | | | 61 | % | | | 31 | % | | | 8 | %(8) | |
(10) Supplemental Information on the Ratios to Average Net Assets: | |
Ratios Before Expense Limitation: | |
Expenses to Average Net Assets | | | 4.39 | % | | | 3.35 | % | | | 3.06 | % | | | 3.15 | % | | | 6.27 | %(9) | |
Net Investment Loss to Average Net Assets | | | (2.30 | )% | | | (1.02 | )% | | | (0.79 | )% | | | (0.67 | )% | | | (5.03 | )%(9) | |
(1) Reflects prior period custodian out-of-pocket expenses that were reimbursed in September 2016. The amount of the reimbursement was immaterial on a per share basis and did not impact the total return of Class L shares. The Ratio of Expenses to Average Net Assets and the Ratio of Net Investment Income to Average Net Assets would be unchanged as the reimbursement of custodian fees was offset against expense waivers/reimbursements with no impact to net expenses or net investment income.
(2) Commencement of Operations.
(3) Per share amount is based on average shares outstanding.
(4) Calculated based on the net asset value as of the last business day of the period.
(5) The Ratios of Expenses and Net Investment Income (Loss) reflect the rebate of certain Fund expenses in connection with the investments in Morgan Stanley affiliates during the period. The effect of the rebate on the ratios is disclosed in the above table as "Ratio of Rebate from Morgan Stanley Affiliates to Average Net Assets."
(6) Effective October 1, 2014, the Adviser has agreed to limit the ratio of expenses to average net assets to the maximum ratios of 1.85% for Class L shares. Prior to October 1, 2014 the maximum ratio was 2.05% for Class L shares.
(7) Amount is less than 0.005%.
(8) Not annualized.
(9) Annualized.
The accompanying notes are an integral part of the financial statements.
16
Morgan Stanley Institutional Fund, Inc.
Annual Report — December 31, 2017
Financial Highlights
Global Quality Portfolio
| | | Class C | |
| | | Year Ended December 31, | | Period from
April 30, 2015(2) to | |
Selected Per Share Data and Ratios | | 2017 | | 2016(1) | | December 31, 2015 | |
Net Asset Value, Beginning of Period | | $ | 10.67 | | | $ | 11.30 | | | $ | 11.77 | | |
Income (Loss) from Investment Operations: | |
Net Investment Income (Loss)(3) | | | (0.01 | ) | | | 0.02 | | | | (0.03 | ) | |
Net Realized and Unrealized Gain | | | 2.30 | | | | 0.32 | | | | 0.02 | | |
Total from Investment Operations | | | 2.29 | | | | 0.34 | | | | (0.01 | ) | |
Distributions from and/or in Excess of: | |
Net Investment Income | | | (0.01 | ) | | | (0.09 | ) | | | (0.12 | ) | |
Net Realized Gain | | | (0.69 | ) | | | (0.88 | ) | | | (0.34 | ) | |
Total Distributions | | | (0.70 | ) | | | (0.97 | ) | | | (0.46 | ) | |
Net Asset Value, End of Period | | $ | 12.26 | | | $ | 10.67 | | | $ | 11.30 | | |
Total Return(4) | | | 21.46 | % | | | 3.06 | % | | | (0.13 | )%(7) | |
Ratios and Supplemental Data: | |
Net Assets, End of Period (Thousands) | | $ | 1,430 | | | $ | 819 | | | $ | 648 | | |
Ratio of Expenses to Average Net Assets(9) | | | 2.10 | %(5) | | | 2.10 | %(5) | | | 2.10 | %(5)(8) | |
Ratio of Net Investment Income (Loss) to Average Net Assets(9) | | | (0.06 | )%(5) | | | 0.17 | %(5) | | | (0.39 | )%(5)(8) | |
Ratio of Rebate from Morgan Stanley Affiliates to Average Net Assets | | | 0.00 | %(6) | | | 0.00 | %(6) | | | 0.00 | %(6)(8) | |
Portfolio Turnover Rate | | | 39 | % | | | 35 | % | | | 61 | % | |
(9) Supplemental Information on the Ratios to Average Net Assets: | |
Ratios Before Expense Limitation: | |
Expense to Average Net Assets | | | 4.71 | % | | | 3.83 | % | | | 3.80 | %(8) | |
Net Investment Loss to Average Net Assets | | | (2.67 | )% | | | (1.56 | )% | | | (2.09 | )%(8) | |
(1) Reflects prior period custodian out-of-pocket expenses that were reimbursed in September 2016. The amount of the reimbursement was immaterial on a per share basis and did not impact the total return of Class C shares. The Ratio of Expenses to Average Net Assets and the Ratio of Net Investment Income to Average Net Assets would be unchanged as the reimbursement of custodian fees was offset against expense waivers/reimbursements with no impact to net expenses or net investment income.
(2) Commencement of Offering.
(3) Per share amount is based on average shares outstanding.
(4) Calculated based on the net asset value which does not reflect sales charges, if applicable, as of the last business day of the period.
(5) The Ratios of Expenses and Net Investment Income (Loss) reflect the rebate of certain Fund expenses in connection with the investments in Morgan Stanley affiliates during the period. The effect of the rebate on the ratios is disclosed in the above table as "Ratio of Rebate from Morgan Stanley Affiliates to Average Net Assets."
(6) Amount is less than 0.005%.
(7) Not annualized.
(8) Annualized.
The accompanying notes are an integral part of the financial statements.
17
Morgan Stanley Institutional Fund, Inc.
Annual Report — December 31, 2017
Financial Highlights
Global Quality Portfolio
| | | Class IS | |
| | | Year Ended December 31, | | Period from
September 13, 2013(2) to | |
Selected Per Share Data and Ratios | | 2017 | | 2016(1) | | 2015 | | 2014 | | December 31, 2013 | |
Net Asset Value, Beginning of Period | | $ | 10.81 | | | $ | 11.43 | | | $ | 11.34 | | | $ | 11.28 | | | $ | 10.28 | | |
Income (Loss) from Investment Operations: | |
Net Investment Income (Loss)(3) | | | 0.14 | | | | 0.16 | | | | 0.16 | | | | 0.17 | | | | (0.00 | )(4) | |
Net Realized and Unrealized Gain | | | 2.34 | | | | 0.31 | | | | 0.45 | | | | 0.13 | | | | 1.00 | | |
Total from Investment Operations | | | 2.48 | | | | 0.47 | | | | 0.61 | | | | 0.30 | | | | 1.00 | | |
Distributions from and/or in Excess of: | |
Net Investment Income | | | (0.13 | ) | | | (0.21 | ) | | | (0.18 | ) | | | (0.13 | ) | | | — | | |
Net Realized Gain | | | (0.69 | ) | | | (0.88 | ) | | | (0.34 | ) | | | (0.11 | ) | | | — | | |
Total Distributions | | | (0.82 | ) | | | (1.09 | ) | | | (0.52 | ) | | | (0.24 | ) | | | — | | |
Net Asset Value, End of Period | | $ | 12.47 | | | $ | 10.81 | | | $ | 11.43 | | | $ | 11.34 | | | $ | 11.28 | | |
Total Return(5) | | | 22.91 | % | | | 4.17 | % | | | 5.38 | % | | | 2.67 | % | | | 9.73 | %(9) | |
Ratios and Supplemental Data: | |
Net Assets, End of Period (Thousands) | | $ | 12 | | | $ | 11 | | | $ | 11 | | | $ | 11 | | | $ | 11 | | |
Ratio of Expenses to Average Net Assets(11) | | | 0.95 | %(6) | | | 0.95 | %(6) | | | 0.95 | %(6) | | | 1.10 | %(6)(7) | | | 1.15 | %(6)(10) | |
Ratio of Net Investment Income (Loss) to Average
Net Assets(11) | | | 1.15 | %(6) | | | 1.35 | %(6) | | | 1.31 | %(6) | | | 1.51 | %(6) | | | (0.10 | )%(6)(10) | |
Ratio of Rebate from Morgan Stanley Affiliates to
Average Net Assets | | | 0.00 | %(8) | | | 0.00 | %(8) | | | 0.00 | %(8) | | | 0.00 | %(8) | | | 0.00 | %(8)(10) | |
Portfolio Turnover Rate | | | 39 | % | | | 35 | % | | | 61 | % | | | 31 | % | | | 8 | %(9) | |
(11) Supplemental Information on the Ratios to Average Net Assets: | |
Ratios Before Expense Limitation: | |
Expenses to Average Net Assets | | | 19.10 | % | | | 19.36 | % | | | 16.35 | % | | | 19.72 | % | | | 9.57 | %(10) | |
Net Investment Loss to Average Net Assets | | | (17.00 | )% | | | (17.06 | )% | | | (14.09 | )% | | | (17.11 | )% | | | (8.52 | )%(10) | |
(1) Reflects prior period custodian out-of-pocket expenses that were reimbursed in September 2016. The amount of the reimbursement was immaterial on a per share basis and did not impact the total return of Class IS shares. The Ratio of Expenses to Average Net Assets and the Ratio of Net Investment Income to Average Net Assets would be unchanged as the reimbursement of custodian fees was offset against expense waivers/reimbursements with no impact to net expenses or net investment income.
(2) Commencement of Offering.
(3) Per share amount is based on average shares outstanding.
(4) Amount is less than $0.005 per share.
(5) Calculated based on the net asset value as of the last business day of the period.
(6) The Ratios of Expenses and Net Investment Income (Loss) reflect the rebate of certain Fund expenses in connection with the investments in Morgan Stanley affiliates during the period. The effect of the rebate on the ratios is disclosed in the above table as "Ratio of Rebate from Morgan Stanley Affiliates to Average Net Assets."
(7) Effective October 1, 2014, the Adviser has agreed to limit the ratio of expenses to average net assets to the maximum ratio of 0.95% for Class IS shares. Prior to October 1, 2014, the maximum ratio was 1.15% for Class IS shares.
(8) Amount is less than 0.005%.
(9) Not annualized.
(10) Annualized.
The accompanying notes are an integral part of the financial statements.
18
Morgan Stanley Institutional Fund, Inc.
Annual Report — December 31, 2017
Notes to Financial Statements
Morgan Stanley Institutional Fund, Inc. (the "Company") is registered under the Investment Company Act of 1940, as amended (the "Act"), as an open-end management investment company. The Company is comprised of twenty-nine separate, active, diversified and non-diversified funds (individually referred to as a "Fund", collectively as the "Funds"). The Company applies investment company accounting and reporting guidance.
The accompanying financial statements relate to the Global Quality Portfolio. The Fund seeks long-term capital appreciation.
During the year ended December 31, 2017, Morgan Stanley Investment Management Company ("MSIM Company") served as the Sub-Adviser to the Fund. Effective December 31, 2017, MSIM Company is no longer a Sub-Adviser to the Fund.
The Fund offers five classes of shares — Class I, Class A, Class L, Class C and Class IS. On April 30, 2015, the Fund suspended offering of Class L shares. Existing Class L shareholders may invest through reinvestment of dividends and distributions.
A. Significant Accounting Policies: The following significant accounting policies are in conformity with U.S. generally accepted accounting principles ("GAAP"). Such policies are consistently followed by the Company in the preparation of its financial statements. GAAP may require management to make estimates and assumptions that affect the reported amounts and disclosures in the financial statements. Actual results may differ from those estimates.
1. Security Valuation: (1) An equity portfolio security listed or traded on an exchange is valued at its latest reported sales price (or at the exchange official closing price if such exchange reports an official closing price), and if there were no sales on a given day and if there is no official exchange closing price for that day, the security is valued at the mean between the last reported bid and asked prices if such bid and asked prices are available on the relevant exchanges. Listed equity securities not traded on the valuation date with no reported bid and asked prices available on the exchange are valued at the mean between the current bid and asked prices obtained from one or more reputable brokers or dealers. In cases where a security is traded on more than one exchange, the security is valued on the exchange designated as the primary market; (2) all other equity portfolio securities for which over-the-counter ("OTC") market quotations are readily available are valued at the latest reported sales price (or at the market official closing price if such market reports an official
closing price), and if there was no trading in the security on a given day and if there is no official closing price from relevant markets for that day, the security is valued at the mean between the last reported bid and asked prices if such bid and asked prices are available on the relevant markets. An unlisted equity security that does not trade on the valuation date and for which bid and asked prices from the relevant markets are unavailable is valued at the mean between the current bid and asked prices obtained from one or more reputable brokers or dealers; (3) certain portfolio securities may be valued by an outside pricing service/vendor approved by the Company's Board of Directors (the "Directors"). The pricing service/vendor may employ a pricing model that takes into account, among other things, bids, yield spreads, and/or other market data and specific security characteristics. Alternatively, if a valuation is not available from an outside pricing service/vendor, and the security trades on an exchange, the security may be valued at its latest reported sale price (or at the exchange official closing price if such exchange reports an official closing price), prior to the time when assets are valued. If there are no sales on a given day and if there is no official exchange closing price for that day, the security is valued at the mean between the last reported bid and asked prices if such bid and asked prices are available in the relevant exchanges; (4) when market quotations are not readily available, including circumstances under which Morgan Stanley Investment Management Inc. (the "Adviser") or Morgan Stanley Investment Management Limited ("MSIM Limited") and Morgan Stanley Investment Management Company ("MSIM Company") (together, the "Sub-Advisers"), each a wholly-owned subsidiary of Morgan Stanley, determine that the closing price, last sale price or the mean between the last reported bid and asked prices are not reflective of a security's market value, portfolio securities are valued at their fair value as determined in good faith under procedures established by and under the general supervision of the Directors. Occasionally, developments affecting the closing prices of securities and other assets may occur between the times at which valuations of such securities are determined (that is, close of the foreign market on which the securities trade) and the close of business of the New York Stock Exchange ("NYSE"). If developments occur during such periods that are expected to materially affect the value of such securities, such valuations may be adjusted to reflect the estimated fair value of such securities as of the close of the
19
Morgan Stanley Institutional Fund, Inc.
Annual Report — December 31, 2017
Notes to Financial Statements (cont'd)
NYSE, as determined in good faith by the Directors or by the Adviser using a pricing service and/or procedures approved by the Directors; (5) quotations of foreign portfolio securities, other assets and liabilities and forward contracts stated in foreign currency are translated into U.S. dollar equivalents at the prevailing market rates prior to the close of the NYSE; and (6) investments in mutual funds, including the Morgan Stanley Institutional Liquidity Funds, are valued at the net asset value ("NAV") as of the close of each business day.
The Directors have responsibility for determining in good faith the fair value of the investments, and the Directors may appoint others, such as the Company's Adviser or a valuation committee, to assist the Directors in determining fair value and to make the actual calculations pursuant to the fair valuation methodologies previously approved by the Directors. Under procedures approved by the Directors, the Company's Adviser has formed a Valuation Committee whose members are approved by the Directors. The Valuation Committee provides administration and oversight of the Company's valuation policies and procedures, which are reviewed at least annually by the Directors. These procedures allow the Company to utilize independent pricing services, quotations from securities and financial instrument dealers, and other market sources to determine fair value.
The Company has procedures to determine the fair value of securities and other financial instruments for which market prices are not readily available. Under these procedures, the Valuation Committee convenes on a regular and ad hoc basis to review such securities and considers a number of factors, including valuation methodologies and significant unobservable valuation inputs, when arriving at fair value. The Valuation Committee may employ a market-based approach which may use related or comparable assets or liabilities, recent transactions, market multiples, book values, and other relevant information for the investment to determine the fair value of the investment. An income-based valuation approach may also be used in which the anticipated future cash flows of the investment are discounted to calculate fair value. Discounts may also be applied due to the nature or duration of any restrictions on the disposition of the investments. Due to the inherent uncertainty of valuations of such investments, the fair values may differ significantly from the values that would have
been used had an active market existed. The Valuation Committee employs various methods for calibrating these valuation approaches including a regular review of valuation methodologies, key inputs and assumptions, transactional back-testing or disposition analysis, and reviews of any related market activity.
2. Fair Value Measurement: Financial Accounting Standards Board ("FASB") Accounting Standards CodificationTM ("ASC") 820, "Fair Value Measurement" ("ASC 820"), defines fair value as the value that the Fund would receive to sell an investment or pay to transfer a liability in a timely transaction with an independent buyer in the principal market, or in the absence of a principal market, the most advantageous market for the investment or liability. ASC 820 establishes a three-tier hierarchy to distinguish between (1) inputs that reflect the assumptions market participants would use in valuing an asset or liability developed based on market data obtained from sources independent of the reporting entity (observable inputs) and (2) inputs that reflect the reporting entity's own assumptions about the assumptions market participants would use in valuing an asset or liability developed based on the best information available in the circumstances (unobservable inputs) and to establish classification of fair value measurements for disclosure purposes. Various inputs are used in determining the value of the Fund's investments. The inputs are summarized in the three broad levels listed below.
• Level 1 – unadjusted quoted prices in active markets for identical investments
• Level 2 – other significant observable inputs (including quoted prices for similar investments, interest rates, prepayment speeds, credit risk, etc.)
• Level 3 – significant unobservable inputs including the Fund's own assumptions in determining the fair value of investments. Factors considered in making this determination may include, but are not limited to, information obtained by contacting the issuer, analysts, or the appropriate stock exchange (for exchange-traded securities), analysis of the issuer's financial statements or other available documents and, if necessary, available information concerning other securities in similar circumstances
20
Morgan Stanley Institutional Fund, Inc.
Annual Report — December 31, 2017
Notes to Financial Statements (cont'd)
The inputs or methodology used for valuing securities are not necessarily an indication of the risk associated with investing in those securities and the determination of the significance of a particular input to the fair value measurement in its entirety requires judgment and considers factors specific to each security.
The following is a summary of the inputs used to value the Fund's investments as of December 31, 2017.
Investment Type | | Level 1
Unadjusted
quoted
prices
(000) | | Level 2
Other
significant
observable
inputs
(000) | | Level 3
Significant
unobservable
inputs
(000) | | Total
(000) | |
Assets: | |
Common Stocks | |
Beverages | | $ | 200 | | | $ | 264 | | | $ | — | | | $ | 464 | | |
Capital Markets | | | 199 | | | | — | | | | — | | | | 199 | | |
Chemicals | | | 31 | | | | — | | | | — | | | | 31 | | |
Food Products | | | — | | | | 26 | | | | — | | | | 26 | | |
Health Care Equipment &
Supplies | | | 419 | | | | — | | | | — | | | | 419 | | |
Household Products | | | — | | | | 444 | | | | — | | | | 444 | | |
Information Technology
Services | | | 1,451 | | | | — | | | | — | | | | 1,451 | | |
Insurance | | | — | | | | 284 | | | | — | | | | 284 | | |
Internet & Direct
Marketing Retail | | | 375 | | | | — | | | | — | | | | 375 | | |
Internet Software &
Services | | | 594 | | | | — | | | | — | | | | 594 | | |
Media | | | 742 | | | | — | | | | — | | | | 742 | | |
Personal Products | | | — | | | | 710 | | | | — | | | | 710 | | |
Pharmaceuticals | | | 475 | | | | 955 | | | | — | | | | 1,430 | | |
Professional Services | | | 101 | | | | 389 | | | | — | | | | 490 | | |
Software | | | 773 | | | | 449 | | | | — | | | | 1,222 | | |
Textiles, Apparel &
Luxury Goods | | | 336 | | | | — | | | | — | | | | 336 | | |
Tobacco | | | 676 | | | | 340 | | | | — | | | | 1,016 | | |
Total Common Stocks | | | 6,372 | | | | 3,861 | | | | — | | | | 10,233 | | |
Short-Term Investment | |
Investment Company | | | 286 | | | | — | | | | — | | | | 286 | | |
Total Assets | | $ | 6,658 | | | $ | 3,861 | | | $ | — | | | $ | 10,519 | | |
Transfers between investment levels may occur as the markets fluctuate and/or the availability of data used in an investment's valuation changes. The Fund recognizes transfers between the levels as of the end of the period. As of December 31, 2017, securities with a total value of approximately $3,861,000 transferred from Level 1 to Level 2. Securities that were valued using unadjusted quoted prices at December 31, 2016 were valued using other significant observable inputs at December 31, 2017. At December 31, 2017, the fair value of certain securities were adjusted due to developments which occurred between the time of the close of the foreign markets on which they trade and the close of business on the NYSE which resulted in their Level 2 classification.
3. Foreign Currency Translation and Foreign Investments: The books and records of the Fund are maintained in U.S. dollars. Foreign currency amounts are translated into U.S. dollars as follows:
– investments, other assets and liabilities at the prevailing rate of exchange on the valuation date;
– investment transactions and investment income at the prevailing rates of exchange on the dates of such transactions.
Although the net assets of the Fund are presented at the foreign exchange rates and market values at the close of the period, the Fund does not isolate that portion of the results of operations arising as a result of changes in the foreign exchange rates from the fluctuations arising from changes in the market prices of securities held at period end. Similarly, the Fund does not isolate the effect of changes in foreign exchange rates from the fluctuations arising from changes in the market prices of securities sold during the period. Accordingly, realized and unrealized foreign currency gains (losses) on investments in securities are included in the reported net realized and unrealized gains (losses) on investment transactions and balances. However, pursuant to U.S. federal income tax regulations, gains and losses from certain foreign currency transactions and the foreign currency portion of gains and losses realized on sales and maturities of foreign denominated debt securities are treated as ordinary income for U.S. federal income tax purposes.
Net realized gains (losses) on foreign currency transactions represent net foreign exchange gains (losses) from foreign currency forward exchange contracts, disposition of foreign currencies, currency gains (losses) realized between the trade and settlement dates on securities transactions, and the difference between the amount of investment income and foreign withholding taxes recorded on the Fund's books and the U.S. dollar equivalent amounts actually received or paid. Net unrealized currency gains (losses) from valuing foreign currency denominated assets and liabilities at period end exchange rates are reflected as a component of unrealized appreciation (depreciation) in the Statement of Assets and Liabilities. The change in unrealized currency gains (losses) on foreign currency translations for the period is reflected in the Statement of Operations.
21
Morgan Stanley Institutional Fund, Inc.
Annual Report — December 31, 2017
Notes to Financial Statements (cont'd)
Foreign security and currency transactions may involve certain considerations and risks not typically associated with those of U.S. dollar denominated transactions as a result of, among other factors, fluctuations of exchange rates in relation to the U.S. dollar, the possibility of lower levels of governmental supervision and regulation of foreign securities markets and the possibility of political or economic instability.
Governmental approval for foreign investments may be required in advance of making an investment under certain circumstances in some countries, and the extent of foreign investments in domestic companies may be subject to limitation in other countries. Foreign ownership limitations also may be imposed by the charters of individual companies to prevent, among other concerns, violations of foreign investment limitations. As a result, an additional class of shares (identified as "Foreign" in the Portfolio of Investments) may be created and offered for investment. The "local" and "foreign shares" market values may differ. In the absence of trading of the foreign shares in such markets, the Fund values the foreign shares at the closing exchange price of the local shares.
4. Indemnifications: The Company enters into contracts that contain a variety of indemnifications. The Company's maximum exposure under these arrangements is unknown. However, the Company has not had prior claims or losses pursuant to these contracts and expects the risk of loss to be remote.
5. Dividends and Distributions to Shareholders: Dividends and distributions to shareholders are recorded on the ex-dividend date. Dividends from net investment income, if any, are declared and paid annually. Net realized capital gains, if any, are distributed at least annually.
6. Security Transactions, Income and Expenses: Security transactions are accounted for on the trade date (date the order to buy or sell is executed). Realized gains and losses on the sale of investment securities are determined on the specific identified cost method. Dividend income and other distributions are recorded on the ex-dividend date (except for certain foreign dividends which may be recorded as soon as the Fund is informed of such dividends) net of applicable withholding taxes. Interest income is recognized on the accrual basis except where collection is in doubt. Discounts are accreted and premiums are amortized over the life of the respective securities. Most expenses of the Company can be directly attributed
to a particular Fund. Expenses which cannot be directly attributed are apportioned among the Funds based upon relative net assets or other appropriate methods. Income, expenses (other than class specific expenses — distribution and shareholder services, transfer agency and sub transfer agency fees) and realized and unrealized gains or losses are allocated to each class of shares based upon their relative net assets.
B. Advisory/Sub-Advisory Fees: The Adviser, a wholly-owned subsidiary of Morgan Stanley, provides the Fund with advisory services under the terms of an Investment Advisory Agreement, paid quarterly, at the annual rate based on the daily net assets as follows:
First $500
million | | Next $500
million | | Over $1
billion | |
| | 0.80 | % | | | 0.75 | % | | | 0.70 | % | |
For the year ended December 31, 2017, the advisory fee rate (net of waiver/rebate) was equivalent to an annual effective rate of 0.00% of the Fund's average daily net assets.
The Adviser has agreed to reduce its advisory fee and/or reimburse the Fund so that total annual portfolio operating expenses, excluding certain investment related expenses, taxes, interest and other extraordinary expenses (including litigation), will not exceed 1.00% for Class I shares, 1.35% for Class A shares, 1.85% for Class L shares, 2.10% for Class C shares and 0.95% for Class IS shares. The fee waivers and/or expense reimbursements will continue for at least one year from the date of the Fund's prospectus or until such time as the Directors act to discontinue all or a portion of such waivers and/or reimbursements when they deem such action is appropriate. For the year ended December 31, 2017, approximately $78,000 of advisory fees were waived and approximately $173,000 of other expenses were reimbursed by the Adviser pursuant to this arrangement.
The Adviser has entered into a Sub-Advisory Agreement with the Sub-Advisers, each a wholly-owned subsidiary of Morgan Stanley. The Sub-Advisers provide the Fund with advisory services subject to the overall supervision of the Adviser and the Fund's Officers and Directors. The Adviser pays the Sub-Advisers on a monthly basis a portion of the net advisory fees the Adviser receives from the Fund.
Effective December 31, 2017, MSIM Company is no longer a Sub-Adviser to the Fund.
C. Administration Fees: The Adviser also serves as Administrator to the Company and provides administrative services pursuant to an Administration Agreement for an annual fee,
22
Morgan Stanley Institutional Fund, Inc.
Annual Report — December 31, 2017
Notes to Financial Statements (cont'd)
accrued daily and paid monthly, of 0.08% of the Fund's average daily net assets.
Under a Sub-Administration Agreement between the Administrator and State Street Bank and Trust Company ("State Street"), State Street provides certain administrative services to the Company. For such services, the Administrator pays State Street a portion of the fee the Administrator receives from the Fund.
D. Distribution and Shareholder Services Fees: Morgan Stanley Distribution, Inc. ("MSDI" or the "Distributor"), a wholly-owned subsidiary of the Adviser and an indirect subsidiary of Morgan Stanley, serves as the Company's Distributor of Fund shares pursuant to a Distribution Agreement. The Company has adopted a Shareholder Services Plan with respect to Class A shares pursuant to Rule 12b-1 under the Act. Under the Shareholder Services Plan, the Fund pays the Distributor a shareholder services fee, accrued daily and paid monthly, at an annual rate of 0.25% of the Fund's average daily net assets attributable to Class A shares.
The Company has adopted a Distribution and Shareholder Services Plan with respect to Class L shares pursuant to Rule 12b-1 under the Act. Under the Distribution and Shareholder Services Plan, the Fund pays the Distributor a distribution fee, accrued daily and paid monthly, at an annual rate of 0.50% and a shareholder services fee, accrued daily and paid monthly, at an annual rate of 0.25% of the Fund's average daily net assets attributable to Class L shares.
The Company has adopted a Distribution and Shareholder Services Plan with respect to Class C shares pursuant to Rule 12b-1 under the Act. Under the Distribution and Shareholder Services Plan, the Fund pays the Distributor a distribution fee, accrued daily and paid monthly, at an annual rate of 0.75% and a shareholder services fee, accrued daily and paid monthly, at an annual rate of 0.25% of the Fund's average daily net assets attributable to Class C shares.
The distribution and shareholder services fees are used to support the expenses associated with servicing and maintaining accounts. The Distributor may compensate other parties for providing shareholder support services to investors who purchase Class A, Class L and Class C shares.
E. Dividend Disbursing and Transfer Agent: The Company's dividend disbursing and transfer agent is Boston Financial Data Services, Inc. ("BFDS"). Pursuant to a Transfer Agency Agreement, the Company pays BFDS a fee based on the number of classes, accounts and transactions relating to the
Funds of the Company. Effective January 1, 2018, BFDS changed its name to DST Asset Manager Solutions, Inc.
F. Custodian Fees: State Street (the "Custodian") also serves as Custodian for the Company in accordance with a Custodian Agreement. The Custodian holds cash, securities, and other assets of the Company as required by the Act. Custody fees are payable monthly based on assets held in custody, investment purchases and sales activity and account maintenance fees, plus reimbursement for certain out-of-pocket expenses.
G. Security Transactions and Transactions with Affiliates: For the year ended December 31, 2017, purchases and sales of investment securities for the Fund, other than long-term U.S. Government securities and short-term investments, were approximately $3,694,000 and $4,269,000, respectively. There were no purchases and sales of long-term U.S. Government securities for the year ended December 31, 2017.
The Fund invests in the Institutional Class of the Morgan Stanley Institutional Liquidity Funds — Treasury Securities Portfolio (the "Liquidity Funds"), an open-end management investment company managed by the Adviser. Advisory fees paid by the Fund are reduced by an amount equal to its pro-rata share of the advisory and administration fees paid by the Fund due to its investment in the Liquidity Funds. For the year ended December 31, 2017, advisory fees paid were reduced by less than $500 relating to the Fund's investment in the Liquidity Funds.
A summary of the Fund's transactions in shares of the Liquidity Funds during the year ended December 31, 2017 is as follows:
Affiliated
Investment
Company | | Value
December 31,
2016
(000) | | Purchases
at Cost
(000) | | Proceeds
from Sales
(000) | | Dividend
Income
(000) | |
Liquidity Funds | | $ | 46 | | | $ | 3,433 | | | $ | 3,193 | | | $ | 1 | | |
Affiliated
Investment
Company (cont'd) | | Realized
Gain
Loss
(000) | | Change in
Unrealized
Appreciation
(Depreciation)
(000) | | Value
December 31,
2017
(000) | |
Liquidity Funds | | $ | — | | | $ | — | | | $ | 286 | | |
The Fund is permitted to purchase and sell securities ("cross-trade") from and to other Morgan Stanley Funds as well as other funds and client accounts for which the Adviser or an affiliate of the Adviser serves as investment adviser, pursuant to procedures approved by the Directors in compliance with Rule 17a-7 under the Act (the "Rule"). Each cross-trade is executed at the current market price in compliance with provisions of the Rule. For the year ended December 31, 2017, the Fund did not engage in any cross-trade transactions.
23
Morgan Stanley Institutional Fund, Inc.
Annual Report — December 31, 2017
Notes to Financial Statements (cont'd)
The Fund has an unfunded Deferred Compensation Plan (the "Compensation Plan"), which allows each independent Director to defer payment of all, or a portion, of the fees he or she receives for serving on the Board of Directors. Each eligible Director generally may elect to have the deferred amounts credited with a return equal to the total return on one or more of the Morgan Stanley funds that are offered as investment options under the Compensation Plan. Appreciation/depreciation and distributions received from these investments are recorded with an offsetting increase/decrease in the deferred compensation obligation and do not affect the NAV of the Fund.
H. Federal Income Taxes: It is the Fund's intention to continue to qualify as a regulated investment company and distribute all of its taxable and tax-exempt income. Accordingly, no provision for federal income taxes is required in the financial statements.
The Fund may be subject to taxes imposed by countries in which it invests. Such taxes are generally based on income and/or capital gains earned or repatriated. Taxes are accrued based on net investment income, net realized gains and net unrealized appreciation as such income and/or gains are earned. Taxes may also be based on transactions in foreign currency and are accrued based on the value of investments denominated in such currency.
FASB ASC 740-10, "Income Taxes — Overall", sets forth a minimum threshold for financial statement recognition of the benefit of a tax position taken or expected to be taken in a tax return. Management has concluded there are no significant uncertain tax positions that would require recognition in the financial statements. If applicable, the Fund recognizes interest accrued related to unrecognized tax benefits in "Interest Expense" and penalties in "Other Expenses" in the Statement of Operations. The Fund files tax returns with the U.S. Internal Revenue Service, New York and various states. Generally, each of the tax years in the four-year period ended December 31, 2017, remains subject to examination by taxing authorities.
The tax character of distributions paid may differ from the character of distributions shown in the Statements of Changes in Net Assets due to short-term capital gains being treated as ordinary income for tax purposes. The tax character of distributions paid during fiscal years 2017 and 2016 was as follows:
2017
Distributions | | 2016
Distributions | |
Paid From: | | Paid From: | |
Ordinary
Income
(000) | | Long-Term
Capital Gain
(000) | | Ordinary
Income
(000) | | Long-Term
Capital Gain
(000) | |
$ | 91 | | | $ | 539 | | | $ | 281 | | | $ | 655 | | |
The amount and character of income and gains to be distributed are determined in accordance with income tax regulations which may differ from GAAP. These book/tax differences are either considered temporary or permanent in nature.
Temporary differences are attributable to differing book and tax treatments for the timing of the recognition of gains (losses) on certain investment transactions and the timing of the deductibility of certain expenses.
Permanent differences, primarily due to differing treatments of gains (losses) related to foreign currency transactions, resulted in the following reclassifications among the components of net assets at December 31, 2017:
Accumulated
Undistributed
Net Investment
Income
(000) | | Distribution
in Excess of
Net Realized
Gain
(000) | | Paid-in-
Capital
(000) | |
| $ | (1 | ) | | $ | 1 | | | $ | — | | |
At December 31, 2017, the components of distributable earnings for the Fund on a tax basis were as follows:
Undistributed
Ordinary
Income
(000) | | Undistributed
Long-Term
Capital Gain
(000) | |
| $ | 5 | | | $ | 113 | | |
I. Credit Facility: The Company and other Morgan Stanley funds participated in a $150,000,000 committed, unsecured revolving line of credit facility (the "Facility") with State Street. This Facility is to be used for temporary emergency purposes or funding of shareholder redemption requests. The interest rate on borrowings is based on the federal funds rate or 1 month LIBOR rate plus a spread. The Facility also has a commitment fee of 0.25% per annum based on the unused portion of the Facility. During the year ended December 31, 2017, the Fund did not have any borrowings under the Facility.
J. Other: At December 31, 2017, the Fund had record owners of 10% or greater. Investment activities of these shareholders could have a material impact on the Fund. The aggregate percentage of such owners was 69.5%.
24
Morgan Stanley Institutional Fund, Inc.
Annual Report — December 31, 2017
Report of Independent Registered Public Accounting Firm
To the Shareholders and Board of Directors of
Morgan Stanley Institutional Fund, Inc. —
Global Quality Portfolio
Opinion on the Financial Statements
We have audited the accompanying statement of assets and liabilities of Global Quality Portfolio (the "Fund") (one of the funds constituting the Morgan Stanley Institutional Fund, Inc. (the "Company")), including the portfolio of investments, as of December 31, 2017, and the related statement of operations for the year then ended, the statements of changes in net assets for each of the two years in the period then ended, the financial highlights for each of the four years in the period then ended and the period from August 30, 2013 (commencement of operations) through December 31, 2013 and the related notes (collectively referred to as the "financial statements"). In our opinion, the financial statements present fairly, in all material respects, the financial position of Global Quality Portfolio (one of the funds constituting Morgan Stanley Institutional Fund, Inc.) at December 31, 2017, the results of its operations for the year then ended, the changes in its net assets for each of the two years in the period then ended and its financial highlights for each of the four years in the period then ended and the period from August 30, 2013 (commencement of operations) through December 31, 2013, in conformity with U.S. generally accepted accounting principles.
Basis for Opinion
These financial statements are the responsibility of the Company's management. Our responsibility is to express an opinion on the Fund's financial statements based on our audits. We are a public accounting firm registered with the Public Company Accounting Oversight Board (United States) ("PCAOB") and are required to be independent with respect to the Company in accordance with the U.S. federal securities law and the applicable rules and regulations of the Securities and Exchange Commission and the PCAOB.
We conducted our audits in accordance with the standards of the PCAOB. Those standards require that we plan and perform the audit to obtain reasonable assurance about whether the financial statements are free of material misstatement, whether due to error or fraud. The Company is not required to have, nor were we engaged to perform, an audit of the Company's internal control over financial reporting. As part of our audits, we are required to obtain an understanding of internal control over financial reporting, but not for the purpose of expressing an opinion on the effectiveness of the Company's internal control over financial reporting. Accordingly, we express no such opinion.
Our audits included performing procedures to assess the risks of material misstatement of the financial statements, whether due to error or fraud, and performing procedures that respond to those risks. Such procedures included examining, on a test basis, evidence regarding the amounts and disclosures in the financial statements. Our procedures included confirmation of securities owned as of December 31, 2017 by correspondence with the custodian and others or by other appropriate auditing procedures where replies from others were not received. Our audits also included evaluating the accounting principles used and significant estimates made by management, as well as evaluating the overall presentation of the financial statements. We believe that our audits provide a reasonable basis for our opinion.

We have served as the auditor of one or more Morgan Stanley investment companies since 2000.
Boston, Massachusetts
February 26, 2018
25
Morgan Stanley Institutional Fund, Inc.
Annual Report — December 31, 2017
Federal Tax Notice (unaudited)
For federal income tax purposes, the following information is furnished with respect to the distributions paid by the Fund during its taxable year ended December 31, 2017. For corporate shareholders, 82.1% of the dividends qualified for the dividends received deduction.
The Fund designated and paid approximately $539,000 as a long-term capital gain distribution.
For federal income tax purposes, the following information is furnished with respect to the Fund's earnings for its taxable year ended December 31, 2017. When distributed, certain earnings may be subject to a maximum tax rate of 15% as provided for the Jobs and Growth Tax Relief Reconciliation Act of 2003. The Fund designated up to a maximum of approximately $91,000 as taxable at this lower rate.
In January, the Fund provides tax information to shareholders for the preceding calendar year.
26
Morgan Stanley Institutional Fund, Inc.
Annual Report — December 31, 2017
Privacy Notice (unaudited)
MORGAN STANLEY INVESTMENT MANAGEMENT INC.
AN IMPORTANT NOTICE CONCERNING OUR U.S. PRIVACY POLICY
We are required by federal law to provide you with a copy of our privacy policy annually. This policy applies to current and former individual investors in funds managed or sponsored by Morgan Stanley Investment Management Inc. ("MSIM") as well as current and former individual clients of MSIM. This policy is not applicable to partnerships, corporations, trusts or other non-individual clients or investors. Please note that we may amend this policy at any time, and will inform you of any changes as required by law.
WE RESPECT YOUR PRIVACY
We appreciate that you have provided us with your personal financial information. We strive to maintain the privacy of such information while we help you achieve your financial objectives. This Notice describes what non-public personal information we collect about you, why we collect it, when we may share it with others and how certain others may use it. It discusses the steps you may take to limit our sharing of certain information about you to affiliated companies in the Morgan Stanley family of companies ("other Morgan Stanley companies"). It also discloses how you may limit use of certain shared information for marketing purposes by other Morgan Stanley branded companies. Throughout this policy, we refer to the non-public information that personally identifies you or your accounts as "personal information.''
1. WHAT PERSONAL INFORMATION DO WE COLLECT ABOUT YOU?
We obtain personal information from applications and other forms you submit to us, from your dealings with us, from consumer reporting agencies, from our Web sites and from third parties and other sources.
For example:
• We may collect information such as your name, address, e-mail address, telephone/fax numbers, assets, income and investment objectives through subscription documents, applications and other forms you submit to us.
• We may obtain information about account balances, your use of account(s) and the types of products and services you prefer to receive from us through your dealings and transactions with us and other sources.
• We may obtain information about your creditworthiness and credit history from consumer reporting agencies.
• We may collect background information from and through third-party vendors to verify representations you have made and to comply with various regulatory requirements.
• If you interact with us through our public and private Web sites, we may collect information that you provide directly through online communications (such as an e-mail address). We may also collect information about your Internet service provider, your domain name, your computer's operating system and Web browser, your use of our Web sites and your product and service preferences, through the use of "cookies." Please consult the Terms of Use of these sites for more details.
2. WHEN DO WE DISCLOSE PERSONAL INFORMATION WE COLLECT ABOUT YOU?
We may disclose personal information we collect about you to other Morgan Stanley companies and to non-affiliated third parties.
a. Information We Disclose to Other Morgan Stanley Companies.
We may disclose personal information to other Morgan Stanley companies for a variety of reasons, including to manage your account(s) effectively, to service and process your transactions, to let you know about products and services offered by us and other Morgan Stanley companies, to manage our business, and as otherwise required or permitted by law. Offers for products and services from other Morgan Stanley companies are developed under conditions designed to safeguard your personal information.
27
Morgan Stanley Institutional Fund, Inc.
Annual Report — December 31, 2017
Privacy Notice (unaudited) (cont'd)
b. Information We Disclose to Non-affiliated Third Parties.
We do not disclose personal information that we collect about you to non-affiliated third parties except to those who provide marketing services on our behalf, to financial institutions with whom we have joint marketing agreements, and as otherwise required or permitted by law. For example, we may disclose personal information to non-affiliated third parties for servicing and processing transactions, to offer our own products and services, to protect against fraud, for institutional risk control, to respond to judicial process or to perform services on our behalf. When we share personal information with a non-affiliated third party, they are required to limit their use of personal information to the particular purpose for which it was shared and they are not allowed to share personal information with others except to fulfill that limited purpose or as may be permitted or required by law.
3. HOW DO WE PROTECT THE SECURITY AND CONFIDENTIALITY OF PERSONAL INFORMATION WE COLLECT ABOUT YOU?
We maintain physical, electronic and procedural security measures to help safeguard the personal information we collect about you. We have internal policies governing the proper handling of client information. Third parties that provide support or marketing services on our behalf may also receive personal information, and we require them to adhere to confidentiality standards with respect to such information.
4. HOW CAN YOU LIMIT THE SHARING OF CERTAIN TYPES OF PERSONAL INFORMATION WITH OTHER MORGAN STANLEY COMPANIES?
We offer you choices as to whether we share with other Morgan Stanley companies the personal information that was collected to determine your eligibility for products and services you request ("eligibility information"). Eligibility information does not include your identification information or personal information pertaining to our transactions or experiences with you. Please note that, even if you direct us not to share eligibility information with other Morgan Stanley companies ("opt-out"), we may still share personal information, including eligibility information, with those companies in circumstances excluded from the opt-out under applicable law, such as to process transactions or to service your account.
5. HOW CAN YOU LIMIT THE USE OF CERTAIN TYPES OF PERSONAL INFORMATION BY OTHER MORGAN STANLEY COMPANIES FOR MARKETING?
By following the opt-out instructions in Section 6 below, you may limit other Morgan Stanley branded companies from marketing their products or services to you based on personal information we disclose to them. This information may include, for example, your income and account history with us. Please note that, even if you choose to limit Other Morgan Stanley Companies from using personal information about you that we may share with them for marketing their products and services to you, Other Morgan Stanley Companies may use your personal information that they obtain from us to market to you in circumstances permitted by law, such as if the Other Morgan Stanley Company has its own relationship with you.
6. HOW CAN YOU SEND US AN OPT-OUT INSTRUCTION?
If you wish to limit our sharing of eligibility information about you with other Morgan Stanley companies or other Morgan Stanley companies' use of personal information for marketing purposes, as described in this notice, you may do so by:
• Calling us at (800) 548-7786
Monday–Friday between 8a.m. and 6p.m.(EST)
• Writing to us at the following address:
DST Asset Manager Solutions, Inc.
c/o Privacy Coordinator
P.O. Box 219804
Kansas City, Missouri 64121
28
Morgan Stanley Institutional Fund, Inc.
Annual Report — December 31, 2017
Privacy Notice (unaudited) (cont'd)
Your written request should include your name, address, telephone number and account number(s) to which the opt-out applies and whether you are opting out with respect to sharing of eligibility information (Section 4 above), or if information used for Marketing (Section 5 above) or both. Written opt-out requests should not be sent with any other correspondence. In order to process your request, we require that the request be provided by you directly and not through a third party.
Your opt-out preference will remain in effect with respect to this policy (as it may be amended) until you notify us otherwise. If you have a joint account, your direction for us not to share this information with other Morgan Stanley companies and for those other Morgan Stanley companies not to use your personal information for marketing will be applied to all account holders on that account. Please understand that if you limit our sharing or our affiliated companies' use of personal information, you and any joint account holder(s) may not receive information about Morgan Stanley products and services, including products or services that could help you manage your financial resources and achieve your investment objectives.
7. WHAT IF AN AFFILIATED COMPANY BECOMES A NON-AFFILIATED THIRD PARTY?
If, at any time in the future, an affiliated company becomes a non-affiliated third party, further disclosures of personal information made to the former affiliated company will be limited to those described in Section 2(b) above relating to non-affiliated third parties. If you elected under Section 6 to limit disclosures we make to affiliated companies, or use of personal information by affiliated companies, your election will not apply to use by any former affiliated company of your personal information in their possession once it becomes a non-affiliated third party.
SPECIAL NOTICE TO RESIDENTS OF VERMONT
The following section supplements our policy with respect to our individual clients who have a Vermont address and supersedes anything to the contrary in the above policy with respect to those clients only.
The state of Vermont requires financial institutions to obtain your consent prior to sharing personal information that they collect about you with affiliated companies and non-affiliated third parties other than in certain limited circumstances. Except as permitted by law, we will not share personal information we collect about you with non-affiliated third parties or other Morgan Stanley companies unless you provide us with your written consent to share such information ("opt-in").
If you wish to receive offers for investment products and services offered by or through other Morgan Stanley companies, please notify us in writing at the following address:
DST Asset Manager Solutions, Inc.
c/o Privacy Coordinator
P.O. Box 219804
Kansas City, Missouri 64121
Your authorization should include your name, address, telephone number and account number(s) to which the opt-in applies and should not be sent with any other correspondence. In order to process your authorization, we require that the authorization be provided by you directly and not through a third party.
SPECIAL NOTICE TO RESIDENTS OF CALIFORNIA
The following section supplements our policy with respect to our individual clients who have a California address and supersedes anything to the contrary in the above policy with respect to those clients only.
In response to a California law, if your account has a California home address, your personal information will not be disclosed to non-affiliated third parties except as permitted by applicable California law, and we will limit sharing such information with our affiliates to comply with California privacy laws that apply to us.
29
Morgan Stanley Institutional Fund, Inc.
Annual Report — December 31, 2017
Director and Officer Information (unaudited)
Independent Directors:
Name, Age and Address of
Independent Director | | Position(s)
Held with
Registrant | | Length of Time
Served* | | Principal Occupation(s) During Past 5 Years
and Other Relevant Professional Experience | | Number of
Portfolios in
Fund Complex
Overseen by
Independent
Director** | | Other Directorships
Held by Independent
Director*** | |
Frank L. Bowman (73)
c/o Perkins Coie LLP
Counsel to the Independent
Directors
30 Rockefeller Plaza
New York, NY 10112 | | Director | | Since
August
2006 | | President, Strategic Decisions, LLC (consulting) (since February 2009); Director or Trustee of various Morgan Stanley Funds (since August 2006); Chairperson of the Compliance and Insurance Committee (since October 2015); formerly, Chairperson of the Insurance Sub-Committee of the Compliance and Insurance Committee (2007-2015); served as President and Chief Executive Officer of the Nuclear Energy Institute (policy organization) (February 2005-November 2008); retired as Admiral, U.S. Navy after serving over 38 years on active duty including 8 years as Director of the Naval Nuclear Propulsion Program in the Department of the Navy and the U.S. Department of Energy (1996-2004); served as Chief of Naval Personnel (July 1994-September 1996) and on the Joint Staff as Director of Political Military Affairs (June 1992-July 1994); knighted as Honorary Knight Commander of the Most Excellent Order of the British Empire; awarded the Officier de l'Orde National du Mérite by the French Government; elected to the National Academy of Engineering (2009). | | | 88 | | | Director of BP p.l.c.; Director of Naval and Nuclear Technologies LLP; Director Emeritus of the Armed Services YMCA; Director of the U.S. Naval Submarine League; Member of the National Security Advisory Council of the Center for U.S. Global Engagement and a member of the CNA Military Advisory Board; Trustee of Fairhaven United Methodist Church; and Director of other various non-profit organizations. | |
Kathleen A. Dennis (64)
c/o Perkins Coie LLP
Counsel to the Independent Directors
30 Rockefeller Plaza
New York, NY 10112 | | Director | | Since
August
2006 | | President, Cedarwood Associates (mutual fund and investment management consulting) (since July 2006); Chairperson of the Liquidity and Alternatives Sub-Committee of the Investment Committee (since October 2006) and Director or Trustee of various Morgan Stanley Funds (since August 2006); formerly, Senior Managing Director of Victory Capital Management (1993-2006). | | | 89 | | | Director of various non-profit organizations. | |
Nancy C. Everett (62)
c/o Perkins Coie LLP
Counsel to the Independent Directors
30 Rockefeller Plaza
New York, NY 10112 | | Director | | Since
January
2015 | | Chief Executive Officer, Virginia Commonwealth University Investment Company (since November 2015); Owner, OBIR, LLC (institutional investment management consulting) (since June 2014); formerly, Managing Director, BlackRock Inc. (February 2011-December 2013); and Chief Executive Officer, General Motors Asset Management (a/k/a Promark Global Advisors, Inc.) (June 2005-May 2010). | | | 90 | | | Formerly, Member of Virginia Commonwealth University School of Business Foundation (2005-2016); Member of Virginia Commonwealth University Board of Visitors (2013-2015); Member of Committee on Directors for Emerging Markets Growth Fund, Inc. (2007-2010); Chairperson of Performance Equity Management, LLC (2006-2010); and Chairperson, GMAM Absolute Return Strategies Fund, LLC (2006-2010). | |
30
Morgan Stanley Institutional Fund, Inc.
Annual Report — December 31, 2017
Director and Officer Information (unaudited) (cont'd)
Independent Directors: (cont'd)
Name, Age and Address of
Independent Director | | Position(s)
Held with
Registrant | | Length of Time
Served* | | Principal Occupation(s) During Past 5 Years
and Other Relevant Professional Experience | | Number of
Portfolios in
Fund Complex
Overseen by
Independent
Director** | | Other Directorships
Held by Independent
Director*** | |
Jakki L. Haussler (60)
c/o Perkins Coie LLP
Counsel to the Independent Directors
30 Rockefeller Plaza
New York, NY 10112 | | Director | | Since
January
2015 | | Chairman and Chief Executive Officer, Opus Capital Group (since January 1996); formerly, Director, Capvest Venture Fund, LP (May 2000-December 2011); Partner, Adena Ventures, LP (July 1999-December 2010); Director, The Victory Funds (February 2005-July 2008). | | | 90 | | | Director of Cincinnati Bell Inc. and Member, Audit Committee and Compensation Committee; Director of Northern Kentucky University Foundation and Member, Investment Committee; Member of Chase College of Law Transactional Law Practice Center Board of Advisors; Director of Best Transport; Director of Chase College of Law Board of Visitors; formerly, Member, University of Cincinnati Foundation Investment Committee; Member, Miami University Board of Visitors (2008-2011); Trustee of Victory Funds (2005-2008) and Chairman, Investment Committee (2007-2008) and Member, Service Provider Committee (2005-2008). | |
Dr. Manuel H. Johnson (68)
c/o Johnson Smick
International, Inc.
220 I Street, NE — Suite 200
Washington, D.C. 20002 | | Director | | Since
July
1991 | | Senior Partner, Johnson Smick International, Inc. (consulting firm); Chairperson of the Investment Committee (since October 2006) and Director or Trustee of various Morgan Stanley Funds (since July 1991); Co-Chairman and a founder of the Group of Seven Council (G7C) (international economic commission); formerly, Chairperson of the Audit Committee (July 1991-September 2006), Vice Chairman of the Board of Governors of the Federal Reserve System and Assistant Secretary of the U.S. Treasury. | | | 88 | | | Director of NVR, Inc. (home construction). | |
Joseph J. Kearns (75)
c/o Kearns & Associates LLC
46 E Peninsula Center #385
Rolling Hills Estates, CA
90274-3712 | | Director | | Since
August
1994 | | Senior Adviser, Kearns & Associates LLC (investment consulting); Chairperson of the Audit Committee (since October 2006) and Director or Trustee of various Morgan Stanley Funds (since August 1994); formerly, Deputy Chairperson of the Audit Committee (July 2003-September 2006) and Chairperson of the Audit Committee of various Morgan Stanley Funds (since August 1994); CFO of the J. Paul Getty Trust. | | | 89 | | | Prior to August 10, 2016, Director of Electro Rent Corporation (equipment leasing); Prior to December 31, 2013, Director of The Ford Family Foundation. | |
31
Morgan Stanley Institutional Fund, Inc.
Annual Report — December 31, 2017
Director and Officer Information (unaudited) (cont'd)
Independent Directors: (cont'd)
Name, Age and Address of
Independent Director | | Position(s)
Held with
Registrant | | Length of Time
Served* | | Principal Occupation(s) During Past 5 Years
and Other Relevant Professional Experience | | Number of
Portfolios in
Fund Complex
Overseen by
Independent
Director** | | Other Directorships
Held by Independent
Director*** | |
Michael F. Klein (59)
c/o Perkins Coie LLP
Counsel to the Independent Directors
30 Rockefeller Plaza
New York, NY 10112 | | Director | | Since
August
2006 | | Managing Director, Aetos Capital, LLC (since March 2000); Co-President, Aetos Alternatives Management, LLC (since January 2004) and Co-Chief Executive Officer of Aetos Capital LLC (since August 2013); Chairperson of the Fixed Income Sub-Committee of the Investment Committee (since October 2006) and Director or Trustee of various Morgan Stanley Funds (since August 2006); formerly, Managing Director, Morgan Stanley & Co. Inc. and Morgan Stanley Dean Witter Investment Management, President, various Morgan Stanley Funds (June 1998-March 2000) and Principal, Morgan Stanley & Co. Inc. and Morgan Stanley Dean Witter Investment Management (August 1997-December 1999). | | | 88 | | | Director of certain investment funds managed or sponsored by Aetos Capital, LLC; Director of Sanitized AG and Sanitized Marketing AG (specialty chemicals). | |
Patricia Maleski (57)
c/o Perkins Coie LLP
Counsel to the Independent Directors
30 Rockefeller Plaza
New York, NY 10112 | | Director | | Since
January
2017 | | Managing Director, JPMorgan Asset Management (2004-2016); Oversight and Control Head of Fiduciary and Conflicts of Interest Program (2015-2016); Chief Control Officer-Global Asset Management (2013-2015); President, JPMorgan Funds (2010-2013); Chief Administrative Officer (2004-2013); various other positions including Treasurer and Board Liaison (since 2001). | | | 90 | | | | None. | | |
Michael E. Nugent (81)
522 Fifth Avenue
New York, NY 10036 | | Chair of the Board and Director | | Chair of the Boards since July 2006 and Director since July 1991 | | Chair of the Boards of various Morgan Stanley Funds (since July 2006); Chairperson of the Closed-End Fund Committee (since June 2012) and Director or Trustee of various Morgan Stanley Funds (since July 1991); formerly, Chairperson of the Insurance Committee (until July 2006); General Partner, Triumph Capital, L.P. (private investment partnership) (1988-2013). | | | 88 | | | | None. | | |
W. Allen Reed (70)
c/o Perkins Coie LLP
Counsel to the Independent Directors
30 Rockefeller Plaza
New York, NY 10112 | | Director | | Since
August
2006 | | Chairperson of the Equity Sub-Committee of the Investment Committee (since October 2006) and Director or Trustee of various Morgan Stanley Funds (since August 2006); formerly, President and CEO of General Motors Asset Management; Chairman and Chief Executive Officer of the GM Trust Bank and Corporate Vice President of General Motors Corporation (August 1994-December 2005). | | | 89 | | | Director of Legg Mason, Inc.; formerly, Director of the Auburn University Foundation (2010-2015). | |
Fergus Reid (85)
c/o Joe Pietryka, Inc.
85 Charles Colman Blvd.
Pawling, NY 12564 | | Director | | Since
June
1992 | | Chairman, Joe Pietryka, Inc.; Chairperson of the Governance Committee and Director or Trustee of various Morgan Stanley Funds (since June 1992). | | | 89 | | | Formerly, Trustee and Director of certain investment companies in the JP Morgan Fund Complex managed by JP Morgan Investment Management Inc. (1987-2012). | |
* This is the earliest date the Director began serving the Morgan Stanley Funds. Each Director serves an indefinite term, until his or her successor is elected.
** The Fund Complex includes (as of December 31, 2017) all open-end and closed-end funds (including all of their portfolios) advised by Morgan Stanley Investment Management Inc. (the "Adviser") and any funds that have an adviser that is an affiliated person of the Adviser (including, but not limited to, Morgan Stanley AIP GP LP).
*** This includes any directorships at public companies and registered investment companies held by the Director at any time during the past five years.
32
Morgan Stanley Institutional Fund, Inc.
Annual Report — December 31, 2017
Director and Officer Information (unaudited) (cont'd)
Executive Officers:
Name, Age and Address of Executive Officer | | Position(s) Held
with
Registrant | | Length of Time
Served* | | Principal Occupation(s) During Past 5 Years | |
John H. Gernon (54)
522 Fifth Avenue
New York, NY 10036 | | President and Principal Executive Officer | | Since
September
2013 | | President and Principal Executive Officer of the Equity and Fixed Income Funds and the Morgan Stanley AIP Funds (since September 2013) and the Liquidity Funds and various money market funds (since May 2014) in the Fund Complex; Managing Director of the Adviser; Head of Product (since 2006). | |
Timothy J. Knierim (58)
522 Fifth Avenue
New York, NY 10036 | | Chief Compliance Officer | | Since
December
2016 | | Managing Director of the Adviser and various entities affiliated with the Adviser; Chief Compliance Officer of various Morgan Stanley Funds and the Adviser (since December 2016) and Chief Compliance Officer of Morgan Stanley AIP GP LP (since 2014). Formerly, Managing Director and Deputy Chief Compliance Officer of the Adviser (2014-2016); and formerly, Chief Compliance Officer of Prudential Investment Management, Inc. (2007-2014). | |
Francis J. Smith (52)
522 Fifth Avenue
New York, NY 10036 | | Treasurer and Principal Financial Officer | | Treasurer since July 2003 and Principal Financial Officer since September 2002 | | Manging Director of the Adviser and various entities affiliated with the Adviser; Treasurer (since July 2003) and Principal Financial Officer of various Morgan Stanley Funds (since September 2002). | |
Mary E. Mullin (50)
522 Fifth Avenue
New York, NY 10036 | | Secretary | | Since
June
1999 | | Managing Director of the Adviser; Secretary of various Morgan Stanley Funds (since June 1999). | |
Michael J. Key (38)
522 Fifth Avenue
New York, NY 10036 | | Vice President | | Since
June
2017 | | Vice President of the Equity and Fixed Income Funds, Liquidity Funds, various money market funds and the Morgan Stanley AIP Funds in the Fund Complex (since June 2017); Executive Director of the Adviser; Head of Product Development for Equity and Fixed Income Funds (since August 2013). | |
* This is the earliest date the officer began serving the Morgan Stanley Funds. Each officer serves a one-year term, until his or her successor is elected and qualifies.
33
Morgan Stanley Institutional Fund, Inc.
Annual Report — December 31, 2017
Adviser and Administrator
Morgan Stanley Investment Management Inc.
522 Fifth Avenue
New York, New York 10036
Sub-Adviser
Morgan Stanley Investment Management Limited
25 Cabot Square, Canary Wharf
London, E14 4QA, England
Distributor
Morgan Stanley Distribution, Inc.
522 Fifth Avenue
New York, New York 10036
Dividend Disbursing and Transfer Agent
DST Asset Manager Solutions, Inc.
2000 Crown Colony Drive
Quincy, Massachusetts 02169
Custodian
State Street Bank and Trust Company
One Lincoln Street
Boston, Massachusetts 02111
Legal Counsel
Dechert LLP
1095 Avenue of the Americas
New York, New York 10036
Counsel to the Independent Directors
Perkins Coie LLP
30 Rockefeller Plaza
New York, New York 10112
Independent Registered Public Accounting Firm
Ernst & Young LLP
200 Clarendon Street
Boston, Massachusetts 02116
Reporting to Shareholders
Each Morgan Stanley Fund provides a complete schedule of portfolio holdings in its semi-annual and annual reports within 60 days of the end of the fund's second and fourth fiscal quarters. The semi-annual and annual reports are filed electronically with the Securities and Exchange Commission (SEC) on Form N-CSRS and Form N-CSR, respectively. Morgan Stanley also delivers the semi-annual and annual reports to fund shareholders and makes these reports available on its public website, www.morganstanley.com/im. Each Morgan Stanley fund also files a complete schedule of portfolio holdings with the SEC for the fund's first and third fiscal quarters on Form N-Q. Morgan Stanley does not deliver the reports for the first and third fiscal quarters to shareholders, nor are the reports posted to the Morgan Stanley public website. You may, however, obtain the Form N-Q filings (as well as the Form N-CSR and N-CSRS filings) by accessing the SEC's website, www.sec.gov. You may also review and copy them at the SEC's Public Reference Room in Washington, DC. Information on the operation of the SEC's Public Reference Room may be obtained by calling the SEC toll free at 1 (800) SEC-0330. You can also request copies of these materials, upon payment of a duplicating fee, by electronic request at the SEC's email address (publicinfo@sec.gov) or by writing to the SEC's Public Reference Section, Washington, D.C. 20549-1520.
Proxy Voting Policies and Procedures and Proxy Voting Record
You may obtain a copy of the Company's Proxy Voting Policy and Procedures and information regarding how the Company voted proxies relating to portfolio securities during the most recent twelve-month period ended June 30, without charge, upon request, by calling toll free 1 (800) 548-7786 or by visiting our website at www.morganstanley.com/im. This information is also available on the SEC's website at www.sec.gov.
This report is authorized for distribution only when preceded or accompanied by a prospectus or summary prospectus of the applicable Fund of Morgan Stanley Institutional Fund, Inc., which describes in detail the Fund's investment policies, risks, fees and expenses. Please read the prospectus carefully before you invest or send money. For additional information, including information regarding the investments comprising the Fund, please visit our website at www.morganstanley.com/im or call toll free 1 (800) 548-7786.
34
Printed in U.S.A.
This Report has been prepared for shareholders and may be distributed to others only if preceded or accompanied by a current prospectus.
Morgan Stanley Investment Management Inc.
522 Fifth Avenue
New York, New York 10036
© 2018 Morgan Stanley. Morgan Stanley Distribution, Inc.

IFIGQANN
2007534 EXP. 02.28.19

Morgan Stanley Institutional Fund, Inc.
Global Real Estate Portfolio
Annual Report
December 31, 2017

Morgan Stanley Institutional Fund, Inc.
Annual Report — December 31, 2017
Shareholders' Letter | | | 2 | | |
Expense Example | | | 3 | | |
Investment Overview | | | 4 | | |
Portfolio of Investments | | | 8 | | |
Statement of Assets and Liabilities | | | 11 | | |
Statement of Operations | | | 13 | | |
Statements of Changes in Net Assets | | | 14 | | |
Financial Highlights | | | 16 | | |
Notes to Financial Statements | | | 21 | | |
Report of Independent Registered Public Accounting Firm | | | 28 | | |
Federal Tax Notice | | | 29 | | |
Privacy Notice | | | 30 | | |
Director and Officer Information | | | 33 | | |
This report is authorized for distribution only when preceded or accompanied by a prospectus or summary prospectus of the applicable Fund of Morgan Stanley Institutional Fund, Inc. To receive a prospectus and/or statement of additional information (SAI), which contains more complete information such as investment objectives, charges, expenses, policies for voting proxies, risk considerations, and describes in detail each of the Fund's investment policies to the prospective investor, please call toll free 1 (800) 548-7786. Please read the prospectuses carefully before you invest or send money.
Additionally, you can access information about the Fund including performance, characteristics, and investment team commentary, through Morgan Stanley Investment Management's website: www.morganstanley.com/im.
Market forecasts provided in this report may not necessarily come to pass. There is no guarantee that any sectors mentioned will continue to perform as discussed herein or that securities in such sectors will be held by the Fund in the future. There is no assurance that a fund will achieve its investment objective. Funds are subject to market risk, which is the possibility that market values of securities owned by the Fund will decline and, therefore, the value of the Fund's shares may be less than what you paid for them. Accordingly, you can lose money investing in this Fund. Please see the prospectus for more complete information on investment risks.
1
Morgan Stanley Institutional Fund, Inc.
Annual Report — December 31, 2017
Shareholders' Letter (unaudited)
Dear Shareholders,
We are pleased to provide this Annual report, in which you will learn how your investment in Global Real Estate Portfolio (the "Fund") performed during the latest twelve-month period.
Morgan Stanley Investment Management is a client-centric, investor-led organization. Our global presence, intellectual capital, and breadth of products and services enable us to partner with investors to meet the evolving challenges of today's financial markets. We aim to deliver superior investment service and to empower our clients to make the informed decisions that help them reach their investment goals.
As always, we thank you for selecting Morgan Stanley Investment Management, and look forward to working with you in the months and years ahead.
Sincerely,

John H. Gernon
President and Principal Executive Officer
January 2018
2
Morgan Stanley Institutional Fund, Inc.
Annual Report — December 31, 2017
Expense Example (unaudited)
Global Real Estate Portfolio
As a shareholder of the Fund, you incur two types of costs: (1) transactional costs; and (2) ongoing costs, which may include advisory fees, administration fees, distribution and shareholder services fees and other Fund expenses. This example is intended to help you understand your ongoing costs (in dollars) of investing in the Fund and to compare these costs with the ongoing costs of investing in other mutual funds.
This example is based on an investment of $1,000 invested at the beginning of the six-month period ended December 31, 2017 and held for the entire six-month period.
Actual Expenses
The table below provides information about actual account values and actual expenses. You may use the information in this table, together with the amount you invested, to estimate the expenses that you paid over the period. Simply divide your account value by $1,000 (for example, an $8,600 account value divided by $1,000 = 8.6), then multiply the result by the number in the table under the heading entitled "Actual Expenses Paid During Period" to estimate the expenses you paid on your account during this period.
Hypothetical Example for Comparison Purposes
The table below provides information about hypothetical account values and hypothetical expenses based on the Fund's actual expense ratio and an assumed rate of return of 5% per year before expenses, which is not the Fund's actual return. The hypothetical account values and expenses may not be used to estimate the actual ending account balance or expenses you paid for the period. You may use this information to compare the ongoing costs of investing in the Fund and other funds. To do so, compare this 5% hypothetical example with the 5% hypothetical examples that appear in the shareholder reports of the other funds.
Please note that the expenses shown in the table are meant to highlight your ongoing costs only and do not reflect any transactional costs, such as sales charges (loads). Therefore, the information for each class in the table is useful in comparing ongoing costs only, and will not help you determine the relative total costs of owning different funds. In addition, if these transactional costs were included, your costs would have been higher.
| | | Beginning
Account
Value
7/1/17 | | Actual Ending
Account
Value
12/31/17 | | Hypothetical
Ending Account
Value | | Actual
Expenses
Paid
During
Period* | | Hypothetical
Expenses Paid
During Period* | | Net
Expense
Ratio
During
Period** | |
Global Real Estate Portfolio Class I | | $ | 1,000.00 | | | $ | 1,059.90 | | | $ | 1,019.91 | | | $ | 5.45 | | | $ | 5.35 | | | | 1.05 | % | |
Global Real Estate Portfolio Class A | | | 1,000.00 | | | | 1,059.80 | | | | 1,018.95 | | | | 6.44 | | | | 6.31 | | | | 1.24 | | |
Global Real Estate Portfolio Class L | | | 1,000.00 | | | | 1,056.20 | | | | 1,015.63 | | | | 9.85 | | | | 9.65 | | | | 1.90 | | |
Global Real Estate Portfolio Class C | | | 1,000.00 | | | | 1,054.20 | | | | 1,014.37 | | | | 11.13 | | | | 10.92 | | | | 2.15 | | |
Global Real Estate Portfolio Class IS | | | 1,000.00 | | | | 1,060.60 | | | | 1,020.32 | | | | 5.04 | | | | 4.94 | | | | 0.97 | | |
* Expenses are calculated using each Fund Class' annualized net expense ratio (as disclosed), multiplied by the average account value over the period, and multiplied by 184/365 (to reflect the most recent one-half year period).
** Annualized.
3
Morgan Stanley Institutional Fund, Inc.
Annual Report — December 31, 2017
Investment Overview (unaudited)
Global Real Estate Portfolio
The Fund seeks to provide current income and capital appreciation.
Performance
For the year ended December 31, 2017, the Fund's Class I shares had a total return based on net asset value and reinvestment of distributions per share of 9.73%, net of fees. The Fund's Class I shares underperformed against the Fund's benchmark, the FTSE EPRA/NAREIT Developed Real Estate Index — Net Total Return to U.S. Investors (the "Index"), which returned 11.08%, and underperformed the MSCI World Net Index, which returned 22.40%.
Factors Affecting Performance
• The global real estate securities market gained 11.1% during the 12-month period ending December 31, 2017, as measured by the Index. Europe and Asia outperformed the global average, and North America underperformed the global average.
• Overall, property stocks have been largely influenced by transactional evidence in the private markets of strong investor demand for core assets at valuations that demonstrate the acceptance of low expected returns. In addition, low government bond yields have bolstered share prices of listed property companies.
• Property stocks in Europe, measured by the FTSE EPRA/NAREIT Developed EMEA Index, experienced the strongest gains over the period with a U.S. dollar ("USD") return of 29.1%.(i) The eurozone economy maintained its strong momentum at the end of the year, with rising workloads encouraging companies to take on new staff at the sharpest pace in more than a decade. However, political uncertainty remains high, created by the ongoing Brexit negotiations, lengthy coalition talks in Germany, an inconclusive election outcome in Catalonia and upcoming general elections in Italy. Property stocks in Asia, measured by the FTSE EPRA/NAREIT Developed Asia Index, gained 16.1%(i) in USD terms, as Hong Kong real estate operating companies ("REOCs") traded at the largest discount to net asset values ("NAVs") with NAVs still growing on healthy operating fundamentals and continued strength in asset values in the private markets. Property stocks
in the U.S., measured by the FTSE EPRA/NAREIT U.S. Index, gained a USD return of 3.9%(i) and lagged Europe and Asia, largely dragged down by significant investor concerns over the retail sector. There were significant disparities in returns with strong share price gains in the manufactured home, data center and industrial sectors, and significant weakness in the student housing, mall and shopping center sectors.
• Performance within the North American and Asian regional portfolios modestly contributed to relative performance, while the European regional portfolio detracted. Top-down global allocation detracted due to the underweight to Europe. Cash held in the Fund modestly detracted. In Asia, the Fund benefited from the overweight to Hong Kong and underweight to Japan; this was more than offset by the underweight to Singapore and stock selection in Hong Kong and Japan, which detracted. In Europe, the Fund benefited from stock selection in Germany; this was more than offset by the negative effect of the underweight to Germany and stock selection in Sweden and the U.K. In the U.S., the Fund benefited from stock selection within and the underweight to the shopping center and health care sectors, stock selection in the mall sector, and stock selection within and the overweight to the apartment sector; this was partially offset by relative losses from the overweight to the mall sector, stock selection within and the underweight to the net lease sector, and the underweight to the industrial sector.
• The Fund's exposure to the U.S. Class A mall sector continues to be out of favor due to concerns over the secular decline of malls, driven by the recent increase in announcements of department store closures and other retailer bankruptcies, increased market share from e-commerce and media headlines regarding select instances of mall debt defaults and prospects for more. While we acknowledge these issues as legitimate concerns in the retail sector, the market is not distinguishing between the impact of retail industry issues on the Class A malls (which continue to experience favorable strength in operating fundamentals and are expected to remain resilient amid a challenging retail environment) versus the impact on lower/medium-quality malls, which are facing challenges in backfilling vacant
4
Morgan Stanley Institutional Fund, Inc.
Annual Report — December 31, 2017
Investment Overview (unaudited) (cont'd)
Global Real Estate Portfolio
spaces and cash flow declines, thereby resulting in a significant valuation disparity between the public market valuation of high-quality malls versus the private market valuation of high-quality malls. As a result, the Fund has significant overweight exposure to the owners of U.S. Class A malls given the opportunity to own these assets at very attractive discounted valuations through companies with solid balance sheets. This has been a key detractor from Fund performance for the full-year period, but we would note it was the largest contributor to relative performance in the fourth quarter of 2017.
Management Strategies
• The global portfolio is comprised of three regional portfolios with a global allocation which weights each of the three major regions (North America, Europe and Asia) relative to the Index based on our view of the relative attractiveness of each region in terms of underlying real estate fundamentals and public market valuations. Moreover, each of the regional portfolios reflects our core investment philosophy as a real estate value investor, which results in the ownership of stocks that we believe provide the best valuation relative to their underlying real estate values, while maintaining portfolio diversification. Our company-specific research leads us to specific preferences for sub-segments within each of the property sectors and countries. For the period ended December 31, 2017, the Fund was overweight the Asian listed property sector, modestly overweight the North American listed property sector, and underweight the European listed property sector. However, we would note that we have muted regional bets due to a lack of large valuation disparities among the regions and due to macro uncertainties, which may impact regional share prices far more than underlying fundamentals and valuations.
• The Hong Kong REOCs continue to represent a significant overweight in the global portfolio, as the stocks offer highly attractive value given the wide discrepancy between public and private valuations, and relative to other public listed property markets. The stocks ended the period trading at an average 34% discount to net asset values NAVs,(i) which represented the widest discounts on a global basis despite healthy operating fundamentals, solid
recurring cash flow growth and continued strength in asset values in the private markets, as well as improving corporate governance and capital management. The discounted valuations are further accentuated as the Hong Kong REOCs maintain very modest leverage levels. In Japan, there is a significant disparity in valuations with the Japan REOCs trading at 19% discount and the Japan real estate investment trusts ("REITs") trading at a 7% premium.(ii) The investment market remains active but there is some caution due to all-time low capitalization (cap) rates and continued policy uncertainty. In Australia, office market fundamentals are witnessing improved rental growth in key markets. In the retail sector, operating fundamentals remain lackluster. The Australian REIT sector ended the period trading at an average 6% premium to NAVs(ii) and remains far less attractive relative to the Hong Kong REOCs within Asia.
• In Europe, property stocks in the U.K. ended the period trading at an average 4% discount to NAVs, with the large-cap U.K. Majors and London office specialists trading at attractive discounted valuations of 15% and 8%,(ii) respectively, which are well in excess of expected asset value declines. In the U.K., the Brexit vote has created expectations for declines in NAVs but transaction and leasing activity to date have indicated these declines have been more modest than initially expected. Property stocks on the Continent ended the period trading at an average 2% premium to NAVs, although there is disparity in valuations within the Continent, with the Continental retail stocks trading at an average 5% discount, and German residential stocks trading at an average 8% premium.(ii) On the Continent, select prospects for better operating fundamentals may support valuations after significant cap rate compression. Within Europe, we are overweight the U.K. Majors and London office specialists, Continental retail, Ireland and French office, and underweight Germany and other segments in the U.K., Sweden and Belgium.
• In the U.S., with asset values for high-quality assets having fully recovered and now, on average, approximately 20% in excess of peak levels achieved in 2007, the overall REIT market ended the period trading at an approximate 2% premium to NAVs,(ii)
(i) Source: FTSE
(ii) Source: Morgan Stanley Investment Management, as of December 31, 2017
5
Morgan Stanley Institutional Fund, Inc.
Annual Report — December 31, 2017
Investment Overview (unaudited) (cont'd)
Global Real Estate Portfolio
although there is wider-than-typical disparity in relative valuations among the sectors. The current valuation disparity may generally be described in three categories: Premiums, Near Par and at Significant Discounts to NAVs. Premiums are sectors with perceived defensive characteristics which have been the greatest beneficiaries of the lower-for-longer interest rate environment that has been pervasive in recent years (net lease, health care) and/or benefiting from secular demand growth of digital technology and e-commerce (industrial, data center); Near Par are sectors experiencing decelerating same-store net operating income growth due to conventional supply-demand factors (storage, hotels, apartment, office ex-NYC); and Significant Discounts are sectors experiencing extreme negative investor sentiment (NYC office and retail). We think that the most attractive value can be found in the companies that own NYC office and Class A mall assets as they are trading at the most significant discounts to NAVs despite significant transactional evidence for NYC office assets that continue to demonstrate strength in asset values and continued resilience in cash flow growth for the Class A malls, despite the headwind of elevated store closures. Within the U.S., our company-specific research leads us to an overweighting in the portfolio to a group of companies that are focused in the ownership of NYC office assets, Class A malls, and a number of out-of-favor companies, and an underweighting to companies concentrated in the ownership of net lease, health care and shopping center assets. The portfolio is underweight Canada given less attractive valuations relative to the various significantly discounted property sectors in the U.S.
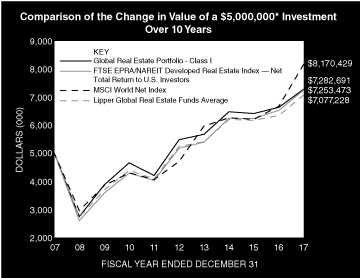
* Minimum Investment for Class I shares
In accordance with SEC regulations, the Fund's performance shown assumes that all recurring fees (including management fees) were deducted and all dividends and distributions were reinvested. The performance of Class A, L, C and IS shares will vary from Class I shares based upon their different inception dates and will be negatively impacted by additional fees assessed to those classes (if applicable).
6
Morgan Stanley Institutional Fund, Inc.
Annual Report — December 31, 2017
Investment Overview (unaudited) (cont'd)
Global Real Estate Portfolio
Performance Compared to the FTSE EPRA/NAREIT Developed Real Estate Index —Net Total Return to U.S. Investors(1), the MSCI World Net Index(2)and the Lipper Global Real Estate Funds Average(3)
| | | Period Ended December 31, 2017
Total Returns(4) | |
| | | | | Average Annual | |
| | | One
Year | | Five
Years | | Ten
Years | | Since
Inception(9) | |
Fund — Class I Shares
w/o sales charges(5) | | | 9.73 | % | | | 5.84 | % | | | 3.83 | % | | | 4.07 | % | |
Fund — Class A Shares
w/o sales charges(5) | | | 9.44 | | | | 5.54 | | | | 3.55 | | | | 3.79 | | |
Fund — Class A Shares with
maximum 5.25% sales charges(5) | | | 3.73 | | | | 4.41 | | | | 2.99 | | | | 3.30 | | |
Fund — Class L Shares
w/o sales charges(6) | | | 8.89 | | | | 5.04 | | | | — | | | | 3.77 | | |
Fund — Class C Shares
w/o sales charges(8) | | | 8.54 | | | | — | | | | — | | | | 2.14 | | |
Fund — Class C Shares with
maximum 1.00% deferred
sales charges(8) | | | 7.54 | | | | — | | | | — | | | | 2.14 | | |
Fund — Class IS Shares
w/o sales charges(7) | | | 9.80 | | | | — | | | | — | | | | 6.31 | | |
FTSE EPRA/NAREIT Developed Real
Estate Index — Net Total Return
to U.S. Investors | | | 11.08 | | | | 6.96 | | | | 3.79 | | | | 4.09 | | |
MSCI World Net Index | | | 22.40 | | | | 11.64 | | | | 5.03 | | | | 6.09 | | |
Lipper Global Real Estate
Funds Average | | | 11.51 | | | | 6.36 | | | | 3.71 | | | | 3.30 | | |
Performance data quoted represents past performance, which is no guarantee of future results, and current performance may be lower or higher than the figures shown. Performance assumes that all dividends and distributions, if any, were reinvested. For the most recent month-end performance figures, please visit www.morganstanley.com/im. Investment return and principal value will fluctuate so that Fund shares, when redeemed, may be worth more or less than their original cost. Total returns do not reflect the deduction of taxes that a shareholder would pay on Fund distributions or the redemption of Fund shares. Performance of share classes will vary due to difference in sales charges and expenses.
(1) The FTSE EPRA/NAREIT Developed Real Estate Index — Net Total Return to U.S. Investors is a market capitalization weighted index designed to reflect the stock performance of companies engaged in the North American, European and Asian real estate markets. The performance of the Index is listed in U.S. dollars and assumes reinvestment of net dividends. "Net Total Return to U.S. investors" reflects a reduction in total returns after taking into account the withholding tax on dividends by certain foreign countries represented in the Index for periods after 1/31/05 (gross returns used prior to 1/31/05). The Index is unmanaged and its returns do not include any sales charges or fees. Such costs would lower performance. It is not possible to invest directly in an index.
(2) The MSCI World Net Index is a free float-adjusted market capitalization weighted index that is designed to measure the global equity market performance of developed markets. The term "free float" represents the portion of shares outstanding that are deemed to be available for purchase in the public equity markets by investors. The MSCI World Net Index currently consists of 23 developed market country indices. The performance of the Index is listed in U.S. dollars and assumes reinvestment of net dividends. The Index is unmanaged and its returns do not include any sales charges or fees. Such costs would lower performance. It is not possible to invest directly in an index.
(3) The Lipper Global Real Estate Funds Average tracks the performance of all funds in the Lipper Global Real Estate Funds classification. The Average, which is adjusted for capital gains distributions and income dividends, is unmanaged and should not be considered an investment. As of the date of this report, the Fund was in the Lipper Global Real Estate Funds classification.
(4) Total returns for the Fund reflect fees waived and expenses reimbursed, if applicable, by the Adviser. Without such waivers and reimbursements, total returns would have been lower.
(5) Commenced operations on August 30, 2006.
(6) Commenced offering on June 16, 2008.
(7) Commenced offering September 13, 2013.
(8) Commenced offering on April 30, 2015.
(9) For comparative purposes, average annual since inception returns listed for the Indexes refer to the inception date of Class I of the Fund, not the inception of the Index.
7
Morgan Stanley Institutional Fund, Inc.
Annual Report — December 31, 2017
Portfolio of Investments
Global Real Estate Portfolio
| | | Shares | | Value
(000) | |
Common Stocks (94.7%) | |
Australia (4.9%) | |
Dexus REIT | | | 936,585 | | | $ | 7,113 | | |
Goodman Group REIT | | | 1,569,524 | | | | 10,289 | | |
GPT Group (The) REIT | | | 2,208,703 | | | | 8,793 | | |
Mirvac Group REIT | | | 2,881,095 | | | | 5,267 | | |
Scentre Group REIT | | | 5,374,513 | | | | 17,539 | | |
Stockland REIT | | | 1,684,784 | | | | 5,893 | | |
Vicinity Centres REIT | | | 3,259,497 | | | | 6,925 | | |
Westfield Corp. REIT | | | 2,350,102 | | | | 17,415 | | |
| | | | 79,234 | | |
Austria (0.4%) | |
Atrium European Real Estate Ltd. (a) | | | 347,394 | | | | 1,730 | | |
BUWOG AG (a) | | | 143,356 | | | | 4,935 | | |
| | | | 6,665 | | |
Canada (1.5%) | |
Boardwalk REIT | | | 34,991 | | | | 1,199 | | |
Crombie Real Estate Investment Trust REIT | | | 211,914 | | | | 2,326 | | |
Extendicare, Inc. | | | 115,407 | | | | 840 | | |
First Capital Realty, Inc. | | | 434,482 | | | | 7,162 | | |
H&R Real Estate Investment Trust REIT | | | 164,702 | | | | 2,799 | | |
RioCan Real Estate Investment Trust REIT | | | 443,605 | | | | 8,597 | | |
SmartCentres Real Estate Investment Trust REIT | | | 59,694 | | | | 1,468 | | |
| | | | 24,391 | | |
China (0.7%) | |
China Overseas Land & Investment Ltd. (b) | | | 1,464,000 | | | | 4,712 | | |
China Resources Land Ltd. (b) | | | 688,000 | | | | 2,021 | | |
China Vanke Co., Ltd. H Shares (b) | | | 584,400 | | | | 2,327 | | |
Guangzhou R&F Properties Co., Ltd.
H Shares (b) | | | 1,088,000 | | | | 2,453 | | |
| | | | 11,513 | | |
Finland (0.2%) | |
Citycon Oyj | | | 1,435,806 | | | | 3,717 | | |
France (4.0%) | |
Carmila SA REIT | | | 58,363 | | | | 1,626 | | |
Fonciere Des Regions REIT | | | 35,876 | | | | 4,065 | | |
Gecina SA REIT | | | 66,036 | | | | 12,184 | | |
ICADE REIT | | | 45,304 | | | | 4,453 | | |
Klepierre SA REIT | | | 292,399 | | | | 12,858 | | |
Mercialys SA REIT | | | 238,861 | | | | 5,285 | | |
Unibail-Rodamco SE REIT | | | 95,160 | | | | 23,973 | | |
| | | | 64,444 | | |
Germany (2.0%) | |
ADO Properties SA (c) | | | 31,159 | | | | 1,581 | | |
Deutsche Wohnen SE | | | 231,460 | | | | 10,092 | | |
LEG Immobilien AG | | | 26,055 | | | | 2,974 | | |
Vonovia SE | | | 345,399 | | | | 17,097 | | |
| | | | 31,744 | | |
| | | Shares | | Value
(000) | |
Hong Kong (11.4%) | |
Champion REIT | | | 4,607,000 | | | $ | 3,378 | | |
CK Asset Holdings Ltd. | | | 2,468,500 | | | | 21,577 | | |
Henderson Land Development Co., Ltd. | | | 828,762 | | | | 5,462 | | |
Hongkong Land Holdings Ltd. | | | 3,542,700 | | | | 24,912 | | |
Hysan Development Co., Ltd. | | | 2,634,014 | | | | 13,981 | | |
Link REIT | | | 2,658,775 | | | | 24,638 | | |
New World Development Co., Ltd. | | | 7,280,758 | | | | 10,939 | | |
Sino Land Co., Ltd. | | | 863,894 | | | | 1,529 | | |
Sun Hung Kai Properties Ltd. | | | 2,363,367 | | | | 39,368 | | |
Swire Properties Ltd. | | | 5,758,800 | | | | 18,574 | | |
Wharf Holdings Ltd. (The) | | | 1,937,763 | | | | 6,701 | | |
Wharf Real Estate Investment Co., Ltd. (a) | | | 2,048,075 | | | | 13,631 | | |
| | | | 184,690 | | |
Ireland (0.7%) | |
Green REIT PLC | | | 3,225,104 | | | | 6,017 | | |
Hibernia REIT PLC | | | 2,715,396 | | | | 4,984 | | |
| | | | 11,001 | | |
Japan (8.6%) | |
Activia Properties, Inc. REIT | | | 1,077 | | | | 4,507 | | |
Advance Residence Investment Corp. REIT | | | 1,690 | | | | 4,155 | | |
Daiwa Office Investment Corp. REIT | | | 183 | | | | 965 | | |
GLP J-REIT | | | 5,388 | | | | 5,822 | | |
Hulic Co., Ltd. | | | 494,500 | | | | 5,535 | | |
Hulic REIT, Inc. | | | 897 | | | | 1,306 | | |
Invincible Investment Corp. REIT | | | 8,890 | | | | 3,779 | | |
Japan Hotel REIT Investment Corp. | | | 3,058 | | | | 2,052 | | |
Japan Prime Realty Investment Corp. REIT | | | 229 | | | | 728 | | |
Japan Real Estate Investment Corp. REIT | | | 1,535 | | | | 7,288 | | |
Japan Retail Fund Investment Corp. REIT | | | 3,577 | | | | 6,557 | | |
Kenedix Office Investment Corp. REIT | | | 241 | | | | 1,368 | | |
Mitsubishi Estate Co., Ltd. | | | 1,621,900 | | | | 28,181 | | |
Mitsui Fudosan Co., Ltd. | | | 1,304,600 | | | | 29,246 | | |
Nippon Building Fund, Inc. REIT | | | 2,044 | | | | 10,000 | | |
Nippon Prologis, Inc. REIT | | | 1,607 | | | | 3,397 | | |
Nomura Real Estate Master Fund, Inc. REIT | | | 5,912 | | | | 7,340 | | |
Orix, Inc. J-REIT | | | 1,959 | | | | 2,714 | | |
Sumitomo Realty & Development Co., Ltd. | | | 289,000 | | | | 9,486 | | |
United Urban Investment Corp. REIT | | | 3,961 | | | | 5,696 | | |
| | | | 140,122 | | |
Malta (0.0%) | |
BGP Holdings PLC (a)(d)(e) | | | 12,867,024 | | | | 15 | | |
Netherlands (0.5%) | |
Eurocommercial Properties N.V. CVA REIT | | | 170,603 | | | | 7,432 | | |
Wereldhave N.V. REIT | | | 6,298 | | | | 302 | | |
| | | | 7,734 | | |
The accompanying notes are an integral part of the financial statements.
8
Morgan Stanley Institutional Fund, Inc.
Annual Report — December 31, 2017
Portfolio of Investments (cont'd)
Global Real Estate Portfolio
| | | Shares | | Value
(000) | |
Norway (0.3%) | |
Entra ASA (c) | | | 280,108 | | | $ | 4,161 | | |
Norwegian Property ASA | | | 700,861 | | | | 905 | | |
| | | | 5,066 | | |
Singapore (1.1%) | |
APAC Realty Ltd. (a) | | | 974,900 | | | | 637 | | |
Ascendas Real Estate Investment Trust REIT | | | 1,389,900 | | | | 2,826 | | |
CapitaLand Commercial Trust REIT | | | 2,337,195 | | | | 3,371 | | |
CapitaLand Ltd. | | | 588,700 | | | | 1,551 | | |
CapitaLand Mall Trust REIT | | | 1,821,400 | | | | 2,899 | | |
EC World Real Estate Investment Trust Unit REIT | | | 459,200 | | | | 261 | | |
Keppel REIT | | | 2,576,930 | | | | 2,432 | | |
Mapletree Industrial Trust REIT | | | 261,600 | | | | 397 | | |
Suntec Real Estate Investment Trust REIT | | | 943,900 | | | | 1,515 | | |
UOL Group Ltd. | | | 303,976 | | | | 2,016 | | |
| | | | 17,905 | | |
Spain (0.9%) | |
Hispania Activos Inmobiliarios SOCIMI SA REIT | | | 240,794 | | | | 4,530 | | |
Inmobiliaria Colonial Socimi SA REIT | | | 183,546 | | | | 1,820 | | |
Merlin Properties Socimi SA REIT | | | 622,429 | | | | 8,427 | | |
| | | | 14,777 | | |
Sweden (0.7%) | |
Atrium Ljungberg AB, Class B | | | 149,068 | | | | 2,367 | | |
Castellum AB | | | 223,693 | | | | 3,772 | | |
Hufvudstaden AB, Class A | | | 292,272 | | | | 4,676 | | |
| | | | 10,815 | | |
Switzerland (0.6%) | |
PSP Swiss Property AG (Registered) | | | 96,934 | | | | 9,186 | | |
Swiss Prime Site AG (Registered) (a) | | | 9,301 | | | | 858 | | |
| | | | 10,044 | | |
United Kingdom (5.9%) | |
British Land Co., PLC (The) REIT | | | 2,212,266 | | | | 20,640 | | |
Capital & Counties Properties PLC | | | 90,779 | | | | 392 | | |
Capital & Regional PLC REIT | | | 1,705,288 | | | | 1,346 | | |
Derwent London PLC REIT | | | 302,935 | | | | 12,749 | | |
Grainger PLC | | | 171,809 | | | | 669 | | |
Great Portland Estates PLC REIT | | | 1,404,124 | | | | 13,044 | | |
Hammerson PLC REIT | | | 1,160,456 | | | | 8,566 | | |
Intu Properties PLC REIT | | | 1,133,335 | | | | 3,869 | | |
Land Securities Group PLC REIT | | | 1,779,717 | | | | 24,137 | | |
LXB Retail Properties PLC (a) | | | 3,172,353 | | | | 980 | | |
Segro PLC REIT | | | 140,928 | | | | 1,116 | | |
St. Modwen Properties PLC | | | 655,724 | | | | 3,587 | | |
Urban & Civic PLC | | | 1,032,701 | | | | 4,001 | | |
Workspace Group PLC REIT | | | 19,303 | | | | 261 | | |
| | | | 95,357 | | |
United States (50.3%) | |
Alexandria Real Estate Equities, Inc. REIT | | | 51,335 | | | | 6,704 | | |
American Campus Communities, Inc. REIT | | | 19,570 | | | | 803 | | |
American Homes 4 Rent, Class A REIT | | | 413,938 | | | | 9,040 | | |
AvalonBay Communities, Inc. REIT | | | 138,904 | | | | 24,782 | | |
| | | Shares | | Value
(000) | |
Blackstone Mortgage Trust, Inc., Class A REIT | | | 135,490 | | | $ | 4,360 | | |
Boston Properties, Inc. REIT | | | 427,848 | | | | 55,633 | | |
Brandywine Realty Trust REIT | | | 157,148 | | | | 2,859 | | |
Brixmor Property Group, Inc. REIT | | | 311,644 | | | | 5,815 | | |
Camden Property Trust REIT | | | 192,489 | | | | 17,721 | | |
CBL & Associates Properties, Inc. REIT | | | 37,892 | | | | 214 | | |
Chesapeake Lodging Trust REIT | | | 129,447 | | | | 3,507 | | |
Cousins Properties, Inc. REIT | | | 471,378 | | | | 4,360 | | |
CubeSmart REIT | | | 444,276 | | | | 12,848 | | |
DCT Industrial Trust, Inc. REIT | | | 230,088 | | | | 13,525 | | |
DDR Corp. REIT | | | 141,010 | | | | 1,263 | | |
Digital Realty Trust, Inc. REIT | | | 98,490 | | | | 11,218 | | |
Douglas Emmett, Inc. REIT | | | 47,536 | | | | 1,952 | | |
Duke Realty Corp. REIT | | | 174,510 | | | | 4,748 | | |
Education Realty Trust, Inc. REIT | | | 124,340 | | | | 4,342 | | |
Equity Lifestyle Properties, Inc. REIT | | | 2,587 | | | | 230 | | |
Equity Residential REIT | | | 452,772 | | | | 28,873 | | |
Essex Property Trust, Inc. REIT | | | 53,773 | | | | 12,979 | | |
Exeter Industrial Value Fund, LP REIT
(See Note A-4) (a)(d)(e)(f) | | | 1,860,000 | | | | 208 | | |
Federal Realty Investment Trust REIT | | | 23,402 | | | | 3,108 | | |
Gaming and Leisure Properties, Inc. REIT | | | 165,558 | | | | 6,126 | | |
GGP, Inc. REIT | | | 1,446,540 | | | | 33,835 | | |
HCP, Inc. REIT | | | 499,554 | | | | 13,028 | | |
Healthcare Realty Trust, Inc. REIT | | | 538,940 | | | | 17,311 | | |
Healthcare Trust of America, Inc., Class A REIT | | | 257,099 | | | | 7,723 | | |
Hilton Worldwide Holdings, Inc. | | | 62,747 | | | | 5,011 | | |
Host Hotels & Resorts, Inc. REIT | | | 416,164 | | | | 8,261 | | |
Invitation Homes, Inc. REIT | | | 363,998 | | | | 8,579 | | |
JBG SMITH Properties REIT | | | 295,220 | | | | 10,253 | | |
Kilroy Realty Corp. REIT | | | 193,272 | | | | 14,428 | | |
LaSalle Hotel Properties REIT | | | 850,396 | | | | 23,871 | | |
Liberty Property Trust REIT | | | 78,705 | | | | 3,385 | | |
Life Storage, Inc. REIT | | | 116,297 | | | | 10,359 | | |
Macerich Co. (The) REIT | | | 273,761 | | | | 17,981 | | |
Mack-Cali Realty Corp. REIT | | | 514,688 | | | | 11,097 | | |
National Retail Properties, Inc. REIT | | | 159,129 | | | | 6,863 | | |
Paramount Group, Inc. REIT | | | 731,754 | | | | 11,598 | | |
Pennsylvania Real Estate Investment Trust REIT | | | 271,842 | | | | 3,232 | | |
ProLogis, Inc. REIT | | | 403,447 | | | | 26,026 | | |
Public Storage REIT | | | 178,543 | | | | 37,316 | | |
QTS Realty Trust, Inc., Class A REIT | | | 240,049 | | | | 13,001 | | |
Regency Centers Corp. REIT | | | 263,822 | | | | 18,251 | | |
Rexford Industrial Realty, Inc. REIT | | | 230,195 | | | | 6,713 | | |
RLJ Lodging Trust REIT | | | 300,750 | | | | 6,607 | | |
Simon Property Group, Inc. REIT | | | 651,466 | | | | 111,883 | | |
SL Green Realty Corp. REIT | | | 410,474 | | | | 41,429 | | |
Starwood Property Trust, Inc. REIT | | | 164,360 | | | | 3,509 | | |
Tanger Factory Outlet Centers, Inc. REIT | | | 130,943 | | | | 3,471 | | |
Taubman Centers, Inc. REIT | | | 171,903 | | | | 11,248 | | |
Tier REIT, Inc. REIT | | | 69,800 | | | | 1,423 | | |
UDR, Inc. REIT | | | 175,965 | | | | 6,778 | | |
Ventas, Inc. REIT | | | 150,135 | | | | 9,010 | | |
The accompanying notes are an integral part of the financial statements.
9
Morgan Stanley Institutional Fund, Inc.
Annual Report — December 31, 2017
Portfolio of Investments (cont'd)
Global Real Estate Portfolio
| | | Shares | | Value
(000) | |
United States (cont'd) | |
VEREIT, Inc. REIT | | | 1,010,592 | | | $ | 7,873 | | |
Vornado Realty Trust REIT | | | 773,091 | | | | 60,440 | | |
Welltower, Inc. REIT | | | 117,875 | | | | 7,517 | | |
| | | | 816,528 | | |
Total Common Stocks (Cost $1,224,036) | | | 1,535,762 | | |
Short-Term Investment (4.5%) | |
Investment Company (4.5%) | |
Morgan Stanley Institutional Liquidity
Funds — Treasury Portfolio —
Institutional Class (See Note G)
(Cost $73,614) | | | 73,613,712 | | | | 73,614 | | |
Total Investments (99.2%) (Cost $1,297,650) (g)(h) | | | 1,609,376 | | |
Other Assets in Excess of Liabilities (0.8%) | | | 12,961 | | |
Net Assets (100.0%) | | $ | 1,622,337 | | |
Country assignments and aggregations are based generally on third party vendor classifications and information, and may be different from the assignments and aggregations under the policies set forth in the Fund's prospectus and/or statement of additional information relating to geographic classifications.
(a) Non-income producing security.
(b) Security trades on the Hong Kong exchange.
(c) 144A security — Certain conditions for public sale may exist. Unless otherwise noted, these securities are deemed to be liquid.
(d) Security has been deemed illiquid at December 31, 2017.
(e) At December 31, 2017, the Fund held fair valued securities valued at approximately $223,000, representing less than 0.05% of net assets. These securities have been fair valued as determined in good faith under procedures established by and under the general supervision of the Company's Directors.
(f) Restricted security valued at fair value and not registered under the Securities Act of 1933. Exeter Industrial Value Fund, LP was acquired between 11/07 - 4/11 and has a current cost basis of $0. At December 31, 2017, this security had an aggregate market value of approximately $208,000, representing less than 0.05% of net assets.
(g) The approximate fair value and percentage of net assets, $681,197,000 and 42.0%, respectively, represent the securities that have been fair valued under the fair valuation policy for international investments as described in Note A-1 within the Notes to the Financial Statements.
(h) At December 31, 2017, the aggregate cost for federal income tax purposes is approximately $1,350,294,000. The aggregate gross unrealized appreciation is approximately $274,049,000 and the aggregate gross unrealized depreciation is approximately $14,967,000, resulting in net unrealized appreciation of approximately $259,082,000.
CVA Certificaten Van Aandelen.
REIT Real Estate Investment Trust.
Portfolio Composition
Classification | | Percentage of
Total Investments | |
Diversified | | | 30.4 | % | |
Retail | | | 23.9 | | |
Other* | | | 19.7 | | |
Office | | | 15.7 | | |
Residential | | | 10.3 | | |
Total Investments | | | 100.0 | % | |
* Industries and/or investment types representing less than 5% of total investments.
The accompanying notes are an integral part of the financial statements.
10
Morgan Stanley Institutional Fund, Inc.
Annual Report — December 31, 2017
Global Real Estate Portfolio
Statement of Assets and Liabilities | | December 31, 2017
(000) | |
Assets: | |
Investments in Securities of Unaffiliated Issuers, at Value (Cost $1,224,036) | | $ | 1,535,762 | | |
Investment in Security of Affiliated Issuer, at Value (Cost $73,614) | | | 73,614 | | |
Total Investments in Securities, at Value (Cost $1,297,650) | | | 1,609,376 | | |
Foreign Currency, at Value (Cost $7,844) | | | 7,946 | | |
Dividends Receivable | | | 5,387 | | |
Receivable for Fund Shares Sold | | | 4,367 | | |
Receivable for Investments Sold | | | 2,274 | | |
Tax Reclaim Receivable | | | 455 | | |
Receivable from Affiliate | | | 55 | | |
Other Assets | | | 103 | | |
Total Assets | | | 1,629,963 | | |
Liabilities: | |
Payable for Fund Shares Redeemed | | | 3,815 | | |
Payable for Advisory Fees | | | 3,240 | | |
Payable for Custodian Fees | | | 168 | | |
Payable for Administration Fees | | | 108 | | |
Payable for Sub Transfer Agency Fees — Class I | | | 94 | | |
Payable for Sub Transfer Agency Fees — Class A | | | 3 | | |
Payable for Sub Transfer Agency Fees — Class L | | | — | @ | |
Payable for Sub Transfer Agency Fees — Class C | | | — | @ | |
Payable for Professional Fees | | | 61 | | |
Payable for Investments Purchased | | | 16 | | |
Payable for Transfer Agency Fees — Class I | | | 5 | | |
Payable for Transfer Agency Fees — Class A | | | 5 | | |
Payable for Transfer Agency Fees — Class L | | | 1 | | |
Payable for Transfer Agency Fees — Class C | | | 1 | | |
Payable for Transfer Agency Fees — Class IS | | | 4 | | |
Payable for Shareholder Services Fees — Class A | | | 4 | | |
Payable for Distribution and Shareholder Services Fees — Class L | | | 1 | | |
Payable for Distribution and Shareholder Services Fees — Class C | | | — | @ | |
Other Liabilities | | | 100 | | |
Total Liabilities | | | 7,626 | | |
Net Assets | | $ | 1,622,337 | | |
Net Assets Consist Of: | |
Paid-in-Capital | | $ | 1,340,798 | | |
Distributions in Excess of Net Investment Income | | | (4,412 | ) | |
Distributions in Excess of Net Realized Gain | | | (25,900 | ) | |
Unrealized Appreciation (Depreciation) on: | |
Investments | | | 311,726 | | |
Foreign Currency Translations | | | 125 | | |
Net Assets | | $ | 1,622,337 | | |
The accompanying notes are an integral part of the financial statements.
11
Morgan Stanley Institutional Fund, Inc.
Annual Report — December 31, 2017
Global Real Estate Portfolio
Statement of Assets and Liabilities (cont'd) | | December 31, 2017
(000) | |
CLASS I: | |
Net Assets | | $ | 553,319 | | |
| Shares Outstanding $0.001 par value shares of beneficial interest (unlimited shares authorized) (not in 000's) | | | 49,695,845 | | |
Net Asset Value, Offering and Redemption Price Per Share | | $ | 11.13 | | |
CLASS A: | |
Net Assets | | $ | 17,701 | | |
| Shares Outstanding $0.001 par value shares of beneficial interest (unlimited shares authorized) (not in 000's) | | | 1,594,421 | | |
Net Asset Value, Redemption Price Per Share | | $ | 11.10 | | |
Maximum Sales Load | | | 5.25 | % | |
Maximum Sales Charge | | $ | 0.62 | | |
Maximum Offering Price Per Share | | $ | 11.72 | | |
CLASS L: | |
Net Assets | | $ | 1,344 | | |
| Shares Outstanding $0.001 par value shares of beneficial interest (unlimited shares authorized) (not in 000's) | | | 122,154 | | |
Net Asset Value, Offering and Redemption Price Per Share | | $ | 11.01 | | |
CLASS C: | |
Net Assets | | $ | 327 | | |
| Shares Outstanding $0.001 par value shares of beneficial interest (unlimited shares authorized) (not in 000's) | | | 30,158 | | |
Net Asset Value, Offering and Redemption Price Per Share | | $ | 10.83 | | |
CLASS IS: | |
Net Assets | | $ | 1,049,646 | | |
| Shares Outstanding $0.001 par value shares of beneficial interest (unlimited shares authorized) (not in 000's) | | | 94,266,400 | | |
Net Asset Value, Offering and Redemption Price Per Share | | $ | 11.13 | | |
@ Amount is less than $500.
The accompanying notes are an integral part of the financial statements.
12
Morgan Stanley Institutional Fund, Inc.
Annual Report — December 31, 2017
Global Real Estate Portfolio
Statement of Operations | | Year Ended
December 31, 2017
(000) | |
Investment Income: | |
Dividends from Securities of Unaffiliated Issuers (Net of $1,981 of Foreign Taxes Withheld) | | $ | 49,495 | | |
Dividends from Security of Affiliated Issuer (Note G) | | | 160 | | |
Total Investment Income | | | 49,655 | | |
Expenses: | |
Advisory Fees (Note B) | | | 13,072 | | |
Administration Fees (Note C) | | | 1,230 | | |
Sub Transfer Agency Fees — Class I | | | 429 | | |
Sub Transfer Agency Fees — Class A | | | 19 | | |
Sub Transfer Agency Fees — Class L | | | 1 | | |
Sub Transfer Agency Fees — Class C | | | — | @ | |
Custodian Fees (Note F) | | | 225 | | |
Professional Fees | | | 129 | | |
Registration Fees | | | 104 | | |
Shareholder Services Fees — Class A (Note D) | | | 72 | | |
Distribution and Shareholder Services Fees — Class L (Note D) | | | 10 | | |
Distribution and Shareholder Services Fees — Class C (Note D) | | | 3 | | |
Shareholder Reporting Fees | | | 63 | | |
Transfer Agency Fees — Class I (Note E) | | | 18 | | |
Transfer Agency Fees — Class A (Note E) | | | 17 | | |
Transfer Agency Fees — Class L (Note E) | | | 2 | | |
Transfer Agency Fees — Class C (Note E) | | | 2 | | |
Transfer Agency Fees — Class IS (Note E) | | | 16 | | |
Directors' Fees and Expenses | | | 43 | | |
Pricing Fees | | | 15 | | |
Other Expenses | | | 96 | | |
Expenses Before Non Operating Expenses | | | 15,566 | | |
Bank Overdraft Expense | | | 16 | | |
Total Expenses | | | 15,582 | | |
Reimbursement of Class Specific Expenses — Class I (Note B) | | | (110 | ) | |
Reimbursement of Class Specific Expenses — Class L (Note B) | | | (— | @) | |
Reimbursement of Class Specific Expenses — Class C (Note B) | | | (2 | ) | |
Rebate from Morgan Stanley Affiliate (Note G) | | | (32 | ) | |
Net Expenses | | | 15,438 | | |
Net Investment Income | | | 34,217 | | |
Realized Gain: | |
Investments Sold | | | 97,390 | | |
Foreign Currency Transactions | | | 241 | | |
Realized Gain | | | 97,631 | | |
Change in Unrealized Appreciation (Depreciation): | |
Investments | | | 12,887 | | |
Foreign Currency Translations | | | 187 | | |
Net Change in Unrealized Appreciation (Depreciation) | | | 13,074 | | |
Net Realized Gain and Change in Unrealized Appreciation (Depreciation) | | | 110,705 | | |
Net Increase in Net Assets Resulting from Operations | | $ | 144,922 | | |
@ Amount is less than $500.
The accompanying notes are an integral part of the financial statements.
13
Morgan Stanley Institutional Fund, Inc.
Annual Report — December 31, 2017
Global Real Estate Portfolio
Statements of Changes in Net Assets | | Year Ended
December 31, 2017
(000) | | Year Ended
December 31, 2016
(000) | |
Increase in Net Assets: | |
Operations: | |
Net Investment Income | | $ | 34,217 | | | $ | 41,130 | | |
Net Realized Gain | | | 97,631 | | | | 20,091 | | |
Net Change in Unrealized Appreciation (Depreciation) | | | 13,074 | | | | 12,821 | | |
Net Increase in Net Assets Resulting from Operations | | | 144,922 | | | | 74,042 | | |
Distributions from and/or in Excess of: | |
Class I: | |
Net Investment Income | | | (6,871 | ) | | | (14,704 | ) | |
Net Realized Gain | | | (23,992 | ) | | | (1,849 | ) | |
Paid-in-Capital | | | — | | | | (725 | ) | |
Class A: | |
Net Investment Income | | | (157 | ) | | | (2,970 | ) | |
Net Realized Gain | | | (883 | ) | | | (429 | ) | |
Paid-in-Capital | | | — | | | | (168 | ) | |
Class L: | |
Net Investment Income | | | (6 | ) | | | (27 | ) | |
Net Realized Gain | | | (62 | ) | | | (6 | ) | |
Paid-in-Capital | | | — | | | | (2 | ) | |
Class C: | |
Net Investment Income | | | (1 | ) | | | (7 | ) | |
Net Realized Gain | | | (15 | ) | | | (1 | ) | |
Paid-in-Capital | | | — | | | | (1 | ) | |
Class IS: | |
Net Investment Income | | | (13,965 | ) | | | (40,319 | ) | |
Net Realized Gain | | | (46,535 | ) | | | (4,880 | ) | |
Paid-in-Capital | | | — | | | | (1,912 | ) | |
Total Distributions | | | (92,487 | ) | | | (68,000 | ) | |
Capital Share Transactions:(1) | |
Class I: | |
Subscribed | | | 238,648 | | | | 114,459 | | |
Distributions Reinvested | | | 23,199 | | | | 15,837 | | |
Redeemed | | | (191,961 | ) | | | (862,678 | ) | |
Class A: | |
Subscribed | | | 6,572 | | | | 94,427 | | |
Distributions Reinvested | | | 1,029 | | | | 3,558 | | |
Redeemed | | | (84,462 | ) | | | (138,133 | ) | |
Class L: | |
Exchanged | | | 2 | | | | — | | |
Distributions Reinvested | | | 67 | | | | 35 | | |
Redeemed | | | (256 | ) | | | (3,106 | ) | |
Class C: | |
Subscribed | | | 13 | | | | 115 | | |
Distributions Reinvested | | | 16 | | | | 8 | | |
Redeemed | | | (18 | ) | | | (5 | ) | |
Class IS: | |
Subscribed | | | 162,578 | | | | 791,778 | | |
Distributions Reinvested | | | 56,577 | | | | 40,976 | | |
Redeemed | | | (463,908 | ) | | | (587,231 | ) | |
Net Decrease in Net Assets Resulting from Capital Share Transactions | | | (251,904 | ) | | | (529,960 | ) | |
Total Decrease in Net Assets | | | (199,469 | ) | | | (523,918 | ) | |
Net Assets: | |
Beginning of Period | | | 1,821,806 | | | | 2,345,724 | | |
End of Period (Including Distributions in Excess of Net Investment Income of $(4,412) and $(27,921)) | | $ | 1,622,337 | | | $ | 1,821,806 | | |
The accompanying notes are an integral part of the financial statements.
14
Morgan Stanley Institutional Fund, Inc.
Annual Report — December 31, 2017
Global Real Estate Portfolio
Statements of Changes in Net Assets (cont'd) | | Year Ended
December 31, 2017
(000) | | Year Ended
December 31, 2016
(000) | |
(1) Capital Share Transactions: | |
Class I: | |
Shares Subscribed | | | 21,034 | | | | 10,334 | | |
Shares Issued on Distributions Reinvested | | | 2,077 | | | | 1,491 | | |
Shares Redeemed | | | (17,249 | ) | | | (78,399 | ) | |
Net Increase (Decrease) in Class I Shares Outstanding | | | 5,862 | | | | (66,574 | ) | |
Class A: | |
Shares Subscribed | | | 593 | | | | 8,746 | | |
Shares Issued on Distributions Reinvested | | | 92 | | | | 337 | | |
Shares Redeemed | | | (7,750 | ) | | | (13,041 | ) | |
Net Decrease in Class A Shares Outstanding | | | (7,065 | ) | | | (3,958 | ) | |
Class L: | |
Shares Exchanged | | | — | @@ | | | — | | |
Shares Issued on Distributions Reinvested | | | 6 | | | | 3 | | |
Shares Redeemed | | | (23 | ) | | | (289 | ) | |
Net Decrease in Class L Shares Outstanding | | | (17 | ) | | | (286 | ) | |
Class C: | |
Shares Subscribed | | | 1 | | | | 10 | | |
Shares Issued on Distributions Reinvested | | | 2 | | | | 1 | | |
Shares Redeemed | | | (2 | ) | | | (— | @@) | |
Net Increase in Class C Shares Outstanding | | | 1 | | | | 11 | | |
Class IS: | |
Shares Subscribed | | | 14,534 | | | | 72,096 | | |
Shares Issued on Distributions Reinvested | | | 5,065 | | | | 3,858 | | |
Shares Redeemed | | | (41,989 | ) | | | (53,032 | ) | |
Net Increase (Decrease) in Class IS Shares Outstanding | | | (22,390 | ) | | | 22,922 | | |
@@ Amount is less than 500 shares.
The accompanying notes are an integral part of the financial statements.
15
Morgan Stanley Institutional Fund, Inc.
Annual Report — December 31, 2017
Financial Highlights
Global Real Estate Portfolio
| | | Class I | |
| | | Year Ended December 31, | |
Selected Per Share Data and Ratios | | 2017 | | 2016(1) | | 2015 | | 2014 | | 2013 | |
Net Asset Value, Beginning of Period | | $ | 10.76 | | | $ | 10.80 | | | $ | 11.10 | | | $ | 9.91 | | | $ | 9.77 | | |
Income (Loss) from Investment Operations: | |
Net Investment Income(2) | | | 0.25 | | | | 0.21 | | | | 0.18 | | | | 0.20 | | | | 0.18 | | |
Net Realized and Unrealized Gain (Loss) | | | 0.80 | | | | 0.15 | | | | (0.28 | ) | | | 1.19 | | | | 0.16 | | |
Total from Investment Operations | | | 1.05 | | | | 0.36 | | | | (0.10 | ) | | | 1.39 | | | | 0.34 | | |
Distributions from and/or in Excess of: | |
Net Investment Income | | | (0.15 | ) | | | (0.34 | ) | | | (0.20 | ) | | | (0.20 | ) | | | (0.20 | ) | |
Net Realized Gain | | | (0.53 | ) | | | (0.04 | ) | | | — | | | | — | | | | — | | |
Paid-in-Capital | | | — | | | | (0.02 | ) | | | — | | | | — | | | | — | | |
Total Distributions | | | (0.68 | ) | | | (0.40 | ) | | | (0.20 | ) | | | (0.20 | ) | | | (0.20 | ) | |
Net Asset Value, End of Period | | $ | 11.13 | | | $ | 10.76 | | | $ | 10.80 | | | $ | 11.10 | | | $ | 9.91 | | |
Total Return(3) | | | 9.73 | % | | | 3.42 | % | | | (0.94 | )% | | | 14.08 | % | | | 3.55 | % | |
Ratios and Supplemental Data: | |
Net Assets, End of Period (Thousands) | | $ | 553,319 | | | $ | 471,790 | | | $ | 1,192,624 | | | $ | 1,828,656 | | | $ | 1,793,614 | | |
Ratio of Expenses to Average Net Assets(6) | | | 1.05 | %(4) | | | 1.04 | %(4) | | | 1.05 | %(4) | | | 1.05 | %(4) | | | 1.02 | %(4) | |
Ratio of Expenses to Average Net Assets Excluding Non Operating Expenses | | | 1.05 | %(4) | | | N/A | | | | 1.05 | %(4) | | | N/A | | | | 1.02 | %(4) | |
Ratio of Net Investment Income to Average Net Assets(6) | | | 2.20 | %(4) | | | 1.88 | %(4) | | | 1.65 | %(4) | | | 1.85 | %(4) | | | 1.77 | %(4) | |
Ratio of Rebate from Morgan Stanley Affiliates to Average Net Assets | | | 0.00 | %(5) | | | 0.00 | %(5) | | | 0.00 | %(5) | | | 0.00 | %(5) | | | 0.00 | %(5) | |
Portfolio Turnover Rate | | | 39 | %(6) | | | 26 | % | | | 29 | % | | | 32 | % | | | 33 | % | |
(6) Supplemental Information on the Ratios to Average Net Assets: | |
Ratios Before Expense Limitation: | |
Expenses to Average Net Assets | | | 1.07 | % | | | 1.04 | % | | | 1.05 | % | | | 1.05 | % | | | N/A | | |
Net Investment Income to Average Net Assets | | | 2.18 | % | | | 1.88 | % | | | 1.65 | % | | | 1.85 | % | | | N/A | | |
(1) Reflects prior period custodian out-of-pocket expenses that were reimbursed in September 2016. The amount of the reimbursement was immaterial on a per share basis and did not impact the total return of Class I shares. The Ratio of Expenses to Average Net Assets would have been less than 0.005% higher and the Ratio of Net Investment Income to Average Net Assets would have been less than 0.005% lower had the custodian not reimbursed the Fund.
(2) Per share amount is based on average shares outstanding.
(3) Calculated based on the net asset value as of the last business day of the period.
(4) The Ratios of Expenses and Net Investment Income reflect the rebate of certain Fund expenses in connection with the investments in Morgan Stanley affiliates during the period. The effect of the rebate on the ratios is disclosed in the above table as "Ratio of Rebate from Morgan Stanley Affiliates to Average Net Assets."
(5) Amount is less than 0.005%.
The accompanying notes are an integral part of the financial statements.
16
Morgan Stanley Institutional Fund, Inc.
Annual Report — December 31, 2017
Financial Highlights
Global Real Estate Portfolio
| | | Class A | |
| | | Year Ended December 31, | |
Selected Per Share Data and Ratios | | 2017 | | 2016(1) | | 2015 | | 2014 | | 2013 | |
Net Asset Value, Beginning of Period | | $ | 10.71 | | | $ | 10.74 | | | $ | 11.05 | | | $ | 9.86 | | | $ | 9.72 | | |
Income (Loss) from Investment Operations: | |
Net Investment Income(2) | | | 0.17 | | | | 0.17 | | | | 0.16 | | | | 0.17 | | | | 0.15 | | |
Net Realized and Unrealized Gain (Loss) | | | 0.84 | | | | 0.16 | | | | (0.30 | ) | | | 1.19 | | | | 0.15 | | |
Total from Investment Operations | | | 1.01 | | | | 0.33 | | | | (0.14 | ) | | | 1.36 | | | | 0.30 | | |
Distributions from and/or in Excess of: | |
Net Investment Income | | | (0.09 | ) | | | (0.30 | ) | | | (0.17 | ) | | | (0.17 | ) | | | (0.16 | ) | |
Net Realized Gain | | | (0.53 | ) | | | (0.04 | ) | | | — | | | | — | | | | — | | |
Paid-in-Capital | | | — | | | | (0.02 | ) | | | — | | | | — | | | | — | | |
Total Distributions | | | (0.62 | ) | | | (0.36 | ) | | | (0.17 | ) | | | (0.17 | ) | | | (0.16 | ) | |
Net Asset Value, End of Period | | $ | 11.10 | | | $ | 10.71 | | | $ | 10.74 | | | $ | 11.05 | | | $ | 9.86 | | |
Total Return(3) | | | 9.44 | % | | | 3.12 | % | | | (1.25 | )% | | | 13.88 | % | | | 3.18 | % | |
Ratios and Supplemental Data: | |
Net Assets, End of Period (Thousands) | | $ | 17,701 | | | $ | 92,730 | | | $ | 135,517 | | | $ | 105,766 | | | $ | 96,046 | | |
Ratio of Expenses to Average Net Assets(7) | | | 1.35 | %(4) | | | 1.35 | %(4) | | | 1.34 | %(4) | | | 1.31 | %(4) | | | 1.30 | %(4)(5) | |
Ratio of Expenses to Average Net Assets Excluding Non Operating Expenses | | | 1.35 | %(4) | | | N/A | | | | 1.34 | %(4) | | | N/A | | | | 1.30 | %(4)(5) | |
Ratio of Net Investment Income to Average Net Assets(7) | | | 1.55 | %(4) | | | 1.51 | %(4) | | | 1.47 | %(4) | | | 1.60 | %(4) | | | 1.43 | %(4) | |
Ratio of Rebate from Morgan Stanley Affiliates to Average Net Assets | | | 0.00 | %(6) | | | 0.00 | %(6) | | | 0.00 | %(6) | | | 0.00 | %(6) | | | 0.00 | %(6) | |
Portfolio Turnover Rate | | | 39 | % | | | 26 | % | | | 29 | % | | | 32 | % | | | 33 | % | |
(7) Supplemental Information on the Ratios to Average Net Assets: | |
Ratios Before Expense Limitation: | |
Expenses to Average Net Assets | | | N/A | | | | 1.36 | % | | | N/A | | | | N/A | | | | 1.32 | % | |
Net Investment Income to Average Net Assets | | | N/A | | | | 1.50 | % | | | N/A | | | | N/A | | | | 1.41 | % | |
(1) Reflects prior period custodian out-of-pocket expenses that were reimbursed in September 2016. The amount of the reimbursement was immaterial on a per share basis and did not impact the total return of Class A shares. The Ratio of Expenses to Average Net Assets would have been 0.01% higher and the Ratio of Net Investment Income to Average Net Assets would have been 0.01% lower had the custodian not reimbursed the Fund.
(2) Per share amount is based on average shares outstanding.
(3) Calculated based on the net asset value which does not reflect sales charges, if applicable, as of the last business day of the period.
(4) The Ratios of Expenses and Net Investment Income reflect the rebate of certain Fund expenses in connection with the investments in Morgan Stanley affiliates during the period. The effect of the rebate on the ratios is disclosed in the above table as "Ratio of Rebate from Morgan Stanley Affiliates to Average Net Assets."
(5) Effective September 16, 2013, the Adviser has agreed to limit the ratio of expenses to average net assets to the maximum ratio of 1.40% for Class A shares. Prior to September 16, 2013, the maximum ratio was 1.30% for Class A shares.
(6) Amount is less than 0.005%.
The accompanying notes are an integral part of the financial statements.
17
Morgan Stanley Institutional Fund, Inc.
Annual Report — December 31, 2017
Financial Highlights
Global Real Estate Portfolio
| | | Class L | |
| | | Year Ended December 31, | |
Selected Per Share Data and Ratios | | 2017 | | 2016(1) | | 2015 | | 2014 | | 2013 | |
Net Asset Value, Beginning of Period | | $ | 10.64 | | | $ | 10.61 | | | $ | 10.91 | | | $ | 9.74 | | | $ | 9.59 | | |
Income (Loss) from Investment Operations: | |
Net Investment Income(2) | | | 0.14 | | | | 0.12 | | | | 0.12 | | | | 0.12 | | | | 0.10 | | |
Net Realized and Unrealized Gain (Loss) | | | 0.81 | | | | 0.16 | | | | (0.31 | ) | | | 1.17 | | | | 0.16 | | |
Total from Investment Operations | | | 0.95 | | | | 0.28 | | | | (0.19 | ) | | | 1.29 | | | | 0.26 | | |
Distributions from and/or in Excess of: | |
Net Investment Income | | | (0.05 | ) | | | (0.19 | ) | | | (0.11 | ) | | | (0.12 | ) | | | (0.11 | ) | |
Net Realized Gain | | | (0.53 | ) | | | (0.04 | ) | | | — | | | | — | | | | — | | |
Paid-in-Capital | | | — | | | | (0.02 | ) | | | — | | | | — | | | | — | | |
Total Distributions | | | (0.58 | ) | | | (0.25 | ) | | | (0.11 | ) | | | (0.12 | ) | | | (0.11 | ) | |
Net Asset Value, End of Period | | $ | 11.01 | | | $ | 10.64 | | | $ | 10.61 | | | $ | 10.91 | | | $ | 9.74 | | |
Total Return(3) | | | 8.89 | % | | | 2.65 | % | | | (1.71 | )% | | | 13.27 | % | | | 2.77 | % | |
Ratios and Supplemental Data: | |
Net Assets, End of Period (Thousands) | | $ | 1,344 | | | $ | 1,483 | | | $ | 4,509 | | | $ | 4,755 | | | $ | 5,844 | | |
Ratio of Expenses to Average Net Assets(7) | | | 1.90 | %(4) | | | 1.82 | %(4) | | | 1.78 | %(4) | | | 1.79 | %(4) | | | 1.77 | %(4)(5) | |
Ratio of Expenses to Average Net Assets Excluding Non Operating Expenses | | | 1.90 | %(4) | | | N/A | | | | 1.77 | %(4) | | | N/A | | | | 1.77 | %(4)(5) | |
Ratio of Net Investment Income to Average Net Assets(7) | | | 1.32 | %(4) | | | 1.07 | %(4) | | | 1.12 | %(4) | | | 1.08 | %(4) | | | 0.98 | %(4) | |
Ratio of Rebate from Morgan Stanley Affiliates to Average Net Assets | | | 0.00 | %(6) | | | 0.00 | %(6) | | | 0.00 | %(6) | | | 0.00 | %(6) | | | 0.00 | %(6) | |
Portfolio Turnover Rate | | | 39 | % | | | 26 | % | | | 29 | % | | | 32 | % | | | 33 | % | |
(7) Supplemental Information on the Ratios to Average Net Assets: | |
Ratios Before Expense Limitation: | |
Expenses to Average Net Assets | | | 1.93 | % | | | 1.82 | % | | | N/A | | | | N/A | | | | N/A | | |
Net Investment Income to Average Net Assets | | | 1.29 | % | | | 1.07 | % | | | N/A | | | | N/A | | | | N/A | | |
(1) Reflects prior period custodian out-of-pocket expenses that were reimbursed in September 2016. The amount of the reimbursement was immaterial on a per share basis and did not impact the total return of Class L shares. The Ratio of Expenses to Average Net Assets would have been less than 0.005% higher and the Ratio of Net Investment Income to Average Net Assets would have been less than 0.005% lower had the custodian not reimbursed the Fund.
(2) Per share amount is based on average shares outstanding.
(3) Calculated based on the net asset value as of the last business day of the period.
(4) The Ratios of Expenses and Net Investment Income reflect the rebate of certain Fund expenses in connection with the investments in Morgan Stanley affiliates during the period. The effect of the rebate on the ratios is disclosed in the above table as "Ratio of Rebate from Morgan Stanley Affiliates to Average Net Assets."
(5) Effective September 16, 2013, the Adviser has agreed to limit the ratio of expenses to average net assets to the maximum ratio of 1.90% for Class L shares. Prior to September 16, 2013, the maximum ratio was 1.80% for Class L shares.
(6) Amount is less than 0.005%.
The accompanying notes are an integral part of the financial statements.
18
Morgan Stanley Institutional Fund, Inc.
Annual Report — December 31, 2017
Financial Highlights
Global Real Estate Portfolio
| | | Class C | |
| | | Year Ended December 31, | | Period from
April 30, 2015(2) to | |
Selected Per Share Data and Ratios | | 2017 | | 2016(1) | | December 31, 2015 | |
Net Asset Value, Beginning of Period | | $ | 10.49 | | | $ | 10.56 | | | $ | 11.23 | | |
Income (Loss) from Investment Operations: | |
Net Investment Income(3) | | | 0.12 | | | | 0.08 | | | | 0.07 | | |
Net Realized and Unrealized Gain (Loss) | | | 0.78 | | | | 0.16 | | | | (0.60 | ) | |
Total from Investment Operations | | | 0.90 | | | | 0.24 | | | | (0.53 | ) | |
Distributions from and/or in Excess of: | |
Net Investment Income | | | (0.03 | ) | | | (0.25 | ) | | | (0.14 | ) | |
Net Realized Gain | | | (0.53 | ) | | | (0.04 | ) | | | — | | |
Paid-in-Capital | | | — | | | | (0.02 | ) | | | — | | |
Total Distributions | | | (0.56 | ) | | | (0.31 | ) | | | (0.14 | ) | |
Net Asset Value, End of Period | | $ | 10.83 | | | $ | 10.49 | | | $ | 10.56 | | |
Total Return(4) | | | 8.54 | % | | | 2.31 | % | | | (4.71 | )%(7) | |
Ratios and Supplemental Data: | |
Net Assets, End of Period (Thousands) | | $ | 327 | | | $ | 305 | | | $ | 191 | | |
Ratio of Expenses to Average Net Assets(9) | | | 2.15 | %(5) | | | 2.15 | %(5) | | | 2.15 | %(5)(8) | |
Ratio of Expenses to Average Net Assets Excluding Non Operating Expenses | | | 2.15 | %(5) | | | N/A | | | | 2.15 | %(5)(8) | |
Ratio of Net Investment Income to Average Net Assets(9) | | | 1.11 | %(5) | | | 0.75 | %(5) | | | 1.01 | %(5)(8) | |
Ratio of Rebate from Morgan Stanley Affiliates to Average Net Assets | | | 0.00 | %(6) | | | 0.00 | %(6) | | | 0.00 | %(6)(8) | |
Portfolio Turnover Rate | | | 39 | % | | | 26 | % | | | 29 | % | |
(9) Supplemental Information on the Ratios to Average Net Assets: | |
Ratios Before Expense Limitation: | |
Expenses to Average Net Assets | | | 2.69 | % | | | 2.86 | % | | | 3.25 | %(8) | |
Net Investment Income (Loss) to Average Net Assets | | | 0.57 | % | | | 0.04 | % | | | (0.09 | )%(8) | |
(1) Reflects prior period custodian out-of-pocket expenses that were reimbursed in September 2016. The amount of the reimbursement was immaterial on a per share basis and did not impact the total return of Class C shares. The Ratio of Expenses to Average Net Assets and the Ratio of Net Investment Income to Average Net Assets would be unchanged as the reimbursement of custodian fees was offset against expense waivers/reimbursements with no impact to net expenses or net investment income.
(2) Commencement of Offering.
(3) Per share amount is based on average shares outstanding.
(4) Calculated based on the net asset value which does not reflect sales charges, if applicable, as of the last business day of the period.
(5) The Ratios of Expenses and Net Investment Income reflect the rebate of certain Fund expenses in connection with the investments in Morgan Stanley affiliates during the period. The effect of the rebate on the ratios is disclosed in the above table as "Ratio of Rebate from Morgan Stanley Affiliates to Average Net Assets."
(6) Amount is less than 0.005%.
(7) Not annualized.
(8) Annualized.
The accompanying notes are an integral part of the financial statements.
19
Morgan Stanley Institutional Fund, Inc.
Annual Report — December 31, 2017
Financial Highlights
Global Real Estate Portfolio
| | | Class IS | |
| | | Year Ended December 31, | | Period from
September 13, 2013(2) to | |
Selected Per Share Data and Ratios | | 2017 | | 2016(1) | | 2015 | | 2014 | | December 31, 2013 | |
Net Asset Value, Beginning of Period | | $ | 10.76 | | | $ | 10.81 | | | $ | 11.11 | | | $ | 9.91 | | | $ | 10.01 | | |
Income (Loss) from Investment Operations: | |
Net Investment Income(3) | | | 0.25 | | | | 0.22 | | | | 0.20 | | | | 0.22 | | | | 0.08 | | |
Net Realized and Unrealized Gain (Loss) | | | 0.81 | | | | 0.15 | | | | (0.29 | ) | | | 1.19 | | | | 0.02 | | |
Total from Investment Operations | | | 1.06 | | | | 0.37 | | | | (0.09 | ) | | | 1.41 | | | | 0.10 | | |
Distributions from and/or in Excess of: | |
Net Investment Income | | | (0.16 | ) | | | (0.36 | ) | | | (0.21 | ) | | | (0.21 | ) | | | (0.20 | ) | |
Net Realized Gain | | | (0.53 | ) | | | (0.04 | ) | | | — | | | | — | | | | — | | |
Paid-in-Capital | | | — | | | | (0.02 | ) | | | — | | | | — | | | | — | | |
Total Distributions | | | (0.69 | ) | | | 0.42 | | | | (0.21 | ) | | | (0.21 | ) | | | (0.20 | ) | |
Net Asset Value, End of Period | | $ | 11.13 | | | $ | 10.76 | | | $ | 10.81 | | | $ | 11.11 | | | $ | 9.91 | | |
Total Return(4) | | | 9.80 | % | | | 3.45 | % | | | (0.84 | )% | | | 14.27 | % | | | 1.08 | %(8) | |
Ratios and Supplemental Data: | |
Net Assets, End of Period (Thousands) | | $ | 1,049,646 | | | $ | 1,255,498 | | | $ | 1,012,883 | | | $ | 586,511 | | | $ | 206,757 | | |
Ratio of Expenses to Average Net Assets(10) | | | 0.97 | %(5) | | | 0.96 | %(5) | | | 0.97 | %(5) | | | 0.96 | %(5) | | | 0.96 | %(5)(6)(9) | |
Ratio of Expenses to Average Net Assets Excluding Non
Operating Expenses | | | 0.97 | %(5) | | | N/A | | | | 0.97 | %(5) | | | N/A | | | | N/A | | |
Ratio of Net Investment Income to Average Net Assets(10) | | | 2.26 | %(5) | | | 2.01 | %(5) | | | 1.78 | %(5) | | | 2.01 | %(5) | | | 2.88 | %(5)(9) | |
Ratio of Rebate from Morgan Stanley Affiliates to Average Net Assets | | | 0.00 | %(7) | | | 0.00 | %(7) | | | 0.00 | %(7) | | | 0.00 | %(7) | | | 0.00 | %(7)(9) | |
Portfolio Turnover Rate | | | 39 | % | | | 26 | % | | | 29 | % | | | 32 | % | | | 33 | % | |
(10) Supplemental Information on the Ratios to Average Net Assets: | |
Ratios Before Expense Limitation: | |
Expenses to Average Net Assets | | | N/A | | | | 0.97 | % | | | N/A | | | | 0.96 | % | | | 0.97 | %(9) | |
Net Investment Income to Average Net Assets | | | N/A | | | | 2.00 | % | | | N/A | | | | 2.01 | % | | | 2.87 | %(9) | |
(1) Reflects prior period custodian out-of-pocket expenses that were reimbursed in September 2016. The amount of the reimbursement was immaterial on a per share basis and did not impact the total return of Class IS shares. The Ratio of Expenses to Average Net Assets would have been 0.01% higher and the Ratio of Net Investment Income to Average Net Assets would have been 0.01% lower had the custodian not reimbursed the Fund.
(2) Commencement of Offering.
(3) Per share amount is based on average shares outstanding.
(4) Calculated based on the net asset value as of the last business day of the period.
(5) The Ratios of Expenses and Net Investment Income reflect the rebate of certain Fund expenses in connection with the investments in Morgan Stanley affiliates during the period. The effect of the rebate on the ratios is disclosed in the above table as "Ratio of Rebate from Morgan Stanley Affiliates to Average Net Assets."
(6) Effective September 16, 2013, the Adviser has agreed to limit the ratio of expenses to average net assets to the maximum ratio of 0.99% for Class IS shares.
(7) Amount is less than 0.005%.
(8) Not annualized.
(9) Annualized.
The accompanying notes are an integral part of the financial statements.
20
Morgan Stanley Institutional Fund, Inc.
Annual Report — December 31, 2017
Notes to Financial Statements
Morgan Stanley Institutional Fund, Inc. (the "Company") is registered under the Investment Company Act of 1940, as amended (the "Act"), as an open-end management investment company. The Company is comprised of twenty-nine separate, active, diversified and non-diversified funds (individually referred to as a "Fund", collectively as the "Funds"). The Company applies investment company accounting and reporting guidance.
The accompanying financial statements relate to the Global Real Estate Portfolio. The Fund seeks to provide current income and capital appreciation. The Fund has capital subscription commitments to an investee company for this same purpose, the details of which are disclosed in the Unfunded Commitments note.
The Fund offers five classes of shares — Class I, Class A, Class L, Class C and Class IS. On April 30, 2015, the Fund suspended offering of Class L shares. Existing Class L shareholders may invest through reinvestment of dividends and distributions.
A. Significant Accounting Policies: The following significant accounting policies are in conformity with U.S. generally accepted accounting principles ("GAAP"). Such policies are consistently followed by the Company in the preparation of its financial statements. GAAP may require management to make estimates and assumptions that affect the reported amounts and disclosures in the financial statements. Actual results may differ from those estimates.
1. Security Valuation: (1) An equity portfolio security listed or traded on an exchange is valued at its latest reported sales price (or at the exchange official closing price if such exchange reports an official closing price), and if there were no sales on a given day and if there is no official exchange closing price for that day, the security is valued at the mean between the last reported bid and asked prices if such bid and asked prices are available on the relevant exchanges. Listed equity securities not traded on the valuation date with no reported bid and asked prices available on the exchange are valued at the mean between the current bid and asked prices obtained from one or more reputable brokers or dealers. In cases where a security is traded on more than one exchange, the security is valued on the exchange designated as the primary market; (2) all other equity portfolio securities for which over-the-counter ("OTC") market quotations are readily available are valued at the latest reported sales price (or at the market official
closing price if such market reports an official closing price), and if there was no trading in the security on a given day and if there is no official closing price from relevant markets for that day, the security is valued at the mean between the last reported bid and asked prices if such bid and asked prices are available on the relevant markets. An unlisted equity security that does not trade on the valuation date and for which bid and asked prices from the relevant markets are unavailable is valued at the mean between the current bid and asked prices obtained from one or more reputable brokers or dealers; (3) certain portfolio securities may be valued by an outside pricing service/vendor approved by the Company's Board of Directors (the "Directors"). The pricing service/vendor may employ a pricing model that takes into account, among other things, bids, yield spreads, and/or other market data and specific security characteristics. Alternatively, if a valuation is not available from an outside pricing service/vendor, and the security trades on an exchange, the security may be valued at its latest reported sale price (or at the exchange official closing price if such exchange reports an official closing price), prior to the time when assets are valued. If there are no sales on a given day and if there is no official exchange closing price for that day, the security is valued at the mean between the last reported bid and asked prices if such bid and asked prices are available in the relevant exchanges; (4) when market quotations are not readily available, including circumstances under which Morgan Stanley Investment Management Inc. (the "Adviser") or Morgan Stanley Investment Management Limited ("MSIM Limited") and Morgan Stanley Investment Management Company ("MSIM Company") (together, the "Sub-Advisers"), each a wholly-owned subsidiary of Morgan Stanley, determine that the closing price, last sale price or the mean between the last reported bid and asked prices are not reflective of a security's market value, portfolio securities are valued at their fair value as determined in good faith under procedures established by and under the general supervision of the Fund's Board of Directors (the "Directors"). Occasionally, developments affecting the closing prices of securities and other assets may occur between the times at which valuations of such securities are determined (that is, close of the foreign market on which the securities trade) and the close of business of the New York Stock Exchange ("NYSE"). If developments occur during such periods that are expected to materially affect the value of such securities, such valuations may be adjusted to reflect the estimated fair
21
Morgan Stanley Institutional Fund, Inc.
Annual Report — December 31, 2017
Notes to Financial Statements (cont'd)
value of such securities as of the close of the NYSE, as determined in good faith by the Directors or by the Adviser using a pricing service and/or procedures approved by the Directors; (5) quotations of foreign portfolio securities, other assets and liabilities and forward contracts stated in foreign currency are translated into U.S. dollar equivalents at the prevailing market rates prior to the close of the NYSE; and (6) investments in mutual funds, including the Morgan Stanley Institutional Liquidity Funds, are valued at the net asset value ("NAV") as of the close of each business day.
The Directors have responsibility for determining in good faith the fair value of the investments, and the Directors may appoint others, such as the Company's Adviser or a valuation committee, to assist the Directors in determining fair value and to make the actual calculations pursuant to the fair valuation methodologies previously approved by the Directors. Under procedures approved by the Directors, the Company's Adviser has formed a Valuation Committee whose members are approved by the Directors. The Valuation Committee provides administration and oversight of the Company's valuation policies and procedures, which are reviewed at least annually by the Directors. These procedures allow the Company to utilize independent pricing services, quotations from securities and financial instrument dealers, and other market sources to determine fair value.
The Company has procedures to determine the fair value of securities and other financial instruments for which market prices are not readily available. Under these procedures, the Valuation Committee convenes on a regular and ad hoc basis to review such securities and considers a number of factors, including valuation methodologies and significant unobservable valuation inputs, when arriving at fair value. The Valuation Committee may employ a market-based approach which may use related or comparable assets or liabilities, recent transactions, market multiples, book values, and other relevant information for the investment to determine the fair value of the investment. An income-based valuation approach may also be used in which the anticipated future cash flows of the investment are discounted to calculate fair value. Discounts may also be applied due to the nature or duration of any restrictions on the disposition of the investments. Due to the inherent uncertainty of valuations of such investments, the fair values may differ significantly from the values that
would have been used had an active market existed. The Valuation Committee employs various methods for calibrating these valuation approaches including a regular review of valuation methodologies, key inputs and assumptions, transactional back-testing or disposition analysis, and reviews of any related market activity.
The Fund invests a significant portion of its assets in securities of real estate investment trusts ("REITs"). The market's perception of prospective declines in private real estate values and other financial assets may result in increased volatility of market prices that can negatively impact the valuation of certain issuers held by the Fund.
2. Fair Value Measurement: Financial Accounting Standards Board ("FASB") Accounting Standards CodificationTM ("ASC") 820, "Fair Value Measurement" ("ASC 820"), defines fair value as the value that the Fund would receive to sell an investment or pay to transfer a liability in a timely transaction with an independent buyer in the principal market, or in the absence of a principal market, the most advantageous market for the investment or liability. ASC 820 establishes a three-tier hierarchy to distinguish between (1) inputs that reflect the assumptions market participants would use in valuing an asset or liability developed based on market data obtained from sources independent of the reporting entity (observable inputs) and (2) inputs that reflect the reporting entity's own assumptions about the assumptions market participants would use in valuing an asset or liability developed based on the best information available in the circumstances (unobservable inputs) and to establish classification of fair value measurements for disclosure purposes. Various inputs are used in determining the value of the Fund's investments. The inputs are summarized in the three broad levels listed below.
• Level 1 – unadjusted quoted prices in active markets for identical investments
• Level 2 – other significant observable inputs (including quoted prices for similar investments, interest rates, prepayment speeds, credit risk, etc.)
• Level 3 – significant unobservable inputs including the Fund's own assumptions in determining the fair value of investments. Factors considered in making this determination may include, but are not limited to, information obtained by contacting the issuer, analysts,
22
Morgan Stanley Institutional Fund, Inc.
Annual Report — December 31, 2017
Notes to Financial Statements (cont'd)
or the appropriate stock exchange (for exchange-traded securities), analysis of the issuer's financial statements or other available documents and, if necessary, available information concerning other securities in similar circumstances
The inputs or methodology used for valuing securities are not necessarily an indication of the risk associated with investing in those securities and the determination of the significance of a particular input to the fair value measurement in its entirety requires judgment and considers factors specific to each security.
The following is a summary of the inputs used to value the Fund's investments as of December 31, 2017.
Investment Type | | Level 1
Unadjusted
quoted
prices
(000) | | Level 2
Other
significant
observable
inputs
(000) | | Level 3
Significant
unobservable
inputs
(000) | | Total
(000) | |
Assets: | |
Common Stocks | |
Diversified | | $ | 133,210 | | | $ | 355,167 | | | $ | — | | | $ | 488,377 | | |
Health Care | | | 55,429 | | | | — | | | | — | | | | 55,429 | | |
Industrial | | | 49,649 | | | | 24,108 | | | | 208 | | | | 73,965 | | |
Industrial/Office Mixed | | | 4,748 | | | | — | | | | — | | | | 4,748 | | |
Lodging/Resorts | | | 47,257 | | | | 2,052 | | | | — | | | | 49,309 | | |
Office | | | 151,483 | | | | 101,258 | | | | — | | | | 252,741 | | |
Residential | | | 115,326 | | | | 50,563 | | | | 15 | | | | 165,904 | | |
Retail | | | 236,717 | | | | 148,049 | | | | — | | | | 384,766 | | |
Self Storage | | | 60,523 | | | | — | | | | — | | | | 60,523 | | |
Total Common Stocks | | | 854,342 | | | | 681,197 | | | | 223 | | | | 1,535,762 | | |
Short-Term Investment | |
Investment Company | | | 73,614 | | | | — | | | | — | | | | 73,614 | | |
Total Assets | | $ | 927,956 | | | $ | 681,197 | | | $ | 223 | | | $ | 1,609,376 | | |
Transfers between investment levels may occur as the markets fluctuate and/or the availability of data used in an investment's valuation changes. The Fund recognizes transfers between the levels as of the end of the period. As of December 31, 2017, securities with a total value of approximately $606,095,000 transferred from Level 1 to Level 2. Securities that were valued using unadjusted quoted prices at December 31, 2016 were valued using other significant observable inputs at December 31, 2017. At December 31, 2017, the fair value of certain securities were adjusted due to developments which occurred between the time of the close of the foreign markets on which they trade and the close of business on the NYSE which resulted in their Level 2 classification.
Following is a reconciliation of investments in which significant unobservable inputs (Level 3) were used in determining fair value.
| | | Common
Stocks
(000) | |
Beginning Balance | | $ | 952 | | |
Purchases | | | 58 | | |
Sales | |
Amortization of discount | |
Transfers in | |
Transfers out | |
Corporate actions | | | (116 | ) | |
Change in unrealized appreciation (depreciation) | | | (671 | ) | |
Realized gains (losses) | | | — | | |
Ending Balance | | $ | 223 | | |
Net change in unrealized appreciation (depreciation) from investments
still held as of December 31, 2017 | | $ | (671 | ) | |
The following table presents additional information about valuation techniques and inputs used for investments that are measured at fair value and categorized within Level 3 as of December 31, 2017. Various valuation techniques were used in the valuation of certain investments and weighted based on the level of significance.
| | | Fair Value at
December 31, 2017
(000) | | Valuation
Technique | | Unobservable
Input | | Range | | Selected
Value | | Impact to
Valuation from an
increase in input | |
Industrial | |
Common Stock
| | $ | 208
| | | Reported Capital Balance,
Adjusted for Subsequent
Capital Calls, Return of
Capital and Significant Market
Changes between last Capital
Statement and Valuation Date | | Adjusted Capital
Balance | | | | | | | | | |
Residential | |
Common Stock
| | $ | 15
| | | Market Transaction
Method | | Transaction Valuation | | $ | 0.001 | | | $ | 0.001 | | | $ | 0.001 | | | Increase | |
| | | | | | | | | | | Discount for Lack of
Marketability | | | 50.0 | % | | | 50.0 | % | | | 50.0 | % | | Decrease | |
23
Morgan Stanley Institutional Fund, Inc.
Annual Report — December 31, 2017
Notes to Financial Statements (cont'd)
3. Foreign Currency Translation and Foreign Investments: The books and records of the Fund are maintained in U.S. dollars. Foreign currency amounts are translated into U.S. dollars as follows:
– investments, other assets and liabilities at the prevailing rate of exchange on the valuation date;
– investment transactions and investment income at the prevailing rates of exchange on the dates of such transactions.
Although the net assets of the Fund are presented at the foreign exchange rates and market values at the close of the period, the Fund does not isolate that portion of the results of operations arising as a result of changes in the foreign exchange rates from the fluctuations arising from changes in the market prices of securities held at period end. Similarly, the Fund does not isolate the effect of changes in foreign exchange rates from the fluctuations arising from changes in the market prices of securities sold during the period. Accordingly, realized and unrealized foreign currency gains (losses) on investments in securities are included in the reported net realized and unrealized gains (losses) on investment transactions and balances. However, pursuant to U.S. federal income tax regulations, gains and losses from certain foreign currency transactions and the foreign currency portion of gains and losses realized on sales and maturities of foreign denominated debt securities are treated as ordinary income for U.S. federal income tax purposes.
Net realized gains (losses) on foreign currency transactions represent net foreign exchange gains (losses) from foreign currency forward exchange contracts, disposition of foreign currencies, currency gains (losses) realized between the trade and settlement dates on securities transactions, and the difference between the amount of investment income and foreign withholding taxes recorded on the Fund's books and the U.S. dollar equivalent amounts actually received or paid. Net unrealized currency gains (losses) from valuing foreign currency denominated assets and liabilities at period end exchange rates are reflected as a component of unrealized appreciation (depreciation) in the Statement of Assets and Liabilities. The change in unrealized currency gains (losses) on foreign currency translations for the period is reflected in the Statement of Operations.
Foreign security and currency transactions may involve certain considerations and risks not typically associated with those of U.S. dollar denominated transactions as a result of, among other factors, fluctuations of exchange rates in relation to the U.S. dollar, the possibility of lower levels of governmental supervision and regulation of foreign securities markets and the possibility of political or economic instability.
Governmental approval for foreign investments may be required in advance of making an investment under certain circumstances in some countries, and the extent of foreign investments in domestic companies may be subject to limitation in other countries. Foreign ownership limitations also may be imposed by the charters of individual companies to prevent, among other concerns, violations of foreign investment limitations. As a result, an additional class of shares (identified as "Foreign" in the Portfolio of Investments) may be created and offered for investment. The "local" and "foreign shares" market values may differ. In the absence of trading of the foreign shares in such markets, the Fund values the foreign shares at the closing exchange price of the local shares.
4. Unfunded Commitments: Subject to the terms of a Subscription Agreement between the Fund and Exeter Industrial Value Fund LP, the Fund has made a subscription commitment of $2,000,000 for which it will receive 2,000,000 shares of common stock. As of December 31, 2017, Exeter Industrial Value Fund LP has drawn down approximately $1,860,000 which represents 93.0% of the commitment.
5. Restricted Securities: The Fund invests in unregistered or otherwise restricted securities. The term "restricted securities" refers to securities that are unregistered or are held by control persons of the issuer and securities that are subject to contractual restrictions on their resale. As a result, restricted securities may be more difficult to value and the Fund may have difficulty disposing of such assets either in a timely manner or for a reasonable price. In order to dispose of an unregistered security, the Fund, where it has contractual rights to do so, may have to cause such security to be registered. A considerable period may elapse between the time the decision is made to sell the security and the time the security is registered so that the Fund can sell it. Contractual restrictions on the resale of securities vary in length and scope and are generally the result of a negotiation between the issuer and the acquirer of the
24
Morgan Stanley Institutional Fund, Inc.
Annual Report — December 31, 2017
Notes to Financial Statements (cont'd)
securities. The Fund would, in either case, bear market risks during that period. Restricted securities are identified in the Portfolio of Investments.
6. Indemnifications: The Company enters into contracts that contain a variety of indemnifications. The Company's maximum exposure under these arrangements is unknown. However, the Company has not had prior claims or losses pursuant to these contracts and expects the risk of loss to be remote.
7. Dividends and Distributions to Shareholders: Dividends and distributions to shareholders are recorded on the ex-dividend date. Dividends from net investment income, if any, are declared and paid annually. Net realized capital gains, if any, are distributed at least annually.
8. Security Transactions, Income and Expenses: Security transactions are accounted for on the trade date (date the order to buy or sell is executed). Realized gains and losses on the sale of investment securities are determined on the specific identified cost method. Dividend income and other distributions are recorded on the ex-dividend date (except for certain foreign dividends which may be recorded as soon as the Fund is informed of such dividends) net of applicable withholding taxes. Interest income is recognized on the accrual basis except where collection is in doubt. Discounts are accreted and premiums are amortized over the life of the respective securities. Most expenses of the Company can be directly attributed to a particular Fund. Expenses which cannot be directly attributed are apportioned among the Funds based upon relative net assets or other appropriate methods. Income, expenses (other than class specific expenses — distribution and shareholder services, transfer agency and sub transfer agency fees) and realized and unrealized gains or losses are allocated to each class of shares based upon their relative net assets.
The Fund owns shares of REITs which report information on the source of their distributions annually in the following calendar year. A portion of distributions received from REITs during the year is estimated to be a return of capital and is recorded as a reduction of their cost.
B. Advisory/Sub-Advisory Fees: The Adviser, a wholly-owned subsidiary of Morgan Stanley, provides the Fund with advisory services under the terms of an Investment
Advisory Agreement, paid quarterly, at the annual rate based on the daily net assets as follows:
First $2
billion | | Over $2
billion | |
| | 0.85 | % | | | 0.80 | % | |
For the year ended December 31, 2017, the advisory fee rate (net of rebate) was equivalent to an annual effective rate of 0.85% of the Fund's average daily net assets.
The Adviser has agreed to reduce its advisory fee and/or reimburse the Fund so that total annual portfolio operating expenses, excluding certain investment related expenses, taxes, interest and other extraordinary expenses (including litigation), will not exceed 1.05% for Class I shares, 1.40% for Class A shares, 1.90% for Class L shares, 2.15% for Class C shares and 0.99% for Class IS shares. The fee waivers and/or expense reimbursements will continue for at least one year from the date of the Fund's prospectus or until such time that the Directors act to discontinue all or a portion of such waivers or reimbursements when they deem such action is appropriate. For the year ended December 31, 2017, approximately $112,000 of other expenses were reimbursed by the Adviser pursuant to this arrangement.
The Adviser has entered into Sub-Advisory Agreements with the Sub-Advisers, each a wholly-owned subsidiary of Morgan Stanley. The Sub-Advisers provide the Fund with advisory services subject to the overall supervision of the Adviser and the Company's Officers and Directors. The Adviser pays the Sub-Advisers on a monthly basis a portion of the net advisory fees the Adviser receives from the Fund.
C. Administration Fees: The Adviser also serves as Administrator to the Company and provides administrative services pursuant to an Administration Agreement for an annual fee, accrued daily and paid monthly, of 0.08% of the Fund's average daily net assets.
Under a Sub-Administration Agreement between the Administrator and State Street Bank and Trust Company ("State Street"), State Street provides certain administrative services to the Company. For such services, the Administrator pays State Street a portion of the fee the Administrator receives from the Fund.
D. Distribution and Shareholder Services Fees: Morgan Stanley Distribution, Inc. ("MSDI" or the "Distributor"), a wholly-owned subsidiary of the Adviser and an indirect subsidiary of Morgan Stanley, serves as the Company's Distributor of Fund shares pursuant to a Distribution Agreement. The Company has adopted a Shareholder Services Plan with
25
Morgan Stanley Institutional Fund, Inc.
Annual Report — December 31, 2017
Notes to Financial Statements (cont'd)
respect to Class A shares pursuant to Rule 12b-1 under the Act. Under the Shareholder Services Plan, the Fund pays the Distributor a shareholder services fee, accrued daily and paid monthly, at an annual rate of 0.25% of the Fund's average daily net assets attributable to Class A shares.
The Company has adopted a Distribution and Shareholder Services Plan with respect to Class L shares pursuant to Rule 12b-1 under the Act. Under the Distribution and Shareholder Services Plan, the Fund pays the Distributor a distribution fee, accrued daily and paid monthly, at an annual rate of 0.50% and a shareholder services fee, accrued daily and paid monthly, at an annual rate of 0.25% of the Fund's average daily net assets attributable to Class L shares.
The Company has adopted a Distribution and Shareholder Services Plan with respect to Class C shares pursuant to Rule 12b-1 under the Act. Under the Distribution and Shareholder Services Plan, the Fund pays the Distributor a distribution fee, accrued daily and paid monthly, at an annual rate of 0.75% and a shareholder services fee, accrued daily and paid monthly, at an annual rate of 0.25% of the Fund's average daily net assets attributable to Class C shares.
The distribution and shareholder services fees are used to support the expenses associated with servicing and maintaining accounts. The Distributor may compensate other parties for providing shareholder support services to investors who purchase Class A, Class L and Class C shares.
E. Dividend Disbursing and Transfer Agent: The Company's dividend disbursing and transfer agent is Boston Financial Data Services, Inc. ("BFDS"). Pursuant to a Transfer Agency Agreement, the Company pays BFDS a fee based on the number of classes, accounts and transactions relating to the Funds of the Company. Effective January 1, 2018, BFDS changed its name to DST Asset Manager Solutions, Inc.
F. Custodian Fees: State Street (the "Custodian") also serves as Custodian for the Company in accordance with a Custodian Agreement. The Custodian holds cash, securities, and other assets of the Company as required by the Act. Custody fees are payable monthly based on assets held in custody, investment purchases and sales activity and account maintenance fees, plus reimbursement for certain out-of-pocket expenses.
G. Security Transactions and Transactions with Affiliates: For the year ended December 31, 2017, purchases and sales of investment securities for the Fund, other than
long-term U.S. Government securities and short-term investments, were approximately $598,487,000 and $964,558,000, respectively. There were no purchases and sales of long-term U.S. Government securities for the year ended December 31, 2017.
The Fund invests in the Institutional Class of the Morgan Stanley Institutional Liquidity Funds — Treasury Portfolio (the "Liquidity Funds"), an open-end management investment company managed by the Adviser. Advisory fees paid by the Fund are reduced by an amount equal to its pro-rata share of the advisory and administration fees paid by the Fund due to its investment in the Liquidity Funds. For the year ended December 31, 2017, advisory fees paid were reduced by approximately $32,000 relating to the Fund's investment in the Liquidity Funds.
A summary of the Fund's transactions in shares of the Liquidity Funds during the year ended December 31, 2017 is as follows:
Affiliated
Investment
Company | | Value
December 31,
2016
(000) | | Purchases
at Cost
(000) | | Proceeds
from Sales
(000) | | Dividend
Income
(000) | |
Liquidity Funds | | $ | 5,762 | | | $ | 476,574 | | | $ | 408,722 | | | $ | 160 | | |
Affiliated
Investment
Company (cont'd) | | Realized
Gain
(Loss)
(000) | | Change in
Unrealized
Appreciation
(Depreciation)
(000) | | Value
December 31,
2017
(000) | |
Liquidity Funds | | $ | — | | | $ | — | | | $ | 73,614 | | |
The Fund is permitted to purchase and sell securities ("cross-trade") from and to other Morgan Stanley Funds as well as other funds and client accounts for which the Adviser or an affiliate of the Adviser serves as investment adviser, pursuant to procedures approved by the Directors in compliance with Rule 17a-7 under the Act (the "Rule"). Each cross-trade is executed at the current market price in compliance with provisions of the Rule. For the year ended December 31, 2017, the Fund did not engage in any cross-trade transactions.
The Fund has an unfunded Deferred Compensation Plan (the "Compensation Plan"), which allows each independent Director to defer payment of all, or a portion, of the fees he or she receives for serving on the Board of Directors. Each eligible Director generally may elect to have the deferred amounts credited with a return equal to the total return on one or more of the Morgan Stanley funds that are offered as investment options under the Compensation Plan. Appreciation/depreciation and distributions received from these investments are recorded with an
26
Morgan Stanley Institutional Fund, Inc.
Annual Report — December 31, 2017
Notes to Financial Statements (cont'd)
offsetting increase/decrease in the deferred compensation obligation and do not affect the NAV of the Fund.
H. Federal Income Taxes: It is the Fund's intention to continue to qualify as a regulated investment company and distribute all of its taxable and tax-exempt income. Accordingly, no provision for federal income taxes is required in the financial statements.
The Fund may be subject to taxes imposed by countries in which it invests. Such taxes are generally based on income and/or capital gains earned or repatriated. Taxes are accrued based on net investment income, net realized gains and net unrealized appreciation as such income and/or gains are earned. Taxes may also be based on transactions in foreign currency and are accrued based on the value of investments denominated in such currency.
FASB ASC 740-10, "Income Taxes — Overall", sets forth a minimum threshold for financial statement recognition of the benefit of a tax position taken or expected to be taken in a tax return. Management has concluded there are no significant uncertain tax positions that would require recognition in the financial statements. If applicable, the Fund recognizes interest accrued related to unrecognized tax benefits in "Interest Expense" and penalties in "Other Expenses" in the Statement of Operations. The Fund files tax returns with the U.S. Internal Revenue Service, New York and various states. Generally, each of the tax years in the four-year period ended December 31, 2017, remains subject to examination by taxing authorities.
The tax character of distributions paid may differ from the character of distributions shown in the Statements of Changes in Net Assets due to short-term capital gains being treated as ordinary income for tax purposes. The tax character of distributions paid during fiscal years 2017 and 2016 was as follows:
2017
Distributions
Paid From: | | 2016
Distributions
Paid From: | |
Ordinary
Income
(000) | | Long-Term
Capital Gain
(000) | | Ordinary
Income
(000) | | Long-Term
Capital Gain
(000) | | Paid-in-
Capital
(000) | |
| $ | 23,486 | | | $ | 69,001 | | | $ | 58,027 | | | $ | 7,165 | | | $ | 2,808 | | |
The amount and character of income and gains to be distributed are determined in accordance with income tax regulations which may differ from GAAP. These book/tax differences are either considered temporary or permanent in nature.
Temporary differences are primarily due to differing book and tax treatments for the timing of the recognition of gains (losses) on certain investment transactions and the timing of the deductibility of certain expenses.
Permanent differences, primarily due to differing treatments of gains (losses) related to foreign currency transactions, REIT adjustments and basis adjustments on certain equity securities designated as passive foreign investment companies, resulted in the following reclassifications among the components of net assets at December 31, 2017:
Distributions
in Excess of Net
Investment
Income
(000) | | Distributions
in Excess of
Net Realized
Gain
(000) | | Paid-in-
Capital
(000) | |
| $ | 10,292 | | | $ | (7,738 | ) | | $ | (2,554 | ) | |
At December 31, 2017, the components of distributable earnings for the Fund on a tax basis were as follows:
Undistributed
Ordinary
Income
(000) | | Undistributed
Long-Term
Capital Gain
(000) | |
| $ | 20,525 | | | $ | 1,899 | | |
I. Credit Facility: The Company and other Morgan Stanley funds participated in a $150,000,000 committed, unsecured revolving line of credit facility (the "Facility") with State Street. This Facility is to be used for temporary emergency purposes or funding of shareholder redemption requests. The interest rate on borrowings is based on the federal funds rate or 1 month LIBOR rate plus a spread. The Facility also has a commitment fee of 0.25% per annum based on the unused portion of the Facility. During the year ended December 31, 2017, the Fund did not have any borrowings under the Facility.
J. Other: At December 31, 2017, the Fund had record owners of 10% or greater. Investment activities of these shareholders could have a material impact on the Fund. The aggregate percentage of such owners was 10.2%.
27
Morgan Stanley Institutional Fund, Inc.
Annual Report — December 31, 2017
Report of Independent Registered Public Accounting Firm
To the Shareholders and Board of Directors of
Morgan Stanley Institutional Fund, Inc. —
Global Real Estate Portfolio
Opinion on the Financial Statements
We have audited the accompanying statement of assets and liabilities of Global Real Estate Portfolio (the "Fund") (one of the funds constituting the Morgan Stanley Institutional Fund, Inc. (the "Company")), including the portfolio of investments, as of December 31, 2017, and the related statement of operations for the year then ended, the statements of changes in net assets for each of the two years in the period then ended, the financial highlights for each of the five years in the period then ended and the related notes (collectively referred to as the "financial statements"). In our opinion, the financial statements present fairly, in all material respects, the financial position of Global Real Estate Portfolio (one of the funds constituting Morgan Stanley Institutional Fund, Inc.) at December 31, 2017, the results of its operations for the year then ended, the changes in its net assets for each of the two years in the period then ended and its financial highlights for each of the five years in the period then ended, in conformity with U.S. generally accepted accounting principles.
Basis for Opinion
These financial statements are the responsibility of the Company's management. Our responsibility is to express an opinion on the Fund's financial statements based on our audits. We are a public accounting firm registered with the Public Company Accounting Oversight Board (United States) ("PCAOB") and are required to be independent with respect to the Company in accordance with the U.S. federal securities law and the applicable rules and regulations of the Securities and Exchange Commission and the PCAOB.
We conducted our audits in accordance with the standards of the PCAOB. Those standards require that we plan and perform the audit to obtain reasonable assurance about whether the financial statements are free of material misstatement, whether due to error or fraud. The Company is not required to have, nor were we engaged to perform, an audit of the Company's internal control over financial reporting. As part of our audits, we are required to obtain an understanding of internal control over financial reporting, but not for the purpose of expressing an opinion on the effectiveness of the Company's internal control over financial reporting. Accordingly, we express no such opinion.
Our audits included performing procedures to assess the risks of material misstatement of the financial statements, whether due to error or fraud, and performing procedures that respond to those risks. Such procedures included examining, on a test basis, evidence regarding the amounts and disclosures in the financial statements. Our procedures included confirmation of securities owned as of December 31, 2017 by correspondence with the custodian and others or by other appropriate auditing procedures where replies from others were not received. Our audits also included evaluating the accounting principles used and significant estimates made by management, as well as evaluating the overall presentation of the financial statements. We believe that our audits provide a reasonable basis for our opinion.

We have served as the auditor of one or more Morgan Stanley investment companies since 2000.
Boston, Massachusetts
February 26, 2018
28
Morgan Stanley Institutional Fund, Inc.
Annual Report — December 31, 2017
Federal Tax Notice (unaudited)
For federal income tax purposes, the following information is furnished with respect to the distributions paid by the Fund during its taxable year ended December 31, 2017. For corporate shareholders, 0.2% of the dividends qualified for the dividends received deduction.
The Fund designated and paid approximately $69,001,000 as a long-term capital gain distribution.
For federal income tax purposes, the following information is furnished with respect to the Fund's earnings for its taxable year ended December 31, 2017. When distributed, certain earnings may be subject to a maximum tax rate of 15% as provided for by the Jobs and Growth Tax Relief Reconciliation Act of 2003. The Fund designated up to a maximum of approximately $12,694,000 as taxable at this lower rate.
In January, the Fund provides tax information to shareholders for the preceding calendar year.
29
Morgan Stanley Institutional Fund, Inc.
Annual Report — December 31, 2017
Privacy Notice (unaudited)
MORGAN STANLEY INVESTMENT MANAGEMENT INC.
AN IMPORTANT NOTICE CONCERNING OUR U.S. PRIVACY POLICY
We are required by federal law to provide you with a copy of our privacy policy annually. This policy applies to current and former individual investors in funds managed or sponsored by Morgan Stanley Investment Management Inc. ("MSIM") as well as current and former individual clients of MSIM. This policy is not applicable to partnerships, corporations, trusts or other non-individual clients or investors. Please note that we may amend this policy at any time, and will inform you of any changes as required by law.
WE RESPECT YOUR PRIVACY
We appreciate that you have provided us with your personal financial information. We strive to maintain the privacy of such information while we help you achieve your financial objectives. This Notice describes what non-public personal information we collect about you, why we collect it, when we may share it with others and how certain others may use it. It discusses the steps you may take to limit our sharing of certain information about you to affiliated companies in the Morgan Stanley family of companies ("other Morgan Stanley companies"). It also discloses how you may limit use of certain shared information for marketing purposes by other Morgan Stanley branded companies. Throughout this policy, we refer to the non-public information that personally identifies you or your accounts as "personal information."
1. WHAT PERSONAL INFORMATION DO WE COLLECT ABOUT YOU?
We obtain personal information from applications and other forms you submit to us, from your dealings with us, from consumer reporting agencies, from our Web sites and from third parties and other sources.
For example:
• We may collect information such as your name, address, e-mail address, telephone/fax numbers, assets, income and investment objectives through subscription documents, applications and other forms you submit to us.
• We may obtain information about account balances, your use of account(s) and the types of products and services you prefer to receive from us through your dealings and transactions with us and other sources.
• We may obtain information about your creditworthiness and credit history from consumer reporting agencies.
• We may collect background information from and through third-party vendors to verify representations you have made and to comply with various regulatory requirements.
• If you interact with us through our public and private Web sites, we may collect information that you provide directly through online communications (such as an e-mail address). We may also collect information about your Internet service provider, your domain name, your computer's operating system and Web browser, your use of our Web sites and your product and service preferences, through the use of "cookies." Please consult the Terms of Use of these sites for more details.
2. WHEN DO WE DISCLOSE PERSONAL INFORMATION WE COLLECT ABOUT YOU?
We may disclose personal information we collect about you to other Morgan Stanley companies and to non-affiliated third parties.
a. Information We Disclose to Other Morgan Stanley Companies.
We may disclose personal information to other Morgan Stanley companies for a variety of reasons, including to manage your account(s) effectively, to service and process your transactions, to let you know about products and services offered by us and other Morgan Stanley companies, to manage our business, and as otherwise required or permitted by law. Offers for products and services from other Morgan Stanley companies are developed under conditions designed to safeguard your personal information.
30
Morgan Stanley Institutional Fund, Inc.
Annual Report — December 31, 2017
Privacy Notice (unaudited) (cont'd)
b. Information We Disclose to Non-affiliated Third Parties.
We do not disclose personal information that we collect about you to non-affiliated third parties except to those who provide marketing services on our behalf, to financial institutions with whom we have joint marketing agreements, and as otherwise required or permitted by law. For example, we may disclose personal information to non-affiliated third parties for servicing and processing transactions, to offer our own products and services, to protect against fraud, for institutional risk control, to respond to judicial process or to perform services on our behalf. When we share personal information with a non-affiliated third party, they are required to limit their use of personal information to the particular purpose for which it was shared and they are not allowed to share personal information with others except to fulfill that limited purpose or as may be permitted or required by law.
3. HOW DO WE PROTECT THE SECURITY AND CONFIDENTIALITY OF PERSONAL INFORMATION WE COLLECT ABOUT YOU?
We maintain physical, electronic and procedural security measures to help safeguard the personal information we collect about you. We have internal policies governing the proper handling of client information. Third parties that provide support or marketing services on our behalf may also receive personal information, and we require them to adhere to confidentiality standards with respect to such information.
4. HOW CAN YOU LIMIT THE SHARING OF CERTAIN TYPES OF PERSONAL INFORMATION WITH OTHER MORGAN STANLEY COMPANIES?
We offer you choices as to whether we share with other Morgan Stanley companies the personal information that was collected to determine your eligibility for products and services you request ("eligibility information"). Eligibility information does not include your identification information or personal information pertaining to our transactions or experiences with you. Please note that, even if you direct us not to share eligibility information with other Morgan Stanley companies ("opt-out"), we may still share personal information, including eligibility information, with those companies in circumstances excluded from the opt-out under applicable law, such as to process transactions or to service your account.
5. HOW CAN YOU LIMIT THE USE OF CERTAIN TYPES OF PERSONAL INFORMATION BY OTHER MORGAN STANLEY COMPANIES FOR MARKETING?
By following the opt-out instructions in Section 6 below, you may limit other Morgan Stanley branded companies from marketing their products or services to you based on personal information we disclose to them. This information may include, for example, your income and account history with us. Please note that, even if you choose to limit Other Morgan Stanley Companies from using personal information about you that we may share with them for marketing their products and services to you, Other Morgan Stanley Companies may use your personal information that they obtain from us to market to you in circumstances permitted by law, such as if the Other Morgan Stanley Company has its own relationship with you.
6. HOW CAN YOU SEND US AN OPT-OUT INSTRUCTION?
If you wish to limit our sharing of eligibility information about you with other Morgan Stanley companies or other Morgan Stanley companies' use of personal information for marketing purposes, as described in this notice, you may do so by:
• Calling us at (800) 548-7786
Monday–Friday between 8a.m. and 6p.m.(EST)
• Writing to us at the following address:
DST Asset Manager Solutions, Inc.
c/o Privacy Coordinator
P.O. Box 219804
Kansas City, Missouri 64121
31
Morgan Stanley Institutional Fund, Inc.
Annual Report — December 31, 2017
Privacy Notice (unaudited) (cont'd)
Your written request should include your name, address, telephone number and account number(s) to which the opt-out applies and whether you are opting out with respect to sharing of eligibility information (Section 4 above), or if information used for Marketing (Section 5 above) or both. Written opt-out requests should not be sent with any other correspondence. In order to process your request, we require that the request be provided by you directly and not through a third party.
Your opt-out preference will remain in effect with respect to this policy (as it may be amended) until you notify us otherwise. If you have a joint account, your direction for us not to share this information with other Morgan Stanley companies and for those other Morgan Stanley companies not to use your personal information for marketing will be applied to all account holders on that account. Please understand that if you limit our sharing or our affiliated companies' use of personal information, you and any joint account holder(s) may not receive information about Morgan Stanley products and services, including products or services that could help you manage your financial resources and achieve your investment objectives.
7. WHAT IF AN AFFILIATED COMPANY BECOMES A NON-AFFILIATED THIRD PARTY?
If, at any time in the future, an affiliated company becomes a non-affiliated third party, further disclosures of personal information made to the former affiliated company will be limited to those described in Section 2(b) above relating to non-affiliated third parties. If you elected under Section 6 to limit disclosures we make to affiliated companies, or use of personal information by affiliated companies, your election will not apply to use by any former affiliated company of your personal information in their possession once it becomes a non-affiliated third party.
SPECIAL NOTICE TO RESIDENTS OF VERMONT
The following section supplements our policy with respect to our individual clients who have a Vermont address and supersedes anything to the contrary in the above policy with respect to those clients only.
The state of Vermont requires financial institutions to obtain your consent prior to sharing personal information that they collect about you with affiliated companies and non-affiliated third parties other than in certain limited circumstances. Except as permitted by law, we will not share personal information we collect about you with non-affiliated third parties or other Morgan Stanley companies unless you provide us with your written consent to share such information ("opt-in").
If you wish to receive offers for investment products and services offered by or through other Morgan Stanley companies, please notify us in writing at the following address:
DST Asset Manager Solutions, Inc.
c/o Privacy Coordinator
P.O. Box 219804
Kansas City, Missouri 64121
Your authorization should include your name, address, telephone number and account number(s) to which the opt-in applies and should not be sent with any other correspondence. In order to process your authorization, we require that the authorization be provided by you directly and not through a third party.
SPECIAL NOTICE TO RESIDENTS OF CALIFORNIA
The following section supplements our policy with respect to our individual clients who have a California address and supersedes anything to the contrary in the above policy with respect to those clients only.
In response to a California law, if your account has a California home address, your personal information will not be disclosed to non-affiliated third parties except as permitted by applicable California law, and we will limit sharing such information with our affiliates to comply with California privacy laws that apply to us.
32
Morgan Stanley Institutional Fund, Inc.
Annual Report — December 31, 2017
Director and Officer Information (unaudited)
Independent Directors:
Name, Age and Address of
Independent Director | | Position(s)
Held with
Registrant | | Length of Time
Served* | | Principal Occupation(s) During Past 5 Years
and Other Relevant Professional Experience | | Number of
Portfolios in
Fund Complex
Overseen by
Independent
Director** | | Other Directorships
Held by Independent
Director*** | |
Frank L. Bowman (73)
c/o Perkins Coie LLP
Counsel to the Independent
Directors
30 Rockefeller Plaza
New York, NY 10112 | | Director | | Since
August
2006 | | President, Strategic Decisions, LLC (consulting) (since February 2009); Director or Trustee of various Morgan Stanley Funds (since August 2006); Chairperson of the Compliance and Insurance Committee (since October 2015); formerly, Chairperson of the Insurance Sub-Committee of the Compliance and Insurance Committee (2007-2015); served as President and Chief Executive Officer of the Nuclear Energy Institute (policy organization) (February 2005-November 2008); retired as Admiral, U.S. Navy after serving over 38 years on active duty including 8 years as Director of the Naval Nuclear Propulsion Program in the Department of the Navy and the U.S. Department of Energy (1996-2004); served as Chief of Naval Personnel (July 1994-September 1996) and on the Joint Staff as Director of Political Military Affairs (June 1992-July 1994); knighted as Honorary Knight Commander of the Most Excellent Order of the British Empire; awarded the Officier de l'Orde National du Mérite by the French Government; elected to the National Academy of Engineering (2009). | | | 88 | | | Director of BP p.l.c.; Director of Naval and Nuclear Technologies LLP; Director Emeritus of the Armed Services YMCA; Director of the U.S. Naval Submarine League; Member of the National Security Advisory Council of the Center for U.S. Global Engagement and a member of the CNA Military Advisory Board; Trustee of Fairhaven United Methodist Church; and Director of other various non-profit organizations. | |
Kathleen A. Dennis (64)
c/o Perkins Coie LLP
Counsel to the Independent Directors
30 Rockefeller Plaza
New York, NY 10112 | | Director | | Since
August
2006 | | President, Cedarwood Associates (mutual fund and investment management consulting) (since July 2006); Chairperson of the Liquidity and Alternatives Sub-Committee of the Investment Committee (since October 2006) and Director or Trustee of various Morgan Stanley Funds (since August 2006); formerly, Senior Managing Director of Victory Capital Management (1993-2006). | | | 89 | | | Director of various non-profit organizations. | |
Nancy C. Everett (62)
c/o Perkins Coie LLP
Counsel to the Independent Directors
30 Rockefeller Plaza
New York, NY 10112 | | Director | | Since
January
2015 | | Chief Executive Officer, Virginia Commonwealth University Investment Company (since November 2015); Owner, OBIR, LLC (institutional investment management consulting) (since June 2014); formerly, Managing Director, BlackRock Inc. (February 2011-December 2013); and Chief Executive Officer, General Motors Asset Management (a/k/a Promark Global Advisors, Inc.) (June 2005-May 2010). | | | 90 | | | Formerly, Member of Virginia Commonwealth University School of Business Foundation (2005-2016); Member of Virginia Commonwealth University Board of Visitors (2013-2015); Member of Committee on Directors for Emerging Markets Growth Fund, Inc. (2007-2010); Chairperson of Performance Equity Management, LLC (2006-2010); and Chairperson, GMAM Absolute Return Strategies Fund, LLC (2006-2010). | |
33
Morgan Stanley Institutional Fund, Inc.
Annual Report — December 31, 2017
Director and Officer Information (unaudited) (cont'd)
Independent Directors: (cont'd)
Name, Age and Address of
Independent Director | | Position(s)
Held with
Registrant | | Length of Time
Served* | | Principal Occupation(s) During Past 5 Years
and Other Relevant Professional Experience | | Number of
Portfolios in
Fund Complex
Overseen by
Independent
Director** | | Other Directorships
Held by Independent
Director*** | |
Jakki L. Haussler (60)
c/o Perkins Coie LLP
Counsel to the Independent Directors
30 Rockefeller Plaza
New York, NY 10112 | | Director | | Since
January
2015 | | Chairman and Chief Executive Officer, Opus Capital Group (since January 1996); formerly, Director, Capvest Venture Fund, LP (May 2000-December 2011); Partner, Adena Ventures, LP (July 1999-December 2010); Director, The Victory Funds (February 2005-July 2008). | | | 90 | | | Director of Cincinnati Bell Inc. and Member, Audit Committee and Compensation Committee; Director of Northern Kentucky University Foundation and Member, Investment Committee; Member of Chase College of Law Transactional Law Practice Center Board of Advisors; Director of Best Transport; Director of Chase College of Law Board of Visitors; formerly, Member, University of Cincinnati Foundation Investment Committee; Member, Miami University Board of Visitors (2008-2011); Trustee of Victory Funds (2005-2008) and Chairman, Investment Committee (2007-2008) and Member, Service Provider Committee (2005-2008). | |
Dr. Manuel H. Johnson (68)
c/o Johnson Smick
International, Inc.
220 I Street, NE — Suite 200
Washington, D.C. 20002 | | Director | | Since
July
1991 | | Senior Partner, Johnson Smick International, Inc. (consulting firm); Chairperson of the Investment Committee (since October 2006) and Director or Trustee of various Morgan Stanley Funds (since July 1991); Co-Chairman and a founder of the Group of Seven Council (G7C) (international economic commission); formerly, Chairperson of the Audit Committee (July 1991-September 2006), Vice Chairman of the Board of Governors of the Federal Reserve System and Assistant Secretary of the U.S. Treasury. | | | 88 | | | Director of NVR, Inc. (home construction). | |
Joseph J. Kearns (75)
c/o Kearns & Associates LLC
46 E Peninsula Center #385
Rolling Hills Estates, CA
90274-3712 | | Director | | Since
August
1994 | | Senior Adviser, Kearns & Associates LLC (investment consulting); Chairperson of the Audit Committee (since October 2006) and Director or Trustee of various Morgan Stanley Funds (since August 1994); formerly, Deputy Chairperson of the Audit Committee (July 2003-September 2006) and Chairperson of the Audit Committee of various Morgan Stanley Funds (since August 1994); CFO of the J. Paul Getty Trust. | | | 89 | | | Prior to August 10, 2016, Director of Electro Rent Corporation (equipment leasing); Prior to December 31, 2013, Director of The Ford Family Foundation. | |
34
Morgan Stanley Institutional Fund, Inc.
Annual Report — December 31, 2017
Director and Officer Information (unaudited) (cont'd)
Independent Directors: (cont'd)
Name, Age and Address of
Independent Director | | Position(s)
Held with
Registrant | | Length of Time
Served* | | Principal Occupation(s) During Past 5 Years
and Other Relevant Professional Experience | | Number of
Portfolios in
Fund Complex
Overseen by
Independent
Director** | | Other Directorships
Held by Independent
Director*** | |
Michael F. Klein (59)
c/o Perkins Coie LLP
Counsel to the Independent Directors
30 Rockefeller Plaza
New York, NY 10112 | | Director | | Since
August
2006 | | Managing Director, Aetos Capital, LLC (since March 2000); Co-President, Aetos Alternatives Management, LLC (since January 2004) and Co-Chief Executive Officer of Aetos Capital LLC (since August 2013); Chairperson of the Fixed Income Sub-Committee of the Investment Committee (since October 2006) and Director or Trustee of various Morgan Stanley Funds (since August 2006); formerly, Managing Director, Morgan Stanley & Co. Inc. and Morgan Stanley Dean Witter Investment Management, President, various Morgan Stanley Funds (June 1998-March 2000) and Principal, Morgan Stanley & Co. Inc. and Morgan Stanley Dean Witter Investment Management (August 1997-December 1999). | | | 88 | | | Director of certain investment funds managed or sponsored by Aetos Capital, LLC; Director of Sanitized AG and Sanitized Marketing AG (specialty chemicals). | |
Patricia Maleski (57)
c/o Perkins Coie LLP
Counsel to the Independent Directors
30 Rockefeller Plaza
New York, NY 10112 | | Director | | Since
January
2017 | | Managing Director, JPMorgan Asset Management (2004-2016); Oversight and Control Head of Fiduciary and Conflicts of Interest Program (2015-2016); Chief Control Officer-Global Asset Management (2013-2015); President, JPMorgan Funds (2010-2013); Chief Administrative Officer (2004-2013); various other positions including Treasurer and Board Liaison (since 2001). | | | 90 | | | None. | |
Michael E. Nugent (81)
522 Fifth Avenue
New York, NY 10036 | | Chair of the Board and Director | | Chair of the Boards since July 2006 and Director since July 1991 | | Chair of the Boards of various Morgan Stanley Funds (since July 2006); Chairperson of the Closed-End Fund Committee (since June 2012) and Director or Trustee of various Morgan Stanley Funds (since July 1991); formerly, Chairperson of the Insurance Committee (until July 2006); General Partner, Triumph Capital, L.P. (private investment partnership) (1988-2013). | | | 88 | | | None. | |
W. Allen Reed (70)
c/o Perkins Coie LLP
Counsel to the Independent Directors
30 Rockefeller Plaza
New York, NY 10112 | | Director | | Since
August
2006 | | Chairperson of the Equity Sub-Committee of the Investment Committee (since October 2006) and Director or Trustee of various Morgan Stanley Funds (since August 2006); formerly, President and CEO of General Motors Asset Management; Chairman and Chief Executive Officer of the GM Trust Bank and Corporate Vice President of General Motors Corporation (August 1994-December 2005). | | | 89 | | | Director of Legg Mason, Inc.; formerly, Director of the Auburn University Foundation (2010-2015). | |
Fergus Reid (85)
c/o Joe Pietryka, Inc.
85 Charles Colman Blvd.
Pawling, NY 12564 | | Director | | Since
June
1992 | | Chairman, Joe Pietryka, Inc.; Chairperson of the Governance Committee and Director or Trustee of various Morgan Stanley Funds (since June 1992). | | | 89 | | | Formerly, Trustee and Director of certain investment companies in the JP Morgan Fund Complex managed by JP Morgan Investment Management Inc. (1987-2012). | |
* This is the earliest date the Director began serving the Morgan Stanley Funds. Each Director serves an indefinite term, until his or her successor is elected.
** The Fund Complex includes (as of December 31, 2017) all open-end and closed-end funds (including all of their portfolios) advised by Morgan Stanley Investment Management Inc. (the "Adviser") and any funds that have an adviser that is an affiliated person of the Adviser (including, but not limited to, Morgan Stanley AIP GP LP).
*** This includes any directorships at public companies and registered investment companies held by the Director at any time during the past five years.
35
Morgan Stanley Institutional Fund, Inc.
Annual Report — December 31, 2017
Director and Officer Information (unaudited) (cont'd)
Executive Officers:
Name, Age and Address of Executive Officer | | Position(s) Held
with
Registrant | | Length of Time
Served* | | Principal Occupation(s) During Past 5 Years | |
John H. Gernon (54)
522 Fifth Avenue
New York, NY 10036 | | President and Principal Executive Officer | | Since
September
2013 | | President and Principal Executive Officer of the Equity and Fixed Income Funds and the Morgan Stanley AIP Funds (since September 2013) and the Liquidity Funds and various money market funds (since May 2014) in the Fund Complex; Managing Director of the Adviser; Head of Product (since 2006). | |
Timothy J. Knierim (58)
522 Fifth Avenue
New York, NY 10036 | | Chief Compliance Officer | | Since
December
2016 | | Managing Director of the Adviser and various entities affiliated with the Adviser; Chief Compliance Officer of various Morgan Stanley Funds and the Adviser (since December 2016) and Chief Compliance Officer of Morgan Stanley AIP GP LP (since 2014). Formerly, Managing Director and Deputy Chief Compliance Officer of the Adviser (2014-2016); and formerly, Chief Compliance Officer of Prudential Investment Management, Inc. (2007-2014). | |
Francis J. Smith (52)
522 Fifth Avenue
New York, NY 10036 | | Treasurer and Principal Financial Officer | | Treasurer since July 2003 and Principal Financial Officer since September 2002 | | Managing Director of the Adviser and various entities affiliated with the Adviser; Treasurer (since July 2003) and Principal Financial Officer of various Morgan Stanley Funds (since September 2002). | |
Mary E. Mullin (50)
522 Fifth Avenue
New York, NY 10036 | | Secretary | | Since
June
1999 | | Managing Director of the Adviser; Secretary of various Morgan Stanley Funds (since June 1999). | |
Michael J. Key (38)
522 Fifth Avenue
New York, NY 10036 | | Vice President | | Since
June
2017 | | Vice President of the Equity and Fixed Income Funds, Liquidity Funds, various money market funds and the Morgan Stanley AIP Funds in the Fund Complex (since June 2017); Executive Director of the Adviser; Head of Product Development for Equity and Fixed Income Funds (since August 2013). | |
* This is the earliest date the officer began serving the Morgan Stanley Funds. Each officer serves a one-year term, until his or her successor is elected and qualifies.
36
Morgan Stanley Institutional Fund, Inc.
Annual Report — December 31, 2017
Adviser and Administrator
Morgan Stanley Investment Management Inc.
522 Fifth Avenue
New York, New York 10036
Sub-Advisers
Morgan Stanley Investment Management Limited
25 Cabot Square, Canary Wharf
London, E14 4QA, England
Morgan Stanley Investment Management Company
23 Church Street
16-01 Capital Square, Singapore 049481
Distributor
Morgan Stanley Distribution, Inc.
522 Fifth Avenue
New York, New York 10036
Dividend Disbursing and Transfer Agent
DST Asset Manager Solutions, Inc.
2000 Crown Colony Drive
Quincy, Massachusetts 02169
Custodian
State Street Bank and Trust Company
One Lincoln Street
Boston, Massachusetts 02111
Legal Counsel
Dechert LLP
1095 Avenue of the Americas
New York, New York 10036
Counsel to the Independent Directors
Perkins Coie LLP
30 Rockefeller Plaza
New York, New York 10112
Independent Registered Public Accounting Firm
Ernst & Young LLP
200 Clarendon Street
Boston, Massachusetts 02116
Reporting to Shareholders
Each Morgan Stanley Fund provides a complete schedule of portfolio holdings in its semi-annual and annual reports within 60 days of the end of the fund's second and fourth fiscal quarters. The semi-annual and annual reports are filed electronically with the Securities and Exchange Commission (SEC) on Form N-CSRS and Form N-CSR, respectively. Morgan Stanley also delivers the semi-annual and annual reports to fund shareholders and makes these reports available on its public website, www.morganstanley.com/im. Each Morgan Stanley fund also files a complete schedule of portfolio holdings with the SEC for the fund's first and third fiscal quarters on Form N-Q. Morgan Stanley does not deliver the reports for the first and third fiscal quarters to shareholders, nor are the reports posted to the Morgan Stanley public website. You may, however, obtain the Form N-Q filings (as well as the Form N-CSR and N-CSRS filings) by accessing the SEC's website, www.sec.gov. You may also review and copy them at the SEC's Public Reference Room in Washington, DC. Information on the operation of the SEC's Public Reference Room may be obtained by calling the SEC toll free at 1 (800) SEC-0330. You can also request copies of these materials, upon payment of a duplicating fee, by electronic request at the SEC's email address (publicinfo@sec.gov) or by writing to the SEC's Public Reference Section, Washington, D.C. 20549-1520.
Proxy Voting Policies and Procedures and Proxy Voting Record
You may obtain a copy of the Company's Proxy Voting Policy and Procedures and information regarding how the Company voted proxies relating to portfolio securities during the most recent twelve-month period ended June 30, without charge, upon request, by calling toll free 1 (800) 548-7786 or by visiting our website at www.morganstanley.com/im. This information is also available on the SEC's website at www.sec.gov.
This report is authorized for distribution only when preceded or accompanied by a prospectus or summary prospectus of the applicable Fund of Morgan Stanley Institutional Fund, Inc., which describes in detail the Fund's investment policies, risks, fees and expenses. Please read the prospectus carefully before you invest or send money. For additional information, including information regarding the investments comprising the Fund, please visit our website at www.morganstanley.com/im or call toll free 1 (800) 548-7786.
37
Printed in U.S.A.
This Report has been prepared for shareholders and may be distributed to others only if preceded or accompanied by a current prospectus.
Morgan Stanley Investment Management Inc.
522 Fifth Avenue
New York, New York 10036
© 2018 Morgan Stanley. Morgan Stanley Distribution, Inc.

IFIGREANN
2011367 EXP. 02.28.19

Morgan Stanley Institutional Fund, Inc.
Growth Portfolio
Annual Report
December 31, 2017

Morgan Stanley Institutional Fund, Inc.
Annual Report — December 31, 2017
Shareholders' Letter | | | 2 | | |
Expense Example | | | 3 | | |
Investment Overview | | | 4 | | |
Portfolio of Investments | | | 6 | | |
Statement of Assets and Liabilities | | | 8 | | |
Statement of Operations | | | 10 | | |
Statements of Changes in Net Assets | | | 11 | | |
Financial Highlights | | | 13 | | |
Notes to Financial Statements | | | 18 | | |
Report of Independent Registered Public Accounting Firm | | | 29 | | |
Federal Tax Notice | | | 30 | | |
Privacy Notice | | | 31 | | |
Director and Officer Information | | | 34 | | |
This report is authorized for distribution only when preceded or accompanied by a prospectus or summary prospectus of the applicable Fund of Morgan Stanley Institutional Fund, Inc. To receive a prospectus and/or statement of additional information (SAI), which contains more complete information such as investment objectives, charges, expenses, policies for voting proxies, risk considerations, and describes in detail each of the Fund's investment policies to the prospective investor, please call toll free 1 (800) 548-7786. Please read the prospectuses carefully before you invest or send money.
Additionally, you can access information about the Fund, including performance, characteristics, and investment team commentary, through Morgan Stanley Investment Management's website: www.morganstanley.com/im.
Market forecasts provided in this report may not necessarily come to pass. There is no guarantee that any sectors mentioned will continue to perform as discussed herein or that securities in such sectors will be held by the Fund in the future. There is no assurance that a fund will achieve its investment objective. Funds are subject to market risk, which is the possibility that market values of securities owned by the Fund will decline and, therefore, the value of the Fund's shares may be less than what you paid for them. Accordingly, you can lose money investing in this Fund. Please see the prospectus for more complete information on investment risks.
1
Morgan Stanley Institutional Fund, Inc.
Annual Report — December 31, 2017
Shareholders' Letter (unaudited)
Dear Shareholders,
We are pleased to provide this Annual report, in which you will learn how your investment in Growth Portfolio (the "Fund") performed during the latest twelve-month period.
Morgan Stanley Investment Management is a client-centric, investor-led organization. Our global presence, intellectual capital, and breadth of products and services enable us to partner with investors to meet the evolving challenges of today's financial markets. We aim to deliver superior investment service and to empower our clients to make the informed decisions that help them reach their investment goals.
As always, we thank you for selecting Morgan Stanley Investment Management, and look forward to working with you in the months and years ahead.
Sincerely,

John H. Gernon
President and Principal Executive Officer
January 2018
2
Morgan Stanley Institutional Fund, Inc.
Annual Report — December 31, 2017
Expense Example (unaudited)
Growth Portfolio
As a shareholder of the Fund, you incur two types of costs: (1) transactional costs; and (2) ongoing costs, which may include advisory fees, administration fees, distribution and shareholder services fees and other Fund expenses. This example is intended to help you understand your ongoing costs (in dollars) of investing in the Fund and to compare these costs with the ongoing costs of investing in other mutual funds.
This example is based on an investment of $1,000 invested at the beginning of the six-month period ended December 31, 2017 and held for the entire six-month period.
Actual Expenses
The table below provides information about actual account values and actual expenses. You may use the information in this table, together with the amount you invested, to estimate the expenses that you paid over the period. Simply divide your account value by $1,000 (for example, an $8,600 account value divided by $1,000 = 8.6), then multiply the result by the number in the table under the heading entitled "Actual Expenses Paid During Period" to estimate the expenses you paid on your account during this period.
Hypothetical Example for Comparison Purposes
The table below provides information about hypothetical account values and hypothetical expenses based on the Fund's actual expense ratio and an assumed rate of return of 5% per year before expenses, which is not the Fund's actual return. The hypothetical account values and expenses may not be used to estimate the actual ending account balance or expenses you paid for the period. You may use this information to compare the ongoing costs of investing in the Fund and other funds. To do so, compare this 5% hypothetical example with the 5% hypothetical examples that appear in the shareholder reports of the other funds.
Please note that the expenses shown in the table are meant to highlight your ongoing costs only and do not reflect any transactional costs, such as sales charges (loads). Therefore, the information for each class in the table is useful in comparing ongoing costs only, and will not help you determine the relative total costs of owning different funds. In addition, if these transactional costs were included, your costs would have been higher.
| | | Beginning
Account
Value
7/1/17 | | Actual Ending
Account
Value
12/31/17 | | Hypothetical
Ending Account
Value | | Actual
Expenses
Paid
During
Period* | | Hypothetical
Expenses Paid
During Period* | | Net
Expense
Ratio
During
Period** | |
Growth Portfolio Class I | | $ | 1,000.00 | | | $ | 1,126.50 | | | $ | 1,022.18 | | | $ | 3.22 | | | $ | 3.06 | | | | 0.60 | % | |
Growth Portfolio Class A | | | 1,000.00 | | | | 1,124.90 | | | | 1,020.82 | | | | 4.66 | | | | 4.43 | | | | 0.87 | | |
Growth Portfolio Class L | | | 1,000.00 | | | | 1,122.00 | | | | 1,018.15 | | | | 7.49 | | | | 7.12 | | | | 1.40 | | |
Growth Portfolio Class C | | | 1,000.00 | | | | 1,120.70 | | | | 1,017.04 | | | | 8.66 | | | | 8.24 | | | | 1.62 | | |
Growth Portfolio Class IS | | | 1,000.00 | | | | 1,127.10 | | | | 1,022.53 | | | | 2.84 | | | | 2.70 | | | | 0.53 | | |
* Expenses are calculated using each Fund Class' annualized net expense ratio (as disclosed), multiplied by the average account value over the period, and multiplied by 184/365 (to reflect the most recent one-half year period).
** Annualized.
3
Morgan Stanley Institutional Fund, Inc.
Annual Report — December 31, 2017
Investment Overview (unaudited)
Growth Portfolio
The Fund seeks long-term capital appreciation by investing primarily in growth-oriented equity securities of large capitalization companies.
Performance
For the year ended December 31, 2017, the Fund's Class I shares had a total return based on net asset value and reinvestment of distributions per share of 43.83%, net of fees. The Fund's Class I shares outperformed the Fund's benchmark, the Russell 1000® Growth Index (the "Index"), which returned 30.21%.
Please keep in mind that double-digit returns are highly unusual and cannot be sustained. Investors should also be aware that these returns were primarily achieved during favorable market conditions.
Factors Affecting Performance
• Major U.S. stock indexes spent most of 2017 climbing toward, then exceeding, new record highs. Fueling their momentum was a combination of strong economic growth, robust corporate profits (aided, in part, by a weak dollar) and optimism for tax reform. While the Federal Reserve raised its benchmark interest rate three times in 2017, the moves were incremental and not considered a headwind to the economy's momentum. Notable uncertainties in domestic politics and geopolitics also failed to disrupt the market's advance. Overall, market volatility remained historically low, further bolstering investor confidence in stocks.
• The Index's top-performing sector during the period was utilities, followed by information technology ("IT") and financials. The energy sector was the only Index sector with a negative return, and telecommunication services and consumer staples were also among the bottom-performing sectors for the period.
• The long-term investment horizon and conviction-weighted investment approach embraced by the team since 1998 can result in periods of performance deviation from the benchmark and peers. In this reporting period, the Fund's outperformance was largely driven by stock selection, while sector allocation contributed a lesser gain.
• The information technology sector was the largest contributor to performance, driven by strongly favorable stock selection and an overweight allocation, which was beneficial as well. Relative gains
were led by a global social networking platform, which continued to execute well, reported strong earnings and provided a positive outlook on cost cutting. Several holdings in the software-as-a-service area were also among the top contributors in the sector and across the portfolio. Sentiment was strong across the industry due to generally solid reported results as well as upbeat management commentary.
• Relative outperformance in the health care sector was driven by a leading genetic testing and analysis company and a surgical robotics maker. Both companies posted strong results during the period on continued strong execution and positive investor sentiment around new product launches.
• Stock selection in consumer discretionary contributed to relative outperformance, led by a holding in an online retail and cloud computing leader that performed well due to the company's continued strong earnings results and expectations that the company's e-commerce business could benefit from a shift in the retail landscape, as brick-and-mortar stores have been closing at an accelerating pace. However, one of the largest detractors in the period was an athletic wear maker. In August, the company reported better-than-expected quarterly results but lowered its financial outlook due to weakness in its North America business, which has been challenged by heightened promotional activity and growing competition from a rival brand.
• Although stock selection modestly detracted from relative results in the industrials and materials sectors, sector weighting differences versus the Index were favorable, which helped offset the negative impact from stock selection.
Management Strategies
• There were no changes to our bottom-up investment process during the period. We continued to look for high-quality growth companies that we believe have these attributes: sustainable competitive advantages, above-average business visibility, rising return on invested capital, strong free cash flow generation and a favorable risk/reward profile. We find these companies through intense fundamental research. Our emphasis is on secular growth, and as a result short-term market events are not as meaningful in the stock selection process.
4
Morgan Stanley Institutional Fund, Inc.
Annual Report — December 31, 2017
Investment Overview (unaudited) (cont'd)
Growth Portfolio
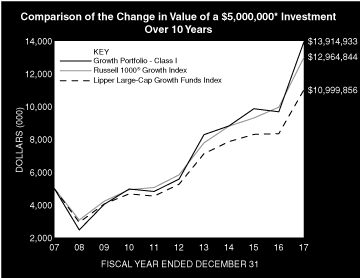
* Minimum Investment for Class I shares
In accordance with SEC regulations, the Fund's performance shown assumes that all recurring fees (including management fees) were deducted and all dividends and distributions were reinvested. The performance of Class A, L, C and IS shares will vary from Class I shares based upon their different inception dates and will be negatively impacted by additional fees assessed to those classes (if applicable).
Performance Compared to the Russell 1000® Growth Index(1) and the Lipper Large-Cap Growth Funds Index(2)
| | Period Ended December 31, 2017
Total Returns(3) | |
| | | | Average Annual | |
| | One
Year | | Five
Years | | Ten
Years | | Since
Inception(9) | |
Fund — Class I Shares
w/o sales charges(4) | | | 43.83 | % | | | 20.08 | % | | | 10.78 | % | | | 11.02 | % | |
Fund — Class A Shares
w/o sales charges(5) | | | 43.45 | | | | 19.76 | | | | 10.50 | | | | 10.02 | | |
Fund — Class A Shares with
maximum 5.25% sales charges(5) | | | 35.93 | | | | 18.48 | | | | 9.91 | | | | 9.75 | | |
Fund — Class L Shares
w/o sales charges(6) | | | 42.69 | | | | 19.12 | | | | — | | | | 15.80 | | |
Fund — Class C Shares
w/o sales charges(8) | | | 42.37 | | | | — | | | | — | | | | 14.01 | | |
Fund — Class C Shares with
maximum 1.00% deferred
sales charges(8) | | | 41.37 | | | | — | | | | — | | | | 14.01 | | |
Fund — Class IS Shares
w/o sales charges(7) | | | 43.98 | | | | — | | | | — | | | | 16.95 | | |
Russell 1000® Growth Index | | | 30.21 | | | | 17.33 | | | | 10.00 | | | | 9.32 | | |
Lipper Large-Cap Growth Funds Index | | | 31.85 | | | | 15.90 | | | | 8.20 | | | | 8.54 | | |
Performance data quoted represents past performance, which is no guarantee of future results, and current performance may be lower or higher than the figures shown. Performance assumes that all dividends and distributions, if any, were reinvested. For the most recent month-end performance figures, please visit www.morganstanley.com/im. Investment return and principal value will fluctuate so that Fund shares, when redeemed, may be worth more or less than their original cost. Total returns do not reflect the deduction of taxes that a shareholder would pay on Fund distributions or the redemption of Fund shares. Performance of share classes will vary due to difference in sales charges and expenses.
(1) The Russell 1000® Growth Index measures the performance of the large-cap growth segment of the U.S. equity universe. It includes those Russell 1000® Index companies with higher price-to-book ratios and higher forecasted growth values. The Russell 1000® Index is an index of approximately 1,000 of the largest U.S. companies based on a combination of market capitalization and current index membership. The Index is unmanaged and its returns do not include any sales charges or fees. Such costs would lower performance. It is not possible to invest directly in an index.
(2) The Lipper Large-Cap Growth Funds Index is an equally weighted performance index of the largest qualifying funds (based on net assets) in the Lipper Large-Cap Growth Funds classification. The Index, which is adjusted for capital gains distributions and income dividends, is unmanaged and should not be considered an investment. There are currently 30 funds represented in this Index. As of the date of this report, the Fund is in the Lipper Large-Cap Growth Funds classification.
(3) Total returns for the Fund reflect fees waived and expenses reimbursed, if applicable, by the Adviser. Without such waivers and reimbursements, total returns would have been lower.
(4) Commenced operations on April 2, 1991.
(5) Commenced offering on January 2, 1996.
(6) Commenced offering on April 27, 2012.
(7) Commenced offering on September 13, 2013.
(8) Commenced offering on April 30, 2015.
(9) For comparative purposes, average annual since inception returns listed for the Indexes refer to the inception date of Class I of the Fund, not the inception of the Index.
5
Morgan Stanley Institutional Fund, Inc.
Annual Report — December 31, 2017
Portfolio of Investments
Growth Portfolio
| | | Shares | | Value
(000) | |
Common Stocks (95.4%) | |
Aerospace & Defense (7.5%) | |
TransDigm Group, Inc. | | | 519,719 | | | $ | 142,725 | | |
United Technologies Corp. | | | 1,270,121 | | | | 162,029 | | |
| | | | 304,754 | | |
Biotechnology (1.5%) | |
Alnylam Pharmaceuticals, Inc. (a) | | | 270,978 | | | | 34,428 | | |
Intrexon Corp. (a)(b) | | | 399,616 | | | | 4,604 | | |
Juno Therapeutics, Inc. (a) | | | 469,231 | | | | 21,448 | | |
| | | | 60,480 | | |
Capital Markets (2.5%) | |
S&P Global, Inc. | | | 608,768 | | | | 103,125 | | |
Construction Materials (3.3%) | |
Martin Marietta Materials, Inc. | | | 307,758 | | | | 68,027 | | |
Vulcan Materials Co. | | | 514,292 | | | | 66,019 | | |
| | | | 134,046 | | |
Diversified Financial Services (3.9%) | |
Berkshire Hathaway, Inc., Class B (a) | | | 802,850 | | | | 159,141 | | |
Health Care Equipment & Supplies (4.0%) | |
DexCom, Inc. (a) | | | 1,114,943 | | | | 63,987 | | |
Intuitive Surgical, Inc. (a) | | | 274,648 | | | | 100,230 | | |
| | | | 164,217 | | |
Health Care Technology (8.5%) | |
athenahealth, Inc. (a) | | | 1,098,441 | | | | 146,137 | | |
Veeva Systems, Inc., Class A (a) | | | 3,630,885 | | | | 200,715 | | |
| | | | 346,852 | | |
Hotels, Restaurants & Leisure (5.1%) | |
Starbucks Corp. | | | 3,623,287 | | | | 208,085 | | |
Information Technology Services (1.5%) | |
Mastercard, Inc., Class A | | | 408,580 | | | | 61,843 | | |
Internet & Direct Marketing Retail (10.2%) | |
Amazon.com, Inc. (a) | | | 304,051 | | | | 355,579 | | |
Priceline Group, Inc. (The) (a) | | | 35,120 | | | | 61,029 | | |
| | | | 416,608 | | |
Internet Software & Services (17.3%) | |
Alphabet, Inc., Class C (a) | | | 242,356 | | | | 253,601 | | |
Facebook, Inc., Class A (a) | | | 1,037,312 | | | | 183,044 | | |
Tencent Holdings Ltd. (China) (c) | | | 1,238,900 | | | | 64,045 | | |
Twitter, Inc. (a) | | | 5,914,808 | | | | 142,014 | | |
Zillow Group, Inc., Class C (a) | | | 1,534,984 | | | | 62,812 | | |
| | | | 705,516 | | |
Life Sciences Tools & Services (5.0%) | |
Illumina, Inc. (a) | | | 938,440 | | | | 205,040 | | |
Road & Rail (4.1%) | |
Union Pacific Corp. | | | 1,252,064 | | | | 167,902 | | |
Semiconductors & Semiconductor Equipment (0.9%) | |
NVIDIA Corp. | | | 193,203 | | | | 37,385 | | |
Software (16.4%) | |
Activision Blizzard, Inc. | | | 2,274,116 | | | | 143,997 | | |
Adobe Systems, Inc. (a) | | | 233,996 | | | | 41,006 | | |
salesforce.com, Inc. (a) | | | 2,126,298 | | | | 217,371 | | |
| | | Shares | | Value
(000) | |
ServiceNow, Inc. (a) | | | 797,839 | | | $ | 104,030 | | |
Snap, Inc., Class A (a)(b) | | | 4,150,992 | | | | 60,646 | | |
Workday, Inc., Class A (a) | | | 994,059 | | | | 101,136 | | |
| | | | 668,186 | | |
Textiles, Apparel & Luxury Goods (3.7%) | |
LVMH Moet Hennessy Louis Vuitton SE (France) | | | 504,270 | | | | 148,129 | | |
Total Common Stocks (Cost $2,506,441) | | | 3,891,309 | | |
Preferred Stocks (3.3%) | |
Electronic Equipment, Instruments & Components (0.5%) | |
Magic Leap Series C (a)(d)(e)(f)
(acquisition cost — $18,812;
acquired 12/22/15) | | | 816,725 | | | | 22,051 | | |
Internet & Direct Marketing Retail (2.7%) | |
Airbnb, Inc. Series D (a)(d)(e)(f)
(acquisition cost — $20,638;
acquired 4/16/14) | | | 506,928 | | | | 53,749 | | |
Flipkart Online Services Pvt Ltd.
Series F (a)(d)(e)(f)
(acquisition cost — $15,000;
acquired 8/18/14) | | | 207,900 | | | | 18,318 | | |
Uber Technologies Series G (a)(d)(e)(f)
(acquisition cost — $54,173;
acquired 12/3/15) | | | 1,110,729 | | | | 38,987 | | |
| | | | 111,054 | | |
Internet Software & Services (0.1%) | |
Dropbox, Inc. Series C (a)(d)(e)(f)
(acquisition cost — $7,182;
acquired 1/30/14) | | | 375,979 | | | | 3,369 | | |
Total Preferred Stocks (Cost $115,805) | | | 136,474 | | |
Short-Term Investments (3.3%) | |
Securities held as Collateral on Loaned Securities (1.0%) | |
Investment Company (0.7%) | |
Morgan Stanley Institutional Liquidity
Funds — Treasury Securities Portfolio —
Institutional Class (See Note G) | | | 28,262,725 | | | | 28,263 | | |
| | | Face
Amount
(000) | | | |
Repurchase Agreements (0.3%) | |
Barclays Capital, Inc., (1.37%, dated 12/29/17,
due 1/2/18; proceeds $6,504;
fully collateralized by a U.S. Government
obligation; 1.75% due 5/15/23;
valued at $6,634) | | $ | 6,504 | | | | 6,504 | | |
HSBC Securities USA, Inc., (1.30%,
dated 12/29/17, due 1/2/18;
proceeds $503; fully collateralized by a
U.S. Government obligation; 3.00%
due 2/15/47; valued at $514) | | | 503 | | | | 503 | | |
Merrill Lynch & Co., Inc., (1.42%,
dated 12/29/17, due 1/2/18;
proceeds $3,331; fully collateralized by a
U.S. Government obligation; 2.00%
due 12/31/21; valued at $3,398) | | | 3,331 | | | | 3,331 | | |
| | | | 10,338 | | |
Total Securities held as Collateral on Loaned
Securities (Cost $38,601) | | | 38,601 | | |
The accompanying notes are an integral part of the financial statements.
6
Morgan Stanley Institutional Fund, Inc.
Annual Report — December 31, 2017
Portfolio of Investments (cont'd)
Growth Portfolio
| | | Shares | | Value
(000) | |
Investment Company (2.3%) | |
Morgan Stanley Institutional Liquidity
Funds — Treasury Securities Portfolio —
Institutional Class (See Note G)
(Cost $92,155) | | | 92,154,690 | | | $ | 92,155 | | |
Total Short-Term Investments (Cost $130,756) | | | 130,756 | | |
Total Investments Excluding Purchased
Options (102.0%) (Cost $2,753,002) | | | 4,158,539 | | |
Total Purchased Options
Outstanding (0.0%) (Cost $8,015) | | | 1,220 | | |
Total Investments (102.0%) (Cost $2,761,017)
Including $38,952 of Securities Loaned (g)(h) | | | 4,159,759 | | |
Liabilities in Excess of Other Assets (–2.0%) | | | (81,320 | ) | |
Net Assets (100.0%) | | $ | 4,078,439 | | |
(a) Non-income producing security.
(b) All or a portion of this security was on loan at December 31, 2017.
(c) Security trades on the Hong Kong exchange.
(d) Security has been deemed illiquid at December 31, 2017.
(e) Security cannot be offered for public resale without first being registered under the Securities Act of 1933 and related rules ("restricted security"). Acquisition date represents the day on which an enforceable right to acquire such security is obtained and is presented along with related cost in the security description. The Fund has registration rights for certain restricted securities. Any costs related to such registration are borne by the issuer. The aggregate value of restricted securities (excluding 144A holdings) at December 31, 2017, amounts to approximately $136,474,000 and represents 3.3% of net assets.
(f) At December 31, 2017, the Fund held fair valued securities valued at approximately $136,474,000, representing 3.3% of net assets. These securities have been fair valued as determined in good faith under procedures established by and under the general supervision of the Company's Directors.
(g) The approximate fair value and percentage of net assets, $212,174,000 and 5.2%, respectively, represent the securities that have been fair valued under the fair valuation policy for international investments as described in Note A-1 within the Notes to the Financial Statements.
(h) At December 31, 2017, the aggregate cost for federal income tax purposes is approximately $2,768,181,000. The aggregate gross unrealized appreciation is approximately $1,496,855,000 and the aggregate gross unrealized depreciation is approximately $105,276,000, resulting in net unrealized appreciation of approximately $1,391,579,000.
Call Options Purchased:
The Fund had the following call options purchased open at December 31, 2017:
Counterparty | | Description | | Strike
Price | | Expiration
Date | | Number of
Contracts | | Notional
Amount
(000) | | Value
(000) | | Premiums
Paid
(000) | | Unrealized
Depreciation
(000) | |
Royal Bank of Scotland | | USD/CNH | | CNH | 7.52 | | | Nov-18 | | | 993,890,548 | | | | 993,891 | | | $ | 968 | | | $ | 4,115 | | | $ | (3,147 | ) | |
Royal Bank of Scotland | | USD/CNH | | CNH | 7.55 | | | Aug-18 | | | 735,834,694 | | | | 735,835 | | | | 252 | | | | 3,900 | | | | (3,648 | ) | |
| | | | | | | | | | | | | $ | 1,220 | | | $ | 8,015 | | | $ | (6,795 | ) | |
CNH — Chinese Yuan Renminbi Offshore
USD — United States Dollar
Portfolio Composition*
Classification | | Percentage of
Total Investments | |
Other** | | | 27.9 | % | |
Internet Software & Services | | | 17.2 | | |
Software | | | 16.2 | | |
Internet & Direct Marketing Retail | | | 12.8 | | |
Health Care Technology | | | 8.4 | | |
Aerospace & Defense | | | 7.4 | | |
Hotels, Restaurants & Leisure | | | 5.1 | | |
Life Sciences Tools & Services | | | 5.0 | | |
Total Investments | | | 100.0 | % | |
* Percentages indicated are based upon total investments (excluding Securities held as Collateral on Loaned Securities) as of December 31, 2017.
** Industries and/or investment types representing less than 5% of total investments.
The accompanying notes are an integral part of the financial statements.
7
Morgan Stanley Institutional Fund, Inc.
Annual Report — December 31, 2017
Statement of Assets and Liabilities | | December 31, 2017
(000) | |
Assets: | |
Investments in Securities of Unaffiliated Issuers, at Value(1) (Cost $2,640,599) | | $ | 4,039,341 | | |
Investment in Security of Affiliated Issuer, at Value (Cost $120,418) | | | 120,418 | | |
Total Investments in Securities, at Value (Cost $2,761,017) | | | 4,159,759 | | |
Foreign Currency, at Value (Cost $1) | | | 1 | | |
Receivable for Fund Shares Sold | | | 4,759 | | |
Receivable from Securities Lending Income | | | 157 | | |
Tax Reclaim Receivable | | | 135 | | |
Receivable from Affiliate | | | 112 | | |
Other Assets | | | 228 | | |
Total Assets | | | 4,165,151 | | |
Liabilities: | |
Payable for Fund Shares Redeemed | | | 40,209 | | |
Collateral on Securities Loaned, at Value | | | 38,601 | | |
Payable for Advisory Fees | | | 4,292 | | |
Due to Broker | | | 1,520 | | |
Payable for Sub Transfer Agency Fees — Class I | | | 182 | | |
Payable for Sub Transfer Agency Fees — Class A | | | 502 | | |
Payable for Sub Transfer Agency Fees — Class L | | | 43 | | |
Payable for Sub Transfer Agency Fees — Class C | | | 7 | | |
Payable for Shareholder Services Fees — Class A | | | 392 | | |
Payable for Distribution and Shareholder Services Fees — Class L | | | 58 | | |
Payable for Distribution and Shareholder Services Fees — Class C | | | 32 | | |
Payable for Administration Fees | | | 281 | | |
Payable for Directors' Fees and Expenses | | | 127 | | |
Payable for Transfer Agency Fees — Class I | | | 19 | | |
Payable for Transfer Agency Fees — Class A | | | 72 | | |
Payable for Transfer Agency Fees — Class L | | | 6 | | |
Payable for Transfer Agency Fees — Class C | | | 1 | | |
Payable for Transfer Agency Fees — Class IS | | | 1 | | |
Payable for Custodian Fees | | | 70 | | |
Payable for Professional Fees | | | 56 | | |
Other Liabilities | | | 241 | | |
Total Liabilities | | | 86,712 | | |
Net Assets | | $ | 4,078,439 | | |
Net Assets Consist Of: | |
Paid-in-Capital | | $ | 2,483,070 | | |
Accumulated Net Investment Loss | | | (248 | ) | |
Accumulated Undistributed Net Realized Gain | | | 196,875 | | |
Unrealized Appreciation (Depreciation) on: | |
Investments | | | 1,398,742 | | |
Foreign Currency Translations | | | — | @ | |
Net Assets | | $ | 4,078,439 | | |
The accompanying notes are an integral part of the financial statements.
8
Morgan Stanley Institutional Fund, Inc.
Annual Report — December 31, 2017
Statement of Assets and Liabilities (cont'd) | | December 31, 2017
(000) | |
CLASS I: | |
Net Assets | | $ | 991,362 | | |
| Shares Outstanding $0.001 par value shares of beneficial interest (unlimited shares authorized) (not in 000's) | | | 23,802,811 | | |
Net Asset Value, Offering and Redemption Price Per Share | | $ | 41.65 | | |
CLASS A: | |
Net Assets | | $ | 1,827,833 | | |
| Shares Outstanding $0.001 par value shares of beneficial interest (unlimited shares authorized) (not in 000's) | | | 45,957,779 | | |
Net Asset Value, Redemption Price Per Share | | $ | 39.77 | | |
Maximum Sales Load | | | 5.25 | % | |
Maximum Sales Charge | | $ | 2.20 | | |
Maximum Offering Price Per Share | | $ | 41.97 | | |
CLASS L: | |
Net Assets | | $ | 90,177 | | |
| Shares Outstanding $0.001 par value shares of beneficial interest (unlimited shares authorized) (not in 000's) | | | 2,373,599 | | |
Net Asset Value, Offering and Redemption Price Per Share | | $ | 37.99 | | |
CLASS C: | |
Net Assets | | $ | 37,524 | | |
| Shares Outstanding $0.001 par value shares of beneficial interest (unlimited shares authorized) (not in 000's) | | | 993,680 | | |
Net Asset Value, Offering and Redemption Price Per Share | | $ | 37.76 | | |
CLASS IS: | |
Net Assets | | $ | 1,131,543 | | |
| Shares Outstanding $0.001 par value shares of beneficial interest (unlimited shares authorized) (not in 000's) | | | 27,015,080 | | |
Net Asset Value, Offering and Redemption Price Per Share | | $ | 41.89 | | |
(1) Including:
Securities on Loan, at Value: | | $ | 38,952 | | |
@ Amount is less than $500.
The accompanying notes are an integral part of the financial statements.
9
Morgan Stanley Institutional Fund, Inc.
Annual Report — December 31, 2017
Statement of Operations | | Year Ended
December 31, 2017
(000) | |
Investment Income: | |
Dividends from Securities of Unaffiliated Issuers (Net of $146 of Foreign Taxes Withheld) | | $ | 9,839 | | |
Income from Securities Loaned — Net | | | 2,835 | | |
Dividends from Security of Affiliated Issuer (Note G) | | | 934 | | |
Total Investment Income | | | 13,608 | | |
Expenses: | |
Advisory Fees (Note B) | | | 16,104 | | |
Shareholder Services Fees — Class A (Note D) | | | 4,227 | | |
Distribution and Shareholder Services Fees — Class L (Note D) | | | 646 | | |
Distribution and Shareholder Services Fees — Class C (Note D) | | | 261 | | |
Administration Fees (Note C) | | | 2,995 | | |
Sub Transfer Agency Fees — Class I | | | 707 | | |
Sub Transfer Agency Fees — Class A | | | 1,496 | | |
Sub Transfer Agency Fees — Class L | | | 98 | | |
Sub Transfer Agency Fees — Class C | | | 21 | | |
Transfer Agency Fees — Class I (Note E) | | | 64 | | |
Transfer Agency Fees — Class A (Note E) | | | 253 | | |
Transfer Agency Fees — Class L (Note E) | | | 20 | | |
Transfer Agency Fees — Class C (Note E) | | | 6 | | |
Transfer Agency Fees — Class IS (Note E) | | | 5 | | |
Shareholder Reporting Fees | | | 272 | | |
Registration Fees | | | 131 | | |
Professional Fees | | | 120 | | |
Custodian Fees (Note F) | | | 103 | | |
Directors' Fees and Expenses | | | 92 | | |
Pricing Fees | | | 3 | | |
Other Expenses | | | 173 | | |
Expenses Before Non Operating Expenses | | | 27,797 | | |
Bank Overdraft Expense | | | 2 | | |
Total Expenses | | | 27,799 | | |
Rebate from Morgan Stanley Affiliate (Note G) | | | (218 | ) | |
Net Expenses | | | 27,581 | | |
Net Investment Loss | | | (13,973 | ) | |
Realized Gain (Loss): | |
Investments Sold | | | 894,483 | | |
Foreign Currency Transactions | | | (101 | ) | |
Net Realized Gain | | | 894,382 | | |
Change in Unrealized Appreciation (Depreciation): | |
Investments | | | 411,029 | | |
Foreign Currency Translations | | | — | @ | |
Net Change in Unrealized Appreciation (Depreciation) | | | 411,029 | | |
Net Realized Gain and Change in Unrealized Appreciation (Depreciation) | | | 1,305,411 | | |
Net Increase in Net Assets Resulting from Operations | | $ | 1,291,438 | | |
@ Amount is less than $500.
The accompanying notes are an integral part of the financial statements.
10
Morgan Stanley Institutional Fund, Inc.
Annual Report — December 31, 2017
Statements of Changes in Net Assets | | Year Ended
December 31, 2017
(000) | | Year Ended
December 31, 2016
(000) | |
Increase (Decrease) in Net Assets: | |
Operations: | |
Net Investment Loss | | $ | (13,973 | ) | | $ | (3,375 | ) | |
Net Realized Gain | | | 894,382 | | | | 267,238 | | |
Net Change in Unrealized Appreciation (Depreciation) | | | 411,029 | | | | (327,432 | ) | |
Net Increase (Decrease) in Net Assets Resulting from Operations | | | 1,291,438 | | | | (63,569 | ) | |
Distributions from and/or in Excess of: | |
Class I: | |
Net Realized Gain | | | (187,298 | ) | | | (93,975 | ) | |
Class A: | |
Net Realized Gain | | | (345,858 | ) | | | (177,189 | ) | |
Class L: | |
Net Realized Gain | | | (17,850 | ) | | | (9,653 | ) | |
Class C: | |
Net Realized Gain | | | (7,005 | ) | | | (2,102 | ) | |
Class IS: | |
Net Realized Gain | | | (199,297 | ) | | | (108,125 | ) | |
Total Distributions | | | (757,308 | ) | | | (391,044 | ) | |
Capital Share Transactions:(1) | |
Class I: | |
Subscribed | | | 405,570 | | | | 245,890 | | |
Distributions Reinvested | | | 177,679 | | | | 90,086 | | |
Redeemed | | | (447,722 | ) | | | (373,817 | ) | |
Class A: | |
Subscribed | | | 178,801 | | | | 129,312 | | |
Distributions Reinvested | | | 335,396 | | | | 171,522 | | |
Redeemed | | | (300,610 | ) | | | (348,180 | ) | |
Class L: | |
Exchanged | | | 223 | | | | 179 | | |
Distributions Reinvested | | | 17,412 | | | | 9,458 | | |
Redeemed | | | (13,660 | ) | | | (12,432 | ) | |
Class C: | |
Subscribed | | | 20,320 | | | | 8,747 | | |
Distributions Reinvested | | | 6,339 | | | | 1,791 | | |
Redeemed | | | (6,799 | ) | | | (5,168 | ) | |
Class IS: | |
Subscribed | | | 153,542 | | | | 115,188 | | |
Distributions Reinvested | | | 196,890 | | | | 103,631 | | |
Redeemed | | | (248,653 | ) | | | (241,921 | ) | |
Net Increase (Decrease) in Net Assets Resulting from Capital Share Transactions | | | 474,728 | | | | (105,714 | ) | |
Total Increase (Decrease) in Net Assets | | | 1,008,858 | | | | (560,327 | ) | |
Net Assets: | |
Beginning of Period | | | 3,069,581 | | | | 3,629,908 | | |
End of Period (Including Accumulated Net Investment Loss of $(248) and $(1,960)) | | $ | 4,078,439 | | | $ | 3,069,581 | | |
The accompanying notes are an integral part of the financial statements.
11
Morgan Stanley Institutional Fund, Inc.
Annual Report — December 31, 2017
Statements of Changes in Net Assets (cont'd) | | Year Ended
December 31, 2017
(000) | | Year Ended
December 31, 2016
(000) | |
(1) Capital Share Transactions: | |
Class I: | |
Shares Subscribed | | | 9,187 | | | | 6,488 | | |
Shares Issued on Distributions Reinvested | | | 4,245 | | | | 2,487 | | |
Shares Redeemed | | | (10,284 | ) | | | (10,000 | ) | |
Net Increase (Decrease) in Class I Shares Outstanding | | | 3,148 | | | | (1,025 | ) | |
Class A: | |
Shares Subscribed | | | 4,204 | | | | 3,580 | | |
Shares Issued on Distributions Reinvested | | | 8,385 | | | | 4,892 | | |
Shares Redeemed | | | (7,161 | ) | | | (9,425 | ) | |
Net Increase (Decrease) in Class A Shares Outstanding | | | 5,428 | | | | (953 | ) | |
Class L: | |
Shares Exchanged | | | 6 | | | | 5 | | |
Shares Issued on Distributions Reinvested | | | 455 | | | | 278 | | |
Shares Redeemed | | | (346 | ) | | | (348 | ) | |
Net Increase (Decrease) in Class L Shares Outstanding | | | 115 | | | | (65 | ) | |
Class C: | |
Shares Subscribed | | | 491 | | | | 246 | | |
Shares Issued on Distributions Reinvested | | | 167 | | | | 53 | | |
Shares Redeemed | | | (171 | ) | | | (145 | ) | |
Net Increase in Class C Shares Outstanding | | | 487 | | | | 154 | | |
Class IS: | |
Shares Subscribed | | | 3,485 | | | | 3,101 | | |
Shares Issued on Distributions Reinvested | | | 4,682 | | | | 2,849 | | |
Shares Redeemed | | | (5,924 | ) | | | (6,336 | ) | |
Net Increase (Decrease) in Class IS Shares Outstanding | | | 2,243 | | | | (386 | ) | |
The accompanying notes are an integral part of the financial statements.
12
Morgan Stanley Institutional Fund, Inc.
Annual Report — December 31, 2017
Financial Highlights
Growth Portfolio
| | | Class I | |
| | | Year Ended December 31, | |
Selected Per Share Data and Ratios | | 2017 | | 2016(1) | | 2015 | | 2014 | | 2013 | |
Net Asset Value, Beginning of Period | | $ | 35.19 | | | $ | 40.44 | | | $ | 38.86 | | | $ | 38.38 | | | $ | 27.05 | | |
Income (Loss) from Investment Operations: | |
Net Investment Income (Loss)(2) | | | (0.11 | ) | | | 0.01 | | | | (0.07 | ) | | | (0.03 | ) | | | 0.02 | | |
Net Realized and Unrealized Gain (Loss) | | | 15.39 | | | | (0.79 | ) | | | 4.70 | | | | 2.43 | | | | 13.02 | | |
Total from Investment Operations | | | 15.28 | | | | (0.78 | ) | | | 4.63 | | | | 2.40 | | | | 13.04 | | |
Distributions from and/or in Excess of: | |
Net Investment Income | | | — | | | | — | | | | — | | | | (0.00 | )(3) | | | (0.13 | ) | |
Net Realized Gain | | | (8.82 | ) | | | (4.47 | ) | | | (3.05 | ) | | | (1.92 | ) | | | (1.58 | ) | |
Total Distributions | | | (8.82 | ) | | | (4.47 | ) | | | (3.05 | ) | | | (1.92 | ) | | | (1.71 | ) | |
Net Asset Value, End of Period | | $ | 41.65 | | | $ | 35.19 | | | $ | 40.44 | | | $ | 38.86 | | | $ | 38.38 | | |
Total Return(4) | | | 43.83 | % | | | (1.91 | )% | | | 11.91 | % | | | 6.42 | % | | | 48.60 | % | |
Ratios and Supplemental Data: | |
Net Assets, End of Period (Thousands) | | $ | 991,362 | | | $ | 726,787 | | | $ | 876,660 | | | $ | 794,648 | | | $ | 989,649 | | |
Ratio of Expenses to Average Net Assets(8) | | | 0.61 | %(5) | | | 0.63 | %(5) | | | 0.61 | %(5) | | | 0.69 | %(5)(6) | | | 0.70 | %(5) | |
Ratio of Expenses to Average Net Assets Excluding Non Operating Expenses | | | 0.61 | %(5) | | | N/A | | | | N/A | | | | N/A | | | | N/A | | |
Ratio of Net Investment Income (Loss) to Average Net Assets(8) | | | (0.25 | )%(5) | | | 0.02 | %(5) | | | (0.18 | )%(5) | | | (0.08 | )%(5) | | | 0.08 | %(5) | |
Ratio of Rebate from Morgan Stanley Affiliates to Average Net Assets | | | 0.01 | % | | | 0.00 | %(7) | | | 0.00 | %(7) | | | 0.01 | % | | | 0.01 | % | |
Portfolio Turnover Rate | | | 55 | % | | | 39 | % | | | 34 | % | | | 44 | % | | | 31 | % | |
(8) Supplemental Information on the Ratios to Average Net Assets: | |
Ratios Before Expense Limitation: | |
Expenses to Average Net Assets | | | N/A | | | | 0.63 | % | | | N/A | | | | N/A | | | | 0.71 | % | |
Net Investment Income to Average Net Assets | | | N/A | | | | 0.02 | % | | | N/A | | | | N/A | | | | 0.07 | % | |
(1) Reflects prior period custodian out-of-pocket expenses that were reimbursed in September 2016. The amount of the reimbursement was immaterial on a per share basis and did not impact the total return of Class I shares. The Ratio of Expenses to Average Net Assets would have been less than 0.005% higher and the Ratio of Net Investment Income to Average Net Assets would have been less than 0.005% lower had the custodian not reimbursed the Fund.
(2) Per share amount is based on average shares outstanding.
(3) Amount is less than $0.005 per share.
(4) Calculated based on the net asset value as of the last business day of the period.
(5) The Ratios of Expenses and Net Investment Income (Loss) reflect the rebate of certain Fund expenses in connection with the investments in Morgan Stanley affiliates during the period. The effect of the rebate on the ratios is disclosed in the above table as "Ratio of Rebate from Morgan Stanley Affiliates to Average Net Assets."
(6) Effective April 7, 2014, the Adviser has agreed to limit the ratio of expenses to average net assets to the maximum ratio of 0.70% for Class I shares. Prior to April 7, 2014, the maximum ratio was 0.80% for Class I shares.
(7) Amount is less than 0.005%.
The accompanying notes are an integral part of the financial statements.
13
Morgan Stanley Institutional Fund, Inc.
Annual Report — December 31, 2017
Financial Highlights
Growth Portfolio
| | | Class A | |
| | | Year Ended December 31, | |
Selected Per Share Data and Ratios | | 2017 | | 2016(1) | | 2015 | | 2014 | | 2013 | |
Net Asset Value, Beginning of Period | | $ | 33.97 | | | $ | 39.31 | | | $ | 37.98 | | | $ | 37.61 | | | $ | 26.53 | | |
Income (Loss) from Investment Operations: | |
Net Investment Loss(2) | | | (0.22 | ) | | | (0.10 | ) | | | (0.21 | ) | | | (0.13 | ) | | | (0.06 | ) | |
Net Realized and Unrealized Gain (Loss) | | | 14.84 | | | | (0.77 | ) | | | 4.59 | | | | 2.42 | | | | 12.78 | | |
Total from Investment Operations | | | 14.62 | | | | (0.87 | ) | | | 4.38 | | | | 2.29 | | | | 12.72 | | |
Distributions from and/or in Excess of: | |
Net Investment Income | | | — | | | | — | | | | — | | | | — | | | | (0.06 | ) | |
Net Realized Gain | | | (8.82 | ) | | | (4.47 | ) | | | (3.05 | ) | | | (1.92 | ) | | | (1.58 | ) | |
Total Distributions | | | (8.82 | ) | | | (4.47 | ) | | | (3.05 | ) | | | (1.92 | ) | | | (1.64 | ) | |
Net Asset Value, End of Period | | $ | 39.77 | | | $ | 33.97 | | | $ | 39.31 | | | $ | 37.98 | | | $ | 37.61 | | |
Total Return(3) | | | 43.45 | % | | | (2.21 | )% | | | 11.53 | % | | | 6.25 | % | | | 48.22 | % | |
Ratios and Supplemental Data: | |
Net Assets, End of Period (Thousands) | | $ | 1,827,833 | | | $ | 1,376,836 | | | $ | 1,630,538 | | | $ | 1,549,756 | | | $ | 205,286 | | |
Ratio of Expenses to Average Net Assets(7) | | | 0.88 | %(4) | | | 0.92 | %(4) | | | 0.96 | %(4) | | | 0.83 | %(4)(5) | | | 0.95 | %(4)(5) | |
Ratio of Expenses to Average Net Assets Excluding Non Operating Expenses | | | 0.88 | %(4) | | | N/A | | | | N/A | | | | N/A | | | | N/A | | |
Ratio of Net Investment Loss to Average Net Assets(7) | | | (0.52 | )%(4) | | | (0.26 | )%(4) | | | (0.52 | )%(4) | | | (0.34 | )%(4) | | | (0.18 | )%(4) | |
Ratio of Rebate from Morgan Stanley Affiliates to Average Net Assets | | | 0.01 | % | | | 0.00 | %(6) | | | 0.00 | %(6) | | | 0.00 | %(6) | | | 0.01 | % | |
Portfolio Turnover Rate | | | 55 | % | | | 39 | % | | | 34 | % | | | 44 | % | | | 31 | % | |
(7) Supplemental Information on the Ratios to Average Net Assets: | |
Ratios Before Expense Limitation: | |
Expenses to Average Net Assets | | | N/A | | | | 0.92 | % | | | 0.96 | % | | | N/A | | | | 0.96 | % | |
Net Investment Loss to Average Net Assets | | | N/A | | | | (0.26 | )% | | | (0.52 | )% | | | N/A | | | | (0.19 | )% | |
(1) Reflects prior period custodian out-of-pocket expenses that were reimbursed in September 2016. The amount of the reimbursement was immaterial on a per share basis and did not impact the total return of Class A shares. The Ratio of Expenses to Average Net Assets would have been less than 0.005% higher and the Ratio of Net Investment Loss to Average Net Assets would have been less than 0.005% lower had the custodian not reimbursed the Fund.
(2) Per share amount is based on average shares outstanding.
(3) Calculated based on the net asset value which does not reflect sales charges, if applicable, as of the last business day of the period.
(4) The Ratios of Expenses and Net Investment Loss reflect the rebate of certain Fund expenses in connection with the investments in Morgan Stanley affiliates during the period. The effect of the rebate on the ratios is disclosed in the above table as "Ratio of Rebate from Morgan Stanley Affiliates to Average Net Assets."
(5) Effective April 7, 2014, the Adviser has agreed to limit the ratio of expenses to average net assets to the maximum ratio of 1.05% for Class A shares. Prior to April 7, 2014, the maximum ratio was 1.15% for Class A shares. Prior to September 16, 2013, the maximum ratio was 1.05% for Class A shares.
(6) Amount is less than 0.005%.
The accompanying notes are an integral part of the financial statements.
14
Morgan Stanley Institutional Fund, Inc.
Annual Report — December 31, 2017
Financial Highlights
Growth Portfolio
| | | Class L | |
| | | Year Ended December 31, | |
Selected Per Share Data and Ratios | | 2017 | | 2016(1) | | 2015 | | 2014 | | 2013 | |
Net Asset Value, Beginning of Period | | $ | 32.90 | | | $ | 38.41 | | | $ | 37.40 | | | $ | 37.26 | | | $ | 26.43 | | |
Income (Loss) from Investment Operations: | |
Net Investment Loss(2) | | | (0.43 | ) | | | (0.29 | ) | | | (0.44 | ) | | | (0.31 | ) | | | (0.38 | ) | |
Net Realized and Unrealized Gain (Loss) | | | 14.34 | | | | (0.75 | ) | | | 4.50 | | | | 2.38 | | | | 12.84 | | |
Total from Investment Operations | | | 13.91 | | | | (1.04 | ) | | | 4.06 | | | | 2.07 | | | | 12.46 | | |
Distributions from and/or in Excess of: | |
Net Investment Income | | | — | | | | — | | | | — | | | | (0.01 | ) | | | (0.05 | ) | |
Net Realized Gain | | | (8.82 | ) | | | (4.47 | ) | | | (3.05 | ) | | | (1.92 | ) | | | (1.58 | ) | |
Total Distributions | | | (8.82 | ) | | | (4.47 | ) | | | (3.05 | ) | | | (1.93 | ) | | | (1.63 | ) | |
Net Asset Value, End of Period | | $ | 37.99 | | | $ | 32.90 | | | $ | 38.41 | | | $ | 37.40 | | | $ | 37.26 | | |
Total Return(3) | | | 42.69 | % | | | (2.72 | )% | | | 10.85 | % | | | 5.72 | % | | | 47.44 | % | |
Ratios and Supplemental Data: | |
Net Assets, End of Period (Thousands) | | $ | 90,177 | | | $ | 74,324 | | | $ | 89,277 | | | $ | 89,854 | | | $ | 528 | | |
Ratio of Expenses to Average Net Assets(7) | | | 1.42 | %(4) | | | 1.45 | %(4) | | | 1.55 | %(4) | | | 1.29 | %(4)(5) | | | 1.60 | %(4)(5) | |
Ratio of Expenses to Average Net Assets Excluding Non Operating Expenses | | | 1.42 | %(4) | | | N/A | | | | N/A | | | | N/A | | | | N/A | | |
Ratio of Net Investment Loss to Average Net Assets(7) | | | (1.05 | )%(4) | | | (0.79 | )%(4) | | | (1.11 | )%(4) | | | (0.82 | )%(4) | | | (1.09 | )%(4) | |
Ratio of Rebate from Morgan Stanley Affiliates to Average Net Assets | | | 0.01 | % | | | 0.00 | %(6) | | | 0.00 | %(6) | | | 0.00 | %(6) | | | 0.01 | % | |
Portfolio Turnover Rate | | | 55 | % | | | 39 | % | | | 34 | % | | | 44 | % | | | 31 | % | |
(7) Supplemental Information on the Ratios to Average Net Assets: | |
Ratios Before Expense Limitation: | |
Expenses to Average Net Assets | | | N/A | | | | 1.45 | % | | | 1.57 | % | | | N/A | | | | 1.72 | % | |
Net Investment Loss to Average Net Assets | | | N/A | | | | (0.79 | )% | | | (1.13 | )% | | | N/A | | | | (1.21 | )% | |
(1) Reflects prior period custodian out-of-pocket expenses that were reimbursed in September 2016. The amount of the reimbursement was immaterial on a per share basis and did not impact the total return of Class L shares. The Ratio of Expenses to Average Net Assets would have been less than 0.005% higher and the Ratio of Net Investment Loss to Average Net Assets would have been less than 0.005% lower had the custodian not reimbursed the Fund.
(2) Per share amount is based on average shares outstanding.
(3) Calculated based on the net asset value as of the last business day of the period.
(4) The Ratios of Expenses and Net Investment Loss reflect the rebate of certain Fund expenses in connection with the investments in Morgan Stanley affiliates during the period. The effect of the rebate on the ratios is disclosed in the above table as "Ratio of Rebate from Morgan Stanley Affiliates to Average Net Assets."
(5) Effective April 7, 2014, the Adviser has agreed to limit the ratio of expenses to average net assets to the maximum ratio of 1.55% for Class L shares. Prior to April 7, 2014, the maximum ratio was 1.65% for Class L shares. Prior to September 16, 2013, the maximum ratio was 1.55% for Class L shares.
(6) Amount is less than 0.005%.
The accompanying notes are an integral part of the financial statements.
15
Morgan Stanley Institutional Fund, Inc.
Annual Report — December 31, 2017
Financial Highlights
Growth Portfolio
| | | Class C | |
| | | Year Ended December 31 | | Period from
April 30, 2015(2) to | |
Selected Per Share Data and Ratios | | 2017 | | 2016(1) | | December 31, 2015 | |
Net Asset Value, Beginning of Period | | $ | 32.81 | | | $ | 38.40 | | | $ | 40.33 | | |
Income (Loss) from Investment Operations: | |
Net Investment Loss(3) | | | (0.51 | ) | | | (0.38 | ) | | | (0.35 | ) | |
Net Realized and Unrealized Gain (Loss) | | | 14.28 | | | | (0.74 | ) | | | 1.47 | | |
Total from Investment Operations | | | 13.77 | | | | (1.12 | ) | | | 1.12 | | |
Distributions from and/or in Excess of: | |
Net Realized Gain | | | (8.82 | ) | | | (4.47 | ) | | | (3.05 | ) | |
Net Asset Value, End of Period | | $ | 37.76 | | | $ | 32.81 | | | $ | 38.40 | | |
Total Return(4) | | | 42.37 | % | | | (2.93 | )% | | | 2.71 | %(7) | |
Ratios and Supplemental Data: | |
Net Assets, End of Period (Thousands) | | $ | 37,524 | | | $ | 16,613 | | | $ | 13,544 | | |
Ratio of Expenses to Average Net Assets(9) | | | 1.63 | %(5) | | | 1.70 | %(5) | | | 1.62 | %(5)(8) | |
Ratio of Expenses to Average Net Assets Excluding Non Operating Expenses | | | 1.63 | %(5) | | | N/A | | | | N/A | | |
Ratio of Net Investment Loss to Average Net Assets(9) | | | (1.26 | )%(5) | | | (1.04 | )%(5) | | | (1.29 | )%(5)(8) | |
Ratio of Rebate from Morgan Stanley Affiliates to Average Net Assets | | | 0.01 | % | | | 0.00 | %(6) | | | 0.00 | %(6)(8) | |
Portfolio Turnover Rate | | | 55 | % | | | 39 | % | | | 34 | % | |
(9) Supplemental Information on the Ratios to Average Net Assets: | |
Ratios Before Expense Limitation: | |
Expenses to Average Net Assets | | | N/A | | | | 1.70 | % | | | N/A | | |
Net Investment Loss to Average Net Assets | | | N/A | | | | (1.04 | )% | | | N/A | | |
(1) Reflects prior period custodian out-of-pocket expenses that were reimbursed in September 2016. The amount of the reimbursement was immaterial on a per share basis and did not impact the total return of Class C shares. The Ratio of Expenses to Average Net Assets would have been less than 0.005% higher and the Ratio of Net Investment Loss to Average Net Assets would have been less than 0.005% lower had the custodian not reimbursed the Fund.
(2) Commencement of Offering.
(3) Per share amount is based on average shares outstanding.
(4) Calculated based on the net asset value which does not reflect sales charges, if applicable, as of the last business day of the period.
(5) The Ratios of Expenses and Net Investment Loss reflect the rebate of certain Fund expenses in connection with the investments in Morgan Stanley affiliates during the period. The effect of the rebate on the ratios is disclosed in the above table as "Ratio of Rebate from Morgan Stanley Affiliates to Average Net Assets."
(6) Amount is less than 0.005%.
(7) Not annualized.
(8) Annualized.
The accompanying notes are an integral part of the financial statements.
16
Morgan Stanley Institutional Fund, Inc.
Annual Report — December 31, 2017
Financial Highlights
Growth Portfolio
| | | Class IS | |
| | | Year Ended December 31, | | Period from
September 13, 2013(2) to | |
Selected Per Share Data and Ratios | | 2017 | | 2016(1) | | 2015 | | 2014 | | December 31, 2013 | |
Net Asset Value, Beginning of Period | | $ | 35.32 | | | $ | 40.54 | | | $ | 38.92 | | | $ | 38.40 | | | $ | 34.45 | | |
Income (Loss) from Investment Operations: | |
Net Investment Income (Loss)(3) | | | (0.07 | ) | | | 0.05 | | | | (0.04 | ) | | | (0.05 | ) | | | (0.02 | ) | |
Net Realized and Unrealized Gain (Loss) | | | 15.46 | | | | (0.80 | ) | | | 4.71 | | | | 2.50 | | | | 5.55 | | |
Total from Investment Operations | | | 15.39 | | | | (0.75 | ) | | | 4.67 | | | | 2.45 | | | | 5.53 | | |
Distributions from and/or in Excess of: | |
Net Investment Income | | | — | | | | — | | | | — | | | | (0.01 | ) | | | — | | |
Net Realized Gain | | | (8.82 | ) | | | (4.47 | ) | | | (3.05 | ) | | | (1.92 | ) | | | (1.58 | ) | |
Total Distributions | | | (8.82 | ) | | | (4.47 | ) | | | (3.05 | ) | | | (1.93 | ) | | | (1.58 | ) | |
Net Asset Value, End of Period | | $ | 41.89 | | | $ | 35.32 | | | $ | 40.54 | | | $ | 38.92 | | | $ | 38.40 | | |
Total Return(4) | | | 43.98 | % | | | (1.83 | )% | | | 11.97 | % | | | 6.60 | % | | | 16.20 | %(8) | |
Ratios and Supplemental Data: | |
Net Assets, End of Period (Thousands) | | $ | 1,131,543 | | | $ | 875,021 | | | $ | 1,019,889 | | | $ | 964,465 | | | $ | 11 | | |
Ratio of Expenses to Average Net Assets(10) | | | 0.53 | %(5) | | | 0.54 | %(5) | | | 0.54 | %(5) | | | 0.54 | %(5)(6) | | | 0.60 | %(5)(9) | |
Ratio of Expenses to Average Net Assets Excluding Non
Operating Expenses | | | 0.53 | %(5) | | | N/A | | | | N/A | | | | N/A | | | | N/A | | |
Ratio of Net Investment Income (Loss) to Average Net Assets(10) | | | (0.16 | )%(5) | | | 0.12 | %(5) | | | (0.10 | )%(5) | | | (0.12 | )%(5) | | | (0.16 | )%(5)(9) | |
Ratio of Rebate from Morgan Stanley Affiliates to Average Net Assets | | | 0.01 | % | | | 0.00 | %(7) | | | 0.00 | %(7) | | | 0.01 | % | | | 0.01 | %(9) | |
Portfolio Turnover Rate | | | 55 | % | | | 39 | % | | | 34 | % | | | 44 | % | | | 31 | % | |
(10) Supplemental Information on the Ratios to Average Net Assets: | |
Ratios Before Expense Limitation: | |
Expenses to Average Net Assets | | | N/A | | | | 0.54 | % | | | N/A | | | | 0.55 | % | | | 5.60 | %(9) | |
Net Investment Income (Loss) to Average Net Assets | | | N/A | | | | 0.12 | % | | | N/A | | | | (0.13 | )% | | | (5.16 | )%(9) | |
(1) Reflects prior period custodian out-of-pocket expenses that were reimbursed in September 2016. The amount of the reimbursement was immaterial on a per share basis and did not impact the total return of Class IS shares. The Ratio of Expenses to Average Net Assets would have been less than 0.005% higher and the Ratio of Net Investment Income to Average Net Assets would have been less than 0.005% lower had the custodian not reimbursed the Fund.
(2) Commencement of Offering.
(3) Per share amount is based on average shares outstanding.
(4) Calculated based on the net asset value as of the last business day of the period.
(5) The Ratios of Expenses and Net Investment Income (Loss) reflect the rebate of certain Fund expenses in connection with the investments in Morgan Stanley affiliates during the period. The effect of the rebate on the ratios is disclosed in the above table as "Ratio of Rebate from Morgan Stanley Affiliates to Average Net Assets."
(6) Effective April 7, 2014, the Adviser has agreed to limit the ratio of expenses to average net assets to the maximum ratio of 0.67% for Class IS shares. Prior to April 7, 2014, the maximum ratio was 0.73% for Class IS shares.
(7) Amount is less than 0.005%.
(8) Not annualized.
(9) Annualized.
The accompanying notes are an integral part of the financial statements.
17
Morgan Stanley Institutional Fund, Inc.
Annual Report — December 31, 2017
Notes to Financial Statements
Morgan Stanley Institutional Fund, Inc. (the "Company") is registered under the Investment Company Act of 1940, as amended (the "Act"), as an open-end management investment company. The Company is comprised of twenty-nine separate, active, diversified and non-diversified funds (individually referred to as a "Fund", collectively as the "Funds"). The Company applies investment company accounting and reporting guidance.
The accompanying financial statements relate to the Growth Portfolio. The Fund seeks long-term capital appreciation by investing primarily in growth-oriented equity securities of large capitalization companies.
The Fund offers five classes of shares — Class I, Class A, Class L, Class C and Class IS. On April 30, 2015, the Fund suspended offering of Class L shares. Existing Class L shareholders may invest through reinvestment of dividends and distributions.
A. Significant Accounting Policies: The following significant accounting policies are in conformity with U.S. generally accepted accounting principles ("GAAP"). Such policies are consistently followed by the Company in the preparation of its financial statements. GAAP may require management to make estimates and assumptions that affect the reported amounts and disclosures in the financial statements. Actual results may differ from those estimates.
1. Security Valuation: (1) An equity portfolio security listed or traded on an exchange is valued at its latest reported sales price (or at the exchange official closing price if such exchange reports an official closing price), and if there were no sales on a given day and if there is no official exchange closing price for that day, the security is valued at the mean between the last reported bid and asked prices if such bid and asked prices are available on the relevant exchanges. Listed equity securities not traded on the valuation date with no reported bid and asked prices available on the exchange are valued at the mean between the current bid and asked prices obtained from one or more reputable brokers or dealers. In cases where a security is traded on more than one exchange, the security is valued on the exchange designated as the primary market; (2) all other equity portfolio securities for which over-the-counter ("OTC") market quotations are readily available are valued at the latest reported sales price (or at the market official closing price if such market reports an official closing price), and if there was no trading in the security on a given day and if there is no official closing price from
relevant markets for that day, the security is valued at the mean between the last reported bid and asked prices if such bid and asked prices are available on the relevant markets. An unlisted equity security that does not trade on the valuation date and for which bid and asked prices from the relevant markets are unavailable is valued at the mean between the current bid and asked prices obtained from one or more reputable brokers or dealers; (3) certain portfolio securities may be valued by an outside pricing service/vendor approved by the Company's Board of Directors (the "Directors"). The pricing service/vendor may employ a pricing model that takes into account, among other things, bids, yield spreads, and/or other market data and specific security characteristics. Alternatively, if a valuation is not available from an outside pricing service/vendor, and the security trades on an exchange, the security may be valued at its latest reported sale price (or at the exchange official closing price if such exchange reports an official closing price), prior to the time when assets are valued. If there are no sales on a given day and if there is no official exchange closing price for that day, the security is valued at the mean between the last reported bid and asked prices if such bid and asked prices are available in the relevant exchanges; (4) listed options are valued at the last reported sales price on the exchange on which they are listed (or at the exchange official closing price if such exchange reports an official closing price). If an official closing price or last reported sales price is unavailable, the listed option should be fair valued at the mean between its latest bid and ask prices. Unlisted options are valued at the mean between their latest bid and ask prices from a broker/dealer or valued by a pricing service/vendor; (5) when market quotations are not readily available, including circumstances under which Morgan Stanley Investment Management Inc. (the "Adviser") determines that the closing price, last sale price or the mean between the last reported bid and asked prices are not reflective of a security's market value, portfolio securities are valued at their fair value as determined in good faith under procedures established by and under the general supervision of the Directors. Occasionally, developments affecting the closing prices of securities and other assets may occur between the times at which valuations of such securities are determined (that is, close of the foreign market on which the securities trade) and the close of business of the New York Stock Exchange ("NYSE"). If developments occur during such periods that are expected to materially affect
18
Morgan Stanley Institutional Fund, Inc.
Annual Report — December 31, 2017
Notes to Financial Statements (cont'd)
the value of such securities, such valuations may be adjusted to reflect the estimated fair value of such securities as of the close of the NYSE, as determined in good faith by the Directors or by the Adviser using a pricing service and/or procedures approved by the Directors; (6) quotations of foreign portfolio securities, other assets and liabilities and forward contracts stated in foreign currency are translated into U.S. dollar equivalents at the prevailing market rates prior to the close of the NYSE; and (7) investments in mutual funds, including the Morgan Stanley Institutional Liquidity Funds, are valued at the net asset value ("NAV") as of the close of each business day.
The Directors have responsibility for determining in good faith the fair value of the investments, and the Directors may appoint others, such as the Company's Adviser or a valuation committee, to assist the Directors in determining fair value and to make the actual calculations pursuant to the fair valuation methodologies previously approved by the Directors. Under procedures approved by the Directors, the Company's Adviser has formed a Valuation Committee whose members are approved by the Directors. The Valuation Committee provides administration and oversight of the Company's valuation policies and procedures, which are reviewed at least annually by the Directors. These procedures allow the Company to utilize independent pricing services, quotations from securities and financial instrument dealers, and other market sources to determine fair value.
The Company has procedures to determine the fair value of securities and other financial instruments for which market prices are not readily available. Under these procedures, the Valuation Committee convenes on a regular and ad hoc basis to review such securities and considers a number of factors, including valuation methodologies and significant unobservable valuation inputs, when arriving at fair value. The Valuation Committee may employ a market-based approach which may use related or comparable assets or liabilities, recent transactions, market multiples, book values, and other relevant information for the investment to determine the fair value of the investment. An income-based valuation approach may also be used in which the anticipated future cash flows of the investment are discounted to calculate fair value. Discounts may also be applied due to the nature or duration of any restrictions on the disposition of the investments. Due to the inherent uncertainty of valuations of such investments, the fair
values may differ significantly from the values that would have been used had an active market existed. The Valuation Committee employs various methods for calibrating these valuation approaches including a regular review of valuation methodologies, key inputs and assumptions, transactional back-testing or disposition analysis, and reviews of any related market activity.
2. Fair Value Measurement: Financial Accounting Standards Board ("FASB") Accounting Standards CodificationTM ("ASC") 820, "Fair Value Measurement" ("ASC 820"), defines fair value as the value that the Fund would receive to sell an investment or pay to transfer a liability in a timely transaction with an independent buyer in the principal market, or in the absence of a principal market, the most advantageous market for the investment or liability. ASC 820 establishes a three-tier hierarchy to distinguish between (1) inputs that reflect the assumptions market participants would use in valuing an asset or liability developed based on market data obtained from sources independent of the reporting entity (observable inputs) and (2) inputs that reflect the reporting entity's own assumptions about the assumptions market participants would use in valuing an asset or liability developed based on the best information available in the circumstances (unobservable inputs) and to establish classification of fair value measurements for disclosure purposes. Various inputs are used in determining the value of the Fund's investments. The inputs are summarized in the three broad levels listed below.
• Level 1 – unadjusted quoted prices in active markets for identical investments
• Level 2 – other significant observable inputs (including quoted prices for similar investments, interest rates, prepayment speeds, credit risk, etc.)
• Level 3 – significant unobservable inputs including the Fund's own assumptions in determining the fair value of investments. Factors considered in making this determination may include, but are not limited to, information obtained by contacting the issuer, analysts, or the appropriate stock exchange (for exchange-traded securities), analysis of the issuer's financial statements or other available documents and, if necessary, available information concerning other securities in similar circumstances
19
Morgan Stanley Institutional Fund, Inc.
Annual Report — December 31, 2017
Notes to Financial Statements (cont'd)
The inputs or methodology used for valuing securities are not necessarily an indication of the risk associated with investing in those securities and the determination of the significance of a particular input to the fair value measurement in its entirety requires judgment and considers factors specific to each security.
The following is a summary of the inputs used to value the Fund's investments as of December 31, 2017.
Investment Type | | Level 1
Unadjusted
quoted
prices
(000) | | Level 2
Other
significant
observable
inputs
(000) | | Level 3
Significant
unobservable
inputs
(000) | | Total
(000) | |
Assets: | |
Common Stocks | |
Aerospace & Defense | | $ | 304,754 | | | $ | — | | | $ | — | | | $ | 304,754 | | |
Biotechnology | | | 60,480 | | | | — | | | | — | | | | 60,480 | | |
Capital Markets | | | 103,125 | | | | — | | | | — | | | | 103,125 | | |
Construction
Materials | | | 134,046 | | | | — | | | | — | | | | 134,046 | | |
Diversified Financial
Services | | | 159,141 | | | | — | | | | — | | | | 159,141 | | |
Health Care
Equipment &
Supplies | | | 164,217 | | | | — | | | | — | | | | 164,217 | | |
Health Care
Technology | �� | | 346,852 | | | | — | | | | — | | | | 346,852 | | |
Hotels, Restaurants &
Leisure | | | 208,085 | | | | — | | | | — | | | | 208,085 | | |
Information
Technology
Services | | | 61,843 | | | | — | | | | — | | | | 61,843 | | |
Internet & Direct
Marketing Retail | | | 416,608 | | | | — | | | | — | | | | 416,608 | | |
Internet Software &
Services | | | 641,471 | | | | 64,045 | | | | — | | | | 705,516 | | |
Life Sciences
Tools & Services | | | 205,040 | | | | — | | | | — | | | | 205,040 | | |
Road & Rail | | | 167,902 | | | | — | | | | — | | | | 167,902 | | |
Semiconductors &
Semiconductor
Equipment | | | 37,385 | | | | — | | | | — | | | | 37,385 | | |
Software | | | 668,186 | | | | — | | | | — | | | | 668,186 | | |
Textiles, Apparel &
Luxury Goods | | | — | | | | 148,129 | | | | — | | | | 148,129 | | |
Total Common Stocks | | | 3,679,135 | | | | 212,174 | | | | — | | | | 3,891,309 | | |
Preferred Stocks | |
Electronic Equipment,
Instruments &
Components | | | — | | | | — | | | | 22,051 | | | | 22,051 | | |
Internet & Direct
Marketing Retail | | | — | | | | — | | | | 111,054 | | | | 111,054 | | |
Internet Software &
Services | | | — | | | | — | | | | 3,369 | | | | 3,369 | | |
Total Preferred Stocks | | | — | | | | — | | | | 136,474 | | | | 136,474 | | |
Investment Type | | Level 1
Unadjusted
quoted
prices
(000) | | Level 2
Other
significant
observable
inputs
(000) | | Level 3
Significant
unobservable
inputs
(000) | | Total
(000) | |
Call Options
Purchased | | | $— | | | | $1,220 | | | | $— | | | | $1,220 | | |
Short-Term
Investments | |
Investment Company | | | 120,418 | | | | — | | | | — | | | | 120,418 | | |
Repurchase
Agreements | | | — | | | | 10,338 | | | | — | | | | 10,338 | | |
Total Short-Term
Investments | | | 120,418 | | | | 10,338 | | | | — | | | | 130,756 | | |
Total Assets | | $ | 3,799,553 | | | $ | 223,732 | | | $ | 136,474 | | | $ | 4,159,759 | | |
Transfers between investment levels may occur as the markets fluctuate and/or the availability of data used in an investment's valuation changes. The Fund recognizes transfers between the levels as of the end of the period. As of December 31, 2017, securities with a total value of approximately $64,045,000 transferred from Level 1 to Level 2. Securities that were valued using unadjusted quoted prices at December 31, 2016 were valued using other significant observable inputs at December 31, 2017. At December 31, 2017, the fair value of certain securities were adjusted due to developments which occurred between the time of the close of the foreign markets on which they trade and the close of business on the NYSE which resulted in their Level 2 classification.
Following is a reconciliation of investments in which significant unobservable inputs (Level 3) were used in determining fair value.
| | | Preferred
Stocks
(000) | |
Beginning Balance | | $ | 139,530 | | |
Purchases | | | — | | |
Sales | | | — | | |
Amortization of discount | | | — | | |
Transfers in | | | — | | |
Transfers out | | | — | | |
Corporate actions | | | — | | |
Change in unrealized appreciation (depreciation) | | | (3,056 | ) | |
Realized gains (losses) | | | — | | |
Ending Balance | | $ | 136,474 | | |
Net change in unrealized appreciation (depreciation) from
investments still held as of December 31, 2017 | | $ | (3,056 | ) | |
20
Morgan Stanley Institutional Fund, Inc.
Annual Report — December 31, 2017
Notes to Financial Statements (cont'd)
The following table presents additional information about valuation techniques and inputs used for investments that are measured at fair value and categorized within Level 3 as of December 31, 2017. Various valuation techniques were used in the valuation of certain investments and weighted based on the level of significance.
| | | Fair Value at
December 31, 2017
(000) | | Valuation
Technique | | Unobservable
Input | | Range | | Selected
Value | | Impact to
Valuation from an
increase in input | |
Electronic Equipment, Instuments & Components | |
Preferred Stock | | $ | 22,051 | | | Market Transaction
Method | | Precedent Transaction | | $ | 27.00 | | | $ | 27.00 | | | $ | 27.00 | | | Increase | |
| | | | | Discounted Cash Flow | | Weighted Average
Cost of Capital | | | 25.0 | % | | | 27.0 | % | | | 26.0 | % | | Decrease | |
| | | | | | | Perpetual Growth Rate | | | 3.0 | % | | | 4.0 | % | | | 3.5 | % | | Increase | |
| | | | | Market Comparable
Companies | | Enterprise Value/
Revenue | | | 12.0 | x | | | 34.2 | x | | | 12.3 | x | | Increase | |
| | | | | | | Discount for Lack of
Marketability | | | 20.0 | % | | | 20.0 | % | | | 20.0 | % | | Decrease | |
Internet & Direct Marketing Retail | |
Preferred Stocks | | $ | 53,749 | | | Discounted Cash Flow | | Weighted Average
Cost of Capital | | | 15.5 | % | | | 17.5 | % | | | 16.5 | % | | Decrease | |
| | | | | | | Perpetual Growth Rate | | | 3.0 | % | | | 4.0 | % | | | 3.5 | % | | Increase | |
| | | | | Market Comparable
Companies | | Enterprise Value/
Revenue | | | 8.7 | x | | | 14.1 | x | | | 10.1 | x | | Increase | |
| | | | | | | Discount for Lack of
Marketability | | | 20.0 | % | | | 20.0 | % | | | 20.0 | % | | Decrease | |
| | | $ | 18,318 | | | Market Transaction
Method | | Precedent Transaction | | $ | 88.11 | | | $ | 88.11 | | | $ | 88.11 | | | Increase | |
| | | $ | 38,987 | | | Market Transaction
Method | | Pending Transaction* | | $ | 32.97 | | | $ | 48.77 | | | $ | 35.10 | | | Increase | |
Internet Software & Services | |
Preferred Stock | | $ | 3,369 | | | Discounted Cash Flow | | Weighted Average
Cost of Capital | | | 16.0 | % | | | 18.0 | % | | | 17.0 | % | | Decrease | |
| | | | | | | Perpetual Growth Rate | | | 2.5 | % | | | 3.5 | % | | | 3.0 | % | | Increase | |
| | | | | Market Comparable
Companies | | Enterprise Value/
Revenue | | | 3.4 | x | | | 10.1 | x | | | 5.0 | x | | Increase | |
| | | | | | | Discount for Lack of
Marketability | | | 20.0 | % | | | 20.0 | % | | | 20.0 | % | | Decrease | |
* Based on a market transaction announced prior to December 31, 2017 that closed subsequent to December 31, 2017.
3. Repurchase Agreements: The Fund may enter into repurchase agreements under which the Fund lends cash and takes possession of securities with an agreement that the counterparty will repurchase such securities. In connection with transactions in repurchase agreements, a bank as custodian for the Fund takes possession of the underlying securities which are held as collateral, with a market value at least equal to the amount of the repurchase transaction, including principal and accrued interest. To the extent that any repurchase transaction exceeds one business day, the value of the collateral is marked-to-market on a daily basis to determine that the value of the collateral does not decrease below the repurchase price
plus accrued interest as earned. If such a decrease occurs, additional collateral will be requested and, when received, will be added to the account to maintain full collateralization. In the event of default on the obligation to repurchase, the Fund has the right to liquidate the collateral and apply the proceeds in satisfaction of the obligation. In the event of default or bankruptcy by the counterparty to the agreement, realization of the collateral proceeds may be subject to cost and delays. The Fund, along with other affiliated investment companies, may utilize a joint trading account for the purpose of entering into repurchase agreements.
21
Morgan Stanley Institutional Fund, Inc.
Annual Report — December 31, 2017
Notes to Financial Statements (cont'd)
4. Foreign Currency Translation and Foreign Investments: The books and records of the Fund are maintained in U.S. dollars. Foreign currency amounts are translated into U.S. dollars as follows:
– investments, other assets and liabilities at the prevailing rate of exchange on the valuation date;
– investment transactions and investment income at the prevailing rates of exchange on the dates of such transactions.
Although the net assets of the Fund are presented at the foreign exchange rates and market values at the close of the period, the Fund does not isolate that portion of the results of operations arising as a result of changes in the foreign exchange rates from the fluctuations arising from changes in the market prices of securities held at period end. Similarly, the Fund does not isolate the effect of changes in foreign exchange rates from the fluctuations arising from changes in the market prices of securities sold during the period. Accordingly, realized and unrealized foreign currency gains (losses) on investments in securities are included in the reported net realized and unrealized gains (losses) on investment transactions and balances. However, pursuant to U.S. federal income tax regulations, gains and losses from certain foreign currency transactions and the foreign currency portion of gains and losses realized on sales and maturities of foreign denominated debt securities are treated as ordinary income for U.S. federal income tax purposes.
Net realized gains (losses) on foreign currency transactions represent net foreign exchange gains (losses) from foreign currency forward exchange contracts, disposition of foreign currencies, currency gains (losses) realized between the trade and settlement dates on securities transactions, and the difference between the amount of investment income and foreign withholding taxes recorded on the Fund's books and the U.S. dollar equivalent amounts actually received or paid. Net unrealized currency gains (losses) from valuing foreign currency denominated assets and liabilities at period end exchange rates are reflected as a component of unrealized appreciation (depreciation) in the Statement of Assets and Liabilities. The change in unrealized currency gains (losses) on foreign currency translations for the period is reflected in the Statement of Operations.
Foreign security and currency transactions may involve certain considerations and risks not typically associated with those of U.S. dollar denominated transactions as a result of, among other factors, fluctuations of exchange rates in relation to the U.S. dollar, the possibility of lower levels of governmental supervision and regulation of foreign securities markets and the possibility of political or economic instability.
Governmental approval for foreign investments may be required in advance of making an investment under certain circumstances in some countries, and the extent of foreign investments in domestic companies may be subject to limitation in other countries. Foreign ownership limitations also may be imposed by the charters of individual companies to prevent, among other concerns, violations of foreign investment limitations. As a result, an additional class of shares (identified as "Foreign" in the Portfolio of Investments) may be created and offered for investment. The "local" and "foreign shares" market values may differ. In the absence of trading of the foreign shares in such markets, the Fund values the foreign shares at the closing exchange price of the local shares.
5. Derivatives: The Fund may, but is not required to, use derivative instruments for a variety of purposes, including hedging, risk management, portfolio management or to earn income. Derivatives are financial instruments whose value is based, in part, on the value of an underlying asset, interest rate, index or financial instrument. Prevailing interest rates and volatility levels, among other things, also affect the value of derivative instruments. A derivative instrument often has risks similar to its underlying asset and may have additional risks, including imperfect correlation between the value of the derivative and the underlying asset, risks of default by the counterparty to certain transactions, magnification of losses incurred due to changes in the market value of the securities, instruments, indices or interest rates to which the derivative instrument relates, risks that the transactions may not be liquid and risks arising from margin requirements. The use of derivatives involves risks that are different from, and possibly greater than, the risks associated with other portfolio investments. Derivatives may involve the use of highly specialized instruments that require investment techniques and risk analyses different from those associated with other portfolio investments. All of the Fund's holdings, including derivative instruments, are marked-to-market each day with
22
Morgan Stanley Institutional Fund, Inc.
Annual Report — December 31, 2017
Notes to Financial Statements (cont'd)
the change in value reflected in unrealized appreciation (depreciation). Upon disposition, a realized gain or loss is recognized.
Certain derivative transactions may give rise to a form of leverage. Leverage magnifies the potential for gain and the risk of loss. Leverage associated with derivative transactions may cause the Fund to liquidate portfolio positions when it may not be advantageous to do so to satisfy its obligations or to meet earmarking or segregation requirements, pursuant to applicable Securities and Exchange Commission ("SEC") rules and regulations, or may cause the Fund to be more volatile than if the Fund had not been leveraged. Although the Adviser seeks to use derivatives to further the Fund's investment objectives, there is no assurance that the use of derivatives will achieve this result.
Following is a description of the derivative instruments and techniques that the Fund used during the period and their associated risks:
Options: With respect to options, the Fund is subject to equity risk, interest rate risk and foreign currency exchange risk in the normal course of pursuing its investment objectives. If the Fund buys an option, it buys a legal contract giving it the right to buy or sell a specific amount of the underlying instrument or foreign currency, or futures contract on the underlying instrument or foreign currency, at an agreed-upon price during a period of time or on a specified date typically in exchange for a premium paid by the Fund. The Fund may purchase and/or sell put and call options. Purchasing call options tends to increase the Fund's exposure to the underlying (or similar) instrument. Purchasing put options tends to decrease the Fund's exposure to the underlying (or similar) instrument. When entering into purchased option contracts, the Fund bears the risk of interest or exchange rates or securities prices moving unexpectedly, in which case, the Fund may not achieve the anticipated benefits of the purchased option contracts; however the risk of loss is limited to the premium paid. Purchased options are reported as part of "Total Investments in Securities" in the Statement of Assets and Liabilities. Premium paid for purchasing options which expired are treated as realized losses. If the Fund sells an option, it sells to another party the right to buy from or sell to the Fund a specific amount of the underlying instrument or foreign currency, or futures contract on the
underlying instrument or foreign currency, at an agreed-upon price during a period of time or on a specified date typically in exchange for a premium received by the Fund. When options are purchased OTC, the Fund bears the risk that the counterparty that wrote the option will be unable or unwilling to perform its obligations under the option contract. Options may also be illiquid and the Fund may have difficulty closing out its position. A decision as to whether, when and how to use options involves the exercise of skill and judgment and even a well-conceived option transaction may be unsuccessful because of market behavior or unexpected events. The prices of options can be highly volatile and the use of options can lower total returns.
FASB ASC 815, "Derivatives and Hedging" ("ASC 815"), is intended to improve financial reporting about derivative instruments by requiring enhanced disclosures to enable investors to better understand how and why the Fund uses derivative instruments, how these derivative instruments are accounted for and their effects on the Fund's financial position and results of operations.
The following table sets forth the fair value of the Fund's derivative contracts by primary risk exposure as of December 31, 2017.
| | | Asset Derivatives
Statement of Assets and
Liabilities Location | | Primary Risk
Exposure | | Value
(000) | |
Options Purchased | | Investments, at Value
(Options Purchased) | | Currency Risk | | $ | 1,220 | (a) | |
(a) Amounts are included in Investments in Securities in the Statement of Assets and Liabilities.
The following tables set forth by primary risk exposure the Fund's realized gains (losses) and change in unrealized appreciation (depreciation) by type of derivative contract for the year ended December 31, 2017 in accordance with ASC 815.
Realized Gain (Loss) | |
Primary Risk Exposure | | Derivative Type | | Value
(000) | |
Currency Risk | | Investments
(Options Purchased) | | $ | (3,509 | )(b) | |
(b) Amounts are included in Investments Sold in the Statement of Operations.
Change in Unrealized Appreciation (Depreciation) | |
Primary Risk Exposure | | Derivative Type | | Value
(000) | |
Currency Risk | | Investments
(Options Purchased) | | $ | (6,648 | )(c) | |
(c) Amounts are included in Investments in the Statement of Operations.
23
Morgan Stanley Institutional Fund, Inc.
Annual Report — December 31, 2017
Notes to Financial Statements (cont'd)
At December 31, 2017, the Fund's derivative assets and liabilities are as follows:
Gross Amounts of Assets and Liabilities
Presented in the Statement of Assets and Liabilities | |
Derivatives | | Assets(d)
(000) | | Liabilities(d)
(000) | |
Options Purchased | | $ | 1,220 | (a) | | $ | — | | |
(a) Amounts are included in Investments in Securities in the Statement of Assets and Liabilities.
(d) Absent an event of default or early termination, OTC derivative assets and liabilities are presented gross and not offset in the Statement of Assets and Liabilities.
The Fund typically enters into International Swaps and Derivatives Association, Inc. Master Agreements ("ISDA Master Agreements") or similar master agreements (collectively, "Master Agreements") with its contract counterparties for certain OTC derivatives in order to, among other things, reduce its credit risk to counterparties. ISDA Master Agreements include provisions for general obligations, representations, collateral and events of default or termination. Under an ISDA Master Agreement, the Fund typically may offset with the counterparty certain OTC derivative financial instruments' payables and/or receivables with collateral held and/or posted and create one single net payment (close-out netting) in the event of default, termination and/or potential deterioration in the credit quality of the counterparty. Various Master Agreements govern the terms of certain transactions with counterparties, including transactions such as swap, forward, repurchase and reverse repurchase agreements. These Master Agreements typically attempt to reduce the counterparty risk associated with such transactions by specifying credit protection mechanisms and providing standardization that improves legal certainty. Cross-termination provisions under Master Agreements typically provide that a default in connection with one transaction between the Fund and a counterparty gives the non-defaulting party the right to terminate any other transactions in place with the defaulting party to create one single net payment due to/due from the defaulting party and may be a feature in certain Master Agreements. In the event the Fund exercises its right to terminate a Master Agreement after a counterparty experiences a termination event as defined in the Master Agreement, the return of collateral with market value in excess of the Fund's net liability may be delayed or denied.
The following table presents derivative financial instruments that are subject to enforceable netting arrangements as of December 31, 2017.
Gross Amounts Not Offset in the Statement of Assets and Liabilities | |
Counterparty | | Gross Asset
Derivatives
Presented in
Statement of
Assets and
Liabilities
(000) | | Financial
Instrument
(000) | | Collateral
Received(e)
(000) | | Net Amount
(not less
than $0)
(000) | |
Royal Bank of Scotland | | $ | 1,220 | (a) | | $ | — | | | $ | (1,220 | ) | | $ | — | | |
(a) Amounts are included in Investments in Securities in the Statement of Assets and Liabilities.
(e) In some instances, the actual collateral received may be more than the amount shown here due to overcollateralization.
For the year ended December 31, 2017, the approximate average monthly amount outstanding for each derivative type is as follows:
Options Purchased: | |
Average monthly notional amount | | | 881,957,000 | | |
6. Securities Lending: The Fund lends securities to qualified financial institutions, such as broker-dealers, to earn additional income. Any increase or decrease in the fair value of the securities loaned that might occur and any interest earned or dividends declared on those securities during the term of the loan would remain in the Fund. The Fund would receive cash or securities as collateral in an amount equal to or exceeding 100% of the current fair value of the loaned securities. The collateral is marked-to-market daily by State Street Bank and Trust Company ("State Street"), the securities lending agent, to ensure that a minimum of 100% collateral coverage is maintained.
Based on pre-established guidelines, the securities lending agent invests any cash collateral that is received in an affiliated money market portfolio and repurchase agreements. Securities lending income is generated from the earnings on the invested collateral and borrowing fees, less any rebates owed to the borrowers and compensation to the lending agent, and is recorded as "Income from Securities Loaned — Net" in the Fund's Statement of Operations. Risks in securities lending transactions are that a borrower may not provide additional collateral when required or return the securities when due, and that the value of the short-term investments will be less than the amount of cash collateral plus any rebate that is required to be returned to the borrower.
24
Morgan Stanley Institutional Fund, Inc.
Annual Report — December 31, 2017
Notes to Financial Statements (cont'd)
The Fund has the right under the securities lending agreement to recover the securities from the borrower on demand.
The following table presents financial instruments that are subject to enforceable netting arrangements as of December 31, 2017.
Gross Amounts Not Offset in the Statement of Assets and Liabilities | |
Gross Asset
Amounts
Presented in
Statement of
Assets and
Liabilities
(000) | | Financial
Instrument
(000) | | Collateral
Received
(000) | | Net Amount
(not less
than $0)
(000) | |
| $ | 38,952 | (f) | | $ | — | | | $ | (38,952 | )(g)(h) | | $ | 0 | | |
(f) Represents market value of loaned securities at year end.
(g) The Fund received cash collateral of approximately $38,601,000, which was subsequently invested in Repurchase Agreements and Morgan Stanley Institutional Liquidity Funds as reported in the Portfolio of Investments. In addition, the Fund received non-cash collateral of approximately $1,947,000 in the form of U.S. Government obligations, which the Fund cannot sell or repledge, and accordingly are not reflected in the Portfolio of Investments.
(h) The actual collateral received is greater than the amount shown here due to overcollateralization.
FASB ASC 860 "Transfers & Servicing: Repurchase-to-Maturity Transactions, Repurchase Financings, and Disclosures", is intended to provide increased transparency about the types of collateral pledged in securities lending transactions and other similar transactions that are accounted for as secured borrowing.
The following table displays a breakdown of transactions accounted for as secured borrowings, the gross obligations by class of collateral pledged, and the remaining contractual maturity of those transactions as of December 31, 2017.
Remaining Contractual Maturity of the Agreements | |
| | | Overnight and
Continuous
(000) | | <30 days
(000) | | Between
30 &
90 days
(000) | | >90 days
(000) | | Total
(000) | |
Securities Lending
Transactions | |
Common Stocks | | $ | 38,601 | | | $ | — | | | $ | — | | | $ | — | | | $ | 38,601 | | |
Total Borrowings | | $ | 38,601 | | | $ | — | | | $ | — | | | $ | — | | | $ | 38,601 | | |
Gross amount of
recognized liabilities
for securities lending
transactions | | | | | | | | | | $ | 38,601 | | |
7. Restricted Securities: The Fund invests in unregistered or otherwise restricted securities. The term "restricted securities" refers to securities that are unregistered or are held by control persons of the issuer and securities
that are subject to contractual restrictions on their resale. As a result, restricted securities may be more difficult to value and the Fund may have difficulty disposing of such assets either in a timely manner or for a reasonable price. In order to dispose of an unregistered security, the Fund, where it has contractual rights to do so, may have to cause such security to be registered. A considerable period may elapse between the time the decision is made to sell the security and the time the security is registered so that the Fund can sell it. Contractual restrictions on the resale of securities vary in length and scope and are generally the result of a negotiation between the issuer and the acquirer of the securities. The Fund would, in either case, bear market risks during that period. Restricted securities are identified in the Portfolio of Investments.
8. Indemnifications: The Company enters into contracts that contain a variety of indemnifications. The Company's maximum exposure under these arrangements is unknown. However, the Company has not had prior claims or losses pursuant to these contracts and expects the risk of loss to be remote.
9. Dividends and Distributions to Shareholders: Dividends and distributions to shareholders are recorded on the ex-dividend date. Dividends from net investment income, if any, are declared and paid annually. Net realized capital gains, if any, are distributed at least annually.
10. Security Transactions, Income and Expenses: Security transactions are accounted for on the trade date (date the order to buy or sell is executed). Realized gains and losses on the sale of investment securities are determined on the specific identified cost method. Dividend income and other distributions are recorded on the ex-dividend date (except for certain foreign dividends which may be recorded as soon as the Fund is informed of such dividends) net of applicable withholding taxes. Interest income is recognized on the accrual basis except where collection is in doubt. Discounts are accreted and premiums are amortized over the life of the respective securities. Most expenses of the Company can be directly attributed to a particular Fund. Expenses which cannot be directly attributed are apportioned among the Funds based upon relative net assets or other appropriate methods. Income, expenses (other than class specific expenses — distribution and shareholder services, transfer agency and sub transfer agency fees) and realized and unrealized gains or losses are
25
Morgan Stanley Institutional Fund, Inc.
Annual Report — December 31, 2017
Notes to Financial Statements (cont'd)
allocated to each class of shares based upon their relative net assets.
B. Advisory Fees: The Adviser, a wholly-owned subsidiary of Morgan Stanley, provides the Fund with advisory services under the terms of an Investment Advisory Agreement, paid quarterly, at the annual rate based on the daily net assets as follows:
First $1
billion | | Next $1
billion | | Next $1
billion | | Over $3
billion | |
| | 0.50 | % | | | 0.45 | % | | | 0.40 | % | | | 0.35 | % | |
For the year ended December 31, 2017, the advisory fee rate (net of rebate) was equivalent to an annual effective rate of 0.42% of the Fund's average daily net assets.
The Adviser has agreed to reduce its advisory fee and/or reimburse the Fund so that total annual portfolio operating expenses, excluding certain investment related expenses, taxes, interest and other extraordinary expenses (including litigation), will not exceed 0.80% for Class I shares, 1.15% for Class A shares, 1.65% for Class L shares, 1.90% for Class C shares and 0.73% for Class IS shares. The fee waivers and/or expense reimbursements will continue for at least one year from the date of the Fund's prospectus or until such time as the Directors act to discontinue all or a portion of such waivers and/or reimbursements when they deem such action is appropriate. This arrangement had no effect for the year ended December 31, 2017.
C. Administration Fees: The Adviser also serves as Administrator to the Company and provides administrative services pursuant to an Administration Agreement for an annual fee, accrued daily and paid monthly, of 0.08% of the Fund's average daily net assets.
Under a Sub-Administration Agreement between the Administrator and State Street, State Street provides certain administrative services to the Company. For such services, the Administrator pays State Street a portion of the fee the Administrator receives from the Fund.
D. Distribution and Shareholder Services Fees: Morgan Stanley Distribution, Inc. ("MSDI" or the "Distributor"), a wholly-owned subsidiary of the Adviser and an indirect subsidiary of Morgan Stanley, serves as the Company's Distributor of Fund shares pursuant to a Distribution Agreement. The Company has adopted a Shareholder Services Plan with respect to Class A shares pursuant to Rule 12b-1 under the Act. Under the Shareholder Services Plan, the Fund pays the Distributor a shareholder services fee, accrued daily and paid
monthly, at an annual rate of 0.25% of the Fund's average daily net assets attributable to Class A shares.
The Company has adopted a Distribution and Shareholder Services Plan with respect to Class L shares pursuant to Rule 12b-1 under the Act. Under the Distribution and Shareholder Services Plan, the Fund pays the Distributor a distribution fee, accrued daily and paid monthly, at an annual rate of 0.50% and a shareholder services fee, accrued daily and paid monthly, at an annual rate of 0.25% of the Fund's average daily net assets attributable to Class L shares.
The Company has adopted a Distribution and Shareholder Services Plan with respect to Class C shares pursuant to Rule 12b-1 under the Act. Under the Distribution and Shareholder Services Plan, the Fund pays the Distributor a distribution fee, accrued daily and paid monthly, at an annual rate of 0.75% and a shareholder services fee, accrued daily and paid monthly, at an annual rate of 0.25% of the Fund's average daily net assets attributable to Class C shares.
The distribution and shareholder services fees are used to support the expenses associated with servicing and maintaining accounts. The Distributor may compensate other parties for providing shareholder support services to investors who purchase Class A, Class L and Class C shares.
E. Dividend Disbursing and Transfer Agent: The Company's dividend disbursing and transfer agent is Boston Financial Data Services, Inc. ("BFDS"). Pursuant to a Transfer Agency Agreement, the Company pays BFDS a fee based on the number of classes, accounts and transactions relating to the Funds of the Company. Effective January 1, 2018, BFDS changed its name to DST Asset Manager Solutions, Inc.
F. Custodian Fees: State Street (the "Custodian") also serves as Custodian for the Company in accordance with a Custodian Agreement. The Custodian holds cash, securities, and other assets of the Company as required by the Act. Custody fees are payable monthly based on assets held in custody, investment purchases and sales activity and account maintenance fees, plus reimbursement for certain out-of-pocket expenses.
G. Security Transactions and Transactions with Affiliates: For the year ended December 31, 2017, purchases and sales of investment securities for the Fund, other than long-term U.S. Government securities and short-term investments, were approximately $1,976,762,000 and $2,285,040,000, respectively. There were no purchases and
26
Morgan Stanley Institutional Fund, Inc.
Annual Report — December 31, 2017
Notes to Financial Statements (cont'd)
sales of long-term U.S. Government securities for the year ended December 31, 2017.
The Fund invests in the Institutional Class of the Morgan Stanley Institutional Liquidity Funds — Treasury Securities Portfolio (the "Liquidity Funds"), an open-end management investment company managed by the Adviser, both directly and as a portion of the securities held as collateral on loaned securities. Advisory fees paid by the Fund are reduced by an amount equal to its pro-rata share of the advisory and administration fees paid by the Fund due to its investment in the Liquidity Funds. For the year ended December 31, 2017, advisory fees paid were reduced by approximately $218,000 relating to the Fund's investment in the Liquidity Funds.
A summary of the Fund's transactions in shares of the Liquidity Funds during the year ended December 31, 2017 is as follows:
Affiliated
Investment
Company | | Value
December 31,
2016
(000) | | Purchases
at Cost
(000) | | Proceeds
from Sales
(000) | | Dividend
Income
(000) | |
Liquidity Funds | | $ | 240,982 | | | $ | 1,434,037 | | | $ | 1,554,601 | | | $ | 934 | | |
Affiliated
Investment
Company (cont'd) | | Realized
Gain
(Loss)
(000) | | Change in
Unrealized
Appreciation
(Depreciation)
(000) | | Value
December 31,
2017
(000) | |
Liquidity Funds | | $ | — | | | $ | — | | | $ | 120,418 | | |
During the year ended December 31, 2017, the Fund incurred approximately $18,000 in brokerage commissions with Morgan Stanley & Co., LLC, an affiliate of the Adviser/Administrator and Distributor, for portfolio transactions executed on behalf of the Fund.
The Fund is permitted to purchase and sell securities ("cross-trade") from and to other Morgan Stanley Funds as well as other funds and client accounts for which the Adviser or an affiliate of the Adviser serves as investment adviser, pursuant to procedures approved by the Directors in compliance with Rule 17a-7 under the Act (the "Rule"). Each cross-trade is executed at the current market price in compliance with provisions of the Rule. For the year ended December 31, 2017, the Fund did not engage in any cross-trade transactions.
The Fund has an unfunded Deferred Compensation Plan (the "Compensation Plan"), which allows each independent Director to defer payment of all, or a portion, of the fees he or she receives for serving on the Board of Directors. Each eligible Director generally may elect to have the deferred amounts credited with a return equal to the total return on one or more of the Morgan Stanley funds that are offered as investment
options under the Compensation Plan. Appreciation/depreciation and distributions received from these investments are recorded with an offsetting increase/decrease in the deferred compensation obligation and do not affect the NAV of the Fund.
H. Federal Income Taxes: It is the Fund's intention to continue to qualify as a regulated investment company and distribute all of its taxable and tax-exempt income. Accordingly, no provision for federal income taxes is required in the financial statements.
The Fund may be subject to taxes imposed by countries in which it invests. Such taxes are generally based on income and/or capital gains earned or repatriated. Taxes are accrued based on net investment income, net realized gains and net unrealized appreciation as such income and/or gains are earned. Taxes may also be based on transactions in foreign currency and are accrued based on the value of investments denominated in such currency.
FASB ASC 740-10, "Income Taxes — Overall", sets forth a minimum threshold for financial statement recognition of the benefit of a tax position taken or expected to be taken in a tax return. Management has concluded there are no significant uncertain tax positions that would require recognition in the financial statements. If applicable, the Fund recognizes interest accrued related to unrecognized tax benefits in "Interest Expense" and penalties in "Other Expenses" in the Statement of Operations. The Fund files tax returns with the U.S. Internal Revenue Service, New York and various states. Generally, each of the tax years in the four-year period ended December 31, 2017, remains subject to examination by taxing authorities.
The tax character of distributions paid may differ from the character of distributions shown in the Statements of Changes in Net Assets due to short-term capital gains being treated as ordinary income for tax purposes. The tax character of distributions paid during fiscal years 2017 and 2016 was as follows:
2017
Distributions
Paid From: | | 2016
Distributions
Paid From: | |
Ordinary
Income
(000) | | Long-Term
Capital Gain
(000) | | Ordinary
Income
(000) | | Long-Term
Capital Gain
(000) | |
| $ | 95,691 | | | $ | 661,617 | | | $ | — | | | $ | 391,044 | | |
The amount and character of income and gains to be distributed are determined in accordance with income tax regulations which may differ from GAAP. These book/tax differences are either considered temporary or permanent in nature.
27
Morgan Stanley Institutional Fund, Inc.
Annual Report — December 31, 2017
Notes to Financial Statements (cont'd)
Temporary differences are primarily due to differing book and tax treatments for the timing of the recognition of gains (losses) on certain investment transactions and the timing of the deductibility of certain expenses.
Permanent differences, primarily due to differing treatments of gains (losses) related to foreign currency transactions and a net operating loss, resulted in the following reclassifications among the components of net assets at December 31, 2017:
Accumulated
Net Investment
Loss
(000) | | Accumulated
Undistributed
Net Realized
Gain
(000) | | Paid-in-
Capital
(000) | |
| $ | 15,685 | | | $ | (16,251 | ) | | $ | 566 | | |
At December 31, 2017, the components of distributable earnings for the Fund on a tax basis were as follows:
Undistributed
Ordinary
Income
(000) | | Undistributed
Long-Term
Capital Gain
(000) | |
| $ | 21,259 | | | $ | 182,778 | | |
I. Credit Facility: Credit Facility: The Company and other Morgan Stanley funds participated in a $150,000,000 committed, unsecured revolving line of credit facility (the "Facility") with State Street. This Facility is to be used for temporary emergency purposes or funding of shareholder redemption requests. The interest rate on borrowings is based on the federal funds rate or 1 month LIBOR rate plus a spread. The Facility also has a commitment fee of 0.25% per annum based on the unused portion of the Facility. During the year ended December 31, 2017, the Fund did not have any borrowings under the Facility.
J. Other: At December 31, 2017, the Fund had record owners of 10% or greater. Investment activities of these shareholders could have a material impact on the Fund. The aggregate percentage of such owners was 55.6%.
28
Morgan Stanley Institutional Fund, Inc.
Annual Report — December 31, 2017
Report of Independent Registered Public Accounting Firm
To the Shareholders and Board of Directors of
Morgan Stanley Institutional Fund, Inc. —
Growth Portfolio
Opinion on the Financial Statements
We have audited the accompanying statement of assets and liabilities of Growth Portfolio (the "Fund") (one of the funds constituting the Morgan Stanley Institutional Fund, Inc. (the "Company")), including the portfolio of investments, as of December 31, 2017, and the related statement of operations for the year then ended, the statements of changes in net assets for each of the two years in the period then ended, the financial highlights for each of the five years in the period then ended and the related notes (collectively referred to as the "financial statements"). In our opinion, the financial statements present fairly, in all material respects, the financial position of Growth Portfolio (one of the funds constituting Morgan Stanley Institutional Fund, Inc.) at December 31, 2017, the results of its operations for the year then ended, the changes in its net assets for each of the two years in the period then ended and its financial highlights for each of the five years in the period then ended, in conformity with U.S. generally accepted accounting principles.
Basis for Opinion
These financial statements are the responsibility of the Company's management. Our responsibility is to express an opinion on the Fund's financial statements based on our audits. We are a public accounting firm registered with the Public Company Accounting Oversight Board (United States) ("PCAOB") and are required to be independent with respect to the Company in accordance with the U.S. federal securities law and the applicable rules and regulations of the Securities and Exchange Commission and the PCAOB.
We conducted our audits in accordance with the standards of the PCAOB. Those standards require that we plan and perform the audit to obtain reasonable assurance about whether the financial statements are free of material misstatement, whether due to error or fraud. The Company is not required to have, nor were we engaged to perform, an audit of the Company's internal control over financial reporting. As part of our audits, we are required to obtain an understanding of internal control over financial reporting, but not for the purpose of expressing an opinion on the effectiveness of the Company's internal control over financial reporting. Accordingly, we express no such opinion.
Our audits included performing procedures to assess the risks of material misstatement of the financial statements, whether due to error or fraud, and performing procedures that respond to those risks. Such procedures included examining, on a test basis, evidence regarding the amounts and disclosures in the financial statements. Our procedures included confirmation of securities owned as of December 31, 2017 by correspondence with the custodian and others or by other appropriate auditing procedures where replies from others were not received. Our audits also included evaluating the accounting principles used and significant estimates made by management, as well as evaluating the overall presentation of the financial statements. We believe that our audits provide a reasonable basis for our opinion.

We have served as the auditor of one or more Morgan Stanley investment companies since 2000.
Boston, Massachusetts
February 26, 2018
29
Morgan Stanley Institutional Fund, Inc.
Annual Report — December 31, 2017
Federal Tax Notice (unaudited)
For federal income tax purposes, the following information is furnished with respect to the distributions paid by the Fund during its taxable year ended December 31, 2017. For corporate shareholders, 8.0% of the dividends qualified for the dividends received deduction.
The Fund designated and paid approximately $661,617,000 as a long-term capital gain distribution.
For federal income tax purposes, the following information is furnished with respect to the Fund's earnings for its taxable year ended December 31, 2017. When distributed, certain earnings may be subject to a maximum tax rate of 15% as provided for the Jobs and Growth Tax Relief Reconciliation Act of 2003. The Fund designated up to a maximum of approximately $10,235,000 as taxable at this lower rate.
In January, the Fund provides tax information to shareholders for the preceding calendar year.
30
Morgan Stanley Institutional Fund, Inc.
Annual Report — December 31, 2017
Privacy Notice (unaudited)
MORGAN STANLEY INVESTMENT MANAGEMENT INC.
AN IMPORTANT NOTICE CONCERNING OUR U.S. PRIVACY POLICY
We are required by federal law to provide you with a copy of our privacy policy annually. This policy applies to current and former individual investors in funds managed or sponsored by Morgan Stanley Investment Management Inc. ("MSIM") as well as current and former individual clients of MSIM. This policy is not applicable to partnerships, corporations, trusts or other non-individual clients or investors. Please note that we may amend this policy at any time, and will inform you of any changes as required by law.
WE RESPECT YOUR PRIVACY
We appreciate that you have provided us with your personal financial information. We strive to maintain the privacy of such information while we help you achieve your financial objectives. This Notice describes what non-public personal information we collect about you, why we collect it, when we may share it with others and how certain others may use it. It discusses the steps you may take to limit our sharing of certain information about you to affiliated companies in the Morgan Stanley family of companies ("other Morgan Stanley companies"). It also discloses how you may limit use of certain shared information for marketing purposes by other Morgan Stanley branded companies. Throughout this policy, we refer to the non-public information that personally identifies you or your accounts as "personal information."
1. WHAT PERSONAL INFORMATION DO WE COLLECT ABOUT YOU?
We obtain personal information from applications and other forms you submit to us, from your dealings with us, from consumer reporting agencies, from our Web sites and from third parties and other sources.
For example:
• We may collect information such as your name, address, e-mail address, telephone/fax numbers, assets, income and investment objectives through subscription documents, applications and other forms you submit to us.
• We may obtain information about account balances, your use of account(s) and the types of products and services you prefer to receive from us through your dealings and transactions with us and other sources.
• We may obtain information about your creditworthiness and credit history from consumer reporting agencies.
• We may collect background information from and through third-party vendors to verify representations you have made and to comply with various regulatory requirements.
• If you interact with us through our public and private Web sites, we may collect information that you provide directly through online communications (such as an e-mail address). We may also collect information about your Internet service provider, your domain name, your computer's operating system and Web browser, your use of our Web sites and your product and service preferences, through the use of "cookies." Please consult the Terms of Use of these sites for more details.
2. WHEN DO WE DISCLOSE PERSONAL INFORMATION WE COLLECT ABOUT YOU?
We may disclose personal information we collect about you to other Morgan Stanley companies and to non-affiliated third parties.
a. Information We Disclose to Other Morgan Stanley Companies.
We may disclose personal information to other Morgan Stanley companies for a variety of reasons, including to manage your account(s) effectively, to service and process your transactions, to let you know about products and services offered by us and other Morgan Stanley companies, to manage our business, and as otherwise required or permitted by law. Offers for products and services from other Morgan Stanley companies are developed under conditions designed to safeguard your personal information.
31
Morgan Stanley Institutional Fund, Inc.
Annual Report — December 31, 2017
Privacy Notice (unaudited) (cont'd)
b. Information We Disclose to Non-affiliated Third Parties.
We do not disclose personal information that we collect about you to non-affiliated third parties except to those who provide marketing services on our behalf, to financial institutions with whom we have joint marketing agreements, and as otherwise required or permitted by law. For example, we may disclose personal information to non-affiliated third parties for servicing and processing transactions, to offer our own products and services, to protect against fraud, for institutional risk control, to respond to judicial process or to perform services on our behalf. When we share personal information with a non-affiliated third party, they are required to limit their use of personal information to the particular purpose for which it was shared and they are not allowed to share personal information with others except to fulfill that limited purpose or as may be permitted or required by law.
3. HOW DO WE PROTECT THE SECURITY AND CONFIDENTIALITY OF PERSONAL INFORMATION WE COLLECT ABOUT YOU?
We maintain physical, electronic and procedural security measures to help safeguard the personal information we collect about you. We have internal policies governing the proper handling of client information. Third parties that provide support or marketing services on our behalf may also receive personal information, and we require them to adhere to confidentiality standards with respect to such information.
4. HOW CAN YOU LIMIT THE SHARING OF CERTAIN TYPES OF PERSONAL INFORMATION WITH OTHER MORGAN STANLEY COMPANIES?
We offer you choices as to whether we share with other Morgan Stanley companies the personal information that was collected to determine your eligibility for products and services you request ("eligibility information"). Eligibility information does not include your identification information or personal information pertaining to our transactions or experiences with you. Please note that, even if you direct us not to share eligibility information with other Morgan Stanley companies ("opt-out"), we may still share personal information, including eligibility information, with those companies in circumstances excluded from the opt-out under applicable law, such as to process transactions or to service your account.
5. HOW CAN YOU LIMIT THE USE OF CERTAIN TYPES OF PERSONAL INFORMATION BY OTHER MORGAN STANLEY COMPANIES FOR MARKETING?
By following the opt-out instructions in Section 6 below, you may limit other Morgan Stanley branded companies from marketing their products or services to you based on personal information we disclose to them. This information may include, for example, your income and account history with us. Please note that, even if you choose to limit Other Morgan Stanley Companies from using personal information about you that we may share with them for marketing their products and services to you, Other Morgan Stanley Companies may use your personal information that they obtain from us to market to you in circumstances permitted by law, such as if the Other Morgan Stanley Company has its own relationship with you.
6. HOW CAN YOU SEND US AN OPT-OUT INSTRUCTION?
If you wish to limit our sharing of eligibility information about you with other Morgan Stanley companies or other Morgan Stanley companies' use of personal information for marketing purposes, as described in this notice, you may do so by:
• Calling us at (800) 548-7786
Monday–Friday between 8a.m. and 6p.m.(EST)
• Writing to us at the following address:
DST Asset Manager Solutions, Inc.
c/o Privacy Coordinator
P.O. Box 219804
Kansas City, Missouri 64121
32
Morgan Stanley Institutional Fund, Inc.
Annual Report — December 31, 2017
Privacy Notice (unaudited) (cont'd)
Your written request should include your name, address, telephone number and account number(s) to which the opt-out applies and whether you are opting out with respect to sharing of eligibility information (Section 4 above), or if information used for Marketing (Section 5 above) or both. Written opt-out requests should not be sent with any other correspondence. In order to process your request, we require that the request be provided by you directly and not through a third party.
Your opt-out preference will remain in effect with respect to this policy (as it may be amended) until you notify us otherwise. If you have a joint account, your direction for us not to share this information with other Morgan Stanley companies and for those other Morgan Stanley companies not to use your personal information for marketing will be applied to all account holders on that account. Please understand that if you limit our sharing or our affiliated companies' use of personal information, you and any joint account holder(s) may not receive information about Morgan Stanley products and services, including products or services that could help you manage your financial resources and achieve your investment objectives.
7. WHAT IF AN AFFILIATED COMPANY BECOMES A NON-AFFILIATED THIRD PARTY?
If, at any time in the future, an affiliated company becomes a non-affiliated third party, further disclosures of personal information made to the former affiliated company will be limited to those described in Section 2(b) above relating to non-affiliated third parties. If you elected under Section 6 to limit disclosures we make to affiliated companies, or use of personal information by affiliated companies, your election will not apply to use by any former affiliated company of your personal information in their possession once it becomes a non-affiliated third party.
SPECIAL NOTICE TO RESIDENTS OF VERMONT
The following section supplements our policy with respect to our individual clients who have a Vermont address and supersedes anything to the contrary in the above policy with respect to those clients only.
The state of Vermont requires financial institutions to obtain your consent prior to sharing personal information that they collect about you with affiliated companies and non-affiliated third parties other than in certain limited circumstances. Except as permitted by law, we will not share personal information we collect about you with non-affiliated third parties or other Morgan Stanley companies unless you provide us with your written consent to share such information ("opt-in").
If you wish to receive offers for investment products and services offered by or through other Morgan Stanley companies, please notify us in writing at the following address:
DST Asset Manager Solutions, Inc.
c/o Privacy Coordinator
P.O. Box 219804
Kansas City, Missouri 64121
Your authorization should include your name, address, telephone number and account number(s) to which the opt-in applies and should not be sent with any other correspondence. In order to process your authorization, we require that the authorization be provided by you directly and not through a third party.
SPECIAL NOTICE TO RESIDENTS OF CALIFORNIA
The following section supplements our policy with respect to our individual clients who have a California address and supersedes anything to the contrary in the above policy with respect to those clients only.
In response to a California law, if your account has a California home address, your personal information will not be disclosed to non-affiliated third parties except as permitted by applicable California law, and we will limit sharing such information with our affiliates to comply with California privacy laws that apply to us.
33
Morgan Stanley Institutional Fund, Inc.
Annual Report — December 31, 2017
Director and Officer Information (unaudited)
Independent Directors:
Name, Age and Address of
Independent Director | | Position(s)
Held with
Registrant | | Length of Time
Served* | | Principal Occupation(s) During Past 5 Years
and Other Relevant Professional Experience | | Number of
Portfolios in
Fund Complex
Overseen by
Independent
Director** | | Other Directorships
Held by Independent
Director*** | |
Frank L. Bowman (73)
c/o Perkins Coie LLP
Counsel to the Independent
Directors
30 Rockefeller Plaza
New York, NY 10112 | | Director | | Since
August
2006 | | President, Strategic Decisions, LLC (consulting) (since February 2009); Director or Trustee of various Morgan Stanley Funds (since August 2006); Chairperson of the Compliance and Insurance Committee (since October 2015); formerly, Chairperson of the Insurance Sub-Committee of the Compliance and Insurance Committee (2007-2015); served as President and Chief Executive Officer of the Nuclear Energy Institute (policy organization) (February 2005-November 2008); retired as Admiral, U.S. Navy after serving over 38 years on active duty including 8 years as Director of the Naval Nuclear Propulsion Program in the Department of the Navy and the U.S. Department of Energy (1996-2004); served as Chief of Naval Personnel (July 1994-September 1996) and on the Joint Staff as Director of Political Military Affairs (June 1992-July 1994); knighted as Honorary Knight Commander of the Most Excellent Order of the British Empire; awarded the Officier de l'Orde National du Mérite by the French Government; elected to the National Academy of Engineering (2009). | | | 88 | | | Director of BP p.l.c.; Director of Naval and Nuclear Technologies LLP; Director Emeritus of the Armed Services YMCA; Director of the U.S. Naval Submarine League; Member of the National Security Advisory Council of the Center for U.S. Global Engagement and a member of the CNA Military Advisory Board; Trustee of Fairhaven United Methodist Church; and Director of other various non-profit organizations. | |
Kathleen A. Dennis (64)
c/o Perkins Coie LLP
Counsel to the Independent Directors
30 Rockefeller Plaza
New York, NY 10112 | | Director | | Since
August
2006 | | President, Cedarwood Associates (mutual fund and investment management consulting) (since July 2006); Chairperson of the Liquidity and Alternatives Sub-Committee of the Investment Committee (since October 2006) and Director or Trustee of various Morgan Stanley Funds (since August 2006); formerly, Senior Managing Director of Victory Capital Management (1993-2006). | | | 89 | | | Director of various non-profit organizations. | |
Nancy C. Everett (62)
c/o Perkins Coie LLP
Counsel to the Independent Directors
30 Rockefeller Plaza
New York, NY 10112 | | Director | | Since
January
2015 | | Chief Executive Officer, Virginia Commonwealth University Investment Company (since November 2015); Owner, OBIR, LLC (institutional investment management consulting) (since June 2014); formerly, Managing Director, BlackRock Inc. (February 2011-December 2013); and Chief Executive Officer, General Motors Asset Management (a/k/a Promark Global Advisors, Inc.) (June 2005-May 2010). | | | 90 | | | Formerly, Member of Virginia Commonwealth University School of Business Foundation (2005-2016); Member of Virginia Commonwealth University Board of Visitors (2013-2015); Member of Committee on Directors for Emerging Markets Growth Fund, Inc. (2007-2010); Chairperson of Performance Equity Management, LLC (2006-2010); and Chairperson, GMAM Absolute Return Strategies Fund, LLC (2006-2010). | |
34
Morgan Stanley Institutional Fund, Inc.
Annual Report — December 31, 2017
Director and Officer Information (unaudited) (cont'd)
Independent Directors: (cont'd)
Name, Age and Address of
Independent Director | | Position(s)
Held with
Registrant | | Length of Time
Served* | | Principal Occupation(s) During Past 5 Years
and Other Relevant Professional Experience | | Number of
Portfolios in
Fund Complex
Overseen by
Independent
Director** | | Other Directorships
Held by Independent
Director*** | |
Jakki L. Haussler (60)
c/o Perkins Coie LLP
Counsel to the Independent Directors
30 Rockefeller Plaza
New York, NY 10112 | | Director | | Since
January
2015 | | Chairman and Chief Executive Officer, Opus Capital Group (since January 1996); formerly, Director, Capvest Venture Fund, LP (May 2000-December 2011); Partner, Adena Ventures, LP (July 1999-December 2010); Director, The Victory Funds (February 2005- July 2008). | | | 90 | | | Director of Cincinnati Bell Inc. and Member, Audit Committee and Compensation Committee; Director of Northern Kentucky University Foundation and Member, Investment Committee; Member of Chase College of Law Transactional Law Practice Center Board of Advisors; Director of Best Transport; Director of Chase College of Law Board of Visitors; formerly, Member, University of Cincinnati Foundation Investment Committee; Member, Miami University Board of Visitors (2008-2011); Trustee of Victory Funds (2005-2008) and Chairman, Investment Committee (2007-2008) and Member, Service Provider Committee (2005-2008). | |
Dr. Manuel H. Johnson (68)
c/o Johnson Smick
International, Inc.
220 I Street, NE — Suite 200
Washington, D.C. 20002 | | Director | | Since
July
1991 | | Senior Partner, Johnson Smick International, Inc. (consulting firm); Chairperson of the Investment Committee (since October 2006) and Director or Trustee of various Morgan Stanley Funds (since July 1991); Co-Chairman and a founder of the Group of Seven Council (G7C) (international economic commission); formerly, Chairperson of the Audit Committee (July 1991-September 2006), Vice Chairman of the Board of Governors of the Federal Reserve System and Assistant Secretary of the U.S. Treasury. | | | 88 | | | Director of NVR, Inc. (home construction). | |
Joseph J. Kearns (75)
c/o Kearns & Associates LLC
46 E Peninsula Center #385
Rolling Hills Estates, CA
90274-3712 | | Director | | Since
August
1994 | | Senior Adviser, Kearns & Associates LLC (investment consulting); Chairperson of the Audit Committee (since October 2006) and Director or Trustee of various Morgan Stanley Funds (since August 1994); formerly, Deputy Chairperson of the Audit Committee (July 2003-September 2006) and Chairperson of the Audit Committee of various Morgan Stanley Funds (since August 1994); CFO of the J. Paul Getty Trust. | | | 89 | | | Prior to August 10, 2016, Director of Electro Rent Corporation (equipment leasing); Prior to December 31, 2013, Director of The Ford Family Foundation. | |
35
Morgan Stanley Institutional Fund, Inc.
Annual Report — December 31, 2017
Director and Officer Information (unaudited) (cont'd)
Independent Directors: (cont'd)
Name, Age and Address of
Independent Director | | Position(s)
Held with
Registrant | | Length of Time
Served* | | Principal Occupation(s) During Past 5 Years
and Other Relevant Professional Experience | | Number of
Portfolios in
Fund Complex
Overseen by
Independent
Director** | | Other Directorships
Held by Independent
Director*** | |
Michael F. Klein (59)
c/o Perkins Coie LLP
Counsel to the Independent Directors
30 Rockefeller Plaza
New York, NY 10112 | | Director | | Since
August
2006 | | Managing Director, Aetos Capital, LLC (since March 2000); Co-President, Aetos Alternatives Management, LLC (since January 2004) and Co-Chief Executive Officer of Aetos Capital LLC (since August 2013); Chairperson of the Fixed Income Sub-Committee of the Investment Committee (since October 2006) and Director or Trustee of various Morgan Stanley Funds (since August 2006); formerly, Managing Director, Morgan Stanley & Co. Inc. and Morgan Stanley Dean Witter Investment Management, President, various Morgan Stanley Funds (June 1998-March 2000) and Principal, Morgan Stanley & Co. Inc. and Morgan Stanley Dean Witter Investment Management (August 1997-December 1999). | | | 88 | | | Director of certain investment funds managed or sponsored by Aetos Capital, LLC; Director of Sanitized AG and Sanitized Marketing AG (specialty chemicals). | |
Patricia Maleski (57)
c/o Perkins Coie LLP
Counsel to the Independent Directors
30 Rockefeller Plaza
New York, NY 10112 | | Director | | Since
January
2017 | | Managing Director, JPMorgan Asset Management (2004-2016); Oversight and Control Head of Fiduciary and Conflicts of Interest Program (2015-2016); Chief Control Officer-Global Asset Management (2013-2015); President, JPMorgan Funds (2010-2013); Chief Administrative Officer (2004-2013); various other positions including Treasurer and Board Liaison (since 2001). | | | 90 | | | None. | |
Michael E. Nugent (81)
522 Fifth Avenue
New York, NY 10036 | | Chair of the Board and Director | | Chair of the Boards since July 2006 and Director since July 1991 | | Chair of the Boards of various Morgan Stanley Funds (since July 2006); Chairperson of the Closed-End Fund Committee (since June 2012) and Director or Trustee of various Morgan Stanley Funds (since July 1991); formerly, Chairperson of the Insurance Committee (until July 2006); General Partner, Triumph Capital, L.P. (private investment partnership) (1988-2013). | | | 88 | | | None. | |
W. Allen Reed (70)
c/o Perkins Coie LLP
Counsel to the Independent Directors
30 Rockefeller Plaza
New York, NY 10112 | | Director | | Since
August
2006 | | Chairperson of the Equity Sub-Committee of the Investment Committee (since October 2006) and Director or Trustee of various Morgan Stanley Funds (since August 2006); formerly, President and CEO of General Motors Asset Management; Chairman and Chief Executive Officer of the GM Trust Bank and Corporate Vice President of General Motors Corporation (August 1994-December 2005). | | | 89 | | | Director of Legg Mason, Inc.; formerly, Director of the Auburn University Foundation (2010-2015). | |
Fergus Reid (85)
c/o Joe Pietryka, Inc.
85 Charles Colman Blvd.
Pawling, NY 12564 | | Director | | Since
June
1992 | | Chairman, Joe Pietryka, Inc.; Chairperson of the Governance Committee and Director or Trustee of various Morgan Stanley Funds (since June 1992). | | | 89 | | | Formerly, Trustee and Director of certain investment companies in the JP Morgan Fund Complex managed by JP Morgan Investment Management Inc. (1987-2012). | |
* This is the earliest date the Director began serving the Morgan Stanley Funds. Each Director serves an indefinite term, until his or her successor is elected.
** The Fund Complex includes (as of December 31, 2017) all open-end and closed-end funds (including all of their portfolios) advised by Morgan Stanley Investment Management Inc. (the "Adviser") and any funds that have an adviser that is an affiliated person of the Adviser (including, but not limited to, Morgan Stanley AIP GP LP).
*** This includes any directorships at public companies and registered investment companies held by the Director at any time during the past five years.
36
Morgan Stanley Institutional Fund, Inc.
Annual Report — December 31, 2017
Director and Officer Information (unaudited) (cont'd)
Executive Officers:
Name, Age and Address of Executive Officer | | Position(s) Held
with
Registrant | | Length of Time
Served* | | Principal Occupation(s) During Past 5 Years | |
John H. Gernon (54)
522 Fifth Avenue
New York, NY 10036 | | President and Principal Executive Officer | | Since
September
2013 | | President and Principal Executive Officer of the Equity and Fixed Income Funds and the Morgan Stanley AIP Funds (since September 2013) and the Liquidity Funds and various money market funds (since May 2014) in the Fund Complex; Managing Director of the Adviser; Head of Product (since 2006). | |
Timothy J. Knierim (58)
522 Fifth Avenue
New York, NY 10036 | | Chief Compliance Officer | | Since
December
2016 | | Managing Director of the Adviser and various entities affiliated with the Adviser; Chief Compliance Officer of various Morgan Stanley Funds and the Adviser (since December 2016) and Chief Compliance Officer of Morgan Stanley AIP GP LP (since 2014). Formerly, Managing Director and Deputy Chief Compliance Officer of the Adviser (2014-2016); and formerly, Chief Compliance Officer of Prudential Investment Management, Inc. (2007-2014). | |
Francis J. Smith (52)
522 Fifth Avenue
New York, NY 10036 | | Treasurer and Principal Financial Officer | | Treasurer since July 2003 and Principal Financial Officer since September 2002 | | Managing Director of the Adviser and various entities affiliated with the Adviser; Treasurer (since July 2003) and Principal Financial Officer of various Morgan Stanley Funds (since September 2002). | |
Mary E. Mullin (50)
522 Fifth Avenue
New York, NY 10036 | | Secretary | | Since
June
1999 | | Managing Director of the Adviser; Secretary of various Morgan Stanley Funds (since June 1999). | |
Michael J. Key (38)
522 Fifth Avenue
New York, NY 10036 | | Vice President | | Since
June
2017 | | Vice President of the Equity and Fixed Income Funds, Liquidity Funds, various money market funds and the Morgan Stanley AIP Funds in the Fund Complex (since June 2017); Executive Director of the Adviser; Head of Product Development for Equity and Fixed Income Funds (since August 2013). | |
* This is the earliest date the officer began serving the Morgan Stanley Funds. Each officer serves a one-year term, until his or her successor is elected and qualifies.
37
Morgan Stanley Institutional Fund, Inc.
Annual Report — December 31, 2017
Adviser and Administrator
Morgan Stanley Investment Management Inc.
522 Fifth Avenue
New York, New York 10036
Distributor
Morgan Stanley Distribution, Inc.
522 Fifth Avenue
New York, New York 10036
Dividend Disbursing and Transfer Agent
DST Asset Manager Solutions, Inc.
2000 Crown Colony Drive
Quincy, Massachusetts 02169
Custodian
State Street Bank and Trust Company
One Lincoln Street
Boston, Massachusetts 02111
Legal Counsel
Dechert LLP
1095 Avenue of the Americas
New York, New York 10036
Counsel to the Independent Directors
Perkins Coie LLP
30 Rockefeller Plaza
New York, New York 10112
Independent Registered Public Accounting Firm
Ernst & Young LLP
200 Clarendon Street
Boston, Massachusetts 02116
Reporting to Shareholders
Each Morgan Stanley Fund provides a complete schedule of portfolio holdings in its semi-annual and annual reports within 60 days of the end of the fund's second and fourth fiscal quarters. The semi-annual and annual reports are filed electronically with the Securities and Exchange Commission (SEC) on Form N-CSRS and Form N-CSR, respectively. Morgan Stanley also delivers the semi-annual and annual reports to fund shareholders and makes these reports available on its public website, www.morganstanley.com/im. Each Morgan Stanley fund also files a complete schedule of portfolio holdings with the SEC for the fund's first and third fiscal quarters on Form N-Q. Morgan Stanley does not deliver the reports for the first and third fiscal quarters to shareholders, nor are the reports posted to the Morgan Stanley public website. You may, however, obtain the Form N-Q filings (as well as the Form N-CSR and N-CSRS filings) by accessing the SEC's website, www.sec.gov. You may also review and copy them at the SEC's Public Reference Room in Washington, DC. Information on the operation of the SEC's Public Reference Room may be obtained by calling the SEC toll free at 1 (800) SEC-0330. You can also request copies of these materials, upon payment of a duplicating fee, by electronic request at the SEC's email address (publicinfo@sec.gov) or by writing to the SEC's Public Reference Section, Washington, D.C. 20549-1520.
Proxy Voting Policies and Procedures and Proxy Voting Record
You may obtain a copy of the Company's Proxy Voting Policy and Procedures and information regarding how the Company voted proxies relating to portfolio securities during the most recent twelve-month period ended June 30, without charge, upon request, by calling toll free 1 (800) 548-7786 or by visiting our website at www.morganstanley.com/im. This information is also available on the SEC's website at www.sec.gov.
This report is authorized for distribution only when preceded or accompanied by a prospectus or summary prospectus of the applicable Fund of Morgan Stanley Institutional Fund, Inc., which describes in detail the Fund's investment policies, risks, fees and expenses. Please read the prospectus carefully before you invest or send money. For additional information, including information regarding the investments comprising the Fund, please visit our website at www.morganstanley.com/im or call toll free 1 (800) 548-7786.
38
Printed in U.S.A.
This Report has been prepared for shareholders and may be distributed to others only if preceded or accompanied by a current prospectus.
Morgan Stanley Investment Management Inc.
522 Fifth Avenue
New York, New York 10036
© 2018 Morgan Stanley. Morgan Stanley Distribution, Inc.

IFIGRWANN
2007715 EXP. 02.28.19

Morgan Stanley Institutional Fund, Inc.
Insight Portfolio
Annual Report
December 31, 2017

Morgan Stanley Institutional Fund, Inc.
Annual Report — December 31, 2017
Shareholders' Letter | | | 2 | | |
Expense Example | | | 3 | | |
Investment Overview | | | 4 | | |
Portfolio of Investments | | | 6 | | |
Statement of Assets and Liabilities | | | 8 | | |
Statement of Operations | | | 10 | | |
Statements of Changes in Net Assets | | | 11 | | |
Financial Highlights | | | 13 | | |
Notes to Financial Statements | | | 17 | | |
Report of Independent Registered Public Accounting Firm | | | 24 | | |
Federal Tax Notice | | | 25 | | |
Privacy Notice | | | 26 | | |
Director and Officer Information | | | 29 | | |
This report is authorized for distribution only when preceded or accompanied by a prospectus or summary prospectus of the applicable Fund of Morgan Stanley Institutional Fund, Inc. To receive a prospectus and/or statement of additional information (SAI), which contains more complete information such as investment objectives, charges, expenses, policies for voting proxies, risk considerations, and describes in detail each of the Fund's investment policies to the prospective investor, please call toll free 1 (800) 548-7786. Please read the prospectuses carefully before you invest or send money.
Additionally, you can access information about the Fund, including performance, characteristics, and investment team commentary, through Morgan Stanley Investment Management's website: www.morganstanley.com/im.
Market forecasts provided in this report may not necessarily come to pass. There is no guarantee that any sectors mentioned will continue to perform as discussed herein or that securities in such sectors will be held by the Fund in the future. There is no assurance that a fund will achieve its investment objective. Funds are subject to market risk, which is the possibility that market values of securities owned by the Fund will decline and, therefore, the value of the Fund's shares may be less than what you paid for them. Accordingly, you can lose money investing in this Fund. Please see the prospectus for more complete information on investment risks.
1
Morgan Stanley Institutional Fund, Inc.
Annual Report — December 31, 2017
Shareholders' Letter (unaudited)
Dear Shareholders,
We are pleased to provide this Annual report, in which you will learn how your investment in Insight Portfolio (the "Fund") performed during the latest twelve-month period.
Morgan Stanley Investment Management is a client-centric, investor-led organization. Our global presence, intellectual capital, and breadth of products and services enable us to partner with investors to meet the evolving challenges of today's financial markets. We aim to deliver superior investment service and to empower our clients to make the informed decisions that help them reach their investment goals.
As always, we thank you for selecting Morgan Stanley Investment Management, and look forward to working with you in the months and years ahead.
Sincerely,

John H. Gernon
President and Principal Executive Officer
January 2018
2
Morgan Stanley Institutional Fund, Inc.
Annual Report — December 31, 2017
Expense Example (unaudited)
Insight Portfolio
As a shareholder of the Fund, you incur two types of costs: (1) transactional costs; and (2) ongoing costs, which may include advisory fees, administration fees, distribution and shareholder services fees and other Fund expenses. This example is intended to help you understand your ongoing costs (in dollars) of investing in the Fund and to compare these costs with the ongoing costs of investing in other mutual funds.
This example is based on an investment of $1,000 invested at the beginning of the six-month period ended December 31, 2017 and held for the entire six-month period.
Actual Expenses
The table below provides information about actual account values and actual expenses. You may use the information in this table, together with the amount you invested, to estimate the expenses that you paid over the period. Simply divide your account value by $1,000 (for example, an $8,600 account value divided by $1,000 = 8.6), then multiply the result by the number in the table under the heading entitled "Actual Expenses Paid During Period" to estimate the expenses you paid on your account during this period.
Hypothetical Example for Comparison Purposes
The table below provides information about hypothetical account values and hypothetical expenses based on the Fund's actual expense ratio and an assumed rate of return of 5% per year before expenses, which is not the Fund's actual return. The hypothetical account values and expenses may not be used to estimate the actual ending account balance or expenses you paid for the period. You may use this information to compare the ongoing costs of investing in the Fund and other funds. To do so, compare this 5% hypothetical example with the 5% hypothetical examples that appear in the shareholder reports of the other funds.
Please note that the expenses shown in the table are meant to highlight your ongoing costs only and do not reflect any transactional costs, such as sales charges (loads). Therefore, the information for each class in the table is useful in comparing ongoing costs only, and will not help you determine the relative total costs of owning different funds. In addition, if these transactional costs were included, your costs would have been higher.
| | | Beginning
Account
Value
7/1/17 | | Actual Ending
Account
Value
12/31/17 | | Hypothetical
Ending Account
Value | | Actual
Expenses
Paid
During
Period* | | Hypothetical
Expenses Paid
During Period* | | Net
Expense
Ratio
During
Period** | |
Insight Portfolio Class I | | $ | 1,000.00 | | | $ | 1,094.80 | | | $ | 1,020.06 | | | $ | 5.39 | | | $ | 5.19 | | | | 1.02 | % | |
Insight Portfolio Class A | | | 1,000.00 | | | | 1,092.40 | | | | 1,018.20 | | | | 7.33 | | | | 7.07 | | | | 1.39 | | |
Insight Portfolio Class L | | | 1,000.00 | | | | 1,090.10 | | | | 1,015.78 | | | | 9.85 | | | | 9.50 | | | | 1.87 | | |
Insight Portfolio Class C | | | 1,000.00 | | | | 1,088.60 | | | | 1,014.52 | | | | 11.16 | | | | 10.76 | | | | 2.12 | | |
* Expenses are calculated using each Fund Class' annualized net expense ratio (as disclosed), multiplied by the average account value over the period, and multiplied by 184/365 (to reflect the most recent one-half year period).
** Annualized.
3
Morgan Stanley Institutional Fund, Inc.
Annual Report — December 31, 2017
Investment Overview (unaudited)
Insight Portfolio
The Fund seeks long-term capital appreciation.
Performance
For the year ended December 31, 2017, the Fund's Class I shares had a total return based on net asset value and reinvestment of distributions per share of 18.28%, net of fees. The Fund's Class I shares outperformed the Fund's benchmark, the Russell 3000® Value Index (the "Index"), which returned 13.19%.
Factors Affecting Performance
• Major U.S. stock indexes spent most of 2017 climbing toward, then exceeding, new record highs. Fueling their momentum was a combination of strong economic growth, robust corporate profits (aided, in part, by a weak dollar) and optimism for tax reform. While the Federal Reserve raised its benchmark interest rate three times in 2017, the moves were incremental and not considered a headwind to the economy's momentum. Notable uncertainties in domestic politics and geopolitics also failed to disrupt the market's advance. Overall, market volatility remained historically low, further bolstering investor confidence in stocks.
• The Index's performance was led by the information technology (IT), materials and health care sectors. The telecommunication services and energy sectors had negative returns for the period, and real estate was also among the weakest-performing sectors.
• The long-term investment horizon and conviction-weighted investment approach embraced by the team can result in periods of performance deviation from the benchmark and peers. In this reporting period, favorable stock selection largely drove the Fund's relative outperformance, with a smaller contribution from sector allocations.
• The health care sector contributed the largest relative gain. Both stock selection and an overweight allocation in the sector were beneficial, led by the portfolio's holding in a Danish pharmaceutical company (which is not represented in the Index).
• Stock selection in the industrials sector added to relative results. A U.K.-based multinational provider of flight services to business and private
aircraft was the main contributor in the sector (and the stock is not included in the Index).
• The Fund's significant underweight allocation in the energy sector was beneficial to relative performance, as the sector had declining performance in the period. However, our stock selection in energy was unfavorable, mildly offsetting the relative gain.
• Stock selection in the consumer discretionary sector adversely affected performance. A U.S. outdoor sports and recreation products maker was the leading detractor within the sector and across the whole portfolio for the period.
• Both stock selection and an underweight allocation in the information technology sector dampened relative performance. The Fund's underperformance was driven by an out-of-benchmark holding in a French commerce marketing technology leader, which helps internet retailers retarget online advertising toward consumers, as well as having less exposure to overall IT sector, the Index's top-performing sector.
Management Strategies
• There were no changes to our bottom-up investment process during the period. We seek to invest primarily in established and cyclical franchise companies that we believe have strong name recognition, sustainable competitive advantages, ample growth prospects, and are trading at an attractive discount to future cash flow generation capacity or asset value. We typically favor companies with the ability to generate attractive free cash flow yields. We utilize a bottom-up stock selection process, seeking attractive investments on an individual company basis. Our emphasis is on long-term results, and hence short-term market events are not as meaningful in the stock selection process.
4
Morgan Stanley Institutional Fund, Inc.
Annual Report — December 31, 2017
Investment Overview (unaudited) (cont'd)
Insight Portfolio
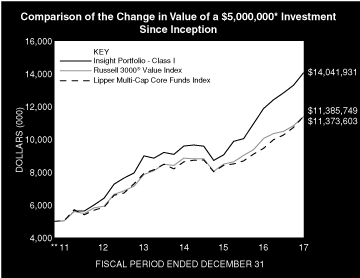
* Minimum Investment for Class I shares
** Commenced Operations on December 28, 2011.
In accordance with SEC regulations, the Fund's performance shown assumes that all recurring fees (including management fees) were deducted and all dividends and distributions were reinvested. The performance of Class A, L and C shares will vary from the performance of Class I shares and will be impacted by additional fees assessed to those classes.
Performance Compared to the Russell 3000® Value Index(1) and the Lipper Multi-Cap Core Funds Index(2)
| | Period Ended December 31, 2017
Total Returns(3) | |
| | | | Average Annual | |
| | One
Year | | Five
Years | | Ten
Years | | Since
Inception(6) | |
Fund — Class I Shares
w/o sales charges(4) | | | 18.28 | % | | | 16.97 | % | | | — | | | | 18.75 | % | |
Fund — Class A Shares
w/o sales charges(4) | | | 17.82 | | | | 16.58 | | | | — | | | | 18.38 | | |
Fund — Class A Shares with
maximum 5.25% sales charges(4) | | | 11.62 | | | | 15.32 | | | | — | | | | 17.33 | | |
Fund — Class L Shares
w/o sales charges(4) | | | 17.21 | | | | 16.00 | | | | — | | | | 17.79 | | |
Fund — Class C Shares
w/o sales charges(5) | | | 16.93 | | | | — | | | | — | | | | 14.06 | | |
Fund — Class C Shares with
maximum 1.00% deferred sales
charges(5) | | | 15.93 | | | | — | | | | — | | | | 14.06 | | |
Russell 3000® Value Index | | | 13.19 | | | | 13.95 | | | | — | | | | 14.66 | | |
Lipper Multi-Cap Core Funds Index | | | 20.54 | | | | 14.24 | | | | — | | | | 14.68 | | |
Performance data quoted represents past performance, which is no guarantee of future results, and current performance may be lower or higher than the figures shown. Performance assumes that all dividends and distributions, if any, were reinvested. For the most recent month-end performance figures, please visit www.morganstanley.com/im. Investment return and principal value will fluctuate so that Fund shares, when redeemed, may be worth more or less than their original cost. Total returns do not reflect the deduction of taxes that a shareholder would pay on Fund distributions or the redemption of Fund shares. Performance of share classes will vary due to difference in sales charges and expenses.
(1) The Russell 3000® Value Index measures the performance of those companies in the Russell 3000® Index with lower price-to-book ratios and lower forecasted growth values. The Russell 3000® Index measures the performance of the largest 3000 U.S. companies representing approximately 98% of the investable U.S. equity market. The Index is unmanaged and its returns do not include any sales charges or fees. Such costs would lower performance. It is not possible to invest directly in an index.
(2) The Lipper Multi-Cap Core Funds Index is an equally weighted performance index of the largest qualifying funds (based on net assets) in the Lipper Multi-Cap Core Funds classification. The Index, which is adjusted for capital gains distributions and income dividends, is unmanaged and should not be considered an investment. There are currently 30 funds represented in this Index. As of the date of this report, the Fund is in the Lipper Multi-Cap Core Funds classification.
(3) Total returns for theFund reflect fees waived and expenses reimbursed, if applicable, by the Adviser. Without such waivers and reimbursements, total returns would have been lower.
(4) Commenced operations on December 28, 2011.
(5) Commenced offering on April 30, 2015.
(6) For comparative purposes, average annual since inception returns listed for the Indexes refer to the inception date of Class I of the Fund, not the inception of the Index.
5
Morgan Stanley Institutional Fund, Inc.
Annual Report — December 31, 2017
Portfolio of Investments
Insight Portfolio
| | | Shares | | Value
(000) | |
Common Stocks (81.9%) | |
Aerospace & Defense (4.6%) | |
United Technologies Corp. | | | 38,398 | | | $ | 4,898 | | |
Auto Components (1.9%) | |
Autoliv, Inc. | | | 15,782 | | | | 2,005 | | |
Automobiles (6.2%) | |
Harley-Davidson, Inc. | | | 129,296 | | | | 6,579 | | |
Banks (4.1%) | |
First Hawaiian, Inc. | | | 69,105 | | | | 2,017 | | |
Signature Bank (a) | | | 16,774 | | | | 2,302 | | |
| | | | 4,319 | | |
Biotechnology (1.7%) | |
Biogen, Inc. (a) | | | 5,728 | | | | 1,825 | | |
Chemicals (8.7%) | |
Agrium, Inc. (Canada) | | | 49,177 | | | | 5,656 | | |
Mosaic Co. (The) | | | 140,781 | | | | 3,613 | | |
| | | | 9,269 | | |
Commercial Services & Supplies (2.2%) | |
Ritchie Bros Auctioneers, Inc. (Canada) | | | 79,549 | | | | 2,381 | | |
Diversified Financial Services (5.8%) | |
Berkshire Hathaway, Inc., Class B (a) | | | 9,447 | | | | 1,873 | | |
Leucadia National Corp. | | | 163,165 | | | | 4,322 | | |
| | | | 6,195 | | |
Energy Equipment & Services (1.3%) | |
Dril-Quip, Inc. (a) | | | 28,168 | | | | 1,344 | | |
Health Care Equipment & Supplies (2.9%) | |
Intuitive Surgical, Inc. (a) | | | 8,445 | | | | 3,082 | | |
Health Care Providers & Services (2.0%) | |
DaVita, Inc. (a) | | | 29,651 | | | | 2,142 | | |
Hotels, Restaurants & Leisure (1.4%) | |
Habit Restaurants, Inc. (The) (a) | | | 6,360 | | | | 61 | | |
Potbelly Corp. (a) | | | 111,201 | | | | 1,368 | | |
YogaWorks, Inc. (a) | | | 30,852 | | | | 87 | | |
| | | | 1,516 | | |
Insurance (2.3%) | |
Progressive Corp. (The) | | | 44,163 | | | | 2,487 | | |
Internet Software & Services (1.5%) | |
Criteo SA ADR (France) (a) | | | 62,162 | | | | 1,618 | | |
Leisure Products (0.6%) | |
Vista Outdoor, Inc. (a) | | | 44,400 | | | | 647 | | |
Machinery (5.9%) | |
Welbilt, Inc. (a) | | | 266,366 | | | | 6,262 | | |
Media (7.2%) | |
Time Warner, Inc. | | | 84,107 | | | | 7,693 | | |
Multi-Line Retail (2.5%) | |
Dillard's, Inc., Class A (b) | | | 44,424 | | | | 2,668 | | |
Pharmaceuticals (4.7%) | |
Novo Nordisk A/S Series B (Denmark) | | | 92,916 | | | | 4,994 | | |
| | | Shares | | Value
(000) | |
Specialty Retail (9.5%) | |
CarMax, Inc. (a) | | | 70,052 | | | $ | 4,492 | | |
Container Store Group, Inc. (The) (a) | | | 64,380 | | | | 305 | | |
L Brands, Inc. | | | 48,897 | | | | 2,945 | | |
Ulta Salon Cosmetics & Fragrance, Inc. (a) | | | 10,802 | | | | 2,416 | | |
| | | | 10,158 | | |
Trading Companies & Distributors (2.9%) | |
Fastenal Co. | | | 56,040 | | | | 3,065 | | |
Transportation Infrastructure (2.0%) | |
BBA Aviation PLC (United Kingdom) | | | 451,717 | | | | 2,132 | | |
Total Common Stocks (Cost $79,241) | | | 87,279 | | |
Short-Term Investments (21.6%) | |
Securities held as Collateral on Loaned Securities (2.6%) | |
Investment Company (1.9%) | |
Morgan Stanley Institutional Liquidity
Funds — Treasury Securities Portfolio —
Institutional Class (See Note G) | | | 2,012,312 | | | | 2,012 | | |
| | | Face
Amount
(000) | | | |
Repurchase Agreements (0.7%) | |
Barclays Capital, Inc., (1.37%,
dated 12/29/17, due 1/2/18;
proceeds $463; fully collateralized
by a U.S. Government obligation;
1.75% due 5/15/23; valued at $472) | | $ | 463 | | | | 463 | | |
HSBC Securities USA, Inc., (1.30%,
dated 12/29/17, due 1/2/18;
proceeds $36; fully collateralized
by a U.S. Government obligation;
3.00% due 2/15/47; valued at $37) | | | 36 | | | | 36 | | |
Merrill Lynch & Co., Inc., (1.42%, dated
12/29/17, due 1/2/18; proceeds
$237; fully collateralized by a
U.S. Government obligation; 2.00%
due 12/31/21; valued at $242) | | | 237 | | | | 237 | | |
| | | | 736 | | |
Total Securities held as Collateral on Loaned
Securities (Cost $2,748) | | | 2,748 | | |
| | | Shares | | | |
Investment Company (19.0%) | |
Morgan Stanley Institutional Liquidity
Funds — Treasury Securities
Portfolio — Institutional Class
(See Note G) (Cost $20,292) | | | 20,291,770 | | | | 20,292 | | |
Total Short-Term Investments (Cost $23,040) | | | 23,040 | | |
Total Investments (103.5%) (Cost $102,281)
Including $2,651 of Securities Loaned (c)(d) | | | 110,319 | | |
Liabilities in Excess of Other Assets (–3.5%) | | | (3,770 | ) | |
Net Assets (100.0%) | | $ | 106,549 | | |
The accompanying notes are an integral part of the financial statements.
6
Morgan Stanley Institutional Fund, Inc.
Annual Report — December 31, 2017
Portfolio of Investments (cont'd)
Insight Portfolio
(a) Non-income producing security.
(b) All or a portion of this security was on loan at December 31, 2017.
(c) The approximate fair value and percentage of net assets, $7,126,000 and 6.7%, respectively, represent the securities that have been fair valued under the fair valuation policy for international investments as described in Note A-1 within the Notes to the Financial Statements.
(d) At December 31, 2017, the aggregate cost for federal income tax purposes is approximately $102,392,000. The aggregate gross unrealized appreciation is approximately $10,032,000 and the aggregate gross unrealized depreciation is approximately $2,105,000, resulting in net unrealized appreciation of approximately $7,927,000.
Portfolio Composition*
Classification | | Percentage of
Total Investments | |
Other** | | | 37.7 | % | |
Short-Term Investments | | | 19.0 | | |
Specialty Retail | | | 9.5 | | |
Chemicals | | | 8.7 | | |
Media | | | 7.2 | | |
Automobiles | | | 6.2 | | |
Machinery | | | 5.9 | | |
Diversified Financial Services | | | 5.8 | | |
Total Investments | | | 100.0 | % | |
* Percentages indicated are based upon total investments (excluding Securities held as Collateral on Loaned Securities) as of December 31, 2017.
** Industries and/or investment types representing less than 5% of total investments.
The accompanying notes are an integral part of the financial statements.
7
Morgan Stanley Institutional Fund, Inc.
Annual Report — December 31, 2017
Statement of Assets and Liabilities | | December 31, 2017
(000) | |
Assets: | |
Investments in Securities of Unaffiliated Issuers, at Value(1) (Cost $79,977) | | $ | 88,015 | | |
Investment in Security of Affiliated Issuer, at Value (Cost $22,304) | | | 22,304 | | |
Total Investments in Securities, at Value (Cost $102,281) | | | 110,319 | | |
Foreign Currency, at Value (Cost —@) | | | — | @ | |
Receivable for Fund Shares Sold | | | 138 | | |
Dividends Receivable | | | 52 | | |
Receivable from Affiliate | | | 15 | | |
Tax Reclaim Receivable | | | 11 | | |
Receivable from Securities Lending Income | | | 4 | | |
Other Assets | | | 57 | | |
Total Assets | | | 110,596 | | |
Liabilities: | |
Collateral on Securities Loaned, at Value | | | 2,748 | | |
Payable for Investments Purchased | | | 1,057 | | |
Payable for Advisory Fees | | | 108 | | |
Payable for Professional Fees | | | 46 | | |
Payable for Fund Shares Redeemed | | | 40 | | |
Payable for Custodian Fees | | | 14 | | |
Payable for Shareholder Services Fees — Class A | | | 4 | | |
Payable for Distribution and Shareholder Services Fees — Class L | | | — | @ | |
Payable for Distribution and Shareholder Services Fees — Class C | | | 8 | | |
Payable for Administration Fees | | | 7 | | |
Payable for Sub Transfer Agency Fees — Class I | | | — | @ | |
Payable for Sub Transfer Agency Fees — Class A | | | 3 | | |
Payable for Sub Transfer Agency Fees — Class L | | | — | @ | |
Payable for Sub Transfer Agency Fees — Class C | | | 2 | | |
Payable for Transfer Agency Fees — Class I | | | 1 | | |
Payable for Transfer Agency Fees — Class A | | | 1 | | |
Payable for Transfer Agency Fees — Class L | | | — | @ | |
Payable for Transfer Agency Fees — Class C | | | 1 | | |
Other Liabilities | | | 7 | | |
Total Liabilities | | | 4,047 | | |
Net Assets | | $ | 106,549 | | |
Net Assets Consist Of: | |
Paid-in-Capital | | $ | 96,655 | | |
Accumulated Undistributed Net Investment Income | | | 17 | | |
Accumulated Net Realized Gain | | | 1,838 | | |
Unrealized Appreciation (Depreciation) on: | |
Investments | | | 8,038 | | |
Foreign Currency Translations | | | 1 | | |
Net Assets | | $ | 106,549 | | |
The accompanying notes are an integral part of the financial statements.
8
Morgan Stanley Institutional Fund, Inc.
Annual Report — December 31, 2017
Statement of Assets and Liabilities (cont'd) | | December 31, 2017
(000) | |
CLASS I: | |
Net Assets | | $ | 78,077 | | |
| Shares Outstanding $0.001 par value shares of beneficial interest (unlimited shares authorized) (not in 000's) | | | 4,720,583 | | |
Net Asset Value, Offering and Redemption Price Per Share | | $ | 16.54 | | |
CLASS A: | |
Net Assets | | $ | 18,557 | | |
| Shares Outstanding $0.001 par value shares of beneficial interest (unlimited shares authorized) (not in 000's) | | | 1,128,045 | | |
Net Asset Value, Redemption Price Per Share | | $ | 16.45 | | |
Maximum Sales Load | | | 5.25 | % | |
Maximum Sales Charge | | $ | 0.91 | | |
Maximum Offering Price Per Share | | $ | 17.36 | | |
CLASS L: | |
Net Assets | | $ | 149 | | |
| Shares Outstanding $0.001 par value shares of beneficial interest (unlimited shares authorized) (not in 000's) | | | 9,335 | | |
Net Asset Value, Offering and Redemption Price Per Share | | $ | 16.00 | | |
CLASS C: | |
Net Assets | | $ | 9,766 | | |
| Shares Outstanding $0.001 par value shares of beneficial interest (unlimited shares authorized) (not in 000's) | | | 614,547 | | |
Net Asset Value, Offering and Redemption Price Per Share | | $ | 15.89 | | |
(1) Including:
Securities on Loan, at Value: | | $ | 2,651 | | |
@ Amount is less than $500.
The accompanying notes are an integral part of the financial statements.
9
Morgan Stanley Institutional Fund, Inc.
Annual Report — December 31, 2017
Statement of Operations | | Year Ended
December 31, 2017
(000) | |
Investment Income: | |
Dividends from Securities of Unaffiliated Issuers (Net of $32 of Foreign Taxes Withheld) | | $ | 725 | | |
Dividends from Security of Affiliated Issuer (Note G) | | | 77 | | |
Income from Securities Loaned — Net | | | 16 | | |
Total Investment Income | | | 818 | | |
Expenses: | |
Advisory Fees (Note B) | | | 459 | | |
Professional Fees | | | 121 | | |
Shareholder Services Fees — Class A (Note D) | | | 35 | | |
Distribution and Shareholder Services Fees — Class L (Note D) | | | 1 | | |
Distribution and Shareholder Services Fees — Class C (Note D) | | | 63 | | |
Registration Fees | | | 65 | | |
Sub Transfer Agency Fees — Class I | | | 30 | | |
Sub Transfer Agency Fees — Class A | | | 15 | | |
Sub Transfer Agency Fees — Class L | | | — | @ | |
Sub Transfer Agency Fees — Class C | | | 5 | | |
Administration Fees (Note C) | | | 46 | | |
Custodian Fees (Note F) | | | 24 | | |
Shareholder Reporting Fees | | | 21 | | |
Transfer Agency Fees — Class I (Note E) | | | 5 | | |
Transfer Agency Fees — Class A (Note E) | | | 4 | | |
Transfer Agency Fees — Class L (Note E) | | | 2 | | |
Transfer Agency Fees — Class C (Note E) | | | 4 | | |
Directors' Fees and Expenses | | | 4 | | |
Pricing Fees | | | 3 | | |
Other Expenses | | | 14 | | |
Total Expenses | | | 921 | | |
Waiver of Advisory Fees (Note B) | | | (154 | ) | |
Reimbursement of Class Specific Expenses — Class I (Note B) | | | (35 | ) | |
Reimbursement of Class Specific Expenses — Class A (Note B) | | | (5 | ) | |
Reimbursement of Class Specific Expenses — Class L (Note B) | | | (2 | ) | |
Reimbursement of Class Specific Expenses — Class C (Note B) | | | (3 | ) | |
Rebate from Morgan Stanley Affiliate (Note G) | | | (17 | ) | |
Net Expenses | | | 705 | | |
Net Investment Income | | | 113 | | |
Realized Gain: | |
Investments Sold | | | 4,580 | | |
Foreign Currency Transactions | | | 9 | | |
Realized Gain | | | 4,589 | | |
Change in Unrealized Appreciation (Depreciation): | |
Investments | | | 6,275 | | |
Foreign Currency Translations | | | 1 | | |
Net Change in Unrealized Appreciation (Depreciation) | | | 6,276 | | |
Net Realized Gain and Change in Unrealized Appreciation (Depreciation) | | | 10,865 | | |
Net Increase in Net Assets Resulting from Operations | | $ | 10,978 | | |
@ Amount is less than $500.
The accompanying notes are an integral part of the financial statements.
10
Morgan Stanley Institutional Fund, Inc.
Annual Report — December 31, 2017
Statements of Changes in Net Assets | | Year Ended
December 31, 2017
(000) | | Year Ended
December 31, 2016
(000) | |
Increase (Decrease) in Net Assets: | |
Operations: | |
Net Investment Income | | $ | 113 | | | $ | 5 | | |
Net Realized Gain | | | 4,589 | | | | 519 | | |
Net Change in Unrealized Appreciation (Depreciation) | | | 6,276 | | | | 1,941 | | |
Net Increase in Net Assets Resulting from Operations | | | 10,978 | | | | 2,465 | | |
Distributions from and/or in Excess of: | |
Class I: | |
Net Investment Income | | | (105 | ) | | | (6 | ) | |
Net Realized Gain | | | (2,095 | ) | | | (212 | ) | |
Class A: | |
Net Investment Income | | | — | | | | (— | @) | |
Net Realized Gain | | | (513 | ) | | | (116 | ) | |
Class L: | |
Net Investment Income | | | — | | | | (— | @) | |
Net Realized Gain | | | (5 | ) | | | (3 | ) | |
Class C: | |
Net Investment Income | | | — | | | | (— | @) | |
Net Realized Gain | | | (278 | ) | | | 44 | | |
Total Distributions | | | (2,996 | ) | | | (381 | ) | |
Capital Share Transactions:(1) | |
Class I: | |
Subscribed | | | 67,786 | | | | 10,923 | | |
Distributions Reinvested | | | 2,200 | | | | 217 | | |
Redeemed | | | (10,822 | ) | | | (995 | ) | |
Class A: | |
Subscribed | | | 19,882 | | | | 6,908 | | |
Distributions Reinvested | | | 512 | | | | 116 | | |
Redeemed | | | (11,068 | ) | | | (528 | ) | |
Class L: | |
Exchanged | | | 6 | | | | 49 | | |
Distributions Reinvested | | | 4 | | | | 2 | | |
Redeemed | | | (31 | ) | | | (17 | ) | |
Class C: | |
Subscribed | | | 6,845 | | | | 3,158 | | |
Distributions Reinvested | | | 278 | | | | 44 | | |
Redeemed | | | (1,459 | ) | | | (55 | ) | |
Net Increase in Net Assets Resulting from Capital Share Transactions | | | 74,133 | | | | 19,822 | | |
Total Increase in Net Assets | | | 82,115 | | | | 21,906 | | |
Net Assets: | |
Beginning of Period | | | 24,434 | | | | 2,528 | | |
End of Period (Including Accumulated Undistributed Net Investment Income of $17 and $—@) | | $ | 106,549 | | | $ | 24,434 | | |
The accompanying notes are an integral part of the financial statements.
11
Morgan Stanley Institutional Fund, Inc.
Annual Report — December 31, 2017
Statements of Changes in Net Assets (cont'd) | | Year Ended
December 31, 2017
(000) | | Year Ended
December 31, 2016
(000) | |
(1) Capital Share Transactions: | |
Class I: | |
Shares Subscribed | | | 4,352 | | | | 821 | | |
Shares Issued on Distributions Reinvested | | | 135 | | | | 15 | | |
Shares Redeemed | | | (707 | ) | | | (73 | ) | |
Net Increase in Class I Shares Outstanding | | | 3,780 | | | | 763 | | |
Class A: | |
Shares Subscribed | | | 1,298 | | | | 509 | | |
Shares Issued on Distributions Reinvested | | | 32 | | | | 8 | | |
Shares Redeemed | | | (714 | ) | | | (41 | ) | |
Net Increase in Class A Shares Outstanding | | | 616 | | | | 476 | | |
Class L: | |
Shares Exchanged | | | — | @@ | | | 4 | | |
Shares Issued on Distributions Reinvested | | | — | @@ | | | — | @@ | |
Shares Redeemed | | | (1 | ) | | | (1 | ) | |
Net Increase (Decrease) in Class L Shares Outstanding | | | (1 | ) | | | 3 | | |
Class C: | |
Shares Subscribed | | | 456 | | | | 234 | | |
Shares Issued on Distributions Reinvested | | | 18 | | | | 3 | | |
Shares Redeemed | | | (98 | ) | | | (4 | ) | |
Net Increase in Class C Shares Outstanding | | | 376 | | | | 233 | | |
@ Amount is less than $500.
@@ Amount is less than 500 shares.
The accompanying notes are an integral part of the financial statements.
12
Morgan Stanley Institutional Fund, Inc.
Annual Report — December 31, 2017
Financial Highlights
Insight Portfolio
| | | Class I | |
| | | Year Ended December 31, | |
Selected Per Share Data and Ratios | | 2017 | | 2016(1) | | 2015 | | 2014 | | 2013 | |
Net Asset Value, Beginning of Period | | $ | 14.44 | | | $ | 11.21 | | | $ | 13.65 | | | $ | 15.40 | | | $ | 11.86 | | |
Income (Loss) from Investment Operations: | |
Net Investment Income(2) | | | 0.06 | | | | 0.03 | | | | 0.10 | | | | 0.06 | | | | 0.18 | | |
Net Realized and Unrealized Gain (Loss) | | | 2.56 | | | | 3.46 | | | | (0.82 | ) | | | 0.87 | | | | 4.52 | | |
Total from Investment Operations | | | 2.62 | | | | 3.49 | | | | (0.72 | ) | | | 0.93 | | | | 4.70 | | |
Distributions from and/or in Excess of: | |
Net Investment Income | | | (0.02 | ) | | | (0.01 | ) | | | (0.10 | ) | | | (0.04 | ) | | | (0.16 | ) | |
Net Realized Gain | | | (0.50 | ) | | | (0.25 | ) | | | (1.62 | ) | | | (2.64 | ) | | | (1.00 | ) | |
Total Distributions | | | (0.52 | ) | | | (0.26 | ) | | | (1.72 | ) | | | (2.68 | ) | | | (1.16 | ) | |
Net Asset Value, End of Period | | $ | 16.54 | | | $ | 14.44 | | | $ | 11.21 | | | $ | 13.65 | | | $ | 15.40 | | |
Total Return(3) | | | 18.28 | % | | | 31.14 | % | | | (5.58 | )% | | | 6.66 | % | | | 40.20 | % | |
Ratios and Supplemental Data: | |
Net Assets, End of Period (Thousands) | | $ | 78,077 | | | $ | 13,578 | | | $ | 1,981 | | | $ | 1,968 | | | $ | 1,859 | | |
Ratio of Expenses to Average Net Assets(5) | | | 1.02 | %(4) | | | 1.03 | %(4) | | | 1.04 | %(4) | | | 1.04 | %(4) | | | 1.04 | %(4) | |
Ratio of Net Investment Income to Average Net Assets(5) | | | 0.40 | %(4) | | | 0.25 | %(4) | | | 0.78 | %(4) | | | 0.44 | %(4) | | | 1.25 | %(4) | |
Ratio of Rebate from Morgan Stanley Affiliates to Average Net Assets | | | 0.03 | % | | | 0.02 | % | | | 0.01 | % | | | 0.01 | % | | | 0.01 | % | |
Portfolio Turnover Rate | | | 101 | % | | | 42 | % | | | 55 | % | | | 82 | % | | | 51 | % | |
(5) Supplemental Information on the Ratios to Average Net Assets: | |
Ratios Before Expense Limitation: | |
Expenses to Average Net Assets | | | 1.41 | % | | | 2.93 | % | | | 7.50 | % | | | 7.69 | % | | | 10.83 | % | |
Net Investment Income (Loss) to Average Net Assets | | | 0.01 | % | | | (1.65 | )% | | | (5.68 | )% | | | (6.21 | )% | | | (8.54 | )% | |
(1) Reflects prior period custodian out-of-pocket expenses that were reimbursed in September 2016. The amount of the reimbursement was immaterial on a per share basis and did not impact the total return of Class I shares. The Ratio of Expenses to Average Net Assets and the Ratio of Net Investment Income to Average Net Assets would be unchanged as the reimbursement of custodian fees was offset against expense waivers/reimbursements with no impact to net expenses or net investment income.
(2) Per share amount is based on average shares outstanding.
(3) Calculated based on the net asset value as of the last business day of the period.
(4) The Ratios of Expenses and Net Investment Income reflect the rebate of certain Fund expenses in connection with the investments in Morgan Stanley affiliates during the period. The effect of the rebate on the ratios is disclosed in the above table as "Ratio of Rebate from Morgan Stanley Affiliates to Average Net Assets."
The accompanying notes are an integral part of the financial statements.
13
Morgan Stanley Institutional Fund, Inc.
Annual Report — December 31, 2017
Financial Highlights
Insight Portfolio
| | | Class A | |
| | | Year Ended December 31, | |
Selected Per Share Data and Ratios | | 2017 | | 2016(1) | | 2015 | | 2014 | | 2013 | |
Net Asset Value, Beginning of Period | | $ | 14.40 | | | $ | 11.21 | | | $ | 13.66 | | | $ | 15.43 | | | $ | 11.86 | | |
Income (Loss) from Investment Operations: | |
Net Investment Income (Loss)(2) | | | 0.01 | | | | (0.02 | ) | | | 0.05 | | | | 0.01 | | | | 0.07 | | |
Net Realized and Unrealized Gain (Loss) | | | 2.54 | | | | 3.46 | | | | (0.82 | ) | | | 0.87 | | | | 4.58 | | |
Total from Investment Operations | | | 2.55 | | | | 3.44 | | | | (0.77 | ) | | | 0.88 | | | | 4.65 | | |
Distributions from and/or in Excess of: | |
Net Investment Income | | | — | | | | (0.00 | )(3) | | | (0.06 | ) | | | (0.01 | ) | | | (0.08 | ) | |
Net Realized Gain | | | (0.50 | ) | | | (0.25 | ) | | | (1.62 | ) | | | (2.64 | ) | | | (1.00 | ) | |
Total Distributions | | | (0.50 | ) | | | (0.25 | ) | | | (1.68 | ) | | | (2.65 | ) | | | (1.08 | ) | |
Net Asset Value, End of Period | | $ | 16.45 | | | $ | 14.40 | | | $ | 11.21 | | | $ | 13.66 | | | $ | 15.43 | | |
Total Return(4) | | | 17.82 | % | | | 30.74 | % | | | (5.97 | )% | | | 6.41 | % | | | 39.73 | % | |
Ratios and Supplemental Data: | |
Net Assets, End of Period (Thousands) | | $ | 18,557 | | | $ | 7,365 | | | $ | 399 | | | $ | 230 | | | $ | 209 | | |
Ratio of Expenses to Average Net Assets(7) | | | 1.37 | %(5) | | | 1.38 | %(5) | | | 1.39 | %(5) | | | 1.39 | %(5) | | | 1.30 | %(5)(6) | |
Ratio of Net Investment Income (Loss) to Average Net Assets(7) | | | 0.07 | %(5) | | | (0.15 | )%(5) | | | 0.42 | %(5) | | | 0.09 | %(5) | | | 0.50 | %(5) | |
Ratio of Rebate from Morgan Stanley Affiliates to Average Net Assets | | | 0.03 | % | | | 0.02 | % | | | 0.01 | % | | | 0.01 | % | | | 0.01 | % | |
Portfolio Turnover Rate | | | 101 | % | | | 42 | % | | | 55 | % | | | 82 | % | | | 51 | % | |
(7) Supplemental Information on the Ratios to Average Net Assets: | |
Ratios Before Expense Limitation: | |
Expenses to Average Net Assets | | | 1.70 | % | | | 3.28 | % | | | 8.32 | % | | | 8.91 | % | | | 13.79 | % | |
Net Investment Loss to Average Net Assets | | | (0.26 | )% | | | (2.05 | )% | | | (6.51 | )% | | | (7.43 | )% | | | (11.99 | )% | |
(1) Reflects prior period custodian out-of-pocket expenses that were reimbursed in September 2016. The amount of the reimbursement was immaterial on a per share basis and did not impact the total return of Class A shares. The Ratio of Expenses to Average Net Assets and the Ratio of Net Investment Loss to Average Net Assets would be unchanged as the reimbursement of custodian fees was offset against expense waivers/reimbursements with no impact to net expenses or net investment loss.
(2) Per share amount is based on average shares outstanding.
(3) Amount is less than $0.005 per share.
(4) Calculated based on the net asset value which does not reflect sales charges, if applicable, as of the last business day of the period.
(5) The Ratios of Expenses and Net Investment Income (Loss) reflect the rebate of certain Fund expenses in connection with the investments in Morgan Stanley affiliates during the period. The effect of the rebate on the ratios is disclosed in the above table as "Ratio of Rebate from Morgan Stanley Affiliates to Average Net Assets."
(6) Effective September 16, 2013, the Adviser has agreed to limit the ratio of expenses to average net assets to the maximum ratio of 1.40% for Class A shares. Prior to September 16, 2013, the maximum ratio was 1.30% for Class A shares.
The accompanying notes are an integral part of the financial statements.
14
Morgan Stanley Institutional Fund, Inc.
Annual Report — December 31, 2017
Financial Highlights
Insight Portfolio
| | | Class L | |
| | | Year Ended December 31, | |
Selected Per Share Data and Ratios | | 2017 | | 2016(1) | | 2015 | | 2014 | | 2013 | |
Net Asset Value, Beginning of Period | | $ | 14.09 | | | $ | 11.02 | | | $ | 13.50 | | | $ | 15.35 | | | $ | 11.85 | | |
Income (Loss) from Investment Operations: | |
Net Investment Income (Loss)(2) | | | (0.07 | ) | | | (0.06 | ) | | | (0.01 | ) | | | (0.06 | ) | | | 0.08 | | |
Net Realized and Unrealized Gain (Loss) | | | 2.48 | | | | 3.38 | | | | (0.82 | ) | | | 0.86 | | | | 4.49 | | |
Total from Investment Operations | | | 2.41 | | | | 3.32 | | | | (0.83 | ) | | | 0.80 | | | | 4.57 | | |
Distributions from and/or in Excess of: | |
Net Investment Income | | | — | | | | (0.00 | )(3) | | | (0.03 | ) | | | (0.01 | ) | | | (0.07 | ) | |
Net Realized Gain | | | (0.50 | ) | | | (0.25 | ) | | | (1.62 | ) | | | (2.64 | ) | | | (1.00 | ) | |
Total Distributions | | | (0.50 | ) | | | (0.25 | ) | | | (1.65 | ) | | | (2.65 | ) | | | (1.07 | ) | |
Net Asset Value, End of Period | | $ | 16.00 | | | $ | 14.09 | | | $ | 11.02 | | | $ | 13.50 | | | $ | 15.35 | | |
Total Return(4) | | | 17.21 | % | | | 30.18 | % | | | (6.49 | )% | | | 5.83 | % | | | 39.13 | % | |
Ratios and Supplemental Data: | |
Net Assets, End of Period (Thousands) | | $ | 149 | | | $ | 150 | | | $ | 90 | | | $ | 47 | | | $ | 115 | | |
Ratio of Expenses to Average Net Assets(7) | | | 1.87 | %(5) | | | 1.88 | %(5) | | | 1.89 | %(5) | | | 1.89 | %(5) | | | 1.84 | %(5)(6) | |
Ratio of Net Investment Income (Loss) to Average Net Assets(7) | | | (0.45 | )%(5) | | | (0.52 | )%(5) | | | (0.09 | )%(5) | | | (0.41 | )%(5) | | | 0.54 | %(5) | |
Ratio of Rebate from Morgan Stanley Affiliates to Average Net Assets | | | 0.03 | % | | | 0.02 | % | | | 0.01 | % | | | 0.01 | % | | | 0.01 | % | |
Portfolio Turnover Rate | | | 101 | % | | | 42 | % | | | 55 | % | | | 82 | % | | | 51 | % | |
(7) Supplemental Information on the Ratios to Average Net Assets: | |
Ratios Before Expense Limitation: | |
Expenses to Average Net Assets | | | 3.45 | % | | | 5.57 | % | | | 10.04 | % | | | 10.64 | % | | | 12.31 | % | |
Net Investment Loss to Average Net Assets | | | (2.03 | )% | | | (4.21 | )% | | | (8.24 | )% | | | (9.16 | )% | | | (9.93 | )% | |
(1) Reflects prior period custodian out-of-pocket expenses that were reimbursed in September 2016. The amount of the reimbursement was immaterial on a per share basis and did not impact the total return of Class L shares. The Ratio of Expenses to Average Net Assets and the Ratio of Net Investment Loss to Average Net Assets would be unchanged as the reimbursement of custodian fees was offset against expense waivers/reimbursements with no impact to net expenses or net investment loss.
(2) Per share amount is based on average shares outstanding.
(3) Amount is less than $0.005 per share.
(4) Calculated based on the net asset value as of the last business day of the period.
(5) The Ratios of Expenses and Net Investment Income (Loss) reflect the rebate of certain Fund expenses in connection with the investments in Morgan Stanley affiliates during the period. The effect of the rebate on the ratios is disclosed in the above table as "Ratio of Rebate from Morgan Stanley Affiliates to Average Net Assets."
(6) Effective September 16, 2013, the Adviser has agreed to limit the ratio of expenses to average net assets to the maximum ratio of 1.90% for Class L shares. Prior to September 16, 2013, the maximum ratio was 1.80% for Class L shares.
The accompanying notes are an integral part of the financial statements.
15
Morgan Stanley Institutional Fund, Inc.
Annual Report — December 31, 2017
Financial Highlights
Insight Portfolio
| | | Class C | |
| | | Year Ended December 31, | | Period from
April 30, 2015(2) to | |
Selected Per Share Data and Ratios | | 2017 | | 2016(1) | | December 31, 2015 | |
Net Asset Value, Beginning of Period | | $ | 14.03 | | | $ | 11.00 | | | $ | 13.47 | | |
Income (Loss) from Investment Operations: | |
Net Investment Loss(3) | | | (0.11 | ) | | | (0.12 | ) | | | (0.08 | ) | |
Net Realized and Unrealized Gain (Loss) | | | 2.47 | | | | 3.40 | | | | (0.74 | ) | |
Total from Investment Operations | | | 2.36 | | | | 3.28 | | | | (0.82 | ) | |
Distributions from and/or in Excess of: | |
Net Investment Income | | | — | | | | (0.00 | )(4) | | | (0.03 | ) | |
Net Realized Gain | | | (0.50 | ) | | | (0.25 | ) | | | (1.62 | ) | |
Total Distributions | | | (0.50 | ) | | | (0.25 | ) | | | (1.65 | ) | |
Net Asset Value, End of Period | | $ | 15.89 | | | $ | 14.03 | | | $ | 11.00 | | |
Total Return(5) | | | 16.93 | % | | | 29.87 | % | | | (6.42 | )%(7) | |
Ratios and Supplemental Data: | |
Net Assets, End of Period (Thousands) | | $ | 9,766 | | | $ | 3,341 | | | $ | 58 | | |
Ratio of Expenses to Average Net Assets(9) | | | 2.12 | %(6) | | | 2.13 | %(6) | | | 2.14 | %(6)(8) | |
Ratio of Net Investment Loss to Average Net Assets(9) | | | (0.71 | )%(6) | | | (0.91 | )%(6) | | | (0.91 | )%(6)(8) | |
Ratio of Rebate from Morgan Stanley Affiliates to Average Net Assets | | | 0.03 | % | | | 0.02 | % | | | 0.01 | %(8) | |
Portfolio Turnover Rate | | | 101 | % | | | 42 | % | | | 55 | % | |
(9) Supplemental Information on the Ratios to Average Net Assets: | |
Ratios Before Expense Limitation: | |
Expense to Average Net Assets | | | 2.46 | % | | | 4.23 | % | | | 12.97 | %(8) | |
Net Investment Loss to Average Net Assets | | | (1.05 | )% | | | (3.01 | )% | | | (11.74 | )%(8) | |
(1) Reflects prior period custodian out-of-pocket expenses that were reimbursed in September 2016. The amount of the reimbursement was immaterial on a per share basis and did not impact the total return of Class C shares. The Ratio of Expenses to Average Net Assets and the Ratio of Net Investment Loss to Average Net Assets would be unchanged as the reimbursement of custodian fees was offset against expense waivers/reimbursements with no impact to net expenses or net investment loss.
(2) Commencement of Offering.
(3) Per share amount is based on average shares outstanding.
(4) Amount is less than $0.005 per share.
(5) Calculated based on the net asset value which does not reflect sales charges, if applicable, as of the last business day of the period.
(6) The Ratios of Expenses and Net Investment Loss reflect the rebate of certain Fund expenses in connection with the investments in Morgan Stanley affiliates during the period. The effect of the rebate on the ratios is disclosed in the above table as "Ratio of Rebate from Morgan Stanley Affiliates to Average Net Assets."
(7) Not annualized.
(8) Annualized.
The accompanying notes are an integral part of the financial statements.
16
Morgan Stanley Institutional Fund, Inc.
Annual Report — December 31, 2017
Notes to Financial Statements
Morgan Stanley Institutional Fund, Inc. (the "Company") is registered under the Investment Company Act of 1940, as amended (the "Act"), as an open-end management investment company. The Company is comprised of twenty-nine separate, active, diversified and non-diversified funds (individually referred to as a "Fund", collectively as the "Funds"). The Company applies investment company accounting and reporting guidance.
The accompanying financial statements relate to the Insight Portfolio. The Fund seeks long-term capital appreciation.
The Fund offers four classes of shares — Class I, Class A, Class L and Class C. On April 30, 2015, the Fund suspended offering of Class L shares. Existing Class L shareholders may invest through reinvestment of dividends and distributions.
A. Significant Accounting Policies: The following significant accounting policies are in conformity with U.S. generally accepted accounting principles ("GAAP"). Such policies are consistently followed by the Company in the preparation of its financial statements. GAAP may require management to make estimates and assumptions that affect the reported amounts and disclosures in the financial statements. Actual results may differ from those estimates.
1. Security Valuation: (1) An equity portfolio security listed or traded on an exchange is valued at its latest reported sales price (or at the exchange official closing price if such exchange reports an official closing price), and if there were no sales on a given day and if there is no official exchange closing price for that day, the security is valued at the mean between the last reported bid and asked prices if such bid and asked prices are available on the relevant exchanges. Listed equity securities not traded on the valuation date with no reported bid and asked prices available on the exchange are valued at the mean between the current bid and asked prices obtained from one or more reputable brokers or dealers. In cases where a security is traded on more than one exchange, the security is valued on the exchange designated as the primary market; (2) all other equity portfolio securities for which over-the-counter ("OTC") market quotations are readily available are valued at the latest reported sales price (or at the market official closing price if such market reports an official closing price), and if there was no trading in the security on a given day and if there is no official closing price from relevant markets for that day, the security is valued at the mean between the last reported bid and
asked prices if such bid and asked prices are available on the relevant markets. An unlisted equity security that does not trade on the valuation date and for which bid and asked prices from the relevant markets are unavailable is valued at the mean between the current bid and asked prices obtained from one or more reputable brokers or dealers; (3) certain portfolio securities may be valued by an outside pricing service/vendor approved by the Company's Board of Directors (the "Directors"). The pricing service/vendor may employ a pricing model that takes into account, among other things, bids, yield spreads, and/or other market data and specific security characteristics. Alternatively, if a valuation is not available from an outside pricing service/vendor, and the security trades on an exchange, the security may be valued at its latest reported sale price (or at the exchange official closing price if such exchange reports an official closing price), prior to the time when assets are valued. If there are no sales on a given day and if there is no official exchange closing price for that day, the security is valued at the mean between the last reported bid and asked prices if such bid and asked prices are available in the relevant exchanges; (4) when market quotations are not readily available, including circumstances under which Morgan Stanley Investment Management Inc. (the "Adviser") determines that the closing price, last sale price or the mean between the last reported bid and asked prices are not reflective of a security's market value, portfolio securities are valued at their fair value as determined in good faith under procedures established by and under the general supervision of the Directors. Occasionally, developments affecting the closing prices of securities and other assets may occur between the times at which valuations of such securities are determined (that is, close of the foreign market on which the securities trade) and the close of business of the New York Stock Exchange ("NYSE"). If developments occur during such periods that are expected to materially affect the value of such securities, such valuations may be adjusted to reflect the estimated fair value of such securities as of the close of the NYSE, as determined in good faith by the Directors or by the Adviser using a pricing service and/or procedures approved by the Directors; (5) quotations of foreign portfolio securities, other assets and liabilities and forward contracts stated in foreign currency are translated into U.S. dollar equivalents at the prevailing market rates prior to the close of the NYSE; and (6) investments in mutual funds, including the Morgan Stanley Institutional
17
Morgan Stanley Institutional Fund, Inc.
Annual Report — December 31, 2017
Notes to Financial Statements (cont'd)
Liquidity Funds, are valued at the net asset value ("NAV") as of the close of each business day.
The Directors have responsibility for determining in good faith the fair value of the investments, and the Directors may appoint others, such as the Company's Adviser or a valuation committee, to assist the Directors in determining fair value and to make the actual calculations pursuant to the fair valuation methodologies previously approved by the Directors. Under procedures approved by the Directors, the Company's Adviser has formed a Valuation Committee whose members are approved by the Directors. The Valuation Committee provides administration and oversight of the Company's valuation policies and procedures, which are reviewed at least annually by the Directors. These procedures allow the Company to utilize independent pricing services, quotations from securities and financial instrument dealers, and other market sources to determine fair value.
The Company has procedures to determine the fair value of securities and other financial instruments for which market prices are not readily available. Under these procedures, the Valuation Committee convenes on a regular and ad hoc basis to review such securities and considers a number of factors, including valuation methodologies and significant unobservable valuation inputs, when arriving at fair value. The Valuation Committee may employ a market-based approach which may use related or comparable assets or liabilities, recent transactions, market multiples, book values, and other relevant information for the investment to determine the fair value of the investment. An income-based valuation approach may also be used in which the anticipated future cash flows of the investment are discounted to calculate fair value. Discounts may also be applied due to the nature or duration of any restrictions on the disposition of the investments. Due to the inherent uncertainty of valuations of such investments, the fair values may differ significantly from the values that would have been used had an active market existed. The Valuation Committee employs various methods for calibrating these valuation approaches including a regular review of valuation methodologies, key inputs and assumptions, transactional back-testing or disposition analysis, and reviews of any related market activity.
2. Fair Value Measurement: Financial Accounting Standards Board ("FASB") Accounting Standards CodificationTM ("ASC") 820, "Fair Value Measurement" ("ASC 820"), defines fair value as the value that the Fund would receive to sell an investment or pay to transfer a liability in a timely transaction with an independent buyer in the principal market, or in the absence of a principal market, the most advantageous market for the investment or liability. ASC 820 establishes a three-tier hierarchy to distinguish between (1) inputs that reflect the assumptions market participants would use in valuing an asset or liability developed based on market data obtained from sources independent of the reporting entity (observable inputs) and (2) inputs that reflect the reporting entity's own assumptions about the assumptions market participants would use in valuing an asset or liability developed based on the best information available in the circumstances (unobservable inputs) and to establish classification of fair value measurements for disclosure purposes. Various inputs are used in determining the value of the Fund's investments. The inputs are summarized in the three broad levels listed below.
• Level 1 – unadjusted quoted prices in active markets for identical investments
• Level 2 – other significant observable inputs (including quoted prices for similar investments, interest rates, prepayment speeds, credit risk, etc.)
• Level 3 – significant unobservable inputs including the Fund's own assumptions in determining the fair value of investments. Factors considered in making this determination may include, but are not limited to, information obtained by contacting the issuer, analysts, or the appropriate stock exchange (for exchange-traded securities), analysis of the issuer's financial statements or other available documents and, if necessary, available information concerning other securities in similar circumstances
The inputs or methodology used for valuing securities are not necessarily an indication of the risk associated with investing in those securities and the determination of the significance of a particular input to the fair value measurement in its entirety requires judgment and considers factors specific to each security.
18
Morgan Stanley Institutional Fund, Inc.
Annual Report — December 31, 2017
Notes to Financial Statements (cont'd)
The following is a summary of the inputs used to value the Fund's investments as of December 31, 2017.
Investment Type | | Level 1
Unadjusted
quoted
prices
(000) | | Level 2
Other
significant
observable
inputs
(000) | | Level 3
Significant
unobservable
inputs
(000) | | Total
(000) | |
Assets: | |
Common Stocks | |
Aerospace & Defense | | $ | 4,898 | | | $ | — | | | $ | — | | | $ | 4,898 | | |
Auto Components | | | 2,005 | | | | — | | | | — | | | | 2,005 | | |
Automobiles | | | 6,579 | | | | — | | | | — | | | | 6,579 | | |
Banks | | | 4,319 | | | | — | | | | — | | | | 4,319 | | |
Biotechnology | | | 1,825 | | | | — | | | | — | | | | 1,825 | | |
Chemicals | | | 9,269 | | | | — | | | | — | | | | 9,269 | | |
Commercial Services &
Supplies | | | 2,381 | | | | — | | | | — | | | | 2,381 | | |
Diversified Financial
Services | | | 6,195 | | | | — | | | | — | | | | 6,195 | | |
Energy Equipment &
Services | | | 1,344 | | | | — | | | | — | | | | 1,344 | | |
Health Care Equipment &
Supplies | | | 3,082 | | | | — | | | | — | | | | 3,082 | | |
Health Care Providers &
Services | | | 2,142 | | | | — | | | | — | | | | 2,142 | | |
Hotels, Restaurants &
Leisure | | | 1,516 | | | | — | | | | — | | | | 1,516 | | |
Insurance | | | 2,487 | | | | — | | | | — | | | | 2,487 | | |
Internet Software &
Services | | | 1,618 | | | | — | | | | — | | | | 1,618 | | |
Leisure Products | | | 647 | | | | — | | | | — | | | | 647 | | |
Machinery | | | 6,262 | | | | — | | | | — | | | | 6,262 | | |
Media | | | 7,693 | | | | — | | | | — | | | | 7,693 | | |
Multi-Line Retail | | | 2,668 | | | | — | | | | — | | | | 2,668 | | |
Pharmaceuticals | | | — | | | | 4,994 | | | | — | | | | 4,994 | | |
Specialty Retail | | | 10,158 | | | | — | | | | — | | | | 10,158 | | |
Trading Companies &
Distributors | | | 3,065 | | | | — | | | | — | | | | 3,065 | | |
Transportation
Infrastructure | | | — | | | | 2,132 | | | | — | | | | 2,132 | | |
Total Common Stocks | | | 80,153 | | | | 7,126 | | | | — | | | | 87,279 | | |
Short-Term Investments | |
Investment Company | | | 22,304 | | | | — | | | | — | | | | 22,304 | | |
Repurchase Agreements | | | — | | | | 736 | | | | — | | | | 736 | | |
Total Short-Term
Investments | | | 22,304 | | | | 736 | | | | — | | | | 23,040 | | |
Total Assets | | $ | 102,457 | | | $ | 7,862 | | | $ | — | | | $ | 110,319 | | |
Transfers between investment levels may occur as the markets fluctuate and/or the availability of data used in an investment's valuation changes. The Fund recognizes transfers between the levels as of the end of the period. As of December 31, 2017, securities with a total value of approximately $2,132,000 transferred from Level 1 to Level 2. Securities that were valued using unadjusted quoted prices at December 31, 2016 were valued using other significant observable inputs at December 31, 2017. At December 31, 2017, the fair value of certain securities were adjusted due to developments which occurred between the time of the close of the foreign markets on
which they trade and the close of business on the NYSE which resulted in their Level 2 classification.
3. Repurchase Agreements: The Fund may enter into repurchase agreements under which the Fund lends cash and takes possession of securities with an agreement that the counterparty will repurchase such securities. In connection with transactions in repurchase agreements, a bank as custodian for the Fund takes possession of the underlying securities which are held as collateral, with a market value at least equal to the amount of the repurchase transaction, including principal and accrued interest. To the extent that any repurchase transaction exceeds one business day, the value of the collateral is marked-to-market on a daily basis to determine that the value of the collateral does not decrease below the repurchase price plus accrued interest as earned. If such a decrease occurs, additional collateral will be requested and, when received, will be added to the account to maintain full collateralization. In the event of default on the obligation to repurchase, the Fund has the right to liquidate the collateral and apply the proceeds in satisfaction of the obligation. In the event of default or bankruptcy by the counterparty to the agreement, realization of the collateral proceeds may be subject to cost and delays. The Fund, along with other affiliated investment companies, may utilize a joint trading account for the purpose of entering into repurchase agreements.
4. Foreign Currency Translation and Foreign Investments: The books and records of the Fund are maintained in U.S. dollars. Foreign currency amounts are translated into U.S. dollars as follows:
– investments, other assets and liabilities at the prevailing rate of exchange on the valuation date;
– investment transactions and investment income at the prevailing rates of exchange on the dates of such transactions.
Although the net assets of the Fund are presented at the foreign exchange rates and market values at the close of the period, the Fund does not isolate that portion of the results of operations arising as a result of changes in the foreign exchange rates from the fluctuations arising from changes in the market prices of securities held at period end. Similarly, the Fund does not isolate the effect of changes in foreign exchange rates from the fluctuations arising from changes in the market prices of securities sold during the period. Accordingly, realized and unreal-
19
Morgan Stanley Institutional Fund, Inc.
Annual Report — December 31, 2017
Notes to Financial Statements (cont'd)
ized foreign currency gains (losses) on investments in securities are included in the reported net realized and unrealized gains (losses) on investment transactions and balances. However, pursuant to U.S. federal income tax regulations, gains and losses from certain foreign currency transactions and the foreign currency portion of gains and losses realized on sales and maturities of foreign denominated debt securities are treated as ordinary income for U.S. federal income tax purposes.
Net realized gains (losses) on foreign currency transactions represent net foreign exchange gains (losses) from foreign currency forward exchange contracts, disposition of foreign currencies, currency gains (losses) realized between the trade and settlement dates on securities transactions, and the difference between the amount of investment income and foreign withholding taxes recorded on the Fund's books and the U.S. dollar equivalent amounts actually received or paid. Net unrealized currency gains (losses) from valuing foreign currency denominated assets and liabilities at period end exchange rates are reflected as a component of unrealized appreciation (depreciation) in the Statement of Assets and Liabilities. The change in unrealized currency gains (losses) on foreign currency translations for the period is reflected in the Statement of Operations.
Foreign security and currency transactions may involve certain considerations and risks not typically associated with those of U.S. dollar denominated transactions as a result of, among other factors, fluctuations of exchange rates in relation to the U.S. dollar, the possibility of lower levels of governmental supervision and regulation of foreign securities markets and the possibility of political or economic instability.
Governmental approval for foreign investments may be required in advance of making an investment under certain circumstances in some countries, and the extent of foreign investments in domestic companies may be subject to limitation in other countries. Foreign ownership limitations also may be imposed by the charters of individual companies to prevent, among other concerns, violations of foreign investment limitations. As a result, an additional class of shares (identified as "Foreign" in the Portfolio of Investments) may be created and offered for investment. The "local" and "foreign shares" market values may differ. In the absence of trading of the for-
eign shares in such markets, the Fund values the foreign shares at the closing exchange price of the local shares.
5. Securities Lending: The Fund lends securities to qualified financial institutions, such as broker-dealers, to earn additional income. Any increase or decrease in the fair value of the securities loaned that might occur and any interest earned or dividends declared on those securities during the term of the loan would remain in the Fund. The Fund would receive cash or securities as collateral in an amount equal to or exceeding 100% of the current fair value of the loaned securities. The collateral is marked-to-market daily by State Street Bank and Trust Company ("State Street"), the securities lending agent, to ensure that a minimum of 100% collateral coverage is maintained.
Based on pre-established guidelines, the securities lending agent invests any cash collateral that is received in an affiliated money market portfolio and repurchase agreements. Securities lending income is generated from the earnings on the invested collateral and borrowing fees, less any rebates owed to the borrowers and compensation to the lending agent, and is recorded as "Income from Securities Loaned — Net" in the Fund's Statement of Operations. Risks in securities lending transactions are that a borrower may not provide additional collateral when required or return the securities when due, and that the value of the short-term investments will be less than the amount of cash collateral plus any rebate that is required to be returned to the borrower.
The Fund has the right under the securities lending agreement to recover the securities from the borrower on demand.
The following table presents financial instruments that are subject to enforceable netting arrangements as of December 31, 2017.
Gross Amounts Not Offset in the Statement of Assets and Liabilities | |
Gross Asset
Amounts
Presented in
Statement of
Assets and
Liabilities
(000) | | Financial
Instrument
(000) | | Collateral
Received
(000) | | Net Amount
(not less
than $0)
(000) | |
| $ | 2,651 | (a) | | $ | — | | | $ | (2,651 | )(b)(c) | | $ | 0 | | |
(a) Represents market value of loaned securities at year end.
(b) The Fund received cash collateral of approximately $2,748,000, which was subsequently invested in Repurchase Agreements and Morgan Stanley Institutional Liquidity Funds as reported in the Portfolio of Investments.
(c) The actual collateral received is greater than the amount shown here due to overcollateralization.
20
Morgan Stanley Institutional Fund, Inc.
Annual Report — December 31, 2017
Notes to Financial Statements (cont'd)
FASB ASC 860 "Transfers & Servicing: Repurchase-to-Maturity Transactions, Repurchase Financings, and Disclosures", is intended to provide increased transparency about the types of collateral pledged in securities lending transactions and other similar transactions that are accounted for as secured borrowing.
The following table displays a breakdown of transactions accounted for as secured borrowings, the gross obligations by class of collateral pledged, and the remaining contractual maturity of those transactions as of December 31, 2017.
Remaining Contractual Maturity of the Agreements | |
| | | Overnight and
Continuous
(000) | | <30 days
(000) | | Between
30 &
90 days
(000) | | >90 days
(000) | | Total
(000) | |
Securities Lending
Transactions | |
Common Stocks | | $ | 2,748 | | | $ | — | | | $ | — | | | $ | — | | | $ | 2,748 | | |
Total Borrowings | | $ | 2,748 | | | $ | — | | | $ | — | | | $ | — | | | $ | 2,748 | | |
Gross amount of
recognized liabilities
for securities lending
transactions | | | | | | | | | | $ | 2,748 | | |
6. Indemnifications: The Company enters into contracts that contain a variety of indemnifications. The Company's maximum exposure under these arrangements is unknown. However, the Company has not had prior claims or losses pursuant to these contracts and expects the risk of loss to be remote.
7. Dividends and Distributions to Shareholders: Dividends and distributions to shareholders are recorded on the ex-dividend date. Dividends from net investment income, if any, are declared and paid annually. Net realized capital gains, if any, are distributed at least annually.
8. Security Transactions, Income and Expenses: Security transactions are accounted for on the trade date (date the order to buy or sell is executed). Realized gains and losses on the sale of investment securities are determined on the specific identified cost method. Dividend income and other distributions are recorded on the ex-dividend date (except for certain foreign dividends which may be recorded as soon as the Fund is informed of such dividends) net of applicable withholding taxes. Interest income is recognized on the accrual basis except where collection is in doubt. Discounts are accreted and premiums are amortized over the life of the respective securities.
Most expenses of the Company can be directly attributed to a particular Fund. Expenses which cannot be directly attributed are apportioned among the Funds based upon relative net assets or other appropriate methods. Income, expenses (other than class specific expenses — distribution and shareholder services, transfer agency and sub transfer agency fees) and realized and unrealized gains or losses are allocated to each class of shares based upon their relative net assets.
B. Advisory Fees: The Adviser, a wholly-owned subsidiary of Morgan Stanley, provides the Fund with advisory services under the terms of an Investment Advisory Agreement, paid quarterly, at the annual rate based on the daily net assets as follows:
First $750
million | | Next $750
million | | Over $1.5
billion | |
| | 0.80 | % | | | 0.75 | % | | | 0.70 | % | |
For the year ended December 31, 2017, the advisory fee rate (net of waiver/rebate) was equivalent to an annual effective rate of 0.50% of the Fund's average daily net assets.
The Adviser has agreed to reduce its advisory fee and/or reimburse the Fund so that total annual portfolio operating expenses, excluding certain investment related expenses, taxes, interest and other extraordinary expenses (including litigation), will not exceed 1.05% for Class I shares, 1.40% for Class A shares, 1.90% for Class L shares and 2.15% for Class C shares. The fee waivers and/or expense reimbursements will continue for at least one year from the date of the Fund's prospectus or until such time as the Directors act to discontinue all or a portion of such waivers and/or reimbursements when they deem such action is appropriate. For the year ended December 31, 2017, approximately $154,000 of advisory fees were waived and approximately $45,000 of other expenses were reimbursed by the Adviser pursuant to this arrangement.
C. Administration Fees: The Adviser also serves as Administrator to the Company and provides administrative services pursuant to an Administration Agreement for an annual fee, accrued daily and paid monthly, of 0.08% of the Fund's average daily net assets.
Under a Sub-Administration Agreement between the Administrator and State Street, State Street provides certain administrative services to the Company. For such services, the Administrator pays State Street a portion of the fee the Administrator receives from the Fund.
21
Morgan Stanley Institutional Fund, Inc.
Annual Report — December 31, 2017
Notes to Financial Statements (cont'd)
D. Distribution and Shareholder Services Fees: Morgan Stanley Distribution, Inc. ("MSDI" or the "Distributor"), a wholly-owned subsidiary of the Adviser and an indirect subsidiary of Morgan Stanley, serves as the Company's Distributor of Fund shares pursuant to a Distribution Agreement. The Company has adopted a Shareholder Services Plan with respect to Class A shares pursuant to Rule 12b-1 under the Act. Under the Shareholder Services Plan, the Fund pays the Distributor a shareholder services fee, accrued daily and paid monthly, at an annual rate of 0.25% of the Fund's average daily net assets attributable to Class A shares.
The Company has adopted a Distribution and Shareholder Services Plan with respect to Class L shares pursuant to Rule 12b-1 under the Act. Under the Distribution and Shareholder Services Plan, the Fund pays the Distributor a distribution fee, accrued daily and paid monthly, at an annual rate of 0.50% and a shareholder services fee, accrued daily and paid monthly, at an annual rate of 0.25% of the Fund's average daily net assets attributable to Class L shares.
The Company has adopted a Distribution and Shareholder Services Plan with respect to Class C shares pursuant to Rule 12b-1 under the Act. Under the Distribution and Shareholder Services Plan, the Fund pays the Distributor a distribution fee, accrued daily and paid monthly, at an annual rate of 0.75% and a shareholder services fee, accrued daily and paid monthly, at an annual rate of 0.25% of the Fund's average daily net assets attributable to Class C shares.
The distribution and shareholder services fees are used to support the expenses associated with servicing and maintaining accounts. The Distributor may compensate other parties for providing shareholder support services to investors who purchase Class A, Class L and Class C shares.
E. Dividend Disbursing and Transfer Agent: The Company's dividend disbursing and transfer agent is Boston Financial Data Services, Inc. ("BFDS"). Pursuant to a Transfer Agency Agreement, the Company pays BFDS a fee based on the number of classes, accounts and transactions relating to the Funds of the Company. Effective January 1, 2018, BFDS changed its name to DST Asset Manager Solutions, Inc.
F. Custodian Fees: State Street (the "Custodian") also serves as Custodian for the Company in accordance with a Custodian Agreement. The Custodian holds cash, securities, and other assets of the Company as required by the Act. Custody fees are payable monthly based on assets held in custody, investment purchases and sales activity and account mainte-
nance fees, plus reimbursement for certain out-of-pocket expenses.
G. Security Transactions and Transactions with Affiliates: For the year ended December 31, 2017, purchases and sales of investment securities for the Fund, other than long-term U.S. Government securities and short-term investments, were approximately $105,111,000 and $49,006,000, respectively. There were no purchases and sales of long-term U.S. Government securities for the year ended December 31, 2017.
The Fund invests in the Institutional Class of the Morgan Stanley Institutional Liquidity Funds (the "Liquidity Funds"), an open-end management investment company managed by the Adviser, both directly and as a portion of the securities held as collateral on loaned securities. Advisory fees paid by the Fund are reduced by an amount equal to its pro-rata share of the advisory and administration fees paid by the Fund due to its investment in the Liquidity Funds. For the year ended December 31, 2017, advisory fees paid were reduced by approximately $17,000 relating to the Fund's investment in the Liquidity Funds.
A summary of the Fund's transactions in shares of the Liquidity Funds during the year ended December 31, 2017 is as follows:
Affiliated
Investment
Company | | Value
December 31,
2016
(000) | | Purchases
at Cost
(000) | | Proceeds
from Sales
(000) | | Dividend
Income
(000) | |
Liquidity Funds | | $ | 3,769 | | | $ | 90,307 | | | $ | 71,772 | | | $ | 77 | | |
Affiliated
Investment
Company (cont'd) | | Realized
Gain (Loss)
(000) | | Change in
Unrealized
Appreciation
(Depreciation)
(000) | | Value
December 31,
2017
(000) | |
Liquidity Funds | | $ | — | | | $ | — | | | $ | 22,304 | | |
During the year ended December 31, 2017, the Fund incurred approximately $4,000 in brokerage commissions with Morgan Stanley & Co., LLC, an affiliate of the Adviser/Administrator and Distributor, for portfolio transactions executed on behalf of the Fund.
The Fund is permitted to purchase and sell securities ("cross-trade") from and to other Morgan Stanley Funds as well as other funds and client accounts for which the Adviser or an affiliate of the Adviser serves as investment adviser, pursuant to procedures approved by the Directors in compliance with Rule 17a-7 under the Act (the "Rule"). Each cross-trade is executed at the current market price in compliance with
22
Morgan Stanley Institutional Fund, Inc.
Annual Report — December 31, 2017
Notes to Financial Statements (cont'd)
provisions of the Rule. For the year ended December 31, 2017, the Fund did not engage in any cross-trade transactions.
The Fund has an unfunded Deferred Compensation Plan (the "Compensation Plan"), which allows each independent Director to defer payment of all, or a portion, of the fees he or she receives for serving on the Board of Directors. Each eligible Director generally may elect to have the deferred amounts credited with a return equal to the total return on one or more of the Morgan Stanley funds that are offered as investment options under the Compensation Plan. Appreciation/depreciation and distributions received from these investments are recorded with an offsetting increase/decrease in the deferred compensation obligation and do not affect the NAV of the Fund.
H. Federal Income Taxes: It is the Fund's intention to continue to qualify as a regulated investment company and distribute all of its taxable and tax-exempt income. Accordingly, no provision for federal income taxes is required in the financial statements.
The Fund may be subject to taxes imposed by countries in which it invests. Such taxes are generally based on income and/or capital gains earned or repatriated. Taxes are accrued based on net investment income, net realized gains and net unrealized appreciation as such income and/or gains are earned or repatriated. Taxes are accrued based on net investment income, net realized gains and net unrealized appreciation as such income and/or gains are earned. Taxes may also be based on transactions in foreign currency and are accrued based on the value of investments denominated in such currency.
FASB ASC 740-10, "Income Taxes — Overall", sets forth a minimum threshold for financial statement recognition of the benefit of a tax position taken or expected to be taken in a tax return. Management has concluded there are no significant uncertain tax positions that would require recognition in the financial statements. If applicable, the Fund recognizes interest accrued related to unrecognized tax benefits in "Interest Expense" and penalties in "Other Expenses" in the Statement of Operations. The Fund files tax returns with the U.S. Internal Revenue Service, New York and various states. Generally, each of the tax years in the four-year period ended December 31, 2017, remains subject to examination by taxing authorities.
The tax character of distributions paid may differ from the character of distributions shown in the Statements of Changes in Net Assets due to short-term capital gains being treated as
ordinary income for tax purposes. The tax character of distributions paid during fiscal years 2017 and 2016 was as follows:
2017
Distributions
Paid From: | | 2016
Distributions
Paid From: | |
Ordinary
Income
(000) | | Long-Term
Capital Gain
(000) | | Ordinary
Income
(000) | | Long-Term
Capital Gain
(000) | |
| $ | 2,120 | | | $ | 876 | | | $ | 257 | | | $ | 124 | | |
The amount and character of income and gains to be distributed are determined in accordance with income tax regulations which may differ from GAAP. These book/tax differences are either considered temporary or permanent in nature.
Temporary differences are primarily due to differing book and tax treatments in the timing of the recognition of gains (losses) on certain investment transactions and the timing of the deductibility of certain expenses.
Permanent differences, primarily due to differing treatments of gains (losses) related to foreign currency transactions, resulted in the following reclassifications among the components of net assets at December 31, 2017:
Accumulated
Undistributed
Net Investment
Income
(000) | | Accumulated
Net Realized
Gain
(000) | | Paid-in-
Capital
(000) | |
| $ | 9 | | | $ | (9 | ) | | $ | — | | |
At December 31, 2017, the components of distributable earnings for the Fund on a tax basis were as follows:
Undistributed
Ordinary
Income
(000) | | Undistributed
Long-Term
Capital Gain
(000) | |
| $ | 1,194 | | | $ | 774 | | |
I. Credit Facility: The Company and other Morgan Stanley funds participated in a $150,000,000 committed, unsecured revolving line of credit facility (the "Facility") with State Street. This Facility is to be used for temporary emergency purposes or funding of shareholder redemption requests. The interest rate on borrowings is based on the federal funds rate or 1 month LIBOR rate plus a spread. The Facility also has a commitment fee of 0.25% per annum based on the unused portion of the Facility. During the year ended December 31, 2017, the Fund did not have any borrowings under the Facility.
J. Other: At December 31, 2017, the Fund had record owners of 10% or greater. Investment activities of these shareholders could have a material impact on the Fund. The aggregate percentage of such owners was 46.6%.
23
Morgan Stanley Institutional Fund, Inc.
Annual Report — December 31, 2017
Report of Independent Registered Public Accounting Firm
To the Shareholders and Board of Directors of
Morgan Stanley Institutional Fund, Inc. —
Insight Portfolio
Opinion on the Financial Statements
We have audited the accompanying statement of assets and liabilities of Insight Portfolio (the "Fund") (one of the funds constituting the Morgan Stanley Institutional Fund, Inc. (the "Company")), including the portfolio of investments, as of December 31, 2017, and the related statement of operations for the year then ended, the statements of changes in net assets for each of the two years in the period then ended, the financial highlights for each of the five years in the period then ended and the related notes (collectively referred to as the "financial statements"). In our opinion, the financial statements present fairly, in all material respects, the financial position of Insight Portfolio (one of the funds constituting Morgan Stanley Institutional Fund, Inc.) at December 31, 2017, the results of its operations for the year then ended, the changes in its net assets for each of the two years in the period then ended and its financial highlights for each of the five years in the period then ended, in conformity with U.S. generally accepted accounting principles.
Basis for Opinion
These financial statements are the responsibility of the Company's management. Our responsibility is to express an opinion on the Fund's financial statements based on our audits. We are a public accounting firm registered with the Public Company Accounting Oversight Board (United States) ("PCAOB") and are required to be independent with respect to the Company in accordance with the U.S. federal securities law and the applicable rules and regulations of the Securities and Exchange Commission and the PCAOB.
We conducted our audits in accordance with the standards of the PCAOB. Those standards require that we plan and perform the audit to obtain reasonable assurance about whether the financial statements are free of material misstatement, whether due to error or fraud. The Company is not required to have, nor were we engaged to perform, an audit of the Company's internal control over financial reporting. As part of our audits, we are required to obtain an understanding of internal control over financial reporting, but not for the purpose of expressing an opinion on the effectiveness of the Company's internal control over financial reporting. Accordingly, we express no such opinion.
Our audits included performing procedures to assess the risks of material misstatement of the financial statements, whether due to error or fraud, and performing procedures that respond to those risks. Such procedures included examining, on a test basis, evidence regarding the amounts and disclosures in the financial statements. Our procedures included confirmation of securities owned as of December 31, 2017 by correspondence with the custodian and others or by other appropriate auditing procedures where replies from others were not received. Our audits also included evaluating the accounting principles used and significant estimates made by management, as well as evaluating the overall presentation of the financial statements. We believe that our audits provide a reasonable basis for our opinion.

We have served as the auditor of one or more Morgan Stanley investment companies since 2000.
Boston, Massachusetts
February 26, 2018
24
Morgan Stanley Institutional Fund, Inc.
Annual Report — December 31, 2017
Federal Tax Notice (unaudited)
For federal income tax purposes, the following information is furnished with respect to the distributions paid by the Fund during its taxable year ended December 31, 2017. For corporate shareholders, 14.9% of the dividends qualified for the dividends received deduction.
The Fund designated and paid approximately $876,000 as a long-term capital gain distribution.
For federal income tax purposes, the following information is furnished with respect to the Fund's earnings for its taxable year ended December 31, 2017. When distributed, certain earnings may be subject to a maximum tax rate of 15% as provided for the Jobs and Growth Tax Relief Reconciliation Act of 2003. The Fund designated up to a maximum of approximately $697,000 as taxable at this lower rate.
In January, the Fund provides tax information to shareholders for the preceding calendar year.
25
Morgan Stanley Institutional Fund, Inc.
Annual Report — December 31, 2017
Privacy Notice (unaudited)
MORGAN STANLEY INVESTMENT MANAGEMENT INC.
AN IMPORTANT NOTICE CONCERNING OUR U.S. PRIVACY POLICY
We are required by federal law to provide you with a copy of our privacy policy annually. This policy applies to current and former individual investors in funds managed or sponsored by Morgan Stanley Investment Management Inc. ("MSIM") as well as current and former individual clients of MSIM. This policy is not applicable to partnerships, corporations, trusts or other non-individual clients or investors. Please note that we may amend this policy at any time, and will inform you of any changes as required by law.
WE RESPECT YOUR PRIVACY
We appreciate that you have provided us with your personal financial information. We strive to maintain the privacy of such information while we help you achieve your financial objectives. This Notice describes what non-public personal information we collect about you, why we collect it, when we may share it with others and how certain others may use it. It discusses the steps you may take to limit our sharing of certain information about you to affiliated companies in the Morgan Stanley family of companies ("other Morgan Stanley companies"). It also discloses how you may limit use of certain shared information for marketing purposes by other Morgan Stanley branded companies. Throughout this policy, we refer to the non-public information that personally identifies you or your accounts as "personal information.''
1. WHAT PERSONAL INFORMATION DO WE COLLECT ABOUT YOU?
We obtain personal information from applications and other forms you submit to us, from your dealings with us, from consumer reporting agencies, from our Web sites and from third parties and other sources.
For example:
• We may collect information such as your name, address, e-mail address, telephone/fax numbers, assets, income and investment objectives through subscription documents, applications and other forms you submit to us.
• We may obtain information about account balances, your use of account(s) and the types of products and services you prefer to receive from us through your dealings and transactions with us and other sources.
• We may obtain information about your creditworthiness and credit history from consumer reporting agencies.
• We may collect background information from and through third-party vendors to verify representations you have made and to comply with various regulatory requirements.
• If you interact with us through our public and private Web sites, we may collect information that you provide directly through online communications (such as an e-mail address). We may also collect information about your Internet service provider, your domain name, your computer's operating system and Web browser, your use of our Web sites and your product and service preferences, through the use of "cookies." Please consult the Terms of Use of these sites for more details.
2. WHEN DO WE DISCLOSE PERSONAL INFORMATION WE COLLECT ABOUT YOU?
We may disclose personal information we collect about you to other Morgan Stanley companies and to non-affiliated third parties.
a. Information We Disclose to Other Morgan Stanley Companies.
We may disclose personal information to other Morgan Stanley companies for a variety of reasons, including to manage your account(s) effectively, to service and process your transactions, to let you know about products and services offered by us and other Morgan Stanley companies, to manage our business, and as otherwise required or permitted by law. Offers for products and services from other Morgan Stanley companies are developed under conditions designed to safeguard your personal information.
26
Morgan Stanley Institutional Fund, Inc.
Annual Report — December 31, 2017
Privacy Notice (unaudited) (cont'd)
b. Information We Disclose to Non-affiliated Third Parties.
We do not disclose personal information that we collect about you to non-affiliated third parties except to those who provide marketing services on our behalf, to financial institutions with whom we have joint marketing agreements, and as otherwise required or permitted by law. For example, we may disclose personal information to non-affiliated third parties for servicing and processing transactions, to offer our own products and services, to protect against fraud, for institutional risk control, to respond to judicial process or to perform services on our behalf. When we share personal information with a non-affiliated third party, they are required to limit their use of personal information to the particular purpose for which it was shared and they are not allowed to share personal information with others except to fulfill that limited purpose or as may be permitted or required by law.
3. HOW DO WE PROTECT THE SECURITY AND CONFIDENTIALITY OF PERSONAL INFORMATION WE COLLECT ABOUT YOU?
We maintain physical, electronic and procedural security measures to help safeguard the personal information we collect about you. We have internal policies governing the proper handling of client information. Third parties that provide support or marketing services on our behalf may also receive personal information, and we require them to adhere to confidentiality standards with respect to such information.
4. HOW CAN YOU LIMIT THE SHARING OF CERTAIN TYPES OF PERSONAL INFORMATION WITH OTHER MORGAN STANLEY COMPANIES?
We offer you choices as to whether we share with other Morgan Stanley companies the personal information that was collected to determine your eligibility for products and services you request ("eligibility information"). Eligibility information does not include your identification information or personal information pertaining to our transactions or experiences with you. Please note that, even if you direct us not to share eligibility information with other Morgan Stanley companies ("opt-out"), we may still share personal information, including eligibility information, with those companies in circumstances excluded from the opt-out under applicable law, such as to process transactions or to service your account.
5. HOW CAN YOU LIMIT THE USE OF CERTAIN TYPES OF PERSONAL INFORMATION BY OTHER MORGAN STANLEY COMPANIES FOR MARKETING?
By following the opt-out instructions in Section 6 below, you may limit other Morgan Stanley branded companies from marketing their products or services to you based on personal information we disclose to them. This information may include, for example, your income and account history with us. Please note that, even if you choose to limit Other Morgan Stanley Companies from using personal information about you that we may share with them for marketing their products and services to you, Other Morgan Stanley Companies may use your personal information that they obtain from us to market to you in circumstances permitted by law, such as if the Other Morgan Stanley Company has its own relationship with you.
6. HOW CAN YOU SEND US AN OPT-OUT INSTRUCTION?
If you wish to limit our sharing of eligibility information about you with other Morgan Stanley companies or other Morgan Stanley companies' use of personal information for marketing purposes, as described in this notice, you may do so by:
• Calling us at (800) 548-7786
Monday–Friday between 8a.m. and 6p.m.(EST)
• Writing to us at the following address:
DST Asset Manager Solutions, Inc.
c/o Privacy Coordinator
P.O. Box 219804
Kansas City, Missouri 64121
27
Morgan Stanley Institutional Fund, Inc.
Annual Report — December 31, 2017
Privacy Notice (unaudited) (cont'd)
Your written request should include your name, address, telephone number and account number(s) to which the opt-out applies and whether you are opting out with respect to sharing of eligibility information (Section 4 above), or if information used for Marketing (Section 5 above) or both. Written opt-out requests should not be sent with any other correspondence. In order to process your request, we require that the request be provided by you directly and not through a third party.
Your opt-out preference will remain in effect with respect to this policy (as it may be amended) until you notify us otherwise. If you have a joint account, your direction for us not to share this information with other Morgan Stanley companies and for those other Morgan Stanley companies not to use your personal information for marketing will be applied to all account holders on that account. Please understand that if you limit our sharing or our affiliated companies' use of personal information, you and any joint account holder(s) may not receive information about Morgan Stanley products and services, including products or services that could help you manage your financial resources and achieve your investment objectives.
7. WHAT IF AN AFFILIATED COMPANY BECOMES A NON-AFFILIATED THIRD PARTY?
If, at any time in the future, an affiliated company becomes a non-affiliated third party, further disclosures of personal information made to the former affiliated company will be limited to those described in Section 2(b) above relating to non-affiliated third parties. If you elected under Section 6 to limit disclosures we make to affiliated companies, or use of personal information by affiliated companies, your election will not apply to use by any former affiliated company of your personal information in their possession once it becomes a non-affiliated third party.
SPECIAL NOTICE TO RESIDENTS OF VERMONT
The following section supplements our policy with respect to our individual clients who have a Vermont address and supersedes anything to the contrary in the above policy with respect to those clients only.
The state of Vermont requires financial institutions to obtain your consent prior to sharing personal information that they collect about you with affiliated companies and non-affiliated third parties other than in certain limited circumstances. Except as permitted by law, we will not share personal information we collect about you with non-affiliated third parties or other Morgan Stanley companies unless you provide us with your written consent to share such information ("opt-in").
If you wish to receive offers for investment products and services offered by or through other Morgan Stanley companies, please notify us in writing at the following address:
DST Asset Manager Solutions, Inc..
c/o Privacy Coordinator
P.O. Box 219804
Kansas City, Missouri 64121
Your authorization should include your name, address, telephone number and account number(s) to which the opt-in applies and should not be sent with any other correspondence. In order to process your authorization, we require that the authorization be provided by you directly and not through a third party.
SPECIAL NOTICE TO RESIDENTS OF CALIFORNIA
The following section supplements our policy with respect to our individual clients who have a California address and supersedes anything to the contrary in the above policy with respect to those clients only.
In response to a California law, if your account has a California home address, your personal information will not be disclosed to non-affiliated third parties except as permitted by applicable California law, and we will limit sharing such information with our affiliates to comply with California privacy laws that apply to us.
28
Morgan Stanley Institutional Fund, Inc.
Annual Report — December 31, 2017
Director and Officer Information (unaudited)
Independent Directors:
Name, Age and Address of
Independent Director | | Position(s)
Held with
Registrant | | Length of Time
Served* | | Principal Occupation(s) During Past 5 Years
and Other Relevant Professional Experience | | Number of
Portfolios in
Fund Complex
Overseen by
Independent
Director** | | Other Directorships
Held by Independent
Director*** | |
Frank L. Bowman (73)
c/o Perkins Coie LLP
Counsel to the Independent
Directors
30 Rockefeller Plaza
New York, NY 10112 | | Director | | Since
August
2006 | | President, Strategic Decisions, LLC (consulting) (since February 2009); Director or Trustee of various Morgan Stanley Funds (since August 2006); Chairperson of the Compliance and Insurance Committee (since October 2015); formerly, Chairperson of the Insurance Sub-Committee of the Compliance and Insurance Committee (2007-2015); served as President and Chief Executive Officer of the Nuclear Energy Institute (policy organization) (February 2005-November 2008); retired as Admiral, U.S. Navy after serving over 38 years on active duty including 8 years as Director of the Naval Nuclear Propulsion Program in the Department of the Navy and the U.S. Department of Energy (1996-2004); served as Chief of Naval Personnel (July 1994-September 1996) and on the Joint Staff as Director of Political Military Affairs (June 1992-July 1994); knighted as Honorary Knight Commander of the Most Excellent Order of the British Empire; awarded the Officier de l'Orde National du Mérite by the French Government; elected to the National Academy of Engineering (2009). | | | 88 | | | Director of BP p.l.c.; Director of Naval and Nuclear Technologies LLP; Director Emeritus of the Armed Services YMCA; Director of the U.S. Naval Submarine League; Member of the National Security Advisory Council of the Center for U.S. Global Engagement and a member of the CNA Military Advisory Board; Trustee of Fairhaven United Methodist Church; and Director of other various non-profit organizations. | |
Kathleen A. Dennis (64)
c/o Perkins Coie LLP
Counsel to the Independent Directors
30 Rockefeller Plaza
New York, NY 10112 | | Director | | Since
August
2006 | | President, Cedarwood Associates (mutual fund and investment management consulting) (since July 2006); Chairperson of the Liquidity and Alternatives Sub-Committee of the Investment Committee (since October 2006) and Director or Trustee of various Morgan Stanley Funds (since August 2006); formerly, Senior Managing Director of Victory Capital Management (1993-2006). | | | 89 | | | Director of various non-profit organizations. | |
Nancy C. Everett (62)
c/o Perkins Coie LLP
Counsel to the Independent Directors
30 Rockefeller Plaza
New York, NY 10112 | | Director | | Since
January
2015 | | Chief Executive Officer, Virginia Commonwealth University Investment Company (since November 2015); Owner, OBIR, LLC (institutional investment management consulting) (since June 2014); formerly, Managing Director, BlackRock Inc. (February 2011-December 2013); and Chief Executive Officer, General Motors Asset Management (a/k/a Promark Global Advisors, Inc.) (June 2005-May 2010). | | | 90 | | | Formerly, Member of Virginia Commonwealth University School of Business Foundation (2005-2016); Member of Virginia Commonwealth University Board of Visitors (2013-2015); Member of Committee on Directors for Emerging Markets Growth Fund, Inc. (2007-2010); Chairperson of Performance Equity Management, LLC (2006-2010); and Chairperson, GMAM Absolute Return Strategies Fund, LLC (2006-2010). | |
29
Morgan Stanley Institutional Fund, Inc.
Annual Report — December 31, 2017
Director and Officer Information (unaudited) (cont'd)
Independent Directors: (cont'd)
Name, Age and Address of
Independent Director | | Position(s)
Held with
Registrant | | Length of Time
Served* | | Principal Occupation(s) During Past 5 Years
and Other Relevant Professional Experience | | Number of
Portfolios in
Fund Complex
Overseen by
Independent
Director** | | Other Directorships
Held by Independent
Director*** | |
Jakki L. Haussler (60)
c/o Perkins Coie LLP
Counsel to the Independent Directors
30 Rockefeller Plaza
New York, NY 10112 | | Director | | Since
January
2015 | | Chairman and Chief Executive Officer, Opus Capital Group (since January 1996); formerly, Director, Capvest Venture Fund, LP (May 2000-December 2011); Partner, Adena Ventures, LP (July 1999-December 2010); Director, The Victory Funds (February 2005-July 2008). | | | 90 | | | Director of Cincinnati Bell Inc. and Member, Audit Committee and Compensation Committee; Director of Northern Kentucky University Foundation and Member, Investment Committee; Member of Chase College of Law Transactional Law Practice Center Board of Advisors; Director of Best Transport; Director of Chase College of Law Board of Visitors; formerly, Member, University of Cincinnati Foundation Investment Committee; Member, Miami University Board of Visitors (2008-2011); Trustee of Victory Funds (2005-2008) and Chairman, Investment Committee (2007-2008) and Member, Service Provider Committee (2005-2008). | |
Dr. Manuel H. Johnson (68)
c/o Johnson Smick
International, Inc.
220 I Street, NE — Suite 200
Washington, D.C. 20002 | | Director | | Since
July
1991 | | Senior Partner, Johnson Smick International, Inc. (consulting firm); Chairperson of the Investment Committee (since October 2006) and Director or Trustee of various Morgan Stanley Funds (since July 1991); Co-Chairman and a founder of the Group of Seven Council (G7C) (international economic commission); formerly, Chairperson of the Audit Committee (July 1991-September 2006), Vice Chairman of the Board of Governors of the Federal Reserve System and Assistant Secretary of the U.S. Treasury. | | | 91 | | | Director of NVR, Inc. (home construction). | |
Joseph J. Kearns (75)
c/o Kearns & Associates LLC
46 E Peninsula Center #385
Rolling Hills Estates, CA 90274-3712 | | Director | | Since
August
1994 | | Senior Adviser, Kearns & Associates LLC (investment consulting); Chairperson of the Audit Committee (since October 2006) and Director or Trustee of various Morgan Stanley Funds (since August 1994); formerly, Deputy Chairperson of the Audit Committee (July 2003-September 2006) and Chairperson of the Audit Committee of various Morgan Stanley Funds (since August 1994); CFO of the J. Paul Getty Trust. | | | 89 | | | Prior to August 10, 2016, Director of Electro Rent Corporation (equipment leasing); Prior to December 31, 2013, Director of The Ford Family Foundation. | |
30
Morgan Stanley Institutional Fund, Inc.
Annual Report — December 31, 2017
Director and Officer Information (unaudited) (cont'd)
Independent Directors: (cont'd)
Name, Age and Address of
Independent Director | | Position(s)
Held with
Registrant | | Length of Time
Served* | | Principal Occupation(s) During Past 5 Years
and Other Relevant Professional Experience | | Number of
Portfolios in
Fund Complex
Overseen by
Independent
Director** | | Other Directorships
Held by Independent
Director*** | |
Michael F. Klein (59)
c/o Perkins Coie LLP
Counsel to the Independent Directors
30 Rockefeller Plaza
New York, NY 10112 | | Director | | Since
August
2006 | | Managing Director, Aetos Capital, LLC (since March 2000); Co-President, Aetos Alternatives Management, LLC (since January 2004) and Co-Chief Executive Officer of Aetos Capital LLC (since August 2013); Chairperson of the Fixed Income Sub-Committee of the Investment Committee (since October 2006) and Director or Trustee of various Morgan Stanley Funds (since August 2006); formerly, Managing Director, Morgan Stanley & Co. Inc. and Morgan Stanley Dean Witter Investment Management, President, various Morgan Stanley Funds (June 1998-March 2000) and Principal, Morgan Stanley & Co. Inc. and Morgan Stanley Dean Witter Investment Management (August 1997-December 1999). | | | 88 | | | Director of certain investment funds managed or sponsored by Aetos Capital, LLC; Director of Sanitized AG and Sanitized Marketing AG (specialty chemicals). | |
Patricia Maleski (57)
c/o Perkins Coie LLP
Counsel to the Independent Directors
30 Rockefeller Plaza
New York, NY 10112 | | Director | | Since
January
2017 | | Managing Director, JPMorgan Asset Management (2004-2016); Oversight and Control Head of Fiduciary and Conflicts of Interest Program (2015-2016); Chief Control Officer-Global Asset Management (2013-2015); President, JPMorgan Funds (2010-2013); Chief Administrative Officer (2004-2013); various other positions including Treasurer and Board Liaison (since 2001). | | | 90 | | | None. | |
Michael E. Nugent (81)
522 Fifth Avenue
New York, NY 10036 | | Chair of the Board and Director | | Chair of the Boards since July 2006 and Director since July 1991 | | Chair of the Boards of various Morgan Stanley Funds (since July 2006); Chairperson of the Closed-End Fund Committee (since June 2012) and Director or Trustee of various Morgan Stanley Funds (since July 1991); formerly, Chairperson of the Insurance Committee (until July 2006); General Partner, Triumph Capital, L.P. (private investment partnership) (1988-2013). | | | 88 | | | None. | |
W. Allen Reed (70)
c/o Perkins Coie LLP
Counsel to the Independent Directors
30 Rockefeller Plaza
New York, NY 10112 | | Director | | Since
August
2006 | | Chairperson of the Equity Sub-Committee of the Investment Committee (since October 2006) and Director or Trustee of various Morgan Stanley Funds (since August 2006); formerly, President and CEO of General Motors Asset Management; Chairman and Chief Executive Officer of the GM Trust Bank and Corporate Vice President of General Motors Corporation (August 1994-December 2005). | | | 89 | | | Director of Legg Mason, Inc.; formerly, Director of the Auburn University Foundation (2010-2015). | |
Fergus Reid (85)
c/o Joe Pietryka, Inc.
85 Charles Colman Blvd.
Pawling, NY 12564 | | Director | | Since
June
1992 | | Chairman, Joe Pietryka, Inc.; Chairperson of the Governance Committee and Director or Trustee of various Morgan Stanley Funds (since June 1992). | | | 89 | | | Formerly, Trustee and Director of certain investment companies in the JP Morgan Fund Complex managed by JP Morgan Investment Management Inc. (1987-2012). | |
* This is the earliest date the Director began serving the Morgan Stanley Funds. Each Director serves an indefinite term, until his or her successor is elected.
** The Fund Complex includes (as of December 31, 2017) all open-end and closed-end funds (including all of their portfolios) advised by Morgan Stanley Investment Management Inc. (the "Adviser") and any funds that have an adviser that is an affiliated person of the Adviser (including, but not limited to, Morgan Stanley AIP GP LP).
*** This includes any directorships at public companies and registered investment companies held by the Director at any time during the past five years.
31
Morgan Stanley Institutional Fund, Inc.
Annual Report — December 31, 2017
Director and Officer Information (unaudited) (cont'd)
Executive Officers:
Name, Age and Address of Executive Officer | | Position(s) Held
with
Registrant | | Length of Time
Served* | | Principal Occupation(s) During Past 5 Years | |
John H. Gernon (54)
522 Fifth Avenue
New York, NY 10036 | | President and Principal Executive Officer | | Since
September
2013 | | President and Principal Executive Officer of the Equity and Fixed Income Funds and the Morgan Stanley AIP Funds (since September 2013) and the Liquidity Funds and various money market funds (since May 2014) in the Fund Complex; Managing Director of the Adviser; Head of Product (since 2006). | |
Timothy J. Knierim (58)
522 Fifth Avenue
New York, NY 10036 | | Chief Compliance Officer | | Since
December
2016 | | Managing Director of the Adviser and various entities affiliated with the Adviser; Chief Compliance Officer of various Morgan Stanley Funds and the Adviser (since December 2016) and Chief Compliance Officer of Morgan Stanley AIP GP LP (since 2014). Formerly, Managing Director and Deputy Chief Compliance Officer of the Adviser (2014-2016); and formerly, Chief Compliance Officer of Prudential Investment Management, Inc. (2007-2014). | |
Francis J. Smith (52)
522 Fifth Avenue
New York, NY 10036 | | Treasurer and Principal Financial Officer | | Treasurer since July 2003 and Principal Financial Officer since September 2002 | | Manging Director of the Adviser and various entities affiliated with the Adviser; Treasurer (since July 2003) and Principal Financial Officer of various Morgan Stanley Funds (since September 2002). | |
Mary E. Mullin (50)
522 Fifth Avenue
New York, NY 10036 | | Secretary | | Since
June
1999 | | Managing Director of the Adviser; Secretary of various Morgan Stanley Funds (since June 1999). | |
Michael J. Key (38)
522 Fifth Avenue
New York, NY 10036 | | Vice President | | Since
June
2017 | | Vice President of the Equity and Fixed Income Funds, Liquidity Funds, various money market funds and the Morgan Stanley AIP Funds in the Fund Complex (since June 2017); Executive Director of the Adviser; Head of Product Development for Equity and Fixed Income Funds (since August 2013). | |
* This is the earliest date the officer began serving the Morgan Stanley Funds. Each officer serves a one-year term, until his or her successor is elected and qualifies.
32
Morgan Stanley Institutional Fund, Inc.
Annual Report — December 31, 2017
Adviser and Administrator
Morgan Stanley Investment Management Inc.
522 Fifth Avenue
New York, New York 10036
Distributor
Morgan Stanley Distribution, Inc.
522 Fifth Avenue
New York, New York 10036
Dividend Disbursing and Transfer Agent
DST Asset Manager Solutions, Inc.
2000 Crown Colony Drive
Quincy, Massachusetts 02169
Custodian
State Street Bank and Trust Company
One Lincoln Street
Boston, Massachusetts 02111
Legal Counsel
Dechert LLP
1095 Avenue of the Americas
New York, New York 10036
Counsel to the Independent Directors
Perkins Coie LLP
30 Rockefeller Plaza
New York, New York 10112
Independent Registered Public Accounting Firm
Ernst & Young LLP
200 Clarendon Street
Boston, Massachusetts 02116
Reporting to Shareholders
Each Morgan Stanley Fund provides a complete schedule of portfolio holdings in its semi-annual and annual reports within 60 days of the end of the fund's second and fourth fiscal quarters. The semi-annual and annual reports are filed electronically with the Securities and Exchange Commission (SEC) on Form N-CSRS and Form N-CSR, respectively. Morgan Stanley also delivers the semi-annual and annual reports to fund shareholders and makes these reports available on its public website, www.morganstanley.com/im. Each Morgan Stanley fund also files a complete schedule of portfolio holdings with the SEC for the fund's first and third fiscal quarters on Form N-Q. Morgan Stanley does not deliver the reports for the first and third fiscal quarters to shareholders, nor are the reports posted to the Morgan Stanley public website. You may, however, obtain the Form N-Q filings (as well as the Form N-CSR and N-CSRS filings) by accessing the SEC's website, www.sec.gov. You may also review and copy them at the SEC's Public Reference Room in Washington, DC. Information on the operation of the SEC's Public Reference Room may be obtained by calling the SEC toll free at 1 (800) SEC-0330. You can also request copies of these materials, upon payment of a duplicating fee, by electronic request at the SEC's email address (publicinfo@sec.gov) or by writing to the SEC's Public Reference Section, Washington, D.C. 20549-1520.
Proxy Voting Policies and Procedures and Proxy Voting Record
You may obtain a copy of the Company's Proxy Voting Policy and Procedures and information regarding how the Company voted proxies relating to portfolio securities during the most recent twelve-month period ended June 30, without charge, upon request, by calling toll free 1 (800) 548-7786 or by visiting our website at www.morganstanley.com/im. This information is also available on the SEC's website at www.sec.gov.
This report is authorized for distribution only when preceded or accompanied by a prospectus or summary prospectus of the applicable Fund of Morgan Stanley Institutional Fund, Inc., which describes in detail the Fund's investment policies, risks, fees and expenses. Please read the prospectus carefully before you invest or send money. For additional information, including information regarding the investments comprising the Fund, please visit our website at www.morganstanley.com/im or call toll free 1 (800) 548-7786.
33
Printed in U.S.A.
This Report has been prepared for shareholders and may be distributed to others only if preceded or accompanied by a current prospectus.
Morgan Stanley Investment Management Inc.
522 Fifth Avenue
New York, New York 10036
© 2018 Morgan Stanley. Morgan Stanley Distribution, Inc.

IFIINSGTANN
2007707 EXP. 02.28.19

Morgan Stanley Institutional Fund, Inc.
International Advantage Portfolio
Annual Report
December 31, 2017

Morgan Stanley Institutional Fund, Inc.
Annual Report — December 31, 2017
Shareholders' Letter | | | 2 | | |
Expense Example | | | 3 | | |
Investment Overview | | | 4 | | |
Portfolio of Investments | | | 6 | | |
Statement of Assets and Liabilities | | | 8 | | |
Statement of Operations | | | 10 | | |
Statements of Changes in Net Assets | | | 11 | | |
Financial Highlights | | | 13 | | |
Notes to Financial Statements | | | 17 | | |
Report of Independent Registered Public Accounting Firm | | | 26 | | |
Federal Tax Notice | | | 27 | | |
Privacy Notice | | | 28 | | |
Director and Officer Information | | | 31 | | |
This report is authorized for distribution only when preceded or accompanied by a prospectus or summary prospectus of the applicable Fund of Morgan Stanley Institutional Fund, Inc. To receive a prospectus and/or statement of additional information (SAI), which contains more complete information such as investment objectives, charges, expenses, policies for voting proxies, risk considerations, and describes in detail each of the Fund's investment policies to the prospective investor, please call toll free 1 (800) 548-7786. Please read the prospectuses carefully before you invest or send money.
Additionally, you can access information about the Fund, including performance, characteristics, and investment team commentary, through Morgan Stanley Investment Management's website: www.morganstanley.com/im.
Market forecasts provided in this report may not necessarily come to pass. There is no guarantee that any sectors mentioned will continue to perform as discussed herein or that securities in such sectors will be held by the Fund in the future. There is no assurance that a fund will achieve its investment objective. Funds are subject to market risk, which is the possibility that market values of securities owned by the Fund will decline and, therefore, the value of the Fund's shares may be less than what you paid for them. Accordingly, you can lose money investing in this Fund. Please see the prospectus for more complete information on investment risks.
1
Morgan Stanley Institutional Fund, Inc.
Annual Report — December 31, 2017
Shareholders' Letter (unaudited)
Dear Shareholders,
We are pleased to provide this Annual report, in which you will learn how your investment in International Advantage Portfolio (the "Fund") performed during the latest twelve-month period.
Morgan Stanley Investment Management is a client-centric, investor-led organization. Our global presence, intellectual capital, and breadth of products and services enable us to partner with investors to meet the evolving challenges of today's financial markets. We aim to deliver superior investment service and to empower our clients to make the informed decisions that help them reach their investment goals.
As always, we thank you for selecting Morgan Stanley Investment Management, and look forward to working with you in the months and years ahead.
Sincerely,

John H. Gernon
President and Principal Executive Officer
January 2018
2
Morgan Stanley Institutional Fund, Inc.
Annual Report — December 31, 2017
Expense Example (unaudited)
International Advantage Portfolio
As a shareholder of the Fund, you incur two types of costs: (1) transactional costs, including redemption fees; and (2) ongoing costs, which may include advisory fees, administration fees, distribution and shareholder services fees and other Fund expenses. This example is intended to help you understand your ongoing costs (in dollars) of investing in the Fund and to compare these costs with the ongoing costs of investing in other mutual funds.
This example is based on an investment of $1,000 invested at the beginning of the six-month period ended December 31, 2017 and held for the entire six-month period.
Actual Expenses
The table below provides information about actual account values and actual expenses. You may use the information in this table, together with the amount you invested, to estimate the expenses that you paid over the period. Simply divide your account value by $1,000 (for example, an $8,600 account value divided by $1,000 = 8.6), then multiply the result by the number in the table under the heading entitled "Actual Expenses Paid During Period" to estimate the expenses you paid on your account during this period.
Hypothetical Example for Comparison Purposes
The table below provides information about hypothetical account values and hypothetical expenses based on the Fund's actual expense ratio and an assumed rate of return of 5% per year before expenses, which is not the Fund's actual return. The hypothetical account values and expenses may not be used to estimate the actual ending account balance or expenses you paid for the period. You may use this information to compare the ongoing costs of investing in the Fund and other funds. To do so, compare this 5% hypothetical example with the 5% hypothetical examples that appear in the shareholder reports of the other funds.
Please note that the expenses shown in the table are meant to highlight your ongoing costs only and do not reflect any transactional costs, such as sales charges (loads) and redemption fees. Therefore, the information for each class in the table is useful in comparing ongoing costs only, and will not help you determine the relative total costs of owning different funds. In addition, if these transactional costs were included, your costs would have been higher.
| | | Beginning
Account
Value
7/1/17 | | Actual Ending
Account
Value
12/31/17 | | Hypothetical
Ending Account
Value | | Actual
Expenses
Paid
During
Period* | | Hypothetical
Expenses Paid
During Period* | | Net
Expense
Ratio
During
Period** | |
International Advantage Portfolio Class I | | $ | 1,000.00 | | | $ | 1,137.20 | | | $ | 1,020.27 | | | $ | 5.28 | | | $ | 4.99 | | | | 0.98 | % | |
International Advantage Portfolio Class A | | | 1,000.00 | | | | 1,134.70 | | | | 1,018.60 | | | | 7.05 | | | | 6.67 | | | | 1.31 | | |
International Advantage Portfolio Class L | | | 1,000.00 | | | | 1,132.20 | | | | 1,015.93 | | | | 9.89 | | | | 9.35 | | | | 1.84 | | |
International Advantage Portfolio Class C | | | 1,000.00 | | | | 1,131.10 | | | | 1,014.72 | | | | 11.17 | | | | 10.56 | | | | 2.08 | | |
* Expenses are calculated using each Fund Class' annualized net expense ratio (as disclosed), multiplied by the average account value over the period, and multiplied by 184/365 (to reflect the most recent one-half year period).
** Annualized.
3
Morgan Stanley Institutional Fund, Inc.
Annual Report — December 31, 2017
Investment Overview (unaudited)
International Advantage Portfolio
The Fund seeks long-term capital appreciation.
Performance
For the year ended December 31, 2017, the Fund's Class I shares had a total return based on net asset value and reinvestment of distributions per share of 44.75%, net of fees. The Fund's Class I shares outperformed the Fund's benchmark, the MSCI All Country World Index ex USA (the "Index"), which returned 27.19%.
Please keep in mind that double-digit returns are highly unusual and cannot be sustained. Investors should also be aware that these returns were primarily achieved during favorable market conditions.
Factors Affecting Performance
• International equity markets rallied on stronger-than-expected economic data and improving corporate profits across Europe and Japan, along with stabilization in emerging market economies amid firming commodity prices. Central bank policy remained largely accommodative as inflation stayed muted and global growth improved. This contributed to weakening in the U.S. dollar, especially against the euro. Political risk abated as key elections across Europe voted in more mainstream candidates, and trade negotiation fears also diminished somewhat, although the North American Free Trade Agreement ("NAFTA") and Brexit talks are ongoing. Markets shrugged off other geopolitical concerns, including escalating tensions with North Korea and in the Middle East, to end the year sharply higher.
• International equity markets advanced 27.19% for the 12-month period ended December 31, 2017, as measured by the Index. Against this backdrop, our team remained focused on assessing company prospects over a longer-term period of three to five years, and owning a portfolio of high quality companies with diverse business drivers not tied to a particular market environment.
• The team manages focused portfolios that are highly differentiated from the benchmark, with securities weighted on our assessment of the quality of the company and our conviction. Our longer-term focus results in lower turnover than many of our peers. The value added or detracted in any period of time will typically result from stock selection, given our philosophy and process.
• For the 12-month period, the Fund outperformed the Index due to favorable stock selection and sector allocation.
• The Fund's relative outperformance was driven by stock selection in the consumer discretionary, industrials and consumer staples sectors.
• An overweight allocation to consumer staples and underweight exposures to the materials and industrials sectors detracted from relative results.
Management Strategies
• There were no changes to our bottom-up investment process during the period. The team seeks high quality companies, which we define primarily as those with sustainable competitive advantages. Our team continues to focus on bottom-up stock selection and the long-term outlook for companies owned in the portfolio; accordingly, we have had very limited turnover in the portfolio to date, as our ongoing work reaffirms our assessment of quality and competitive advantage in the names we own.
• At the close of the period, consumer staples represented the largest sector weight in the Fund, followed by information technology and consumer discretionary. The team's bottom-up investment process resulted in sector overweight positions in consumer staples, information technology, consumer discretionary and utilities, and underweight positions in financials, energy, materials, telecommunication services, health care, real estate and industrials.
4
Morgan Stanley Institutional Fund, Inc.
Annual Report — December 31, 2017
Investment Overview (unaudited) (cont'd)
International Advantage Portfolio
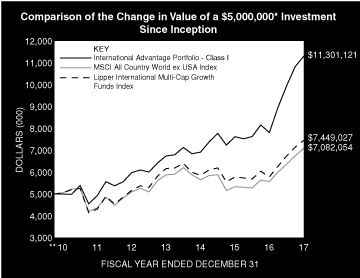
* Minimum Investment for Class I shares
** Commenced Operations on December 28, 2010.
In accordance with SEC regulations, the Fund's performance shown assumes that all recurring fees (including management fees) were deducted and all dividends and distributions were reinvested. The performance of Class A, L and C shares will vary from the performance of Class I shares and will be impacted by additional fees assessed to those classes.
Performance Compared to the MSCI All Country World ex USA Index(1) and the Lipper International Multi-Cap Growth Funds Index(2)
| | Period Ended December 31, 2017
Total Returns(3) | |
| | | | Average Annual | |
| | One
Year | | Five
Years | | Ten
Years | | Since
Inception(6) | |
Fund — Class I Shares
w/o sales charges(4) | | | 44.75 | % | | | 13.58 | % | | | — | | | | 12.34 | % | |
Fund — Class A Shares
w/o sales charges(4) | | | 44.18 | | | | 13.22 | | | | — | | | | 12.00 | | |
Fund — Class A Shares with
maximum 5.25% sales charges(4) | | | 36.58 | | | | 12.01 | | | | — | | | | 11.15 | | |
Fund — Class L Shares
w/o sales charges(4) | | | 43.41 | | | | 12.64 | | | | — | | | | 11.44 | | |
Fund — Class C Shares
w/o sales charges(5) | | | 43.16 | | | | — | | | | — | | | | 13.82 | | |
Fund — Class C Shares
with maximum 1.00% deferred
sales charges(5) | | | 42.16 | | | | — | | | | — | | | | 13.82 | | |
MSCI All Country World
ex USA Index | | | 27.19 | | | | 6.80 | | | | — | | | | 5.09 | | |
Lipper International Multi-Cap
Growth Funds Index | | | 28.88 | | | | 7.59 | | | | — | | | | 5.85 | | |
Performance data quoted represents past performance, which is no guarantee of future results, and current performance may be lower or higher than the figures shown. Performance assumes that all dividends and distributions, if any, were reinvested. For the most recent month-end performance figures, please visit www.morganstanley.com/im. Investment return and principal value will fluctuate so that Fund shares, when redeemed, may be worth more or less than their original cost. Total returns do not reflect the deduction of taxes that a shareholder would pay on Fund distributions or the redemption of Fund shares. Performance of share classes will vary due to difference in sales charges and expenses.
(1) The MSCI All Country World ex USA Index is a free float-adjusted market capitalization weighted index designed to measure the equity market performance of developed and emerging markets, excluding the United States. The term "free float" represents the portion of shares outstanding that are deemed to be available for purchase in the public equity markets by investors. The Index is unmanaged and its returns do not include any sales charges or fees. Such costs would lower performance. It is not possible to invest directly in an index.
(2) The Lipper International Multi-Cap Growth Funds Index is an equally weighted performance index of the largest qualifying funds (based on net assets) in the Lipper International Multi-Cap Growth Funds classification. The Index, which is adjusted for capital gains distributions and income dividends, is unmanaged and should not be considered an investment. There are currently 30 funds represented in this Index. As of the date of this report, the Fund was in the Lipper International Multi-Cap Growth Funds classification.
(3) Total returns for the Fund reflect fees waived and expenses reimbursed, if applicable, by the Adviser. Without such waivers and reimbursements, total returns would have been lower.
(4) Commenced operations on December 28, 2010.
(5) Commenced offering on April 30, 2015.
(6) For comparative purposes, average annual since inception returns listed for the Indexes refer to the inception date of Class I of the Fund, not the inception of the Index.
5
Morgan Stanley Institutional Fund, Inc.
Annual Report — December 31, 2017
Portfolio of Investments
International Advantage Portfolio
| | | Shares | | Value
(000) | |
Common Stocks (91.4%) | |
Australia (6.0%) | |
Brookfield Infrastructure Partners LP | | | 234,032 | | | $ | 10,487 | | |
CSL Ltd. | | | 78,540 | | | | 8,644 | | |
| | | | 19,131 | | |
Belgium (2.6%) | |
Anheuser-Busch InBev N.V. | | | 73,629 | | | | 8,213 | | |
Canada (2.2%) | |
Brookfield Asset Management, Inc., Class A | | | 162,631 | | | | 7,081 | | |
China (14.0%) | |
Alibaba Group Holding Ltd. ADR (a) | | | 68,191 | | | | 11,758 | | |
Foshan Haitian Flavouring & Food Co., Ltd.,
Class A | | | 786,461 | | | | 6,496 | | |
Jiangsu Hengrui Medicine Co., Ltd., Class A | | | 357,364 | | | | 3,782 | | |
Oppein Home Group, Inc., Class A (a) | | | 22,617 | | | | 410 | | |
Suofeiya Home Collection Co., Ltd., Class A | | | 390,822 | | | | 2,208 | | |
TAL Education Group ADR | | | 291,426 | | | | 8,658 | | |
Tencent Holdings Ltd. (b) | | | 212,900 | | | | 11,006 | | |
| | | | 44,318 | | |
Denmark (8.1%) | |
Chr Hansen Holding A/S | | | 95,019 | | | | 8,912 | | |
DSV A/S | | | 214,807 | | | | 16,912 | | |
| | | | 25,824 | | |
France (11.3%) | |
Danone SA | | | 94,893 | | | | 7,956 | | |
Hermes International | | | 36,343 | | | | 19,454 | | |
Pernod Ricard SA | | | 52,399 | | | | 8,294 | | |
| | | | 35,704 | | |
Hong Kong (1.7%) | |
AIA Group Ltd. | | | 617,500 | | | | 5,266 | | |
Italy (5.2%) | |
Moncler SpA | | | 528,910 | | | | 16,524 | | |
Japan (9.1%) | |
Calbee, Inc. | | | 324,900 | | | | 10,570 | | |
Keyence Corp. | | | 23,000 | | | | 12,842 | | |
Nihon M&A Center, Inc. | | | 117,100 | | | | 5,582 | | |
| | | | 28,994 | | |
Switzerland (7.1%) | |
Chocoladefabriken Lindt & Spruengli AG
(Registered) | | | 206 | | | | 14,895 | | |
Kuehne & Nagel International AG
(Registered) | | | 43,642 | | | | 7,713 | | |
| | | | 22,608 | | |
United Kingdom (15.9%) | |
Diageo PLC | | | 223,762 | | | | 8,189 | | |
Fevertree Drinks PLC | | | 243,120 | | | | 7,487 | | |
Reckitt Benckiser Group PLC | | | 221,602 | | | | 20,700 | | |
Rightmove PLC | | | 230,888 | | | | 14,023 | | |
| | | | 50,399 | | |
| | | Shares | | Value
(000) | |
United States (8.2%) | |
EPAM Systems, Inc. (a) | | | 129,084 | | | $ | 13,867 | | |
Priceline Group, Inc. (The) (a) | | | 6,917 | | | | 12,020 | | |
| | | | 25,887 | | |
Total Common Stocks (Cost $251,850) | | | 289,949 | | |
Short-Term Investment (8.4%) | |
Investment Company (8.4%) | |
Morgan Stanley Institutional Liquidity
Funds — Treasury Securities Portfolio —
Institutional Class (See Note G)
(Cost $26,761) | | | 26,760,994 | | | | 26,761 | | |
Total Investments Excluding Purchased
Options (99.8%) (Cost $278,611) | | | | | 316,710 | | |
Total Purchased Options Outstanding (0.0%)
(Cost $453) | | | 75 | | |
Total Investments (99.9%) (Cost $279,064) (c)(d) | | | 316,785 | | |
Other Assets in Excess of Liabilities (0.1%) | | | 411 | | |
Net Assets (100.0%) | | $ | 317,196 | | |
Country assignments and aggregations are based generally on third party vendor classifications and information, and may be different from the assignments and aggregations under the policies set forth in the Fund's prospectus and/or statement of additional information relating to geographic classifications.
(a) Non-income producing security.
(b) Security trades on the Hong Kong exchange.
(c) The approximate fair value and percentage of net assets, $226,078,000 and 71.3%, respectively, represent the securities that have been fair valued under the fair valuation policy for international investments as described in Note A-1 within the Notes to the Financial Statements.
(d) At December 31, 2017, the aggregate cost for federal income tax purposes is approximately $279,211,000. The aggregate gross unrealized appreciation is approximately $39,586,000 and the aggregate gross unrealized depreciation is approximately $2,011,000, resulting in net unrealized appreciation of approximately $37,575,000.
ADR American Depositary Receipt.
The accompanying notes are an integral part of the financial statements.
6
Morgan Stanley Institutional Fund, Inc.
Annual Report — December 31, 2017
Portfolio of Investments (cont'd)
International Advantage Portfolio
Call Options Purchased:
The Fund had the following call options purchased open at December 31, 2017:
Counterparty | | Description | | Strike
Price | | Expiration
Date | | Number of
Contracts | | Notional
Amount
(000) | | Value
(000) | | Premiums
Paid
(000) | | Unrealized
Depreciation
(000) | |
Royal Bank of Scotland | | USD/CNH | | CNH | 7.52 | | | Nov-18 | | | 64,496,916 | | | | 64,497 | | | $ | 63 | | | $ | 267 | | | $ | (204 | ) | |
Royal Bank of Scotland | | USD/CNH | | CNH | 7.55 | | | Aug-18 | | | 35,176,613 | | | | 35,177 | | | | 12 | | | | 186 | | | | (174 | ) | |
| | | | | | | | | | | | | $ | 75 | | | $ | 453 | | | $ | (378 | ) | |
CNH — Chinese Yuan Renminbi Offshore
USD — United States Dollar
Portfolio Composition
Classification | | Percentage of
Total Investments | |
Other* | | | 33.9 | % | |
Food Products | | | 12.6 | | |
Internet Software & Services | | | 11.6 | | |
Textiles, Apparel & Luxury Goods | | | 11.4 | | |
Beverages | | | 10.2 | | |
Short-Term Investment | | | 8.5 | | |
Household Products | | | 6.5 | | |
Road & Rail | | | 5.3 | | |
Total Investments | | | 100.0 | % | |
* Industries and/or investment types representing less than 5% of total investments.
The accompanying notes are an integral part of the financial statements.
7
Morgan Stanley Institutional Fund, Inc.
Annual Report — December 31, 2017
International Advantage Portfolio
Statement of Assets and Liabilities | | December 31, 2017
(000) | |
Assets: | |
Investments in Securities of Unaffiliated Issuers, at Value (Cost $252,303) | | $ | 290,024 | | |
Investment in Security of Affiliated Issuer, at Value (Cost $26,761) | | | 26,761 | | |
Total Investments in Securities, at Value (Cost $279,064) | | | 316,785 | | |
Foreign Currency, at Value (Cost $15) | | | 15 | | |
Cash | | | 91 | | |
Receivable for Fund Shares Sold | | | 1,361 | | |
Tax Reclaim Receivable | | | 76 | | |
Receivable from Affiliate | | | 26 | | |
Other Assets | | | 67 | | |
Total Assets | | | 318,421 | | |
Liabilities: | |
Payable for Advisory Fees | | | 432 | | |
Payable for Fund Shares Redeemed | | | 329 | | |
Due to Broker | | | 260 | | |
Payable for Professional Fees | | | 54 | | |
Payable for Custodian Fees | | | 47 | | |
Payable for Shareholder Services Fees — Class A | | | 28 | | |
Payable for Distribution and Shareholder Services Fees — Class L | | | — | @ | |
Payable for Distribution and Shareholder Services Fees — Class C | | | 5 | | |
Payable for Sub Transfer Agency Fees — Class I | | | 18 | | |
Payable for Sub Transfer Agency Fees — Class A | | | 7 | | |
Payable for Sub Transfer Agency Fees — Class L | | | — | @ | |
Payable for Sub Transfer Agency Fees — Class C | | | 1 | | |
Payable for Administration Fees | | | 20 | | |
Payable for Transfer Agency Fees — Class I | | | 5 | | |
Payable for Transfer Agency Fees — Class A | | | 1 | | |
Payable for Transfer Agency Fees — Class L | | | — | @ | |
Payable for Transfer Agency Fees — Class C | | | 1 | | |
Other Liabilities | | | 17 | | |
Total Liabilities | | | 1,225 | | |
Net Assets | | $ | 317,196 | | |
Net Assets Consist Of: | |
Paid-in-Capital | | $ | 279,324 | | |
Accumulated Net Investment Loss | | | (4 | ) | |
Accumulated Net Realized Gain | | | 152 | | |
Unrealized Appreciation (Depreciation) on: | |
Investments | | | 37,721 | | |
Foreign Currency Translations | | | 3 | | |
Net Assets | | $ | 317,196 | | |
The accompanying notes are an integral part of the financial statements.
8
Morgan Stanley Institutional Fund, Inc.
Annual Report — December 31, 2017
International Advantage Portfolio
Statement of Assets and Liabilities (cont'd) | | December 31, 2017
(000) | |
CLASS I: | |
Net Assets | | $ | 166,189 | | |
| Shares Outstanding $0.001 par value shares of beneficial interest (unlimited shares authorized) (not in 000's) | | | 9,841,240 | | |
Net Asset Value, Offering and Redemption Price Per Share | | $ | 16.89 | | |
CLASS A: | |
Net Assets | | $ | 144,112 | | |
| Shares Outstanding $0.001 par value shares of beneficial interest (unlimited shares authorized) (not in 000's) | | | 8,601,546 | | |
Net Asset Value, Redemption Price Per Share | | $ | 16.75 | | |
Maximum Sales Load | | | 5.25 | % | |
Maximum Sales Charge | | $ | 0.93 | | |
Maximum Offering Price Per Share | | $ | 17.68 | | |
CLASS L: | |
Net Assets | | $ | 135 | | |
| Shares Outstanding $0.001 par value shares of beneficial interest (unlimited shares authorized) (not in 000's) | | | 8,200 | | |
Net Asset Value, Offering and Redemption Price Per Share | | $ | 16.43 | | |
CLASS C: | |
Net Assets | | $ | 6,760 | | |
| Shares Outstanding $0.001 par value shares of beneficial interest (unlimited shares authorized) (not in 000's) | | | 414,806 | | |
Net Asset Value, Offering and Redemption Price Per Share | | $ | 16.30 | | |
@ Amount is less than $500.
The accompanying notes are an integral part of the financial statements.
9
Morgan Stanley Institutional Fund, Inc.
Annual Report — December 31, 2017
International Advantage Portfolio
Statement of Operations | | Year Ended
December 31, 2017
(000) | |
Investment Income: | |
Dividends from Securities of Unaffiliated Issuers (Net of $120 of Foreign Taxes Withheld) | | $ | 1,342 | | |
Dividends from Security of Affiliated Issuer (Note G) | | | 112 | | |
Income from Securities Loaned — Net | | | 3 | | |
Total Investment Income | | | 1,457 | | |
Expenses: | |
Advisory Fees (Note B) | | | 1,228 | | |
Shareholder Services Fees — Class A (Note D) | | | 138 | | |
Distribution and Shareholder Services Fees — Class L (Note D) | | | 1 | | |
Distribution and Shareholder Services Fees — Class C (Note D) | | | 34 | | |
Sub Transfer Agency Fees — Class I | | | 97 | | |
Sub Transfer Agency Fees — Class A | | | 39 | | |
Sub Transfer Agency Fees — Class L | | | — | @ | |
Sub Transfer Agency Fees — Class C | | | 3 | | |
Administration Fees (Note C) | | | 123 | | |
Professional Fees | | | 123 | | |
Custodian Fees (Note F) | | | 74 | | |
Registration Fees | | | 61 | | |
Shareholder Reporting Fees | | | 27 | | |
Transfer Agency Fees — Class I (Note E) | | | 13 | | |
Transfer Agency Fees — Class A (Note E) | | | 4 | | |
Transfer Agency Fees — Class L (Note E) | | | 2 | | |
Transfer Agency Fees — Class C (Note E) | | | 3 | | |
Directors' Fees and Expenses | | | 6 | | |
Pricing Fees | | | 5 | | |
Other Expenses | | | 27 | | |
Total Expenses | | | 2,008 | | |
Waiver of Advisory Fees (Note B) | | | (140 | ) | |
Reimbursement of Class Specific Expenses — Class I (Note B) | | | (110 | ) | |
Reimbursement of Class Specific Expenses — Class L (Note B) | | | (2 | ) | |
Reimbursement of Class Specific Expenses — Class C (Note B) | | | (2 | ) | |
Rebate from Morgan Stanley Affiliate (Note G) | | | (24 | ) | |
Net Expenses | | | 1,730 | | |
Net Investment Loss | | | (273 | ) | |
Realized Gain: | |
Investments Sold | | | 6,173 | | |
Foreign Currency Transactions | | | 138 | | |
Realized Gain | | | 6,311 | | |
Change in Unrealized Appreciation (Depreciation): | |
Investments | | | 37,210 | | |
Foreign Currency Translations | | | 4 | | |
Net Change in Unrealized Appreciation (Depreciation) | | | 37,214 | | |
Net Realized Gain and Change in Unrealized Appreciation (Depreciation) | | | 43,525 | | |
Net Increase in Net Assets Resulting from Operations | | $ | 43,252 | | |
@ Amount is less than $500.
The accompanying notes are an integral part of the financial statements.
10
Morgan Stanley Institutional Fund, Inc.
Annual Report — December 31, 2017
International Advantage Portfolio
Statements of Changes in Net Assets | | Year Ended
December 31, 2017
(000) | | Year Ended
December 31, 2016
(000) | |
Increase (Decrease) in Net Assets: | |
Operations: | |
Net Investment Income (Loss) | | $ | (273 | ) | | $ | 10 | | |
Net Realized Gain | | | 6,311 | | | | 575 | | |
Net Change in Unrealized Appreciation (Depreciation) | | | 37,214 | | | | 181 | | |
Net Increase in Net Assets Resulting from Operations | | | 43,252 | | | | 766 | | |
Distributions from and/or in Excess of: | |
Class I: | |
Net Realized Gain | | | (3,225 | ) | | | (272 | ) | |
Class A: | |
Net Realized Gain | | | (2,609 | ) | | | (182 | ) | |
Class L: | |
Net Realized Gain | | | (3 | ) | | | (1 | ) | |
Class C: | |
Net Realized Gain | | | (134 | ) | | | (17 | ) | |
Total Distributions | | | (5,971 | ) | | | (472 | ) | |
Capital Share Transactions:(1) | |
Class I: | |
Subscribed | | | 152,464 | | | | 30,034 | | |
Distributions Reinvested | | | 3,224 | | | | 272 | | |
Redeemed | | | (44,827 | ) | | | (3,133 | ) | |
Class A: | |
Subscribed | | | 129,943 | | | | 12,448 | | |
Distributions Reinvested | | | 2,609 | | | | 182 | | |
Redeemed | | | (10,165 | ) | | | (4,830 | ) | |
Class L: | |
Exchanged | | | 27 | | | | 51 | | |
Distributions Reinvested | | | 2 | | | | 1 | | |
Redeemed | | | (— | @) | | | (193 | ) | |
Class C: | |
Subscribed | | | 5,022 | | | | 975 | | |
Distributions Reinvested | | | 134 | | | | 17 | | |
Redeemed | | | (270 | ) | | | (159 | ) | |
Net Increase in Net Assets Resulting from Capital Share Transactions | | | 238,163 | | | | 35,665 | | |
Redemption Fees | | | 7 | | | | 1 | | |
Total Increase in Net Assets | | | 275,451 | | | | 35,960 | | |
Net Assets: | |
Beginning of Period | | | 41,745 | | | | 5,785 | | |
End of Period (Including Accumulated Net Investment Loss of $(4) and $(11)) | | $ | 317,196 | | | $ | 41,745 | | |
The accompanying notes are an integral part of the financial statements.
11
Morgan Stanley Institutional Fund, Inc.
Annual Report — December 31, 2017
International Advantage Portfolio
Statements of Changes in Net Assets (cont'd) | | Year Ended
December 31, 2017
(000) | | Year Ended
December 31, 2016
(000) | |
(1) Capital Share Transactions: | |
Class I: | |
Shares Subscribed | | | 10,012 | | | | 2,536 | | |
Shares Issued on Distributions Reinvested | | | 194 | | | | 23 | | |
Shares Redeemed | | | (2,865 | ) | | | (259 | ) | |
Net Increase in Class I Shares Outstanding | | | 7,341 | | | | 2,300 | | |
Class A: | |
Shares Subscribed | | | 8,199 | | | | 1,045 | | |
Shares Issued on Distributions Reinvested | | | 158 | | | | 16 | | |
Shares Redeemed | | | (668 | ) | | | (400 | ) | |
Net Increase in Class A Shares Outstanding | | | 7,689 | | | | 661 | | |
Class L: | |
Shares Exchanged | | | 2 | | | | 4 | | |
Shares Issued on Distributions Reinvested | | | — | @@ | | | — | @@ | |
Shares Redeemed | | | (— | @@) | | | (16 | ) | |
Net Increase (Decrease) in Class L Shares Outstanding | | | 2 | | | | (12 | ) | |
Class C: | |
Shares Subscribed | | | 334 | | | | 83 | | |
Shares Issued on Distributions Reinvested | | | 8 | | | | 1 | | |
Shares Redeemed | | | (19 | ) | | | (13 | ) | |
Net Increase in Class C Shares Outstanding | | | 323 | | | | 71 | | |
@ Amount is less than $500.
@@ Amount is less than 500 shares.
The accompanying notes are an integral part of the financial statements.
12
Morgan Stanley Institutional Fund, Inc.
Annual Report — December 31, 2017
Financial Highlights
International Advantage Portfolio
| | | Class I | |
| | | Year Ended December 31, | |
Selected Per Share Data and Ratios | | 2017 | | 2016(1) | | 2015 | | 2014 | | 2013 | |
Net Asset Value, Beginning of Period | | $ | 11.91 | | | $ | 11.80 | | | $ | 12.36 | | | $ | 12.36 | | | $ | 11.60 | | |
Income from Investment Operations: | |
Net Investment Income(2) | | | 0.00 | (3) | | | 0.02 | | | | 0.10 | | | | 0.13 | | | | 0.13 | | |
Net Realized and Unrealized Gain | | | 5.32 | | | | 0.29 | | | | 1.18 | | | | 0.20 | | | | 1.32 | | |
Total from Investment Operations | | | 5.32 | | | | 0.31 | | | | 1.28 | | | | 0.33 | | | | 1.45 | | |
Distributions from and/or in Excess of: | |
Net Investment Income | | | — | | | | — | | | | (0.10 | ) | | | (0.07 | ) | | | (0.12 | ) | |
Net Realized Gain | | | (0.34 | ) | | | (0.20 | ) | | | (1.74 | ) | | | (0.26 | ) | | | (0.57 | ) | |
Total Distributions | | | (0.34 | ) | | | (0.20 | ) | | | (1.84 | ) | | | (0.33 | ) | | | (0.69 | ) | |
Redemption Fees | | | 0.00 | (3) | | | 0.00 | (3) | | | — | | | | 0.00 | (3) | | | — | | |
Net Asset Value, End of Period | | $ | 16.89 | | | $ | 11.91 | | | $ | 11.80 | | | $ | 12.36 | | | $ | 12.36 | | |
Total Return(4) | | | 44.75 | % | | | 2.47 | % | | | 10.23 | % | | | 2.58 | % | | | 12.72 | % | |
Ratios and Supplemental Data: | |
Net Assets, End of Period (Thousands) | | $ | 166,189 | | | $ | 29,781 | | | $ | 2,361 | | | $ | 3,387 | | | $ | 2,637 | | |
Ratio of Expenses to Average Net Assets(8) | | | 0.98 | %(5) | | | 0.99 | %(5) | | | 1.16 | %(5)(6) | | | 1.24 | %(5) | | | 1.24 | %(5) | |
Ratio of Net Investment Income to Average Net Assets(8) | | | 0.02 | %(5) | | | 0.20 | %(5) | | | 0.76 | %(5) | | | 1.05 | %(5) | | | 1.04 | %(5) | |
Ratio of Rebate from Morgan Stanley Affiliates to Average Net Assets | | | 0.02 | % | | | 0.01 | % | | | 0.00 | %(7) | | | 0.01 | % | | | 0.00 | %(7) | |
Portfolio Turnover Rate | | | 30 | % | | | 23 | % | | | 96 | % | | | 30 | % | | | 49 | % | |
(8) Supplemental Information on the Ratios to Average Net Assets: | |
Ratios Before Expense Limitation: | |
Expenses to Average Net Assets | | | 1.21 | % | | | 2.26 | % | | | 4.82 | % | | | 5.47 | % | | | 6.30 | % | |
Net Investment Loss to Average Net Assets | | | (0.21 | )% | | | (1.07 | )% | | | (2.90 | )% | | | (3.18 | )% | | | (4.02 | )% | |
(1) Reflects prior period custodian out-of-pocket expenses that were reimbursed in September 2016. The amount of the reimbursement was immaterial on a per share basis and did not impact the total return of Class I shares. The Ratio of Expenses to Average Net Assets and the Ratio of Net Investment Income to Average Net Assets would be unchanged as the reimbursement of custodian fees was offset against expense waivers/reimbursements with no impact to net expenses or net investment income.
(2) Per share amount is based on average shares outstanding.
(3) Amount is less than $0.005 per share.
(4) Calculated based on the net asset value as of the last business day of the period.
(5) The Ratios of Expenses and Net Investment Income reflect the rebate of certain Fund expenses in connection with the investments in Morgan Stanley affiliates during the period. The effect of the rebate on the ratios is disclosed in the above table as "Ratio of Rebate from Morgan Stanley Affiliates to Average Net Assets."
(6) Effective July 1, 2015, the Adviser has agreed to limit the ratio of expenses to average net assets to the maximum ratio of 1.00% for Class I shares. Prior to July 1, 2015, the maximum ratio was 1.25% for Class I shares.
(7) Amount is less than 0.005%.
The accompanying notes are an integral part of the financial statements.
13
Morgan Stanley Institutional Fund, Inc.
Annual Report — December 31, 2017
Financial Highlights
International Advantage Portfolio
| | | Class A | |
| | | Year Ended December 31, | |
Selected Per Share Data and Ratios | | 2017 | | 2016(1) | | 2015 | | 2014 | | 2013 | |
Net Asset Value, Beginning of Period | | $ | 11.86 | | | $ | 11.79 | | | $ | 12.37 | | | $ | 12.38 | | | $ | 11.60 | | |
Income (Loss) from Investment Operations: | |
Net Investment Income (Loss)(2) | | | (0.07 | ) | | | (0.00 | )(3) | | | 0.01 | | | | 0.09 | | | | 0.04 | | |
Net Realized and Unrealized Gain | | | 5.30 | | | | 0.27 | | | | 1.23 | | | | 0.19 | | | | 1.38 | | |
Total from Investment Operations | | | 5.23 | | | | 0.27 | | | | 1.24 | | | | 0.28 | | | | 1.42 | | |
Distributions from and/or in Excess of: | |
Net Investment Income | | | — | | | | — | | | | (0.08 | ) | | | (0.03 | ) | | | (0.07 | ) | |
Net Realized Gain | | | (0.34 | ) | | | (0.20 | ) | | | (1.74 | ) | | | (0.26 | ) | | | (0.57 | ) | |
Total Distributions | | | (0.34 | ) | | | (0.20 | ) | | | (1.82 | ) | | | (0.29 | ) | | | (0.64 | ) | |
Redemption Fees | | | 0.00 | (3) | | | 0.00 | (3) | | | — | | | | 0.00 | (3) | | | — | | |
Net Asset Value, End of Period | | $ | 16.75 | | | $ | 11.86 | | | $ | 11.79 | | | $ | 12.37 | | | $ | 12.38 | | |
Total Return(4) | | | 44.18 | % | | | 2.13 | % | | | 9.92 | % | | | 2.21 | % | | | 12.43 | % | |
Ratios and Supplemental Data: | |
Net Assets, End of Period (Thousands) | | $ | 144,112 | | | $ | 10,822 | | | $ | 2,966 | | | $ | 889 | | | $ | 248 | | |
Ratio of Expenses to Average Net Assets(9) | | | 1.31 | %(5) | | | 1.34 | %(5) | | | 1.46 | %(5)(6) | | | 1.59 | %(5) | | | 1.55 | %(5)(7) | |
Ratio of Net Investment Income (Loss) to Average Net Assets(9) | | | (0.46 | )%(5) | | | (0.04 | )%(5) | | | 0.09 | %(5) | | | 0.70 | %(5) | | | 0.29 | %(5) | |
Ratio of Rebate from Morgan Stanley Affiliates to Average Net Assets | | | 0.02 | % | | | 0.01 | % | | | 0.00 | %(8) | | | 0.01 | % | | | 0.00 | %(8) | |
Portfolio Turnover Rate | | | 30 | % | | | 23 | % | | | 96 | % | | | 30 | % | | | 49 | % | |
(9) Supplemental Information on the Ratios to Average Net Assets: | |
Ratios Before Expense Limitation: | |
Expenses to Average Net Assets | | | 1.42 | % | | | 2.55 | % | | | 5.77 | % | | | 6.03 | % | | | 6.89 | % | |
Net Investment Loss to Average Net Assets | | | (0.57 | )% | | | (1.25 | )% | | | (4.22 | )% | | | (3.74 | )% | | | (5.05 | )% | |
(1) Reflects prior period custodian out-of-pocket expenses that were reimbursed in September 2016. The amount of the reimbursement was immaterial on a per share basis and did not impact the total return of Class A shares. The Ratio of Expenses to Average Net Assets and the Ratio of Net Investment Loss to Average Net Assets would be unchanged as the reimbursement of custodian fees was offset against expense waivers/reimbursements with no impact to net expenses or net investment loss.
(2) Per share amount is based on average shares outstanding.
(3) Amount is less than $0.005 per share.
(4) Calculated based on the net asset value which does not reflect sales charges, if applicable, as of the last business day of the period.
(5) The Ratios of Expenses and Net Investment Income (Loss) reflect the rebate of certain Fund expenses in connection with the investments in Morgan Stanley affiliates during the period. The effect of the rebate on the ratios is disclosed in the above table as "Ratio of Rebate from Morgan Stanley Affiliates to Average Net Assets."
(6) Effective July 1, 2015, the Adviser has agreed to limit the ratio of expenses to average net assets to the maximum ratio of 1.35% for Class A shares. Prior to July 1, 2015, the maximum ratio was 1.60% for Class A shares.
(7) Effective September 16, 2013, the Adviser has agreed to limit the ratio of expenses to average net assets to the maximum ratio of 1.60% for Class A shares. Prior to September 16, 2013, the maximum ratio was 1.50% for Class A shares.
(8) Amount is less than 0.005%.
The accompanying notes are an integral part of the financial statements.
14
Morgan Stanley Institutional Fund, Inc.
Annual Report — December 31, 2017
Financial Highlights
International Advantage Portfolio
| | | Class L | |
| | | Year Ended December 31, | |
Selected Per Share Data and Ratios | | 2017 | | 2016(1) | | 2015 | | 2014 | | 2013 | |
Net Asset Value, Beginning of Period | | $ | 11.70 | | | $ | 11.69 | | | $ | 12.31 | | | $ | 12.36 | | | $ | 11.60 | | |
Income (Loss) from Investment Operations: | |
Net Investment Income (Loss)(2) | | | (0.11 | ) | | | (0.06 | ) | | | (0.04 | ) | | | 0.02 | | | | 0.02 | | |
Net Realized and Unrealized Gain | | | 5.18 | | | | 0.27 | | | | 1.20 | | | | 0.20 | | | | 1.34 | | |
Total from Investment Operations | | | 5.07 | | | | 0.21 | | | | 1.16 | | | | 0.22 | | | | 1.36 | | |
Distributions from and/or in Excess of: | |
Net Investment Income | | | — | | | | — | | | | (0.04 | ) | | | (0.01 | ) | | | (0.03 | ) | |
Net Realized Gain | | | (0.34 | ) | | | (0.20 | ) | | | (1.74 | ) | | | (0.26 | ) | | | (0.57 | ) | |
Total Distributions | | | (0.34 | ) | | | (0.20 | ) | | | (1.78 | ) | | | (0.27 | ) | | | (0.60 | ) | |
Redemption Fees | | | 0.00 | (3) | | | 0.00 | (3) | | | — | | | | 0.00 | (3) | | | — | | |
Net Asset Value, End of Period | | $ | 16.43 | | | $ | 11.70 | | | $ | 11.69 | | | $ | 12.31 | | | $ | 12.36 | | |
Total Return(4) | | | 43.41 | % | | | 1.64 | % | | | 9.34 | % | | | 1.69 | % | | | 11.88 | % | |
Ratios and Supplemental Data: | |
Net Assets, End of Period (Thousands) | | $ | 135 | | | $ | 75 | | | $ | 211 | | | $ | 148 | | | $ | 123 | | |
Ratio of Expenses to Average Net Assets(9) | | | 1.84 | %(5) | | | 1.84 | %(5) | | | 1.97 | %(5)(6) | | | 2.09 | %(5) | | | 2.03 | %(5)(7) | |
Ratio of Net Investment Income (Loss) to Average Net Assets(9) | | | (0.77 | )%(5) | | | (0.52 | )%(5) | | | (0.31 | )%(5) | | | 0.20 | %(5) | | | 0.18 | %(5) | |
Ratio of Rebate from Morgan Stanley Affiliates to Average Net Assets | | | 0.01 | % | | | 0.01 | % | | | 0.00 | %(8) | | | 0.01 | % | | | 0.00 | %(8) | |
Portfolio Turnover Rate | | | 30 | % | | | 23 | % | | | 96 | % | | | 30 | % | | | 49 | % | |
(9) Supplemental Information on the Ratios to Average Net Assets: | |
Ratios Before Expense Limitation: | |
Expenses to Average Net Assets | | | 3.82 | % | | | 3.96 | % | | | 6.87 | % | | | 7.42 | % | | | 7.43 | % | |
Net Investment Loss to Average Net Assets | | | (2.75 | )% | | | (2.64 | )% | | | (5.21 | )% | | | (5.13 | )% | | | (5.22 | )% | |
(1) Reflects prior period custodian out-of-pocket expenses that were reimbursed in September 2016. The amount of the reimbursement was immaterial on a per share basis and did not impact the total return of Class L shares. The Ratio of Expenses to Average Net Assets and the Ratio of Net Investment Loss to Average Net Assets would be unchanged as the reimbursement of custodian fees was offset against expense waivers/reimbursements with no impact to net expenses or net investment loss.
(2) Per share amount is based on average shares outstanding.
(3) Amount is less than $0.005 per share.
(4) Calculated based on the net asset value as of the last business day of the period.
(5) The Ratios of Expenses and Net Investment Income (Loss) reflect the rebate of certain Fund expenses in connection with the investments in Morgan Stanley affiliates during the period. The effect of the rebate on the ratios is disclosed in the above table as "Ratio of Rebate from Morgan Stanley Affiliates to Average Net Assets."
(6) Effective July 1, 2015, the Adviser has agreed to limit the ratio of expenses to average net assets to the maximum ratio of 1.85% for Class L shares. Prior to July 1, 2015, the maximum ratio was 2.10% for Class L shares.
(7) Effective September 16, 2013, the Adviser has agreed to limit the ratio of expenses to average net assets to the maximum ratio of 2.10% for Class L shares. Prior to September 16, 2013, the maximum ratio was 2.00% for Class L shares.
(8) Amount is less than 0.005%.
The accompanying notes are an integral part of the financial statements.
15
Morgan Stanley Institutional Fund, Inc.
Annual Report — December 31, 2017
Financial Highlights
International Advantage Portfolio
| | | Class C | |
| | | Year Ended December 31, | | Period from
April 30, 2015(2) to | |
Selected Per Share Data and Ratios | | 2017 | | 2016(1) | | December 31, 2015 | |
Net Asset Value, Beginning of Period | | $ | 11.63 | | | $ | 11.66 | | | $ | 13.80 | | |
Income (Loss) from Investment Operations: | |
Net Investment Loss(3) | | | (0.17 | ) | | | (0.11 | ) | | | (0.08 | ) | |
Net Realized and Unrealized Gain (Loss) | | | 5.18 | | | | 0.28 | | | | (0.26 | ) | |
Total from Investment Operations | | | 5.01 | | | | 0.17 | | | | (0.34 | ) | |
Distributions from and/or in Excess of: | |
Net Investment Income | | | — | | | | — | | | | (0.06 | ) | |
Net Realized Gain | | | (0.34 | ) | | | (0.20 | ) | | | (1.74 | ) | |
Total Distributions | | | (0.34 | ) | | | (0.20 | ) | | | (1.80 | ) | |
Redemption Fees | | | 0.00 | (4) | | | 0.00 | (4) | | | — | | |
Net Asset Value, End of Period | | $ | 16.30 | | | $ | 11.63 | | | $ | 11.66 | | |
Total Return(5) | | | 43.16 | % | | | 1.38 | % | | | (2.63 | )%(9) | |
Ratios and Supplemental Data: | |
Net Assets, End of Period (Thousands) | | $ | 6,760 | | | $ | 1,067 | | | $ | 247 | | |
Ratio of Expenses to Average Net Assets(11) | | | 2.08 | %(6) | | | 2.09 | %(6) | | | 2.11 | %(6)(7)(10) | |
Ratio of Net Investment Loss to Average Net Assets(11) | | | (1.12 | )%(6) | | | (0.91 | )%(6) | | | (0.94 | )%(6)(10) | |
Ratio of Rebate from Morgan Stanley Affiliates to Average Net Assets | | | 0.02 | % | | | 0.01 | % | | | 0.00 | %(8) | |
Portfolio Turnover Rate | | | 30 | % | | | 23 | % | | | 96 | % | |
(11) Supplemental Information on the Ratios to Average Net Assets: | |
Ratios Before Expense Limitation: | |
Expenses to Average Net Assets | | | 2.25 | % | | | 3.60 | % | | | 9.11 | %(10) | |
Net Investment Loss to Average Net Assets | | | (1.29 | )% | | | (2.42 | )% | | | (7.94 | )%(10) | |
(1) Reflects prior period custodian out-of-pocket expenses that were reimbursed in September 2016. The amount of the reimbursement was immaterial on a per share basis and did not impact the total return of Class C shares. The Ratio of Expenses to Average Net Assets and the Ratio of Net Investment Loss to Average Net Assets would be unchanged as the reimbursement of custodian fees was offset against expense waivers/reimbursements with no impact to net expenses or net investment loss.
(2) Commencement of Offering.
(3) Per share amount is based on average shares outstanding.
(4) Amount is less than $0.005 per share.
(5) Calculated based on the net asset value which does not reflect sales charges, if applicable, as of the last business day of the period.
(6) The Ratios of Expenses and Net Investment Loss reflect the rebate of certain Fund expenses in connection with the investments in Morgan Stanley affiliates during the period. The effect of the rebate on the ratios is disclosed in the above table as "Ratio of Rebate from Morgan Stanley Affiliates to Average Net Assets."
(7) Effective July 1, 2015, the Adviser has agreed to limit the ratio of expenses to average net assets to the maximum ratio of 2.10% for Class C shares. Prior to July 1, 2015, the maximum ratio was 2.35% for Class C shares.
(8) Amount is less than 0.005%.
(9) Not annualized.
(10) Annualized.
The accompanying notes are an integral part of the financial statements.
16
Morgan Stanley Institutional Fund, Inc.
Annual Report — December 31, 2017
Notes to Financial Statements
Morgan Stanley Institutional Fund, Inc. (the "Company") is registered under the Investment Company Act of 1940, as amended (the "Act"), as an open-end management investment company. The Company is comprised of twenty-nine separate, active, diversified and non-diversified funds (individually referred to as a "Fund", collectively as the "Funds"). The Company applies investment company accounting and reporting guidance.
The accompanying financial statements relate to the International Advantage Portfolio. The Fund seeks long-term capital appreciation.
The Fund offers four classes of shares — Class I, Class A, Class L and Class C. On April 30, 2015, the Fund suspended offering of Class L shares. Existing Class L shareholders may invest through reinvestment of dividends and distributions.
A. Significant Accounting Policies: The following significant accounting policies are in conformity with U.S. generally accepted accounting principles ("GAAP"). Such policies are consistently followed by the Company in the preparation of its financial statements. GAAP may require management to make estimates and assumptions that affect the reported amounts and disclosures in the financial statements. Actual results may differ from those estimates.
1. Security Valuation: (1) An equity portfolio security listed or traded on an exchange is valued at its latest reported sales price (or at the exchange official closing price if such exchange reports an official closing price), and if there were no sales on a given day and if there is no official exchange closing price for that day, the security is valued at the mean between the last reported bid and asked prices if such bid and asked prices are available on the relevant exchanges. Listed equity securities not traded on the valuation date with no reported bid and asked prices available on the exchange are valued at the mean between the current bid and asked prices obtained from one or more reputable brokers or dealers. In cases where a security is traded on more than one exchange, the security is valued on the exchange designated as the primary market; (2) all other equity portfolio securities for which over-the-counter ("OTC") market quotations are readily available are valued at the latest reported sales price (or at the market official closing price if such market reports an official closing price), and if there was no trading in the security on a given day and if there is no official closing price from relevant markets for that day, the security is
valued at the mean between the last reported bid and asked prices if such bid and asked prices are available on the relevant markets. An unlisted equity security that does not trade on the valuation date and for which bid and asked prices from the relevant markets are unavailable is valued at the mean between the current bid and asked prices obtained from one or more reputable brokers or dealers; (3) certain portfolio securities may be valued by an outside pricing service/vendor approved by the Company's Board of Directors (the "Directors"). The pricing service/vendor may employ a pricing model that takes into account, among other things, bids, yield spreads, and/or other market data and specific security characteristics. Alternatively, if a valuation is not available from an outside pricing service/vendor, and the security trades on an exchange, the security may be valued at its latest reported sale price (or at the exchange official closing price if such exchange reports an official closing price), prior to the time when assets are valued. If there are no sales on a given day and if there is no official exchange closing price for that day, the security is valued at the mean between the last reported bid and asked prices if such bid and asked prices are available in the relevant exchanges; (4) listed options are valued at the last reported sales price on the exchange on which they are listed (or at the exchange official closing price if such exchange reports an official closing price). If an official closing price or last reported sales price is unavailable, the listed option should be fair valued at the mean between its latest bid and ask prices. Unlisted options are valued at the mean between their latest bid and ask prices from a broker/dealer or valued by a pricing service/vendor; (5) when market quotations are not readily available, including circumstances under which Morgan Stanley Investment Management Inc. (the "Adviser") determines that the closing price, last sale price or the mean between the last reported bid and asked prices are not reflective of a security's market value, portfolio securities are valued at their fair value as determined in good faith under procedures established by and under the general supervision of the Directors. Occasionally, developments affecting the closing prices of securities and other assets may occur between the times at which valuations of such securities are determined (that is, close of the foreign market on which the securities trade) and the close of business of the New York Stock Exchange ("NYSE"). If developments occur during such periods that are expected to materially affect the value of such securities, such
17
Morgan Stanley Institutional Fund, Inc.
Annual Report — December 31, 2017
Notes to Financial Statements (cont'd)
valuations may be adjusted to reflect the estimated fair value of such securities as of the close of the NYSE, as determined in good faith by the Directors or by the Adviser using a pricing service and/or procedures approved by the Directors; (6) quotations of foreign portfolio securities, other assets and liabilities and forward contracts stated in foreign currency are translated into U.S. dollar equivalents at the prevailing market rates prior to the close of the NYSE; and (7) investments in mutual funds, including the Morgan Stanley Institutional Liquidity Funds, are valued at the net asset value ("NAV") as of the close of each business day.
The Directors have responsibility for determining in good faith the fair value of the investments, and the Directors may appoint others, such as the Company's Adviser or a valuation committee, to assist the Directors in determining fair value and to make the actual calculations pursuant to the fair valuation methodologies previously approved by the Directors. Under procedures approved by the Directors, the Company's Adviser has formed a Valuation Committee whose members are approved by the Directors. The Valuation Committee provides administration and oversight of the Company's valuation policies and procedures, which are reviewed at least annually by the Directors. These procedures allow the Company to utilize independent pricing services, quotations from securities and financial instrument dealers, and other market sources to determine fair value.
The Company has procedures to determine the fair value of securities and other financial instruments for which market prices are not readily available. Under these procedures, the Valuation Committee convenes on a regular and ad hoc basis to review such securities and considers a number of factors, including valuation methodologies and significant unobservable valuation inputs, when arriving at fair value. The Valuation Committee may employ a market-based approach which may use related or comparable assets or liabilities, recent transactions, market multiples, book values, and other relevant information for the investment to determine the fair value of the investment. An income-based valuation approach may also be used in which the anticipated future cash flows of the investment are discounted to calculate fair value. Discounts may also be applied due to the nature or duration of any restrictions on the disposition of the investments. Due to the inherent uncertainty of valuations of such investments, the fair
values may differ significantly from the values that would have been used had an active market existed. The Valuation Committee employs various methods for calibrating these valuation approaches including a regular review of valuation methodologies, key inputs and assumptions, transactional back-testing or disposition analysis, and reviews of any related market activity.
2. Fair Value Measurement: Financial Accounting Standards Board ("FASB") Accounting Standards CodificationTM ("ASC") 820, "Fair Value Measurement" ("ASC 820"), defines fair value as the value that the Fund would receive to sell an investment or pay to transfer a liability in a timely transaction with an independent buyer in the principal market, or in the absence of a principal market, the most advantageous market for the investment or liability. ASC 820 establishes a three-tier hierarchy to distinguish between (1) inputs that reflect the assumptions market participants would use in valuing an asset or liability developed based on market data obtained from sources independent of the reporting entity (observable inputs) and (2) inputs that reflect the reporting entity's own assumptions about the assumptions market participants would use in valuing an asset or liability developed based on the best information available in the circumstances (unobservable inputs) and to establish classification of fair value measurements for disclosure purposes. Various inputs are used in determining the value of the Fund's investments. The inputs are summarized in the three broad levels listed below.
• Level 1 – unadjusted quoted prices in active markets for identical investments
• Level 2 – other significant observable inputs (including quoted prices for similar investments, interest rates, prepayment speeds, credit risk, etc.)
• Level 3 – significant unobservable inputs including the Fund's own assumptions in determining the fair value of investments. Factors considered in making this determination may include, but are not limited to, information obtained by contacting the issuer, analysts, or the appropriate stock exchange (for exchange-traded securities), analysis of the issuer's financial statements or other available documents and, if necessary, available information concerning other securities in similar circumstances
18
Morgan Stanley Institutional Fund, Inc.
Annual Report — December 31, 2017
Notes to Financial Statements (cont'd)
The inputs or methodology used for valuing securities are not necessarily an indication of the risk associated with investing in those securities and the determination of the significance of a particular input to the fair value measurement in its entirety requires judgment and considers factors specific to each security.
The following is a summary of the inputs used to value the Fund's investments as of December 31, 2017.
Investment Type | | Level 1
Unadjusted
quoted
prices
(000) | | Level 2
Other
significant
observable
inputs
(000) | | Level 3
Significant
unobservable
inputs
(000) | | Total
(000) | |
Assets: | |
Common Stocks | |
Beverages | | $ | — | | | $ | 32,183 | | | $ | — | | | $ | 32,183 | | |
Biotechnology | | | — | | | | 8,644 | | | | — | | | | 8,644 | | |
Capital Markets | | | 7,081 | | | | — | | | | — | | | | 7,081 | | |
Chemicals | | | — | | | | 8,912 | | | | — | | | | 8,912 | | |
Diversified Consumer
Services | | | 8,658 | | | | — | | | | — | | | | 8,658 | | |
Electric Utilities | | | 10,487 | | | | — | | | | — | | | | 10,487 | | |
Electronic Equipment,
Instruments &
Components | | | — | | | | 12,842 | | | | — | | | | 12,842 | | |
Food Products | | | — | | | | 39,917 | | | | — | | | | 39,917 | | |
Household Durables | | | — | | | | 2,618 | | | | — | | | | 2,618 | | |
Household Products | | | — | | | | 20,700 | | | | — | | | | 20,700 | | |
Information Technology
Services | | | 13,867 | | | | — | | | | — | | | | 13,867 | | |
Insurance | | | — | | | | 5,266 | | | | — | | | | 5,266 | | |
Internet & Direct
Marketing Retail | | | 12,020 | | | | — | | | | — | | | | 12,020 | | |
Internet Software &
Services | | | 11,758 | | | | 25,029 | | | | — | | | | 36,787 | | |
Marine | | | — | | | | 7,713 | | | | — | | | | 7,713 | | |
Pharmaceuticals | | | — | | | | 3,782 | | | | — | | | | 3,782 | | |
Professional Services | | | — | | | | 5,582 | | | | — | | | | 5,582 | | |
Road & Rail | | | — | | | | 16,912 | | | | — | | | | 16,912 | | |
Textiles, Apparel &
Luxury Goods | | | — | | | | 35,978 | | | | — | | | | 35,978 | | |
Total Common Stocks | | | 63,871 | | | | 226,078 | | | | — | | | | 289,949 | | |
Call Options Purchased | | | — | | | | 75 | | | | — | | | | 75 | | |
Short-Term Investment | |
Investment Company | | | 26,761 | | | | — | | | | — | | | | 26,761 | | |
Total Assets | | $ | 90,632 | | | $ | 226,153 | | | $ | — | | | $ | 316,785 | | |
Transfers between investment levels may occur as the markets fluctuate and/or the availability of data used in an investment's valuation changes. The Fund recognizes transfers between the levels as of the end of the period. As of December 31, 2017, securities with a total value of approximately $179,755,000 transferred from Level 1 to Level 2. Securities that were valued using unadjusted quoted prices at December 31, 2016 were valued using other significant observable inputs at December 31, 2017.
At December 31, 2017, the fair value of certain securities were adjusted due to developments which occurred between the time of the close of the foreign markets on which they trade and the close of business on the NYSE which resulted in their Level 2 classification.
3. Foreign Currency Translation and Foreign Investments: The books and records of the Fund are maintained in U.S. dollars. Foreign currency amounts are translated into U.S. dollars as follows:
– investments, other assets and liabilities at the prevailing rate of exchange on the valuation date;
– investment transactions and investment income at the prevailing rates of exchange on the dates of such transactions.
Although the net assets of the Fund are presented at the foreign exchange rates and market values at the close of the period, the Fund does not isolate that portion of the results of operations arising as a result of changes in the foreign exchange rates from the fluctuations arising from changes in the market prices of securities held at period end. Similarly, the Fund does not isolate the effect of changes in foreign exchange rates from the fluctuations arising from changes in the market prices of securities sold during the period. Accordingly, realized and unrealized foreign currency gains (losses) on investments in securities are included in the reported net realized and unrealized gains (losses) on investment transactions and balances. However, pursuant to U.S. federal income tax regulations, gains and losses from certain foreign currency transactions and the foreign currency portion of gains and losses realized on sales and maturities of foreign denominated debt securities are treated as ordinary income for U.S. federal income tax purposes.
Net realized gains (losses) on foreign currency transactions represent net foreign exchange gains (losses) from foreign currency forward exchange contracts, disposition of foreign currencies, currency gains (losses) realized between the trade and settlement dates on securities transactions, and the difference between the amount of investment income and foreign withholding taxes recorded on the Fund's books and the U.S. dollar equivalent amounts actually received or paid. Net unrealized currency gains (losses) from valuing foreign currency denominated assets and liabilities at period end exchange rates are reflected as a component of unrealized
19
Morgan Stanley Institutional Fund, Inc.
Annual Report — December 31, 2017
Notes to Financial Statements (cont'd)
appreciation (depreciation) in the Statement of Assets and Liabilities. The change in unrealized currency gains (losses) on foreign currency translations for the period is reflected in the Statement of Operations.
Foreign security and currency transactions may involve certain considerations and risks not typically associated with those of U.S. dollar denominated transactions as a result of, among other factors, fluctuations of exchange rates in relation to the U.S. dollar, the possibility of lower levels of governmental supervision and regulation of foreign securities markets and the possibility of political or economic instability.
Governmental approval for foreign investments may be required in advance of making an investment under certain circumstances in some countries, and the extent of foreign investments in domestic companies may be subject to limitation in other countries. Foreign ownership limitations also may be imposed by the charters of individual companies to prevent, among other concerns, violations of foreign investment limitations. As a result, an additional class of shares (identified as "Foreign" in the Portfolio of Investments) may be created and offered for investment. The "local" and "foreign shares" market values may differ. In the absence of trading of the foreign shares in such markets, the Fund values the foreign shares at the closing exchange price of the local shares.
4. Derivatives: The Fund may, but is not required to, use derivative instruments for a variety of purposes, including hedging, risk management, portfolio management or to earn income. Derivatives are financial instruments whose value is based, in part, on the value of an underlying asset, interest rate, index or financial instrument. Prevailing interest rates and volatility levels, among other things, also affect the value of derivative instruments. A derivative instrument often has risks similar to its underlying asset and may have additional risks, including imperfect correlation between the value of the derivative and the underlying asset, risks of default by the counterparty to certain transactions, magnification of losses incurred due to changes in the market value of the securities, instruments, indices or interest rates to which the derivative instrument relates, risks that the transactions may not be liquid and risks arising from margin requirements. The use of derivatives involves risks that are different from, and possibly greater than, the risks associated with other portfolio investments. Derivatives may involve the use of highly
specialized instruments that require investment techniques and risk analyses different from those associated with other portfolio investments. All of the Fund's holdings, including derivative instruments, are marked-to-market each day with the change in value reflected in unrealized appreciation (depreciation). Upon disposition, a realized gain or loss is recognized.
Certain derivative transactions may give rise to a form of leverage. Leverage magnifies the potential for gain and the risk of loss. Leverage associated with derivative transactions may cause the Fund to liquidate portfolio positions when it may not be advantageous to do so to satisfy its obligations or to meet earmarking or segregation requirements, pursuant to applicable Securities and Exchange Commission ("SEC") rules and regulations, or may cause the Fund to be more volatile than if the Fund had not been leveraged. Although the Adviser seeks to use derivatives to further the Fund's investment objectives, there is no assurance that the use of derivatives will achieve this result.
Following is a description of the derivative instruments and techniques that the Fund used during the period and their associated risks:
Options: With respect to options, the Fund is subject to equity risk, interest rate risk and foreign currency exchange risk in the normal course of pursuing its investment objectives. If the Fund buys an option, it buys a legal contract giving it the right to buy or sell a specific amount of the underlying instrument or foreign currency, or futures contract on the underlying instrument or foreign currency, at an agreed-upon price during a period of time or on a specified date typically in exchange for a premium paid by the Fund. The Fund may purchase and/or sell put and call options. Purchasing call options tends to increase the Fund's exposure to the underlying (or similar) instrument. Purchasing put options tends to decrease the Fund's exposure to the underlying (or similar) instrument. When entering into purchased option contracts, the Fund bears the risk of interest or exchange rates or securities prices moving unexpectedly, in which case, the Fund may not achieve the anticipated benefits of the purchased option contracts; however the risk of loss is limited to the premium paid. Purchased options are reported as part of "Total Investments in Securities" in the Statement of Assets and Liabilities. Premium paid for purchasing options which expired are treated as
20
Morgan Stanley Institutional Fund, Inc.
Annual Report — December 31, 2017
Notes to Financial Statements (cont'd)
realized losses. If the Fund sells an option, it sells to another party the right to buy from or sell to the Fund a specific amount of the underlying instrument or foreign currency, or futures contract on the underlying instrument or foreign currency, at an agreed-upon price during a period of time or on a specified date typically in exchange for a premium received by the Fund. When options are purchased OTC, the Fund bears the risk that the counterparty that wrote the option will be unable or unwilling to perform its obligations under the option contract. Options may also be illiquid and the Fund may have difficulty closing out its position. A decision as to whether, when and how to use options involves the exercise of skill and judgment and even a well-conceived option transaction may be unsuccessful because of market behavior or unexpected events. The prices of options can be highly volatile and the use of options can lower total returns.
FASB ASC 815, "Derivatives and Hedging" ("ASC 815"), is intended to improve financial reporting about derivative instruments by requiring enhanced disclosures to enable investors to better understand how and why the Fund uses derivative instruments, how these derivative instruments are accounted for and their effects on the Fund's financial position and results of operations.
The following table sets forth the fair value of the Fund's derivative contracts by primary risk exposure as of December 31, 2017.
| | | Asset Derivatives
Statement of Assets and
Liabilities Location | | Primary Risk
Exposure | | Value
(000) | |
Options Purchased
| | Investments, at Value
(Options Purchased) | | Currency Risk | | $ | 75 | (a) | |
(a) Amounts are included in Investments in Securities in the Statement of Assets and Liabilities.
The following tables set forth by primary risk exposure the Fund's realized gains (losses) and change in unrealized appreciation (depreciation) by type of derivative contract for the year ended December 31, 2017 in accordance with ASC 815.
Realized Gain (Loss) | |
Primary Risk Exposure | | Derivative Type | | Value
(000) | |
Currency Risk
| | Investments
(Option Purchased) | | $ | (13 | )(b) | |
(b) Amounts are included in Investments Sold in the Statement of Operations.
Change in Unrealized Appreciation (Depreciation) | |
Primary Risk Exposure | | Derivative Type | | Value
(000) | |
Currency Risk
| | Investments
(Options Purchased) | | $ | (376 | )(c) | |
(c) Amounts are included in Investments in the Statement of Operations.
At December 31, 2017, the Fund's derivative assets and liabilities are as follows:
Gross Amounts of Assets and Liabilities
Presented in the Statement of Assets and Liabilities | |
Derivatives | | Assets(d)
(000) | | Liabilities(d)
(000) | |
Options Purchased | | $ | 75 | (a) | | $ | — | | |
(a) Amounts are included in Investments in Securities in the Statement of Assets and Liabilities.
(d) Absent an event of default or early termination, OTC derivative assets and liabilities are presented gross and not offset in the Statement of Assets and Liabilities.
The Fund typically enters into International Swaps and Derivatives Association, Inc. Master Agreements ("ISDA Master Agreements") or similar master agreements (collectively, "Master Agreements") with its contract counterparties for certain OTC derivatives in order to, among other things, reduce its credit risk to counterparties. ISDA Master Agreements include provisions for general obligations, representations, collateral and events of default or termination. Under an ISDA Master Agreement, the Fund typically may offset with the counterparty certain OTC derivative financial instruments' payables and/or receivables with collateral held and/or posted and create one single net payment (close-out netting) in the event of default, termination and/or potential deterioration in the credit quality of the counterparty. Various Master Agreements govern the terms of certain transactions with counterparties, including transactions such as swap, forward, repurchase and reverse repurchase agreements. These Master Agreements typically attempt to reduce the counterparty risk associated with such transactions by specifying credit protection mechanisms and providing standardization that improves legal certainty. Cross-termination provisions under Master Agreements typically provide that a default in connection with one transaction between the Fund and a counterparty gives the non-defaulting party the right to terminate any other transactions in place with the defaulting party to create one single net payment due to/due from the defaulting party and may be a feature in certain Master Agreements. In the event the Fund exercises its right to terminate a Master Agreement after a counterparty experiences a termination event as defined in the Master
21
Morgan Stanley Institutional Fund, Inc.
Annual Report — December 31, 2017
Notes to Financial Statements (cont'd)
Agreement, the return of collateral with market value in excess of the Fund's net liability may be delayed or denied.
The following table presents derivative financial instruments that are subject to enforceable netting arrangements as of December 31, 2017.
Gross Amounts Not Offset in the Statement of Assets and Liabilities | |
Counterparty | | Gross Asset
Derivatives
Presented in
Statement of
Assets and
Liabilities
(000) | | Financial
Instrument
(000) | | Collateral
Received(e)
(000) | | Net Amount
(not less
than $0)
(000) | |
Royal Bank of Scotland | | $ | 75 | (a) | | $ | — | | | $ | (75 | ) | | $ | — | | |
(a) Amounts are included in Investments in Securities in the Statement of Assets and Liabilities.
(e) In some instances, the actual collateral received may be more than the amount shown here due to overcollateralization.
For the year ended December 31, 2017, the approximate average monthly amount outstanding for each derivative type is as follows:
Options Purchased: | |
Average monthly notional amount | | | 26,500,000 | | |
5. Securities Lending: The Fund lends securities to qualified financial institutions, such as broker-dealers, to earn additional income. Any increase or decrease in the fair value of the securities loaned that might occur and any interest earned or dividends declared on those securities during the term of the loan would remain in the Fund. The Fund would receive cash or securities as collateral in an amount equal to or exceeding 100% of the current fair value of the loaned securities. The collateral is marked-to-market daily by State Street Bank and Trust Company ("State Street"), the securities lending agent, to ensure that a minimum of 100% collateral coverage is maintained.
Based on pre-established guidelines, the securities lending agent invests any cash collateral that is received in an affiliated money market portfolio and repurchase agreements. Securities lending income is generated from the earnings on the invested collateral and borrowing fees, less any rebates owed to the borrowers and compensation to the lending agent, and is recorded as "Income from Securities Loaned — Net" in the Fund's Statement of Operations. Risks in securities lending transactions are that a borrower may not provide additional collateral when required or return the securities when due, and that the value of the short-term investments will be less
than the amount of cash collateral plus any rebate that is required to be returned to the borrower.
The Fund has the right under the securities lending agreement to recover the securities from the borrower on demand.
At December 31, 2017, the Fund did not have any outstanding securities on loan.
6. Redemption Fees: The Fund will assess a 2% redemption fee on Class I shares, Class A shares, Class L shares and Class C shares, which is paid directly to the Fund, for shares redeemed or exchanged within thirty days of purchase, subject to certain exceptions. The redemption fee is designed to protect the Fund and its remaining shareholders from the effects of short-term trading. These fees, if any, are included in the Statements of Changes in Net Assets.
7. Indemnifications: The Company enters into contracts that contain a variety of indemnifications. The Company's maximum exposure under these arrangements is unknown. However, the Company has not had prior claims or losses pursuant to these contracts and expects the risk of loss to be remote.
8. Dividends and Distributions to Shareholders: Dividends and distributions to shareholders are recorded on the ex-dividend date. Dividends from net investment income, if any, are declared and paid annually. Net realized capital gains, if any, are distributed at least annually.
9. Security Transactions, Income and Expenses: Security transactions are accounted for on the trade date (date the order to buy or sell is executed). Realized gains and losses on the sale of investment securities are determined on the specific identified cost method. Dividend income and other distributions are recorded on the ex-dividend date (except for certain foreign dividends which may be recorded as soon as the Fund is informed of such dividends) net of applicable withholding taxes. Interest income is recognized on the accrual basis except where collection is in doubt. Discounts are accreted and premiums are amortized over the life of the respective securities. Most expenses of the Company can be directly attributed to a particular Fund. Expenses which cannot be directly attributed are apportioned among the Funds based upon relative net assets or other appropriate methods. Income, expenses (other than class specific expenses — distribution and shareholder services, transfer agency and sub transfer agency fees) and realized
22
Morgan Stanley Institutional Fund, Inc.
Annual Report — December 31, 2017
Notes to Financial Statements (cont'd)
and unrealized gains or losses are allocated to each class of shares based upon their relative net assets.
B. Advisory Fees: The Adviser, a wholly-owned subsidiary of Morgan Stanley, provides the Fund with advisory services under the terms of an Investment Advisory Agreement, paid quarterly, at the annual rate based on the daily net assets as follows:
First $1
billion | | Over $1
billion | |
| | 0.80 | % | | | 0.75 | % | |
For the year ended December 31, 2017, the advisory fee rate (net of waiver/rebate) was equivalent to an annual effective rate of 0.69% of the Fund's average daily net assets.
The Adviser has agreed to reduce its advisory fee and/or reimburse the Fund so that total annual fund operating expenses, excluding certain investment related expenses, taxes, interest and other extraordinary expenses (including litigation), will not exceed 1.00% for Class I shares, 1.35% for Class A shares, 1.85% for Class L shares and 2.10% for Class C shares. The fee waivers and/or expense reimbursements will continue for at least one year from the date of the Fund's prospectus or until such time as the Directors act to discontinue all or a portion of such waivers and/or reimbursements when they deem such action is appropriate. For the year ended December 31, 2017, approximately $140,000 of advisory fees were waived and approximately $114,000 of other expenses were reimbursed by the Adviser pursuant to this arrangement.
C. Administration Fees: The Adviser also serves as Administrator to the Company and provides administrative services pursuant to an Administration Agreement for an annual fee, accrued daily and paid monthly, of 0.08% of the Fund's average daily net assets.
Under a Sub-Administration Agreement between the Administrator and State Street, State Street provides certain administrative services to the Company. For such services, the Administrator pays State Street a portion of the fee the Administrator receives from the Fund.
D. Distribution and Shareholder Services Fees: Morgan Stanley Distribution, Inc. ("MSDI" or the "Distributor"), a wholly-owned subsidiary of the Adviser and an indirect subsidiary of Morgan Stanley, serves as the Company's Distributor of Fund shares pursuant to a Distribution Agreement. The Company has adopted a Shareholder Services Plan with respect to Class A shares pursuant to Rule 12b-1 under the Act. Under the Shareholder Services Plan, the Fund pays the
Distributor a shareholder services fee, accrued daily and paid monthly, at an annual rate of 0.25% of the Fund's average daily net assets attributable to Class A shares.
The Company has adopted a Distribution and Shareholder Services Plan with respect to Class L shares pursuant to Rule 12b-1 under the Act. Under the Distribution and Shareholder Services Plan, the Fund pays the Distributor a distribution fee, accrued daily and paid monthly, at an annual rate of 0.50% and a shareholder services fee, accrued daily and paid monthly, at an annual rate of 0.25% of the Fund's average daily net assets attributable to Class L shares.
The Company has adopted a Distribution and Shareholder Services Plan with respect to Class C shares pursuant to Rule 12b-1 under the Act. Under the Distribution and Shareholder Services Plan, the Fund pays the Distributor a distribution fee, accrued daily and paid monthly, at an annual rate of 0.75% and a shareholder services fee, accrued daily and paid monthly, at an annual rate of 0.25% of the Fund's average daily net assets attributable to Class C shares.
The distribution and shareholder services fees are used to support the expenses associated with servicing and maintaining accounts. The Distributor may compensate other parties for providing shareholder support services to investors who purchase Class A, Class L and Class C shares.
E. Dividend Disbursing and Transfer Agent: The Company's dividend disbursing and transfer agent is Boston Financial Data Services, Inc. ("BFDS"). Pursuant to a Transfer Agency Agreement, the Company pays BFDS a fee based on the number of classes, accounts and transactions relating to the Funds of the Company. Effective January 1, 2018, BFDS changed its name to DST Asset Manager Solutions, Inc.
F. Custodian Fees: State Street (the "Custodian") also serves as Custodian for the Company in accordance with a Custodian Agreement. The Custodian holds cash, securities, and other assets of the Company as required by the Act. Custody fees are payable monthly based on assets held in custody, investment purchases and sales activity and account maintenance fees, plus reimbursement for certain out-of-pocket expenses.
G. Security Transactions and Transactions with Affiliates: For the year ended December 31, 2017, purchases and sales of investment securities for the Fund, other than long-term U.S. Government securities and short-term investments, were approximately $250,094,000 and $43,178,000, respectively. There were no purchases and sales of long-term U.S. Government securities for the year ended December 31, 2017.
23
Morgan Stanley Institutional Fund, Inc.
Annual Report — December 31, 2017
Notes to Financial Statements (cont'd)
The Fund invests in the Institutional Class of the Morgan Stanley Institutional Liquidity Funds — Treasury Securities Portfolio (the "Liquidity Funds"), an open-end management investment company managed by the Adviser, both directly and as a portion of the securities held as collateral on loaned securities. Advisory fees paid by the Fund are reduced by an amount equal to its pro-rata share of the advisory and administration fees paid by the Fund due to its investment in the Liquidity Funds. For the year ended December 31, 2017, advisory fees paid were reduced by approximately $24,000 relating to the Fund's investment in the Liquidity Funds.
A summary of the Fund's transactions in shares of the Liquidity Funds during the year ended December 31, 2017 is as follows:
Affiliated
Investment Company | | Value
December 31,
2016
(000) | | Purchases
at Cost
(000) | | Proceeds
from Sales
(000) | | Dividend
Income
(000) | |
Liquidity Funds | | $ | 1,586 | | | $ | 172,478 | | | $ | 147,303 | | | $ | 112 | | |
Affiliated
Investment Company (cont'd) | | Realized
Gain (Loss)
(000) | | Change in
Unrealized
Appreciation
(Depreciation)
(000) | | Value
December 31,
2017
(000) | |
Liquidity Funds | | $ | — | | | $ | — | | | $ | 26,761 | | |
The Fund is permitted to purchase and sell securities ("cross-trade") from and to other Morgan Stanley Funds as well as other funds and client accounts for which the Adviser or an affiliate of the Adviser serves as investment adviser, pursuant to procedures approved by the Directors in compliance with Rule 17a-7 under the Act (the "Rule"). Each cross-trade is executed at the current market price in compliance with provisions of the Rule. For the year ended December 31, 2017, the Fund did not engage in any cross-trade transactions.
The Fund has an unfunded Deferred Compensation Plan (the "Compensation Plan"), which allows each independent Director to defer payment of all, or a portion, of the fees he or she receives for serving on the Board of Directors. Each eligible Director generally may elect to have the deferred amounts credited with a return equal to the total return on one or more of the Morgan Stanley funds that are offered as investment options under the Compensation Plan. Appreciation/depreciation and distributions received from these investments are recorded with an offsetting increase/decrease in the deferred compensation obligation and do not affect the NAV of the Fund.
H. Federal Income Taxes: It is the Fund's intention to continue to qualify as a regulated investment company and distribute all of its taxable and tax-exempt income. Accordingly, no provision for federal income taxes is required in the financial statements.
The Fund may be subject to taxes imposed by countries in which it invests. Such taxes are generally based on income and/or capital gains earned or repatriated. Taxes are accrued based on net investment income, net realized gains and net unrealized appreciation as such income and/or gains are earned. Taxes may also be based on transactions in foreign currency and are accrued based on the value of investments denominated in such currency.
FASB ASC 740-10, "Income Taxes — Overall", sets forth a minimum threshold for financial statement recognition of the benefit of a tax position taken or expected to be taken in a tax return. Management has concluded that there are no significant uncertain tax positions that would require recognition in the financial statements. If applicable, the Fund recognizes interest accrued related to unrecognized tax benefits in "Interest Expense" and penalties in "Other Expenses" in the Statement of Operations. The Fund files tax returns with the U.S. Internal Revenue Service, New York and various states. Each of the tax years in the four-year period ended December 31, 2017, remains subject to examination by taxing authorities.
The tax character of distributions paid may differ from the character of distributions shown in the Statements of Changes in Net Assets due to short-term capital gains being treated as ordinary income for tax purposes. The tax character of distributions paid during fiscal years 2017 and 2016 was as follows:
2017
Distributions
Paid From: | | 2016
Distributions
Paid From: | |
Ordinary
Income
(000) | | Long-Term
Capital Gain
(000) | | Ordinary
Income
(000) | | Long-Term
Capital Gain
(000) | |
| $ | 2,814 | | | $ | 3,157 | | | $ | 326 | | | $ | 146 | | |
The amount and character of income and gains to be distributed are determined in accordance with income tax regulations which may differ from GAAP. These book/tax differences are either considered temporary or permanent in nature.
Temporary differences are primarily due to differing book and tax treatments for the timing of the recognition of gains (losses) on certain investment transactions and the timing of the deductibility of certain expenses.
24
Morgan Stanley Institutional Fund, Inc.
Annual Report — December 31, 2017
Notes to Financial Statements (cont'd)
Permanent differences, primarily due to differing treatments of gains (losses) related to foreign currency transactions, a net operating loss and distribution redesignations, resulted in the following reclassifications among the components of net assets at December 31, 2017:
Accumulated
Net Investment
Loss
(000) | | Accumulated
Net Realized
Gain
(000) | | Paid-in-
Capital
(000) | |
| $ | 280 | | | $ | (280 | ) | | $ | — | | |
At December 31, 2017, the components of distributable earnings for the Fund on a tax basis were as follows:
Undistributed
Ordinary
Income
(000) | | Undistributed
Long-Term
Capital Gain
(000) | |
| $ | 94 | | | $ | 205 | | |
I. Credit Facility: The Company and other Morgan Stanley funds participated in a $150,000,000 committed, unsecured revolving line of credit facility (the "Facility") with State Street. This Facility is to be used for temporary emergency purposes or funding of shareholder redemption requests. The interest rate on borrowings is based on the federal funds rate or 1 month LIBOR rate plus a spread. The Facility also has a commitment fee of 0.25% per annum based on the unused portion of the Facility. During the year ended December 31, 2017, the Fund did not have any borrowings under the Facility.
J. Other: At December 31, 2017, the Fund had record owners of 10% or greater. Investment activities of these shareholders could have a material impact on the Fund. The aggregate percentage of such owners was 36.6%.
25
Morgan Stanley Institutional Fund, Inc.
Annual Report — December 31, 2017
Report of Independent Registered Public Accounting Firm
To the Shareholders and Board of Directors of
Morgan Stanley Institutional Fund, Inc. —
International Advantage Portfolio
Opinion on the Financial Statements
We have audited the accompanying statement of assets and liabilities of International Advantage Portfolio (the "Fund") (one of the funds constituting the Morgan Stanley Institutional Fund, Inc. (the "Company")), including the portfolio of investments, as of December 31, 2017, and the related statement of operations for the year then ended, the statements of changes in net assets for each of the two years in the period then ended, the financial highlights for each of the five years in the period then ended and the related notes (collectively referred to as the "financial statements"). In our opinion, the financial statements present fairly, in all material respects, the financial position of International Advantage Portfolio (one of the funds constituting Morgan Stanley Institutional Fund, Inc.) at December 31, 2017, the results of its operations for the year then ended, the changes in its net assets for each of the two years in the period then ended and its financial highlights for each of the five years in the period then ended, in conformity with U.S. generally accepted accounting principles.
Basis for Opinion
These financial statements are the responsibility of the Company's management. Our responsibility is to express an opinion on the Fund's financial statements based on our audits. We are a public accounting firm registered with the Public Company Accounting Oversight Board (United States) ("PCAOB") and are required to be independent with respect to the Company in accordance with the U.S. federal securities law and the applicable rules and regulations of the Securities and Exchange Commission and the PCAOB.
We conducted our audits in accordance with the standards of the PCAOB. Those standards require that we plan and perform the audit to obtain reasonable assurance about whether the financial statements are free of material misstatement, whether due to error or fraud. The Company is not required to have, nor were we engaged to perform, an audit of the Company's internal control over financial reporting. As part of our audits, we are required to obtain an understanding of internal control over financial reporting, but not for the purpose of expressing an opinion on the effectiveness of the Company's internal control over financial reporting. Accordingly, we express no such opinion.
Our audits included performing procedures to assess the risks of material misstatement of the financial statements, whether due to error or fraud, and performing procedures that respond to those risks. Such procedures included examining, on a test basis, evidence regarding the amounts and disclosures in the financial statements. Our procedures included confirmation of securities owned as of December 31, 2017 by correspondence with the custodian and others or by other appropriate auditing procedures where replies from others were not received. Our audits also included evaluating the accounting principles used and significant estimates made by management, as well as evaluating the overall presentation of the financial statements. We believe that our audits provide a reasonable basis for our opinion.

We have served as the auditor of one or more Morgan Stanley investment companies since 2000.
Boston, Massachusetts
February 26, 2018
26
Morgan Stanley Institutional Fund, Inc.
Annual Report — December 31, 2017
Federal Tax Notice (unaudited)
For federal income tax purposes, the following information is furnished with respect to the distributions paid by the Fund during its taxable year ended December 31, 2017.
The Fund designated and paid approximately $3,157,000 as a long-term capital gain distribution.
For federal income tax purposes, the following information is furnished with respect to the Fund's earnings for its taxable year ended December 31, 2017. When distributed, certain earnings may be subject to a maximum tax rate of 15% as provided for the Jobs and Growth Tax Relief Reconciliation Act of 2003. The Fund designated up to a maximum of approximately $1,115,000 as taxable at this lower rate.
The Fund intends to pass through foreign tax credits of approximately $120,000 and has derived net income from sources within foreign countries amounting to approximately $1,471,000.
In January, the Fund provides tax information to shareholders for the preceding calendar year.
27
Morgan Stanley Institutional Fund, Inc.
Annual Report — December 31, 2017
Privacy Notice (unaudited)
MORGAN STANLEY INVESTMENT MANAGEMENT INC.
AN IMPORTANT NOTICE CONCERNING OUR U.S. PRIVACY POLICY
We are required by federal law to provide you with a copy of our privacy policy annually. This policy applies to current and former individual investors in funds managed or sponsored by Morgan Stanley Investment Management Inc. ("MSIM") as well as current and former individual clients of MSIM. This policy is not applicable to partnerships, corporations, trusts or other non-individual clients or investors. Please note that we may amend this policy at any time, and will inform you of any changes as required by law.
WE RESPECT YOUR PRIVACY
We appreciate that you have provided us with your personal financial information. We strive to maintain the privacy of such information while we help you achieve your financial objectives. This Notice describes what non-public personal information we collect about you, why we collect it, when we may share it with others and how certain others may use it. It discusses the steps you may take to limit our sharing of certain information about you to affiliated companies in the Morgan Stanley family of companies ("other Morgan Stanley companies"). It also discloses how you may limit use of certain shared information for marketing purposes by other Morgan Stanley branded companies. Throughout this policy, we refer to the non-public information that personally identifies you or your accounts as "personal information.''
1. WHAT PERSONAL INFORMATION DO WE COLLECT ABOUT YOU?
We obtain personal information from applications and other forms you submit to us, from your dealings with us, from consumer reporting agencies, from our Web sites and from third parties and other sources.
For example:
• We may collect information such as your name, address, e-mail address, telephone/fax numbers, assets, income and investment objectives through subscription documents, applications and other forms you submit to us.
• We may obtain information about account balances, your use of account(s) and the types of products and services you prefer to receive from us through your dealings and transactions with us and other sources.
• We may obtain information about your creditworthiness and credit history from consumer reporting agencies.
• We may collect background information from and through third-party vendors to verify representations you have made and to comply with various regulatory requirements.
• If you interact with us through our public and private Web sites, we may collect information that you provide directly through online communications (such as an e-mail address). We may also collect information about your Internet service provider, your domain name, your computer's operating system and Web browser, your use of our Web sites and your product and service preferences, through the use of "cookies." Please consult the Terms of Use of these sites for more details.
2. WHEN DO WE DISCLOSE PERSONAL INFORMATION WE COLLECT ABOUT YOU?
We may disclose personal information we collect about you to other Morgan Stanley companies and to non-affiliated third parties.
a. Information We Disclose to Other Morgan Stanley Companies.
We may disclose personal information to other Morgan Stanley companies for a variety of reasons, including to manage your account(s) effectively, to service and process your transactions, to let you know about products and services offered by us and other Morgan Stanley companies, to manage our business, and as otherwise required or permitted by law. Offers for products and services from other Morgan Stanley companies are developed under conditions designed to safeguard your personal information.
28
Morgan Stanley Institutional Fund, Inc.
Annual Report — December 31, 2017
Privacy Notice (unaudited) (cont'd)
b. Information We Disclose to Non-affiliated Third Parties.
We do not disclose personal information that we collect about you to non-affiliated third parties except to those who provide marketing services on our behalf, to financial institutions with whom we have joint marketing agreements, and as otherwise required or permitted by law. For example, we may disclose personal information to non-affiliated third parties for servicing and processing transactions, to offer our own products and services, to protect against fraud, for institutional risk control, to respond to judicial process or to perform services on our behalf. When we share personal information with a non-affiliated third party, they are required to limit their use of personal information to the particular purpose for which it was shared and they are not allowed to share personal information with others except to fulfill that limited purpose or as may be permitted or required by law.
3. HOW DO WE PROTECT THE SECURITY AND CONFIDENTIALITY OF PERSONAL INFORMATION WE COLLECT ABOUT YOU?
We maintain physical, electronic and procedural security measures to help safeguard the personal information we collect about you. We have internal policies governing the proper handling of client information. Third parties that provide support or marketing services on our behalf may also receive personal information, and we require them to adhere to confidentiality standards with respect to such information.
4. HOW CAN YOU LIMIT THE SHARING OF CERTAIN TYPES OF PERSONAL INFORMATION WITH OTHER MORGAN STANLEY COMPANIES?
We offer you choices as to whether we share with other Morgan Stanley companies the personal information that was collected to determine your eligibility for products and services you request ("eligibility information"). Eligibility information does not include your identification information or personal information pertaining to our transactions or experiences with you. Please note that, even if you direct us not to share eligibility information with other Morgan Stanley companies ("opt-out"), we may still share personal information, including eligibility information, with those companies in circumstances excluded from the opt-out under applicable law, such as to process transactions or to service your account.
5. HOW CAN YOU LIMIT THE USE OF CERTAIN TYPES OF PERSONAL INFORMATION BY OTHER MORGAN STANLEY COMPANIES FOR MARKETING?
By following the opt-out instructions in Section 6 below, you may limit other Morgan Stanley branded companies from marketing their products or services to you based on personal information we disclose to them. This information may include, for example, your income and account history with us. Please note that, even if you choose to limit Other Morgan Stanley Companies from using personal information about you that we may share with them for marketing their products and services to you, Other Morgan Stanley Companies may use your personal information that they obtain from us to market to you in circumstances permitted by law, such as if the Other Morgan Stanley Company has its own relationship with you.
6. HOW CAN YOU SEND US AN OPT-OUT INSTRUCTION?
If you wish to limit our sharing of eligibility information about you with other Morgan Stanley companies or other Morgan Stanley companies' use of personal information for marketing purposes, as described in this notice, you may do so by:
• Calling us at (800) 548-7786
Monday–Friday between 8a.m. and 6p.m.(EST)
• Writing to us at the following address:
DST Asset Manager Solutions, Inc.
c/o Privacy Coordinator
P.O. Box 219804
Kansas City, Missouri 64121
29
Morgan Stanley Institutional Fund, Inc.
Annual Report — December 31, 2017
Privacy Notice (unaudited) (cont'd)
Your written request should include your name, address, telephone number and account number(s) to which the opt-out applies and whether you are opting out with respect to sharing of eligibility information (Section 4 above), or if information used for Marketing (Section 5 above) or both. Written opt-out requests should not be sent with any other correspondence. In order to process your request, we require that the request be provided by you directly and not through a third party.
Your opt-out preference will remain in effect with respect to this policy (as it may be amended) until you notify us otherwise. If you have a joint account, your direction for us not to share this information with other Morgan Stanley companies and for those other Morgan Stanley companies not to use your personal information for marketing will be applied to all account holders on that account. Please understand that if you limit our sharing or our affiliated companies' use of personal information, you and any joint account holder(s) may not receive information about Morgan Stanley products and services, including products or services that could help you manage your financial resources and achieve your investment objectives.
7. WHAT IF AN AFFILIATED COMPANY BECOMES A NON-AFFILIATED THIRD PARTY?
If, at any time in the future, an affiliated company becomes a non-affiliated third party, further disclosures of personal information made to the former affiliated company will be limited to those described in Section 2(b) above relating to non-affiliated third parties. If you elected under Section 6 to limit disclosures we make to affiliated companies, or use of personal information by affiliated companies, your election will not apply to use by any former affiliated company of your personal information in their possession once it becomes a non-affiliated third party.
SPECIAL NOTICE TO RESIDENTS OF VERMONT
The following section supplements our policy with respect to our individual clients who have a Vermont address and supersedes anything to the contrary in the above policy with respect to those clients only.
The state of Vermont requires financial institutions to obtain your consent prior to sharing personal information that they collect about you with affiliated companies and non-affiliated third parties other than in certain limited circumstances. Except as permitted by law, we will not share personal information we collect about you with non-affiliated third parties or other Morgan Stanley companies unless you provide us with your written consent to share such information ("opt-in").
If you wish to receive offers for investment products and services offered by or through other Morgan Stanley companies, please notify us in writing at the following address:
DST Asset Manager Solutions, Inc.
c/o Privacy Coordinator
P.O. Box 219804
Kansas City, Missouri 64121
Your authorization should include your name, address, telephone number and account number(s) to which the opt-in applies and should not be sent with any other correspondence. In order to process your authorization, we require that the authorization be provided by you directly and not through a third party.
SPECIAL NOTICE TO RESIDENTS OF CALIFORNIA
The following section supplements our policy with respect to our individual clients who have a California address and supersedes anything to the contrary in the above policy with respect to those clients only.
In response to a California law, if your account has a California home address, your personal information will not be disclosed to non-affiliated third parties except as permitted by applicable California law, and we will limit sharing such information with our affiliates to comply with California privacy laws that apply to us.
30
Morgan Stanley Institutional Fund, Inc.
Annual Report — December 31, 2017
Director and Officer Information (unaudited)
Independent Directors:
Name, Age and Address of
Independent Director | | Position(s)
Held with
Registrant | | Length of Time
Served* | | Principal Occupation(s) During Past 5 Years
and Other Relevant Professional Experience | | Number of
Portfolios in
Fund Complex
Overseen by
Independent
Director** | | Other Directorships
Held by Independent
Director*** | |
Frank L. Bowman (73)
c/o Perkins Coie LLP
Counsel to the Independent
Directors
30 Rockefeller Plaza
New York, NY 10112 | | Director | | Since
August
2006 | | President, Strategic Decisions, LLC (consulting) (since February 2009); Director or Trustee of various Morgan Stanley Funds (since August 2006); Chairperson of the Compliance and Insurance Committee (since October 2015); formerly, Chairperson of the Insurance Sub-Committee of the Compliance and Insurance Committee (2007-2015); served as President and Chief Executive Officer of the Nuclear Energy Institute (policy organization) (February 2005-November 2008); retired as Admiral, U.S. Navy after serving over 38 years on active duty including 8 years as Director of the Naval Nuclear Propulsion Program in the Department of the Navy and the U.S. Department of Energy (1996-2004); served as Chief of Naval Personnel (July 1994-September 1996) and on the Joint Staff as Director of Political Military Affairs (June 1992-July 1994); knighted as Honorary Knight Commander of the Most Excellent Order of the British Empire; awarded the Officier de l'Orde National du Mérite by the French Government; elected to the National Academy of Engineering (2009). | | | 88 | | | Director of BP p.l.c.; Director of Naval and Nuclear Technologies LLP; Director Emeritus of the Armed Services YMCA; Director of the U.S. Naval Submarine League; Member of the National Security Advisory Council of the Center for U.S. Global Engagement and a member of the CNA Military Advisory Board; Trustee of Fairhaven United Methodist Church; and Director of other various non-profit organizations. | |
Kathleen A. Dennis (64)
c/o Perkins Coie LLP
Counsel to the Independent Directors
30 Rockefeller Plaza
New York, NY 10112 | | Director | | Since
August
2006 | | President, Cedarwood Associates (mutual fund and investment management consulting) (since July 2006); Chairperson of the Liquidity and Alternatives Sub-Committee of the Investment Committee (since October 2006) and Director or Trustee of various Morgan Stanley Funds (since August 2006); formerly, Senior Managing Director of Victory Capital Management (1993-2006). | | | 89 | | | Director of various non-profit organizations. | |
Nancy C. Everett (62)
c/o Perkins Coie LLP
Counsel to the Independent Directors
30 Rockefeller Plaza
New York, NY 10112 | | Director | | Since
January
2015 | | Chief Executive Officer, Virginia Commonwealth University Investment Company (since November 2015); Owner, OBIR, LLC (institutional investment management consulting) (since June 2014); formerly, Managing Director, BlackRock Inc. (February 2011-December 2013); and Chief Executive Officer, General Motors Asset Management (a/k/a Promark Global Advisors, Inc.) (June 2005-May 2010). | | | 90 | | | Formerly, Member of Virginia Commonwealth University School of Business Foundation (2005-2016); Member of Virginia Commonwealth University Board of Visitors (2013-2015); Member of Committee on Directors for Emerging Markets Growth Fund, Inc. (2007-2010); Chairperson of Performance Equity Management, LLC (2006-2010); and Chairperson, GMAM Absolute Return Strategies Fund, LLC (2006-2010). | |
31
Morgan Stanley Institutional Fund, Inc.
Annual Report — December 31, 2017
Director and Officer Information (unaudited) (cont'd)
Independent Directors: (cont'd)
Name, Age and Address of
Independent Director | | Position(s)
Held with
Registrant | | Length of Time
Served* | | Principal Occupation(s) During Past 5 Years
and Other Relevant Professional Experience | | Number of
Portfolios in
Fund Complex
Overseen by
Independent
Director** | | Other Directorships
Held by Independent
Director*** | |
Jakki L. Haussler (60)
c/o Perkins Coie LLP
Counsel to the Independent Directors
30 Rockefeller Plaza
New York, NY 10112 | | Director | | Since
January
2015 | | Chairman and Chief Executive Officer, Opus Capital Group (since January 1996); formerly, Director, Capvest Venture Fund, LP (May 2000-December 2011); Partner, Adena Ventures, LP (July 1999-December 2010); Director, The Victory Funds (February 2005-July 2008). | | | 90 | | | Director of Cincinnati Bell Inc. and Member, Audit Committee and Compensation Committee; Director of Northern Kentucky University Foundation and Member, Investment Committee; Member of Chase College of Law Transactional Law Practice Center Board of Advisors; Director of Best Transport; Director of Chase College of Law Board of Visitors; formerly, Member, University of Cincinnati Foundation Investment Committee; Member, Miami University Board of Visitors (2008-2011); Trustee of Victory Funds (2005-2008) and Chairman, Investment Committee (2007-2008) and Member, Service Provider Committee (2005-2008). | |
Dr. Manuel H. Johnson (68)
c/o Johnson Smick
International, Inc.
220 I Street, NE — Suite 200
Washington, D.C. 20002 | | Director | | Since
July
1991 | | Senior Partner, Johnson Smick International, Inc. (consulting firm); Chairperson of the Investment Committee (since October 2006) and Director or Trustee of various Morgan Stanley Funds (since July 1991); Co-Chairman and a founder of the Group of Seven Council (G7C) (international economic commission); formerly, Chairperson of the Audit Committee (July 1991-September 2006), Vice Chairman of the Board of Governors of the Federal Reserve System and Assistant Secretary of the U.S. Treasury. | | | 88 | | | Director of NVR, Inc. (home construction). | |
Joseph J. Kearns (75)
c/o Kearns & Associates LLC
46 E Peninsula Center #385
Rolling Hills Estates, CA
90274-3712 | | Director | | Since
August
1994 | | Senior Adviser, Kearns & Associates LLC (investment consulting); Chairperson of the Audit Committee (since October 2006) and Director or Trustee of various Morgan Stanley Funds (since August 1994); formerly, Deputy Chairperson of the Audit Committee (July 2003-September 2006) and Chairperson of the Audit Committee of various Morgan Stanley Funds (since August 1994); CFO of the J. Paul Getty Trust. | | | 89 | | | Prior to August 10, 2016, Director of Electro Rent Corporation (equipment leasing); Prior to December 31, 2013, Director of The Ford Family Foundation. | |
32
Morgan Stanley Institutional Fund, Inc.
Annual Report — December 31, 2017
Director and Officer Information (unaudited) (cont'd)
Independent Directors: (cont'd)
Name, Age and Address of
Independent Director | | Position(s)
Held with
Registrant | | Length of Time
Served* | | Principal Occupation(s) During Past 5 Years
and Other Relevant Professional Experience | | Number of
Portfolios in
Fund Complex
Overseen by
Independent
Director** | | Other Directorships
Held by Independent
Director*** | |
Michael F. Klein (59)
c/o Perkins Coie LLP
Counsel to the Independent Directors
30 Rockefeller Plaza
New York, NY 10112 | | Director | | Since
August
2006 | | Managing Director, Aetos Capital, LLC (since March 2000); Co-President, Aetos Alternatives Management, LLC (since January 2004) and Co-Chief Executive Officer of Aetos Capital LLC (since August 2013); Chairperson of the Fixed Income Sub-Committee of the Investment Committee (since October 2006) and Director or Trustee of various Morgan Stanley Funds (since August 2006); formerly, Managing Director, Morgan Stanley & Co. Inc. and Morgan Stanley Dean Witter Investment Management, President, various Morgan Stanley Funds (June 1998-March 2000) and Principal, Morgan Stanley & Co. Inc. and Morgan Stanley Dean Witter Investment Management (August 1997-December 1999). | | | 88 | | | Director of certain investment funds managed or sponsored by Aetos Capital, LLC; Director of Sanitized AG and Sanitized Marketing AG (specialty chemicals). | |
Patricia Maleski (57)
c/o Perkins Coie LLP
Counsel to the Independent Directors
30 Rockefeller Plaza
New York, NY 10112 | | Director | | Since
January
2017 | | Managing Director, JPMorgan Asset Management (2004-2016); Oversight and Control Head of Fiduciary and Conflicts of Interest Program (2015-2016); Chief Control Officer-Global Asset Management (2013-2015); President, JPMorgan Funds (2010-2013); Chief Administrative Officer (2004-2013); various other positions including Treasurer and Board Liaison (since 2001). | | | 90 | | | None. | |
Michael E. Nugent (81)
522 Fifth Avenue
New York, NY 10036 | | Chair of the Board and Director | | Chair of the Boards since July 2006 and Director since July 1991 | | Chair of the Boards of various Morgan Stanley Funds (since July 2006); Chairperson of the Closed-End Fund Committee (since June 2012) and Director or Trustee of various Morgan Stanley Funds (since July 1991); formerly, Chairperson of the Insurance Committee (until July 2006); General Partner, Triumph Capital, L.P. (private investment partnership) (1988-2013). | | | 88 | | | None. | |
W. Allen Reed (70)
c/o Perkins Coie LLP
Counsel to the Independent Directors
30 Rockefeller Plaza
New York, NY 10112 | | Director | | Since
August
2006 | | Chairperson of the Equity Sub-Committee of the Investment Committee (since October 2006) and Director or Trustee of various Morgan Stanley Funds (since August 2006); formerly, President and CEO of General Motors Asset Management; Chairman and Chief Executive Officer of the GM Trust Bank and Corporate Vice President of General Motors Corporation (August 1994-December 2005). | | | 89 | | | Director of Legg Mason, Inc.; formerly, Director of the Auburn University Foundation (2010-2015). | |
Fergus Reid (85)
c/o Joe Pietryka, Inc.
85 Charles Colman Blvd.
Pawling, NY 12564 | | Director | | Since
June
1992 | | Chairman, Joe Pietryka, Inc.; Chairperson of the Governance Committee and Director or Trustee of various Morgan Stanley Funds (since June 1992). | | | 89 | | | Formerly, Trustee and Director of certain investment companies in the JP Morgan Fund Complex managed by JP Morgan Investment Management Inc. (1987-2012). | |
* This is the earliest date the Director began serving the Morgan Stanley Funds. Each Director serves an indefinite term, until his or her successor is elected.
** The Fund Complex includes (as of December 31, 2017) all open-end and closed-end funds (including all of their portfolios) advised by Morgan Stanley Investment Management Inc. (the "Adviser") and any funds that have an adviser that is an affiliated person of the Adviser (including, but not limited to, Morgan Stanley AIP GP LP).
*** This includes any directorships at public companies and registered investment companies held by the Director at any time during the past five years.
33
Morgan Stanley Institutional Fund, Inc.
Annual Report — December 31, 2017
Director and Officer Information (unaudited) (cont'd)
Executive Officers:
Name, Age and Address of Executive Officer | | Position(s) Held
with
Registrant | | Length of Time
Served* | | Principal Occupation(s) During Past 5 Years | |
John H. Gernon (54)
522 Fifth Avenue
New York, NY 10036 | | President and Principal Executive Officer | | Since
September
2013 | | President and Principal Executive Officer of the Equity and Fixed Income Funds and the Morgan Stanley AIP Funds (since September 2013) and the Liquidity Funds and various money market funds (since May 2014) in the Fund Complex; Managing Director of the Adviser; Head of Product (since 2006). | |
Timothy J. Knierim (58)
522 Fifth Avenue
New York, NY 10036 | | Chief Compliance Officer | | Since
December
2016 | | Managing Director of the Adviser and various entities affiliated with the Adviser; Chief Compliance Officer of various Morgan Stanley Funds and the Adviser (since December 2016) and Chief Compliance Officer of Morgan Stanley AIP GP LP (since 2014). Formerly, Managing Director and Deputy Chief Compliance Officer of the Adviser (2014-2016); and formerly, Chief Compliance Officer of Prudential Investment Management, Inc. (2007-2014). | |
Francis J. Smith (52)
522 Fifth Avenue
New York, NY 10036 | | Treasurer and Principal Financial Officer | | Treasurer since July 2003 and Principal Financial Officer since September 2002 | | Managing Director of the Adviser and various entities affiliated with the Adviser; Treasurer (since July 2003) and Principal Financial Officer of various Morgan Stanley Funds (since September 2002). | |
Mary E. Mullin (50)
522 Fifth Avenue
New York, NY 10036 | | Secretary | | Since
June
1999 | | Managing Director of the Adviser; Secretary of various Morgan Stanley Funds (since June 1999). | |
Michael J. Key (38)
522 Fifth Avenue
New York, NY 10036 | | Vice President | | Since
June
2017 | | Vice President of the Equity and Fixed Income Funds, Liquidity Funds, various money market funds and the Morgan Stanley AIP Funds in the Fund Complex (since June 2017); Executive Director of the Adviser; Head of Product Development for Equity and Fixed Income Funds (since August 2013). | |
* This is the earliest date the officer began serving the Morgan Stanley Funds. Each officer serves a one-year term, until his or her successor is elected and qualifies.
34
Morgan Stanley Institutional Fund, Inc.
Annual Report — December 31, 2017
Adviser and Administrator
Morgan Stanley Investment Management Inc.
522 Fifth Avenue
New York, New York 10036
Distributor
Morgan Stanley Distribution, Inc.
522 Fifth Avenue
New York, New York 10036
Dividend Disbursing and Transfer Agent
DST Asset Manager Solutions, Inc.
2000 Crown Colony Drive
Quincy, Massachusetts 02169
Custodian
State Street Bank and Trust Company
One Lincoln Street
Boston, Massachusetts 02111
Legal Counsel
Dechert LLP
1095 Avenue of the Americas
New York, New York 10036
Counsel to the Independent Directors
Perkins Coie LLP
30 Rockefeller Plaza
New York, New York 10112
Independent Registered Public Accounting Firm
Ernst & Young LLP
200 Clarendon Street
Boston, Massachusetts 02116
Reporting to Shareholders
Each Morgan Stanley Fund provides a complete schedule of portfolio holdings in its semi-annual and annual reports within 60 days of the end of the fund's second and fourth fiscal quarters. The semi-annual and annual reports are filed electronically with the Securities and Exchange Commission (SEC) on Form N-CSRS and Form N-CSR, respectively. Morgan Stanley also delivers the semi-annual and annual reports to fund shareholders and makes these reports available on its public website, www.morganstanley.com/im. Each Morgan Stanley fund also files a complete schedule of portfolio holdings with the SEC for the fund's first and third fiscal quarters on Form N-Q. Morgan Stanley does not deliver the reports for the first and third fiscal quarters to shareholders, nor are the reports posted to the Morgan Stanley public website. You may, however, obtain the Form N-Q filings (as well as the Form N-CSR and N-CSRS filings) by accessing the SEC's website, www.sec.gov. You may also review and copy them at the SEC's Public Reference Room in Washington, DC. Information on the operation of the SEC's Public Reference Room may be obtained by calling the SEC toll free at 1 (800) SEC-0330. You can also request copies of these materials, upon payment of a duplicating fee, by electronic request at the SEC's email address (publicinfo@sec.gov) or by writing to the SEC's Public Reference Section, Washington, D.C. 20549-1520.
Proxy Voting Policies and Procedures and Proxy Voting Record
You may obtain a copy of the Company's Proxy Voting Policy and Procedures and information regarding how the Company voted proxies relating to portfolio securities during the most recent twelve-month period ended June 30, without charge, upon request, by calling toll free 1 (800) 548-7786 or by visiting our website at www.morganstanley.com/im. This information is also available on the SEC's website at www.sec.gov.
This report is authorized for distribution only when preceded or accompanied by a prospectus or summary prospectus of the applicable Fund of Morgan Stanley Institutional Fund, Inc., which describes in detail the Fund's investment policies, risks, fees and expenses. Please read the prospectus carefully before you invest or send money. For additional information, including information regarding the investments comprising the Fund, please visit our website at www.morganstanley.com/im or call toll free 1 (800) 548-7786.
35
Printed in U.S.A.
This Report has been prepared for shareholders and may be distributed to others only if preceded or accompanied by a current prospectus.
Morgan Stanley Investment Management Inc.
522 Fifth Avenue
New York, New York 10036
© 2018 Morgan Stanley. Morgan Stanley Distribution, Inc.

IFIIAANN
2007911 EXP. 02.28.19

Morgan Stanley Institutional Fund, Inc.
International Equity Portfolio
Annual Report
December 31, 2017

Morgan Stanley Institutional Fund, Inc.
Annual Report — December 31, 2017
Shareholders' Letter | | | 2 | | |
Expense Example | | | 3 | | |
Investment Overview | | | 4 | | |
Portfolio of Investments | | | 8 | | |
Statement of Assets and Liabilities | | | 10 | | |
Statement of Operations | | | 12 | | |
Statements of Changes in Net Assets | | | 13 | | |
Financial Highlights | | | 15 | | |
Notes to Financial Statements | | | 20 | | |
Report of Independent Registered Public Accounting Firm | | | 30 | | |
Federal Tax Notice | | | 31 | | |
Privacy Notice | | | 32 | | |
Director and Officer Information | | | 35 | | |
This report is authorized for distribution only when preceded or accompanied by a prospectus or summary prospectus of the applicable Fund of Morgan Stanley Institutional Fund, Inc. To receive a prospectus and/or statement of additional information (SAI), which contains more complete information such as investment objectives, charges, expenses, policies for voting proxies, risk considerations, and describes in detail each of the Fund's investment policies to the prospective investor, please call toll free 1 (800) 548-7786. Please read the prospectuses carefully before you invest or send money.
Additionally, you can access information about the Fund, including performance, characteristics, and investment team commentary, through Morgan Stanley Investment Management's website: www.morganstanley.com/im.
Market forecasts provided in this report may not necessarily come to pass. There is no guarantee that any sectors mentioned will continue to perform as discussed herein or that securities in such sectors will be held by the Fund in the future. There is no assurance that a fund will achieve its investment objective. Funds are subject to market risk, which is the possibility that market values of securities owned by the Fund will decline and, therefore, the value of the Fund's shares may be less than what you paid for them. Accordingly, you can lose money investing in this Fund. Please see the prospectus for more complete information on investment risks.
1
Morgan Stanley Institutional Fund, Inc.
Annual Report — December 31, 2017
Shareholders' Letter (unaudited)
Dear Shareholders,
We are pleased to provide this Annual report, in which you will learn how your investment in International Equity Portfolio (the "Fund") performed during the latest twelve-month period.
Morgan Stanley Investment Management is a client-centric, investor-led organization. Our global presence, intellectual capital, and breadth of products and services enable us to partner with investors to meet the evolving challenges of today's financial markets. We aim to deliver superior investment service and to empower our clients to make the informed decisions that help them reach their investment goals.
As always, we thank you for selecting Morgan Stanley Investment Management, and look forward to working with you in the months and years ahead.
Sincerely,

John H. Gernon
President and Principal Executive Officer
January 2018
2
Morgan Stanley Institutional Fund, Inc.
Annual Report — December 31, 2017
Expense Example (unaudited)
International Equity Portfolio
As a shareholder of the Fund, you incur two types of costs: (1) transactional costs, including redemption fees; and (2) ongoing costs, which may include advisory fees, administration fees, distribution and shareholder services fees and other Fund expenses. This example is intended to help you understand your ongoing costs (in dollars) of investing in the Fund and to compare these costs with the ongoing costs of investing in other mutual funds.
This example is based on an investment of $1,000 invested at the beginning of the six-month period ended December 31, 2017 and held for the entire six-month period.
Actual Expenses
The table below provides information about actual account values and actual expenses. You may use the information in this table, together with the amount you invested, to estimate the expenses that you paid over the period. Simply divide your account value by $1,000 (for example, an $8,600 account value divided by $1,000 = 8.6), then multiply the result by the number in the table under the heading entitled "Actual Expenses Paid During Period" to estimate the expenses you paid on your account during this period.
Hypothetical Example for Comparison Purposes
The table below provides information about hypothetical account values and hypothetical expenses based on the Fund's actual expense ratio and an assumed rate of return of 5% per year before expenses, which is not the Fund's actual return. The hypothetical account values and expenses may not be used to estimate the actual ending account balance or expenses you paid for the period. You may use this information to compare the ongoing costs of investing in the Fund and other funds. To do so, compare this 5% hypothetical example with the 5% hypothetical examples that appear in the shareholder reports of the other funds.
Please note that the expenses shown in the table are meant to highlight your ongoing costs only and do not reflect any transactional costs, such as sales charges (loads) and redemption fees. Therefore, the information for each class in the table is useful in comparing ongoing costs only, and will not help you determine the relative total costs of owning different funds. In addition, if these transactional costs were included, your costs would have been higher.
| | | Beginning
Account
Value
7/1/17 | | Actual Ending
Account
Value
12/31/17 | | Hypothetical
Ending Account
Value | | Actual
Expenses
Paid
During
Period* | | Hypothetical
Expenses Paid
During Period* | | Net
Expense
Ratio
During
Period** | |
International Equity Portfolio Class I | | $ | 1,000.00 | | | $ | 1,072.80 | | | $ | 1,020.42 | | | $ | 4.96 | | | $ | 4.84 | | | | 0.95 | % | |
International Equity Portfolio Class A | | | 1,000.00 | | | | 1,071.40 | | | | 1,018.65 | | | | 6.79 | | | | 6.61 | | | | 1.30 | | |
International Equity Portfolio Class L | | | 1,000.00 | | | | 1,068.10 | | | | 1,016.13 | | | | 9.38 | | | | 9.15 | | | | 1.80 | | |
International Equity Portfolio Class C | | | 1,000.00 | | | | 1,067.00 | | | | 1,014.87 | | | | 10.68 | | | | 10.41 | | | | 2.05 | | |
International Equity Portfolio Class IS | | | 1,000.00 | | | | 1,073.30 | | | | 1,020.62 | | | | 4.76 | | | | 4.63 | | | | 0.91 | | |
* Expenses are calculated using each Fund Class' annualized net expense ratio (as disclosed), multiplied by the average account value over the period, and multiplied by 184/365 (to reflect the most recent one-half year period).
** Annualized.
3
Morgan Stanley Institutional Fund, Inc.
Annual Report — December 31, 2017
Investment Overview (unaudited)
International Equity Portfolio
The Fund seeks long-term capital appreciation by investing primarily in equity securities of non-U.S. issuers.
Performance
For the year ended December 31, 2017, the Fund's Class I shares had a total return based on net asset value and reinvestment of distributions per share of 25.17%, net of fees. The Fund's Class I shares outperformed the Fund's benchmark, the MSCI EAFE Index (the "Index"), which returned 25.03%.
Please keep in mind that double-digit returns are highly unusual and cannot be sustained. Investors should also be aware that these returns were primarily achieved during favorable market conditions.
Factors Affecting Performance
• For 2017 as whole, the MSCI EAFE Index finished sharply higher at +25% in U.S. dollar (USD) terms, but +15.2% in local currency terms as the USD weakened against most major currencies throughout the year. Anticipated regional political risks failed to materialize. Emerging markets (+37.3% USD, +30.6 local) outperformed developed markets given the weak dollar and a recovery in industrial commodity prices. Japan (+24.0% USD, +19.8% local) also did well, underpinned by strong earnings. The eurozone advanced following Macron's election in France, finishing the year up 26.5% in USD terms, but just +11.2% in local currency terms, held back by euro strength. The United Kingdom (+22.3% USD, +11.7% local) lagged, weighed down by sterling strength and continued uncertainty around Brexit transition arrangements. At the sector level, information technology (+39.3%), materials (+33.9%) and industrials (+30.0%) led the way in 2017, while telecommunications (+12.9%), health care (+16.9%) and utilities (+19.2%) were the primary laggards. (Regional and country performance is represented by the respective MSCI Indexes.)
• The Fund's stock selection was favorable for the year, led by consumer staples, with our holdings in the sector outperforming the Index by 10%. Strong stock selection in information technology also benefited performance, with two out-of-Index holdings performing strongly, along with a Japan-
based maker of factory automation sensors. Stock selection in financials was also a positive. The allocation effect was negative for the year, partially offsetting strong stock selection, with the overweight in health care and underweight in materials weighing on performance. The hedge on the Japanese yen to USD, which is managed using forward contracts, was also a negative, given the weakening dollar, as was the minor cash position with markets up sharply.
Management Strategies
• Our central concern at the start of 2017 was a backdrop of generally high valuations coinciding with some significant macro/political concerns for the then-forthcoming year, including China, the risk of U.S. and European politics going wrong, the vulnerability of the financial system to shocks due to the sharp increase in debt, and general stagnation. We observed that if any of these major concerns went wrong, there was little margin of safety generally and probably quite a lot of downside given the nature of some of the potential risks. As bottom-up stock pickers, we found little margin of safety in stocks more or less across the board. 2017 ended with most major country indices up 20 to 25% or more (in USD),(i) making such concerns look at best premature, at worst just plain wrong. However, enthused US dollar-based investors excited about markets in 2017 may have forgotten that markets went up a lot in something that went down a lot (i.e., the dollar).
• As we start 2018, we are more concerned about valuation and, on balance, less concerned about the macro conditions, although there is still plenty that can go wrong. In a nutshell, the market has re-rated on the basis that 2017's expected earnings increase of 15% for the MSCI World Index actually delivered for the first time in five years, as growth for once did not disappoint.(i) Although there is growing evidence of gross domestic product growth across the board, should these proverbial green shoots fail to bloom the market will de-rate multiples on lower actual earnings, the proverbial double-hit.(ii)
(i) Source: Morgan Stanley Investment Management and FactSet. Data as of December 31, 2017.
(ii) Forecast/estimates are based on current market conditions, subject to change and may not necessarily come to pass.
4
Morgan Stanley Institutional Fund, Inc.
Annual Report — December 31, 2017
Investment Overview (unaudited) (cont'd)
International Equity Portfolio
• In the U.S., despite the sturm und drang and the flying of a lot of liberal feathers, the market has broadly seen the benefits of Trump (tax reform being the biggest win) without any of the major risks eventuating as yet (an unholy cocktail of awfulness ranging from a trade war with China to nuclear war with North Korea). To the credit of Congress, it has passed, after much drama, the single measure we thought would have the biggest long-term positive impact on the U.S. economy, namely tax reform. Although its impact on overall U.S. corporations may be muted in the short term (few major U.S. companies pay a full U.S. tax charge unless they are purely domestic), the big long-term question is whether the combination of the tax reform and short-term capital expenditure (capex) and cash repatriation packages will be enough to get a capex cycle going, leading to a pick-up in productivity from current lows. In recent years, U.S. corporates have generally chosen to buy back shares rather than increase capex, and productivity has generally suffered as a result. A bull would say the combination of tax reform and the opportunities provided by the internet of things (IoT) and artificial intelligence (AI) will kick off a long cycle of investment to drive waste out of many sectors, with massive potential cost savings, a good chunk of which will come through in margins, which will be propelled to permanent new highs. A bear would respond that there may be some positive impact, but U.S. corporations will just continue to buy back shares, and margins may normalize as labor seeks to get its hands on a larger share of corporate profits from a still historically low starting point, leaving aside the risks from the aging U.S. economic cycle.
• Add to this that the U.S. market is anticipating a repeat of the 12% earnings growth in the S&P 500 Index it saw in 2017, it is hardly a surprise that the market has not been over-concerned with valuation.(i) A bull (no shortage of those) would say that at 18.2x, the next 12 months price-to-earnings ("P/E") ratio of the S&P 500 Index is only about 14% above the long-term mean of 16.0x from 1997 to 2017; so why the fuss?(i) A bear (count us as one) would point out that even leaving aside quality of earnings (given the largest ever cycle of U.S.
earnings manipulation), corporate debt after a buyback binge is near record highs, as are margins, which means that the debt-adjusted price-to-sales ratio (EV/sales) at 2.44 for the S&P 500 Index is getting close to the 2000 peak of 2.98, which is a clear amber light, even leaving aside outdated notions of earnings reversion to the mean or the risk of a turn down in the U.S. economy.(i)
• If one takes a longer-term view of valuations as per the Schiller P/E, the U.S. market has gone from expensive on 27.9x at the start of 2017 to very expensive on 32.4x at the end of 2017.(i) Unless the visionary tech bulls are right that a heady cocktail of AI, IoT, e-commerce et al. will propel already peak margins ever higher, leading to a ton of earnings growth, this is also a dark amber light for valuation, with a lot of expectations baked into price. No bull market ever bursts purely from valuation alone; but when markets do focus on valuation once more, it matters.
• The other major geopolitical risk (aside from Trump) facing the world at the start of 2017 was the risk of political disruption in Europe, possibly leading to a break-up of the eurozone if the politics went wrong. After a few awkward moments, the market shrugged off such concerns following the Dutch and (in particular) French elections and, even after nasty surprises in the German election, continued to concentrate on the growing evidence of a eurozone economic recovery. So far, the market has been right, with some entirely unexpected positive results such as a majority in parliament for President Macron in France, which (miracle of miracles) means that reform, particularly labor market reform, has actually progressed in France and looks set to continue. Our concerns that Brexit could inspire a cascade of falling euro-dominos have been hitherto wrong: the only domino to fall flat on its face has been the U.K. itself, after doing what Michael Bloomberg memorably described as "the single stupidest thing any country has ever done." In fact, the only wobble of the dominos to date has been a positive impact — the U.K.'s self-immolation probably inspired France to rally around Macron to avoid the fate of its much loved European partner. However, our concerns for the
(i) Source: Morgan Stanley Investment Management and FactSet. Data as of December 31, 2017.
5
Morgan Stanley Institutional Fund, Inc.
Annual Report — December 31, 2017
Investment Overview (unaudited) (cont'd)
International Equity Portfolio
European elections were not that there was a high probability of things going horribly wrong in France or Germany; rather, the risk was Italy, which managed not to have its general election in 2017. Italy has been the big loser of the euro, with its economy not growing for 20 years due to an inability to reform itself and (mostly) to losing its historic ability to depreciate its currency (the lira) to keep its competitive plates spinning. Furthermore, Italy has the strongest eurosceptic forces of the major European countries going into its electoral cycle. The risk, now that Italy is having its election in March 2018, is that the Italians elect a government who decide to do something about the euro — if so, political risk will be back in Europe in spades.
• Looking forward to 2018, there does seem to be a synchronized global expansion. However, it isn't that large, has quite a lot of risk and seems to be priced in by markets. We see that few of the major structural problems in the world (debt, the unknowns of a quantitative easing (QE) unwind, political uncertainty, China et al.) have gone away. In simple terms, a goldilocks scenario has been priced in but there seems to be quite a lot of risk and no apparent margin of safety in valuations. Such growth as there is looks unlikely to drive a sharp pick-up in inflation. Even though the U.S. is pressing the reflation button of tax cuts, this does not guarantee that the U.S. will reflate, especially given its starting point as one of the longest economic expansions in recent memory and already record-high margins. One might also point out that giving the wrong people (corporates and the wealthy) tax cuts does not, in itself, amount to a conventional hitting of the reflation button via fiscal policy. General use of fiscal policy to reflate Europe also looks questionable given the Germans have to agree to it, which looks far from a foregone conclusion with a weakened Mrs. Merkel in discussions with the (socialist) Social Democratic Party (SPD) for a renewed Grand Coalition. However, even if there is very little probability of systematic German-led reflation in Europe, at least European fiscal policy as a whole no longer looks like a future drag and could be mildly expansionary.
• Despite its many problems (debt, demographics, QE ad nauseam), Japan does not face the same political risk as the West given that Prime Minister Abe has just been re-elected with a large majority. Furthermore, the Japanese cabinet approved a draft tax measure to incentivize companies to increase wages and raise capex in December 2017, potentially lowering Japanese corporate tax rates from the current 30% to 20%. There is even some evidence that Japanese companies are at last taking measures to run themselves better, although this is very much on a stock-by-stock basis and generally the number is few. Japan just may have the ability to surprise on the upside from reflation, particularly as there is growing evidence of labor shortages driving up wages. However, as always in Japan, there are a frustratingly small number of investible companies that can benefit from this.
• As bottom-up stock pickers, the substantial rally in markets in 2017 aggravates the problem we have faced over the last few years of generally not having a sufficient margin of safety in the form of price to compensate us for potential risks, be they cyclical, macro or the threat of disruptive change. Clearly the market does not see margin of safety as a principal concern with the VIX, a common gauge of volatility, trading at around all-time lows.(iii) This means it has generally been difficult to find new opportunities and there have been no obvious sectors, which have been dramatically mispriced. Nonetheless, by casting a net wide and intensifying our search, we have found 10 attractive new holdings for International Equity Portfolio this year (in 2016 we found 15 new holdings). We are broadly encouraged by the performance of these holdings in 2017.
• To us, the risks look skewed more to the downside than upside. If widespread hopes of a continuation of the current synchronized pick-up in world growth fail to materialize, the current backdrop of high valuation and low concern for risk make preservation of capital the key concern. To us, high-quality companies, which should still be better able to grow sales and profits in a downturn, look the best relative bet, even if they are unexciting in absolute terms.
(iii) Source: Chicago Board Options Exchange Market Volatility Index, December 31, 2017.
6
Morgan Stanley Institutional Fund, Inc.
Annual Report — December 31, 2017
Investment Overview (unaudited) (cont'd)
International Equity Portfolio
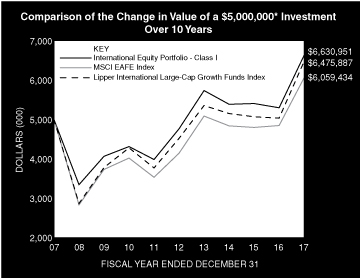
* Minimum Investment for Class I shares
In accordance with SEC regulations, the Fund's performance shown assumes that all recurring fees (including management fees) were deducted and all dividends and distributions were reinvested. The performance of Class A, L, C and IS shares will vary from Class I shares based upon their different inception dates and will be negatively impacted by additional fees assessed to those classes (if applicable).
Performance Compared to the MSCI EAFE Index(1) and the Lipper International Large-Cap Growth Funds Index(2)
| | Period Ended December 31, 2017
Total Returns(3) | |
| | | | Average Annual | |
| | One
Year | | Five
Years | | Ten
Years | | Since
Inception(9) | |
Fund — Class I Shares
w/o sales charges(4) | | | 25.17 | % | | | 6.84 | % | | | 2.86 | % | | | 8.60 | % | |
Fund — Class A Shares
w/o sales charges(5) | | | 24.77 | | | | 6.49 | | | | 2.57 | | | | 7.66 | | |
Fund — Class A Shares with
maximum 5.25% sales charges(5) | | | 18.23 | | | | 5.34 | | | | 2.02 | | | | 7.40 | | |
Fund — Class L Shares
w/o sales charges(6) | | | 24.06 | | | | 5.94 | | | | — | | | | 8.28 | | |
Fund — Class C Shares
w/o sales charges(8) | | | 23.78 | | | | — | | | | — | | | | 3.19 | | |
Fund — Class C Shares with
maximum 1.00% deferred sales
charges(8) | | | 22.78 | | | | — | | | | — | | | | 3.19 | | |
Fund — Class IS Shares
w/o sales charges(7) | | | 25.22 | | | | — | | | | — | | | | 5.20 | | |
MSCI EAFE Index | | | 25.03 | | | | 7.90 | | | | 1.94 | | | | 4.83 | | |
Lipper International Large-Cap
Growth Funds Index | | | 28.64 | | | | 7.45 | | | | 2.62 | | | | N/A | | |
Performance data quoted represents past performance, which is no guarantee of future results, and current performance may be lower or higher than the figures shown. Performance assumes that all dividends and distributions, if any, were reinvested. For the most recent month-end performance figures, please visit www.morganstanley.com/im. Investment return and principal value will fluctuate so that Fund shares, when redeemed, may be worth more or less than their original cost. Total returns do not reflect the deduction of taxes that a shareholder would pay on Fund distributions or the redemption of Fund shares. Performance of share classes will vary due to difference in sales charges and expenses.
(1) The MSCI EAFE Index (Europe, Australasia, Far East) is a free float-adjusted market capitalization index that is designed to measure the international equity market performance of developed markets, excluding the U.S. & Canada. The term "free float" represents the portion of shares outstanding that are deemed to be available for purchase in the public equity markets by investors. The MSCI EAFE Index currently consists of 21 developed market country indices. The performance of the Index is listed in U.S. dollars and assumes reinvestment of net dividends. The Index is unmanaged and its returns do not include any sales charges or fees. Such costs would lower performance. It is not possible to invest directly in an index.
(2) The Lipper International Large-Cap Growth Funds Index is an equally weighted performance index of the largest qualifying funds (based on net assets) in the Lipper International Large-Cap Growth Funds classification. The Index, which is adjusted for capital gains distributions and income dividends, is unmanaged and should not be considered an investment. There are currently 30 funds represented in this Index. As of the date of this report, the Fund is in the Lipper International Large-Cap Growth Funds classification.
(3) Total returns for the Fund reflect fees waived and expenses reimbursed, if applicable, by the Adviser. Without such waivers and reimbursements, total returns would have been lower.
(4) Commenced operations on August 4, 1989.
(5) Commenced offering on January 2, 1996.
(6) Commenced offering on June 14, 2012.
(7) Commenced offering on September 13, 2013.
(8) Commenced offering on April 30, 2015.
(9) For comparative purposes, average annual since inception returns listed for the Indexes refer to the inception date of Class I of the Fund, not the inception of the Index.
7
Morgan Stanley Institutional Fund, Inc.
Annual Report — December 31, 2017
Portfolio of Investments
International Equity Portfolio
| | | Shares | | Value
(000) | |
Common Stocks (97.7%) | |
Canada (3.1%) | |
Barrick Gold Corp. (a) | | | 5,144,972 | | | $ | 74,412 | | |
Constellation Software, Inc. | | | 52,886 | | | | 32,061 | | |
Turquoise Hill Resources Ltd. (a)(b) | | | 6,626,815 | | | | 22,616 | | |
| | | | 129,089 | | |
China (3.6%) | |
China Petroleum & Chemical Corp. H Shares (c) | | | 32,470,000 | | | | 23,791 | | |
Tencent Holdings Ltd. (c) | | | 2,404,300 | | | | 124,290 | | |
| | | | 148,081 | | |
Finland (0.6%) | |
Neste Oyj | | | 362,331 | | | | 23,187 | | |
France (14.8%) | |
AXA SA | | | 1,544,987 | | | | 45,791 | | |
L'Oreal SA | | | 739,197 | | | | 163,754 | | |
Pernod Ricard SA | | | 1,004,563 | | | | 159,013 | | |
Publicis Groupe SA | | | 482,284 | | | | 32,765 | | |
Safran SA | | | 793,965 | | | | 81,643 | | |
Sanofi | | | 1,069,678 | | | | 92,103 | | |
TOTAL SA | | | 772,754 | | | | 42,637 | | |
| | | | 617,706 | | |
Germany (7.4%) | |
Bayer AG (Registered) | | | 907,284 | | | | 112,844 | | |
Continental AG | | | 174,057 | | | | 46,991 | | |
HeidelbergCement AG | | | 222,365 | | | | 24,071 | | |
SAP SE | | | 1,111,012 | | | | 124,578 | | |
| | | | 308,484 | | |
Hong Kong (1.8%) | |
AIA Group Ltd. | | | 8,861,400 | | | | 75,573 | | |
Ireland (1.2%) | |
Bank of Ireland Group PLC (b) | | | 2,673,151 | | | | 22,740 | | |
CRH PLC | | | 781,471 | | | | 28,113 | | |
| | | | 50,853 | | |
Japan (18.6%) | |
FANUC Corp. | | | 371,300 | | | | 89,208 | | |
Hitachi Ltd. | | | 4,441,000 | | | | 34,547 | | |
Keyence Corp. | | | 117,800 | | | | 65,775 | | |
Kirin Holdings Co., Ltd. | | | 1,836,700 | | | | 46,211 | | |
Komatsu Ltd. | | | 1,654,100 | | | | 59,917 | | |
Lion Corp. | | | 1,503,700 | | | | 28,387 | | |
Mitsubishi Estate Co., Ltd. | | | 1,098,200 | | | | 19,082 | | |
Mizuho Financial Group, Inc. | | | 16,479,500 | | | | 29,934 | | |
NGK Spark Plug Co., Ltd. (a) | | | 588,100 | | | | 14,301 | | |
Nitto Denko Corp. | | | 619,000 | | | | 55,020 | | |
Shiseido Co., Ltd. | | | 2,880,400 | | | | 138,839 | | |
Sompo Holdings, Inc. | | | 637,400 | | | | 24,574 | | |
Sumitomo Mitsui Financial Group, Inc. | | | 1,891,451 | | | | 81,692 | | |
Sumitomo Mitsui Trust Holdings, Inc. | | | 117,999 | | | | 4,686 | | |
Toyota Motor Corp. | | | 827,100 | | | | 52,964 | | |
USS Co., Ltd. | | | 1,361,800 | | | | 28,809 | | |
| | | | 773,946 | | |
| | | Shares | | Value
(000) | |
Korea, Republic of (2.2%) | |
LG Household & Health Care Ltd. | | | 48,365 | | | $ | 53,619 | | |
NCSoft Corp. | | | 93,348 | | | | 38,997 | | |
| | | | 92,616 | | |
Netherlands (8.3%) | |
Heineken N.V. | | | 858,853 | | | | 89,522 | | |
RELX N.V. | | | 3,277,027 | | | | 75,335 | | |
Unilever N.V. CVA | | | 3,192,916 | | | | 179,392 | | |
| | | | 344,249 | | |
Portugal (0.7%) | |
Galp Energia SGPS SA | | | 1,469,336 | | | | 26,993 | | |
Sweden (0.6%) | |
Nordea Bank AB | | | 2,143,849 | | | | 25,946 | | |
Switzerland (7.4%) | |
Nestle SA (Registered) | | | 405,014 | | | | 34,804 | | |
Novartis AG (Registered) | | | 1,636,938 | | | | 138,390 | | |
Roche Holding AG (Genusschein) | | | 436,190 | | | | 110,331 | | |
Zurich Insurance Group AG | | | 84,731 | | | | 25,769 | | |
| | | | 309,294 | | |
United Kingdom (27.4%) | |
Admiral Group PLC | | | 808,544 | | | | 21,804 | | |
Aggreko PLC | | | 3,228,363 | | | | 34,717 | | |
Aviva PLC | | | 6,886,430 | | | | 47,062 | | |
British American Tobacco PLC | | | 2,953,426 | | | | 199,328 | | |
BT Group PLC | | | 16,929,485 | | | | 61,986 | | |
Bunzl PLC | | | 1,312,171 | | | | 36,691 | | |
Experian PLC | | | 2,609,548 | | | | 57,351 | | |
Ferguson PLC | | | 997,460 | | | | 71,371 | | |
GlaxoSmithKline PLC | | | 8,443,423 | | | | 149,346 | | |
Imperial Brands PLC | | | 679,592 | | | | 29,042 | | |
Man Group PLC | | | 15,176,100 | | | | 42,240 | | |
Meggitt PLC | | | 2,557,531 | | | | 16,560 | | |
Prudential PLC | | | 4,241,450 | | | | 109,049 | | |
Reckitt Benckiser Group PLC | | | 1,840,638 | | | | 171,932 | | |
RELX PLC | | | 3,272,331 | | | | 76,663 | | |
Travis Perkins PLC | | | 722,849 | | | | 15,284 | | |
| | | | 1,140,426 | | |
Total Common Stocks (Cost $2,818,185) | | | 4,066,443 | | |
Short-Term Investments (2.2%) | |
Securities held as Collateral on Loaned Securities (0.0%) | |
Investment Company (0.0%) | |
Morgan Stanley Institutional Liquidity
Funds — Treasury Securities Portfolio —
Institutional Class (See Note G) | | | 433,122 | | | | 433 | | |
The accompanying notes are an integral part of the financial statements.
8
Morgan Stanley Institutional Fund, Inc.
Annual Report — December 31, 2017
Portfolio of Investments (cont'd)
International Equity Portfolio
| | | Face
Amount
(000) | | Value
(000) | |
Repurchase Agreements (0.0%) | |
Barclays Capital, Inc., (1.37%,
dated 12/29/17, due 1/2/18;
proceeds $100; fully collateralized by a
U.S. Government obligation;
1.75% due 5/15/23; valued at $102) | | $ | 100 | | | $ | 100 | | |
HSBC Securities USA, Inc., (1.30%,
dated 12/29/17, due 1/2/18;
proceeds $8; fully collateralized by a
U.S. Government obligation;
3.00% due 2/15/47; valued at $8) | | | 8 | | | | 8 | | |
Merrill Lynch & Co., Inc., (1.42%,
dated 12/29/17, due 1/2/18;
proceeds $51; fully collateralized by a
U.S. Government obligation;
2.00% due 12/31/21; valued at $52) | | | 51 | | | | 51 | | |
| | | | 159 | | |
Total Securities held as Collateral on Loaned
Securities (Cost $592) | | | 592 | | |
| | | Shares | | | |
Investment Company (2.2%) | |
Morgan Stanley Institutional Liquidity
Funds — Treasury Securities Portfolio —
Institutional Class (See Note G)
(Cost $91,551) | | | 91,551,334 | | | | 91,551 | | |
Total Short-Term Investments (Cost $92,143) | | | 92,143 | | |
Total Investments (99.9%) (Cost $2,910,328)
Including $11,557 of Securities Loaned (d)(e)(f) | | | 4,158,586 | | |
Other Assets in Excess of Liabilities (0.1%) | | | 2,380 | | |
Net Assets (100.0%) | | $ | 4,160,966 | | |
Country assignments and aggregations are based generally on third party vendor classifications and information, and may be different from the assignments and aggregations under the policies set forth in the Fund's prospectus and/or statement of additional information relating to geographic classifications.
(a) All or a portion of this security was on loan at December 31, 2017.
(b) Non-income producing security.
(c) Security trades on the Hong Kong exchange.
(d) The approximate fair value and percentage of net assets, $3,937,354,000 and 94.6%, respectively, represent the securities that have been fair valued under the fair valuation policy for international investments as described in Note A-1 within the Notes to the Financial Statements.
(e) Securities are available for collateral in connection with an open foreign currency forward exchange contract.
(f) At December 31, 2017, the aggregate cost for federal income tax purposes is approximately $2,944,677,000. The aggregate gross unrealized appreciation is approximately $1,295,339,000 and the aggregate gross unrealized depreciation is approximately $82,207,000, resulting in net unrealized appreciation of approximately $1,213,132,000.
CVA Certificaten Van Aandelen.
Foreign Currency Forward Exchange Contract:
The Fund had the following foreign currency forward exchange contract open at December 31, 2017:
Counterparty | | Contracts to
Deliver
(000) | | In Exchange
For
(000) | | Delivery
Date | | Unrealized
Depreciation
(000) | |
Commonwealth Bank of Australia | | JPY | 32,741,000 | | | $ | 290,638 | | | 3/5/18 | | $ | (777 | ) | |
JPY — Japanese Yen
Portfolio Composition*
Classification | | Percentage of
Total Investments | |
Other** | | | 46.6 | % | |
Pharmaceuticals | | | 14.5 | | |
Personal Products | | | 12.9 | | |
Insurance | | | 8.4 | | |
Beverages | | | 7.1 | | |
Tobacco | | | 5.5 | | |
Professional Services | | | 5.0 | | |
Total Investments | | | 100.0 | %*** | |
* Percentages indicated are based upon total investments (excluding Securities held as Collateral on Loaned Securities) as of December 31, 2017.
** Industries and/or investment types representing less than 5% of total investments.
*** Does not include an open foreign currency forward exchange contract with unrealized depreciation of approximately $777,000.
The accompanying notes are an integral part of the financial statements.
9
Morgan Stanley Institutional Fund, Inc.
Annual Report — December 31, 2017
International Equity Portfolio
Statement of Assets and Liabilities | | December 31, 2017
(000) | |
Assets: | |
Investments in Securities of Unaffiliated Issuers, at Value(1) (Cost $2,818,344) | | $ | 4,066,602 | | |
Investment in Security of Affiliated Issuer, at Value (Cost $91,984) | | | 91,984 | | |
Total Investments in Securities, at Value (Cost $2,910,328) | | | 4,158,586 | | |
Foreign Currency, at Value (Cost $562) | | | 564 | | |
Tax Reclaim Receivable | | | 6,737 | | |
Dividends Receivable | | | 6,555 | | |
Receivable for Fund Shares Sold | | | 4,527 | | |
Receivable for Investments Sold | | | 1,586 | | |
Receivable from Affiliate | | | 79 | | |
Receivable from Securities Lending Income | | | 9 | | |
Other Assets | | | 219 | | |
Total Assets | | | 4,178,862 | | |
Liabilities: | |
Payable for Advisory Fees | | | 8,099 | | |
Payable for Investments Purchased | | | 3,659 | | |
Payable for Fund Shares Redeemed | | | 2,790 | | |
Unrealized Depreciation on Foreign Currency Forward Exchange Contracts | | | 777 | | |
Collateral on Securities Loaned, at Value | | | 592 | | |
Payable for Custodian Fees | | | 455 | | |
Payable for Sub Transfer Agency Fees — Class I | | | 234 | | |
Payable for Sub Transfer Agency Fees — Class A | | | 196 | | |
Payable for Sub Transfer Agency Fees — Class L | | | 6 | | |
Payable for Sub Transfer Agency Fees — Class C | | | — | @ | |
Payable for Directors' Fees and Expenses | | | 283 | | |
Payable for Administration Fees | | | 280 | | |
Payable for Shareholder Services Fees — Class A | | | 263 | | |
Payable for Distribution and Shareholder Services Fees — Class L | | | 4 | | |
Payable for Distribution and Shareholder Services Fees — Class C | | | 1 | | |
Payable for Professional Fees | | | 51 | | |
Payable for Transfer Agency Fees — Class I | | | 7 | | |
Payable for Transfer Agency Fees — Class A | | | 5 | | |
Payable for Transfer Agency Fees — Class L | | | 1 | | |
Payable for Transfer Agency Fees — Class C | | | 1 | | |
Payable for Transfer Agency Fees — Class IS | | | 1 | | |
Other Liabilities | | | 191 | | |
Total Liabilities | | | 17,896 | | |
Net Assets | | $ | 4,160,966 | | |
Net Assets Consist Of: | |
Paid-in-Capital | | $ | 2,942,816 | | |
Accumulated Undistributed Net Investment Income | | | 5,551 | | |
Accumulated Net Realized Loss | | | (35,123 | ) | |
Unrealized Appreciation (Depreciation) on: | |
Investments | | | 1,248,258 | | |
Foreign Currency Forward Exchange Contracts | | | (777 | ) | |
Foreign Currency Translations | | | 241 | | |
Net Assets | | $ | 4,160,966 | | |
The accompanying notes are an integral part of the financial statements.
10
Morgan Stanley Institutional Fund, Inc.
Annual Report — December 31, 2017
International Equity Portfolio
Statement of Assets and Liabilities (cont'd) | | December 31, 2017
(000) | |
CLASS I: | |
Net Assets | | $ | 1,691,807 | | |
| Shares Outstanding $0.001 par value shares of beneficial interest (unlimited shares authorized) (not in 000's) | | | 94,125,436 | | |
Net Asset Value, Offering and Redemption Price Per Share | | $ | 17.97 | | |
CLASS A: | |
Net Assets | | $ | 1,231,279 | | |
| Shares Outstanding $0.001 par value shares of beneficial interest (unlimited shares authorized) (not in 000's) | | | 69,376,159 | | |
Net Asset Value, Redemption Price Per Share | | $ | 17.75 | | |
Maximum Sales Load | | | 5.25 | % | |
Maximum Sales Charge | | $ | 0.98 | | |
Maximum Offering Price Per Share | | $ | 18.73 | | |
CLASS L: | |
Net Assets | | $ | 7,099 | | |
| Shares Outstanding $0.001 par value shares of beneficial interest (unlimited shares authorized) (not in 000's) | | | 400,997 | | |
Net Asset Value, Offering and Redemption Price Per Share | | $ | 17.70 | | |
CLASS C: | |
Net Assets | | $ | 677 | | |
| Shares Outstanding $0.001 par value shares of beneficial interest (unlimited shares authorized) (not in 000's) | | | 38,662 | | |
Net Asset Value, Offering and Redemption Price Per Share | | $ | 17.51 | | |
CLASS IS: | |
Net Assets | | $ | 1,230,104 | | |
| Shares Outstanding $0.001 par value shares of beneficial interest (unlimited shares authorized) (not in 000's) | | | 68,447,827 | | |
Net Asset Value, Offering and Redemption Price Per Share | | $ | 17.97 | | |
(1) Including:
Securities on Loan, at Value: | | $ | 11,557 | | |
@ Amount is less than $500.
The accompanying notes are an integral part of the financial statements.
11
Morgan Stanley Institutional Fund, Inc.
Annual Report — December 31, 2017
International Equity Portfolio
Statement of Operations | | Year Ended
December 31, 2017
(000) | |
Investment Income: | |
Dividends from Securities of Unaffiliated Issuers (Net of $8,918 of Foreign Taxes Withheld) | | $ | 101,074 | | |
Income from Securities Loaned — Net | | | 837 | | |
Dividends from Security of Affiliated Issuer (Note G) | | | 500 | | |
Total Investment Income | | | 102,411 | | |
Expenses: | |
Advisory Fees (Note B) | | | 33,279 | | |
Administration Fees (Note C) | | | 3,328 | | |
Sub Transfer Agency Fees — Class I | | | 1,381 | | |
Sub Transfer Agency Fees — Class A | | | 1,817 | | |
Sub Transfer Agency Fees — Class L | | | 13 | | |
Sub Transfer Agency Fees — Class C | | | — | @ | |
Shareholder Services Fees — Class A (Note D) | | | 3,080 | | |
Distribution and Shareholder Services Fees — Class L (Note D) | | | 54 | | |
Distribution and Shareholder Services Fees — Class C (Note D) | | | 5 | | |
Custodian Fees (Note F) | | | 669 | | |
Registration Fees | | | 137 | | |
Professional Fees | | | 113 | | |
Shareholder Reporting Fees | | | 112 | | |
Directors' Fees and Expenses | | | 103 | | |
Transfer Agency Fees — Class I (Note E) | | | 24 | | |
Transfer Agency Fees — Class A (Note E) | | | 18 | | |
Transfer Agency Fees — Class L (Note E) | | | 4 | | |
Transfer Agency Fees — Class C (Note E) | | | 2 | | |
Transfer Agency Fees — Class IS (Note E) | | | 4 | | |
Pricing Fees | | | 8 | | |
Other Expenses | | | 220 | | |
Total Expenses | | | 44,371 | | |
Reimbursement of Class Specific Expenses — Class I (Note B) | | | (707 | ) | |
Reimbursement of Class Specific Expenses — Class A (Note B) | | | (111 | ) | |
Reimbursement of Class Specific Expenses — Class L (Note B) | | | (7 | ) | |
Reimbursement of Class Specific Expenses — Class C (Note B) | | | (2 | ) | |
Reimbursement of Class Specific Expenses — Class IS (Note B) | | | (4 | ) | |
Rebate from Morgan Stanley Affiliate (Note G) | | | (122 | ) | |
Waiver of Advisory Fees (Note B) | | | (114 | ) | |
Net Expenses | | | 43,304 | | |
Net Investment Income | | | 59,107 | | |
Realized Gain (Loss): | |
Investments Sold | | | 190,122 | | |
Foreign Currency Forward Exchange Contracts | | | (6,073 | ) | |
Foreign Currency Transactions | | | 427 | | |
Net Realized Gain | | | 184,476 | | |
Change in Unrealized Appreciation (Depreciation): | |
Investments | | | 680,568 | | |
Foreign Currency Forward Exchange Contracts | | | 1,529 | | |
Foreign Currency Translations | | | 646 | | |
Net Change in Unrealized Appreciation (Depreciation) | | | 682,743 | | |
Net Realized Gain and Change in Unrealized Appreciation (Depreciation) | | | 867,219 | | |
Net Increase in Net Assets Resulting from Operations | | $ | 926,326 | | |
@ Amount is less than $500.
The accompanying notes are an integral part of the financial statements.
12
Morgan Stanley Institutional Fund, Inc.
Annual Report — December 31, 2017
International Equity Portfolio
Statements of Changes in Net Assets | | Year Ended
December 31, 2017
(000) | | Year Ended
December 31, 2016
(000) | |
Increase (Decrease) in Net Assets: | |
Operations: | |
Net Investment Income | | $ | 59,107 | | | $ | 75,131 | | |
Net Realized Gain (Loss) | | | 184,476 | | | | (120,744 | ) | |
Net Change in Unrealized Appreciation (Depreciation) | | | 682,743 | | | | (46,498 | ) | |
Net Increase (Decrease) in Net Assets Resulting from Operations | | | 926,326 | | | | (92,111 | ) | |
Distributions from and/or in Excess of: | |
Class I: | |
Net Investment Income | | | (33,238 | ) | | | (18,324 | ) | |
Class A: | |
Net Investment Income | | | (20,120 | ) | | | (8,374 | ) | |
Class L: | |
Net Investment Income | | | (80 | ) | | | (11 | ) | |
Class C: | |
Net Investment Income | | | (7 | ) | | | (1 | ) | |
Class IS: | |
Net Investment Income | | | (23,796 | ) | | | (11,726 | ) | |
Total Distributions | | | (77,241 | ) | | | (38,436 | ) | |
Capital Share Transactions:(1) | |
Class I: | |
Subscribed | | | 188,753 | | | | 292,344 | | |
Distributions Reinvested | | | 31,004 | | | | 17,125 | | |
Redeemed | | | (607,988 | ) | | | (590,802 | ) | |
Class A: | |
Subscribed | | | 78,806 | | | | 325,847 | | |
Distributions Reinvested | | | 20,074 | | | | 8,356 | | |
Redeemed | | | (294,914 | ) | | | (489,120 | ) | |
Class L: | |
Exchanged | | | 115 | | | | 243 | | |
Distributions Reinvested | | | 79 | | | | 10 | | |
Redeemed | | | (1,585 | ) | | | (2,032 | ) | |
Class C: | |
Subscribed | | | 260 | | | | 508 | | |
Distributions Reinvested | | | 7 | | | | 1 | | |
Redeemed | | | (164 | ) | | | (403 | ) | |
Class IS: | |
Subscribed | | | 206,211 | | | | 345,619 | | |
Distributions Reinvested | | | 22,187 | | | | 11,091 | | |
Redeemed | | | (293,178 | ) | | | (151,013 | ) | |
Net Decrease in Net Assets Resulting from Capital Share Transactions | | | (650,333 | ) | | | (232,226 | ) | |
Redemption Fees | | | 31 | | | | 16 | | |
Total Increase (Decrease) in Net Assets | | | 198,783 | | | | (362,757 | ) | |
Net Assets: | |
Beginning of Period | | | 3,962,183 | | | | 4,324,940 | | |
End of Period (Including Accumulated Undistributed Net Investment Income of $5,551 and $29,235) | | $ | 4,160,966 | | | $ | 3,962,183 | | |
The accompanying notes are an integral part of the financial statements.
13
Morgan Stanley Institutional Fund, Inc.
Annual Report — December 31, 2017
International Equity Portfolio
Statements of Changes in Net Assets (cont'd) | | Year Ended
December 31, 2017
(000) | | Year Ended
December 31, 2016
(000) | |
(1) Capital Share Transactions: | |
Class I: | |
Shares Subscribed | | | 11,313 | | | | 19,900 | | |
Shares Issued on Distributions Reinvested | | | 1,773 | | | | 1,182 | | |
Shares Redeemed | | | (36,417 | ) | | | (40,979 | ) | |
Net Decrease in Class I Shares Outstanding | | | (23,331 | ) | | | (19,897 | ) | |
Class A: | |
Shares Subscribed | | | 4,760 | | | | 23,324 | | |
Shares Issued on Distributions Reinvested | | | 1,168 | | | | 584 | | |
Shares Redeemed | | | (17,931 | ) | | | (34,381 | ) | |
Net Decrease in Class A Shares Outstanding | | | (12,003 | ) | | | (10,473 | ) | |
Class L: | |
Shares Exchanged | | | 7 | | | | 17 | | |
Shares Issued on Distributions Reinvested | | | 5 | | | | 1 | | |
Shares Redeemed | | | (97 | ) | | | (141 | ) | |
Net Decrease in Class L Shares Outstanding | | | (85 | ) | | | (123 | ) | |
Class C: | |
Shares Subscribed | | | 16 | | | | 36 | | |
Shares Issued on Distributions Reinvested | | | — | @@ | | | — | @@ | |
Shares Redeemed | | | (11 | ) | | | (28 | ) | |
Net Increase in Class C Shares Outstanding | | | 5 | | | | 8 | | |
Class IS: | |
Shares Subscribed | | | 12,066 | | | | 24,017 | | |
Shares Issued on Distributions Reinvested | | | 1,267 | | | | 765 | | |
Shares Redeemed | | | (17,169 | ) | | | (10,253 | ) | |
Net Increase (Decrease) in Class IS Shares Outstanding | | | (3,836 | ) | | | 14,529 | | |
@@ Amount is less than 500 shares.
The accompanying notes are an integral part of the financial statements.
14
Morgan Stanley Institutional Fund, Inc.
Annual Report — December 31, 2017
Financial Highlights
International Equity Portfolio
| | | Class I | |
| | | Year Ended December 31, | |
Selected Per Share Data and Ratios | | 2017 | | 2016(1) | | 2015 | | 2014 | | 2013 | |
Net Asset Value, Beginning of Period | | $ | 14.64 | | | $ | 15.10 | | | $ | 15.47 | | | $ | 16.98 | | | $ | 14.35 | | |
Income (Loss) from Investment Operations: | |
Net Investment Income(2) | | | 0.26 | | | | 0.27 | | | | 0.30 | | | | 0.39 | | | | 0.32 | | |
Net Realized and Unrealized Gain (Loss) | | | 3.41 | | | | (0.57 | ) | | | (0.23 | ) | | | (1.42 | ) | | | 2.59 | | |
Total from Investment Operations | | | 3.67 | | | | (0.30 | ) | | | 0.07 | | | | (1.03 | ) | | | 2.91 | | |
Distributions from and/or in Excess of: | |
Net Investment Income | | | (0.34 | ) | | | (0.16 | ) | | | (0.44 | ) | | | (0.48 | ) | | | (0.28 | ) | |
Redemption Fees | | | 0.00 | (3) | | | 0.00 | (3) | | | 0.00 | (3) | | | 0.00 | (3) | | | 0.00 | (3) | |
Net Asset Value, End of Period | | $ | 17.97 | | | $ | 14.64 | | | $ | 15.10 | | | $ | 15.47 | | | $ | 16.98 | | |
Total Return(4) | | | 25.17 | % | | | (2.00 | )% | | | 0.36 | % | | | (6.08 | )% | | | 20.39 | % | |
Ratios and Supplemental Data: | |
Net Assets, End of Period (Thousands) | | $ | 1,691,807 | | | $ | 1,719,699 | | | $ | 2,073,782 | | | $ | 2,620,040 | | | $ | 3,694,164 | | |
Ratio of Expenses to Average Net Assets(7) | | | 0.95 | %(5) | | | 0.95 | %(5) | | | 0.95 | %(5) | | | 0.95 | %(5) | | | 0.94 | %(5) | |
Ratio of Expenses to Average Net Assets Excluding Non Operating Expenses | | | N/A | | | | 0.95 | %(5) | | | 0.95 | %(5) | | | 0.95 | %(5) | | | 0.95 | %(5) | |
Ratio of Net Investment Income to Average Net Assets(7) | | | 1.54 | %(5) | | | 1.86 | %(5) | | | 1.85 | %(5) | | | 2.33 | %(5) | | | 2.04 | %(5) | |
Ratio of Rebate from Morgan Stanley Affiliates to Average Net Assets | | | 0.00 | %(6) | | | 0.00 | %(6) | | | 0.00 | %(6) | | | 0.00 | %(6) | | | 0.00 | %(6) | |
Portfolio Turnover Rate | | | 18 | % | | | 33 | % | | | 29 | % | | | 29 | % | | | 29 | % | |
(7) Supplemental Information on the Ratios to Average Net Assets: | |
Ratios Before Expense Limitation: | |
Expenses to Average Net Assets | | | 0.99 | % | | | 0.98 | % | | | 1.01 | % | | | 1.04 | % | | | 0.99 | % | |
Net Investment Income to Average Net Assets | | | 1.50 | % | | | 1.83 | % | | | 1.79 | % | | | 2.24 | % | | | 1.99 | % | |
(1) Reflects prior period custodian out-of-pocket expenses that were reimbursed in September 2016. The amount of the reimbursement was immaterial on a per share basis and did not impact the total return of Class I shares. The Ratio of Expenses to Average Net Assets and the Ratio of Net Investment Income to Average Net Assets would be unchanged as the reimbursement of custodian fees was offset against expense waivers/reimbursements with no impact to net expenses or net investment income.
(2) Per share amount is based on average shares outstanding.
(3) Amount is less than $0.005 per share.
(4) Calculated based on the net asset value as of the last business day of the period.
(5) The Ratios of Expenses and Net Investment Income reflect the rebate of certain Fund expenses in connection with the investments in Morgan Stanley affiliates during the period. The effect of the rebate on the ratios is disclosed in the above table as "Ratio of Rebate from Morgan Stanley Affiliates to Average Net Assets."
(6) Amount is less than 0.005%.
The accompanying notes are an integral part of the financial statements.
15
Morgan Stanley Institutional Fund, Inc.
Annual Report — December 31, 2017
Financial Highlights
International Equity Portfolio
| | | Class A | |
| | | Year Ended December 31, | |
Selected Per Share Data and Ratios | | 2017 | | 2016(1) | | 2015 | | 2014 | | 2013 | |
Net Asset Value, Beginning of Period | | $ | 14.46 | | | $ | 14.91 | | | $ | 15.28 | | | $ | 16.78 | | | $ | 14.18 | | |
Income (Loss) from Investment Operations: | |
Net Investment Income(2) | | | 0.19 | | | | 0.23 | | | | 0.24 | | | | 0.31 | | | | 0.25 | | |
Net Realized and Unrealized Gain (Loss) | | | 3.38 | | | | (0.58 | ) | | | (0.23 | ) | | | (1.38 | ) | | | 2.59 | | |
Total from Investment Operations | | | 3.57 | | | | (0.35 | ) | | | 0.01 | | | | (1.07 | ) | | | 2.84 | | |
Distributions from and/or in Excess of: | |
Net Investment Income | | | (0.28 | ) | | | (0.10 | ) | | | (0.38 | ) | | | (0.43 | ) | | | (0.24 | ) | |
Redemption Fees | | | 0.00 | (3) | | | 0.00 | (3) | | | 0.00 | (3) | | | 0.00 | (3) | | | 0.00 | (3) | |
Net Asset Value, End of Period | | $ | 17.75 | | | $ | 14.46 | | | $ | 14.91 | | | $ | 15.28 | | | $ | 16.78 | | |
Total Return(4) | | | 24.77 | % | | | (2.33 | )% | | | (0.02 | )% | | | (6.43 | )% | | | 20.13 | % | |
Ratios and Supplemental Data: | |
Net Assets, End of Period (Thousands) | | $ | 1,231,279 | | | $ | 1,176,835 | | | $ | 1,369,566 | | | $ | 1,576,475 | | | $ | 1,508,564 | | |
Ratio of Expenses to Average Net Assets(8) | | | 1.30 | %(5) | | | 1.29 | %(5) | | | 1.30 | %(5) | | | 1.30 | %(5) | | | 1.22 | %(5)(6) | |
Ratio of Expenses to Average Net Assets Excluding Non Operating Expenses | | | N/A | | | | 1.29 | %(5) | | | 1.30 | %(5) | | | 1.30 | %(5) | | | 1.22 | %(5)(6) | |
Ratio of Net Investment Income to Average Net Assets(8) | | | 1.16 | %(5) | | | 1.60 | %(5) | | | 1.48 | %(5) | | | 1.89 | %(5) | | | 1.60 | %(5) | |
Ratio of Rebate from Morgan Stanley Affiliates to Average Net Assets | | | 0.00 | %(7) | | | 0.01 | % | | | 0.00 | %(7) | | | 0.00 | %(7) | | | 0.00 | %(7) | |
Portfolio Turnover Rate | | | 18 | % | | | 33 | % | | | 29 | % | | | 29 | % | | | 29 | % | |
(8) Supplemental Information on the Ratios to Average Net Assets: | |
Ratios Before Expense Limitation: | |
Expenses to Average Net Assets | | | 1.31 | % | | | 1.30 | % | | | 1.32 | % | | | 1.34 | % | | | 1.25 | % | |
Net Investment Income to Average Net Assets | | | 1.15 | % | | | 1.59 | % | | | 1.46 | % | | | 1.85 | % | | | 1.57 | % | |
(1) Reflects prior period custodian out-of-pocket expenses that were reimbursed in September 2016. The amount of the reimbursement was immaterial on a per share basis and did not impact the total return of Class A shares. The Ratio of Expenses to Average Net Assets would have been less than 0.005% higher and the Ratio of Net Investment Income to Average Net Assets would have been less than 0.005% lower had the custodian not reimbursed the Fund.
(2) Per share amount is based on average shares outstanding.
(3) Amount is less than $0.005 per share.
(4) Calculated based on the net asset value which does not reflect sales charges, if applicable, as of the last business day of the period.
(5) The Ratios of Expenses and Net Investment Income reflect the rebate of certain Fund expenses in connection with the investments in Morgan Stanley affiliates during the period. The effect of the rebate on the ratios is disclosed in the above table as "Ratio of Rebate from Morgan Stanley Affiliates to Average Net Assets."
(6) Effective September 16, 2013, the Adviser has agreed to limit the ratio of expenses to average net assets to the maximum ratio of 1.30% for Class A shares. Prior to September 16, 2013, the maximum ratio was 1.20% for Class A shares.
(7) Amount is less than 0.005%.
The accompanying notes are an integral part of the financial statements.
16
Morgan Stanley Institutional Fund, Inc.
Annual Report — December 31, 2017
Financial Highlights
International Equity Portfolio
| | | Class L | |
| | | Year Ended December 31, | |
Selected Per Share Data and Ratios | | 2017 | | 2016(1) | | 2015 | | 2014 | | 2013 | |
Net Asset Value, Beginning of Period | | $ | 14.43 | | | $ | 14.87 | | | $ | 15.23 | | | $ | 16.71 | | | $ | 14.12 | | |
Income (Loss) from Investment Operations: | |
Net Investment Income(2) | | | 0.11 | | | | 0.16 | | | | 0.15 | | | | 0.24 | | | | 0.19 | | |
Net Realized and Unrealized Gain (Loss) | | | 3.35 | | | | (0.58 | ) | | | (0.21 | ) | | | (1.39 | ) | | | 2.55 | | |
Total from Investment Operations | | | 3.46 | | | | (0.42 | ) | | | (0.06 | ) | | | (1.15 | ) | | | 2.74 | | |
Distributions from and/or in Excess of: | |
Net Investment Income | | | (0.19 | ) | | | (0.02 | ) | | | (0.30 | ) | | | (0.33 | ) | | | (0.15 | ) | |
Redemption Fees | | | 0.00 | (3) | | | 0.00 | (3) | | | 0.00 | (3) | | | 0.00 | (3) | | | 0.00 | (3) | |
Net Asset Value, End of Period | | $ | 17.70 | | | $ | 14.43 | | | $ | 14.87 | | | $ | 15.23 | | | $ | 16.71 | | |
Total Return(4) | | | 24.06 | % | | | (2.82 | )% | | | (0.47 | )% | | | (6.91 | )% | | | 19.49 | % | |
Ratios and Supplemental Data: | |
Net Assets, End of Period (Thousands) | | $ | 7,099 | | | $ | 7,008 | | | $ | 9,053 | | | $ | 9,763 | | | $ | 12,072 | | |
Ratio of Expenses to Average Net Assets(8) | | | 1.80 | %(5) | | | 1.80 | %(5) | | | 1.80 | %(5) | | | 1.80 | %(5) | | | 1.72 | %(5)(6) | |
Ratio of Expenses to Average Net Assets Excluding Non Operating Expenses | | | N/A | | | | 1.80 | %(5) | | | 1.80 | %(5) | | | 1.80 | %(5) | | | 1.73 | %(5)(6) | |
Ratio of Net Investment Income to Average Net Assets(8) | | | 0.69 | %(5) | | | 1.09 | %(5) | | | 0.97 | %(5) | | | 1.48 | %(5) | | | 1.24 | %(5) | |
Ratio of Rebate from Morgan Stanley Affiliates to Average Net Assets | | | 0.00 | %(7) | | | 0.00 | %(7) | | | 0.00 | %(7) | | | 0.00 | %(7) | | | 0.00 | %(7) | |
Portfolio Turnover Rate | | | 18 | % | | | 33 | % | | | 29 | % | | | 29 | % | | | 29 | % | |
(8) Supplemental Information on the Ratios to Average Net Assets: | |
Ratios Before Expense Limitation: | |
Expenses to Average Net Assets | | | 1.90 | % | | | 1.93 | % | | | 1.89 | % | | | 1.89 | % | | | 1.78 | % | |
Net Investment Income to Average Net Assets | | | 0.59 | % | | | 0.96 | % | | | 0.88 | % | | | 1.38 | % | | | 1.18 | % | |
(1) Reflects prior period custodian out-of-pocket expenses that were reimbursed in September 2016. The amount of the reimbursement was immaterial on a per share basis and did not impact the total return of Class L shares. The Ratio of Expenses to Average Net Assets and the Ratio of Net Investment Income to Average Net Assets would be unchanged as the reimbursement of custodian fees was offset against expense waivers/reimbursements with no impact to net expenses or net investment income.
(2) Per share amount is based on average shares outstanding.
(3) Amount is less than $0.005 per share.
(4) Calculated based on the net asset value as of the last business day of the period.
(5) The Ratios of Expenses and Net Investment Income reflect the rebate of certain Fund expenses in connection with the investments in Morgan Stanley affiliates during the period. The effect of the rebate on the ratios is disclosed in the above table as "Ratio of Rebate from Morgan Stanley Affiliates to Average Net Assets."
(6) Effective September 16, 2013, the Adviser has agreed to limit the ratio of expenses to average net assets to the maximum ratio of 1.80% for Class L shares. Prior to September 16, 2013, the maximum ratio was 1.70% for Class L shares.
(7) Amount is less than 0.005%.
The accompanying notes are an integral part of the financial statements.
17
Morgan Stanley Institutional Fund, Inc.
Annual Report — December 31, 2017
Financial Highlights
International Equity Portfolio
| | | Class C | |
| | | Year Ended December 31, | | Period from
April 30, 2015(2) to | |
Selected Per Share Data and Ratios | | 2017 | | 2016(1) | | December 31, 2015 | |
Net Asset Value, Beginning of Period | | $ | 14.31 | | | $ | 14.77 | | | $ | 16.70 | | |
Income (Loss) from Investment Operations: | |
Net Investment Income (Loss)(3) | | | 0.04 | | | | 0.14 | | | | (0.03 | ) | |
Net Realized and Unrealized Gain (Loss) | | | 3.35 | | | | (0.58 | ) | | | (1.53 | ) | |
Total from Investment Operations | | | 3.39 | | | | (0.44 | ) | | | (1.56 | ) | |
Distributions from and/or in Excess of: | |
Net Investment Income | | | (0.19 | ) | | | (0.02 | ) | | | (0.37 | ) | |
Redemption Fees | | | 0.00 | (4) | | | 0.00 | (4) | | | 0.00 | (4) | |
Net Asset Value, End of Period | | $ | 17.51 | | | $ | 14.31 | | | $ | 14.77 | | |
Total Return(5) | | | 23.78 | % | | | (3.01 | )% | | | (9.41 | )%(8) | |
Ratios and Supplemental Data: | |
Net Assets, End of Period (Thousands) | | $ | 677 | | | $ | 476 | | | $ | 372 | | |
Ratio of Expenses to Average Net Assets(10) | | | 2.05 | %(6) | | | 2.05 | %(6) | | | 2.05 | %(6)(9) | |
Ratio of Expenses to Average Net Assets Excluding Non Operating Expenses | | | N/A | | | | 2.05 | %(6) | | | 2.05 | %(6)(9) | |
Ratio of Net Investment Income (Loss) to Average Net Assets(10) | | | 0.22 | %(6) | | | 0.95 | %(6) | | | (0.27 | )%(6)(9) | |
Ratio of Rebate from Morgan Stanley Affiliates to Average Net Assets | | | 0.00 | %(7) | | | 0.00 | %(7) | | | 0.00 | %(7)(9) | |
Portfolio Turnover Rate | | | 18 | % | | | 33 | % | | | 29 | % | |
(10) Supplemental Information on the Ratios to Average Net Assets: | |
Ratios Before Expense Limitation: | |
Expense to Average Net Assets | | | 2.41 | % | | | 2.40 | % | | | 2.75 | %(9) | |
Net Investment Income (Loss) to Average Net Assets | | | (0.14 | )% | | | 0.60 | % | | | (0.97 | )%(9) | |
(1) Reflects prior period custodian out-of-pocket expenses that were reimbursed in September 2016. The amount of the reimbursement was immaterial on a per share basis and did not impact the total return of Class C shares. The Ratio of Expenses to Average Net Assets and the Ratio of Net Investment Income to Average Net Assets would be unchanged as the reimbursement of custodian fees was offset against expense waivers/reimbursements with no impact to net expenses or net investment income.
(2) Commencement of Offering.
(3) Per share amount is based on average shares outstanding.
(4) Amount is less than $0.005 per share.
(5) Calculated based on the net asset value which does not reflect sales charges, if applicable, as of the last business day of the period.
(6) The Ratios of Expenses and Net Investment Income (Loss) reflect the rebate of certain Fund expenses in connection with the investments in Morgan Stanley affiliates during the period. The effect of the rebate on the ratios is disclosed in the above table as "Ratio of Rebate from Morgan Stanley Affiliates to Average Net Assets."
(7) Amount is less than 0.005%.
(8) Not annualized.
(9) Annualized.
The accompanying notes are an integral part of the financial statements.
18
Morgan Stanley Institutional Fund, Inc.
Annual Report — December 31, 2017
Financial Highlights
International Equity Portfolio
| | | Class IS | |
| | | Year Ended December 31, | | Period from
September 13, 2013(2) to | |
Selected Per Share Data and Ratios | | 2017 | | 2016(1) | | 2015 | | 2014 | | December 31, 2013 | |
Net Asset Value, Beginning of Period | | $ | 14.64 | | | $ | 15.10 | | | $ | 15.47 | | | $ | 16.98 | | | $ | 16.08 | | |
Income (Loss) from Investment Operations: | |
Net Investment Income (Loss)(3) | | | 0.26 | | | | 0.29 | | | | 0.30 | | | | 0.40 | | | | (0.01 | ) | |
Net Realized and Unrealized Gain (Loss) | | | 3.42 | | | | (0.59 | ) | | | (0.23 | ) | | | (1.43 | ) | | | 1.19 | | |
Total from Investment Operations | | | 3.68 | | | | (0.30 | ) | | | 0.07 | | | | (1.03 | ) | | | 1.18 | | |
Distributions from and/or in Excess of: | |
Net Investment Income | | | (0.35 | ) | | | (0.16 | ) | | | (0.44 | ) | | | (0.48 | ) | | | (0.28 | ) | |
Redemption Fees | | | 0.00 | (4) | | | 0.00 | (4) | | | 0.00 | (4) | | | 0.00 | (4) | | | 0.00 | (4) | |
Net Asset Value, End of Period | | $ | 17.97 | | | $ | 14.64 | | | $ | 15.10 | | | $ | 15.47 | | | $ | 16.98 | | |
Total Return(5) | | | 25.22 | % | | | (1.95 | )% | | | 0.40 | % | | | (6.07 | )% | | | 7.42 | %(9) | |
Ratios and Supplemental Data: | |
Net Assets, End of Period (Thousands) | | $ | 1,230,104 | | | $ | 1,058,165 | | | $ | 872,167 | | | $ | 715,262 | | | $ | 285,253 | | |
Ratio of Expenses to Average Net Assets(11) | | | 0.91 | %(6) | | | 0.91 | %(6) | | | 0.91 | %(6) | | | 0.91 | %(6) | | | 0.91 | %(6)(7)(10) | |
Ratio of Expenses to Average Net Assets Excluding Non Operating
Expenses | | | N/A | | | | 0.91 | %(6) | | | 0.91 | %(6) | | | 0.91 | %(6) | | | 0.91 | %(6)(7)(10) | |
Ratio of Net Investment Income (Loss) to Average Net Assets(11) | | | 1.52 | %(6) | | | 1.96 | %(6) | | | 1.84 | %(6) | | | 2.36 | %(6) | | | (0.29 | )%(6)(10) | |
Ratio of Rebate from Morgan Stanley Affiliates to Average Net Assets | | | 0.00 | %(8) | | | 0.00 | %(8) | | | 0.00 | %(8) | | | 0.00 | %(8) | | | 0.00 | %(8)(10) | |
Portfolio Turnover Rate | | | 18 | % | | | 33 | % | | | 29 | % | | | 29 | % | | | 29 | % | |
(11) Supplemental Information on the Ratios to Average Net Assets: | |
Ratios Before Expense Limitation: | |
Expenses to Average Net Assets | | | 0.91 | % | | | 0.91 | % | | | 0.91 | % | | | 0.91 | % | | | 0.91 | %(10) | |
Net Investment Income (Loss) to Average Net Assets | | | 1.52 | % | | | 1.96 | % | | | 1.84 | % | | | 2.36 | % | | | (0.29 | )%(10) | |
(1) Reflects prior period custodian out-of-pocket expenses that were reimbursed in September 2016. The amount of the reimbursement was immaterial on a per share basis and did not impact the total return of Class IS shares. The Ratio of Expenses to Average Net Assets would have been less than 0.005% higher and the Ratio of Net Investment Income to Average Net Assets would have been less than 0.005% lower had the custodian not reimbursed the Fund.
(2) Commencement of Offering.
(3) Per share amount is based on average shares outstanding.
(4) Amount is less than $0.005 per share.
(5) Calculated based on the net asset value as of the last business day of the period.
(6) The Ratios of Expenses and Net Investment Income (Loss) reflect the rebate of certain Fund expenses in connection with the investments in Morgan Stanley affiliates during the period. The effect of the rebate on the ratios is disclosed in the above table as "Ratio of Rebate from Morgan Stanley Affiliates to Average Net Assets."
(7) Effective September 16, 2013, the Adviser has agreed to limit the ratio of expenses to average net assets to the maximum ratio of 0.91% for class IS shares.
(8) Amount is less than 0.005%.
(9) Not annualized.
(10) Annualized.
The accompanying notes are an integral part of the financial statements.
19
Morgan Stanley Institutional Fund, Inc.
Annual Report — December 31, 2017
Notes to Financial Statements
Morgan Stanley Institutional Fund, Inc. (the "Company") is registered under the Investment Company Act of 1940, as amended (the "Act"), as an open-end management investment company. The Company is comprised of twenty-nine separate, active, diversified and non-diversified funds (individually referred to as a "Fund", collectively as the "Funds"). The Company applies investment company accounting and reporting guidance.
The accompanying financial statements relate to the International Equity Portfolio. The Fund seeks long-term capital appreciation by investing primarily in equity securities of non-U.S. issuers.
During the year ended December 31, 2017, Morgan Stanley Investment Management Company ("MSIM Company") served as the Sub-Adviser to the Fund. Effective December 31, 2017, MSIM Company is no longer a Sub-Adviser to the Fund.
The Fund offers five classes of shares — Class I, Class A, Class L, Class C and Class IS. On April 30, 2015, the Fund suspended offering of Class L shares. Existing Class L shareholders may invest through reinvestment of dividends and distributions.
A. Significant Accounting Policies: The following significant accounting policies are in conformity with U.S. generally accepted accounting principles ("GAAP"). Such policies are consistently followed by the Company in the preparation of its financial statements. GAAP may require management to make estimates and assumptions that affect the reported amounts and disclosures in the financial statements. Actual results may differ from those estimates.
1. Security Valuation: (1) An equity portfolio security listed or traded on an exchange is valued at its latest reported sales price (or at the exchange official closing price if such exchange reports an official closing price), and if there were no sales on a given day and if there is no official exchange closing price for that day, the security is valued at the mean between the last reported bid and asked prices if such bid and asked prices are available on the relevant exchanges. Listed equity securities not traded on the valuation date with no reported bid and asked prices available on the exchange are valued at the mean between the current bid and asked prices obtained from one or more reputable brokers or dealers. In cases where a security is traded on more than one exchange, the security is valued on the exchange designated as the primary market; (2) all other equity portfolio securities for which over-the-counter ("OTC") market quotations are readily available are valued at the latest reported sales price (or at the market official closing price if such market reports an official closing price), and if there was no trading in the
security on a given day and if there is no official closing price from relevant markets for that day, the security is valued at the mean between the last reported bid and asked prices if such bid and asked prices are available on the relevant markets. An unlisted equity security that does not trade on the valuation date and for which bid and asked prices from the relevant markets are unavailable is valued at the mean between the current bid and asked prices obtained from one or more reputable brokers or dealers; (3) certain portfolio securities may be valued by an outside pricing service/vendor approved by the Company's Board of Directors (the "Directors"). The pricing service/vendor may employ a pricing model that takes into account, among other things, bids, yield spreads, and/or other market data and specific security characteristics. Alternatively, if a valuation is not available from an outside pricing service/vendor, and the security trades on an exchange, the security may be valued at its latest reported sale price (or at the exchange official closing price if such exchange reports an official closing price), prior to the time when assets are valued. If there are no sales on a given day and if there is no official exchange closing price for that day, the security is valued at the mean between the last reported bid and asked prices if such bid and asked prices are available in the relevant exchanges; (4) when market quotations are not readily available, including circumstances under which Morgan Stanley Investment Management Inc. (the "Adviser") or Morgan Stanley Investment Management Limited ("MSIM Limited") and Morgan Stanley Investment Management Company ("MSIM Company") (together, the "Sub-Advisers"), each a wholly-owned subsidiary of Morgan Stanley, determine that the closing price, last sale price or the mean between the last reported bid and asked prices are not reflective of a security's market value, portfolio securities are valued at their fair value as determined in good faith under procedures established by and under the general supervision of the Directors. Occasionally, developments affecting the closing prices of securities and other assets may occur between the times at which valuations of such securities are determined (that is, close of the foreign market on which the securities trade) and the close of business of the New York Stock Exchange ("NYSE"). If developments occur during such periods that are expected to materially affect the value of such securities, such valuations may be adjusted to reflect the estimated fair value of such securities as of the close of the NYSE, as determined in good faith by the Directors or by the Adviser using a pricing service and/or procedures approved by the Directors; (5) quotations of foreign portfolio securities,
20
Morgan Stanley Institutional Fund, Inc.
Annual Report — December 31, 2017
Notes to Financial Statements (cont'd)
other assets and liabilities and forward contracts stated in foreign currency are translated into U.S. dollar equivalents at the prevailing market rates prior to the close of the NYSE; and (6) investments in mutual funds, including the Morgan Stanley Institutional Liquidity Funds, are valued at the net asset value ("NAV") as of the close of each business day.
The Directors have responsibility for determining in good faith the fair value of the investments, and the Directors may appoint others, such as the Company's Adviser or a valuation committee, to assist the Directors in determining fair value and to make the actual calculations pursuant to the fair valuation methodologies previously approved by the Directors. Under procedures approved by the Directors, the Company's Adviser has formed a Valuation Committee whose members are approved by the Directors. The Valuation Committee provides administration and oversight of the Company's valuation policies and procedures, which are reviewed at least annually by the Directors. These procedures allow the Company to utilize independent pricing services, quotations from securities and financial instrument dealers, and other market sources to determine fair value.
The Company has procedures to determine the fair value of securities and other financial instruments for which market prices are not readily available. Under these procedures, the Valuation Committee convenes on a regular and ad hoc basis to review such securities and considers a number of factors, including valuation methodologies and significant unobservable valuation inputs, when arriving at fair value. The Valuation Committee may employ a market-based approach which may use related or comparable assets or liabilities, recent transactions, market multiples, book values, and other relevant information for the investment to determine the fair value of the investment. An income-based valuation approach may also be used in which the anticipated future cash flows of the investment are discounted to calculate fair value. Discounts may also be applied due to the nature or duration of any restrictions on the disposition of the investments. Due to the inherent uncertainty of valuations of such investments, the fair values may differ significantly from the values that would have been used had an active market existed. The Valuation Committee employs various methods for calibrating these valuation approaches including a regular review of valuation methodologies, key inputs and assumptions,
transactional back-testing or disposition analysis, and reviews of any related market activity.
2. Fair Value Measurement: Financial Accounting Standards Board ("FASB") Accounting Standards CodificationTM ("ASC") 820, "Fair Value Measurement" ("ASC 820"), defines fair value as the value that the Fund would receive to sell an investment or pay to transfer a liability in a timely transaction with an independent buyer in the principal market, or in the absence of a principal market, the most advantageous market for the investment or liability. ASC 820 establishes a three-tier hierarchy to distinguish between (1) inputs that reflect the assumptions market participants would use in valuing an asset or liability developed based on market data obtained from sources independent of the reporting entity (observable inputs) and (2) inputs that reflect the reporting entity's own assumptions about the assumptions market participants would use in valuing an asset or liability developed based on the best information available in the circumstances (unobservable inputs) and to establish classification of fair value measurements for disclosure purposes. Various inputs are used in determining the value of the Fund's investments. The inputs are summarized in the three broad levels listed below.
• Level 1 – unadjusted quoted prices in active markets for identical investments
• Level 2 – other significant observable inputs (including quoted prices for similar investments, interest rates, prepayment speeds, credit risk, etc.)
• Level 3 – significant unobservable inputs including the Fund's own assumptions in determining the fair value of investments. Factors considered in making this determination may include, but are not limited to, information obtained by contacting the issuer, analysts, or the appropriate stock exchange (for exchange-traded securities), analysis of the issuer's financial statements or other available documents and, if necessary, available information concerning other securities in similar circumstances
The inputs or methodology used for valuing securities are not necessarily an indication of the risk associated with investing in those securities and the determination of the significance of a particular input to the fair value measurement in its entirety requires judgment and considers factors specific to each security.
21
Morgan Stanley Institutional Fund, Inc.
Annual Report — December 31, 2017
Notes to Financial Statements (cont'd)
The following is a summary of the inputs used to value the Fund's investments as of December 31, 2017.
Investment Type | | Level 1
Unadjusted
quoted
prices
(000) | | Level 2
Other
significant
observable
inputs
(000) | | Level 3
Significant
unobservable
inputs
(000) | | Total
(000) | |
Assets: | |
Common Stocks | |
Aerospace & Defense | | $ | — | | | $ | 98,203 | | | $ | — | | | $ | 98,203 | | |
Auto Components | | | — | | | | 61,292 | | | | — | | | | 61,292 | | |
Automobiles | | | — | | | | 52,964 | | | | — | | | | 52,964 | | |
Banks | | | — | | | | 164,998 | | | | — | | | | 164,998 | | |
Beverages | | | — | | | | 294,746 | | | | — | | | | 294,746 | | |
Capital Markets | | | — | | | | 42,240 | | | | — | | | | 42,240 | | |
Chemicals | | | — | | | | 55,020 | | | | — | | | | 55,020 | | |
Commercial Services &
Supplies | | | — | | | | 34,717 | | | | — | | | | 34,717 | | |
Construction Materials | | | — | | | | 52,184 | | | | — | | | | 52,184 | | |
Diversified
Telecommunication
Services | | | — | | | | 61,986 | | | | — | | | | 61,986 | | |
Electronic Equipment,
Instruments &
Components | | | — | | | | 100,322 | | | | — | | | | 100,322 | | |
Food Products | | | — | | | | 34,804 | | | | — | | | | 34,804 | | |
Household Products | | | — | | | | 200,319 | | | | — | | | | 200,319 | | |
Insurance | | | — | | | | 349,622 | | | | — | | | | 349,622 | | |
Internet Software &
Services | | | — | | | | 124,290 | | | | — | | | | 124,290 | | |
Machinery | | | — | | | | 149,125 | | | | — | | | | 149,125 | | |
Media | | | — | | | | 32,765 | | | | — | | | | 32,765 | | |
Metals & Mining | | | 97,028 | | | | — | | | | — | | | | 97,028 | | |
Oil, Gas & Consumable
Fuels | | | — | | | | 116,608 | | | | — | | | | 116,608 | | |
Personal Products | | | — | | | | 535,604 | | | | — | | | | 535,604 | | |
Pharmaceuticals | | | — | | | | 603,014 | | | | — | | | | 603,014 | | |
Professional Services | | | — | | | | 209,349 | | | | — | | | | 209,349 | | |
Real Estate
Management &
Development | | | — | | | | 19,082 | | | | — | | | | 19,082 | | |
Software | | | 32,061 | | | | 163,575 | | | | — | | | | 195,636 | | |
Specialty Retail | | | — | | | | 28,809 | | | | — | | | | 28,809 | | |
Tobacco | | | — | | | | 228,370 | | | | — | | | | 228,370 | | |
Trading Companies &
Distributors | | | — | | | | 123,346 | | | | — | | | | 123,346 | | |
Total Common
Stocks | | | 129,089 | | | | 3,937,354 | | | | — | | | | 4,066,443 | | |
Short-Term Investments | |
Investment Company | | | 91,984 | | | | — | | | | — | | | | 91,984 | | |
Repurchase
Agreements | | | — | | | | 159 | | | | — | | | | 159 | | |
Total Short-Term
Investments | | | 91,984 | | | | 159 | | | | — | | | | 92,143 | | |
Total Assets | | | 221,073 | | | | 3,937,513 | | | | — | | | | 4,158,586 | | |
Liabilities: | |
Foreign Currency
Forward Exchange
Contract | | | — | | | | (777 | ) | | | — | | | | (777 | ) | |
Total | | $ | 221,073 | | | $ | 3,936,736 | | | $ | — | | | $ | 4,157,809 | | |
Transfers between investment levels may occur as the markets fluctuate and/or the availability of data used in an
investment's valuation changes. The Fund recognizes transfers between the levels as of the end of the period. As of December 31, 2017, securities with a total value of approximately $3,557,348,000 transferred from Level 1 to Level 2. Securities that were valued using unadjusted quoted prices at December 31, 2016 were valued using other significant observable inputs at December 31, 2017. At December 31, 2017, the fair value of certain securities were adjusted due to developments which occurred between the time of the close of the foreign markets on which they trade and the close of business on the NYSE which resulted in their Level 2 classification.
3. Repurchase Agreements: The Fund may enter into repurchase agreements under which the Fund lends cash and takes possession of securities with an agreement that the counterparty will repurchase such securities. In connection with transactions in repurchase agreements, a bank as custodian for the Fund takes possession of the underlying securities which are held as collateral, with a market value at least equal to the amount of the repurchase transaction, including principal and accrued interest. To the extent that any repurchase transaction exceeds one business day, the value of the collateral is marked-to-market on a daily basis to determine that the value of the collateral does not decrease below the repurchase price plus accrued interest as earned. If such a decrease occurs, additional collateral will be requested and, when received, will be added to the account to maintain full collateralization. In the event of default on the obligation to repurchase, the Fund has the right to liquidate the collateral and apply the proceeds in satisfaction of the obligation. In the event of default or bankruptcy by the counterparty to the agreement, realization of the collateral proceeds may be subject to cost and delays. The Fund, along with other affiliated investment companies, may utilize a joint trading account for the purpose of entering into repurchase agreements.
4. Foreign Currency Translation and Foreign Investments: The books and records of the Fund are maintained in U.S. dollars. Foreign currency amounts are translated into U.S. dollars as follows:
– investments, other assets and liabilities at the prevailing rate of exchange on the valuation date;
– investment transactions and investment income at the prevailing rates of exchange on the dates of such transactions.
22
Morgan Stanley Institutional Fund, Inc.
Annual Report — December 31, 2017
Notes to Financial Statements (cont'd)
Although the net assets of the Fund are presented at the foreign exchange rates and market values at the close of the period, the Fund does not isolate that portion of the results of operations arising as a result of changes in the foreign exchange rates from the fluctuations arising from changes in the market prices of securities held at period end. Similarly, the Fund does not isolate the effect of changes in foreign exchange rates from the fluctuations arising from changes in the market prices of securities sold during the period. Accordingly, realized and unrealized foreign currency gains (losses) on investments in securities are included in the reported net realized and unrealized gains (losses) on investment transactions and balances. However, pursuant to U.S. federal income tax regulations, gains and losses from certain foreign currency transactions and the foreign currency portion of gains and losses realized on sales and maturities of foreign denominated debt securities are treated as ordinary income for U.S. federal income tax purposes.
Net realized gains (losses) on foreign currency transactions represent net foreign exchange gains (losses) from foreign currency forward exchange contracts, disposition of foreign currencies, currency gains (losses) realized between the trade and settlement dates on securities transactions, and the difference between the amount of investment income and foreign withholding taxes recorded on the Fund's books and the U.S. dollar equivalent amounts actually received or paid. Net unrealized currency gains (losses) from valuing foreign currency denominated assets and liabilities at period end exchange rates are reflected as a component of unrealized appreciation (depreciation) in the Statement of Assets and Liabilities. The change in unrealized currency gains (losses) on foreign currency translations for the period is reflected in the Statement of Operations.
Foreign security and currency transactions may involve certain considerations and risks not typically associated with those of U.S. dollar denominated transactions as a result of, among other factors, fluctuations of exchange rates in relation to the U.S. dollar, the possibility of lower levels of governmental supervision and regulation of foreign securities markets and the possibility of political or economic instability.
Governmental approval for foreign investments may be required in advance of making an investment under certain circumstances in some countries, and the extent of
foreign investments in domestic companies may be subject to limitation in other countries. Foreign ownership limitations also may be imposed by the charters of individual companies to prevent, among other concerns, violations of foreign investment limitations. As a result, an additional class of shares (identified as "Foreign" in the Portfolio of Investments) may be created and offered for investment. The "local" and "foreign shares" market values may differ. In the absence of trading of the foreign shares in such markets, the Fund values the foreign shares at the closing exchange price of the local shares.
5. Derivatives: The Fund may, but is not required to, use derivative instruments for a variety of purposes, including hedging, risk management, portfolio management or to earn income. Derivatives are financial instruments whose value is based, in part, on the value of an underlying asset, interest rate, index or financial instrument. Prevailing interest rates and volatility levels, among other things, also affect the value of derivative instruments. A derivative instrument often has risks similar to its underlying asset and may have additional risks, including imperfect correlation between the value of the derivative and the underlying asset, risks of default by the counterparty to certain transactions, magnification of losses incurred due to changes in the market value of the securities, instruments, indices or interest rates to which the derivative instrument relates, risks that the transactions may not be liquid and risks arising from margin requirements. The use of derivatives involves risks that are different from, and possibly greater than, the risks associated with other portfolio investments. Derivatives may involve the use of highly specialized instruments that require investment techniques and risk analyses different from those associated with other portfolio investments. All of the Fund's holdings, including derivative instruments, are marked-to-market each day with the change in value reflected in unrealized appreciation (depreciation). Upon disposition, a realized gain or loss is recognized.
Certain derivative transactions may give rise to a form of leverage. Leverage magnifies the potential for gain and the risk of loss. Leverage associated with derivative transactions may cause the Fund to liquidate portfolio positions when it may not be advantageous to do so to satisfy its obligations or to meet earmarking or segregation requirements, pursuant to applicable Securities and Exchange Commission ("SEC") rules and regulations, or
23
Morgan Stanley Institutional Fund, Inc.
Annual Report — December 31, 2017
Notes to Financial Statements (cont'd)
may cause the Fund to be more volatile than if the Fund had not been leveraged. Although the Adviser and/or Sub-Advisers seek to use derivatives to further the Fund's investment objectives, there is no assurance that the use of derivatives will achieve this result.
Following is a description of the derivative instruments and techniques that the Fund used during the period and their associated risks:
Foreign Currency Forward Exchange Contracts: In connection with its investments in foreign securities, the Fund also entered into contracts with banks, brokers or dealers to purchase or sell securities or foreign currencies at a future date. A foreign currency forward exchange contract ("currency contract") is a negotiated agreement between the contracting parties to exchange a specified amount of currency at a specified future time at a specified rate. The rate can be higher or lower than the spot rate between the currencies that are the subject of the contract. Currency contracts may be used to protect against uncertainty in the level of future foreign currency exchange rates or to gain or modify exposure to a particular currency. To the extent hedged by the use of currency contracts, the precise matching of the currency contract amounts and the value of the securities involved will not generally be possible because the future value of such securities in foreign currencies will change as a consequence of market movements in the value of those securities between the date on which the contract is entered into and the date it matures. Furthermore, such transactions may reduce or preclude the opportunity for gain if the value of the currency should move in the direction opposite to the position taken. There is additional risk to the extent that currency contracts create exposure to currencies in which the Fund's securities are not denominated. Unanticipated changes in currency prices may result in poorer overall performance for the Fund than if it had not entered into such contracts. The use of currency contracts involves the risk of loss from the insolvency or bankruptcy of the counterparty to the contract or the failure of the counterparty to make payments or otherwise comply with the terms of the contract. A currency contract is marked-to-market daily and the change in market value is recorded by the Fund as unrealized gain or loss. The Fund records realized gains (losses) when the currency contract is closed equal to the difference between the value of the currency
contract at the time it was opened and the value at the time it was closed.
FASB ASC 815, "Derivatives and Hedging" ("ASC 815"), is intended to improve financial reporting about derivative instruments by requiring enhanced disclosures to enable investors to better understand how and why the Fund uses derivative instruments, how these derivative instruments are accounted for and their effects on the Fund's financial position and results of operations.
The following table sets forth the fair value of the Fund's derivative contracts by primary risk exposure as of December 31, 2017.
| | | Liability Derivatives
Statement of Assets and
Liabilities Location | | Primary Risk
Exposure | | Value
(000) | |
Foreign Currency Forward
Exchange Contract
| | Unrealized Depreciation on
Foreign Currency Forward
Exchange Contract | |
Currency Risk | | $ | (777 | ) | |
The following tables set forth by primary risk exposure the Fund's realized gains (losses) and change in unrealized appreciation (depreciation) by type of derivative contract for the year ended December 31, 2017 in accordance with ASC 815.
Realized Gain (Loss) | |
Primary Risk Exposure | | Derivative Type | | Value
(000) | |
Currency Risk | | Foreign Currency
Forward Exchange Contracts | | $ | (6,073 | ) | |
Change in Unrealized Appreciation (Depreciation) | |
Primary Risk Exposure | | Derivative Type | | Value
(000) | |
Currency Risk Foreign Currency
| | Forward Exchange Contracts | | $ | 1,529 | | |
At December 31, 2017, the Fund's derivative assets and liabilities are as follows:
Gross Amounts of Assets and Liabilities
Presented in the Statement of Assets and Liabilities | |
Derivatives(a) | | Assets(b)
(000) | | Liabilities(b)
(000) | |
Foreign Currency Forward Exchange Contract | | $ | — | | | $ | (777 | ) | |
(a) Excludes exchange traded derivatives.
(b) Absent an event of default or early termination, OTC derivative assets and liabilities are presented gross and not offset in the Statement of Assets and Liabilities.
The Fund typically enters into International Swaps and Derivatives Association, Inc. Master Agreements ("ISDA Master Agreements") or similar master agreements (collectively, "Master Agreements") with its contract counterparties for certain OTC derivatives in order to, among other things, reduce its credit risk to counterparties. ISDA Master Agreements include provisions for general obligations, representations, collateral and events of default or
24
Morgan Stanley Institutional Fund, Inc.
Annual Report — December 31, 2017
Notes to Financial Statements (cont'd)
termination. Under an ISDA Master Agreement, the Fund typically may offset with the counterparty certain OTC derivative financial instruments' payables and/or receivables with collateral held and/or posted and create one single net payment (close-out netting) in the event of default, termination and/or potential deterioration in the credit quality of the counterparty. Various Master Agreements govern the terms of certain transactions with counterparties, including transactions such as swap, forward, repurchase and reverse repurchase agreements. These Master Agreements typically attempt to reduce the counterparty risk associated with such transactions by specifying credit protection mechanisms and providing standardization that improves legal certainty. Cross-termination provisions under Master Agreements typically provide that a default in connection with one transaction between the Fund and a counterparty gives the non-defaulting party the right to terminate any other transactions in place with the defaulting party to create one single net payment due to/due from the defaulting party and may be a feature in certain Master Agreements. In the event the Fund exercises its right to terminate a Master Agreement after a counterparty experiences a termination event as defined in the Master Agreement, the return of collateral with market value in excess of the Fund's net liability may be delayed or denied.
The following table presents derivative financial instruments that are subject to enforceable netting arrangements as of December 31, 2017.
Gross Amounts Not Offset in the Statement of Assets and Liabilities | |
Counterparty | | Gross Liability
Derivatives
Presented in
Statement of
Assets and
Liabilities
(000) | | Financial
Instrument
(000) | | Collateral
Pledged
(000) | | Net
Amount
(not less
than $0)
(000) | |
Commonwealth Bank of Australia | | $ | 777 | | | $ | — | | | $ | — | | | $ | 777 | | |
For the year ended December 31, 2017, the approximate average monthly amount outstanding for each derivative type is as follows:
Foreign Currency Forward Exchange Contracts: | |
Average monthly principal amount | | $ | 227,016,000 | | |
6. Securities Lending: The Fund lends securities to qualified financial institutions, such as broker-dealers, to earn additional income. Any increase or decrease in the fair value of the securities loaned that might occur and any interest earned or dividends declared on those securities during the term of the loan would remain in the Fund. The Fund would receive cash or securities as collateral in an amount equal to or exceeding 100% of the
current fair value of the loaned securities. The collateral is marked-to-market daily by State Street Bank and Trust Company ("State Street"), the securities lending agent, to ensure that a minimum of 100% collateral coverage is maintained.
Based on pre-established guidelines, the securities lending agent invests any cash collateral that is received in an affiliated money market portfolio and repurchase agreements. Securities lending income is generated from the earnings on the invested collateral and borrowing fees, less any rebates owed to the borrowers and compensation to the lending agent, and is recorded as "Income from Securities Loaned — Net" in the Fund's Statement of Operations. Risks in securities lending transactions are that a borrower may not provide additional collateral when required or return the securities when due, and that the value of the short-term investments will be less than the amount of cash collateral plus any rebate that is required to be returned to the borrower.
The Fund has the right under the securities lending agreement to recover the securities from the borrower on demand.
The following table presents financial instruments that are subject to enforceable netting arrangements as of December 31, 2017.
Gross Amounts Not Offset in the Statement of Assets and Liabilities | |
Gross Asset
Amounts
Presented in
Statement of
Assets and
Liabilities
(000) | | Financial
Instrument
(000) | | Collateral
Received
(000) | | Net Amount
(not less
than $0)
(000) | |
| $ | 11,557 | (b) | | $ | — | | | $ | (11,557 | )(c)(d) | | $ | 0 | | |
(b) Represents market value of loaned securities at year end.
(c) The Fund received cash collateral of approximately $592,000, which was subsequently invested in Repurchase Agreements and Morgan Stanley Institutional Liquidity Funds as reported in the Portfolio of Investments. In addition, the Fund received non-cash collateral of approximately $11,532,000 in the form of U.S. Government obligations, which the Fund cannot sell or repledge, and accordingly are not reflected in the Portfolio of Investments.
(d) The actual collateral received is greater than the amount shown here due to overcollateralization.
FASB ASC 860 "Transfers & Servicing: Repurchase-to-Maturity Transactions, Repurchase Financings, and Disclosures", is intended to provide increased transparency about the types of collateral pledged in securities lending transactions and other similar transactions that are accounted for as secured borrowing.
25
Morgan Stanley Institutional Fund, Inc.
Annual Report — December 31, 2017
Notes to Financial Statements (cont'd)
The following table displays a breakdown of transactions accounted for as secured borrowings, the gross obligations by class of collateral pledged, and the remaining contractual maturity of those transactions as of December 31, 2017.
Remaining Contractual Maturity of the Agreements | |
| | | Overnight and
Continuous
(000) | | <30 days
(000) | | Between
30 &
90 days
(000) | | >90 days
(000) | | Total
(000) | |
Securities Lending
Transactions | |
Common Stocks | | $ | 592 | | | $ | — | | | $ | — | | | $ | — | | | $ | 592 | | |
Total Borrowings | | $ | 592 | | | $ | — | | | $ | — | | | $ | — | | | $ | 592 | | |
Gross amount of
recognized liabilities
for securities lending
transactions | | | | | | | | | | $ | 592 | | |
7. Redemption Fees: The Fund will assess a 2% redemption fee on Class I shares, Class A shares, Class L shares, Class C shares and Class IS shares, which is paid directly to the Fund, for shares redeemed or exchanged within thirty days of purchase, subject to certain exceptions. The redemption fee is designed to protect the Fund and its remaining shareholders from the effects of short-term trading. These fees, if any, are included in the Statements of Changes in Net Assets.
8. Indemnifications: The Company enters into contracts that contain a variety of indemnifications. The Company's maximum exposure under these arrangements is unknown. However, the Company has not had prior claims or losses pursuant to these contracts and expects the risk of loss to be remote.
9. Dividends and Distributions to Shareholders: Dividends and distributions to shareholders are recorded on the ex-dividend date. Dividends from net investment income, if any, are declared and paid annually. Net realized capital gains, if any, are distributed at least annually.
10. Security Transactions, Income and Expenses: Security transactions are accounted for on the trade date (date the order to buy or sell is executed). Realized gains and losses on the sale of investment securities are determined on the specific identified cost method. Dividend income and other distributions are recorded on the ex-dividend date (except for certain foreign dividends which may be recorded as soon as the Fund is informed of such dividends) net of applicable withholding taxes. Interest income is recognized on the accrual basis except
where collection is in doubt. Discounts are accreted and premiums are amortized over the life of the respective securities. Most expenses of the Company can be directly attributed to a particular Fund. Expenses which cannot be directly attributed are apportioned among the Funds based upon relative net assets or other appropriate methods. Income, expenses (other than class specific expenses — distribution and shareholder services, transfer agency and sub transfer agency fees) and realized and unrealized gains or losses are allocated to each class of shares based upon their relative net assets.
B. Advisory/Sub-Advisory Fees: The Adviser, a wholly-owned subsidiary of Morgan Stanley, provides the Fund with advisory services under the terms of an Investment Advisory Agreement, paid quarterly, at the annual rate based on the daily net assets as follows:
First $10
billion | | Over $10
billion | |
| | 0.80 | % | | | 0.75 | % | |
For the year ended December 31, 2017, the advisory fee rate (net of waiver/rebate) was equivalent to an annual effective rate of 0.79% of the Fund's average daily net assets.
The Adviser has agreed to reduce its advisory fee and/or reimburse the Fund so that total annual portfolio operating expenses, excluding certain investment related expenses, taxes, interest and other extraordinary expenses (including litigation), will not exceed 0.95% for Class I shares, 1.30% for Class A shares, 1.80% for Class L shares, 2.05% for Class C shares and 0.91% for Class IS shares. The fee waivers and/or expense reimbursements will continue for at least one year from the date of the Fund's prospectus or until such time as the Directors act to discontinue all or a portion of such waivers and/or reimbursements when they deem such action is appropriate. For the year ended December 31, 2017, approximately $114,000 of advisory fees were waived and approximately $831,000 of other expenses were reimbursed by the Adviser pursuant to this arrangement.
The Adviser has entered into a Sub-Advisory Agreement with the Sub-Advisers, each a wholly-owned subsidiary of Morgan Stanley. The Sub-Advisers provide the Fund with advisory services subject to the overall supervision of the Adviser and the Fund's Officers and Directors. The Adviser pays the Sub-Advisers on a monthly basis a portion of the net advisory fees the Adviser receives from the Fund.
Effective December 31, 2017, MSIM Company is no longer a Sub-Adviser to the Fund.
26
Morgan Stanley Institutional Fund, Inc.
Annual Report — December 31, 2017
Notes to Financial Statements (cont'd)
C. Administration Fees: The Adviser also serves as Administrator to the Company and provides administrative services pursuant to an Administration Agreement for an annual fee, accrued daily and paid monthly, of 0.08% of the Fund's average daily net assets.
Under a Sub-Administration Agreement between the Administrator and State Street, State Street provides certain administrative services to the Company. For such services, the Administrator pays State Street a portion of the fee the Administrator receives from the Fund.
D. Distribution and Shareholder Services Fees: Morgan Stanley Distribution, Inc. ("MSDI" or the "Distributor"), a wholly-owned subsidiary of the Adviser and an indirect subsidiary of Morgan Stanley, serves as the Company's Distributor of Fund shares pursuant to a Distribution Agreement. The Company has adopted a Shareholder Services Plan with respect to Class A shares pursuant to Rule 12b-1 under the Act. Under the Shareholder Services Plan, the Fund pays the Distributor a shareholder services fee, accrued daily and paid monthly, at an annual rate of 0.25% of the Fund's average daily net assets attributable to Class A shares.
The Company has adopted a Distribution and Shareholder Services Plan with respect to Class L shares pursuant to Rule 12b-1 under the Act. Under the Distribution and Shareholder Services Plan, the Fund pays the Distributor a distribution fee, accrued daily and paid monthly, at an annual rate of 0.50% and a shareholder services fee, accrued daily and paid monthly, at an annual rate of 0.25% of the Fund's average daily net assets attributable to Class L shares.
The Company has adopted a Distribution and Shareholder Services Plan with respect to Class C shares pursuant to Rule 12b-1 under the Act. Under the Distribution and Shareholder Services Plan, the Fund pays the Distributor a distribution fee, accrued daily and paid monthly, at an annual rate of 0.75% and a shareholder services fee, accrued daily and paid monthly, at an annual rate of 0.25% of the Fund's average daily net assets attributable to Class C shares.
The distribution and shareholder services fees are used to support the expenses associated with servicing and maintaining accounts. The Distributor may compensate other parties for providing shareholder support services to investors who purchase Class A, Class L and Class C shares.
E. Dividend Disbursing and Transfer Agent: The Company's dividend disbursing and transfer agent is Boston Financial Data Services, Inc. ("BFDS"). Pursuant to a Transfer
Agency Agreement, the Company pays BFDS a fee based on the number of classes, accounts and transactions relating to the Funds of the Company. Effective January 1, 2018, BFDS changed its name to DST Asset Manager Solutions, Inc.
F. Custodian Fees: State Street (the "Custodian") also serves as Custodian for the Company in accordance with a Custodian Agreement. The Custodian holds cash, securities, and other assets of the Company as required by the Act. Custody fees are payable monthly based on assets held in custody, investment purchases and sales activity and account maintenance fees, plus reimbursement for certain out-of-pocket expenses.
G. Security Transactions and Transactions with Affiliates: For the year ended December 31, 2017, purchases and sales of investment securities for the Fund, other than long-term U.S. Government securities and short-term investments, were approximately $720,794,000 and $1,392,809,000, respectively. There were no purchases and sales of long-term U.S. Government securities for the year ended December 31, 2017.
The Fund invests in the Institutional Class of the Morgan Stanley Institutional Liquidity Funds — Treasury Securities Portfolio (the "Liquidity Funds"), an open-end management investment company managed by the Adviser, both directly and as a portion of the securities held as collateral on loaned securities. Advisory fees paid by the Fund are reduced by an amount equal to its pro-rata share of the advisory and administration fees paid by the Fund due to its investment in the Liquidity Funds. For the year ended December 31, 2017, advisory fees paid were reduced by approximately $122,000 relating to the Fund's investment in the Liquidity Funds.
A summary of the Fund's transactions in shares of the Liquidity Funds during the year ended December 31, 2017 is as follows:
Affiliated
Investment
Company | | Value
December 31,
2016
(000) | | Purchases
at Cost
(000) | | Proceeds
from Sales
(000) | | Dividend
Income
(000) | |
Liquidity Funds | | $ | 77,597 | | | $ | 912,307 | | | $ | 897,920 | | | $ | 500 | | |
Affiliated
Investment
Company (cont'd) | | Realized
Gain
(Loss)
(000) | | Change in
Unrealized
Appreciation
(Depreciation)
(000) | | Value
December 31,
2017
(000) | |
Liquidity Funds | | $ | — | | | $ | — | | | $ | 91,984 | | |
The Fund is permitted to purchase and sell securities ("cross-trade") from and to other Morgan Stanley Funds as well as other funds and client accounts for which the Adviser or an affiliate of the Adviser serves as investment adviser, pursuant to procedures approved by the Directors in compliance with
27
Morgan Stanley Institutional Fund, Inc.
Annual Report — December 31, 2017
Notes to Financial Statements (cont'd)
Rule 17a-7 under the Act (the "Rule"). Each cross-trade is executed at the current market price in compliance with provisions of the Rule. For the year ended December 31, 2017, the Fund did not engage in any cross-trade transactions.
The Fund has an unfunded Deferred Compensation Plan (the "Compensation Plan"), which allows each independent Director to defer payment of all, or a portion, of the fees he or she receives for serving on the Board of Directors. Each eligible Director generally may elect to have the deferred amounts credited with a return equal to the total return on one or more of the Morgan Stanley funds that are offered as investment options under the Compensation Plan. Appreciation/depreciation and distributions received from these investments are recorded with an offsetting increase/decrease in the deferred compensation obligation and do not affect the NAV of the Fund.
H. Federal Income Taxes: It is the Fund's intention to continue to qualify as a regulated investment company and distribute all of its taxable and tax-exempt income. Accordingly, no provision for federal income taxes is required in the financial statements.
The Fund may be subject to taxes imposed by countries in which it invests. Such taxes are generally based on income and/or capital gains earned or repatriated. Taxes are accrued based on net investment income, net realized gains and net unrealized appreciation as such income and/or gains are earned. Taxes may also be based on transactions in foreign currency and are accrued based on the value of investments denominated in such currency.
FASB ASC 740-10, "Income Taxes — Overall", sets forth a minimum threshold for financial statement recognition of the benefit of a tax position taken or expected to be taken in a tax return. Management has concluded there are no significant uncertain tax positions that would require recognition in the financial statements. If applicable, the Fund recognizes interest accrued related to unrecognized tax benefits in "Interest Expense" and penalties in "Other Expenses" in the Statement of Operations. The Fund files tax returns with the U.S. Internal Revenue Service, New York and various states. Generally, each of the tax years in the four-year period ended December 31, 2017, remains subject to examination by taxing authorities.
The tax character of distributions paid may differ from the character of distributions shown in the Statements of Changes in Net Assets due to short-term capital gains being treated as ordinary
income for tax purposes. The tax character of distributions paid during fiscal years 2017 and 2016 was as follows:
2017
Distributions
Paid From: | | 2016
Distributions
Paid From: | |
Ordinary
Income
(000) | | Long-Term
Capital Gain
(000) | | Ordinary
Income
(000) | | Long-Term
Capital Gain
(000) | |
| $ | 77,241 | | | $ | — | | | $ | 38,436 | | | $ | — | | |
The amount and character of income and gains to be distributed are determined in accordance with income tax regulations which may differ from GAAP. These book/tax differences are either considered temporary or permanent in nature.
Temporary differences are primarily due to differing book and tax treatments for the timing of the recognition of gains (losses) on certain investment transactions and the timing of the deductibility of certain expenses.
Permanent differences, primarily due to differing treatments of gains (losses) related to foreign currency transactions, basis adjustments on certain equity securities designated as passive foreign investment companies, redemptions in kind and an expired capital loss carryforward, resulted in the following reclassifications among the components of net assets at December 31, 2017:
Accumulated
Undistributed
Net Investment
Income
(000) | | Accumulated
Net Realized
Loss
(000) | | Paid-in-
Capital
(000) | |
| $ | (5,550 | ) | | $ | 9,708 | | | $ | (4,158 | ) | |
At December 31, 2017, the components of distributable earnings for the Fund on a tax basis were as follows:
Undistributed
Ordinary
Income
(000) | | Undistributed
Long-Term
Capital Gain
(000) | |
| $ | 5,056 | | | $ | ��� | | |
During the year ended December 31, 2017, capital loss carryforwards of approximately $5,820,000 expired for federal income tax purposes.
During the year ended December 31, 2017, the Fund utilized capital loss carryforwards for U.S. federal income tax purposes of approximately $191,328,000.
For the year ended December 31, 2017, the Fund realized gains from in-kind redemptions of approximately $1,661,000. The gains are not taxable income to the Fund.
28
Morgan Stanley Institutional Fund, Inc.
Annual Report — December 31, 2017
Notes to Financial Statements (cont'd)
I. Credit Facility: The Company and other Morgan Stanley funds participated in a $150,000,000 committed, unsecured revolving line of credit facility (the "Facility") with State Street. This Facility is to be used for temporary emergency purposes or funding of shareholder redemption requests. The interest rate on borrowings is based on the federal funds rate or 1 month LIBOR rate plus a spread. The Facility also has a commitment fee of 0.25% per annum based on the unused portion of the Facility. During the year ended December 31, 2017, the Fund did not have any borrowings under the Facility.
J. Other: At December 31, 2017, the Fund had record owners of 10% or greater. Investment activities of these shareholders could have a material impact on the Fund. The aggregate percentage of such owners was 39.8%.
29
Morgan Stanley Institutional Fund, Inc.
Annual Report — December 31, 2017
Report of Independent Registered Public Accounting Firm
To the Shareholders and Board of Directors of
Morgan Stanley Institutional Fund, Inc. —
International Equity Portfolio
Opinion on the Financial Statements
We have audited the accompanying statement of assets and liabilities of International Equity Portfolio (the "Fund") (one of the funds constituting the Morgan Stanley Institutional Fund, Inc. (the "Company")), including the portfolio of investments, as of December 31, 2017, and the related statement of operations for the year then ended, the statements of changes in net assets for each of the two years in the period then ended, the financial highlights for each of the five years in the period then ended and the related notes (collectively referred to as the "financial statements"). In our opinion, the financial statements present fairly, in all material respects, the financial position of International Equity Portfolio (one of the funds constituting Morgan Stanley Institutional Fund, Inc.) at December 31, 2017, the results of its operations for the year then ended, the changes in its net assets for each of the two years in the period then ended and its financial highlights for each of the five years in the period then ended, in conformity with U.S. generally accepted accounting principles.
Basis for Opinion
These financial statements are the responsibility of the Company's management. Our responsibility is to express an opinion on the Fund's financial statements based on our audits. We are a public accounting firm registered with the Public Company Accounting Oversight Board (United States) ("PCAOB") and are required to be independent with respect to the Company in accordance with the U.S. federal securities law and the applicable rules and regulations of the Securities and Exchange Commission and the PCAOB.
We conducted our audits in accordance with the standards of the PCAOB. Those standards require that we plan and perform the audit to obtain reasonable assurance about whether the financial statements are free of material misstatement, whether due to error or fraud. The Company is not required to have, nor were we engaged to perform, an audit of the Company's internal control over financial reporting. As part of our audits, we are required to obtain an understanding of internal control over financial reporting, but not for the purpose of expressing an opinion on the effectiveness of the Company's internal control over financial reporting. Accordingly, we express no such opinion.
Our audits included performing procedures to assess the risks of material misstatement of the financial statements, whether due to error or fraud, and performing procedures that respond to those risks. Such procedures included examining, on a test basis, evidence regarding the amounts and disclosures in the financial statements. Our procedures included confirmation of securities owned as of December 31, 2017 by correspondence with the custodian and others or by other appropriate auditing procedures where replies from others were not received. Our audits also included evaluating the accounting principles used and significant estimates made by management, as well as evaluating the overall presentation of the financial statements. We believe that our audits provide a reasonable basis for our opinion.

We have served as the auditor of one or more Morgan Stanley investment companies since 2000.
Boston, Massachusetts
February 26, 2018
30
Morgan Stanley Institutional Fund, Inc.
Annual Report — December 31, 2017
Federal Tax Notice (unaudited)
For federal income tax purposes, the following information is furnished with respect to the Fund's earnings for the taxable year ended December 31, 2017.
When distributed, certain earnings may be subject to a maximum tax rate of 15% as provided for the Jobs and Growth Tax Relief Reconciliation Act of 2003. The Fund designated up to a maximum of approximately $83,321,000 as taxable at this lower rate.
The Fund intends to pass through foreign tax credits of approximately $6,081,000, and has derived net income from sources within foreign countries amounting to approximately $108,773,000.
In January, the Fund provides tax information to shareholders for the preceding calendar year.
31
Morgan Stanley Institutional Fund, Inc.
Annual Report — December 31, 2017
Privacy Notice (unaudited)
MORGAN STANLEY INVESTMENT MANAGEMENT INC.
AN IMPORTANT NOTICE CONCERNING OUR U.S. PRIVACY POLICY
We are required by federal law to provide you with a copy of our privacy policy annually. This policy applies to current and former individual investors in funds managed or sponsored by Morgan Stanley Investment Management Inc. ("MSIM") as well as current and former individual clients of MSIM. This policy is not applicable to partnerships, corporations, trusts or other non-individual clients or investors. Please note that we may amend this policy at any time, and will inform you of any changes as required by law.
WE RESPECT YOUR PRIVACY
We appreciate that you have provided us with your personal financial information. We strive to maintain the privacy of such information while we help you achieve your financial objectives. This Notice describes what non-public personal information we collect about you, why we collect it, when we may share it with others and how certain others may use it. It discusses the steps you may take to limit our sharing of certain information about you to affiliated companies in the Morgan Stanley family of companies ("other Morgan Stanley companies"). It also discloses how you may limit use of certain shared information for marketing purposes by other Morgan Stanley branded companies. Throughout this policy, we refer to the non-public information that personally identifies you or your accounts as "personal information.''
1. WHAT PERSONAL INFORMATION DO WE COLLECT ABOUT YOU?
We obtain personal information from applications and other forms you submit to us, from your dealings with us, from consumer reporting agencies, from our Web sites and from third parties and other sources.
For example:
• We may collect information such as your name, address, e-mail address, telephone/fax numbers, assets, income and investment objectives through subscription documents, applications and other forms you submit to us.
• We may obtain information about account balances, your use of account(s) and the types of products and services you prefer to receive from us through your dealings and transactions with us and other sources.
• We may obtain information about your creditworthiness and credit history from consumer reporting agencies.
• We may collect background information from and through third-party vendors to verify representations you have made and to comply with various regulatory requirements.
• If you interact with us through our public and private Web sites, we may collect information that you provide directly through online communications (such as an e-mail address). We may also collect information about your Internet service provider, your domain name, your computer's operating system and Web browser, your use of our Web sites and your product and service preferences, through the use of "cookies." Please consult the Terms of Use of these sites for more details.
2. WHEN DO WE DISCLOSE PERSONAL INFORMATION WE COLLECT ABOUT YOU?
We may disclose personal information we collect about you to other Morgan Stanley companies and to non-affiliated third parties.
a. Information We Disclose to Other Morgan Stanley Companies.
We may disclose personal information to other Morgan Stanley companies for a variety of reasons, including to manage your account(s) effectively, to service and process your transactions, to let you know about products and services offered by us and other Morgan Stanley companies, to manage our business, and as otherwise required or permitted by law. Offers for products and services from other Morgan Stanley companies are developed under conditions designed to safeguard your personal information.
32
Morgan Stanley Institutional Fund, Inc.
Annual Report — December 31, 2017
Privacy Notice (unaudited) (cont'd)
b. Information We Disclose to Non-affiliated Third Parties.
We do not disclose personal information that we collect about you to non-affiliated third parties except to those who provide marketing services on our behalf, to financial institutions with whom we have joint marketing agreements, and as otherwise required or permitted by law. For example, we may disclose personal information to non-affiliated third parties for servicing and processing transactions, to offer our own products and services, to protect against fraud, for institutional risk control, to respond to judicial process or to perform services on our behalf. When we share personal information with a non-affiliated third party, they are required to limit their use of personal information to the particular purpose for which it was shared and they are not allowed to share personal information with others except to fulfill that limited purpose or as may be permitted or required by law.
3. HOW DO WE PROTECT THE SECURITY AND CONFIDENTIALITY OF PERSONAL INFORMATION WE COLLECT ABOUT YOU?
We maintain physical, electronic and procedural security measures to help safeguard the personal information we collect about you. We have internal policies governing the proper handling of client information. Third parties that provide support or marketing services on our behalf may also receive personal information, and we require them to adhere to confidentiality standards with respect to such information.
4. HOW CAN YOU LIMIT THE SHARING OF CERTAIN TYPES OF PERSONAL INFORMATION WITH OTHER MORGAN STANLEY COMPANIES?
We offer you choices as to whether we share with other Morgan Stanley companies the personal information that was collected to determine your eligibility for products and services you request ("eligibility information"). Eligibility information does not include your identification information or personal information pertaining to our transactions or experiences with you. Please note that, even if you direct us not to share eligibility information with other Morgan Stanley companies ("opt-out"), we may still share personal information, including eligibility information, with those companies in circumstances excluded from the opt-out under applicable law, such as to process transactions or to service your account.
5. HOW CAN YOU LIMIT THE USE OF CERTAIN TYPES OF PERSONAL INFORMATION BY OTHER MORGAN STANLEY COMPANIES FOR MARKETING?
By following the opt-out instructions in Section 6 below, you may limit other Morgan Stanley branded companies from marketing their products or services to you based on personal information we disclose to them. This information may include, for example, your income and account history with us. Please note that, even if you choose to limit Other Morgan Stanley Companies from using personal information about you that we may share with them for marketing their products and services to you, Other Morgan Stanley Companies may use your personal information that they obtain from us to market to you in circumstances permitted by law, such as if the Other Morgan Stanley Company has its own relationship with you.
6. HOW CAN YOU SEND US AN OPT-OUT INSTRUCTION?
If you wish to limit our sharing of eligibility information about you with other Morgan Stanley companies or other Morgan Stanley companies' use of personal information for marketing purposes, as described in this notice, you may do so by:
• Calling us at (800) 548-7786
Monday-Friday between 8a.m. and 6p.m.(EST)
• Writing to us at the following address:
DST Asset Manager Solutions, Inc.
c/o Privacy Coordinator
P.O. Box 219804
Kansas City, Missouri 64121
33
Morgan Stanley Institutional Fund, Inc.
Annual Report — December 31, 2017
Privacy Notice (unaudited) (cont'd)
Your written request should include your name, address, telephone number and account number(s) to which the opt-out applies and whether you are opting out with respect to sharing of eligibility information (Section 4 above), or if information used for Marketing (Section 5 above) or both. Written opt-out requests should not be sent with any other correspondence. In order to process your request, we require that the request be provided by you directly and not through a third party.
Your opt-out preference will remain in effect with respect to this policy (as it may be amended) until you notify us otherwise. If you have a joint account, your direction for us not to share this information with other Morgan Stanley companies and for those other Morgan Stanley companies not to use your personal information for marketing will be applied to all account holders on that account. Please understand that if you limit our sharing or our affiliated companies' use of personal information, you and any joint account holder(s) may not receive information about Morgan Stanley products and services, including products or services that could help you manage your financial resources and achieve your investment objectives.
7. WHAT IF AN AFFILIATED COMPANY BECOMES A NON-AFFILIATED THIRD PARTY?
If, at any time in the future, an affiliated company becomes a non-affiliated third party, further disclosures of personal information made to the former affiliated company will be limited to those described in Section 2(b) above relating to non-affiliated third parties. If you elected under Section 6 to limit disclosures we make to affiliated companies, or use of personal information by affiliated companies, your election will not apply to use by any former affiliated company of your personal information in their possession once it becomes a non-affiliated third party.
SPECIAL NOTICE TO RESIDENTS OF VERMONT
The following section supplements our policy with respect to our individual clients who have a Vermont address and supersedes anything to the contrary in the above policy with respect to those clients only.
The state of Vermont requires financial institutions to obtain your consent prior to sharing personal information that they collect about you with affiliated companies and non-affiliated third parties other than in certain limited circumstances. Except as permitted by law, we will not share personal information we collect about you with non-affiliated third parties or other Morgan Stanley companies unless you provide us with your written consent to share such information ("opt-in").
If you wish to receive offers for investment products and services offered by or through other Morgan Stanley companies, please notify us in writing at the following address:
DST Asset Manager Solutions, Inc.
c/o Privacy Coordinator
P.O. Box 219804
Kansas City, Missouri 64121
Your authorization should include your name, address, telephone number and account number(s) to which the opt-in applies and should not be sent with any other correspondence. In order to process your authorization, we require that the authorization be provided by you directly and not through a third party.
SPECIAL NOTICE TO RESIDENTS OF CALIFORNIA
The following section supplements our policy with respect to our individual clients who have a California address and supersedes anything to the contrary in the above policy with respect to those clients only.
In response to a California law, if your account has a California home address, your personal information will not be disclosed to non-affiliated third parties except as permitted by applicable California law, and we will limit sharing such information with our affiliates to comply with California privacy laws that apply to us.
34
Morgan Stanley Institutional Fund, Inc.
Annual Report — December 31, 2017
Director and Officer Information (unaudited)
Independent Directors:
Name, Age and Address of
Independent Director | | Position(s)
Held with
Registrant | | Length of Time
Served* | | Principal Occupation(s) During Past 5 Years
and Other Relevant Professional Experience | | Number of
Portfolios in
Fund Complex
Overseen by
Independent
Director** | | Other Directorships
Held by Independent
Director*** | |
Frank L. Bowman (73)
c/o Perkins Coie LLP
Counsel to the Independent
Directors
30 Rockefeller Plaza
New York, NY 10112 | | Director | | Since
August
2006 | | President, Strategic Decisions, LLC (consulting) (since February 2009); Director or Trustee of various Morgan Stanley Funds (since August 2006); Chairperson of the Compliance and Insurance Committee (since October 2015); formerly, Chairperson of the Insurance Sub-Committee of the Compliance and Insurance Committee (2007- 2015); served as President and Chief Executive Officer of the Nuclear Energy Institute (policy organization) (February 2005-November 2008); retired as Admiral, U.S. Navy after serving over 38 years on active duty including 8 years as Director of the Naval Nuclear Propulsion Program in the Department of the Navy and the U.S. Department of Energy (1996-2004); served as Chief of Naval Personnel (July 1994-September 1996) and on the Joint Staff as Director of Political Military Affairs (June 1992-July 1994); knighted as Honorary Knight Commander of the Most Excellent Order of the British Empire; awarded the Officier de l'Orde National du Mérite by the French Government; elected to the National Academy of Engineering (2009). | | | 88 | | | Director of BP p.l.c.; Director of Naval and Nuclear Technologies LLP; Director Emeritus of the Armed Services YMCA; Director of the U.S. Naval Submarine League; Member of the National Security Advisory Council of the Center for U.S. Global Engagement and a member of the CNA Military Advisory Board; Trustee of Fairhaven United Methodist Church; and Director of other various non-profit organizations. | |
Kathleen A. Dennis (64)
c/o Perkins Coie LLP
Counsel to the Independent Directors
30 Rockefeller Plaza
New York, NY 10112 | | Director | | Since
August
2006 | | President, Cedarwood Associates (mutual fund and investment management consulting) (since July 2006); Chairperson of the Liquidity and Alternatives Sub-Committee of the Investment Committee (since October 2006) and Director or Trustee of various Morgan Stanley Funds (since August 2006); formerly, Senior Managing Director of Victory Capital Management (1993-2006). | | | 89 | | | Director of various non-profit organizations. | |
Nancy C. Everett (62)
c/o Perkins Coie LLP
Counsel to the Independent Directors
30 Rockefeller Plaza
New York, NY 10112 | | Director | | Since
January
2015 | | Chief Executive Officer, Virginia Commonwealth University Investment Company (since November 2015); Owner, OBIR, LLC (institutional investment management consulting) (since June 2014); formerly, Managing Director, BlackRock Inc. (February 2011-December 2013); and Chief Executive Officer, General Motors Asset Management (a/k/a Promark Global Advisors, Inc.) (June 2005-May 2010). | | | 90 | | | Formerly, Member of Virginia Commonwealth University School of Business Foundation (2005-2016); Member of Virginia Commonwealth University Board of Visitors (2013-2015); Member of Committee on Directors for Emerging Markets Growth Fund, Inc. (2007-2010); Chairperson of Performance Equity Management, LLC (2006-2010); and Chairperson, GMAM Absolute Return Strategies Fund, LLC (2006-2010). | |
35
Morgan Stanley Institutional Fund, Inc.
Annual Report — December 31, 2017
Director and Officer Information (unaudited) (cont'd)
Independent Directors: (cont'd)
Name, Age and Address of
Independent Director | | Position(s)
Held with
Registrant | | Length of Time
Served* | | Principal Occupation(s) During Past 5 Years
and Other Relevant Professional Experience | | Number of
Portfolios in
Fund Complex
Overseen by
Independent
Director** | | Other Directorships
Held by Independent
Director*** | |
Jakki L. Haussler (60)
c/o Perkins Coie LLP
Counsel to the Independent Directors
30 Rockefeller Plaza
New York, NY 10112 | | Director | | Since
January
2015 | | Chairman and Chief Executive Officer, Opus Capital Group (since January 1996); formerly, Director, Capvest Venture Fund, LP (May 2000-December 2011); Partner, Adena Ventures, LP (July 1999-December 2010); Director, The Victory Funds (February 2005-July 2008). | | | 90 | | | Director of Cincinnati Bell Inc. and Member, Audit Committee and Compensation Committee; Director of Northern Kentucky University Foundation and Member, Investment Committee; Member of Chase College of Law Transactional Law Practice Center Board of Advisors; Director of Best Transport; Director of Chase College of Law Board of Visitors; formerly, Member, University of Cincinnati Foundation Investment Committee; Member, Miami University Board of Visitors (2008-2011); Trustee of Victory Funds (2005-2008) and Chairman, Investment Committee (2007-2008) and Member, Service Provider Committee (2005-2008). | |
Dr. Manuel H. Johnson (68)
c/o Johnson Smick
International, Inc.
220 I Street, NE — Suite 200
Washington, D.C. 20002 | | Director | | Since
July
1991 | | Senior Partner, Johnson Smick International, Inc. (consulting firm); Chairperson of the Investment Committee (since October 2006) and Director or Trustee of various Morgan Stanley Funds (since July 1991); Co-Chairman and a founder of the Group of Seven Council (G7C) (international economic commission); formerly, Chairperson of the Audit Committee (July 1991-September 2006), Vice Chairman of the Board of Governors of the Federal Reserve System and Assistant Secretary of the U.S. Treasury. | | | 88 | | | Director of NVR, Inc. (home construction). | |
Joseph J. Kearns (75)
c/o Kearns & Associates LLC
46 E Peninsula Center #385
Rolling Hills Estates,
CA 90274-3712 | | Director | | Since
August
1994 | | Senior Adviser, Kearns & Associates LLC (investment consulting); Chairperson of the Audit Committee (since October 2006) and Director or Trustee of various Morgan Stanley Funds (since August 1994); formerly, Deputy Chairperson of the Audit Committee (July 2003-September 2006) and Chairperson of the Audit Committee of various Morgan Stanley Funds (since August 1994); CFO of the J. Paul Getty Trust. | | | 89 | | | Prior to August 10, 2016, Director of Electro Rent Corporation (equipment leasing); Prior to December 31, 2013, Director of The Ford Family Foundation. | |
36
Morgan Stanley Institutional Fund, Inc.
Annual Report — December 31, 2017
Director and Officer Information (unaudited) (cont'd)
Independent Directors: (cont'd)
Name, Age and Address of
Independent Director | | Position(s)
Held with
Registrant | | Length of Time
Served* | | Principal Occupation(s) During Past 5 Years
and Other Relevant Professional Experience | | Number of
Portfolios in
Fund Complex
Overseen by
Independent
Director** | | Other Directorships
Held by Independent
Director*** | |
Michael F. Klein (59)
c/o Perkins Coie LLP
Counsel to the Independent Directors
30 Rockefeller Plaza
New York, NY 10112 | | Director | | Since
August
2006 | | Managing Director, Aetos Capital, LLC (since March 2000); Co-President, Aetos Alternatives Management, LLC (since January 2004) and Co-Chief Executive Officer of Aetos Capital LLC (since August 2013); Chairperson of the Fixed Income Sub-Committee of the Investment Committee (since October 2006) and Director or Trustee of various Morgan Stanley Funds (since August 2006); formerly, Managing Director, Morgan Stanley & Co. Inc. and Morgan Stanley Dean Witter Investment Management, President, various Morgan Stanley Funds (June 1998-March 2000) and Principal, Morgan Stanley & Co. Inc. and Morgan Stanley Dean Witter Investment Management (August 1997-December 1999). | | | 88 | | | Director of certain investment funds managed or sponsored by Aetos Capital, LLC; Director of Sanitized AG and Sanitized Marketing AG (specialty chemicals). | |
Patricia Maleski (57)
c/o Perkins Coie LLP
Counsel to the Independent Directors
30 Rockefeller Plaza
New York, NY 10112 | | Director | | Since
January
2017 | | Managing Director, JPMorgan Asset Management (2004-2016); Oversight and Control Head of Fiduciary and Conflicts of Interest Program (2015-2016); Chief Control Officer-Global Asset Management (2013-2015); President, JPMorgan Funds (2010-2013); Chief Administrative Officer (2004-2013); various other positions including Treasurer and Board Liaison (since 2001). | | | 90 | | | None. | |
Michael E. Nugent (81)
522 Fifth Avenue
New York, NY 10036 | | Chair of the Board and Director | | Chair of the Boards since July 2006 and Director since July 1991 | | Chair of the Boards of various Morgan Stanley Funds (since July 2006); Chairperson of the Closed-End Fund Committee (since June 2012) and Director or Trustee of various Morgan Stanley Funds (since July 1991); formerly, Chairperson of the Insurance Committee (until July 2006); General Partner, Triumph Capital, L.P. (private investment partnership) (1988-2013). | | | 88 | | | None. | |
W. Allen Reed (70)
c/o Perkins Coie LLP
Counsel to the Independent Directors
30 Rockefeller Plaza
New York, NY 10112 | | Director | | Since
August
2006 | | Chairperson of the Equity Sub-Committee of the Investment Committee (since October 2006) and Director or Trustee of various Morgan Stanley Funds (since August 2006); formerly, President and CEO of General Motors Asset Management; Chairman and Chief Executive Officer of the GM Trust Bank and Corporate Vice President of General Motors Corporation (August 1994-December 2005). | | | 89 | | | Director of Legg Mason, Inc.; formerly, Director of the Auburn University Foundation (2010-2015). | |
Fergus Reid (85)
c/o Joe Pietryka, Inc.
85 Charles Colman Blvd.
Pawling, NY 12564 | | Director | | Since
June
1992 | | Chairman, Joe Pietryka, Inc.; Chairperson of the Governance Committee and Director or Trustee of various Morgan Stanley Funds (since June 1992). | | | 89 | | | Formerly, Trustee and Director of certain investment companies in the JP Morgan Fund Complex managed by JP Morgan Investment Management Inc. (1987-2012). | |
* This is the earliest date the Director began serving the Morgan Stanley Funds. Each Director serves an indefinite term, until his or her successor is elected.
** The Fund Complex includes (as of December 31, 2017) all open-end and closed-end funds (including all of their portfolios) advised by Morgan Stanley Investment Management Inc. (the "Adviser") and any funds that have an adviser that is an affiliated person of the Adviser (including, but not limited to, Morgan Stanley AIP GP LP).
*** This includes any directorships at public companies and registered investment companies held by the Director at any time during the past five years.
37
Morgan Stanley Institutional Fund, Inc.
Annual Report — December 31, 2017
Director and Officer Information (unaudited) (cont'd)
Executive Officers:
Name, Age and Address of Executive Officer | | Position(s) Held
with
Registrant | | Length of Time
Served* | | Principal Occupation(s) During Past 5 Years | |
John H. Gernon (54)
522 Fifth Avenue
New York, NY 10036 | | President and Principal Executive Officer | | Since
September
2013 | | President and Principal Executive Officer of the Equity and Fixed Income Funds and the Morgan Stanley AIP Funds (since September 2013) and the Liquidity Funds and various money market funds (since May 2014) in the Fund Complex; Managing Director of the Adviser; Head of Product (since 2006). | |
Timothy J. Knierim (58)
522 Fifth Avenue
New York, NY 10036 | | Chief Compliance Officer | | Since
December
2016 | | Managing Director of the Adviser and various entities affiliated with the Adviser; Chief Compliance Officer of various Morgan Stanley Funds and the Adviser (since December 2016) and Chief Compliance Officer of Morgan Stanley AIP GP LP (since 2014). Formerly, Managing Director and Deputy Chief Compliance Officer of the Adviser (2014-2016); and formerly, Chief Compliance Officer of Prudential Investment Management, Inc. (2007-2014). | |
Francis J. Smith (52)
522 Fifth Avenue
New York, NY 10036 | | Treasurer and Principal Financial Officer | | Treasurer since July 2003 and Principal Financial Officer since September 2002 | | Manging Director of the Adviser and various entities affiliated with the Adviser; Treasurer (since July 2003) and Principal Financial Officer of various Morgan Stanley Funds (since September 2002). | |
Mary E. Mullin (50)
522 Fifth Avenue
New York, NY 10036 | | Secretary | | Since
June
1999 | | Managing Director of the Adviser; Secretary of various Morgan Stanley Funds (since June 1999). | |
Michael J. Key (38)
522 Fifth Avenue
New York, NY 10036 | | Vice President | | Since
June
2017 | | Vice President of the Equity and Fixed Income Funds, Liquidity Funds, various money market funds and the Morgan Stanley AIP Funds in the Fund Complex (since June 2017); Executive Director of the Adviser; Head of Product Development for Equity and Fixed Income Funds (since August 2013). | |
* This is the earliest date the officer began serving the Morgan Stanley Funds. Each officer serves a one-year term, until his or her successor is elected and qualifies.
38
Morgan Stanley Institutional Fund, Inc.
Annual Report — December 31, 2017
Adviser and Administrator
Morgan Stanley Investment Management Inc.
522 Fifth Avenue
New York, New York 10036
Sub-Adviser
Morgan Stanley Investment Management Limited
25 Cabot Square, Canary Wharf
London, E14 4QA, England
Distributor
Morgan Stanley Distribution, Inc.
522 Fifth Avenue
New York, New York 10036
Dividend Disbursing and Transfer Agent
DST Asset Manager Solutions, Inc.
2000 Crown Colony Drive
Quincy, Massachusetts 02169
Custodian
State Street Bank and Trust Company
One Lincoln Street
Boston, Massachusetts 02111
Legal Counsel
Dechert LLP
1095 Avenue of the Americas
New York, New York 10036
Counsel to the Independent Directors
Perkins Coie LLP
30 Rockefeller Plaza
New York, New York 10112
Independent Registered Public Accounting Firm
Ernst & Young LLP
200 Clarendon Street
Boston, Massachusetts 02116
Reporting to Shareholders
Each Morgan Stanley Fund provides a complete schedule of portfolio holdings in its semi-annual and annual reports within 60 days of the end of the fund's second and fourth fiscal quarters. The semi-annual and annual reports are filed electronically with the Securities and Exchange Commission (SEC) on Form N-CSRS and Form N-CSR, respectively. Morgan Stanley also delivers the semi-annual and annual reports to fund shareholders and makes these reports available on its public website, www.morganstanley.com/im. Each Morgan Stanley fund also files a complete schedule of portfolio holdings with the SEC for the fund's first and third fiscal quarters on Form N-Q. Morgan Stanley does not deliver the reports for the first and third fiscal quarters to shareholders, nor are the reports posted to the Morgan Stanley public website. You may, however, obtain the Form N-Q filings (as well as the Form N-CSR and N-CSRS filings) by accessing the SEC's website, www.sec.gov. You may also review and copy them at the SEC's Public Reference Room in Washington, DC. Information on the operation of the SEC's Public Reference Room may be obtained by calling the SEC toll free at 1 (800) SEC-0330. You can also request copies of these materials, upon payment of a duplicating fee, by electronic request at the SEC's email address (publicinfo@sec.gov) or by writing to the SEC's Public Reference Section, Washington, D.C. 20549-1520.
Proxy Voting Policies and Procedures and Proxy Voting Record
You may obtain a copy of the Company's Proxy Voting Policy and Procedures and information regarding how the Company voted proxies relating to portfolio securities during the most recent twelve-month period ended June 30, without charge, upon request, by calling toll free 1 (800) 548-7786 or by visiting our website at www.morganstanley.com/im. This information is also available on the SEC's website at www.sec.gov.
This report is authorized for distribution only when preceded or accompanied by a prospectus or summary prospectus of the applicable Fund of Morgan Stanley Institutional Fund, Inc., which describes in detail the Fund's investment policies, risks, fees and expenses. Please read the prospectus carefully before you invest or send money. For additional information, including information regarding the investments comprising the Fund, please visit our website at www.morganstanley.com/im or call toll free 1 (800) 548-7786.
39
Printed in U.S.A.
This Report has been prepared for shareholders and may be distributed to others only if preceded or accompanied by a current prospectus.
Morgan Stanley Investment Management Inc.
522 Fifth Avenue
New York, New York 10036
© 2018 Morgan Stanley. Morgan Stanley Distribution, Inc.

IFIIEANN
2007512 EXP. 02.28.19

Morgan Stanley Institutional Fund, Inc.
International Opportunity Portfolio
Annual Report
December 31, 2017

Morgan Stanley Institutional Fund, Inc.
Annual Report — December 31, 2017
Shareholders' Letter | | | 2 | | |
Expense Example | | | 3 | | |
Investment Overview | | | 4 | | |
Portfolio of Investments | | | 6 | | |
Statement of Assets and Liabilities | | | 8 | | |
Statement of Operations | | | 10 | | |
Statements of Changes in Net Assets | | | 11 | | |
Financial Highlights | | | 13 | | |
Notes to Financial Statements | | | 18 | | |
Report of Independent Registered Public Accounting Firm | | | 27 | | |
Federal Tax Notice | | | 28 | | |
Privacy Notice | | | 29 | | |
Director and Officer Information | | | 32 | | |
This report is authorized for distribution only when preceded or accompanied by a prospectus or summary prospectus of the applicable Fund of Morgan Stanley Institutional Fund, Inc. To receive a prospectus and/or statement of additional information (SAI), which contains more complete information such as investment objectives, charges, expenses, policies for voting proxies, risk considerations, and describes in detail each of the Fund's investment policies to the prospective investor, please call toll free 1 (800) 548-7786. Please read the prospectuses carefully before you invest or send money.
Additionally, you can access information about the Fund, including performance, characteristics, and investment team commentary, through Morgan Stanley Investment Management's website: www.morganstanley.com/im.
Market forecasts provided in this report may not necessarily come to pass. There is no guarantee that any sectors mentioned will continue to perform as discussed herein or that securities in such sectors will be held by the Fund in the future. There is no assurance that a fund will achieve its investment objective. Funds are subject to market risk, which is the possibility that market values of securities owned by the Fund will decline and, therefore, the value of the Fund's shares may be less than what you paid for them. Accordingly, you can lose money investing in this Fund. Please see the prospectus for more complete information on investment risks.
1
Morgan Stanley Institutional Fund, Inc.
Annual Report — December 31, 2017
Shareholders' Letter (unaudited)
Dear Shareholders,
We are pleased to provide this Annual report, in which you will learn how your investment in International Opportunity Portfolio (the "Fund") performed during the latest twelve-month period.
Morgan Stanley Investment Management is a client-centric, investor-led organization. Our global presence, intellectual capital, and breadth of products and services enable us to partner with investors to meet the evolving challenges of today's financial markets. We aim to deliver superior investment service and to empower our clients to make the informed decisions that help them reach their investment goals.
As always, we thank you for selecting Morgan Stanley Investment Management, and look forward to working with you in the months and years ahead.
Sincerely,

John H. Gernon
President and Principal Executive Officer
January 2018
2
Morgan Stanley Institutional Fund, Inc.
Annual Report — December 31, 2017
Expense Example (unaudited)
International Opportunity Portfolio
As a shareholder of the Fund, you incur two types of costs: (1) transactional costs, including redemption fees; and (2) ongoing costs, which may include advisory fees, administration fees, distribution and shareholder services fees and other Fund expenses. This example is intended to help you understand your ongoing costs (in dollars) of investing in the Fund and to compare these costs with the ongoing costs of investing in other mutual funds.
This example is based on an investment of $1,000 invested at the beginning of the six-month period ended December 31, 2017 and held for the entire six-month period.
Actual Expenses
The table below provides information about actual account values and actual expenses. You may use the information in this table, together with the amount you invested, to estimate the expenses that you paid over the period. Simply divide your account value by $1,000 (for example, an $8,600 account value divided by $1,000 = 8.6), then multiply the result by the number in the table under the heading entitled "Actual Expenses Paid During Period" to estimate the expenses you paid on your account during this period.
Hypothetical Example for Comparison Purposes
The table below provides information about hypothetical account values and hypothetical expenses based on the Fund's actual expense ratio and an assumed rate of return of 5% per year before expenses, which is not the Fund's actual return. The hypothetical account values and expenses may not be used to estimate the actual ending account balance or expenses you paid for the period. You may use this information to compare the ongoing costs of investing in the Fund and other funds. To do so, compare this 5% hypothetical example with the 5% hypothetical examples that appear in the shareholder reports of the other funds.
Please note that the expenses shown in the table are meant to highlight your ongoing costs only and do not reflect any transactional costs, such as sales charges (loads) and redemption fees. Therefore, the information for each class in the table is useful in comparing ongoing costs only, and will not help you determine the relative total costs of owning different funds. In addition, if these transactional costs were included, your costs would have been higher.
| | | Beginning
Account
Value
7/1/17 | | Actual Ending
Account
Value
12/31/17 | | Hypothetical
Ending Account
Value | | Actual
Expenses
Paid
During
Period* | | Hypothetical
Expenses Paid
During Period* | | Net
Expense
Ratio
During
Period** | |
International Opportunity Portfolio Class I | | $ | 1,000.00 | | | $ | 1,179.20 | | | $ | 1,020.27 | | | $ | 5.38 | | | $ | 4.99 | | | | 0.98 | % | |
International Opportunity Portfolio Class A | | | 1,000.00 | | | | 1,178.00 | | | | 1,018.75 | | | | 7.03 | | | | 6.51 | | | | 1.28 | | |
International Opportunity Portfolio Class L | | | 1,000.00 | | | | 1,174.50 | | | | 1,015.93 | | | | 10.08 | | | | 9.35 | | | | 1.84 | | |
International Opportunity Portfolio Class C | | | 1,000.00 | | | | 1,173.60 | | | | 1,015.07 | | | | 11.01 | | | | 10.21 | | | | 2.01 | | |
International Opportunity Portfolio Class IS | | | 1,000.00 | | | | 1,179.60 | | | | 1,020.57 | | | | 5.05 | | | | 4.69 | | | | 0.92 | | |
* Expenses are calculated using each Fund Class' annualized net expense ratio (as disclosed), multiplied by the average account value over the period, and multiplied by 184/365 (to reflect the most recent one-half year period).
** Annualized.
3
Morgan Stanley Institutional Fund, Inc.
Annual Report — December 31, 2017
Investment Overview (unaudited)
International Opportunity Portfolio
The Fund seeks long-term capital appreciation.
Performance
For the year ended December 31, 2017, the Fund's Class I shares had a total return based on net asset value and reinvestment of distributions per share of 53.38%, net of fees. The Fund's Class I shares outperformed the Fund's benchmark, the MSCI All Country World ex USA Index (the "Index"), which returned 27.19%.
Please keep in mind that double-digit returns are highly unusual and cannot be sustained. Investors should also be aware that these returns were primarily achieved during favorable market conditions.
Factors Affecting Performance
• International equity markets rallied on stronger-than-expected economic data and improving corporate profits across Europe and Japan, along with stabilization in emerging market economies amid firming commodity prices. Central bank policy remained largely accommodative as inflation stayed muted and global growth improved. This contributed to weakening in the U.S. dollar, especially against the euro. Political risk abated as key elections across Europe voted in more mainstream candidates, and trade negotiation fears also diminished somewhat, although the North American Free Trade Agreement ("NAFTA") and Brexit talks are ongoing. Markets shrugged off other geopolitical concerns, including escalating tensions with North Korea and in the Middle East, to end the year sharply higher.
• International equity markets advanced 27.19% for the 12-month period ended December 31, 2017, as measured by the Index. Against this backdrop, our team remained focused on assessing company prospects over a longer-term period of three to five years, and owning a portfolio of high quality companies with diverse business drivers not tied to a particular market environment.
• The team manages focused portfolios that are highly differentiated from the benchmark, with securities weighted on our assessment of the quality of the company and our conviction. Our longer-term focus results in lower turnover than many of our peers. The value added or detracted in any period of time will typically result from stock selection, given our philosophy and process.
• For the 12-month period, the Fund outperformed the Index due to favorable stock selection and sector allocation.
• The Fund's relative outperformance was driven by stock selection in the consumer discretionary, consumer staples and industrials sectors.
• Underweight exposures to the materials and industrials sectors and an overweight allocation to consumer staples detracted from relative results.
Management Strategies
• There were no changes to our bottom-up investment process during the period. The team seeks high quality companies, which we define primarily as those with sustainable competitive advantages. Our team continues to focus on bottom-up stock selection and the long-term outlook for companies owned in the portfolio; accordingly, we have had very limited turnover in the portfolio to date, as our ongoing work reaffirms our assessment of quality and competitive advantage in the names we own.
• At the close of the period, consumer discretionary represented the largest sector weight in the Fund, followed by information technology and consumer staples. The team's bottom-up investment process resulted in sector overweight positions in consumer discretionary, information technology and consumer staples and underweight positions in financials, materials, energy, industrials, telecommunication services, health care, real estate and utilities.
4
Morgan Stanley Institutional Fund, Inc.
Annual Report — December 31, 2017
Investment Overview (unaudited) (cont'd)
International Opportunity Portfolio
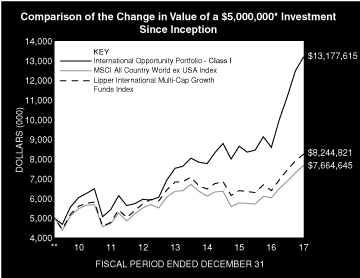
* Minimum Investment for Class I shares
** Commenced Operations on March 31, 2010.
In accordance with SEC regulations, the Fund's performance shown assumes that all recurring fees (including management fees) were deducted and all dividends and distributions were reinvested. The performance of Class A, L, C and IS shares will vary from the performance of Class I shares and will be impacted by additional fees assessed to those classes (if applicable).
Performance Compared to the MSCI All Country World ex USA Index(1) and the Lipper International Multi-Cap Growth Funds Index(2)
| | | Period Ended December 31, 2017
Total Returns(3) | |
| | | | Average Annual | |
| | One
Year | | Five
Years | | Ten
Years | | Since
Inception(7) | |
Fund — Class I Shares
w/o sales charges(4) | | | 53.38 | % | | | 17.23 | % | | | — | | | | 13.31 | % | |
Fund — Class A Shares
w/o sales charges(4) | | | 53.01 | | | | 16.84 | | | | — | | | | 12.97 | | |
Fund — Class A Shares with
maximum 5.25% sales charges(4) | | | 44.97 | | | | 15.59 | | | | — | | | | 12.19 | | |
Fund — Class L Shares
w/o sales charges(4) | | | 52.11 | | | | 16.24 | | | | — | | | | 12.39 | | |
Fund — Class C Shares
w/o sales charges(6) | | | 51.77 | | | | — | | | | — | | | | 15.34 | | |
Fund — Class C Shares
with maximum 1.00% deferred
sales charges(6) | | | 50.77 | | | | — | | | | — | | | | 15.34 | | |
Fund — Class IS Shares
w/o sales charges(5) | | | 53.41 | | | | — | | | | — | | | | 16.74 | | |
MSCI All Country World
ex USA Index | | | 27.19 | | | | 6.80 | | | | — | | | | 5.66 | | |
Lipper International Multi-Cap
Growth Funds Index | | | 28.88 | | | | 7.59 | | | | — | | | | 6.67 | | |
Performance data quoted represents past performance, which is no guarantee of future results, and current performance may be lower or higher than the figures shown. Performance assumes that all dividends and distributions, if any, were reinvested. For the most recent month-end performance figures, please visit www.morganstanley.com/im. Investment return and principal value will fluctuate so that Fund shares, when redeemed, may be worth more or less than their original cost. Total returns do not reflect the deduction of taxes that a shareholder would pay on Fund distributions or the redemption of Fund shares. Performance of share classes will vary due to difference in sales charges and expenses.
(1) The MSCI All Country World ex USA Index is a free float-adjusted market capitalization weighted index designed to measure the equity market performance of developed and emerging markets, excluding the United States. The term "free float" represents the portion of shares outstanding that are deemed to be available for purchase in the public equity markets by investors. The Index is unmanaged and its returns do not include any sales charges or fees. Such costs would lower performance. It is not possible to invest directly in an index.
(2) The Lipper International Multi-Cap Growth Funds Index is an equally weighted performance index of the largest qualifying funds (based on net assets) in the Lipper International Multi-Cap Growth Funds classification. The Index, which is adjusted for capital gains distributions and income dividends, is unmanaged and should not be considered an investment. There are currently 30 funds represented in this Index. As of the date of this report, the Fund was in the Lipper International Multi-Cap Growth Funds classification.
(3) Total returns for the Fund reflect fees waived and expenses reimbursed, if applicable, by the Adviser. Without such waivers and reimbursements, total returns would have been lower.
(4) Commenced operations on March 31, 2010.
(5) Commenced offering on September 13, 2013.
(6) Commenced offering on April 30, 2015.
(7) For comparative purposes, average annual since inception returns listed for the Indexes refer to the inception date of Class I of the Fund, not the inception of the Index.
5
Morgan Stanley Institutional Fund, Inc.
Annual Report — December 31, 2017
Portfolio of Investments
International Opportunity Portfolio
| | | Shares | | Value
(000) | |
Common Stocks (90.6%) | |
Argentina (1.8%) | |
Globant SA (a) | | | 240,835 | | | $ | 11,189 | | |
Belgium (1.6%) | |
Anheuser-Busch InBev N.V. | | | 86,565 | | | | 9,656 | | |
Brazil (0.9%) | |
Smiles Fidelidade SA | | | 247,556 | | | | 5,638 | | |
Canada (1.3%) | |
Brookfield Asset Management, Inc., Class A | | | 186,077 | | | | 8,102 | | |
China (24.2%) | |
Alibaba Group Holding Ltd. ADR (a) | | | 151,092 | | | | 26,053 | | |
China Lodging Group Ltd. ADR | | | 150,373 | | | | 21,718 | | |
China Resources Beer Holdings Co., Ltd. (b) | | | 2,684,666 | | | | 9,635 | | |
Foshan Haitian Flavouring & Food Co., Ltd.,
Class A | | | 1,841,597 | | | | 15,211 | | |
Jiangsu Hengrui Medicine Co., Ltd., Class A | | | 644,738 | | | | 6,824 | | |
Jiangsu Yanghe Brewery Joint-Stock Co.,
Ltd., Class A | | | 701,586 | | | | 12,387 | | |
Oppein Home Group, Inc. (a) | | | 90,949 | | | | 1,648 | | |
Suofeiya Home Collection Co., Ltd., Class A | | | 1,554,768 | | | | 8,782 | | |
TAL Education Group ADR | | | 1,011,912 | | | | 30,064 | | |
Tencent Holdings Ltd. (b) | | | 376,800 | | | | 19,479 | | |
| | | | 151,801 | | |
Denmark (5.0%) | |
DSV A/S | | | 394,511 | | | | 31,061 | | |
France (4.5%) | |
Hermes International | | | 53,118 | | | | 28,434 | | |
Germany (1.5%) | |
Adidas AG | | | 47,504 | | | | 9,483 | | |
India (3.5%) | |
HDFC Bank Ltd. | | | 741,424 | | | | 21,955 | | |
Italy (4.9%) | |
Moncler SpA | | | 988,290 | | | | 30,877 | | |
Japan (6.4%) | |
Calbee, Inc. | | | 442,600 | | | | 14,399 | | |
Keyence Corp. | | | 25,500 | | | | 14,238 | | |
Nihon M&A Center, Inc. | | | 234,900 | | | | 11,197 | | |
| | | | 39,834 | | |
Korea, Republic of (2.4%) | |
Loen Entertainment, Inc. | | | 33,038 | | | | 3,471 | | |
NAVER Corp. | | | 13,884 | | | | 11,273 | | |
| | | | 14,744 | | |
South Africa (2.6%) | |
Naspers Ltd., Class N | | | 57,893 | | | | 16,131 | | |
Sweden (3.1%) | |
RaySearch Laboratories AB (a) | | | 407,292 | | | | 8,489 | | |
Vitrolife AB | | | 147,277 | | | | 11,185 | | |
| | | | 19,674 | | |
Switzerland (3.1%) | |
Chocoladefabriken Lindt & Spruengli AG
(Registered) | | | 267 | | | | 19,306 | | |
| | | Shares | | Value
(000) | |
United Kingdom (12.2%) | |
Fevertree Drinks PLC | | | 606,908 | | | $ | 18,691 | | |
Just Eat PLC (a) | | | 1,351,648 | | | | 14,179 | | |
Reckitt Benckiser Group PLC | | | 335,364 | | | | 31,326 | | |
Rightmove PLC | | | 203,200 | | | | 12,341 | | |
| | | | 76,537 | | |
United States (11.6%) | |
CEVA, Inc. (a) | | | 127,562 | | | | 5,887 | | |
EPAM Systems, Inc. (a) | | | 309,077 | | | | 33,204 | | |
Luxoft Holding, Inc. (a) | | | 95,969 | | | | 5,345 | | |
MercadoLibre, Inc. | | | 18,118 | | | | 5,701 | | |
Priceline Group, Inc. (The) (a) | | | 13,030 | | | | 22,643 | | |
| | | | 72,780 | | |
| Total Common Stocks (Cost $484,873) | | | 567,202 | | |
Participation Notes (0.4%) | |
China (0.4%) | |
Jiangsu Yanghe Brewery, Class A,
Equity Linked Notes, expires 1/10/18 (a)
(Cost $1,554) | | | 151,200 | | | | 2,669 | | |
Short-Term Investment (9.8%) | |
Investment Company (9.8%) | |
Morgan Stanley Institutional Liquidity
Funds — Treasury Securities Portfolio —
Institutional Class (See Note G)
(Cost $61,592) | | | 61,592,484 | | | | 61,592 | | |
Total Investments Excluding Purchased
Options (100.8%) (Cost $548,019) | | | | | 631,463 | | |
Total Purchased Options Outstanding (0.0%)
(Cost $778) | | | 131 | | |
Total Investments (100.8%) (Cost $548,797) (c)(d) | | | 631,594 | | |
Liabilities in Excess of Other Assets (–0.8%) | | | (5,138 | ) | |
Net Assets (100.0%) | | $ | 626,456 | | |
Country assignments and aggregations are based generally on third party vendor classifications and information, and may be different from the assignments and aggregations under the policies set forth in the Fund's prospectus and/or statement of additional information relating to geographic classifications.
(a) Non-income producing security.
(b) Security trades on the Hong Kong exchange.
(c) The approximate fair value and percentage of net assets, $375,341,000 and 59.9%, respectively, represent the securities that have been fair valued under the fair valuation policy for international investments as described in Note A-1 within the Notes to the Financial Statements.
(d) At December 31, 2017, the aggregate cost for federal income tax purposes is approximately $549,682,000. The aggregate gross unrealized appreciation is approximately $85,753,000 and the aggregate gross unrealized depreciation is approximately $3,841,000, resulting in net unrealized appreciation of approximately $81,912,000.
ADR American Depositary Receipt.
The accompanying notes are an integral part of the financial statements.
6
Morgan Stanley Institutional Fund, Inc.
Annual Report — December 31, 2017
Portfolio of Investments (cont'd)
International Opportunity Portfolio
Call Options Purchased:
The Fund had the following call options purchased open at December 31, 2017:
Counterparty | | Description | | Strike
Price | | Expiration
Date | | Number of
Contracts | | Notional
Amount
(000) | | Value
(000) | | Premiums
Paid
(000) | | Unrealized
Depreciation
(000) | |
Royal Bank of Scotland | | USD/CNH | | CNH | 7.52 | | | Nov-18 | | | 115,004,380 | | | | 115,004 | | | $ | 112 | | | $ | 476 | | | $ | (364 | ) | |
Royal Bank of Scotland | | USD/CNH | | CNH | 7.55 | | | Aug-18 | | | 56,889,460 | | | | 56,889 | | | | 19 | | | | 302 | | | | (283 | ) | |
| | | | | | | | | | | | | $ | 131 | | | $ | 778 | | | $ | (647 | ) | |
CNH — Chinese Yuan Renminbi Offshore
USD — United States Dollar
Portfolio Composition
Classification | | Percentage of
Total Investments | |
Other* | | | 38.0 | % | |
Internet Software & Services | | | 14.1 | | |
Textiles, Apparel & Luxury Goods | | | 10.9 | | |
Short-Term Investments | | | 9.8 | | |
Beverages | | | 8.4 | | |
Food Products | | | 7.7 | | |
Information Technology Services | | | 6.1 | | |
Household Products | | | 5.0 | | |
Total Investments | | | 100.0 | % | |
* Industries and/or investment types representing less than 5% of total investments.
The accompanying notes are an integral part of the financial statements.
7
Morgan Stanley Institutional Fund, Inc.
Annual Report — December 31, 2017
International Opportunity Portfolio
Statement of Assets and Liabilities | | December 31, 2017
(000) | |
Assets: | |
Investments in Securities of Unaffiliated Issuers, at Value (Cost $487,205) | | $ | 570,002 | | |
Investment in Security of Affiliated Issuer, at Value (Cost $61,592) | | | 61,592 | | |
Total Investments in Securities, at Value (Cost $548,797) | | | 631,594 | | |
Foreign Currency, at Value (Cost $269) | | | 269 | | |
Cash | | | 5 | | |
Receivable for Fund Shares Sold | | | 7,250 | | |
Receivable for Investments Sold | | | 89 | | |
Tax Reclaim Receivable | | | 63 | | |
Receivable from Affiliate | | | 50 | | |
Dividends Receivable | | | 3 | | |
Receivable from Securities Lending Income | | | — | @ | |
Other Assets | | | 70 | | |
Total Assets | | | 639,393 | | |
Liabilities: | |
Payable for Investments Purchased | | | 11,124 | | |
Payable for Advisory Fees | | | 902 | | |
Deferred Capital Gain Country Tax | | | 351 | | |
Due to Broker | | | 170 | | |
Payable for Fund Shares Redeemed | | | 131 | | |
Payable for Shareholder Services Fees — Class A | | | 37 | | |
Payable for Distribution and Shareholder Services Fees — Class L | | | — | @ | |
Payable for Distribution and Shareholder Services Fees — Class C | | | 18 | | |
Payable for Custodian Fees | | | 54 | | |
Payable for Professional Fees | | | 53 | | |
Payable for Administration Fees | | | 39 | | |
Payable for Sub Transfer Agency Fees — Class I | | | 24 | | |
Payable for Sub Transfer Agency Fees — Class A | | | 1 | | |
Payable for Sub Transfer Agency Fees — Class L | | | — | @ | |
Payable for Sub Transfer Agency Fees — Class C | | | 2 | | |
Payable for Transfer Agency Fees — Class I | | | 6 | | |
Payable for Transfer Agency Fees — Class A | | | 1 | | |
Payable for Transfer Agency Fees — Class L | | | — | @ | |
Payable for Transfer Agency Fees — Class C | | | 1 | | |
Payable for Transfer Agency Fees — Class IS | | | — | @ | |
Other Liabilities | | | 23 | | |
Total Liabilities | | | 12,937 | | |
Net Assets | | $ | 626,456 | | |
Net Assets Consist Of: | |
Paid-in-Capital | | $ | 542,491 | | |
Accumulated Net Investment Loss | | | (9 | ) | |
Accumulated Net Realized Gain | | | 1,531 | | |
Unrealized Appreciation (Depreciation) on: | |
Investments (Net of $351 of Deferred Capital Gain Country Tax) | | | 82,446 | | |
Foreign Currency Translations | | | (3 | ) | |
Net Assets | | $ | 626,456 | | |
The accompanying notes are an integral part of the financial statements.
8
Morgan Stanley Institutional Fund, Inc.
Annual Report — December 31, 2017
International Opportunity Portfolio
Statement of Assets and Liabilities (cont'd) | | December 31, 2017
(000) | |
CLASS I: | |
Net Assets | | $ | 358,141 | | |
| Shares Outstanding $0.001 par value shares of beneficial interest (unlimited shares authorized) (not in 000's) | | | 15,901,685 | | |
Net Asset Value, Offering and Redemption Price Per Share | | $ | 22.52 | | |
CLASS A: | |
Net Assets | | $ | 186,988 | | |
| Shares Outstanding $0.001 par value shares of beneficial interest (unlimited shares authorized) (not in 000's) | | | 8,405,149 | | |
Net Asset Value, Redemption Price Per Share | | $ | 22.25 | | |
Maximum Sales Load | | | 5.25 | % | |
Maximum Sales Charge | | $ | 1.23 | | |
Maximum Offering Price Per Share | | $ | 23.48 | | |
CLASS L: | |
Net Assets | | $ | 364 | | |
| Shares Outstanding $0.001 par value shares of beneficial interest (unlimited shares authorized) (not in 000's) | | | 16,839 | | |
Net Asset Value, Offering and Redemption Price Per Share | | $ | 21.63 | | |
CLASS C: | |
Net Assets | | $ | 23,334 | | |
| Shares Outstanding $0.001 par value shares of beneficial interest (unlimited shares authorized) (not in 000's) | | | 1,087,545 | | |
Net Asset Value, Offering and Redemption Price Per Share | | $ | 21.46 | | |
CLASS IS: | |
Net Assets | | $ | 57,629 | | |
| Shares Outstanding $0.001 par value shares of beneficial interest (unlimited shares authorized) (not in 000's) | | | 2,556,761 | | |
Net Asset Value, Offering and Redemption Price Per Share | | $ | 22.54 | | |
@ Amount is less than $500.
The accompanying notes are an integral part of the financial statements.
9
Morgan Stanley Institutional Fund, Inc.
Annual Report — December 31, 2017
International Opportunity Portfolio
Statement of Operations | | Year Ended
December 31, 2017
(000) | |
Investment Income: | |
Dividends from Securities of Unaffiliated Issuers (Net of $104 of Foreign Taxes Withheld) | | $ | 1,249 | | |
Dividends from Security of Affiliated Issuer (Note G) | | | 202 | | |
Income from Securities Loaned — Net | | | 7 | | |
Total Investment Income | | | 1,458 | | |
Expenses: | |
Advisory Fees (Note B) | | | 2,150 | | |
Shareholder Services Fees — Class A (Note D) | | | 198 | | |
Distribution and Shareholder Services Fees — Class L (Note D) | | | 2 | | |
Distribution and Shareholder Services Fees — Class C (Note D) | | | 108 | | |
Administration Fees (Note C) | | | 215 | | |
Sub Transfer Agency Fees — Class I | | | 115 | | |
Sub Transfer Agency Fees — Class A | | | 71 | | |
Sub Transfer Agency Fees — Class L | | | — | @ | |
Sub Transfer Agency Fees — Class C | | | 5 | | |
Professional Fees | | | 125 | | |
Registration Fees | | | 88 | | |
Custodian Fees (Note F) | | | 82 | | |
Transfer Agency Fees — Class I (Note E) | | | 20 | | |
Transfer Agency Fees — Class A (Note E) | | | 5 | | |
Transfer Agency Fees — Class L (Note E) | | | 2 | | |
Transfer Agency Fees — Class C (Note E) | | | 4 | | |
Transfer Agency Fees — Class IS (Note E) | | | 2 | | |
Shareholder Reporting Fees | | | 26 | | |
Directors' Fees and Expenses | | | 8 | | |
Pricing Fees | | | 6 | | |
Other Expenses | | | 31 | | |
Total Expenses | | | 3,263 | | |
Waiver of Advisory Fees (Note B) | | | (204 | ) | |
Rebate from Morgan Stanley Affiliate (Note G) | | | (43 | ) | |
Reimbursement of Class Specific Expenses — Class I (Note B) | | | (37 | ) | |
Reimbursement of Class Specific Expenses — Class L (Note B) | | | (2 | ) | |
Reimbursement of Class Specific Expenses — Class IS (Note B) | | | (2 | ) | |
Net Expenses | | | 2,975 | | |
Net Investment Loss | | | (1,517 | ) | |
Realized Gain: | |
Investments Sold | | | 11,818 | | |
Foreign Currency Transactions | | | 30 | | |
Realized Gain | | | 11,848 | | |
Change in Unrealized Appreciation (Depreciation): | |
Investments (Net of Increase in Deferred Capital Gain Country Tax of $351) | | | 79,820 | | |
Foreign Currency Translations | | | (1 | ) | |
Net Change in Unrealized Appreciation (Depreciation) | | | 79,819 | | |
Net Realized Gain and Change in Unrealized Appreciation (Depreciation) | | | 91,667 | | |
Net Increase in Net Assets Resulting from Operations | | $ | 90,150 | | |
@ Amount is less than $500.
The accompanying notes are an integral part of the financial statements.
10
Morgan Stanley Institutional Fund, Inc.
Annual Report — December 31, 2017
International Opportunity Portfolio
Statements of Changes in Net Assets | | Year Ended
December 31, 2017
(000) | | Year Ended
December 31, 2016
(000) | |
Increase (Decrease) in Net Assets: | |
Operations: | |
Net Investment Loss | | $ | (1,517 | ) | | $ | (222 | ) | |
Net Realized Gain | | | 11,848 | | | | 952 | | |
Net Change in Unrealized Appreciation (Depreciation) | | | 79,819 | | | | (174 | ) | |
Net Increase in Net Assets Resulting from Operations | | | 90,150 | | | | 556 | | |
Distributions from and/or in Excess of: | |
Class I: | |
Net Investment Income | | | — | | | | (10 | ) | |
Net Realized Gain | | | (5,012 | ) | | | — | | |
Class A: | |
Net Realized Gain | | | (2,793 | ) | | | — | | |
Class L: | |
Net Realized Gain | | | (6 | ) | | | — | | |
Class C: | |
Net Realized Gain | | | (360 | ) | | | — | | |
Class IS: | |
Net Investment Income | | | — | | | | (— | @) | |
Net Realized Gain | | | (849 | ) | | | — | | |
Total Distributions | | | (9,020 | ) | | | (10 | ) | |
Capital Share Transactions:(1) | |
Class I: | |
Subscribed | | | 267,962 | | | | 38,010 | | |
Distributions Reinvested | | | 5,005 | | | | 10 | | |
Redeemed | | | (29,983 | ) | | | (28,192 | ) | |
Class A: | |
Subscribed | | | 177,334 | | | | 11,094 | | |
Distributions Reinvested | | | 2,793 | | | | — | | |
Redeemed | | | (26,941 | ) | | | (8,975 | ) | |
Class L: | |
Exchanged | | | 42 | | | | 146 | | |
Distributions Reinvested | | | 6 | | | | — | | |
Redeemed | | | (16 | ) | | | (190 | ) | |
Class C: | |
Subscribed | | | 19,131 | | | | 722 | | |
Distributions Reinvested | | | 360 | | | | — | | |
Redeemed | | | (1,137 | ) | | | (604 | ) | |
Class IS: | |
Subscribed | | | 53,039 | | | | 1,008 | | |
Distributions Reinvested | | | 848 | | | | — | | |
Redeemed | | | (443 | ) | | | — | | |
Net Increase in Net Assets Resulting from Capital Share Transactions | | | 468,000 | | | | 13,029 | | |
Redemption Fees | | | 46 | | | | 3 | | |
Total Increase in Net Assets | | | 549,176 | | | | 13,578 | | |
Net Assets: | |
Beginning of Period | | | 77,280 | | | | 63,702 | | |
End of Period (Including Accumulated Net Investment Loss and Distributions in Excess of
Net Investment Income of $(9) and $(35), respectively) | | $ | 626,456 | | | $ | 77,280 | | |
The accompanying notes are an integral part of the financial statements.
11
Morgan Stanley Institutional Fund, Inc.
Annual Report — December 31, 2017
International Opportunity Portfolio
Statements of Changes in Net Assets (cont'd) | | Year Ended
December 31, 2017
(000) | | Year Ended
December 31, 2016
(000) | |
(1) Capital Share Transactions: | |
Class I: | |
Shares Subscribed | | | 13,008 | | | | 2,611 | | |
Shares Issued on Distributions Reinvested | | | 228 | | | | 1 | | |
Shares Redeemed | | | (1,515 | ) | | | (1,900 | ) | |
Net Increase in Class I Shares Outstanding | | | 11,721 | | | | 712 | | |
Class A: | |
Shares Subscribed | | | 8,781 | | | | 764 | | |
Shares Issued on Distributions Reinvested | | | 129 | | | | — | | |
Shares Redeemed | | | (1,298 | ) | | | (609 | ) | |
Net Increase in Class A Shares Outstanding | | | 7,612 | | | | 155 | | |
Class L: | |
Shares Exchanged | | | 3 | | | | 10 | | |
Shares Issued on Distributions Reinvested | | | — | @@ | | | — | | |
Shares Redeemed | | | (1 | ) | | | (13 | ) | |
Net Increase (Decrease) in Class L Shares Outstanding | | | 2 | | | | (3 | ) | |
Class C: | |
Shares Subscribed | | | 999 | | | | 50 | | |
Shares Issued on Distributions Reinvested | | | 17 | | | | — | | |
Shares Redeemed | | | (58 | ) | | | (42 | ) | |
Net Increase in Class C Shares Outstanding | | | 958 | | | | 8 | | |
Class IS: | |
Shares Subscribed | | | 2,471 | | | | 68 | | |
Shares Issued on Distributions Reinvested | | | 38 | | | | — | | |
Shares Redeemed | | | (21 | ) | | | — | | |
Net Increase in Class IS Shares Outstanding | | | 2,488 | | | | 68 | | |
@ Amount is less than $500.
@@ Amount is less than 500 shares.
The accompanying notes are an integral part of the financial statements.
12
Morgan Stanley Institutional Fund, Inc.
Annual Report — December 31, 2017
Financial Highlights
International Opportunity Portfolio
| | | Class I | |
| | | Year Ended December 31, | |
Selected Per Share Data and Ratios | | 2017 | | 2016(1) | | 2015 | | 2014 | | 2013 | |
Net Asset Value, Beginning of Period | | $ | 14.93 | | | $ | 15.03 | | | $ | 13.92 | | | $ | 13.77 | | | $ | 11.19 | | |
Income (Loss) from Investment Operations: | |
Net Investment Income (Loss)(2) | | | (0.08 | ) | | | (0.03 | ) | | | (0.00 | )(3) | | | 0.08 | | | | 0.10 | | |
Net Realized and Unrealized Gain (Loss) | | | 8.04 | | | | (0.07 | ) | | | 1.58 | | | | 0.36 | | | | 2.85 | | |
Total from Investment Operations | | | 7.96 | | | | (0.10 | ) | | | 1.58 | | | | 0.44 | | | | 2.95 | | |
Distributions from and/or in Excess of: | |
Net Investment Income | | | — | | | | (0.00 | )(3) | | | (0.03 | ) | | | (0.01 | ) | | | (0.09 | ) | |
Net Realized Gain | | | (0.37 | ) | | | — | | | | (0.44 | ) | | | (0.28 | ) | | | (0.28 | ) | |
Total Distributions | | | (0.37 | ) | | | (0.00 | )(3) | | | (0.47 | ) | | | (0.29 | ) | | | (0.37 | ) | |
Redemption Fees | | | 0.00 | (3) | | | 0.00 | (3) | | | 0.00 | (3) | | | 0.00 | (3) | | | — | | |
Net Asset Value, End of Period | | $ | 22.52 | | | $ | 14.93 | | | $ | 15.03 | | | $ | 13.92 | | | $ | 13.77 | | |
Total Return(4) | | | 53.38 | % | | | (0.65 | )% | | | 11.40 | % | | | 3.14 | % | | | 26.47 | % | |
Ratios and Supplemental Data: | |
Net Assets, End of Period (Thousands) | | $ | 358,141 | | | $ | 62,440 | | | $ | 52,128 | | | $ | 10,943 | | | $ | 7,647 | | |
Ratio of Expenses to Average Net Assets(8) | | | 0.98 | %(5) | | | 1.00 | %(5) | | | 1.01 | %(5)(6) | | | 1.09 | %(5) | | | 1.13 | %(5) | |
Ratio of Net Investment Income (Loss) to Average Net Assets(8) | | | (0.42 | )%(5) | | | (0.22 | )%(5) | | | (0.01 | )%(5) | | | 0.57 | %(5) | | | 0.82 | %(5) | |
Ratio of Rebate from Morgan Stanley Affiliates to Average Net Assets | | | 0.02 | % | | | 0.00 | %(7) | | | 0.01 | % | | | 0.01 | % | | | 0.01 | % | |
Portfolio Turnover Rate | | | 30 | % | | | 42 | % | | | 51 | % | | | 33 | % | | | 40 | % | |
(8) Supplemental Information on the Ratios to Average Net Assets: | |
Ratios Before Expense Limitation: | |
Expenses to Average Net Assets | | | 1.10 | % | | | 1.34 | % | | | 1.95 | % | | | 3.25 | % | | | 3.84 | % | |
Net Investment Loss to Average Net Assets | | | (0.54 | )% | | | (0.56 | )% | | | (0.95 | )% | | | (1.59 | )% | | | (1.89 | )% | |
(1) Reflects prior period custodian out-of-pocket expenses that were reimbursed in September 2016. The amount of the reimbursement was immaterial on a per share basis and did not impact the total return of Class I shares. The Ratio of Expenses to Average Net Assets and the Ratio of Net Investment Loss to Average Net Assets would be unchanged as the reimbursement of custodian fees was offset against expense waivers/reimbursements with no impact to net expenses or net investment loss.
(2) Per share amount is based on average shares outstanding.
(3) Amount is less than $0.005 per share.
(4) Calculated based on the net asset value as of the last business day of the period.
(5) The Ratios of Expenses and Net Investment Income (Loss) reflect the rebate of certain Fund expenses in connection with the investments in Morgan Stanley affiliates during the period. The effect of the rebate on the ratios is disclosed in the above table as "Ratio of Rebate from Morgan Stanley Affiliates to Average Net Assets."
(6) Effective July 1, 2015, the Adviser has agreed to limit the ratio of expenses to average net assets to the maximum ratio of 1.00% for Class I shares. Prior to July 1, 2015, the maximum ratio was 1.15% for Class I shares.
(7) Amount is less than 0.005%.
The accompanying notes are an integral part of the financial statements.
13
Morgan Stanley Institutional Fund, Inc.
Annual Report — December 31, 2017
Financial Highlights
International Opportunity Portfolio
| | | Class A | |
| | | Year Ended December 31, | |
Selected Per Share Data and Ratios | | 2017 | | 2016(1) | | 2015 | | 2014 | | 2013 | |
Net Asset Value, Beginning of Period | | $ | 14.79 | | | $ | 14.93 | | | $ | 13.87 | | | $ | 13.78 | | | $ | 11.19 | | |
Income (Loss) from Investment Operations: | |
Net Investment Income (Loss)(2) | | | (0.15 | ) | | | (0.08 | ) | | | (0.06 | ) | | | 0.01 | | | | 0.02 | | |
Net Realized and Unrealized Gain (Loss) | | | 7.98 | | | | (0.06 | ) | | | 1.57 | | | | 0.37 | | | | 2.89 | | |
Total from Investment Operations | | | 7.83 | | | | (0.14 | ) | | | 1.51 | | | | 0.38 | | | | 2.91 | | |
Distributions from and/or in Excess of: | |
Net Investment Income | | | — | | | | — | | | | (0.01 | ) | | | (0.01 | ) | | | (0.04 | ) | |
Net Realized Gain | | | (0.37 | ) | | | — | | | | (0.44 | ) | | | (0.28 | ) | | | (0.28 | ) | |
Total Distributions | | | (0.37 | ) | | | — | | | | (0.45 | ) | | | (0.29 | ) | | | (0.32 | ) | |
Redemption Fees | | | 0.00 | (3) | | | 0.00 | (3) | | | 0.00 | (3) | | | 0.00 | (3) | | | — | | |
Net Asset Value, End of Period | | $ | 22.25 | | | $ | 14.79 | | | $ | 14.93 | | | $ | 13.87 | | | $ | 13.78 | | |
Total Return(4) | | | 53.01 | % | | | (1.00 | )% | | | 10.99 | % | | | 2.71 | % | | | 26.12 | % | |
Ratios and Supplemental Data: | |
Net Assets, End of Period (Thousands) | | $ | 186,988 | | | $ | 11,727 | | | $ | 9,520 | | | $ | 992 | | | $ | 275 | | |
Ratio of Expenses to Average Net Assets(9) | | | 1.27 | %(5) | | | 1.35 | %(5) | | | 1.34 | %(5)(7) | | | 1.49 | %(5) | | | 1.44 | %(5)(6) | |
Ratio of Net Investment Income (Loss) to Average Net Assets(9) | | | (0.74 | )%(5) | | | (0.55 | )%(5) | | | (0.39 | )%(5) | | | 0.04 | %(5) | | | 0.13 | %(5) | |
Ratio of Rebate from Morgan Stanley Affiliates to Average Net Assets | | | 0.02 | % | | | 0.00 | %(8) | | | 0.01 | % | | | 0.01 | % | | | 0.01 | % | |
Portfolio Turnover Rate | | | 30 | % | | | 42 | % | | | 51 | % | | | 33 | % | | | 40 | % | |
(9) Supplemental Information on the Ratios to Average Net Assets: | |
Ratios Before Expense Limitation: | |
Expenses to Average Net Assets | | | 1.36 | % | | | 1.66 | % | | | 2.28 | % | | | 3.81 | % | | | 4.49 | % | |
Net Investment Loss to Average Net Assets | | | (0.83 | )% | | | (0.86 | )% | | | (1.33 | )% | | | (2.28 | )% | | | (2.92 | )% | |
(1) Reflects prior period custodian out-of-pocket expenses that were reimbursed in September 2016. The amount of the reimbursement was immaterial on a per share basis and did not impact the total return of Class A shares. The Ratio of Expenses to Average Net Assets and the Ratio of Net Investment Loss to Average Net Assets would be unchanged as the reimbursement of custodian fees was offset against expense waivers/reimbursements with no impact to net expenses or net investment loss.
(2) Per share amount is based on average shares outstanding.
(3) Amount is less than $0.005 per share.
(4) Calculated based on the net asset value which does not reflect sales charges, if applicable, as of the last business day of the period.
(5) The Ratios of Expenses and Net Investment Income (Loss) reflect the rebate of certain Fund expenses in connection with the investments in Morgan Stanley affiliates during the period. The effect of the rebate on the ratios is disclosed in the above table as "Ratio of Rebate from Morgan Stanley Affiliates to Average Net Assets."
(6) Effective September 16, 2013, the Adviser has agreed to limit the ratio of expenses to average net assets to the maximum ratio of 1.50% for Class A shares. Prior to September 16, 2013, the maximum ratio was 1.40% for Class A shares.
(7) Effective July 1, 2015, the Adviser has agreed to limit the ratio of expenses to average net assets to the maximum ratio of 1.35% for Class A shares. Prior to July 1, 2015, the maximum ratio was 1.50% for Class A shares.
(8) Amount is less than 0.005%.
The accompanying notes are an integral part of the financial statements.
14
Morgan Stanley Institutional Fund, Inc.
Annual Report — December 31, 2017
Financial Highlights
International Opportunity Portfolio
| | | Class L | |
| | | Year Ended December 31, | |
Selected Per Share Data and Ratios | | 2017 | | 2016(1) | | 2015 | | 2014 | | 2013 | |
Net Asset Value, Beginning of Period | | $ | 14.47 | | | $ | 14.69 | | | $ | 13.71 | | | $ | 13.68 | | | $ | 11.13 | | |
Income (Loss) from Investment Operations: | |
Net Investment Loss(2) | | | (0.22 | ) | | | (0.14 | ) | | | (0.12 | ) | | | (0.05 | ) | | | (0.00 | )(3) | |
Net Realized and Unrealized Gain (Loss) | | | 7.75 | | | | (0.08 | ) | | | 1.54 | | | | 0.36 | | | | 2.83 | | |
Total from Investment Operations | | | 7.53 | | | | (0.22 | ) | | | 1.42 | | | | 0.31 | | | | 2.83 | | |
Distributions from and/or in Excess of: | |
Net Realized Gain | | | (0.37 | ) | | | — | | | | (0.44 | ) | | | (0.28 | ) | | | (0.28 | ) | |
Redemption Fees | | | 0.00 | (3) | | | 0.00 | (3) | | | 0.00 | (3) | | | 0.00 | (3) | | | — | | |
Net Asset Value, End of Period | | $ | 21.63 | | | $ | 14.47 | | | $ | 14.69 | | | $ | 13.71 | | | $ | 13.68 | | |
Total Return(4) | | | 52.11 | % | | | (1.50 | )% | | | 10.38 | % | | | 2.24 | % | | | 25.49 | % | |
Ratios and Supplemental Data: | |
Net Assets, End of Period (Thousands) | | $ | 364 | | | $ | 221 | | | $ | 266 | | | $ | 193 | | | $ | 137 | | |
Ratio of Expenses to Average Net Assets(9) | | | 1.84 | %(5) | | | 1.85 | %(5) | | | 1.91 | %(5)(7) | | | 1.99 | %(5) | | | 1.92 | %(5)(6) | |
Ratio of Net Investment Loss to Average Net Assets(9) | | | (1.16 | )%(5) | | | (1.00 | )%(5) | | | (0.80 | )%(5) | | | (0.38 | )%(5) | | | (0.00 | )%(5)(8) | |
Ratio of Rebate from Morgan Stanley Affiliates to Average Net Assets | | | 0.01 | % | | | 0.00 | %(8) | | | 0.01 | % | | | 0.01 | % | | | 0.01 | % | |
Portfolio Turnover Rate | | | 30 | % | | | 42 | % | | | 51 | % | | | 33 | % | | | 40 | % | |
(9) Supplemental Information on the Ratios to Average Net Assets: | |
Ratios Before Expense Limitation: | |
Expenses to Average Net Assets | | | 2.51 | % | | | 3.16 | % | | | 3.54 | % | | | 5.06 | % | | | 4.91 | % | |
Net Investment Loss to Average Net Assets | | | (1.83 | )% | | | (2.31 | )% | | | (2.43 | )% | | | (3.45 | )% | | | (2.99 | )% | |
(1) Reflects prior period custodian out-of-pocket expenses that were reimbursed in September 2016. The amount of the reimbursement was immaterial on a per share basis and did not impact the total return of Class L shares. The Ratio of Expenses to Average Net Assets and the Ratio of Net Investment Loss to Average Net Assets would be unchanged as the reimbursement of custodian fees was offset against expense waivers/reimbursements with no impact to net expenses or net investment loss.
(2) Per share amount is based on average shares outstanding.
(3) Amount is less than $0.005 per share.
(4) Calculated based on the net asset value as of the last business day of the period.
(5) The Ratios of Expenses and Net Investment Loss reflect the rebate of certain Fund expenses in connection with the investments in Morgan Stanley affiliates during the period. The effect of the rebate on the ratios is disclosed in the above table as "Ratio of Rebate from Morgan Stanley Affiliates to Average Net Assets."
(6) Effective September 16, 2013, the Adviser has agreed to limit the ratio of expenses to average net assets to the maximum ratio of 2.00% for Class L shares. Prior to September 16, 2013, the maximum ratio was 1.90% for Class L shares.
(7) Effective July 1, 2015, the Adviser has agreed to limit the ratio of expenses to average net assets to the maximum ratio of 1.85% for Class L shares. Prior to July 1, 2015, the maximum ratio was 2.00% for Class L shares.
(8) Amount is less than 0.005%.
The accompanying notes are an integral part of the financial statements.
15
Morgan Stanley Institutional Fund, Inc.
Annual Report — December 31, 2017
Financial Highlights
International Opportunity Portfolio
| | | Class C | |
| | | Year Ended December 31, | | Period from
April 30, 2015(2) to | |
Selected Per Share Data and Ratios | | 2017 | | 2016(1) | | December 31, 2015 | |
Net Asset Value, Beginning of Period | | $ | 14.39 | | | $ | 14.63 | | | $ | 15.39 | | |
Income (Loss) from Investment Operations: | |
Net Investment Loss(3) | | | (0.29 | ) | | | (0.19 | ) | | | (0.13 | ) | |
Net Realized and Unrealized Gain (Loss) | | | 7.73 | | | | (0.05 | ) | | | (0.16 | ) | |
Total from Investment Operations | | | 7.44 | | | | (0.24 | ) | | | (0.29 | ) | |
Distributions from and/or in Excess of: | |
Net Investment Income | | | — | | | | — | | | | (0.03 | ) | |
Net Realized Gain | | | (0.37 | ) | | | — | | | | (0.44 | ) | |
Total Distributions | | | (0.37 | ) | | | — | | | | (0.47 | ) | |
Redemption Fees | | | 0.00 | (4) | | | 0.00 | (4) | | | 0.00 | (4) | |
Net Asset Value, End of Period | | $ | 21.46 | | | $ | 14.39 | | | $ | 14.63 | | |
Total Return(5) | | | 51.77 | % | | | (1.71 | )% | | | (1.85 | )%(9) | |
Ratios and Supplemental Data: | |
Net Assets, End of Period (Thousands) | | $ | 23,334 | | | $ | 1,862 | | | $ | 1,776 | | |
Ratio of Expenses to Average Net Assets(11) | | | 2.01 | %(6) | | | 2.10 | %(6) | | | 2.10 | %(6)(7)(10) | |
Ratio of Net Investment Loss to Average Net Assets(11) | | | (1.45 | )%(6) | | | (1.32 | )%(6) | | | (1.28 | )%(6)(10) | |
Ratio of Rebate from Morgan Stanley Affiliates to Average Net Assets | | | 0.02 | % | | | 0.00 | %(8) | | | 0.01 | %(10) | |
Portfolio Turnover Rate | | | 30 | % | | | 42 | % | | | 51 | % | |
(11) Supplemental Information on the Ratios to Average Net Assets: | |
Ratios Before Expense Limitation: | |
Expense to Average Net Assets | | | 2.10 | % | | | 2.43 | % | | | 3.03 | %(10) | |
Net Investment Loss to Average Net Assets | | | (1.54 | )% | | | (1.65 | )% | | | (2.21 | )%(10) | |
(1) Reflects prior period custodian out-of-pocket expenses that were reimbursed in September 2016. The amount of the reimbursement was immaterial on a per share basis and did not impact the total return of Class C shares. The Ratio of Expenses to Average Net Assets and the Ratio of Net Investment Loss to Average Net Assets would be unchanged as the reimbursement of custodian fees was offset against expense waivers/reimbursements with no impact to net expenses or net investment loss.
(2) Commencement of Offering.
(3) Per share amount is based on average shares outstanding.
(4) Amount is less than $0.005 per share.
(5) Calculated based on the net asset value which does not reflect sales charges, if applicable, as of the last business day of the period.
(6) The Ratios of Expenses and Net Investment Loss reflect the rebate of certain Fund expenses in connection with the investments in Morgan Stanley affiliates during the period. The effect of the rebate on the ratios is disclosed in the above table as "Ratio of Rebate from Morgan Stanley Affiliates to Average Net Assets."
(7) Effective July 1, 2015, the Adviser has agreed to limit the ratio of expenses to average net assets to the maximum ratio of 2.10% for Class C shares. Prior to July 1, 2015, the maximum ratio was 2.25% for Class C shares.
(8) Amount is less than 0.005%.
(9) Not annualized.
(10) Annualized.
The accompanying notes are an integral part of the financial statements.
16
Morgan Stanley Institutional Fund, Inc.
Annual Report — December 31, 2017
Financial Highlights
International Opportunity Portfolio
| | | Class IS | |
| | | Year Ended December 31, | | Period from
September 13, 2013(2) to | |
Selected Per Share Data and Ratios | | 2017 | | 2016(1) | | 2015 | | 2014 | | December 31, 2013 | |
Net Asset Value, Beginning of Period | | $ | 14.94 | | | $ | 15.03 | | | $ | 13.92 | | | $ | 13.77 | | | $ | 12.75 | | |
Income (Loss) from Investment Operations: | |
Net Investment Income (Loss)(3) | | | (0.12 | ) | | | (0.03 | ) | | | 0.02 | | | | 0.07 | | | | (0.02 | ) | |
Net Realized and Unrealized Gain (Loss) | | | 8.09 | | | | (0.06 | ) | | | 1.56 | | | | 0.37 | | | | 1.41 | | |
Total from Investment Operations | | | 7.97 | | | | (0.09 | ) | | | 1.58 | | | | 0.44 | | | | 1.39 | | |
Distributions from and/or in Excess of: | |
Net Investment Income | | | — | | | | (0.00 | )(4) | | | (0.03 | ) | | | (0.01 | ) | | | (0.09 | ) | |
Net Realized Gain | | | (0.37 | ) | | | — | | | | (0.44 | ) | | | (0.28 | ) | | | (0.28 | ) | |
Total Distributions | | | (0.37 | ) | | | (0.00 | )(4) | | | (0.47 | ) | | | (0.29 | ) | | | (0.37 | ) | |
Redemption Fees | | | 0.00 | (4) | | | 0.00 | (4) | | | 0.00 | (4) | | | 0.00 | (4) | | | — | | |
Net Asset Value, End of Period | | $ | 22.54 | | | $ | 14.94 | | | $ | 15.03 | | | $ | 13.92 | | | $ | 13.77 | | |
Total Return(5) | | | 53.41 | % | | | (0.64 | )% | | | 11.40 | % | | | 3.22 | % | | | 10.96 | %(10) | |
Ratios and Supplemental Data: | |
Net Assets, End of Period (Thousands) | | $ | 57,629 | | | $ | 1,030 | | | $ | 12 | | | $ | 11 | | | $ | 11 | | |
Ratio of Expenses to Average Net Assets(12) | | | 0.92 | %(6) | | | 0.93 | %(6) | | | 1.01 | %(6)(8) | | | 1.08 | %(6) | | | 1.08 | %(6)(7)(11) | |
Ratio of Net Investment Income (Loss) to Average Net Assets(12) | | | (0.56 | )%(6) | | | (0.20 | )%(6) | | | 0.12 | %(6) | | | 0.51 | %(6) | | | (0.47 | )%(6)(11) | |
Ratio of Rebate from Morgan Stanley Affiliates to Average Net Assets | | | 0.02 | % | | | 0.01 | % | | | 0.00 | %(9) | | | 0.01 | % | | | 0.01 | %(11) | |
Portfolio Turnover Rate | | | 30 | % | | | 42 | % | | | 51 | % | | | 33 | % | | | 40 | % | |
(12) Supplemental Information on the Ratios to Average Net Assets: | |
Ratios Before Expense Limitation: | |
Expenses to Average Net Assets | | | 1.03 | % | | | 5.64 | % | | | 15.79 | % | | | 20.64 | % | | | 9.61 | %(11) | |
Net Investment Loss to Average Net Assets | | | (0.67 | )% | | | (4.91 | )% | | | (14.66 | )% | | | (19.05 | )% | | | (9.00 | )%(11) | |
(1) Reflects prior period custodian out-of-pocket expenses that were reimbursed in September 2016. The amount of the reimbursement was immaterial on a per share basis and did not impact the total return of Class IS shares. The Ratio of Expenses to Average Net Assets and the Ratio of Net Investment Loss to Average Net Assets would be unchanged as the reimbursement of custodian fees was offset against expense waivers/reimbursements with no impact to net expenses or net investment loss.
(2) Commencement of Offering.
(3) Per share amount is based on average shares outstanding.
(4) Amount is less than $0.005 per share.
(5) Calculated based on the net asset value as of the last business day of the period.
(6) The Ratios of Expenses and Net Investment Income (Loss) reflect the rebate of certain Fund expenses in connection with the investments in Morgan Stanley affiliates during the period. The effect of the rebate on the ratios is disclosed in the above table as "Ratio of Rebate from Morgan Stanley Affiliates to Average Net Assets."
(7) Effective September 16, 2013, the Adviser has agreed to limit the ratio of expenses to average net assets to the maximum ratio of 1.09% for Class IS shares.
(8) Effective July 1, 2015, the Adviser has agreed to limit the ratio of expenses to average net assets to the maximum ratio of 0.94% for Class IS shares. Prior to July 1, 2015, the maximum ratio was 1.09% for Class IS shares.
(9) Amount is less than 0.005%.
(10) Not annualized.
(11) Annualized.
The accompanying notes are an integral part of the financial statements.
17
Morgan Stanley Institutional Fund, Inc.
Annual Report — December 31, 2017
Notes to Financial Statements
Morgan Stanley Institutional Fund, Inc. (the "Company") is registered under the Investment Company Act of 1940, as amended (the "Act"), as an open-end management investment company. The Company is comprised of twenty-nine separate, active, diversified and non-diversified funds (individually referred to as a "Fund", collectively as the "Funds"). The Company applies investment company accounting and reporting guidance.
The accompanying financial statements relate to the International Opportunity Portfolio. The Fund seeks long-term capital appreciation.
The Fund offers five classes of shares — Class I, Class A, Class L, Class C and Class IS. On April, 30, 2015 the Fund suspended offering of Class L shares. Existing Class L shareholders may invest through reinvestment of dividends and distributions.
A. Significant Accounting Policies: The following significant accounting policies are in conformity with U.S. generally accepted accounting principles ("GAAP"). Such policies are consistently followed by the Company in the preparation of its financial statements. GAAP may require management to make estimates and assumptions that affect the reported amounts and disclosures in the financial statements. Actual results may differ from those estimates.
1. Security Valuation: (1) An equity portfolio security listed or traded on an exchange is valued at its latest reported sales price (or at the exchange official closing price if such exchange reports an official closing price), and if there were no sales on a given day and if there is no official exchange closing price for that day, the security is valued at the mean between the last reported bid and asked prices if such bid and asked prices are available on the relevant exchanges. Listed equity securities not traded on the valuation date with no reported bid and asked prices available on the exchange are valued at the mean between the current bid and asked prices obtained from one or more reputable brokers or dealers. In cases where a security is traded on more than one exchange, the security is valued on the exchange designated as the primary market; (2) all other equity portfolio securities for which over-the-counter ("OTC") market quotations are readily available are valued at the latest reported sales price (or at the market official closing price if such market reports an official closing price), and if there was no trading in the security on a given day and if there is no official closing
price from relevant markets for that day, the security is valued at the mean between the last reported bid and asked prices if such bid and asked prices are available on the relevant markets. An unlisted equity security that does not trade on the valuation date and for which bid and asked prices from the relevant markets are unavailable is valued at the mean between the current bid and asked prices obtained from one or more reputable brokers or dealers; (3) certain portfolio securities may be valued by an outside pricing service/vendor approved by the Company's Board of Directors (the "Directors"). The pricing service/vendor may employ a pricing model that takes into account, among other things, bids, yield spreads, and/or other market data and specific security characteristics. Alternatively, if a valuation is not available from an outside pricing service/vendor, and the security trades on an exchange, the security may be valued at its latest reported sale price (or at the exchange official closing price if such exchange reports an official closing price), prior to the time when assets are valued. If there are no sales on a given day and if there is no official exchange closing price for that day, the security is valued at the mean between the last reported bid and asked prices if such bid and asked prices are available in the relevant exchanges; (4) listed options are valued at the last reported sales price on the exchange on which they are listed (or at the exchange official closing price if such exchange reports an official closing price). If an official closing price or last reported sales price is unavailable, the listed option should be fair valued at the mean between its latest bid and ask prices. Unlisted options are valued at the mean between their latest bid and ask prices from a broker/dealer or valued by a pricing service/vendor; (5) when market quotations are not readily available, including circumstances under which Morgan Stanley Investment Management Inc. (the "Adviser") determines that the closing price, last sale price or the mean between the last reported bid and asked prices are not reflective of a security's market value, portfolio securities are valued at their fair value as determined in good faith under procedures established by and under the general supervision of the Directors. Occasionally, developments affecting the closing prices of securities and other assets may occur between the times at which valuations of such securities are determined (that is, close of the foreign market on which the securities trade) and the close of business of the New York Stock Exchange ("NYSE"). If developments occur during such periods that are expected
18
Morgan Stanley Institutional Fund, Inc.
Annual Report — December 31, 2017
Notes to Financial Statements (cont'd)
to materially affect the value of such securities, such valuations may be adjusted to reflect the estimated fair value of such securities as of the close of the NYSE, as determined in good faith by the Directors or by the Adviser using a pricing service and/or procedures approved by the Directors; (6) quotations of foreign portfolio securities, other assets and liabilities and forward contracts stated in foreign currency are translated into U.S. dollar equivalents at the prevailing market rates prior to the close of the NYSE; and (7) investments in mutual funds, including the Morgan Stanley Institutional Liquidity Funds, are valued at the net asset value ("NAV") as of the close of each business day.
The Directors have responsibility for determining in good faith the fair value of the investments, and the Directors may appoint others, such as the Company's Adviser or a valuation committee, to assist the Directors in determining fair value and to make the actual calculations pursuant to the fair valuation methodologies previously approved by the Directors. Under procedures approved by the Directors, the Company's Adviser has formed a Valuation Committee whose members are approved by the Directors. The Valuation Committee provides administration and oversight of the Company's valuation policies and procedures, which are reviewed at least annually by the Directors. These procedures allow the Company to utilize independent pricing services, quotations from securities and financial instrument dealers, and other market sources to determine fair value.
The Company has procedures to determine the fair value of securities and other financial instruments for which market prices are not readily available. Under these procedures, the Valuation Committee convenes on a regular and ad hoc basis to review such securities and considers a number of factors, including valuation methodologies and significant unobservable valuation inputs, when arriving at fair value. The Valuation Committee may employ a market-based approach which may use related or comparable assets or liabilities, recent transactions, market multiples, book values, and other relevant information for the investment to determine the fair value of the investment. An income-based valuation approach may also be used in which the anticipated future cash flows of the investment are discounted to calculate fair value. Discounts may also be applied due to the nature or duration of any restrictions on the disposition of the investments. Due to the inherent uncertainty of valuations of such investments, the
fair values may differ significantly from the values that would have been used had an active market existed. The Valuation Committee employs various methods for calibrating these valuation approaches including a regular review of valuation methodologies, key inputs and assumptions, transactional back-testing or disposition analysis, and reviews of any related market activity.
2. Fair Value Measurement: Financial Accounting Standards Board ("FASB") Accounting Standards CodificationTM ("ASC") 820, "Fair Value Measurement" ("ASC 820"), defines fair value as the value that the Fund would receive to sell an investment or pay to transfer a liability in a timely transaction with an independent buyer in the principal market, or in the absence of a principal market, the most advantageous market for the investment or liability. ASC 820 establishes a three-tier hierarchy to distinguish between (1) inputs that reflect the assumptions market participants would use in valuing an asset or liability developed based on market data obtained from sources independent of the reporting entity (observable inputs) and (2) inputs that reflect the reporting entity's own assumptions about the assumptions market participants would use in valuing an asset or liability developed based on the best information available in the circumstances (unobservable inputs) and to establish classification of fair value measurements for disclosure purposes. Various inputs are used in determining the value of the Fund's investments. The inputs are summarized in the three broad levels listed below.
• Level 1 – unadjusted quoted prices in active markets for identical investments
• Level 2 – other significant observable inputs (including quoted prices for similar investments, interest rates, prepayment speeds, credit risk, etc.)
• Level 3 – significant unobservable inputs including the Fund's own assumptions in determining the fair value of investments. Factors considered in making this determination may include, but are not limited to, information obtained by contacting the issuer, analysts, or the appropriate stock exchange (for exchange-traded securities), analysis of the issuer's financial statements or other available documents and, if necessary, available information concerning other securities in similar circumstances
19
Morgan Stanley Institutional Fund, Inc.
Annual Report — December 31, 2017
Notes to Financial Statements (cont'd)
The inputs or methodology used for valuing securities are not necessarily an indication of the risk associated with investing in those securities and the determination of the significance of a particular input to the fair value measurement in its entirety requires judgment and considers factors specific to each security.
The following is a summary of the inputs used to value the Fund's investments as of December 31, 2017.
Investment Type | | Level 1
Unadjusted
quoted
prices
(000) | | Level 2
Other
significant
observable
inputs
(000) | | Level 3
Significant
unobservable
inputs
(000) | | Total
(000) | |
Assets: | |
Common Stocks | |
Banks | | $ | — | | | $ | 21,955 | | | $ | — | | | $ | 21,955 | | |
Beverages | | | — | | | | 50,369 | | | | — | | | | 50,369 | | |
Biotechnology | | | — | | | | 11,185 | | | | — | | | | 11,185 | | |
Capital Markets | | | 8,102 | | | | — | | | | — | | | | 8,102 | | |
Diversified Consumer
Services | | | 30,064 | | | | — | | | | — | | | | 30,064 | | |
Electronic Equipment,
Instruments &
Components | | | — | | | | 14,238 | | | | — | | | | 14,238 | | |
Food Products | | | — | | | | 48,916 | | | | — | | | | 48,916 | | |
Health Care Technology | | | — | | | | 8,489 | | | | — | | | | 8,489 | | |
Hotels, Restaurants &
Leisure | | | 21,718 | | | | — | | | | — | | | | 21,718 | | |
Household Durables | | | — | | | | 10,430 | | | | — | | | | 10,430 | | |
Household Products | | | — | | | | 31,326 | | | | — | | | | 31,326 | | |
Information Technology
Services | | | 38,549 | | | | — | | | | — | | | | 38,549 | | |
Internet & Direct
Marketing Retail | | | 22,643 | | | | — | | | | — | | | | 22,643 | | |
Internet Software &
Services | | | 31,754 | | | | 57,272 | | | | — | | | | 89,026 | | |
Media | | | — | | | | 25,240 | | | | — | | | | 25,240 | | |
Pharmaceuticals | | | — | | | | 6,824 | | | | — | | | | 6,824 | | |
Professional Services | | | — | | | | 11,197 | | | | — | | | | 11,197 | | |
Road & Rail | | | — | | | | 31,061 | | | | — | | | | 31,061 | | |
Semiconductors &
Semiconductor
Equipment | | | 5,887 | | | | — | | | | — | | | | 5,887 | | |
Software | | | 11,189 | | | | — | | | | — | | | | 11,189 | | |
Textiles, Apparel &
Luxury Goods | | | — | | | | 68,794 | | | | — | | | | 68,794 | | |
Total Common Stocks | | | 169,906 | | | | 397,296 | | | | — | | | | 567,202 | | |
Participation Notes | | | — | | | | 2,669 | | | | — | | | | 2,669 | | |
Call Options Purchased | | | — | | | | 131 | | | | — | | | | 131 | | |
Short-Term Investment | |
Investment Company | | | 61,592 | | | | — | | | | — | | | | 61,592 | | |
Total Assets | | $ | 231,498 | | | $ | 400,096 | | | $ | — | | | $ | 631,594 | | |
Transfers between investment levels may occur as the markets fluctuate and/or the availability of data used in an investment's valuation changes. The Fund recognizes transfers between the levels as of the end of the period. As of December 31, 2017, securities with a total value of
approximately $242,218,000 transferred from Level 1 to Level 2. Securities that were valued using unadjusted quoted prices at December 31, 2016 were valued using other significant observable inputs at December 31, 2017. At December 31, 2017, the fair value of certain securities were adjusted due to developments which occurred between the time of the close of the foreign markets on which they trade and the close of business on the NYSE which resulted in their Level 2 classification.
Following is a reconciliation of investments in which significant unobservable inputs (Level 3) were used in determining fair value.
| | | Common
Stock
(000) | | Preferred
Stock
(000) | |
Beginning Balance | | $ | — | † | | $ | 80 | | |
Purchases | | | — | | | | — | | |
Sales | | | — | † | | | (98 | ) | |
Amortization of discount | | | — | | | | — | | |
Transfers in | | | — | | | | — | | |
Transfers out | | | — | | | | — | | |
Corporate actions | | | — | | | | — | | |
Change in unrealized appreciation (depreciation) | | | — | | | | (43 | ) | |
Realized gains (losses) | | | — | | | | 61 | | |
Ending Balance | | $ | — | | | $ | — | | |
Net change in unrealized appreciation (depreciation)
from investments still held as of December 31, 2017 | | $ | — | | | $ | — | | |
† Includes one security which is valued at zero.
3. Foreign Currency Translation and Foreign Investments: The books and records of the Fund are maintained in U.S. dollars. Foreign currency amounts are translated into U.S. dollars as follows:
– investments, other assets and liabilities at the prevailing rate of exchange on the valuation date;
– investment transactions and investment income at the prevailing rates of exchange on the dates of such transactions.
Although the net assets of the Fund are presented at the foreign exchange rates and market values at the close of the period, the Fund does not isolate that portion of the results of operations arising as a result of changes in the foreign exchange rates from the fluctuations arising from changes in the market prices of securities held at period end. Similarly, the Fund does not isolate the effect of changes in foreign exchange rates from the
20
Morgan Stanley Institutional Fund, Inc.
Annual Report — December 31, 2017
Notes to Financial Statements (cont'd)
fluctuations arising from changes in the market prices of securities sold during the period. Accordingly, realized and unrealized foreign currency gains (losses) on investments in securities are included in the reported net realized and unrealized gains (losses) on investment transactions and balances. However, pursuant to U.S. federal income tax regulations, gains and losses from certain foreign currency transactions and the foreign currency portion of gains and losses realized on sales and maturities of foreign denominated debt securities are treated as ordinary income for U.S. federal income tax purposes.
Net realized gains (losses) on foreign currency transactions represent net foreign exchange gains (losses) from foreign currency forward exchange contracts, disposition of foreign currencies, currency gains (losses) realized between the trade and settlement dates on securities transactions, and the difference between the amount of investment income and foreign withholding taxes recorded on the Fund's books and the U.S. dollar equivalent amounts actually received or paid. Net unrealized currency gains (losses) from valuing foreign currency denominated assets and liabilities at period end exchange rates are reflected as a component of unrealized appreciation (depreciation) in the Statement of Assets and Liabilities. The change in unrealized currency gains (losses) on foreign currency translations for the period is reflected in the Statement of Operations.
Foreign security and currency transactions may involve certain considerations and risks not typically associated with those of U.S. dollar denominated transactions as a result of, among other factors, fluctuations of exchange rates in relation to the U.S. dollar, the possibility of lower levels of governmental supervision and regulation of foreign securities markets and the possibility of political or economic instability.
Governmental approval for foreign investments may be required in advance of making an investment under certain circumstances in some countries, and the extent of foreign investments in domestic companies may be subject to limitation in other countries. Foreign ownership limitations also may be imposed by the charters of individual companies to prevent, among other concerns, violations of foreign investment limitations. As a result, an additional class of shares (identified as "Foreign" in the Portfolio of Investments) may be created and offered
for investment. The "local" and "foreign shares" market values may differ. In the absence of trading of the foreign shares in such markets, the Fund values the foreign shares at the closing exchange price of the local shares.
4. Derivatives: The Fund may, but is not required to, use derivative instruments for a variety of purposes, including hedging, risk management, portfolio management or to earn income. Derivatives are financial instruments whose value is based, in part, on the value of an underlying asset, interest rate, index or financial instrument. Prevailing interest rates and volatility levels, among other things, also affect the value of derivative instruments. A derivative instrument often has risks similar to its underlying asset and may have additional risks, including imperfect correlation between the value of the derivative and the underlying asset, risks of default by the counterparty to certain transactions, magnification of losses incurred due to changes in the market value of the securities, instruments, indices or interest rates to which the derivative instrument relates, risks that the transactions may not be liquid and risks arising from margin requirements. The use of derivatives involves risks that are different from, and possibly greater than, the risks associated with other portfolio investments. Derivatives may involve the use of highly specialized instruments that require investment techniques and risk analyses different from those associated with other portfolio investments. All of the Fund's holdings, including derivative instruments, are marked-to-market each day with the change in value reflected in unrealized appreciation (depreciation). Upon disposition, a realized gain or loss is recognized.
Certain derivative transactions may give rise to a form of leverage. Leverage magnifies the potential for gain and the risk of loss. Leverage associated with derivative transactions may cause the Fund to liquidate portfolio positions when it may not be advantageous to do so to satisfy its obligations or to meet earmarking or segregation requirements, pursuant to applicable Securities and Exchange Commission ("SEC") rules and regulations, or may cause the Fund to be more volatile than if the Fund had not been leveraged. Although the Adviser seeks to use derivatives to further the Fund's investment objectives, there is no assurance that the use of derivatives will achieve this result.
21
Morgan Stanley Institutional Fund, Inc.
Annual Report — December 31, 2017
Notes to Financial Statements (cont'd)
Following is a description of the derivative instruments and techniques that the Fund used during the period and their associated risks:
Options: With respect to options, the Fund is subject to equity risk, interest rate risk and foreign currency exchange risk in the normal course of pursuing its investment objectives. If the Fund buys an option, it buys a legal contract giving it the right to buy or sell a specific amount of the underlying instrument or foreign currency, or futures contract on the underlying instrument or foreign currency, at an agreed-upon price typically in exchange for a premium paid by the Fund. The Fund may purchase and/or sell put and call options. Purchasing call options tends to increase the Fund's exposure to the underlying (or similar) instrument. Purchasing put options tends to decrease the Fund's exposure to the underlying (or similar) instrument. When entering into purchased option contracts, the Fund bears the risk of interest or exchange rates or securities prices moving unexpectedly, in which case, the Fund may not achieve the anticipated benefits of the purchased option contracts; however the risk of loss is limited to the premium paid. Purchased options are reported as part of "Total Investments in Securities" in the Statement of Assets and Liabilities. Premium paid for purchasing options which expired are treated as realized losses. If the Fund sells an option, it sells to another party the right to buy from or sell to the Fund a specific amount of the underlying instrument or foreign currency, or futures contract on the underlying instrument or foreign currency, at an agreed-upon price during a period of time or on a specified date typically in exchange for a premium received by the Fund. When options are purchased OTC, the Fund bears the risk that the counterparty that wrote the option will be unable or unwilling to perform its obligations under the option contract. Options may also be illiquid and the Fund may have difficulty closing out its position. A decision as to whether, when and how to use options involves the exercise of skill and judgment and even a well-conceived option transaction may be unsuccessful because of market behavior or unexpected events. The prices of options can be highly volatile and the use of options can lower total returns.
FASB ASC 815, "Derivatives and Hedging" ("ASC 815"), is intended to improve financial reporting about derivative instruments by requiring enhanced
disclosures to enable investors to better understand how and why the Fund uses derivative instruments, how these derivative instruments are accounted for and their effects on the Fund's financial position and results of operations.
The following table sets forth the fair value of the Fund's derivative contracts by primary risk exposure as of December 31, 2017.
| | | Asset Derivatives
Statement of Assets and
Liabilities Location | | Primary Risk
Exposure | | Value
(000) | |
Options Purchased
| | Investments, at Value
(Options Purchased) | | Currency Risk | | $ | 131 | (a) | |
(a) Amounts are included in Investments in Securities in the Statement of Assets and Liabilities.
The following tables set forth by primary risk exposure the Fund's realized gains (losses) and change in unrealized appreciation (depreciation) by type of derivative contract for the year ended December 31, 2017 in accordance with ASC 815.
Realized Gain (Loss) | |
Primary Risk Exposure | | Derivative Type | | Value
(000) | |
Currency Risk
| | Investments
(Options Purchased) | | $ | (39 | )(b) | |
(b) Amounts are included in Investments Sold in the Statement of Operations.
Change in Unrealized Appreciation (Depreciation) | |
Primary Risk Exposure | | Derivative Type | | Value
(000) | |
Currency Risk
| | Investments
(Options Purchased) | | | $(642)(c) | | |
(c) Amounts are included in Investments in the Statement of Operations.
At December 31, 2017, the Fund's derivative assets and liabilities are as follows:
Gross Amounts of Assets and Liabilities Presented in the
Statement of Assets and Liabilities | |
Derivatives | | Assets(d)
(000) | | Liabilities(d)
(000) | |
Options Purchased | | $ | 131 | (a) | | $ | — | | |
(a) Amounts are included in Investments in Securities in the Statement of Assets and Liabilities.
(d) Absent an event of default or early termination, OTC derivative assets and liabilities are presented gross and not offset in the Statement of Assets and Liabilities.
The Fund typically enters into International Swaps and Derivatives Association, Inc. Master Agreements ("ISDA Master Agreements") or similar master agreements (collectively, "Master Agreements") with its contract counterparties for certain OTC derivatives in order to, among other things, reduce its credit risk to counterparties. ISDA Master
22
Morgan Stanley Institutional Fund, Inc.
Annual Report — December 31, 2017
Notes to Financial Statements (cont'd)
Agreements include provisions for general obligations, representations, collateral and events of default or termination. Under an ISDA Master Agreement, the Fund typically may offset with the counterparty certain OTC derivative financial instruments' payables and/or receivables with collateral held and/or posted and create one single net payment (close-out netting) in the event of default, termination and/or potential deterioration in the credit quality of the counterparty. Various Master Agreements govern the terms of certain transactions with counterparties, including transactions such as swap, forward, repurchase and reverse repurchase agreements. These Master Agreements typically attempt to reduce the counterparty risk associated with such transactions by specifying credit protection mechanisms and providing standardization that improves legal certainty. Cross-termination provisions under Master Agreements typically provide that a default in connection with one transaction between the Fund and a counterparty gives the non-defaulting party the right to terminate any other transactions in place with the defaulting party to create one single net payment due to/due from the defaulting party and may be a feature in certain Master Agreements. In the event the Fund exercises its right to terminate a Master Agreement after a counterparty experiences a termination event as defined in the Master Agreement, the return of collateral with market value in excess of the Fund's net liability may be delayed or denied.
The following table presents derivative financial instruments that are subject to enforceable netting arrangements as of December 31, 2017.
Gross Amounts Not Offset in the Statement of Assets and Liabilities | |
Counterparty | | Gross Asset
Derivatives
Presented in
Statement of
Assets and
Liabilities
(000) | | Financial
Instrument
(000) | | Collateral
Received(e)
(000) | | Net Amount
(not less
than $0)
(000) | |
Royal Bank of Scotland | | $ | 131 | (a) | | $ | — | | | $ | (131 | ) | | | 0 | | |
(a) Amounts are included in Investments in Securities in the Statement of Assets and Liabilities.
(e) In some instances, the actual collateral received may be more than the amount shown here due to overcollateralization.
For the year ended December 31, 2017, the approximate average monthly amount outstanding for each derivative type is as follows:
Options Purchased: | |
Average monthly notional amount | | | 46,012,000 | | |
5. Securities Lending: The Fund lends securities to qualified financial institutions, such as broker-dealers, to earn additional income. Any increase or decrease in the fair value of the securities loaned that might occur and any interest earned or dividends declared on those securities during the term of the loan would remain in the Fund. The Fund would receive cash or securities as collateral in an amount equal to or exceeding 100% of the current fair value of the loaned securities. The collateral is marked-to-market daily by State Street Bank and Trust Company ("State Street"), the securities lending agent, to ensure that a minimum of 100% collateral coverage is maintained.
Based on pre-established guidelines, the securities lending agent invests any cash collateral that is received in an affiliated money market portfolio and repurchase agreements. Securities lending income is generated from the earnings on the invested collateral and borrowing fees, less any rebates owed to the borrowers and compensation to the lending agent, and is recorded as "Income from Securities Loaned — Net" in the Fund's Statement of Operations. Risks in securities lending transactions are that a borrower may not provide additional collateral when required or return the securities when due, and that the value of the short-term investments will be less than the amount of cash collateral plus any rebate that is required to be returned to the borrower.
The Fund has the right under the securities lending agreement to recover the securities from the borrower on demand.
At December 31, 2017, the Fund did not have any outstanding securities on loan.
6. Structured Investments: The Fund invested a portion of its assets in structured investments. A structured investment is a derivative security designed to offer a return linked to a particular underlying security, currency, commodity or market. Structured investments may come in various forms including notes (such as exchange-traded notes), warrants and options to purchase securities. The Fund will typically use structured investments to gain exposure to a permitted underlying security, currency, commodity or market when direct access to a market is limited or inefficient from a tax or cost standpoint. There can be no assurance that structured investments will trade at the same price or have the same value as the underlying security, currency, commodity or market. Investments in structured investments involve risks including issuer risk, counterparty risk and market risk. Holders of structured
23
Morgan Stanley Institutional Fund, Inc.
Annual Report — December 31, 2017
Notes to Financial Statements (cont'd)
investments bear risks of the underlying investment and are subject to issuer or counterparty risk because the Fund is relying on the creditworthiness of such issuer or counterparty and has no rights with respect to the underlying investment. Certain structured investments may be thinly traded or have a limited trading market and may have the effect of increasing the Fund's illiquidity to the extent that the Fund, at a particular time, may be unable to find qualified buyers for these securities.
7. Redemption Fees: The Fund will assess a 2% redemption fee on Class I shares, Class A shares, Class L shares, Class C shares and Class IS shares, which is paid directly to the Fund, for shares redeemed or exchanged within thirty days of purchase, subject to certain exceptions. The redemption fee is designed to protect the Fund and its remaining shareholders from the effects of short-term trading. These fees, if any, are included in the Statements of Changes in Net Assets.
8. Indemnifications: The Company enters into contracts that contain a variety of indemnifications. The Company's maximum exposure under these arrangements is unknown. However, the Company has not had prior claims or losses pursuant to these contracts and expects the risk of loss to be remote.
9. Dividends and Distributions to Shareholders: Dividends and distributions to shareholders are recorded on the ex-dividend date. Dividends from net investment income, if any, are declared and paid annually. Net realized capital gains, if any, are distributed at least annually.
10. Security Transactions, Income and Expenses: Security transactions are accounted for on the trade date (date the order to buy or sell is executed). Realized gains and losses on the sale of investment securities are determined on the specific identified cost method. Dividend income and other distributions are recorded on the ex-dividend date (except for certain foreign dividends which may be recorded as soon as the Fund is informed of such dividends) net of applicable withholding taxes. Interest income is recognized on the accrual basis except where collection is in doubt. Discounts are accreted and premiums are amortized over the life of the respective securities. Most expenses of the Company can be directly attributed to a particular Fund. Expenses which cannot be directly attributed are apportioned among the Funds based upon
relative net assets or other appropriate methods. Income, expenses (other than class specific expenses — distribution and shareholder services, transfer agency and sub transfer agency fees) and realized and unrealized gains or losses are allocated to each class of shares based upon their relative net assets.
B. Advisory Fees: The Adviser, a wholly-owned subsidiary of Morgan Stanley, provides the Fund with advisory services under the terms of an Investment Advisory Agreement, paid quarterly, at the annual rate based on the daily net assets as follows:
First $1
billion | | Over $1
billion | |
| | 0.80 | % | | | 0.75 | % | |
For the year ended December 31, 2017, the advisory fee rate (net of waiver/rebate) was equivalent to an annual effective rate of 0.71% of the Fund's average daily net assets.
The Adviser has agreed to reduce its advisory fee and/or reimburse the Fund so that total annual portfolio operating expenses, excluding certain investment related expenses, taxes, interest and other extraordinary expenses (including litigation), will not exceed 1.00% for Class I shares, 1.35% for Class A shares, 1.85% for Class L shares, 2.10% for Class C shares and 0.94% for Class IS shares. The fee waivers and/or expense reimbursements will continue for at least one year from the date of the Fund's prospectus or until such time as the Directors act to discontinue all or a portion of such waivers and/or reimbursements when they deem such action is appropriate. For the year ended December 31, 2017, approximately $204,000 of advisory fees were waived and approximately $41,000 of other expenses were reimbursed by the Adviser pursuant to this arrangement.
C. Administration Fees: The Adviser also serves as Administrator to the Company and provides administrative services pursuant to an Administration Agreement for an annual fee, accrued daily and paid monthly, of 0.08% of the Fund's average daily net assets.
Under a Sub-Administration Agreement between the Administrator and State Street, State Street provides certain administrative services to the Company. For such services, the Administrator pays State Street a portion of the fee the Administrator receives from the Fund.
D. Distribution and Shareholder Services Fees: Morgan Stanley Distribution, Inc. ("MSDI" or the "Distributor"), a wholly-owned subsidiary of the Adviser and an indirect
24
Morgan Stanley Institutional Fund, Inc.
Annual Report — December 31, 2017
Notes to Financial Statements (cont'd)
subsidiary of Morgan Stanley, serves as the Company's Distributor of Fund shares pursuant to a Distribution Agreement. The Company has adopted a Shareholder Services Plan with respect to Class A shares pursuant to Rule 12b-1 under the Act. Under the Shareholder Services Plan, the Fund pays the Distributor a shareholder services fee, accrued daily and paid monthly, at an annual rate of 0.25% of the Fund's average daily net assets attributable to Class A shares.
The Company has adopted a Distribution and Shareholder Services Plan with respect to Class L shares pursuant to Rule 12b-1 under the Act. Under the Distribution and Shareholder Services Plan, the Fund pays the Distributor a distribution fee, accrued daily and paid monthly, at an annual rate of 0.50% and a shareholder services fee, accrued daily and paid monthly, at an annual rate of 0.25% of the Fund's average daily net assets attributable to Class L shares.
The Company has adopted a Distribution and Shareholder Services Plan with respect to Class C shares pursuant to Rule 12b-1 under the Act. Under the Distribution and Shareholder Services Plan, the Fund pays the Distributor a distribution fee, accrued daily and paid monthly, at an annual rate of 0.75% and a shareholder services fee, accrued daily and paid monthly, at an annual rate of 0.25% of the Fund's average daily net assets attributable to Class C shares.
The distribution and shareholder services fees are used to support the expenses associated with servicing and maintaining accounts. The Distributor may compensate other parties for providing shareholder support services to investors who purchase Class A, Class L and Class C shares.
E. Dividend Disbursing and Transfer Agent: The Company's dividend disbursing and transfer agent is Boston Financial Data Services, Inc. ("BFDS"). Pursuant to a Transfer Agency Agreement, the Company pays BFDS a fee based on the number of classes, accounts and transactions relating to the Funds of the Company. Effective January 1, 2018, BFDS changed its name to DST Asset Manager Solutions, Inc.
F. Custodian Fees: State Street (the "Custodian") also serves as Custodian for the Company in accordance with a Custodian Agreement. The Custodian holds cash, securities, and other assets of the Company as required by the Act. Custody fees are payable monthly based on assets held in custody, investment purchases and sales activity and account maintenance fees, plus reimbursement for certain out-of-pocket expenses.
G. Security Transactions and Transactions with Affiliates: For the year ended December 31, 2017, purchases and sales of investment securities for the Fund, other than long-term U.S. Government securities and short-term investments, were approximately $480,756,000 and $74,555,000, respectively. There were no purchases and sales of long-term U.S. Government securities for the year ended December 31, 2017.
The Fund invests in the Institutional Class of the Morgan Stanley Institutional Liquidity Funds — Treasury Securities Portfolio. (the "Liquidity Funds"), an open-end management investment company managed by the Adviser, both directly and as a portion of the securities held as collateral on loaned securities. Advisory fees paid by the Fund are reduced by an amount equal to its pro-rata share of the advisory and administration fees paid by the Fund due to its investment in the Liquidity Funds. For the year ended December 31, 2017, advisory fees paid were reduced by approximately $43,000 relating to the Fund's investment in the Liquidity Funds.
A summary of the Fund's transactions in shares of the Liquidity Funds during the year ended December 31, 2017 is as follows:
Affiliated
Investment
Company | | Value
December 31,
2016
(000) | | Purchases
at Cost
(000) | | Proceeds
from Sales
(000) | | Dividend
Income
(000) | |
Liquidity Funds | | $ | 5,351 | | | $ | 263,253 | | | $ | 207,012 | | | $ | 202 | | |
| | | Realized
Gain (Loss)
(000) | | Change in
Unrealized
Appreciation
(Depreciation)
(000) | | Value
December 31,
2017
(000) | |
Liquidity Funds | | $ | — | | | $ | — | | | $ | 61,592 | | |
The Fund is permitted to purchase and sell securities ("cross-trade") from and to other Morgan Stanley Funds as well as other funds and client accounts for which the Adviser or an affiliate of the Adviser serves as investment adviser, pursuant to procedures approved by the Directors in compliance with Rule 17a-7 under the Act (the "Rule"). Each cross-trade is executed at the current market price in compliance with provisions of the Rule. For the year ended December 31, 2017, the Fund did not engage in any cross-trade transactions.
The Fund has an unfunded Deferred Compensation Plan (the "Compensation Plan"), which allows each independent Director to defer payment of all, or a portion, of the fees he or she receives for serving on the Board of Directors. Each eligible Director generally may elect to have the deferred amounts credited with a return equal to the total return on one or more of the Morgan Stanley funds that are offered as investment options under the Compensation Plan. Appreciation/depreciation
25
Morgan Stanley Institutional Fund, Inc.
Annual Report — December 31, 2017
Notes to Financial Statements (cont'd)
and distributions received from these investments are recorded with an offsetting increase/decrease in the deferred compensation obligation and do not affect the NAV of the Fund.
H. Federal Income Taxes: It is the Fund's intention to continue to qualify as a regulated investment company and distribute all of its taxable and tax-exempt income. Accordingly, no provision for federal income taxes is required in the financial statements.
The Fund may be subject to taxes imposed by countries in which it invests. Such taxes are generally based on income and/or capital gains earned or repatriated. Taxes are accrued based on net investment income, net realized gains and net unrealized appreciation as such income and/or gains are earned. Taxes may also be based on transactions in foreign currency and are accrued based on the value of investments denominated in such currency.
FASB ASC 740-10, "Income Taxes — Overall", sets forth a minimum threshold for financial statement recognition of the benefit of a tax position taken or expected to be taken in a tax return. Management has concluded there are no significant uncertain tax positions that would require recognition in the financial statements. If applicable, the Fund recognizes interest accrued related to unrecognized tax benefits in "Interest Expense" and penalties in "Other Expenses" in the Statement of Operations. The Fund files tax returns with the U.S. Internal Revenue Service, New York and various states. Generally, each of the tax years in the four-year period ended December 31, 2017, remains subject to examination by taxing authorities.
The tax character of distributions paid may differ from the character of distributions shown in the Statements of Changes in Net Assets due to short-term capital gains being treated as ordinary income for tax purposes. The tax character of distributions paid during fiscal years 2017 and 2016 was as follows:
2017
Distributions
Paid From: | | 2016
Distributions
Paid From: | |
Ordinary
Income
(000) | | Long-Term
Capital Gain
(000) | | Ordinary
Income
(000) | | Long-Term
Capital Gain
(000) | |
| $ | 385 | | | $ | 8,635 | | | $ | 10 | | | $ | — | | |
The amount and character of income and gains to be distributed are determined in accordance with income tax regulations which may differ from GAAP. These book/tax differences are either considered temporary or permanent in nature.
Temporary differences are primarily due to differing book and tax treatments for the timing in the recognition of gains
(losses) on certain investment transactions and the timing of the deductibility of certain expenses.
Permanent differences, primarily due to differing treatments of gains (losses) related to foreign currency transactions, a dividend redesignation and a net operating loss, resulted in the following reclassifications among the components of net assets at December 31, 2017:
Accumulated
Net Investment
Loss
(000) | | Accumulated
Net Realized
Gain
(000) | | Paid-in-
Capital
(000) | |
| $ | 1,543 | | | $ | (1,552 | ) | | $ | 9 | | |
At December 31, 2017, the components of distributable earnings for the Fund on a tax basis were as follows:
Undistributed
Ordinary
Income
(000) | | Undistributed
Long-Term
Capital Gain
(000) | |
| $ | 608 | | | $ | 1,806 | | |
I. Credit Facility: The Company and other Morgan Stanley funds participated in a $150,000,000 committed, unsecured revolving line of credit facility (the "Facility") with State Street. This Facility is to be used for temporary emergency purposes or funding of shareholder redemption requests. The interest rate on borrowings is based on the federal funds rate or 1 month LIBOR rate plus a spread. The Facility also has a commitment fee of 0.25% per annum based on the unused portion of the Facility. During the year ended December 31, 2017, the Fund did not have any borrowings under the Facility.
J. Other: At December 31, 2017, the Fund had record owners of 10% or greater. Investment activities of these shareholders could have a material impact on the Fund. The aggregate percentage of such owners was 31.4%.
26
Morgan Stanley Institutional Fund, Inc.
Annual Report — December 31, 2017
Report of Independent Registered Public Accounting Firm
To the Shareholders and Board of Directors of
Morgan Stanley Institutional Fund, Inc. —
International Opportunity Portfolio
Opinion on the Financial Statements
We have audited the accompanying statement of assets and liabilities of International Opportunity Portfolio (the "Fund") (one of the funds constituting the Morgan Stanley Institutional Fund, Inc. (the "Company")), including the portfolio of investments, as of December 31, 2017, and the related statement of operations for the year then ended, the statements of changes in net assets for each of the two years in the period then ended, the financial highlights for each of the five years in the period then ended and the related notes (collectively referred to as the "financial statements"). In our opinion, the financial statements present fairly, in all material respects, the financial position of International Opportunity Portfolio (one of the funds constituting Morgan Stanley Institutional Fund, Inc.) at December 31, 2017, the results of its operations for the year then ended, the changes in its net assets for each of the two years in the period then ended and its financial highlights for each of the five years in the period then ended, in conformity with U.S. generally accepted accounting principles.
Basis for Opinion
These financial statements are the responsibility of the Company's management. Our responsibility is to express an opinion on the Fund's financial statements based on our audits. We are a public accounting firm registered with the Public Company Accounting Oversight Board (United States) ("PCAOB") and are required to be independent with respect to the Company in accordance with the U.S. federal securities law and the applicable rules and regulations of the Securities and Exchange Commission and the PCAOB.
We conducted our audits in accordance with the standards of the PCAOB. Those standards require that we plan and perform the audit to obtain reasonable assurance about whether the financial statements are free of material misstatement, whether due to error or fraud. The Company is not required to have, nor were we engaged to perform, an audit of the Company's internal control over financial reporting. As part of our audits, we are required to obtain an understanding of internal control over financial reporting, but not for the purpose of expressing an opinion on the effectiveness of the Company's internal control over financial reporting. Accordingly, we express no such opinion.
Our audits included performing procedures to assess the risks of material misstatement of the financial statements, whether due to error or fraud, and performing procedures that respond to those risks. Such procedures included examining, on a test basis, evidence regarding the amounts and disclosures in the financial statements. Our procedures included confirmation of securities owned as of December 31, 2017 by correspondence with the custodian and others or by other appropriate auditing procedures where replies from others were not received. Our audits also included evaluating the accounting principles used and significant estimates made by management, as well as evaluating the overall presentation of the financial statements. We believe that our audits provide a reasonable basis for our opinion.

We have served as the auditor of one or more Morgan Stanley investment companies since 2000.
Boston, Massachusetts
February 26, 2018
27
Morgan Stanley Institutional Fund, Inc.
Annual Report — December 31, 2017
Federal Tax Notice (unaudited)
For federal income tax purposes, the following information is furnished with respect to the distributions paid by the Fund during its taxable year ended December 31, 2017.
The Fund designated and paid approximately $8,635,000 as a long-term capital gain distribution.
For federal income tax purposes, the following information is furnished with respect to the Fund's earnings for its taxable year ended December 31, 2017. When distributed, certain earnings may be subject to a maximum tax rate of 15% as provided for the Jobs and Growth Tax Relief Reconciliation Act of 2003. The Fund designated up to a maximum of approximately $482,000 as taxable at this lower rate.
The Fund intends to pass through foreign tax credits of approximately $97,000 and has derived net income from sources within foreign countries amounting to approximately $1,370,000.
In January, the Fund provides tax information to shareholders for the preceding calendar year.
28
Morgan Stanley Institutional Fund, Inc.
Annual Report — December 31, 2017
Privacy Notice (unaudited)
MORGAN STANLEY INVESTMENT MANAGEMENT INC.
AN IMPORTANT NOTICE CONCERNING OUR U.S. PRIVACY POLICY
We are required by federal law to provide you with a copy of our privacy policy annually. This policy applies to current and former individual investors in funds managed or sponsored by Morgan Stanley Investment Management Inc. ("MSIM") as well as current and former individual clients of MSIM. This policy is not applicable to partnerships, corporations, trusts or other non-individual clients or investors. Please note that we may amend this policy at any time, and will inform you of any changes as required by law.
WE RESPECT YOUR PRIVACY
We appreciate that you have provided us with your personal financial information. We strive to maintain the privacy of such information while we help you achieve your financial objectives. This Notice describes what non-public personal information we collect about you, why we collect it, when we may share it with others and how certain others may use it. It discusses the steps you may take to limit our sharing of certain information about you to affiliated companies in the Morgan Stanley family of companies ("other Morgan Stanley companies"). It also discloses how you may limit use of certain shared information for marketing purposes by other Morgan Stanley branded companies. Throughout this policy, we refer to the non-public information that personally identifies you or your accounts as "personal information.''
1. WHAT PERSONAL INFORMATION DO WE COLLECT ABOUT YOU?
We obtain personal information from applications and other forms you submit to us, from your dealings with us, from consumer reporting agencies, from our Web sites and from third parties and other sources.
For example:
• We may collect information such as your name, address, e-mail address, telephone/fax numbers, assets, income and investment objectives through subscription documents, applications and other forms you submit to us.
• We may obtain information about account balances, your use of account(s) and the types of products and services you prefer to receive from us through your dealings and transactions with us and other sources.
• We may obtain information about your creditworthiness and credit history from consumer reporting agencies.
• We may collect background information from and through third-party vendors to verify representations you have made and to comply with various regulatory requirements.
• If you interact with us through our public and private Web sites, we may collect information that you provide directly through online communications (such as an e-mail address). We may also collect information about your Internet service provider, your domain name, your computer's operating system and Web browser, your use of our Web sites and your product and service preferences, through the use of "cookies." Please consult the Terms of Use of these sites for more details.
2. WHEN DO WE DISCLOSE PERSONAL INFORMATION WE COLLECT ABOUT YOU?
We may disclose personal information we collect about you to other Morgan Stanley companies and to non-affiliated third parties.
a. Information We Disclose to Other Morgan Stanley Companies.
We may disclose personal information to other Morgan Stanley companies for a variety of reasons, including to manage your account(s) effectively, to service and process your transactions, to let you know about products and services offered by us and other Morgan Stanley companies, to manage our business, and as otherwise required or permitted by law. Offers for products and services from other Morgan Stanley companies are developed under conditions designed to safeguard your personal information.
29
Morgan Stanley Institutional Fund, Inc.
Annual Report — December 31, 2017
Privacy Notice (unaudited) (cont'd)
b. Information We Disclose to Non-affiliated Third Parties.
We do not disclose personal information that we collect about you to non-affiliated third parties except to those who provide marketing services on our behalf, to financial institutions with whom we have joint marketing agreements, and as otherwise required or permitted by law. For example, we may disclose personal information to non-affiliated third parties for servicing and processing transactions, to offer our own products and services, to protect against fraud, for institutional risk control, to respond to judicial process or to perform services on our behalf. When we share personal information with a non-affiliated third party, they are required to limit their use of personal information to the particular purpose for which it was shared and they are not allowed to share personal information with others except to fulfill that limited purpose or as may be permitted or required by law.
3. HOW DO WE PROTECT THE SECURITY AND CONFIDENTIALITY OF PERSONAL INFORMATION WE COLLECT ABOUT YOU?
We maintain physical, electronic and procedural security measures to help safeguard the personal information we collect about you. We have internal policies governing the proper handling of client information. Third parties that provide support or marketing services on our behalf may also receive personal information, and we require them to adhere to confidentiality standards with respect to such information.
4. HOW CAN YOU LIMIT THE SHARING OF CERTAIN TYPES OF PERSONAL INFORMATION WITH OTHER MORGAN STANLEY COMPANIES?
We offer you choices as to whether we share with other Morgan Stanley companies the personal information that was collected to determine your eligibility for products and services you request ("eligibility information"). Eligibility information does not include your identification information or personal information pertaining to our transactions or experiences with you. Please note that, even if you direct us not to share eligibility information with other Morgan Stanley companies ("opt-out"), we may still share personal information, including eligibility information, with those companies in circumstances excluded from the opt-out under applicable law, such as to process transactions or to service your account.
5. HOW CAN YOU LIMIT THE USE OF CERTAIN TYPES OF PERSONAL INFORMATION BY OTHER MORGAN STANLEY COMPANIES FOR MARKETING?
By following the opt-out instructions in Section 6 below, you may limit other Morgan Stanley branded companies from marketing their products or services to you based on personal information we disclose to them. This information may include, for example, your income and account history with us. Please note that, even if you choose to limit Other Morgan Stanley Companies from using personal information about you that we may share with them for marketing their products and services to you, Other Morgan Stanley Companies may use your personal information that they obtain from us to market to you in circumstances permitted by law, such as if the Other Morgan Stanley Company has its own relationship with you.
6. HOW CAN YOU SEND US AN OPT-OUT INSTRUCTION?
If you wish to limit our sharing of eligibility information about you with other Morgan Stanley companies or other Morgan Stanley companies' use of personal information for marketing purposes, as described in this notice, you may do so by:
• Calling us at (800) 548-7786
Monday–Friday between 8a.m. and 6p.m.(EST)
• Writing to us at the following address:
DST Asset Manager Solutions, Inc.
c/o Privacy Coordinator
P.O. Box 219804
Kansas City, Missouri 64121
30
Morgan Stanley Institutional Fund, Inc.
Annual Report — December 31, 2017
Privacy Notice (unaudited) (cont'd)
Your written request should include your name, address, telephone number and account number(s) to which the opt-out applies and whether you are opting out with respect to sharing of eligibility information (Section 4 above), or if information used for Marketing (Section 5 above) or both. Written opt-out requests should not be sent with any other correspondence. In order to process your request, we require that the request be provided by you directly and not through a third party.
Your opt-out preference will remain in effect with respect to this policy (as it may be amended) until you notify us otherwise. If you have a joint account, your direction for us not to share this information with other Morgan Stanley companies and for those other Morgan Stanley companies not to use your personal information for marketing will be applied to all account holders on that account. Please understand that if you limit our sharing or our affiliated companies' use of personal information, you and any joint account holder(s) may not receive information about Morgan Stanley products and services, including products or services that could help you manage your financial resources and achieve your investment objectives.
7. WHAT IF AN AFFILIATED COMPANY BECOMES A NON-AFFILIATED THIRD PARTY?
If, at any time in the future, an affiliated company becomes a non-affiliated third party, further disclosures of personal information made to the former affiliated company will be limited to those described in Section 2(b) above relating to non-affiliated third parties. If you elected under Section 6 to limit disclosures we make to affiliated companies, or use of personal information by affiliated companies, your election will not apply to use by any former affiliated company of your personal information in their possession once it becomes a non-affiliated third party.
SPECIAL NOTICE TO RESIDENTS OF VERMONT
The following section supplements our policy with respect to our individual clients who have a Vermont address and supersedes anything to the contrary in the above policy with respect to those clients only.
The state of Vermont requires financial institutions to obtain your consent prior to sharing personal information that they collect about you with affiliated companies and non-affiliated third parties other than in certain limited circumstances. Except as permitted by law, we will not share personal information we collect about you with non-affiliated third parties or other Morgan Stanley companies unless you provide us with your written consent to share such information ("opt-in").
If you wish to receive offers for investment products and services offered by or through other Morgan Stanley companies, please notify us in writing at the following address:
DST Asset Manager Solutions, Inc.
c/o Privacy Coordinator
P.O. Box 219804
Kansas City, Missouri 64121
Your authorization should include your name, address, telephone number and account number(s) to which the opt-in applies and should not be sent with any other correspondence. In order to process your authorization, we require that the authorization be provided by you directly and not through a third party.
SPECIAL NOTICE TO RESIDENTS OF CALIFORNIA
The following section supplements our policy with respect to our individual clients who have a California address and supersedes anything to the contrary in the above policy with respect to those clients only.
In response to a California law, if your account has a California home address, your personal information will not be disclosed to non-affiliated third parties except as permitted by applicable California law, and we will limit sharing such information with our affiliates to comply with California privacy laws that apply to us.
31
Morgan Stanley Institutional Fund, Inc.
Annual Report — December 31, 2017
Director and Officer Information (unaudited)
Independent Directors:
Name, Age and Address of
Independent Director | | Position(s)
Held with
Registrant | | Length of Time
Served* | | Principal Occupation(s) During Past 5 Years
and Other Relevant Professional Experience | | Number of
Portfolios in
Fund Complex
Overseen by
Independent
Director** | | Other Directorships
Held by Independent
Director*** | |
Frank L. Bowman (73)
c/o Perkins Coie LLP
Counsel to the Independent
Directors
30 Rockefeller Plaza
New York, NY 10112 | | Director | | Since
August
2006 | | President, Strategic Decisions, LLC (consulting) (since February 2009); Director or Trustee of various Morgan Stanley Funds (since August 2006); Chairperson of the Compliance and Insurance Committee (since October 2015); formerly, Chairperson of the Insurance Sub-Committee of the Compliance and Insurance Committee (2007-2015); served as President and Chief Executive Officer of the Nuclear Energy Institute (policy organization) (February 2005-November 2008); retired as Admiral, U.S. Navy after serving over 38 years on active duty including 8 years as Director of the Naval Nuclear Propulsion Program in the Department of the Navy and the U.S. Department of Energy (1996-2004); served as Chief of Naval Personnel (July 1994-September 1996) and on the Joint Staff as Director of Political Military Affairs (June 1992-July 1994); knighted as Honorary Knight Commander of the Most Excellent Order of the British Empire; awarded the Officier de l'Orde National du Mérite by the French Government; elected to the National Academy of Engineering (2009). | | | 88 | | | Director of BP p.l.c.; Director of Naval and Nuclear Technologies LLP; Director Emeritus of the Armed Services YMCA; Director of the U.S. Naval Submarine League; Member of the National Security Advisory Council of the Center for U.S. Global Engagement and a member of the CNA Military Advisory Board; Trustee of Fairhaven United Methodist Church; and Director of other various non-profit organizations. | |
Kathleen A. Dennis (64)
c/o Perkins Coie LLP
Counsel to the Independent Directors
30 Rockefeller Plaza
New York, NY 10112 | | Director | | Since
August
2006 | | President, Cedarwood Associates (mutual fund and investment management consulting) (since July 2006); Chairperson of the Liquidity and Alternatives Sub-Committee of the Investment Committee (since October 2006) and Director or Trustee of various Morgan Stanley Funds (since August 2006); formerly, Senior Managing Director of Victory Capital Management (1993-2006). | | | 89 | | | Director of various non-profit organizations. | |
Nancy C. Everett (62)
c/o Perkins Coie LLP
Counsel to the Independent Directors
30 Rockefeller Plaza
New York, NY 10112 | | Director | | Since
January
2015 | | Chief Executive Officer, Virginia Commonwealth University Investment Company (since November 2015); Owner, OBIR, LLC (institutional investment management consulting) (since June 2014); formerly, Managing Director, BlackRock Inc. (February 2011-December 2013); and Chief Executive Officer, General Motors Asset Management (a/k/a Promark Global Advisors, Inc.) (June 2005-May 2010). | | | 90 | | | Formerly, Member of Virginia Commonwealth University School of Business Foundation (2005-2016); Member of Virginia Commonwealth University Board of Visitors (2013-2015); Member of Committee on Directors for Emerging Markets Growth Fund, Inc. (2007-2010); Chairperson of Performance Equity Management, LLC (2006-2010); and Chairperson, GMAM Absolute Return Strategies Fund, LLC (2006-2010). | |
32
Morgan Stanley Institutional Fund, Inc.
Annual Report — December 31, 2017
Director and Officer Information (unaudited) (cont'd)
Independent Directors: (cont'd)
Name, Age and Address of
Independent Director | | Position(s)
Held with
Registrant | | Length of Time
Served* | | Principal Occupation(s) During Past 5 Years
and Other Relevant Professional Experience | | Number of
Portfolios in
Fund Complex
Overseen by
Independent
Director** | | Other Directorships
Held by Independent
Director*** | |
Jakki L. Haussler (60)
c/o Perkins Coie LLP
Counsel to the Independent Directors
30 Rockefeller Plaza
New York, NY 10112 | | Director | | Since
January
2015 | | Chairman and Chief Executive Officer, Opus Capital Group (since January 1996); formerly, Director, Capvest Venture Fund, LP (May 2000-December 2011); Partner, Adena Ventures, LP (July 1999-December 2010); Director, The Victory Funds (February 2005-July 2008). | | | 90 | | | Director of Cincinnati Bell Inc. and Member, Audit Committee and Compensation Committee; Director of Northern Kentucky University Foundation and Member, Investment Committee; Member of Chase College of Law Transactional Law Practice Center Board of Advisors; Director of Best Transport; Director of Chase College of Law Board of Visitors; formerly, Member, University of Cincinnati Foundation Investment Committee; Member, Miami University Board of Visitors (2008-2011); Trustee of Victory Funds (2005-2008) and Chairman, Investment Committee (2007-2008) and Member, Service Provider Committee (2005-2008). | |
Dr. Manuel H. Johnson (68)
c/o Johnson Smick
International, Inc.
220 I Street, NE — Suite 200
Washington, D.C. 20002 | | Director | | Since
July
1991 | | Senior Partner, Johnson Smick International, Inc. (consulting firm); Chairperson of the Investment Committee (since October 2006) and Director or Trustee of various Morgan Stanley Funds (since July 1991); Co-Chairman and a founder of the Group of Seven Council (G7C) (international economic commission); formerly, Chairperson of the Audit Committee (July 1991-September 2006), Vice Chairman of the Board of Governors of the Federal Reserve System and Assistant Secretary of the U.S. Treasury. | | | 88 | | | Director of NVR, Inc. (home construction). | |
Joseph J. Kearns (75)
c/o Kearns & Associates LLC
46 E Peninsula Center #385
Rolling Hills Estates, CA
90274-3712 | | Director | | Since
August
1994 | | Senior Adviser, Kearns & Associates LLC (investment consulting); Chairperson of the Audit Committee (since October 2006) and Director or Trustee of various Morgan Stanley Funds (since August 1994); formerly, Deputy Chairperson of the Audit Committee (July 2003-September 2006) and Chairperson of the Audit Committee of various Morgan Stanley Funds (since August 1994); CFO of the J. Paul Getty Trust. | | | 89 | | | Prior to August 10, 2016, Director of Electro Rent Corporation (equipment leasing); Prior to December 31, 2013, Director of The Ford Family Foundation. | |
33
Morgan Stanley Institutional Fund, Inc.
Annual Report — December 31, 2017
Director and Officer Information (unaudited) (cont'd)
Independent Directors: (cont'd)
Name, Age and Address of
Independent Director | | Position(s)
Held with
Registrant | | Length of Time
Served* | | Principal Occupation(s) During Past 5 Years
and Other Relevant Professional Experience | | Number of
Portfolios in
Fund Complex
Overseen by
Independent
Director** | | Other Directorships
Held by Independent
Director*** | |
Michael F. Klein (59)
c/o Perkins Coie LLP
Counsel to the Independent Directors
30 Rockefeller Plaza
New York, NY 10112 | | Director | | Since
August
2006 | | Managing Director, Aetos Capital, LLC (since March 2000); Co-President, Aetos Alternatives Management, LLC (since January 2004) and Co-Chief Executive Officer of Aetos Capital LLC (since August 2013); Chairperson of the Fixed Income Sub-Committee of the Investment Committee (since October 2006) and Director or Trustee of various Morgan Stanley Funds (since August 2006); formerly, Managing Director, Morgan Stanley & Co. Inc. and Morgan Stanley Dean Witter Investment Management, President, various Morgan Stanley Funds (June 1998-March 2000) and Principal, Morgan Stanley & Co. Inc. and Morgan Stanley Dean Witter Investment Management (August 1997-December 1999). | | | 88 | | | Director of certain investment funds managed or sponsored by Aetos Capital, LLC; Director of Sanitized AG and Sanitized Marketing AG (specialty chemicals). | |
Patricia Maleski (57)
c/o Perkins Coie LLP
Counsel to the Independent Directors
30 Rockefeller Plaza
New York, NY 10112 | | Director | | Since
January
2017 | | Managing Director, JPMorgan Asset Management (2004-2016); Oversight and Control Head of Fiduciary and Conflicts of Interest Program (2015-2016); Chief Control Officer-Global Asset Management (2013-2015); President, JPMorgan Funds (2010-2013); Chief Administrative Officer (2004-2013); various other positions including Treasurer and Board Liaison (since 2001). | | | 90 | | | None. | |
Michael E. Nugent (81)
522 Fifth Avenue
New York, NY 10036 | | Chair of the Board and Director | | Chair of the Boards since July 2006 and Director since July 1991 | | Chair of the Boards of various Morgan Stanley Funds (since July 2006); Chairperson of the Closed-End Fund Committee (since June 2012) and Director or Trustee of various Morgan Stanley Funds (since July 1991); formerly, Chairperson of the Insurance Committee (until July 2006); General Partner, Triumph Capital, L.P. (private investment partnership) (1988-2013). | | | 88 | | | None. | |
W. Allen Reed (70)
c/o Perkins Coie LLP
Counsel to the Independent Directors
30 Rockefeller Plaza
New York, NY 10112 | | Director | | Since
August
2006 | | Chairperson of the Equity Sub-Committee of the Investment Committee (since October 2006) and Director or Trustee of various Morgan Stanley Funds (since August 2006); formerly, President and CEO of General Motors Asset Management; Chairman and Chief Executive Officer of the GM Trust Bank and Corporate Vice President of General Motors Corporation (August 1994-December 2005). | | | 89 | | | Director of Legg Mason, Inc.; formerly, Director of the Auburn University Foundation (2010-2015). | |
Fergus Reid (85)
c/o Joe Pietryka, Inc.
85 Charles Colman Blvd.
Pawling, NY 12564 | | Director | | Since
June
1992 | | Chairman, Joe Pietryka, Inc.; Chairperson of the Governance Committee and Director or Trustee of various Morgan Stanley Funds (since June 1992). | | | 89 | | | Formerly, Trustee and Director of certain investment companies in the JP Morgan Fund Complex managed by JP Morgan Investment Management Inc. (1987-2012). | |
* This is the earliest date the Director began serving the Morgan Stanley Funds. Each Director serves an indefinite term, until his or her successor is elected.
** The Fund Complex includes (as of December 31, 2017) all open-end and closed-end funds (including all of their portfolios) advised by Morgan Stanley Investment Management Inc. (the "Adviser") and any funds that have an adviser that is an affiliated person of the Adviser (including, but not limited to, Morgan Stanley AIP GP LP).
*** This includes any directorships at public companies and registered investment companies held by the Director at any time during the past five years.
34
Morgan Stanley Institutional Fund, Inc.
Annual Report — December 31, 2017
Director and Officer Information (unaudited) (cont'd)
Executive Officers:
Name, Age and Address of Executive Officer | | Position(s) Held
with
Registrant | | Length of Time
Served* | | Principal Occupation(s) During Past 5 Years | |
John H. Gernon (54)
522 Fifth Avenue
New York, NY 10036 | | President and Principal Executive Officer | | Since
September
2013 | | President and Principal Executive Officer of the Equity and Fixed Income Funds and the Morgan Stanley AIP Funds (since September 2013) and the Liquidity Funds and various money market funds (since May 2014) in the Fund Complex; Managing Director of the Adviser; Head of Product (since 2006). | |
Timothy J. Knierim (58)
522 Fifth Avenue
New York, NY 10036 | | Chief Compliance Officer | | Since
December
2016 | | Managing Director of the Adviser and various entities affiliated with the Adviser; Chief Compliance Officer of various Morgan Stanley Funds and the Adviser (since December 2016) and Chief Compliance Officer of Morgan Stanley AIP GP LP (since 2014). Formerly, Managing Director and Deputy Chief Compliance Officer of the Adviser (2014-2016); and formerly, Chief Compliance Officer of Prudential Investment Management, Inc. (2007-2014). | |
Francis J. Smith (52)
522 Fifth Avenue
New York, NY 10036 | | Treasurer and Principal Financial Officer | | Treasurer since July 2003 and Principal Financial Officer since September 2002 | | Manging Director of the Adviser and various entities affiliated with the Adviser; Treasurer (since July 2003) and Principal Financial Officer of various Morgan Stanley Funds (since September 2002). | |
Mary E. Mullin (50)
522 Fifth Avenue
New York, NY 10036 | | Secretary | | Since
June
1999 | | Managing Director of the Adviser; Secretary of various Morgan Stanley Funds (since June 1999). | |
Michael J. Key (38)
522 Fifth Avenue
New York, NY 10036 | | Vice President | | Since
June
2017 | | Vice President of the Equity and Fixed Income Funds, Liquidity Funds, various money market funds and the Morgan Stanley AIP Funds in the Fund Complex (since June 2017); Executive Director of the Adviser; Head of Product Development for Equity and Fixed Income Funds (since August 2013). | |
* This is the earliest date the officer began serving the Morgan Stanley Funds. Each officer serves a one-year term, until his or her successor is elected and qualifies.
35
Morgan Stanley Institutional Fund, Inc.
Annual Report — December 31, 2017
Adviser and Administrator
Morgan Stanley Investment Management Inc.
522 Fifth Avenue
New York, New York 10036
Distributor
Morgan Stanley Distribution, Inc.
522 Fifth Avenue
New York, New York 10036
Dividend Disbursing and Transfer Agent
DST Asset Manager Solutions, Inc.
2000 Crown Colony Drive
Quincy, Massachusetts 02169
Custodian
State Street Bank and Trust Company
One Lincoln Street
Boston, Massachusetts 02111
Legal Counsel
Dechert LLP
1095 Avenue of the Americas
New York, New York 10036
Counsel to the Independent Directors
Perkins Coie LLP
30 Rockefeller Plaza
New York, New York 10112
Independent Registered Public Accounting Firm
Ernst & Young LLP
200 Clarendon Street
Boston, Massachusetts 02116
Reporting to Shareholders
Each Morgan Stanley Fund provides a complete schedule of portfolio holdings in its semi-annual and annual reports within 60 days of the end of the fund's second and fourth fiscal quarters. The semi-annual and annual reports are filed electronically with the Securities and Exchange Commission (SEC) on Form N-CSRS and Form N-CSR, respectively. Morgan Stanley also delivers the semi-annual and annual reports to fund shareholders and makes these reports available on its public website, www.morganstanley.com/im. Each Morgan Stanley fund also files a complete schedule of portfolio holdings with the SEC for the fund's first and third fiscal quarters on Form N-Q. Morgan Stanley does not deliver the reports for the first and third fiscal quarters to shareholders, nor are the reports posted to the Morgan Stanley public website. You may, however, obtain the Form N-Q filings (as well as the Form N-CSR and N-CSRS filings) by accessing the SEC's website, www.sec.gov. You may also review and copy them at the SEC's Public Reference Room in Washington, DC. Information on the operation of the SEC's Public Reference Room may be obtained by calling the SEC toll free at 1 (800) SEC-0330. You can also request copies of these materials, upon payment of a duplicating fee, by electronic request at the SEC's email address (publicinfo@sec.gov) or by writing to the SEC's Public Reference Section, Washington, D.C. 20549-1520.
Proxy Voting Policies and Procedures and Proxy Voting Record
You may obtain a copy of the Company's Proxy Voting Policy and Procedures and information regarding how the Company voted proxies relating to portfolio securities during the most recent twelve-month period ended June 30, without charge, upon request, by calling toll free 1 (800) 548-7786 or by visiting our website at www.morganstanley.com/im. This information is also available on the SEC's website at www.sec.gov.
This report is authorized for distribution only when preceded or accompanied by a prospectus or summary prospectus of the applicable Fund of Morgan Stanley Institutional Fund, Inc., which describes in detail the Fund's investment policies, risks, fees and expenses. Please read the prospectus carefully before you invest or send money. For additional information, including information regarding the investments comprising the Fund, please visit our website at www.morganstanley.com/im or call toll free 1 (800) 548-7786.
36
Printed in U.S.A.
This Report has been prepared for shareholders and may be distributed to others only if preceded or accompanied by a current prospectus.
Morgan Stanley Investment Management Inc.
522 Fifth Avenue
New York, New York 10036
© 2018 Morgan Stanley. Morgan Stanley Distribution, Inc.

IFIIIOANN
2007888 EXP. 02.28.19

Morgan Stanley Institutional Fund, Inc.
International Real Estate Portfolio
Annual Report
December 31, 2017

Morgan Stanley Institutional Fund, Inc.
Annual Report — December 31, 2017
Shareholders' Letter | | | 2 | | |
Expense Example | | | 3 | | |
Investment Overview | | | 4 | | |
Portfolio of Investments | | | 7 | | |
Statement of Assets and Liabilities | | | 9 | | |
Statement of Operations | | | 11 | | |
Statements of Changes in Net Assets | | | 12 | | |
Financial Highlights | | | 14 | | |
Notes to Financial Statements | | | 19 | | |
Report of Independent Registered Public Accounting Firm | | | 26 | | |
Federal Tax Notice | | | 27 | | |
Privacy Notice | | | 28 | | |
Director and Officer Information | | | 31 | | |
This report is authorized for distribution only when preceded or accompanied by a prospectus or summary prospectus of the applicable Fund of Morgan Stanley Institutional Fund, Inc. To receive a prospectus and/or statement of additional information (SAI), which contains more complete information such as investment objectives, charges, expenses, policies for voting proxies, risk considerations, and describes in detail each of the Fund's investment policies to the prospective investor, please call toll free 1 (800) 548-7786. Please read the prospectuses carefully before you invest or send money.
Additionally, you can access information about the Fund, including performance, characteristics, and investment team commentary, through Morgan Stanley Investment Management's website: www.morganstanley.com/im.
Market forecasts provided in this report may not necessarily come to pass. There is no guarantee that any sectors mentioned will continue to perform as discussed herein or that securities in such sectors will be held by the Fund in the future. There is no assurance that a fund will achieve its investment objective. Funds are subject to market risk, which is the possibility that market values of securities owned by the Fund will decline and, therefore, the value of the Fund's shares may be less than what you paid for them. Accordingly, you can lose money investing in this Fund. Please see the prospectus for more complete information on investment risks.
1
Morgan Stanley Institutional Fund, Inc.
Annual Report — December 31, 2017
Shareholders' Letter (unaudited)
Dear Shareholders,
We are pleased to provide this Annual report, in which you will learn how your investment in International Real Estate Portfolio (the "Fund") performed during the latest twelve-month period.
Morgan Stanley Investment Management is a client-centric, investor-led organization. Our global presence, intellectual capital, and breadth of products and services enable us to partner with investors to meet the evolving challenges of today's financial markets. We aim to deliver superior investment service and to empower our clients to make the informed decisions that help them reach their investment goals.
As always, we thank you for selecting Morgan Stanley Investment Management, and look forward to working with you in the months and years ahead.
Sincerely,

John H. Gernon
President and Principal Executive Officer
January 2018
2
Morgan Stanley Institutional Fund, Inc.
Annual Report — December 31, 2017
Expense Example (unaudited)
International Real Estate Portfolio
As a shareholder of the Fund, you incur two types of costs: (1) transactional costs, including redemption fees; and (2) ongoing costs, which may include advisory fees, administration fees, distribution and shareholder services fees and other Fund expenses. This example is intended to help you understand your ongoing costs (in dollars) of investing in the Fund and to compare these costs with the ongoing costs of investing in other mutual funds.
This example is based on an investment of $1,000 invested at the beginning of the six-month period ended December 31, 2017 and held for the entire six-month period.
Actual Expenses
The table below provides information about actual account values and actual expenses. You may use the information in this table, together with the amount you invested, to estimate the expenses that you paid over the period. Simply divide your account value by $1,000 (for example, an $8,600 account value divided by $1,000 = 8.6), then multiply the result by the number in the table under the heading entitled "Actual Expenses Paid During Period" to estimate the expenses you paid on your account during this period.
Hypothetical Example for Comparison Purposes
The table below provides information about hypothetical account values and hypothetical expenses based on the Fund's actual expense ratio and an assumed rate of return of 5% per year before expenses, which is not the Fund's actual return. The hypothetical account values and expenses may not be used to estimate the actual ending account balance or expenses you paid for the period. You may use this information to compare the ongoing costs of investing in the Fund and other funds. To do so, compare this 5% hypothetical example with the 5% hypothetical examples that appear in the shareholder reports of the other funds.
Please note that the expenses shown in the table are meant to highlight your ongoing costs only and do not reflect any transactional costs, such as sales charges (loads) and redemption fees. Therefore, the information for each class in the table is useful in comparing ongoing costs only, and will not help you determine the relative total costs of owning different funds. In addition, if these transactional costs were included, your costs would have been higher.
| | | Beginning
Account
Value
7/1/17 | | Actual Ending
Account
Value
12/31/17 | | Hypothetical
Ending Account
Value | | Actual
Expenses
Paid
During
Period* | | Hypothetical
Expenses Paid
During Period* | | Net
Expense
Ratio
During
Period** | |
International Real Estate Portfolio Class I | | $ | 1,000.00 | | | $ | 1,083.70 | | | $ | 1,020.16 | | | $ | 5.25 | | | $ | 5.09 | | | | 1.00 | % | |
International Real Estate Portfolio Class A | | | 1,000.00 | | | | 1,081.70 | | | | 1,018.40 | | | | 7.08 | | | | 6.87 | | | | 1.35 | | |
International Real Estate Portfolio Class L | | | 1,000.00 | | | | 1,078.60 | | | | 1,015.88 | | | | 9.69 | | | | 9.40 | | | | 1.85 | | |
International Real Estate Portfolio Class C | | | 1,000.00 | | | | 1,077.60 | | | | 1,014.62 | | | | 11.00 | | | | 10.66 | | | | 2.10 | | |
International Real Estate Portfolio Class IS | | | 1,000.00 | | | | 1,084.20 | | | | 1,020.32 | | | | 5.10 | | | | 4.94 | | | | 0.97 | | |
* Expenses are calculated using each Fund Class' annualized net expense ratio (as disclosed), multiplied by the average account value over the period, and multiplied by 184/365 (to reflect the most recent one-half year period).
** Annualized.
3
Morgan Stanley Institutional Fund, Inc.
Annual Report — December 31, 2017
Investment Overview (unaudited)
International Real Estate Portfolio
The Fund's investment objective is to provide current income and long-term capital appreciation.
Performance
For the year ended December 31, 2017, the Fund's Class I shares had a total return based on net asset value and reinvestment of distributions per share of 19.13%, net of fees. The Fund's Class I shares underperformed against the Fund's benchmark, the FTSE EPRA/NAREIT Developed ex-North America Real Estate — Net Total Return Index (the "Index"), which returned 20.28%, and underperformed the MSCI EAFE Index, which returned 25.03%.
Factors Affecting Performance
• The international real estate securities market gained 20.30% during the 12-month period ending December 31, 2017, as measured by the Index. Europe outperformed the global developed ex-North American average, while Asia underperformed for the period.
• Overall, property stocks have been largely influenced by transactional evidence in the private markets of strong investor demand for core assets at valuations that demonstrate the acceptance of low expected returns. In addition, low government bond yields have bolstered share prices of listed property companies.
• Property stocks in Europe, measured by the FTSE EPRA/NAREIT Developed EMEA Index, experienced the strongest gains over the period with a U.S. dollar ("USD") return of 29.1%.(i) The eurozone economy maintained its strong momentum at the end of the year, with rising workloads encouraging companies to take on new staff at the sharpest pace in more than a decade. However, political uncertainty remains high, created by the ongoing Brexit negotiations, lengthy coalition talks in Germany, an inconclusive election outcome in Catalonia and upcoming general elections in Italy. Property stocks in Asia, measured by the FTSE EPRA/NAREIT Developed Asia Index, gained 16.1%(i) in USD terms, as Hong Kong real estate operating companies ("REOCs") traded at the largest discount to net asset values ("NAVs") with NAVs still growing on healthy
operating fundamentals and continued strength in asset values in the private markets.
• Performance within the Asian regional portfolio modestly contributed to relative performance while the European regional portfolio detracted. Top-down global allocation detracted due to the underweight to Europe. Cash held in the Fund modestly detracted. In Asia, the Fund benefited from the overweight to Hong Kong and underweight to Japan; this was more than offset by the underweight to Singapore and stock selection in Hong Kong and Japan, which detracted. In Europe, the Fund benefited from stock selection in Germany; this was more than offset by the negative effect of the underweight to Germany and stock selection in Sweden and the U.K.
Management Strategies
• The Fund is comprised of two regional portfolios with a global allocation which weights the European and Asian regions relative to the Index based on our view of the relative attractiveness of each region in terms of underlying real estate fundamentals and public market valuations. Moreover, both of the regional portfolios reflect our core investment philosophy as a real estate value investor, which results in the ownership of stocks that provide the best valuation relative to their underlying real estate values, while maintaining portfolio diversification. Our company-specific research leads us to specific preferences for sub-segments within each of the property sectors and countries. For the period ended December 31, 2017, the Fund was overweight the Asian listed property sector and underweight the European listed property sector.
• The Hong Kong REOCs continue to represent a significant overweight in the global portfolio, as the stocks offer highly attractive value given the wide discrepancy between public and private valuations, and relative to other public listed property markets. The stocks ended the period trading at an average 34% discount to NAVs,(i) which represented the widest discounts on a global basis despite healthy operating fundamentals, solid recurring cash flow growth and continued strength in asset values in the
4
Morgan Stanley Institutional Fund, Inc.
Annual Report — December 31, 2017
Investment Overview (unaudited) (cont'd)
International Real Estate Portfolio
private markets, as well as improving corporate governance and capital management. The discounted valuations are further accentuated as the Hong Kong REOCs maintain very modest leverage levels. In Japan, there is a significant disparity in valuations with the Japan REOCs trading at 19% discount and the Japan real estate investment trusts ("REITs") trading at a 7% premium.(ii) The investment market remains active but there is some caution due to all-time low capitalization (cap) rates and continued policy uncertainty. In Australia, office market fundamentals are witnessing improved rental growth in key markets. In the retail sector, operating fundamentals remain lackluster. The Australian REIT sector ended the period trading at an average 6% premium to NAVs(ii) and remains far less attractive relative to the Hong Kong REOCs within Asia.
• In Europe, property stocks in the U.K. ended the period trading at an average 4% discount to NAVs, with the large-cap U.K. Majors and London office specialists trading at attractive discounted valuations of 15% and 8%,(ii) respectively, which are well in excess of expected asset value declines. In the U.K., the Brexit vote has created expectations for declines in NAVs but transaction and leasing activity to date have indicated these declines have been more modest than initially expected. Property stocks on the Continent ended the period trading at an average 2% premium to NAVs, although there is disparity in valuations within the Continent, with the Continental retail stocks trading at an average 5% discount, and German residential stocks trading at an average 8% premium.(ii) On the Continent, select prospects for better operating fundamentals may support valuations after significant cap rate compression. Within Europe, we are overweight the U.K. Majors and London office specialists, Continental retail, Ireland and French office, and underweight Germany and other segments in the U.K., Sweden and Belgium.

* Minimum Investment for Class I shares
In accordance with SEC regulations, the Fund's performance shown assumes that all recurring fees (including management fees) were deducted and all dividends and distributions were reinvested. The performance of Class A, L, C and IS shares will vary from Class I shares based upon their different inception dates and will be negatively impacted by additional fees assessed to those classes (if applicable).
(ii) Source: Morgan Stanley Investment Management, as of December 31, 2017
5
Morgan Stanley Institutional Fund, Inc.
Annual Report — December 31, 2017
Investment Overview (unaudited) (cont'd)
International Real Estate Portfolio
Performance Compared to the FTSE EPRA/NAREIT Developed ex-North America Real Estate — Net Total Return Index(1) and the MSCI EAFE Index(2)
| | Period Ended December 31, 2017
Total Returns(3) | |
| | | | Average Annual | |
| | One
Year | | Five
Years | | Ten
Years | | Since
Inception(8) | |
Fund — Class I Shares
w/o sales charges(4) | | | 19.13 | % | | | 4.04 | % | | | 1.22 | % | | | 7.74 | % | |
Fund — Class A Shares
w/o sales charges(4) | | | 18.78 | | | | 3.70 | | | | 0.93 | | | | 7.45 | | |
Fund — Class A Shares with
maximum 5.25% sales charges(4) | | | 12.56 | | | | 2.58 | | | | 0.39 | | | | 7.17 | | |
Fund — Class L Shares
w/o sales charges(5) | | | 18.14 | | | | 3.17 | | | | — | | | | 6.33 | | |
Fund — Class C Shares
w/o sales charges(7) | | | 17.78 | | | | — | | | | — | | | | 0.64 | | |
Fund — Class C Shares with
maximum 1.00% deferred sales
charges(7) | | | 16.78 | | | | — | | | | — | | | | 0.64 | | |
Fund — Class IS Shares
w/o sales charges(6) | | | 19.19 | | | | — | | | | — | | | | 3.83 | | |
FTSE EPRA/NAREIT Developed
ex-North America Real
Estate — Net Total Return Index | | | 20.28 | | | | 5.40 | | | | 1.59 | | | | 6.23 | | |
MSCI EAFE Index | | | 25.03 | | | | 7.90 | | | | 1.94 | | | | 4.74 | | |
Performance data quoted represents past performance, which is no guarantee of future results, and current performance may be lower or higher than the figures shown. Performance assumes that all dividends and distributions, if any, were reinvested. For the most recent month-end performance figures, please visit www.morganstanley.com/im. Investment return and principal value will fluctuate so that Fund shares, when redeemed, may be worth more or less than their original cost. Total returns do not reflect the deduction of taxes that a shareholder would pay on Fund distributions or the redemption of Fund shares. Performance of share classes will vary due to difference in sales charges and expenses.
(1) The FTSE EPRA/NAREIT Developed ex-North America Real Estate — Net Total Return Index is a free float-adjusted market capitalization weighted index designed to reflect the stock performance of companies engaged in the European and Asian real estate markets. The performance of the Index is listed in U.S. dollars and assumes reinvestment of dividends. "Net Total Return " reflects a reduction in total returns after taking into account the withholding tax on dividends by certain foreign countries represented in the Index for periods after 2/18/05 (gross returns used prior to 2/18/05). The Index is unmanaged and its returns do not include any sales charges or fees. Such costs would lower performance. It is not possible to invest directly in an index.
(2) The MSCI EAFE Index (Europe, Australasia, Far East) is a free float-adjusted market capitalization index that is designed to measure the international equity market performance of developed markets, excluding the U.S. & Canada. The term "free float" represents the portion of shares outstanding that are deemed to be available for purchase in the public equity markets by investors. The MSCI EAFE Index currently consists of 21 developed market country indices. The performance of the Index is listed in U.S. dollars and assumes reinvestment of net dividends. The Index is unmanaged and its returns do not include any sales charges or fees. Such costs would lower performance. It is not possible to invest directly in an index.
(3) Total returns for the Fund reflect fees waived and expenses reimbursed, if applicable, by the Adviser. Without such waivers and reimbursements, total returns would have been lower.
(4) Commenced operations on October 1, 1997.
(5) Commenced offering on April 27, 2012.
(6) Commenced offering on September 13, 2013.
(7) Commenced offering on April 30, 2015.
(8) For comparative purposes, average annual since inception returns listed for the Indexes refer to the inception date of Class I of the Fund, not the inception of the Index.
6
Morgan Stanley Institutional Fund, Inc.
Annual Report — December 31, 2017
Portfolio of Investments
International Real Estate Portfolio
| | | Shares | | Value
(000) | |
Common Stocks (98.9%) | |
Australia (10.2%) | |
Dexus REIT | | | 40,591 | | | $ | 308 | | |
Goodman Group REIT | | | 69,058 | | | | 453 | | |
GPT Group (The) REIT | | | 95,723 | | | | 381 | | |
Mirvac Group REIT | | | 124,864 | | | | 228 | | |
Scentre Group REIT | | | 226,339 | | | | 739 | | |
Stockland REIT | | | 74,130 | | | | 259 | | |
Vicinity Centres REIT | | | 134,306 | | | | 286 | | |
Westfield Corp. REIT | | | 99,082 | | | | 734 | | |
| | | | 3,388 | | |
Austria (1.1%) | |
Atrium European Real Estate Ltd. (a) | | | 17,470 | | | | 87 | | |
BUWOG AG (a) | | | 7,849 | | | | 270 | | |
| | | | 357 | | |
China (1.8%) | |
China Overseas Land & Investment Ltd. (b) | | | 80,000 | | | | 257 | | |
China Resources Land Ltd. (b) | | | 36,000 | | | | 106 | | |
China Vanke Co., Ltd. H Shares (b) | | | 27,400 | | | | 109 | | |
Guangzhou R&F Properties Co., Ltd. H Shares (b) | | | 58,000 | | | | 131 | | |
| | | | 603 | | |
Finland (0.6%) | |
Citycon Oyj | | | 76,423 | | | | 198 | | |
France (10.3%) | |
Carmila SA REIT | | | 3,060 | | | | 85 | | |
Fonciere Des Regions REIT | | | 1,794 | | | | 203 | | |
Gecina SA REIT | | | 3,519 | | | | 649 | | |
ICADE REIT | | | 2,400 | | | | 236 | | |
Klepierre SA REIT | | | 15,915 | | | | 700 | | |
Mercialys SA REIT | | | 12,101 | | | | 268 | | |
Unibail-Rodamco SE REIT | | | 5,090 | | | | 1,283 | | |
| | | | 3,424 | | |
Germany (5.2%) | |
ADO Properties SA (c) | | | 1,743 | | | | 88 | | |
Deutsche Wohnen SE | | | 12,263 | | | | 535 | | |
LEG Immobilien AG | | | 1,514 | | | | 173 | | |
Vonovia SE | | | 18,671 | | | | 924 | | |
| | | | 1,720 | | |
Hong Kong (27.1%) | |
Champion REIT | | | 200,000 | | | | 147 | | |
CK Asset Holdings Ltd. | | | 105,000 | | | | 918 | | |
Henderson Land Development Co., Ltd. | | | 36,012 | | | | 237 | | |
Hongkong Land Holdings Ltd. | | | 207,500 | | | | 1,459 | | |
Hysan Development Co., Ltd. | | | 111,836 | | | | 593 | | |
Link REIT | | | 114,895 | | | | 1,065 | | |
New World Development Co., Ltd. | | | 315,788 | | | | 474 | | |
Sino Land Co., Ltd. | | | 36,685 | | | | 65 | | |
Sun Hung Kai Properties Ltd. | | | 139,456 | | | | 2,323 | | |
Swire Properties Ltd. | | | 249,500 | | | | 805 | | |
Wharf Holdings Ltd. (The) | | | 88,117 | | | | 305 | | |
Wharf Real Estate Investment Co., Ltd. (a) | | | 92,370 | | | | 615 | | |
| | | | 9,006 | | |
| | | Shares | | Value
(000) | |
Ireland (1.7%) | |
Green REIT PLC | | | 169,846 | | | $ | 317 | | |
Hibernia REIT PLC | | | 134,297 | | | | 246 | | |
| | | | 563 | | |
Japan (19.1%) | |
Activia Properties, Inc. REIT | | | 47 | | | | 197 | | |
Advance Residence Investment Corp. REIT | | | 74 | | | | 182 | | |
Daiwa Office Investment Corp. REIT | | | 8 | | | | 42 | | |
GLP J-REIT | | | 316 | | | | 342 | | |
Hulic Co., Ltd. | | | 21,800 | | | | 244 | | |
Hulic REIT, Inc. | | | 40 | | | | 58 | | |
Invincible Investment Corp. REIT | | | 391 | | | | 166 | | |
Japan Hotel REIT Investment Corp. | | | 137 | | | | 92 | | |
Japan Prime Realty Investment Corp. REIT | | | 10 | | | | 32 | | |
Japan Real Estate Investment Corp. REIT | | | 67 | | | | 318 | | |
Japan Retail Fund Investment Corp. REIT | | | 198 | | | | 363 | | |
Kenedix Office Investment Corp. REIT | | | 11 | | | | 63 | | |
Mitsubishi Estate Co., Ltd. | | | 71,200 | | | | 1,237 | | |
Mitsui Fudosan Co., Ltd. | | | 57,200 | | | | 1,282 | | |
Nippon Building Fund, Inc. REIT | | | 90 | | | | 440 | | |
Nippon Prologis, Inc. REIT | | | 88 | | | | 186 | | |
Nomura Real Estate Master Fund, Inc. REIT | | | 260 | | | | 323 | | |
Orix, Inc. J-REIT | | | 86 | | | | 119 | | |
Sumitomo Realty & Development Co., Ltd. | | | 13,000 | | | | 427 | | |
United Urban Investment Corp. REIT | | | 174 | | | | 250 | | |
| | | | 6,363 | | |
Malta (0.0%) | |
BGP Holdings PLC (a)(d)(e) | | | 4,769,371 | | | | 6 | | |
Netherlands (1.2%) | |
Eurocommercial Properties N.V. CVA REIT | | | 9,232 | | | | 402 | | |
Norway (0.7%) | |
Entra ASA (c) | | | 14,205 | | | | 211 | | |
Norwegian Property ASA | | | 28,851 | | | | 37 | | |
| | | | 248 | | |
Singapore (2.4%) | |
APAC Realty Ltd. (a) | | | 56,900 | | | | 37 | | |
Ascendas Real Estate Investment Trust REIT | | | 60,200 | | | | 122 | | |
CapitaLand Commercial Trust REIT | | | 87,560 | | | | 126 | | |
CapitaLand Ltd. | | | 25,900 | | | | 68 | | |
CapitaLand Mall Trust REIT | | | 78,900 | | | | 126 | | |
EC World Real Estate Investment Trust Unit REIT | | | 31,000 | | | | 18 | | |
Keppel REIT | | | 118,047 | | | | 111 | | |
Mapletree Industrial Trust REIT | | | 100 | | | | — | @ | |
Suntec Real Estate Investment Trust REIT | | | 40,900 | | | | 66 | | |
UOL Group Ltd. | | | 17,713 | | | | 118 | | |
| | | | 792 | | |
Spain (2.4%) | |
Hispania Activos Inmobiliarios SOCIMI SA REIT | | | 12,788 | | | | 241 | | |
Inmobiliaria Colonial Socimi SA REIT | | | 9,929 | | | | 98 | | |
Merlin Properties Socimi SA REIT | | | 32,970 | | | | 446 | | |
| | | | 785 | | |
The accompanying notes are an integral part of the financial statements.
7
Morgan Stanley Institutional Fund, Inc.
Annual Report — December 31, 2017
Portfolio of Investments (cont'd)
International Real Estate Portfolio
| | | Shares | | Value
(000) | |
Sweden (1.7%) | |
Atrium Ljungberg AB, Class B | | | 8,213 | | | $ | 130 | | |
Castellum AB | | | 11,392 | | | | 192 | | |
Hufvudstaden AB, Class A | | | 15,557 | | | | 249 | | |
| | | | 571 | | |
Switzerland (1.5%) | |
PSP Swiss Property AG (Registered) | | | 4,905 | | | | 465 | | |
Swiss Prime Site AG (Registered) (a) | | | 485 | | | | 45 | | |
| | | | 510 | | |
United Kingdom (11.9%) | |
British Land Co., PLC (The) REIT | | | 89,183 | | | | 832 | | |
Capital & Counties Properties PLC | | | 4,750 | | | | 21 | | |
Capital & Regional PLC REIT | | | 88,026 | | | | 69 | | |
Derwent London PLC REIT | | | 9,996 | | | | 421 | | |
Grainger PLC | | | 9,481 | | | | 37 | | |
Great Portland Estates PLC REIT | | | 43,352 | | | | 403 | | |
Hammerson PLC REIT | | | 61,772 | | | | 456 | | |
Intu Properties PLC REIT | | | 59,740 | | | | 204 | | |
Land Securities Group PLC REIT | | | 73,375 | | | | 995 | | |
LXB Retail Properties PLC (a) | | | 168,042 | | | | 52 | | |
Segro PLC REIT | | | 7,465 | | | | 59 | | |
St. Modwen Properties PLC | | | 34,818 | | | | 190 | | |
Urban & Civic PLC | | | 57,828 | | | | 224 | | |
Workspace Group PLC REIT | | | 1,027 | | | | 14 | | |
| | | | 3,977 | | |
Total Common Stocks (Cost $27,260) | | | 32,913 | | |
Short-Term Investment (0.5%) | |
Investment Company (0.5%) | |
Morgan Stanley Institutional Liquidity
Funds — Treasury Portfolio —
Institutional Class (See Note G)
(Cost $151) | | | 151,441 | | | | 151 | | |
Total Investments (99.4%) (Cost $27,411) (f)(g) | | | 33,064 | | |
Other Assets in Excess of Liabilities (0.6%) | | | 197 | | |
Net Assets (100.0%) | | $ | 33,261 | | |
Country assignments and aggregations are based generally on third party vendor classifications and information, and may be different from the assignments and aggregations under the policies set forth in the Fund's prospectus and/or statement of additional information relating to geographic classifications.
(a) Non-income producing security.
(b) Security trades on the Hong Kong exchange.
(c) 144A security — Certain conditions for public sale may exist. Unless otherwise noted, these securities are deemed to be liquid.
(d) At December 31, 2017, the Fund held a fair valued security valued at approximately $6,000, representing less than 0.05% of net assets. This security has been fair valued as determined in good faith under procedures established by and under the general supervision of the Company's Directors.
(e) Security has been deemed illiquid at December 31, 2017.
(f) The approximate fair value and percentage of net assets, $32,292,000 and 97.1%, respectively, represent the securities that have been fair valued under the fair valuation policy for international investments as described in Note A-1 within the Notes to the Financial Statements.
(g) At December 31, 2017, the aggregate cost for federal income tax purposes is approximately $32,425,000. The aggregate gross unrealized appreciation is approximately $1,218,000 and the aggregate gross unrealized depreciation is approximately $579,000, resulting in net unrealized appreciation of approximately $639,000.
CVA Certificaten Van Aandelen.
REIT Real Estate Investment Trust.
@ Value is less than $500.
Portfolio Composition
Classification | | Percentage of
Total Investments | |
Diversified | | | 51.2 | % | |
Retail | | | 21.6 | | |
Office | | | 14.8 | | |
Residential | | | 8.1 | | |
Other* | | | 4.3 | | |
Total Investments | | | 100.0 | % | |
* Industries and/or investment types representing less than 5% of total investments.
The accompanying notes are an integral part of the financial statements.
8
Morgan Stanley Institutional Fund, Inc.
Annual Report — December 31, 2017
International Real Estate Portfolio
Statement of Assets and Liabilities | | December 31, 2017
(000) | |
Assets: | |
Investments in Securities of Unaffiliated Issuers, at Value (Cost $27,260) | | $ | 32,913 | | |
Investment in Security of Affiliated Issuer, at Value (Cost $151) | | | 151 | | |
Total Investments in Securities, at Value (Cost $27,411) | | | 33,064 | | |
Foreign Currency, at Value (Cost $49) | | | 49 | | |
Receivable for Investments Sold | | | 149 | | |
Dividends Receivable | | | 73 | | |
Tax Reclaim Receivable | | | 29 | | |
Receivable for Fund Shares Sold | | | 25 | | |
Receivable from Affiliate | | | — | @ | |
Other Assets | | | 42 | | |
Total Assets | | | 33,431 | | |
Liabilities: | |
Payable for Professional Fees | | | 54 | | |
Payable for Custodian Fees | | | 52 | | |
Payable for Fund Shares Redeemed | | | 35 | | |
Payable for Transfer Agency Fees — Class I | | | 1 | | |
Payable for Transfer Agency Fees — Class A | | | 1 | | |
Payable for Transfer Agency Fees — Class L | | | — | @ | |
Payable for Transfer Agency Fees — Class C | | | 1 | | |
Payable for Transfer Agency Fees — Class IS | | | 1 | | |
Payable for Sub Transfer Agency Fees — Class I | | | 2 | | |
Payable for Sub Transfer Agency Fees — Class A | | | 1 | | |
Payable for Sub Transfer Agency Fees — Class C | | | — | @ | |
Payable for Administration Fees | | | 2 | | |
Payable for Directors' Fees and Expenses | | | 2 | | |
Payable for Investments Purchased | | | 1 | | |
Payable for Advisory Fees | | | 1 | | |
Payable for Shareholder Services Fees — Class A | | | — | @ | |
Payable for Distribution and Shareholder Services Fees — Class L | | | — | @ | |
Payable for Distribution and Shareholder Services Fees — Class C | | | — | @ | |
Other Liabilities | | | 16 | | |
Total Liabilities | | | 170 | | |
Net Assets | | $ | 33,261 | | |
Net Assets Consist Of: | |
Paid-in-Capital | | $ | 322,642 | | |
Distributions in Excess of Net Investment Income | | | (639 | ) | |
Accumulated Net Realized Loss | | | (294,397 | ) | |
Unrealized Appreciation (Depreciation) on: | |
Investments | | | 5,653 | | |
Foreign Currency Translations | | | 2 | | |
Net Assets | | $ | 33,261 | | |
The accompanying notes are an integral part of the financial statements.
9
Morgan Stanley Institutional Fund, Inc.
Annual Report — December 31, 2017
International Real Estate Portfolio
Statement of Assets and Liabilities (cont'd) | | December 31, 2017
(000) | |
CLASS I: | |
Net Assets | | $ | 19,846 | | |
| Shares Outstanding $0.001 par value shares of beneficial interest (unlimited shares authorized) (not in 000's) | | | 1,025,146 | | |
Net Asset Value, Offering and Redemption Price Per Share | | $ | 19.36 | | |
CLASS A: | |
Net Assets | | $ | 1,917 | | |
| Shares Outstanding $0.001 par value shares of beneficial interest (unlimited shares authorized) (not in 000's) | | | 98,976 | | |
Net Asset Value, Redemption Price Per Share | | $ | 19.37 | | |
Maximum Sales Load | | | 5.25 | % | |
Maximum Sales Charge | | $ | 1.07 | | |
Maximum Offering Price Per Share | | $ | 20.44 | | |
CLASS L: | |
Net Assets | | $ | 11 | | |
| Shares Outstanding $0.001 par value shares of beneficial interest (unlimited shares authorized) (not in 000's) | | | 578 | | |
Net Asset Value, Offering and Redemption Price Per Share | | $ | 19.29 | | |
CLASS C: | |
Net Assets | | $ | 128 | | |
| Shares Outstanding $0.001 par value shares of beneficial interest (unlimited shares authorized) (not in 000's) | | | 6,732 | | |
Net Asset Value, Offering and Redemption Price Per Share | | $ | 19.00 | | |
CLASS IS: | |
Net Assets | | $ | 11,359 | | |
| Shares Outstanding $0.001 par value shares of beneficial interest (unlimited shares authorized) (not in 000's) | | | 587,101 | | |
Net Asset Value, Offering and Redemption Price Per Share | | $ | 19.35 | | |
@ Amount is less than $500.
The accompanying notes are an integral part of the financial statements.
10
Morgan Stanley Institutional Fund, Inc.
Annual Report — December 31, 2017
International Real Estate Portfolio
Statement of Operations | | Year Ended
December 31, 2017
(000) | |
Investment Income: | |
Dividends from Securities of Unaffiliated Issuers (Net of $108 of Foreign Taxes Withheld) | | $ | 1,648 | | |
Dividends from Security of Affiliated Issuer (Note G) | | | 3 | | |
Total Investment Income | | | 1,651 | | |
Expenses: | |
Advisory Fees (Note B) | | | 321 | | |
Professional Fees | | | 117 | | |
Custodian Fees (Note F) | | | 82 | | |
Registration Fees | | | 65 | | |
Administration Fees (Note C) | | | 32 | | |
Shareholder Reporting Fees | | | 19 | | |
Sub Transfer Agency Fees — Class I | | | 15 | | |
Sub Transfer Agency Fees — Class A | | | 2 | | |
Sub Transfer Agency Fees — Class C | | | — | @ | |
Transfer Agency Fees — Class I (Note E) | | | 5 | | |
Transfer Agency Fees — Class A (Note E) | | | 3 | | |
Transfer Agency Fees — Class L (Note E) | | | 2 | | |
Transfer Agency Fees — Class C (Note E) | | | 2 | | |
Transfer Agency Fees — Class IS (Note E) | | | 2 | | |
Pricing Fees | | | 10 | | |
Shareholder Services Fees — Class A (Note D) | | | 4 | | |
Distribution and Shareholder Services Fees — Class L (Note D) | | | — | @ | |
Distribution and Shareholder Services Fees — Class C (Note D) | | | 1 | | |
Directors' Fees and Expenses | | | 4 | | |
Other Expenses | | | 24 | | |
Expenses Before Non Operating Expenses | | | 710 | | |
Bank Overdraft Expense | | | 1 | | |
Total Expenses | | | 711 | | |
Waiver of Advisory Fees (Note B) | | | (285 | ) | |
Reimbursement of Class Specific Expenses — Class I (Note B) | | | (12 | ) | |
Reimbursement of Class Specific Expenses — Class A (Note B) | | | (3 | ) | |
Reimbursement of Class Specific Expenses — Class L (Note B) | | | (2 | ) | |
Reimbursement of Class Specific Expenses — Class C (Note B) | | | (2 | ) | |
Reimbursement of Class Specific Expenses — Class IS (Note B) | | | (2 | ) | |
Rebate from Morgan Stanley Affiliate (Note G) | | | (1 | ) | |
Net Expenses | | | 404 | | |
Net Investment Income | | | 1,247 | | |
Realized Gain: | |
Investments Sold | | | 1,253 | | |
Foreign Currency Transactions | | | 23 | | |
Realized Gain | | | 1,276 | | |
Change in Unrealized Appreciation (Depreciation): | |
Investments | | | 4,414 | | |
Foreign Currency Translations | | | 9 | | |
Net Change in Unrealized Appreciation (Depreciation) | | | 4,423 | | |
Net Realized Gain and Change in Unrealized Appreciation (Depreciation) | | | 5,699 | | |
Net Increase in Net Assets Resulting from Operations | | $ | 6,946 | | |
@ Amount is less than $500.
The accompanying notes are an integral part of the financial statements.
11
Morgan Stanley Institutional Fund, Inc.
Annual Report — December 31, 2017
International Real Estate Portfolio
Statements of Changes in Net Assets | | Year Ended
December 31, 2017
(000) | | Year Ended
December 31, 2016
(000) | |
Increase (Decrease) in Net Assets: | |
Operations: | |
Net Investment Income | | $ | 1,247 | | | $ | 1,826 | | |
Net Realized Gain (Loss) | | | 1,276 | | | | (4,059 | ) | |
Net Change in Unrealized Appreciation (Depreciation) | | | 4,423 | | | | 2,792 | | |
Net Increase in Net Assets Resulting from Operations | | | 6,946 | | | | 559 | | |
Distributions from and/or in Excess of: | |
Class I: | |
Net Investment Income | | | (1,752 | ) | | | (1,543 | ) | |
Class A: | |
Net Investment Income | | | (125 | ) | | | (77 | ) | |
Class L: | |
Net Investment Income | | | (1 | ) | | | (2 | ) | |
Class C: | |
Net Investment Income | | | (8 | ) | | | (1 | ) | |
Class IS: | |
Net Investment Income | | | (890 | ) | | | (639 | ) | |
Total Distributions | | | (2,776 | ) | | | (2,262 | ) | |
Capital Share Transactions:(1) | |
Class I: | |
Subscribed | | | 2,617 | | | | 2,882 | | |
Distributions Reinvested | | | 1,727 | | | | 1,354 | | |
Redeemed | | | (13,538 | ) | | | (44,218 | ) | |
Class A: | |
Subscribed | | | 558 | | | | 16 | | |
Distributions Reinvested | | | 108 | | | | 67 | | |
Redeemed | | | (426 | ) | | | (764 | ) | |
Class H:* | |
Redeemed | | | — | | | | (10 | ) | |
Class L: | |
Distributions Reinvested | | | — | | | | 2 | | |
Redeemed | | | (44 | ) | | | — | | |
Class C: | |
Subscribed | | | 121 | | | | — | | |
Distributions Reinvested | | | 9 | | | | — | @ | |
Redeemed | | | (22 | ) | | | — | | |
Class IS: | |
Subscribed | | | 168 | | | | 266 | | |
Distributions Reinvested | | | 889 | | | | 639 | | |
Redeemed | | | (2,449 | ) | | | (9,958 | ) | |
Net Decrease in Net Assets Resulting from Capital Share Transactions | | | (10,282 | ) | | | (49,724 | ) | |
Redemption Fees | | | 1 | | | | — | @ | |
Total Decrease in Net Assets | | | (6,111 | ) | | | (51,427 | ) | |
Net Assets: | |
Beginning of Period | | | 39,372 | | | | 90,799 | | |
End of Period (Including Distributions in Excess of Net Investment Income and Accumulated Undistributed
Net Investment Income of $(639) and $359, respectively) | | $ | 33,261 | | | $ | 39,372 | | |
The accompanying notes are an integral part of the financial statements.
12
Morgan Stanley Institutional Fund, Inc.
Annual Report — December 31, 2017
International Real Estate Portfolio
Statements of Changes in Net Assets (cont'd) | | Year Ended
December 31, 2017
(000) | | Year Ended
December 31, 2016
(000) | |
(1) Capital Share Transactions: | |
Class I: | |
Shares Subscribed | | | 138 | | | | 160 | | |
Shares Issued on Distributions Reinvested | | | 93 | | | | 78 | | |
Shares Redeemed | | | (701 | ) | | | (2,346 | ) | |
Net Decrease in Class I Shares Outstanding | | | (470 | ) | | | (2,108 | ) | |
Class A: | |
Shares Subscribed | | | 29 | | | | 1 | | |
Shares Issued on Distributions Reinvested | | | 6 | | | | 4 | | |
Shares Redeemed | | | (22 | ) | | | (42 | ) | |
Net Increase (Decrease) in Class A Shares Outstanding | | | 13 | | | | (37 | ) | |
Class H:* | |
Shares Redeemed | | | — | | | | (1 | ) | |
Class L: | |
Shares Issued on Distributions Reinvested | | | — | | | | — | @@ | |
Shares Redeemed | | | (2 | ) | | | — | | |
Net Increase (Decrease) in Class L Shares Outstanding | | | (2 | ) | | | — | @@ | |
Class C: | |
Shares Subscribed | | | 6 | | | | — | | |
Shares Issued on Distributions Reinvested | | | — | @@ | | | — | @@ | |
Shares Redeemed | | | (1 | ) | | | — | | |
Net Increase in Class C Shares Outstanding | | | 5 | | | | — | @@ | |
Class IS: | |
Shares Subscribed | | | 9 | | | | 14 | | |
Shares Issued on Distributions Reinvested | | | 48 | | | | 37 | | |
Shares Redeemed | | | (131 | ) | | | (509 | ) | |
Net Decrease in Class IS Shares Outstanding | | | (74 | ) | | | (458 | ) | |
* Class H shares were liquidated on February 29, 2016.
@ Amount is less than $500.
@@ Amount is less than 500 shares.
The accompanying notes are an integral part of the financial statements.
13
Morgan Stanley Institutional Fund, Inc.
Annual Report — December 31, 2017
Financial Highlights
International Real Estate Portfolio
| | | Class I | |
| | | Year Ended December 31, | |
Selected Per Share Data and Ratios | | 2017 | | 2016(1) | | 2015 | | 2014 | | 2013 | |
Net Asset Value, Beginning of Period | | $ | 17.53 | | | $ | 18.72 | | | $ | 19.84 | | | $ | 19.99 | | | $ | 20.16 | | |
Income (Loss) from Investment Operations: | |
Net Investment Income(2) | | | 0.59 | | | | 0.46 | | | | 0.37 | | | | 0.39 | | | | 0.41 | | |
Net Realized and Unrealized Gain (Loss) | | | 2.69 | | | | (0.73 | ) | | | (1.00 | ) | | | (0.07 | ) | | | 0.65 | | |
Total from Investment Operations | | | 3.28 | | | | (0.27 | ) | | | (0.63 | ) | | | 0.32 | | | | 1.06 | | |
Distributions from and/or in Excess of: | |
Net Investment Income | | | (1.45 | ) | | | (0.92 | ) | | | (0.49 | ) | | | (0.47 | ) | | | (1.23 | ) | |
Redemption Fees | | | 0.00 | (3) | | | 0.00 | (3) | | | 0.00 | (3) | | | 0.00 | (3) | | | 0.00 | (3) | |
Net Asset Value, End of Period | | $ | 19.36 | | | $ | 17.53 | | | $ | 18.72 | | | $ | 19.84 | | | $ | 19.99 | | |
Total Return(4) | | | 19.13 | % | | | (1.38 | )% | | | (3.29 | )% | | | 1.61 | % | | | 5.56 | % | |
Ratios and Supplemental Data: | |
Net Assets, End of Period (Thousands) | | $ | 19,846 | | | $ | 26,213 | | | $ | 67,459 | | | $ | 94,269 | | | $ | 130,023 | | |
Ratio of Expenses to Average Net Assets(7) | | | 1.00 | %(5) | | | 1.00 | %(5) | | | 1.00 | %(5) | | | 1.00 | %(5) | | | 1.00 | %(5) | |
Ratio of Expenses to Average Net Assets Excluding Non Operating Expenses | | | 1.00 | %(5) | | | N/A | | | | N/A | | | | N/A | | | | N/A | | |
Ratio of Net Investment Income to Average Net Assets(7) | | | 3.13 | %(5) | | | 2.47 | %(5) | | | 1.84 | %(5) | | | 1.91 | %(5) | | | 2.00 | %(5) | |
Ratio of Rebate from Morgan Stanley Affiliates to Average Net Assets | | | 0.00 | %(6) | | | 0.00 | %(6) | | | 0.00 | %(6) | | | 0.00 | %(6) | | | 0.00 | %(6) | |
Portfolio Turnover Rate | | | 23 | % | | | 21 | % | | | 37 | % | | | 59 | % | | | 40 | % | |
(7) Supplemental Information on the Ratios to Average Net Assets: | |
Ratios Before Expense Limitation: | |
Expenses to Average Net Assets | | | 1.76 | % | | | 1.37 | % | | | 1.29 | % | | | 1.16 | % | | | 1.23 | %(5) | |
Net Investment Income to Average Net Assets | | | 2.37 | % | | | 2.10 | % | | | 1.55 | % | | | 1.75 | % | | | 1.76 | %(5) | |
(1) Reflects prior period custodian out-of-pocket expenses that were reimbursed in September 2016. The amount of the reimbursement was immaterial on a per share basis and did not impact the total return of Class I shares. The Ratio of Expenses to Average Net Assets and the Ratio of Net Investment Income to Average Net Assets would be unchanged as the reimbursement of custodian fees was offset against expense waivers/reimbursements with no impact to net expenses or net investment income.
(2) Per share amount is based on average shares outstanding.
(3) Amount is less than $0.005 per share.
(4) Calculated based on the net asset value as of the last business day of the period.
(5) The Ratios of Expenses and Net Investment Income reflect the rebate of certain Fund expenses in connection with the investments in Morgan Stanley affiliates during the period. The effect of the rebate on the ratios is disclosed in the above table as "Ratio of Rebate from Morgan Stanley Affiliates to Average Net Assets."
(6) Amount is less than 0.005%.
The accompanying notes are an integral part of the financial statements.
14
Morgan Stanley Institutional Fund, Inc.
Annual Report — December 31, 2017
Financial Highlights
International Real Estate Portfolio
| | | Class A | |
| | | Year Ended December 31, | |
Selected Per Share Data and Ratios | | 2017 | | 2016(1) | | 2015 | | 2014 | | 2013 | |
Net Asset Value, Beginning of Period | | $ | 17.54 | | | $ | 18.73 | | | $ | 19.84 | | | $ | 19.98 | | | $ | 20.14 | | |
Income (Loss) from Investment Operations: | |
Net Investment Income(2) | | | 0.51 | | | | 0.39 | | | | 0.30 | | | | 0.31 | | | | 0.35 | | |
Net Realized and Unrealized Gain (Loss) | | | 2.71 | | | | (0.73 | ) | | | (1.00 | ) | | | (0.06 | ) | | | 0.66 | | |
Total from Investment Operations | | | 3.22 | | | | (0.34 | ) | | | (0.70 | ) | | | 0.25 | | | | 1.01 | | |
Distributions from and/or in Excess of: | |
Net Investment Income | | | (1.39 | ) | | | (0.85 | ) | | | (0.41 | ) | | | (0.39 | ) | | | (1.17 | ) | |
Redemption Fees | | | 0.00 | (3) | | | 0.00 | (3) | | | — | | | | 0.00 | (3) | | | 0.00 | (3) | |
Net Asset Value, End of Period | | $ | 19.37 | | | $ | 17.54 | | | $ | 18.73 | | | $ | 19.84 | | | $ | 19.98 | | |
Total Return(4) | | | 18.78 | % | | | (1.78 | )% | | | (3.61 | )% | | | 1.27 | % | | | 5.28 | % | |
Ratios and Supplemental Data: | |
Net Assets, End of Period (Thousands) | | $ | 1,917 | | | $ | 1,512 | | | $ | 2,308 | | | $ | 2,792 | | | $ | 3,331 | | |
Ratio of Expenses to Average Net Assets(8) | | | 1.35 | %(5) | | | 1.35 | %(5) | | | 1.35 | %(5) | | | 1.35 | %(5) | | | 1.27 | %(5)(6) | |
Ratio of Expenses to Average Net Assets Excluding Non Operating Expenses | | | 1.35 | %(5) | | | N/A | | | | N/A | | | | N/A | | | | N/A | | |
Ratio of Net Investment Income to Average Net Assets(8) | | | 2.71 | %(5) | | | 2.10 | %(5) | | | 1.48 | %(5) | | | 1.55 | %(5) | | | 1.72 | %(5) | |
Ratio of Rebate from Morgan Stanley Affiliates to Average Net Assets | | | 0.00 | %(7) | | | 0.00 | %(7) | | | 0.00 | %(7) | | | 0.00 | %(7) | | | 0.00 | %(7) | |
Portfolio Turnover Rate | | | 23 | % | | | 21 | % | | | 37 | % | | | 59 | % | | | 40 | % | |
(8) Supplemental Information on the Ratios to Average Net Assets: | |
Ratios Before Expense Limitation: | |
Expenses to Average Net Assets | | | 2.23 | % | | | 1.85 | % | | | 1.70 | % | | | 1.58 | % | | | 1.53 | %(5) | |
Net Investment Income to Average Net Assets | | | 1.83 | % | | | 1.60 | % | | | 1.13 | % | | | 1.32 | % | | | 1.47 | %(5) | |
(1) Reflects prior period custodian out-of-pocket expenses that were reimbursed in September 2016. The amount of the reimbursement was immaterial on a per share basis and did not impact the total return of Class A shares. The Ratio of Expenses to Average Net Assets and the Ratio of Net Investment Income to Average Net Assets would be unchanged as the reimbursement of custodian fees was offset against expense waivers/reimbursements with no impact to net expenses or net investment income.
(2) Per share amount is based on average shares outstanding.
(3) Amount is less than $0.005 per share.
(4) Calculated based on the net asset value which does not reflect sales charges, if applicable, as of the last business day of the period.
(5) The Ratios of Expenses and Net Investment Income reflect the rebate of certain Fund expenses in connection with the investments in Morgan Stanley affiliates during the period. The effect of the rebate on the ratios is disclosed in the above table as "Ratio of Rebate from Morgan Stanley Affiliates to Average Net Assets."
(6) Effective September 16, 2013, the Adviser has agreed to limit the ratio of expenses to average net assets to the maximum ratio of 1.35% for Class A shares. Prior to September 16, 2013, the maximum ratio was 1.25% for Class A shares.
(7) Amount is less than 0.005%.
The accompanying notes are an integral part of the financial statements.
15
Morgan Stanley Institutional Fund, Inc.
Annual Report — December 31, 2017
Financial Highlights
International Real Estate Portfolio
| | | Class L | |
| | | Year Ended December 31, | |
Selected Per Share Data and Ratios | | 2017 | | 2016(1) | | 2015 | | 2014 | | 2013 | |
Net Asset Value, Beginning of Period | | $ | 17.42 | | | $ | 18.61 | | | $ | 19.69 | | | $ | 19.86 | | | $ | 20.13 | | |
Income (Loss) from Investment Operations: | |
Net Investment Income(2) | | | 0.50 | | | | 0.29 | | | | 0.18 | | | | 0.21 | | | | 0.22 | | |
Net Realized and Unrealized Gain (Loss) | | | 2.59 | | | | (0.71 | ) | | | (0.97 | ) | | | (0.06 | ) | | | 0.68 | | |
Total from Investment Operations | | | 3.09 | | | | (0.42 | ) | | | (0.79 | ) | | | 0.15 | | | | 0.90 | | |
Distributions from and/or in Excess of: | |
Net Investment Income | | | (1.22 | ) | | | (0.77 | ) | | | (0.29 | ) | | | (0.32 | ) | | | (1.17 | ) | |
Redemption Fees | | | 0.00 | (3) | | | 0.00 | (3) | | | 0.00 | (3) | | | 0.00 | (3) | | | — | | |
Net Asset Value, End of Period | | $ | 19.29 | | | $ | 17.42 | | | $ | 18.61 | | | $ | 19.69 | | | $ | 19.86 | | |
Total Return(4) | | | 18.14 | % | | | (2.23 | )% | | | (4.11 | )% | | | 0.75 | % | | | 4.73 | % | |
Ratios and Supplemental Data: | |
Net Assets, End of Period (Thousands) | | $ | 11 | | | $ | 53 | | | $ | 55 | | | $ | 95 | | | $ | 73 | | |
Ratio of Expenses to Average Net Assets(8) | | | 1.85 | %(5) | | | 1.85 | %(5) | | | 1.85 | %(5) | | | 1.85 | %(5) | | | 1.81 | %(5)(6) | |
Ratio of Expenses to Average Net Assets Excluding Non Operating Expenses | | | 1.85 | %(5) | | | N/A | | | | N/A | | | | N/A | | | | N/A | | |
Ratio of Net Investment Income to Average Net Assets(8) | | | 2.70 | %(5) | | | 1.58 | %(5) | | | 0.90 | %(5) | | | 1.05 | %(5) | | | 1.08 | %(5) | |
Ratio of Rebate from Morgan Stanley Affiliates to Average Net Assets | | | 0.00 | %(7) | | | 0.00 | %(7) | | | 0.00 | %(7) | | | 0.00 | %(7) | | | 0.00 | %(7) | |
Portfolio Turnover Rate | | | 23 | % | | | 21 | % | | | 37 | % | | | 59 | % | | | 40 | % | |
(8) Supplemental Information on the Ratios to Average Net Assets: | |
Ratios Before Expense Limitation: | |
Expenses to Average Net Assets | | | 14.81 | % | | | 5.51 | % | | | 4.58 | % | | | 3.90 | % | | | 3.44 | %(5) | |
Net Investment Loss to Average Net Assets | | | (10.26 | )% | | | (2.08 | )% | | | (1.83 | )% | | | (1.00 | )% | | | (0.55 | )%(5) | |
(1) Reflects prior period custodian out-of-pocket expenses that were reimbursed in September 2016. The amount of the reimbursement was immaterial on a per share basis and did not impact the total return of Class L shares. The Ratio of Expenses to Average Net Assets and the Ratio of Net Investment Income to Average Net Assets would be unchanged as the reimbursement of custodian fees was offset against expense waivers/reimbursements with no impact to net expenses or net investment income.
(2) Per share amount is based on average shares outstanding.
(3) Amount is less than $0.005 per share.
(4) Calculated based on the net asset value as of the last business day of the period.
(5) The Ratios of Expenses and Net Investment Income reflect the rebate of certain Fund expenses in connection with the investments in Morgan Stanley affiliates during the period. The effect of the rebate on the ratios is disclosed in the above table as "Ratio of Rebate from Morgan Stanley Affiliates to Average Net Assets."
(6) Effective September 16, 2013, the Adviser has agreed to limit the ratio of expenses to average net assets to the maximum ratio of 1.85% for Class L shares. Prior to September 16, 2013, the maximum ratio was 1.75% for Class L shares.
(7) Amount is less than 0.005%.
The accompanying notes are an integral part of the financial statements.
16
Morgan Stanley Institutional Fund, Inc.
Annual Report — December 31, 2017
Financial Highlights
International Real Estate Portfolio
| | | Class C | |
| | | Year Ended December 31, | | Period from
April 30, 2015(2) to | |
Selected Per Share Data and Ratios | | 2017 | | 2016(1) | | December 31, 2015 | |
Net Asset Value, Beginning of Period | | $ | 17.32 | | | $ | 18.50 | | | $ | 21.28 | | |
Income (Loss) from Investment Operations: | |
Net Investment Income(3) | | | 0.30 | | | | 0.25 | | | | 0.06 | | |
Net Realized and Unrealized Gain (Loss) | | | 2.71 | | | | (0.71 | ) | | | (2.48 | ) | |
Total from Investment Operations | | | 3.01 | | | | (0.46 | ) | | | (2.42 | ) | |
Distributions from and/or in Excess of: | |
Net Investment Income | | | (1.33 | ) | | | (0.72 | ) | | | (0.36 | ) | |
Redemption Fees | | | 0.00 | (4) | | | 0.00 | (4) | | | 0.00 | (4) | |
Net Asset Value, End of Period | | $ | 19.00 | | | $ | 17.32 | | | $ | 18.50 | | |
Total Return(5) | | | 17.78 | % | | | (2.44 | )% | | | (11.47 | )%(8) | |
Ratios and Supplemental Data: | |
Net Assets, End of Period (Thousands) | | $ | 128 | | | $ | 21 | | | $ | 22 | | |
Ratio of Expenses to Average Net Assets(10) | | | 2.10 | %(6) | | | 2.10 | %(6) | | | 2.10 | %(6)(9) | |
Ratio of Expenses to Average Net Assets Excluding Non Operating Expenses | | | 2.10 | %(6) | | | N/A | | | | N/A | | |
Ratio of Net Investment Income to Average Net Assets(10) | | | 1.58 | %(6) | | | 1.33 | %(6) | | | 0.45 | %(6)(9) | |
Ratio of Rebate from Morgan Stanley Affiliates to Average Net Assets | | | 0.00 | %(7) | | | 0.00 | %(7) | | | 0.00 | %(7)(9) | |
Portfolio Turnover Rate | | | 23 | % | | | 21 | % | | | 37 | % | |
(10) Supplemental Information on the Ratios to Average Net Assets: | |
Ratios Before Expense Limitation: | |
Expense to Average Net Assets | | | 5.62 | % | | | 12.39 | % | | | 10.98 | %(9) | |
Net Investment Loss to Average Net Assets | | | (1.94 | )% | | | (8.96 | )% | | | (8.43 | )%(9) | |
(1) Reflects prior period custodian out-of-pocket expenses that were reimbursed in September 2016. The amount of the reimbursement was immaterial on a per share basis and did not impact the total return of Class C shares. The Ratio of Expenses to Average Net Assets and the Ratio of Net Investment Income to Average Net Assets would be unchanged as the reimbursement of custodian fees was offset against expense waivers/reimbursements with no impact to net expenses or net investment income.
(2) Commencement of Offering.
(3) Per share amount is based on average shares outstanding.
(4) Amount is less than $0.005 per share.
(5) Calculated based on the net asset value which does not reflect sales charges, if applicable, as of the last business day of the period.
(6) The Ratios of Expenses and Net Investment Income reflect the rebate of certain Fund expenses in connection with the investments in Morgan Stanley affiliates during the period. The effect of the rebate on the ratios is disclosed in the above table as "Ratio of Rebate from Morgan Stanley Affiliates to Average Net Assets."
(7) Amount is less than 0.005%.
(8) Not annualized.
(9) Annualized.
The accompanying notes are an integral part of the financial statements.
17
Morgan Stanley Institutional Fund, Inc.
Annual Report — December 31, 2017
Financial Highlights
International Real Estate Portfolio
| | | Class IS | |
| | | Year Ended December 31, | | Period from
September 13, 2013(2) to | |
Selected Per Share Data and Ratios | | 2017 | | 2016(1) | | 2015 | | 2014 | | December 31, 2013 | |
Net Asset Value, Beginning of Period | | $ | 17.52 | | | $ | 18.71 | | | $ | 19.83 | | | $ | 19.99 | | | $ | 19.97 | | |
Income (Loss) from Investment Operations: | |
Net Investment Income(3) | | | 0.59 | | | | 0.47 | | | | 0.37 | | | | 0.23 | | | | 0.11 | | |
Net Realized and Unrealized Gain (Loss) | | | 2.70 | | | | (0.73 | ) | | | (1.00 | ) | | | 0.09 | | | | 0.22 | | |
Total from Investment Operations | | | 3.29 | | | | (0.26 | ) | | | (0.63 | ) | | | 0.32 | | | | 0.33 | | |
Distributions from and/or in Excess of: | |
Net Investment Income | | | (1.46 | ) | | | (0.93 | ) | | | (0.49 | ) | | | (0.48 | ) | | | (0.31 | ) | |
Redemption Fees | | | 0.00 | (4) | | | 0.00 | (4) | | | 0.00 | (4) | | | 0.00 | (4) | | | — | | |
Net Asset Value, End of Period | | $ | 19.35 | | | $ | 17.52 | | | $ | 18.71 | | | $ | 19.83 | | | $ | 19.99 | | |
Total Return(5) | | | 19.19 | % | | | (1.33 | )% | | | (3.26 | )% | | | 1.60 | % | | | 1.68 | %(9) | |
Ratios and Supplemental Data: | |
Net Assets, End of Period (Thousands) | | $ | 11,359 | | | $ | 11,573 | | | $ | 20,944 | | | $ | 2,557 | | | $ | 10 | | |
Ratio of Expenses to Average Net Assets(11) | | | 0.97 | %(6) | | | 0.97 | %(6) | | | 0.97 | %(6) | | | 0.97 | %(6) | | | 0.97 | %(6)(7)(10) | |
Ratio of Expenses to Average Net Assets Excluding Non Operating Expenses | | | 0.97 | %(6) | | | N/A | | | | N/A | | | | N/A | | | | N/A | | |
Ratio of Net Investment Income to Average Net Assets(11) | | | 3.11 | %(6) | | | 2.52 | %(6) | | | 1.86 | %(6) | | | 1.14 | %(6) | | | 1.76 | %(6)(10) | |
Ratio of Rebate from Morgan Stanley Affiliates to Average Net Assets | | | 0.00 | %(8) | | | 0.00 | %(8) | | | 0.00 | %(8) | | | 0.00 | %(8) | | | 0.00 | %(8)(10) | |
Portfolio Turnover Rate | | | 23 | % | | | 21 | % | | | 37 | % | | | 59 | % | | | 40 | % | |
(11) Supplemental Information on the Ratios to Average Net Assets: | |
Ratios Before Expense Limitation: | |
Expenses to Average Net Assets | | | 1.70 | % | | | 1.33 | % | | | 1.30 | % | | | 1.13 | % | | | 6.46 | %(10) | |
Net Investment Income (Loss) to Average Net Assets | | | 2.38 | % | | | 2.16 | % | | | 1.53 | % | | | 0.98 | % | | | (3.73 | )%(10) | |
(1) Reflects prior period custodian out-of-pocket expenses that were reimbursed in September 2016. The amount of the reimbursement was immaterial on a per share basis and did not impact the total return of Class IS shares. The Ratio of Expenses to Average Net Assets and the Ratio of Net Investment Income to Average Net Assets would be unchanged as the reimbursement of custodian fees was offset against expense waivers/reimbursements with no impact to net expenses or net investment income.
(2) Commencement of Offering.
(3) Per share amount is based on average shares outstanding.
(4) Amount is less than $0.005 per share.
(5) Calculated based on the net asset value as of the last business day of the period.
(6) The Ratios of Expenses and Net Investment Income reflect the rebate of certain Fund expenses in connection with the investments in Morgan Stanley affiliates during the period. The effect of the rebate on the ratios is disclosed in the above table as "Ratio of Rebate from Morgan Stanley Affiliates to Average Net Assets."
(7) Effective September 16, 2013, the Adviser has agreed to limit the ratio of expenses to average net assets to the maximum ratio of 0.97% for Class IS shares.
(8) Amount is less than 0.005%.
(9) Not annualized.
(10) Annualized.
The accompanying notes are an integral part of the financial statements.
18
Morgan Stanley Institutional Fund, Inc.
Annual Report — December 31, 2017
Notes to Financial Statements
Morgan Stanley Institutional Fund, Inc. (the "Company") is registered under the Investment Company Act of 1940, as amended (the "Act"), as an open-end management investment company. The Company is comprised of twenty-nine separate, active, diversified and non-diversified funds (individually referred to as a "Fund", collectively as the "Funds"). The Company applies investment company accounting and reporting guidance.
The accompanying financial statements relate to the International Real Estate Portfolio. The Fund seeks to provide current income and long-term capital appreciation.
The Fund offers five classes of shares — Class I, Class A, Class L, Class C and Class IS. On April 30, 2015, the Fund suspended offering of Class L shares. Existing Class L shareholders may invest through reinvestment of dividends and distributions.
A. Significant Accounting Policies: The following significant accounting policies are in conformity with U.S. generally accepted accounting principles ("GAAP"). Such policies are consistently followed by the Company in the preparation of its financial statements. GAAP may require management to make estimates and assumptions that affect the reported amounts and disclosures in the financial statements. Actual results may differ from those estimates.
1. Security Valuation: (1) An equity portfolio security listed or traded on an exchange is valued at its latest reported sales price (or at the exchange official closing price if such exchange reports an official closing price), and if there were no sales on a given day and if there is no official exchange closing price for that day, the security is valued at the mean between the last reported bid and asked prices if such bid and asked prices are available on the relevant exchanges. Listed equity securities not traded on the valuation date with no reported bid and asked prices available on the exchange are valued at the mean between the current bid and asked prices obtained from one or more reputable brokers or dealers. In cases where a security is traded on more than one exchange, the security is valued on the exchange designated as the primary market; (2) all other equity portfolio securities for which over-the-counter ("OTC") market quotations are readily available are valued at the latest reported sales price (or at the market official closing price if such market reports an official closing price), and if there was no trading in the security on a given day and if there is no official closing price from
relevant markets for that day, the security is valued at the mean between the last reported bid and asked prices if such bid and asked prices are available on the relevant markets. An unlisted equity security that does not trade on the valuation date and for which bid and asked prices from the relevant markets are unavailable is valued at the mean between the current bid and asked prices obtained from one or more reputable brokers or dealers; (3) certain portfolio securities may be valued by an outside pricing service/vendor approved by the Company's Board of Directors (the "Directors"). The pricing service/vendor may employ a pricing model that takes into account, among other things, bids, yield spreads, and/or other market data and specific security characteristics. Alternatively, if a valuation is not available from an outside pricing service/vendor, and the security trades on an exchange, the security may be valued at its latest reported sale price (or at the exchange official closing price if such exchange reports an official closing price), prior to the time when assets are valued. If there are no sales on a given day and if there is no official exchange closing price for that day, the security is valued at the mean between the last reported bid and asked prices if such bid and asked prices are available in the relevant exchanges; (4) when market quotations are not readily available, including circumstances under which Morgan Stanley Investment Management Inc. (the "Adviser") or Morgan Stanley Investment Management Limited ("MSIM Limited") and Morgan Stanley Investment Management Company ("MSIM Company") (together, the "Sub-Advisers"), each a wholly-owned subsidiary of Morgan Stanley, determine that the closing price, last sale price or the mean between the last reported bid and asked prices are not reflective of a security's market value, portfolio securities are valued at their fair value as determined in good faith under procedures established by and under the general supervision of the Directors. Occasionally, developments affecting the closing prices of securities and other assets may occur between the times at which valuations of such securities are determined (that is, close of the foreign market on which the securities trade) and the close of business of the New York Stock Exchange ("NYSE"). If developments occur during such periods that are expected to materially affect the value of such securities, such valuations may be adjusted to reflect the estimated fair value of such securities as of the close of the NYSE, as determined in good faith by the Directors or by the Adviser using a pricing service and/or procedures approved by the
19
Morgan Stanley Institutional Fund, Inc.
Annual Report — December 31, 2017
Notes to Financial Statements (cont'd)
Directors; (5) quotations of foreign portfolio securities, other assets and liabilities and forward contracts stated in foreign currency are translated into U.S. dollar equivalents at the prevailing market rates prior to the close of the NYSE; and (6) investments in mutual funds, including the Morgan Stanley Institutional Liquidity Funds, are valued at the net asset value ("NAV") as of the close of each business day.
The Directors have responsibility for determining in good faith the fair value of the investments, and the Directors may appoint others, such as the Company's Adviser or a valuation committee, to assist the Directors in determining fair value and to make the actual calculations pursuant to the fair valuation methodologies previously approved by the Directors. Under procedures approved by the Directors, the Company's Adviser has formed a Valuation Committee whose members are approved by the Directors. The Valuation Committee provides administration and oversight of the Company's valuation policies and procedures, which are reviewed at least annually by the Directors. These procedures allow the Company to utilize independent pricing services, quotations from securities and financial instrument dealers, and other market sources to determine fair value.
The Company has procedures to determine the fair value of securities and other financial instruments for which market prices are not readily available. Under these procedures, the Valuation Committee convenes on a regular and ad hoc basis to review such securities and considers a number of factors, including valuation methodologies and significant unobservable valuation inputs, when arriving at fair value. The Valuation Committee may employ a market-based approach which may use related or comparable assets or liabilities, recent transactions, market multiples, book values, and other relevant information for the investment to determine the fair value of the investment. An income-based valuation approach may also be used in which the anticipated future cash flows of the investment are discounted to calculate fair value. Discounts may also be applied due to the nature or duration of any restrictions on the disposition of the investments. Due to the inherent uncertainty of valuations of such investments, the fair values may differ significantly from the values that would have been used had an active market existed. The Valuation Committee employs various methods for calibrating
these valuation approaches including a regular review of valuation methodologies, key inputs and assumptions, transactional back-testing or disposition analysis, and reviews of any related market activity.
The Fund invests a significant portion of its assets in securities of real estate investment trusts ("REITs"). The market's perception of prospective declines in private real estate values and other financial assets may result in increased volatility of market prices that can negatively impact the valuation of certain issuers held by the Fund.
2. Fair Value Measurement: Financial Accounting Standards Board ("FASB") Accounting Standards CodificationTM ("ASC") 820, "Fair Value Measurement" ("ASC 820"), defines fair value as the value that the Fund would receive to sell an investment or pay to transfer a liability in a timely transaction with an independent buyer in the principal market, or in the absence of a principal market, the most advantageous market for the investment or liability. ASC 820 establishes a three-tier hierarchy to distinguish between (1) inputs that reflect the assumptions market participants would use in valuing an asset or liability developed based on market data obtained from sources independent of the reporting entity (observable inputs) and (2) inputs that reflect the reporting entity's own assumptions about the assumptions market participants would use in valuing an asset or liability developed based on the best information available in the circumstances (unobservable inputs) and to establish classification of fair value measurements for disclosure purposes. Various inputs are used in determining the value of the Fund's investments. The inputs are summarized in the three broad levels listed below.
• Level 1 – unadjusted quoted prices in active markets for identical investments
• Level 2 – other significant observable inputs (including quoted prices for similar investments, interest rates, prepayment speeds, credit risk, etc.)
• Level 3 – significant unobservable inputs including the Fund's own assumptions in determining the fair value of investments. Factors considered in making this determination may include, but are not limited to,
20
Morgan Stanley Institutional Fund, Inc.
Annual Report — December 31, 2017
Notes to Financial Statements (cont'd)
information obtained by contacting the issuer, analysts, or the appropriate stock exchange (for exchange-traded securities), analysis of the issuer's financial statements or other available documents and, if necessary, available information concerning other securities in similar circumstances
The inputs or methodology used for valuing securities are not necessarily an indication of the risk associated with investing in those securities and the determination of the significance of a particular input to the fair value measurement in its entirety requires judgment and considers factors specific to each security.
The following is a summary of the inputs used to value the Fund's investments as of December 31, 2017.
Investment Type | | Level 1
Unadjusted
quoted
prices
(000) | | Level 2
Other
significant
observable
inputs
(000) | | Level 3
Significant
unobservable
inputs
(000) | | Total
(000) | |
Assets: | |
Common Stocks | |
Diversified | | $ | 615 | | | $ | 16,309 | | | $ | — | | | $ | 16,924 | | |
Industrial | | | — | | | | 1,180 | | | | — | | | | 1,180 | | |
Lodging/Resorts | | | — | | | | 92 | | | | — | | | | 92 | | |
Office | | | — | | | | 4,892 | | | | — | | | | 4,892 | | |
Residential | | | — | | | | 2,681 | | | | 6 | | | | 2,687 | | |
Retail | | | — | | | | 7,138 | | | | — | | | | 7,138 | | |
Total Common Stocks | | | 615 | | | | 32,292 | | | | 6 | | | | 32,913 | | |
Short-Term Investment | |
Investment Company | | | 151 | | | | — | | | | — | | | | 151 | | |
Total Assets | | $ | 766 | | | $ | 32,292 | | | $ | 6 | | | $ | 33,064 | | |
Transfers between investment levels may occur as the markets fluctuate and/or the availability of data used in an investment's valuation changes. The Fund recognizes transfers between the levels as of the end of the period. As of December 31, 2017, securities with a total value of approximately $29,209,000 transferred from Level 1 to Level 2. Securities that were valued using unadjusted quoted prices at December 31, 2016 were valued using other significant observable inputs at December 31, 2017. At December 31, 2017, the fair value of certain securities were adjusted due to developments which occurred between the time of the close of the foreign markets on which they trade and the close of business on the NYSE which resulted in their Level 2 classification.
Following is a reconciliation of investments in which significant unobservable inputs (Level 3) were used in determining fair value.
| | | Common
Stock
(000) | |
Beginning Balance | | $ | 153 | | |
Purchases | | | — | | |
Sales | | | — | | |
Amortization of discount | | | — | | |
Transfers in | | | — | | |
Transfers out | | | — | | |
Corporate actions | | | — | | |
Change in unrealized appreciation (depreciation) | | | (147 | ) | |
Realized gains (losses) | | | — | | |
Ending Balance | | $ | 6 | | |
Net change in unrealized appreciation (depreciation) from investments
still held as of December 31, 2017 | | $ | (147 | ) | |
The following table presents additional information about valuation techniques and inputs used for investments that are measured at fair value and categorized within Level 3 as of December 31, 2017.
| | | Fair Value at
December 31, 2017
(000) | | Valuation
Technique | | Unobservable
Input | | Range | | Selected
Value | | Impact to
Valuation from an
increase in input | |
Residential | |
Common Stock
| | $ | 6
| | | Market Transaction
Method | | Transaction Valuation | | $ | 0.001 | | | $ | 0.001 | | | $ | 0.001 | | | Increase | |
| |
| |
| | Discount for Lack of
Marketability | | | 50.0 | % | | | 50.0 | % | | | 50.0 | % | | Decrease | |
21
Morgan Stanley Institutional Fund, Inc.
Annual Report — December 31, 2017
Notes to Financial Statements (cont'd)
3. Foreign Currency Translation and Foreign Investments: The books and records of the Fund are maintained in U.S. dollars. Foreign currency amounts are translated into U.S. dollars as follows:
– investments, other assets and liabilities at the prevailing rate of exchange on the valuation date;
– investment transactions and investment income at the prevailing rates of exchange on the dates of such transactions.
Although the net assets of the Fund are presented at the foreign exchange rates and market values at the close of the period, the Fund does not isolate that portion of the results of operations arising as a result of changes in the foreign exchange rates from the fluctuations arising from changes in the market prices of securities held at period end. Similarly, the Fund does not isolate the effect of changes in foreign exchange rates from the fluctuations arising from changes in the market prices of securities sold during the period. Accordingly, realized and unrealized foreign currency gains (losses) on investments in securities are included in the reported net realized and unrealized gains (losses) on investment transactions and balances. However, pursuant to U.S. federal income tax regulations, gains and losses from certain foreign currency transactions and the foreign currency portion of gains and losses realized on sales and maturities of foreign denominated debt securities are treated as ordinary income for U.S. federal income tax purposes.
Net realized gains (losses) on foreign currency transactions represent net foreign exchange gains (losses) from foreign currency forward exchange contracts, disposition of foreign currencies, currency gains (losses) realized between the trade and settlement dates on securities transactions, and the difference between the amount of investment income and foreign withholding taxes recorded on the Fund's books and the U.S. dollar equivalent amounts actually received or paid. Net unrealized currency gains (losses) from valuing foreign currency denominated assets and liabilities at period end exchange rates are reflected as a component of unrealized appreciation (depreciation) in the Statement of Assets and Liabilities. The change in unrealized currency gains (losses) on foreign currency translations for the period is reflected in the Statement of Operations.
Foreign security and currency transactions may involve certain considerations and risks not typically associated with those of U.S. dollar denominated transactions as a result of, among other factors, fluctuations of exchange rates in relation to the U.S. dollar, the possibility of lower levels of governmental supervision and regulation of foreign securities markets and the possibility of political or economic instability.
Governmental approval for foreign investments may be required in advance of making an investment under certain circumstances in some countries, and the extent of foreign investments in domestic companies may be subject to limitation in other countries. Foreign ownership limitations also may be imposed by the charters of individual companies to prevent, among other concerns, violations of foreign investment limitations. As a result, an additional class of shares (identified as "Foreign" in the Portfolio of Investments) may be created and offered for investment. The "local" and "foreign shares" market values may differ. In the absence of trading of the foreign shares in such markets, the Fund values the foreign shares at the closing exchange price of the local shares.
4. Redemption Fees: The Fund will assess a 2% redemption fee on Class I shares, Class A shares, Class L shares, Class C shares and Class IS shares, which is paid directly to the Fund, for shares redeemed or exchanged within thirty days of purchase, subject to certain exceptions. The redemption fee is designed to protect the Fund and its remaining shareholders from the effects of short-term trading. These fees, if any, are included in the Statements of Changes in Net Assets.
5. Indemnifications: The Company enters into contracts that contain a variety of indemnifications. The Company's maximum exposure under these arrangements is unknown. However, the Company has not had prior claims or losses pursuant to these contracts and expects the risk of loss to be remote.
6. Dividends and Distributions to Shareholders: Dividend income and distributions to shareholders are recorded on the ex-dividend date. Dividends from net investment income, if any, are declared and paid annually. Net realized capital gains, if any, are distributed at least annually.
22
Morgan Stanley Institutional Fund, Inc.
Annual Report — December 31, 2017
Notes to Financial Statements (cont'd)
7. Security Transactions, Income and Expenses: Security transactions are accounted for on the trade date (date the order to buy or sell is executed). Realized gains and losses on the sale of investment securities are determined on the specific identified cost method. Dividend income and other distributions are recorded on the ex-dividend date (except for certain foreign dividends which may be recorded as soon as the Fund is informed of such dividends) net of applicable withholding taxes. Interest income is recognized on the accrual basis except where collection is in doubt. Discounts are accreted and premiums are amortized over the life of the respective securities. Most expenses of the Company can be directly attributed to a particular Fund. Expenses which cannot be directly attributed are apportioned among the Funds based upon relative net assets or other appropriate methods. Income, expenses (other than class specific expenses — distribution and shareholder services, transfer agency and sub transfer agency fees) and realized and unrealized gains or losses are allocated to each class of shares based upon their relative net assets.
The Fund owns shares of REITs which report information on the source of their distributions annually in the following calendar year. A portion of distributions received from REITs during the year is estimated to be a return of capital and is recorded as a reduction of their cost.
B. Advisory/Sub-Advisory Fees: The Adviser, a wholly-owned subsidiary of Morgan Stanley, provides the Fund with advisory services under the terms of an Investment Advisory Agreement, paid quarterly, at an annual rate of 0.80% of the daily net assets of the Fund.
The Adviser has agreed to reduce its advisory fee and/or reimburse the Fund so that total annual portfolio operating expenses, excluding certain investment related expenses, taxes, interest and other extraordinary expenses (including litigation), will not exceed 1.00% for Class I shares, 1.35% for Class A shares, 1.85% for Class L shares, 2.10% for Class C shares and 0.97% for Class IS shares. The fee waivers and/or expense reimbursements will continue for at least one year from the date of the Fund's prospectus or until such time as the Directors act to discontinue all or a portion of such waivers and/or reimbursements when they deem such action is appropriate. For the year ended December 31, 2017, approximately $285,000 of advisory fees were waived and approximately $21,000 of
other expenses were reimbursed by the Adviser pursuant to this arrangement.
The Adviser has entered into Sub-Advisory Agreements with the Sub-Advisers, each a wholly-owned subsidiary of Morgan Stanley. The Sub-Advisers provide the Fund with advisory services subject to the overall supervision of the Adviser and the Company's Officers and Directors. The Adviser pays the Sub-Advisers on a monthly basis a portion of the net advisory fees the Adviser receives from the Fund.
C. Administration Fees: The Adviser also serves as Administrator to the Company and provides administrative services pursuant to an Administration Agreement for an annual fee, accrued daily and paid monthly, of 0.08% of the Fund's average daily net assets.
Under a Sub-Administration Agreement between the Administrator and State Street Bank and Trust Company ("State Street"), State Street provides certain administrative services to the Company. For such services, the Administrator pays State Street a portion of the fee the Administrator receives from the Fund.
D. Distribution and Shareholder Services Fees: Morgan Stanley Distribution, Inc. ("MSDI" or the "Distributor"), a wholly-owned subsidiary of the Adviser and an indirect subsidiary of Morgan Stanley, serves as the Company's Distributor of Fund shares pursuant to a Distribution Agreement. The Fund has adopted a Shareholder Services Plan with respect to Class A shares pursuant to Rule 12b-1 under the Act. Under the Shareholder Services Plan, the Fund pays the Distributor a shareholder services fee, accrued daily and paid monthly, at an annual rate of 0.25% of the Fund's average daily net assets attributable to Class A shares.
The Company has adopted a Distribution and Shareholder Services Plan with respect to Class L shares pursuant to Rule 12b-1 under the Act. Under the Distribution and Shareholder Services Plan, the Fund pays the Distributor a distribution fee, accrued daily and paid monthly, at an annual rate of 0.50% and a shareholder services fee, accrued daily and paid monthly, at an annual rate of 0.25% of the Fund's average daily net assets attributable to Class L shares.
The Company has adopted a Distribution and Shareholder Services Plan with respect to Class C shares pursuant to Rule 12b-1 under the Act. Under the Distribution and Shareholder Services Plan, the Fund pays the Distributor a distribution fee, accrued daily and paid monthly, at an annual rate of
23
Morgan Stanley Institutional Fund, Inc.
Annual Report — December 31, 2017
Notes to Financial Statements (cont'd)
0.75% and a shareholder services fee, accrued daily and paid monthly, at an annual rate of 0.25% of the Fund's average daily net assets attributable to Class C shares.
The distribution and shareholder services fees are used to support the expenses associated with servicing and maintaining accounts. The Distributor may compensate other parties for providing shareholder support services to investors who purchase Class A, Class L and Class C shares.
E. Dividend Disbursing and Transfer Agent: The Company's dividend disbursing and transfer agent is Boston Financial Data Services, Inc. ("BFDS"). Pursuant to a Transfer Agency Agreement, the Company pays BFDS a fee based on the number of c lasses, accounts and transactions relating to the Funds of the Company. Effective January 1, 2018, BFDS changed its name to DST Asset Manager Solutions, Inc.
F. Custodian Fees: State Street (the "Custodian") also serves as Custodian for the Company in accordance with a Custodian Agreement. The Custodian holds cash, securities, and other assets of the Company as required by the Act. Custody fees are payable monthly based on assets held in custody, investment purchases and sales activity and account maintenance fees, plus reimbursement for certain out-of-pocket expenses.
G. Security Transactions and Transactions with Affiliates: For the year ended December 31, 2017, purchases and sales of investment securities for the Fund, other than long-term U.S. Government securities and short-term investments, were approximately $9,108,000 and $21,284,000, respectively. There were no purchases and sales of long-term U.S. Government securities for the year ended December 31, 2017.
The Fund invests in the Institutional Class of the Morgan Stanley Institutional Liquidity Funds — Treasury Portfolio (the "Liquidity Funds"), an open-end management investment company managed by the Adviser. Advisory fees paid by the Fund are reduced by an amount equal to its pro-rata share of the advisory and administration fees paid by the Fund due to its investment in the Liquidity Funds. For the year ended December 31, 2017, advisory fees paid were reduced approximately $1,000 relating to the Fund's investment in the Liquidity Funds.
A summary of the Fund's transactions in shares of the Liquidity Funds during the year ended December 31, 2017 is as follows:
Affiliated
Investment
Company | | Value
December 31,
2016
(000) | | Purchases
at Cost
(000) | | Proceeds
from Sales
(000) | | Dividend
Income
(000) | |
Liquidity Funds | | $ | 216 | | | $ | 8,492 | | | $ | 8,557 | | | $ | 3 | | |
Affiliated
Investment
Company (cont'd) | | Realized
Gain
(Loss)
(000) | | Change in
Unrealized
Appreciation
(Depreciation)
(000) | | Value
December 31,
2017
(000) | |
Liquidity Funds | | $ | — | | | $ | — | | | $ | 151 | | |
The Fund is permitted to purchase and sell securities ("cross-trade") from and to other Morgan Stanley Funds as well as other funds and client accounts for which the Adviser or an affiliate of the Adviser serves as investment adviser, pursuant to procedures approved by the Directors in compliance with Rule 17a-7 under the Act (the "Rule"). Each cross-trade is executed at the current market price in compliance with provisions of the Rule. For the year ended December 31, 2017, the Fund did not engage in any cross-trade transactions.
The Fund has an unfunded Deferred Compensation Plan (the "Compensation Plan"), which allows each independent Director to defer payment of all, or a portion, of the fees he or she receives for serving on the Board of Directors. Each eligible Director generally may elect to have the deferred amounts credited with a return equal to the total return on one or more of the Morgan Stanley funds that are offered as investment options under the Compensation Plan. Appreciation/depreciation and distributions received from these investments are recorded with an offsetting increase/decrease in the deferred compensation obligation and do not affect the NAV of the Fund.
H. Federal Income Taxes: It is the Fund's intention to continue to qualify as a regulated investment company and distribute all of its taxable and tax-exempt income. Accordingly, no provision for federal income taxes is required in the financial statements.
The Fund may be subject to taxes imposed by countries in which it invests. Such taxes are generally based on income and/or capital gains earned or repatriated. Taxes are accrued based on net investment income, net realized gains and net unrealized appreciation as such income and/or gains are earned. Taxes may also be based on transactions in foreign currency and are accrued based on the value of investments denominated in such currency.
24
Morgan Stanley Institutional Fund, Inc.
Annual Report — December 31, 2017
Notes to Financial Statements (cont'd)
FASB ASC 740-10, "Income Taxes — Overall", sets forth a minimum threshold for financial statement recognition of the benefit of a tax position taken or expected to be taken in a tax return. Management has concluded there are no significant uncertain tax positions that would require recognition in the financial statements. If applicable, the Fund recognizes interest accrued related to unrecognized tax benefits in "Interest Expense" and penalties in "Other Expenses" in the Statement of Operations. The Fund files tax returns with the U.S. Internal Revenue Service, New York and various states. Generally, each of the tax years in the four-year period ended December 31, 2017, remains subject to examination by taxing authorities.
The tax character of distributions paid may differ from the character of distributions shown in the Statements of Changes in Net Assets due to short-term capital gains being treated as ordinary income for tax purposes. The tax character of distributions paid during fiscal years 2017 and 2016 was as follows:
2017
Distributions
Paid From: | | 2016
Distributions
Paid From: | |
Ordinary
Income
(000) | | Long-Term
Capital Gain
(000) | | Ordinary
Income
(000) | | Long-Term
Capital Gain
(000) | |
| $ | 2,776 | | | $ | — | | | $ | 2,262 | | | $ | — | | |
The amount and character of income and gains to be distributed are determined in accordance with income tax regulations which may differ from GAAP. These book/tax differences are either considered temporary or permanent in nature.
Temporary differences are primarily due to differing book and tax treatments for the timing of the recognition of gains (losses) on certain investment transactions and the timing of the deductibility of certain expenses.
Permanent differences, primarily due to differing treatments of gains (losses) related to foreign currency transactions, basis adjustments on certain equity securities designated as passive foreign investment companies and an expired capital loss carryforward, resulted in the following reclassifications among the components of net assets at December 31, 2017:
Distributions in
Excess of
Net Investment
Income
(000) | | Accumulated
Net Realized
Loss
(000) | | Paid-in-
Capital
(000) | |
| $ | 531 | | | $ | 217,096 | | | $ | (217,627 | ) | |
At December 31, 2017, the components of distributable earnings for the Fund on a tax basis were as follows:
Undistributed
Ordinary
Income
(000) | | Undistributed
Long-Term
Capital Gain
(000) | |
| $ | 622 | | | $ | — | | |
At December 31, 2017, the Fund had available for federal income tax purposes unused short-term capital losses of approximately $3,259,000 and long-term capital losses of approximately $220,501,000 that do not have an expiration date.
In addition, at December 31, 2017, the Fund had available capital loss carryforwards to offset future net capital gains, to the extent provided by regulations, through the indicated expiration dates:
Amount
(000) | | Expiration | |
| $ | 66,872 | | | December 31, 2018 | |
During the year ended December 31, 2017, capital loss carryforwards of approximately $217,627,000 expired for federal income tax purposes.
To the extent that capital loss carryforwards are used to offset any future capital gains realized during the carryover period as provided by U.S. federal income tax regulations, no capital gains tax liability will be incurred by the Fund for gains realized and not distributed. To the extent that capital gains are offset, such gains will not be distributed to the shareholders.
I. Credit Facility: The Company and other Morgan Stanley funds participated in a $150,000,000 committed, unsecured revolving line of credit facility (the "Facility") with State Street. This Facility is to be used for temporary emergency purposes or funding of shareholder redemption requests. The interest rate on borrowings is based on the federal funds rate or 1 month LIBOR rate plus a spread. The Facility also has a commitment fee of 0.25% per annum based on the unused portion of the Facility. During the year ended December 31, 2017, the Fund did not have any borrowings under the Facility.
J. Other: At December 31, 2017, the Fund had record owners of 10% or greater. Investment activities of these shareholders could have a material impact on the Fund. The aggregate percentage of such owners was 65.0%.
25
Morgan Stanley Institutional Fund, Inc.
Annual Report — December 31, 2017
Report of Independent Registered Public Accounting Firm
To the Shareholders and Board of Directors of
Morgan Stanley Institutional Fund, Inc. —
International Real Estate Portfolio
Opinion on the Financial Statements
We have audited the accompanying statement of assets and liabilities of International Real Estate Portfolio (the "Fund") (one of the funds constituting the Morgan Stanley Institutional Fund, Inc. (the "Company")), including the portfolio of investments, as of December 31, 2017, and the related statement of operations for the year then ended, the statements of changes in net assets for each of the two years in the period then ended, the financial highlights for each of the five years in the period then ended and the related notes (collectively referred to as the "financial statements"). In our opinion, the financial statements present fairly, in all material respects, the financial position of International Real Estate Portfolio (one of the funds constituting Morgan Stanley Institutional Fund, Inc.) at December 31, 2017, the results of its operations for the year then ended, the changes in its net assets for each of the two years in the period then ended and its financial highlights for each of the five years in the period then ended, in conformity with U.S. generally accepted accounting principles.
Basis for Opinion
These financial statements are the responsibility of the Company's management. Our responsibility is to express an opinion on the Fund's financial statements based on our audits. We are a public accounting firm registered with the Public Company Accounting Oversight Board (United States) ("PCAOB") and are required to be independent with respect to the Company in accordance with the U.S. federal securities law and the applicable rules and regulations of the Securities and Exchange Commission and the PCAOB.
We conducted our audits in accordance with the standards of the PCAOB. Those standards require that we plan and perform the audit to obtain reasonable assurance about whether the financial statements are free of material misstatement, whether due to error or fraud. The Company is not required to have, nor were we engaged to perform, an audit of the Company's internal control over financial reporting. As part of our audits, we are required to obtain an understanding of internal control over financial reporting, but not for the purpose of expressing an opinion on the effectiveness of the Company's internal control over financial reporting. Accordingly, we express no such opinion.
Our audits included performing procedures to assess the risks of material misstatement of the financial statements, whether due to error or fraud, and performing procedures that respond to those risks. Such procedures included examining, on a test basis, evidence regarding the amounts and disclosures in the financial statements. Our procedures included confirmation of securities owned as of December 31, 2017 by correspondence with the custodian and others or by other appropriate auditing procedures where replies from others were not received. Our audits also included evaluating the accounting principles used and significant estimates made by management, as well as evaluating the overall presentation of the financial statements. We believe that our audits provide a reasonable basis for our opinion.

We have served as the auditor of one or more Morgan Stanley investment companies since 2000.
Boston, Massachusetts
February 26, 2018
26
Morgan Stanley Institutional Fund, Inc.
Annual Report — December 31, 2017
Federal Tax Notice (unaudited)
For federal income tax purposes, the following information is furnished with respect to the Fund's earnings for the taxable year ended December 31, 2017.
When distributed, certain earnings may be subject to a maximum tax rate of 15% as provided for the Jobs and Growth Tax Relief Reconciliation Act of 2003. The Fund designated up to a maximum of approximately $938,000 as taxable at this lower rate.
The Fund intends to pass through foreign tax credits of approximately $92,000, and has derived net income from sources within foreign countries amounting to approximately $1,779,000.
In January, the Fund provides tax information to shareholders for the preceding calendar year.
27
Morgan Stanley Institutional Fund, Inc.
Annual Report — December 31, 2017
Privacy Notice (unaudited)
MORGAN STANLEY INVESTMENT MANAGEMENT INC.
AN IMPORTANT NOTICE CONCERNING OUR U.S. PRIVACY POLICY
We are required by federal law to provide you with a copy of our privacy policy annually. This policy applies to current and former individual investors in funds managed or sponsored by Morgan Stanley Investment Management Inc. ("MSIM") as well as current and former individual clients of MSIM. This policy is not applicable to partnerships, corporations, trusts or other non-individual clients or investors. Please note that we may amend this policy at any time, and will inform you of any changes as required by law.
WE RESPECT YOUR PRIVACY
We appreciate that you have provided us with your personal financial information. We strive to maintain the privacy of such information while we help you achieve your financial objectives. This Notice describes what non-public personal information we collect about you, why we collect it, when we may share it with others and how certain others may use it. It discusses the steps you may take to limit our sharing of certain information about you to affiliated companies in the Morgan Stanley family of companies ("other Morgan Stanley companies"). It also discloses how you may limit use of certain shared information for marketing purposes by other Morgan Stanley branded companies. Throughout this policy, we refer to the non-public information that personally identifies you or your accounts as "personal information.''
1. WHAT PERSONAL INFORMATION DO WE COLLECT ABOUT YOU?
We obtain personal information from applications and other forms you submit to us, from your dealings with us, from consumer reporting agencies, from our Web sites and from third parties and other sources.
For example:
• We may collect information such as your name, address, e-mail address, telephone/fax numbers, assets, income and investment objectives through subscription documents, applications and other forms you submit to us.
• We may obtain information about account balances, your use of account(s) and the types of products and services you prefer to receive from us through your dealings and transactions with us and other sources.
• We may obtain information about your creditworthiness and credit history from consumer reporting agencies.
• We may collect background information from and through third-party vendors to verify representations you have made and to comply with various regulatory requirements.
• If you interact with us through our public and private Web sites, we may collect information that you provide directly through online communications (such as an e-mail address). We may also collect information about your Internet service provider, your domain name, your computer's operating system and Web browser, your use of our Web sites and your product and service preferences, through the use of "cookies." Please consult the Terms of Use of these sites for more details.
2. WHEN DO WE DISCLOSE PERSONAL INFORMATION WE COLLECT ABOUT YOU?
We may disclose personal information we collect about you to other Morgan Stanley companies and to non-affiliated third parties.
a. Information We Disclose to Other Morgan Stanley Companies.
We may disclose personal information to other Morgan Stanley companies for a variety of reasons, including to manage your account(s) effectively, to service and process your transactions, to let you know about products and services offered by us and other Morgan Stanley companies, to manage our business, and as otherwise required or permitted by law. Offers for products and services from other Morgan Stanley companies are developed under conditions designed to safeguard your personal information.
28
Morgan Stanley Institutional Fund, Inc.
Annual Report — December 31, 2017
Privacy Notice (unaudited) (cont'd)
b. Information We Disclose to Non-affiliated Third Parties.
We do not disclose personal information that we collect about you to non-affiliated third parties except to those who provide marketing services on our behalf, to financial institutions with whom we have joint marketing agreements, and as otherwise required or permitted by law. For example, we may disclose personal information to non-affiliated third parties for servicing and processing transactions, to offer our own products and services, to protect against fraud, for institutional risk control, to respond to judicial process or to perform services on our behalf. When we share personal information with a non-affiliated third party, they are required to limit their use of personal information to the particular purpose for which it was shared and they are not allowed to share personal information with others except to fulfill that limited purpose or as may be permitted or required by law.
3. HOW DO WE PROTECT THE SECURITY AND CONFIDENTIALITY OF PERSONAL INFORMATION WE COLLECT ABOUT YOU?
We maintain physical, electronic and procedural security measures to help safeguard the personal information we collect about you. We have internal policies governing the proper handling of client information. Third parties that provide support or marketing services on our behalf may also receive personal information, and we require them to adhere to confidentiality standards with respect to such information.
4. HOW CAN YOU LIMIT THE SHARING OF CERTAIN TYPES OF PERSONAL INFORMATION WITH OTHER MORGAN STANLEY COMPANIES?
We offer you choices as to whether we share with other Morgan Stanley companies the personal information that was collected to determine your eligibility for products and services you request ("eligibility information"). Eligibility information does not include your identification information or personal information pertaining to our transactions or experiences with you. Please note that, even if you direct us not to share eligibility information with other Morgan Stanley companies ("opt-out"), we may still share personal information, including eligibility information, with those companies in circumstances excluded from the opt-out under applicable law, such as to process transactions or to service your account.
5. HOW CAN YOU LIMIT THE USE OF CERTAIN TYPES OF PERSONAL INFORMATION BY OTHER MORGAN STANLEY COMPANIES FOR MARKETING?
By following the opt-out instructions in Section 6 below, you may limit other Morgan Stanley branded companies from marketing their products or services to you based on personal information we disclose to them. This information may include, for example, your income and account history with us. Please note that, even if you choose to limit Other Morgan Stanley Companies from using personal information about you that we may share with them for marketing their products and services to you, Other Morgan Stanley Companies may use your personal information that they obtain from us to market to you in circumstances permitted by law, such as if the Other Morgan Stanley Company has its own relationship with you.
6. HOW CAN YOU SEND US AN OPT-OUT INSTRUCTION?
If you wish to limit our sharing of eligibility information about you with other Morgan Stanley companies or other Morgan Stanley companies' use of personal information for marketing purposes, as described in this notice, you may do so by:
• Calling us at (800) 548-7786
Monday–Friday between 8a.m. and 6p.m.(EST)
• Writing to us at the following address:
DST Asset Manager Solutions, Inc.
c/o Privacy Coordinator
P.O. Box 219804
Kansas City, Missouri 64121
29
Morgan Stanley Institutional Fund, Inc.
Annual Report — December 31, 2017
Privacy Notice (unaudited) (cont'd)
Your written request should include your name, address, telephone number and account number(s) to which the opt-out applies and whether you are opting out with respect to sharing of eligibility information (Section 4 above), or if information used for Marketing (Section 5 above) or both. Written opt-out requests should not be sent with any other correspondence. In order to process your request, we require that the request be provided by you directly and not through a third party.
Your opt-out preference will remain in effect with respect to this policy (as it may be amended) until you notify us otherwise. If you have a joint account, your direction for us not to share this information with other Morgan Stanley companies and for those other Morgan Stanley companies not to use your personal information for marketing will be applied to all account holders on that account. Please understand that if you limit our sharing or our affiliated companies' use of personal information, you and any joint account holder(s) may not receive information about Morgan Stanley products and services, including products or services that could help you manage your financial resources and achieve your investment objectives.
7. WHAT IF AN AFFILIATED COMPANY BECOMES A NON-AFFILIATED THIRD PARTY?
If, at any time in the future, an affiliated company becomes a non-affiliated third party, further disclosures of personal information made to the former affiliated company will be limited to those described in Section 2(b) above relating to non-affiliated third parties. If you elected under Section 6 to limit disclosures we make to affiliated companies, or use of personal information by affiliated companies, your election will not apply to use by any former affiliated company of your personal information in their possession once it becomes a non-affiliated third party.
SPECIAL NOTICE TO RESIDENTS OF VERMONT
The following section supplements our policy with respect to our individual clients who have a Vermont address and supersedes anything to the contrary in the above policy with respect to those clients only.
The state of Vermont requires financial institutions to obtain your consent prior to sharing personal information that they collect about you with affiliated companies and non-affiliated third parties other than in certain limited circumstances. Except as permitted by law, we will not share personal information we collect about you with non-affiliated third parties or other Morgan Stanley companies unless you provide us with your written consent to share such information ("opt-in").
If you wish to receive offers for investment products and services offered by or through other Morgan Stanley companies, please notify us in writing at the following address:
DST Asset Manager Solutions, Inc.
c/o Privacy Coordinator
P.O. Box 219804
Kansas City, Missouri 64121
Your authorization should include your name, address, telephone number and account number(s) to which the opt-in applies and should not be sent with any other correspondence. In order to process your authorization, we require that the authorization be provided by you directly and not through a third party.
SPECIAL NOTICE TO RESIDENTS OF CALIFORNIA
The following section supplements our policy with respect to our individual clients who have a California address and supersedes anything to the contrary in the above policy with respect to those clients only.
In response to a California law, if your account has a California home address, your personal information will not be disclosed to non-affiliated third parties except as permitted by applicable California law, and we will limit sharing such information with our affiliates to comply with California privacy laws that apply to us.
30
Morgan Stanley Institutional Fund, Inc.
Annual Report — December 31, 2017
Director and Officer Information (unaudited)
Independent Directors:
Name, Age and Address of
Independent Director | | Position(s)
Held with
Registrant | | Length of Time
Served* | | Principal Occupation(s) During Past 5 Years
and Other Relevant Professional Experience | | Number of
Portfolios in
Fund Complex
Overseen by
Independent
Director** | | Other Directorships
Held by Independent
Director*** | |
Frank L. Bowman (73)
c/o Perkins Coie LLP
Counsel to the Independent
Directors
30 Rockefeller Plaza
New York, NY 10112 | | Director | | Since
August
2006 | | President, Strategic Decisions, LLC (consulting) (since February 2009); Director or Trustee of various Morgan Stanley Funds (since August 2006); Chairperson of the Compliance and Insurance Committee (since October 2015); formerly, Chairperson of the Insurance Sub-Committee of the Compliance and Insurance Committee (2007-2015); served as President and Chief Executive Officer of the Nuclear Energy Institute (policy organization) (February 2005-November 2008); retired as Admiral, U.S. Navy after serving over 38 years on active duty including 8 years as Director of the Naval Nuclear Propulsion Program in the Department of the Navy and the U.S. Department of Energy (1996-2004); served as Chief of Naval Personnel (July 1994-September 1996) and on the Joint Staff as Director of Political Military Affairs (June 1992-July 1994); knighted as Honorary Knight Commander of the Most Excellent Order of the British Empire; awarded the Officier de l'Orde National du Mérite by the French Government; elected to the National Academy of Engineering (2009). | | | 88 | | | Director of BP p.l.c.; Director of Naval and Nuclear Technologies LLP; Director Emeritus of the Armed Services YMCA; Director of the U.S. Naval Submarine League; Member of the National Security Advisory Council of the Center for U.S. Global Engagement and a member of the CNA Military Advisory Board; Trustee of Fairhaven United Methodist Church; and Director of other various non-profit organizations. | |
Kathleen A. Dennis (64)
c/o Perkins Coie LLP
Counsel to the Independent Directors
30 Rockefeller Plaza
New York, NY 10112 | | Director | | Since
August
2006 | | President, Cedarwood Associates (mutual fund and investment management consulting) (since July 2006); Chairperson of the Liquidity and Alternatives Sub-Committee of the Investment Committee (since October 2006) and Director or Trustee of various Morgan Stanley Funds (since August 2006); formerly, Senior Managing Director of Victory Capital Management (1993-2006). | | | 89 | | | Director of various non-profit organizations. | |
Nancy C. Everett (62)
c/o Perkins Coie LLP
Counsel to the Independent Directors
30 Rockefeller Plaza
New York, NY 10112 | | Director | | Since
January
2015 | | Chief Executive Officer, Virginia Commonwealth University Investment Company (since November 2015); Owner, OBIR, LLC (institutional investment management consulting) (since June 2014); formerly, Managing Director, BlackRock Inc. (February 2011-December 2013); and Chief Executive Officer, General Motors Asset Management (a/k/a Promark Global Advisors, Inc.) (June 2005-May 2010). | | | 90 | | | Formerly, Member of Virginia Commonwealth University School of Business Foundation (2005-2016); Member of Virginia Commonwealth University Board of Visitors (2013-2015); Member of Committee on Directors for Emerging Markets Growth Fund, Inc. (2007-2010); Chairperson of Performance Equity Management, LLC (2006-2010); and Chairperson, GMAM Absolute Return Strategies Fund, LLC (2006-2010). | |
31
Morgan Stanley Institutional Fund, Inc.
Annual Report — December 31, 2017
Director and Officer Information (unaudited) (cont'd)
Independent Directors: (cont'd)
Name, Age and Address of
Independent Director | | Position(s)
Held with
Registrant | | Length of Time
Served* | | Principal Occupation(s) During Past 5 Years
and Other Relevant Professional Experience | | Number of
Portfolios in
Fund Complex
Overseen by
Independent
Director** | | Other Directorships
Held by Independent
Director*** | |
Jakki L. Haussler (60)
c/o Perkins Coie LLP
Counsel to the Independent Directors
30 Rockefeller Plaza
New York, NY 10112 | | Director | | Since
January
2015 | | Chairman and Chief Executive Officer, Opus Capital Group (since January 1996); formerly, Director, Capvest Venture Fund, LP (May 2000-December 2011); Partner, Adena Ventures, LP (July 1999-December 2010); Director, The Victory Funds (February 2005-July 2008). | | | 90 | | | Director of Cincinnati Bell Inc. and Member, Audit Committee and Compensation Committee; Director of Northern Kentucky University Foundation and Member, Investment Committee; Member of Chase College of Law Transactional Law Practice Center Board of Advisors; Director of Best Transport; Director of Chase College of Law Board of Visitors; formerly, Member, University of Cincinnati Foundation Investment Committee; Member, Miami University Board of Visitors (2008-2011); Trustee of Victory Funds (2005-2008) and Chairman, Investment Committee (2007-2008) and Member, Service Provider Committee (2005-2008). | |
Dr. Manuel H. Johnson (68)
c/o Johnson Smick
International, Inc.
220 I Street, NE — Suite 200
Washington, D.C. 20002 | | Director | | Since
July
1991 | | Senior Partner, Johnson Smick International, Inc. (consulting firm); Chairperson of the Investment Committee (since October 2006) and Director or Trustee of various Morgan Stanley Funds (since July 1991); Co-Chairman and a founder of the Group of Seven Council (G7C) (international economic commission); formerly, Chairperson of the Audit Committee (July 1991-September 2006), Vice Chairman of the Board of Governors of the Federal Reserve System and Assistant Secretary of the U.S. Treasury. | | | 88 | | | Director of NVR, Inc. (home construction). | |
Joseph J. Kearns (75)
c/o Kearns & Associates LLC
46 E Peninsula Center #385
Rolling Hills Estates,
CA 90274-3712 | | Director | | Since
August
1994 | | Senior Adviser, Kearns & Associates LLC (investment consulting); Chairperson of the Audit Committee (since October 2006) and Director or Trustee of various Morgan Stanley Funds (since August 1994); formerly, Deputy Chairperson of the Audit Committee (July 2003-September 2006) and Chairperson of the Audit Committee of various Morgan Stanley Funds (since August 1994); CFO of the J. Paul Getty Trust. | | | 89 | | | Prior to August 10, 2016, Director of Electro Rent Corporation (equipment leasing); Prior to December 31, 2013, Director of The Ford Family Foundation. | |
32
Morgan Stanley Institutional Fund, Inc.
Annual Report — December 31, 2017
Director and Officer Information (unaudited) (cont'd)
Independent Directors: (cont'd)
Name, Age and Address of
Independent Director | | Position(s)
Held with
Registrant | | Length of Time
Served* | | Principal Occupation(s) During Past 5 Years
and Other Relevant Professional Experience | | Number of
Portfolios in
Fund Complex
Overseen by
Independent
Director** | | Other Directorships
Held by Independent
Director*** | |
Michael F. Klein (59)
c/o Perkins Coie LLP
Counsel to the Independent Directors
30 Rockefeller Plaza
New York, NY 10112 | | Director | | Since
August
2006 | | Managing Director, Aetos Capital, LLC (since March 2000); Co-President, Aetos Alternatives Management, LLC (since January 2004) and Co-Chief Executive Officer of Aetos Capital LLC (since August 2013); Chairperson of the Fixed Income Sub-Committee of the Investment Committee (since October 2006) and Director or Trustee of various Morgan Stanley Funds (since August 2006); formerly, Managing Director, Morgan Stanley & Co. Inc. and Morgan Stanley Dean Witter Investment Management, President, various Morgan Stanley Funds (June 1998-March 2000) and Principal, Morgan Stanley & Co. Inc. and Morgan Stanley Dean Witter Investment Management (August 1997-December 1999). | | | 88 | | | Director of certain investment funds managed or sponsored by Aetos Capital, LLC; Director of Sanitized AG and Sanitized Marketing AG (specialty chemicals). | |
Patricia Maleski (57)
c/o Perkins Coie LLP
Counsel to the Independent Directors
30 Rockefeller Plaza
New York, NY 10112 | | Director | | Since
January
2017 | | Managing Director, JPMorgan Asset Management (2004-2016); Oversight and Control Head of Fiduciary and Conflicts of Interest Program (2015-2016); Chief Control Officer-Global Asset Management (2013-2015); President, JPMorgan Funds (2010-2013); Chief Administrative Officer (2004-2013); various other positions including Treasurer and Board Liaison (since 2001). | | | 90 | | | None. | |
Michael E. Nugent (81)
522 Fifth Avenue
New York, NY 10036 | | Chair of the Board and Director | | Chair of the Boards since July 2006 and Director since July 1991 | | Chair of the Boards of various Morgan Stanley Funds (since July 2006); Chairperson of the Closed-End Fund Committee (since June 2012) and Director or Trustee of various Morgan Stanley Funds (since July 1991); formerly, Chairperson of the Insurance Committee (until July 2006); General Partner, Triumph Capital, L.P. (private investment partnership) (1988-2013). | | | 88 | | | None. | |
W. Allen Reed (70)
c/o Perkins Coie LLP
Counsel to the Independent Directors
30 Rockefeller Plaza
New York, NY 10112 | | Director | | Since
August
2006 | | Chairperson of the Equity Sub-Committee of the Investment Committee (since October 2006) and Director or Trustee of various Morgan Stanley Funds (since August 2006); formerly, President and CEO of General Motors Asset Management; Chairman and Chief Executive Officer of the GM Trust Bank and Corporate Vice President of General Motors Corporation (August 1994-December 2005). | | | 89 | | | Director of Legg Mason, Inc.; formerly, Director of the Auburn University Foundation (2010-2015). | |
Fergus Reid (85)
c/o Joe Pietryka, Inc.
85 Charles Colman Blvd.
Pawling, NY 12564 | | Director | | Since
June
1992 | | Chairman, Joe Pietryka, Inc.; Chairperson of the Governance Committee and Director or Trustee of various Morgan Stanley Funds (since June 1992). | | | 89 | | | Formerly, Trustee and Director of certain investment companies in the JP Morgan Fund Complex managed by JP Morgan Investment Management Inc. (1987-2012). | |
* This is the earliest date the Director began serving the Morgan Stanley Funds. Each Director serves an indefinite term, until his or her successor is elected.
** The Fund Complex includes (as of December 31, 2017) all open-end and closed-end funds (including all of their portfolios) advised by Morgan Stanley Investment Management Inc. (the "Adviser") and any funds that have an adviser that is an affiliated person of the Adviser (including, but not limited to, Morgan Stanley AIP GP LP).
*** This includes any directorships at public companies and registered investment companies held by the Director at any time during the past five years.
33
Morgan Stanley Institutional Fund, Inc.
Annual Report — December 31, 2017
Director and Officer Information (unaudited) (cont'd)
Executive Officers:
Name, Age and Address of Executive Officer | | Position(s) Held
with
Registrant | | Length of Time
Served* | | Principal Occupation(s) During Past 5 Years | |
John H. Gernon (54)
522 Fifth Avenue
New York, NY 10036 | | President and Principal Executive Officer | | Since
September
2013 | | President and Principal Executive Officer of the Equity and Fixed Income Funds and the Morgan Stanley AIP Funds (since September 2013) and the Liquidity Funds and various money market funds (since May 2014) in the Fund Complex; Managing Director of the Adviser; Head of Product (since 2006). | |
Timothy J. Knierim (58)
522 Fifth Avenue
New York, NY 10036 | | Chief Compliance Officer | | Since
December
2016 | | Managing Director of the Adviser and various entities affiliated with the Adviser; Chief Compliance Officer of various Morgan Stanley Funds and the Adviser (since December 2016) and Chief Compliance Officer of Morgan Stanley AIP GP LP (since 2014). Formerly, Managing Director and Deputy Chief Compliance Officer of the Adviser (2014-2016); and formerly, Chief Compliance Officer of Prudential Investment Management, Inc. (2007-2014). | |
Francis J. Smith (52)
522 Fifth Avenue
New York, NY 10036 | | Treasurer and Principal Financial Officer | | Treasurer since July 2003 and Principal Financial Officer since September 2002 | | Managing Director of the Adviser and various entities affiliated with the Adviser; Treasurer (since July 2003) and Principal Financial Officer of various Morgan Stanley Funds (since September 2002). | |
Mary E. Mullin (50)
522 Fifth Avenue
New York, NY 10036 | | Secretary | | Since
June
1999 | | Managing Director of the Adviser; Secretary of various Morgan Stanley Funds (since June 1999). | |
Michael J. Key (38)
522 Fifth Avenue
New York, NY 10036 | | Vice President | | Since
June
2017 | | Vice President of the Equity and Fixed Income Funds, Liquidity Funds, various money market funds and the Morgan Stanley AIP Funds in the Fund Complex (since June 2017); Executive Director of the Adviser; Head of Product Development for Equity and Fixed Income Funds (since August 2013). | |
* This is the earliest date the officer began serving the Morgan Stanley Funds. Each officer serves a one-year term, until his or her successor is elected and qualifies.
34
Morgan Stanley Institutional Fund, Inc.
Annual Report — December 31, 2017
Adviser and Administrator
Morgan Stanley Investment Management Inc.
522 Fifth Avenue
New York, New York 10036
Sub-Advisers
Morgan Stanley Investment Management Limited
25 Cabot Square, Canary Wharf
London, E14 4QA, England
Morgan Stanley Investment Management Company
23 Church Street
16-01 Capital Square, Singapore 049481
Distributor
Morgan Stanley Distribution, Inc.
522 Fifth Avenue
New York, New York 10036
Dividend Disbursing and Transfer Agent
DST Asset Manager Solutions, Inc.
2000 Crown Colony Drive
Quincy, Massachusetts 02169
Custodian
State Street Bank and Trust Company
One Lincoln Street
Boston, Massachusetts 02111
Legal Counsel
Dechert LLP
1095 Avenue of the Americas
New York, New York 10036
Counsel to the Independent Directors
Perkins Coie LLP
30 Rockefeller Plaza
New York, New York 10112
Independent Registered Public Accounting Firm
Ernst & Young LLP
200 Clarendon Street
Boston, Massachusetts 02116
Reporting to Shareholders
Each Morgan Stanley Fund provides a complete schedule of portfolio holdings in its semi-annual and annual reports within 60 days of the end of the fund's second and fourth fiscal quarters. The semi-annual and annual reports are filed electronically with the Securities and Exchange Commission (SEC) on Form N-CSRS and Form N-CSR, respectively. Morgan Stanley also delivers the semi-annual and annual reports to fund shareholders and makes these reports available on its public website, www.morganstanley.com/im. Each Morgan Stanley fund also files a complete schedule of portfolio holdings with the SEC for the fund's first and third fiscal quarters on Form N-Q. Morgan Stanley does not deliver the reports for the first and third fiscal quarters to shareholders, nor are the reports posted to the Morgan Stanley public website. You may, however, obtain the Form N-Q filings (as well as the Form N-CSR and N-CSRS filings) by accessing the SEC's website, www.sec.gov. You may also review and copy them at the SEC's Public Reference Room in Washington, DC. Information on the operation of the SEC's Public Reference Room may be obtained by calling the SEC toll free at 1 (800) SEC-0330. You can also request copies of these materials, upon payment of a duplicating fee, by electronic request at the SEC's email address (publicinfo@sec.gov) or by writing to the SEC's Public Reference Section, Washington, D.C. 20549-1520.
Proxy Voting Policies and Procedures and Proxy Voting Record
You may obtain a copy of the Company's Proxy Voting Policy and Procedures and information regarding how the Company voted proxies relating to portfolio securities during the most recent twelve-month period ended June 30, without charge, upon request, by calling toll free 1 (800) 548-7786 or by visiting our website at www.morganstanley.com/im. This information is also available on the SEC's website at www.sec.gov.
This report is authorized for distribution only when preceded or accompanied by a prospectus or summary prospectus of the applicable Fund of Morgan Stanley Institutional Fund, Inc., which describes in detail the Fund's investment policies, risks, fees and expenses. Please read the prospectus carefully before you invest or send money. For additional information, including information regarding the investments comprising the Fund, please visit our website at www.morganstanley.com/im or call toll free 1 (800) 548-7786.
35
Printed in U.S.A.
This Report has been prepared for shareholders and may be distributed to others only if preceded or accompanied by a current prospectus.
Morgan Stanley Investment Management Inc.
522 Fifth Avenue
New York, New York 10036
© 2018 Morgan Stanley. Morgan Stanley Distribution, Inc.

IFIIREANN
2009739 EXP. 02.28.19

Morgan Stanley Institutional Fund, Inc.
Multi-Asset Portfolio
Annual Report
December 31, 2017

Morgan Stanley Institutional Fund, Inc.
Annual Report — December 31, 2017
Shareholders' Letter | | | 2 | | |
Consolidated Expense Example | | | 3 | | |
Investment Overview | | | 4 | | |
Consolidated Portfolio of Investments | | | 8 | | |
Consolidated Statement of Assets and Liabilities | | | 26 | | |
Consolidated Statement of Operations | | | 28 | | |
Consolidated Statements of Changes in Net Assets | | | 29 | | |
Consolidated Financial Highlights | | | 31 | | |
Notes to Consolidated Financial Statements | | | 36 | | |
Report of Independent Registered Public Accounting Firm | | | 48 | | |
Privacy Notice | | | 49 | | |
Director and Officer Information | | | 52 | | |
This report is authorized for distribution only when preceded or accompanied by a prospectus or summary prospectus of the applicable Fund of Morgan Stanley Institutional Fund, Inc. To receive a prospectus and/or statement of additional information (SAI), which contains more complete information such as investment objectives, charges, expenses, policies for voting proxies, risk considerations, and describes in detail each of the Fund's investment policies to the prospective investor, please call toll free 1 (800) 548-7786. Please read the prospectuses carefully before you invest or send money.
Additionally, you can access information about the Fund, including performance, characteristics, and investment team commentary, through Morgan Stanley Investment Management's website: www.morganstanley.com/im.
Market forecasts provided in this report may not necessarily come to pass. There is no guarantee that any sectors mentioned will continue to perform as discussed herein or that securities in such sectors will be held by the Fund in the future. There is no assurance that a fund will achieve its investment objective. Funds are subject to market risk, which is the possibility that market values of securities owned by the Fund will decline and, therefore, the value of the Fund's shares may be less than what you paid for them. Accordingly, you can lose money investing in this Fund. Please see the prospectus for more complete information on investment risks.
1
Morgan Stanley Institutional Fund, Inc.
Annual Report — December 31, 2017
Shareholders' Letter (unaudited)
Dear Shareholders,
We are pleased to provide this Annual report, in which you will learn how your investment in Multi-Asset Portfolio (the "Fund") performed during the latest twelve-month period.
Morgan Stanley Investment Management is a client-centric, investor-led organization. Our global presence, intellectual capital, and breadth of products and services enable us to partner with investors to meet the evolving challenges of today's financial markets. We aim to deliver superior investment service and to empower our clients to make the informed decisions that help them reach their investment goals.
As always, we thank you for selecting Morgan Stanley Investment Management, and look forward to working with you in the months and years ahead.
Sincerely,

John H. Gernon
President and Principal Executive Officer
January 2018
2
Morgan Stanley Institutional Fund, Inc.
Annual Report — December 31, 2017
Consolidated Expense Example (unaudited)
Multi-Asset Portfolio
As a shareholder of the Fund, you incur two types of costs: (1) transactional costs; and (2) ongoing costs, which may include advisory fees, administration fees, distribution and shareholder services fees and other Fund expenses. This example is intended to help you understand your ongoing costs (in dollars) of investing in the Fund and to compare these costs with the ongoing costs of investing in other mutual funds.
This example is based on an investment of $1,000 invested at the beginning of the six-month period ended December 31, 2017 and held for the entire six-month period.
Actual Expenses
The table below provides information about actual account values and actual expenses. You may use the information in this table, together with the amount you invested, to estimate the expenses that you paid over the period. Simply divide your account value by $1,000 (for example, an $8,600 account value divided by $1,000 = 8.6), then multiply the result by the number in the table under the heading entitled "Actual Expenses Paid During Period" to estimate the expenses you paid on your account during this period.
Hypothetical Example for Comparison Purposes
The table below provides information about hypothetical account values and hypothetical expenses based on the Fund's actual expense ratio and an assumed rate of return of 5% per year before expenses, which is not the Fund's actual return. The hypothetical account values and expenses may not be used to estimate the actual ending account balance or expenses you paid for the period. You may use this information to compare the ongoing costs of investing in the Fund and other funds. To do so, compare this 5% hypothetical example with the 5% hypothetical examples that appear in the shareholder reports of the other funds.
Please note that the expenses shown in the table are meant to highlight your ongoing costs only and do not reflect any transactional costs, such as sales charges (loads). Therefore, the information for each class in the table is useful in comparing ongoing costs only, and will not help you determine the relative total costs of owning different funds. In addition, if these transactional costs were included, your costs would have been higher.
| | | Beginning
Account
Value
7/1/17 | | Actual Ending
Account
Value
12/31/17 | | Hypothetical
Ending Account
Value | | Actual
Expenses
Paid
During
Period* | | Hypothetical
Expenses Paid
During Period* | | Net
Expense
Ratio
During
Period** | |
Multi-Asset Portfolio Class I | | $ | 1,000.00 | | | $ | 976.70 | | | $ | 1,019.96 | | | $ | 5.18 | | | $ | 5.30 | | | | 1.04 | % | |
Multi-Asset Portfolio Class A | | | 1,000.00 | | | | 973.50 | | | | 1,018.20 | | | | 6.91 | | | | 7.07 | | | | 1.39 | | |
Multi-Asset Portfolio Class L | | | 1,000.00 | | | | 972.20 | | | | 1,015.83 | | | | 9.25 | | | | 9.45 | | | | 1.86 | | |
Multi-Asset Portfolio Class C | | | 1,000.00 | | | | 970.70 | | | | 1,014.47 | | | | 10.58 | | | | 10.82 | | | | 2.13 | | |
Multi-Asset Portfolio Class IS | | | 1,000.00 | | | | 976.70 | | | | 1,020.06 | | | | 5.08 | | | | 5.19 | | | | 1.02 | | |
* Expenses are calculated using each Fund Class' annualized net expense ratio (as disclosed), multiplied by the average account value over the period, and multiplied by 184/365 (to reflect the most recent one-half year period).
** Annualized.
3
Morgan Stanley Institutional Fund, Inc.
Annual Report — December 31, 2017
Investment Overview (unaudited)
Multi-Asset Portfolio
The Fund seeks total return. The Fund's "Adviser," Morgan Stanley Investment Management Inc., seeks to achieve this objective with an emphasis on positive absolute return and managing downside portfolio risk.
Performance
For the year ended December 31, 2017, the Fund's Class I shares had a total return based on net asset value and reinvestment of distributions per share of –0.72%, net of fees. The Fund's Class I shares underperformed the Fund's primary benchmark, the ICE BofAML U.S. Dollar 1-Month LIBID Average Index (the "Index"), which returned 0.98%, and underperformed the secondary benchmark, the Customized MSIM Global Allocation Index(i) (the "Customized Index"), which returned 16.45%. The Fund and benchmark index performance is in U.S. dollar ("USD") terms.
Factors Affecting Performance*
• During 2017, global equities (as measured by the MSCI All Country World Index) were up in all 12 months of the year and had the best year since 2009, finishing the year up +24.0% in USD (+19.8% in local currency terms). Growth beat expectations in every major region around the world while inflation remained subdued in developed markets, suggesting that accommodative central bank policy could continue. Furthermore, many of the major risks markets faced at the beginning of the year did not materialize: the eurozone managed to avert political risk, geopolitical risks were contained, and the U.S. passed a substantial tax cut (rather than the more growth-negative trade or immigration policies feared). Within Index sectors, tech was the clear leader (+37.3% local), followed by other cyclical sectors, materials (+19.9% local), consumer discretionary (+19.4% local), and industrials (+18.4% local).
• Emerging market equities outperformed developed markets (MSCI Emerging Markets Index +37.3% USD versus MSCI World Index +22.4% USD), boosted by the combination of booming global growth, benign local inflation, a weak U.S. dollar, and the exit from recession of two of its heavyweights, Brazil and Russia. U.S. equities (S&P 500 Index +21.8% USD) were supported by strong growth, muted inflation, sweeping tax cuts, and a slow-and-steady approach to rate hikes from
the Federal Reserve (Fed). Eurozone equities underperformed (EURO STOXX 50 +9.2% local), despite economic data that continued to beat expectations and the dissipation of far-right political risk following Macron's presidential victory in France, as the strong euro (which ended the year up 14%) weighed on the region's export prospects. Japanese equities rose 21.8% (TOPIX Index in USD), helped by improving growth, slowly improving inflation, and the Abe electoral victory, which suggested continued accommodative policy from the Bank of Japan (BOJ).
• Bonds were slightly up for the year, with the JP Morgan Global Government Bond Index gaining +1.3% in local currency terms (+6.8% in USD). U.S. rates trended lower in the first three quarters of the year, but began rising in early September, as the Fed began to signal a more hawkish tone, confirming it was on track for a gradual pace of rate hikes and balance sheet reduction beginning in October, despite sluggish inflation. The U.S. 10-year Treasury yield ended the year little changed (down 4 basis points [bps] to 2.41%), but the yield curve flattened: 2-year yields rose by 69 bps and 30-year yields fell 33 bps, as a consequence of better economic data and three Fed hikes amid subdued inflation expectations. Within fixed income, risk-on sentiment, synchronized global growth, and higher commodity prices helped emerging market local currency bonds outperform: the JP Morgan GBI-EM rose +15.4% (USD unhedged). In the U.S., high yield and investment grade bonds outperformed the broader index, rising 7.5% and 6.4%, respectively, compared to the U.S. aggregate, which was up 3.5% (Bloomberg Barclays indices in USD).
(i) Effective May 31, 2017, the Customized Index, the Fund's secondary benchmark, consists of 60% MSCI All Country World Index and 40% Bloomberg Barclays Global Aggregate Bond Index. Prior to May 31, 2017, the Customized Index consisted of 60% MSCI All Country World Index, 30% Bloomberg Barclays Global Aggregate Bond Index, 5% S&P GSCI Light Energy Index, and 5% ICE BofAML U.S. Dollar 1-Month LIBID Average Index.
* Certain of the Fund's investment themes may, in whole or part, be implemented through the use of derivatives, including the purchase and sale of futures, options, swaps, structured investments (including commodity-linked notes) and other related instruments and techniques. The Fund may also invest in foreign currency forward exchange contracts, which are also derivatives, in connection with its investments in foreign securities. The Fund may use derivative instruments for a variety of purposes, including hedging, risk management, portfolio management or to earn income. As a result, the use of derivatives had a material effect on the Fund's performance during the period.
4
Morgan Stanley Institutional Fund, Inc.
Annual Report — December 31, 2017
Investment Overview (unaudited) (cont'd)
Multi-Asset Portfolio
• Commodities rallied, particularly in the second half of the year, supported by synchronized global growth and a falling USD (DXY –9.9%). The S&P GSCI Total Return Index was up +5.8% in USD (and 17.8% in the second half of the year). Industrial metals led, up 29%, driven by a 30% rise in copper as China managed to avoid a slowdown. Brent crude bottomed in June at $45 and rose nearly 50% to over $65 per barrel, ending the year up 17.7%, at the highest level since 2015. Oil's gains were driven by strengthening demand, particularly from China and India, and a pause in the supply gains seen in the first half of the year. Specifically, the Organization of the Petroleum Exporting Countries (OPEC) and Russia output cuts were extended, Nigerian supply stopped increasing in the second half of the year as it approached production capacity, Libya under-produced relative to expectations, and Venezuelan output collapsed.
• Positions within equities detracted from performance. Contributors during the period included long positions in U.S. banks and U.S. consumer finance, both relative to U.S. equities. In addition, long positions in eurozone domestically focused equities relative to U.S. equities and eurozone banks relative to eurozone equities contributed to performance. However, these gains were completely offset by losses from short positions in global aerospace, China H-shares and global iron ore mining stocks, all relative to global equities.
• Positions within fixed income strongly contributed to performance. Directional long positions in Brazilian 5-year bonds and South African 10-year bonds, a short position in Czech 5-year bonds and a long position in Portuguese bonds relative to both German and Italian 10-year bonds, all contributed to performance. In addition, short positions in U.S. 10-year and 5-year Treasuries and a short position in German 10-year bunds relative to U.S. 10-year Treasuries contributed to performance. Detractors during the period included long positions in Australian 10-year bonds and Italian 10-year bonds, both relative to German 10-year bunds.
• Positions within commodities (implemented via commodity futures) had a negative impact on
performance, as short positions in copper and Brent crude oil detracted from performance.
• Currency positions (implemented via currency forwards and futures) positively impacted performance. Long positions in the Mexican peso and Turkish lira, both relative to the U.S. dollar contributed to performance. Other contributors included short positions in the Japanese yen relative to the U.S. dollar and the euro relative to the Czech koruna. These gains were partially offset by losses from long positions in Swedish krona and in British pound sterling, all relative to the euro.
Management Strategies(ii)
• As of December 31, 2017, the Fund's net equity exposure was 0.1%, net fixed income exposure was –15.6% (–9.3% in U.S. 10-year Treasury duration-equivalent exposure), and net commodities exposure was –4.4%.(iii)
• Going into 2018, we have shifted to a more defensive stance, as we believe global growth is peaking, due to tightening policy in China and the delayed effect of higher oil and real rates in the U.S., and that inflation is likely to surprise to the upside. We prefer defensive to cyclical assets, and are short China-sensitive assets globally. We prefer eurozone and Japanese equities to the U.S. Within fixed income, we hold targeted thematic positions in eurozone periphery and emerging market debt.
• If growth disappoints in 2018, we expect bond yields to roll over. Our fixed income long is modest at the moment, but we will look to position the portfolio further for a risk-off environment if current asset prices stretch further.
(ii) Source: Morgan Stanley Investment Management (MSIM) Global Multi-Asset Team analysis; market data sourced from Bloomberg; consensus estimates sourced from Thomson Reuters I/B/E/S.
(iii) The Fund seeks to achieve a consistent level of positive absolute returns while controlling downside portfolio risk. The Fund seeks to achieve this objective by taking long and short positions (often in the form of paired or hedged trades) in a range of equity and equity related securities of any market capitalization, bonds, currencies and commodities, which can result in negative net exposures. As the Fund's primary benchmark (ICE BofAML U.S. Dollar 1-month LIBID Average Index) represents cash, the Fund will maintain, from time to time, significant exposure to a risk-free asset class.
5
Morgan Stanley Institutional Fund, Inc.
Annual Report — December 31, 2017
Investment Overview (unaudited) (cont'd)
Multi-Asset Portfolio
• We believe that U.S. inflation is likely to surprise to the upside (core consumer price index at 1.9 to 2.0% by the fourth quarter of 2018, one year ahead of schedule), and that growth will disappoint in 2018 (at 2.4%, versus 2.6% expected by consensus). After a year where growth and inflation both surprised positively, markets are paying us to take this counter-consensus view. Sentiment has reached extreme risk-on positioning and valuations are expensive at 18.6x forward earnings per share, higher than any other time (except the dot-com bubble) in history. A faster normalization to positive real policy rates would likely cause a de-rating shock for U.S. equities.
• Data has been improving in the eurozone, with PMI (purchasing managers index) levels implying 3 to 3.5% growth, which is above the consensus expectation for 2.1% year-over-year in 2018. Core inflation also appears to have bottomed, and we expect it to continue trending slowly upward (to 1.3% in 2018 and 1.5% in 2019 from 1.0% on December 31, 2017). We expect European Monetary Union domestic stocks to outperform U.S. equities, as earnings growth remains strong on the back of accelerating gross domestic product growth. Despite the U.S. benefiting from the tax cut, we expect Europe's relative earnings growth to be roughly equal to the U.S. in 2018, before outperforming again in 2019.
• Japanese equities are cheap (trading at 13 to 25% below the historical discount to U.S. equities on price-to-book and forward price-to-earnings) and earnings are outperforming. Corporate health is improving, with return on equity at 9%, or the highest level post-crisis, and margins at 6%, or a 40-year high. We believe core inflation has likely troughed and will accelerate to nearly 1% in 2018, and that the economy will grow at around 1% in 2018. We also expect U.S. monetary policy to continue to pressure the yen versus the U.S. dollar, as the Fed proceeds in hiking rates while the BOJ continues to ease.
• We believe we are approaching an inflection point in Chinese growth, while at the same time, bullishness regarding growth and stability of its financial system are near decade highs. Although Chinese nominal growth recently rebounded to 12%, following stimulus in 2015-16 and a rebound in commodity prices, stimulus is beginning fade,
and policy has shifted to tightening mode. Credit and fixed investment growth have slowed, and property sales have begun to roll over. We expect nominal growth to decelerate to 8% in 2018 and 6% in 2019. On a real growth basis, we expect a slowdown from 6.8% in the second and third quarters of 2017 to 6.25% in 2018 and 5.7% in 2019, below consensus expectations of 6.5% and 6.2%, respectively. Thus, we believe the risk-reward has shifted back in favor of a bearish stance on China plays.
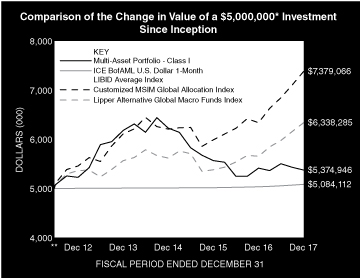
* Minimum Investment for Class I shares
** Commenced Operations on June 22, 2012.
In accordance with SEC regulations, the Fund's performance shown assumes that all recurring fees (including management fees) were deducted and all dividends and distributions were reinvested. The performance of Class A, L, C and IS shares will vary from the performance of Class I shares and will be impacted by additional fees assessed to those classes (if applicable).
6
Morgan Stanley Institutional Fund, Inc.
Annual Report — December 31, 2017
Investment Overview (unaudited) (cont'd)
Multi-Asset Portfolio
Performance Compared to the ICE BofAML U.S. Dollar 1-Month LIBID Average Index(1) the Customized MSIM Global Allocation Index(2) and the Lipper Alternative Global Macro Funds Index(3)
| | | Period Ended December 31, 2017
Total Returns(4) | |
| | | | | Averge Annual | |
| | | One
Year | | Five
Years | | Ten
Years | | Since
Inception(8) | |
Fund — Class I Shares
w/o sales charges(5) | | | –0.72 | % | | | 0.56 | % | | | — | | | | 1.32 | % | |
Fund — Class A Shares
w/o sales charges(5) | | | –1.24 | | | | 0.22 | | | | — | | | | 0.99 | | |
Fund — Class A Shares
with maximum 5.25%
sales charges(5) | | | –6.46 | | | | –0.86 | | | | — | | | | 0.01 | | |
Fund — Class L Shares
w/o sales charges(5) | | | –1.67 | | | | –0.26 | | | | — | | | | 0.50 | | |
Fund — Class C Shares
w/o sales charges(6) | | | –1.90 | | | | — | | | | — | | | | –5.53 | | |
Fund — Class C Shares
with maximum 1.00% deferred
sales charges(6) | | | –2.88 | | | | — | | | | — | | | | –5.53 | | |
Fund — Class IS Shares
w/o sales charges(7) | | | –0.82 | | | | — | | | | — | | | | –4.03 | | |
ICE BofAML U.S. Dollar 1-Month
LIBID Average Index | | | 0.98 | | | | 0.32 | | | | — | | | | 0.30 | | |
Customized MSIM Global
Allocation Index | | | 16.45 | | | | 6.22 | | | | — | | | | 7.30 | | |
Lipper Alternative Global Macro
Funds Index | | | 12.08 | | | | 3.39 | | | | — | | | | 4.39 | | |
Performance data quoted represents past performance, which is no guarantee of future results, and current performance may be lower or higher than the figures shown. Performance assumes that all dividends and distributions, if any, were reinvested. For the most recent month-end performance figures, please visit www.morganstanley.com/im. Investment return and principal value will fluctuate so that Fund shares, when redeemed, may be worth more or less than their original cost. Total returns do not reflect the deduction of taxes that a shareholder would pay on Fund distributions or the redemption of Fund shares. Performance of share classes will vary due to difference in sales charges and expenses.
(1) The ICE BofAML (Intercontinental Exchange Bank of America Merrill Lynch) U.S. Dollar 1-Month LIBID Average Index tracks the performance of a basket of synthetic assets paying LIBID to a stated maturity. The index purchases a new instrument each day, priced at par, having exactly its stated maturity and with a coupon equal to that day's fixing rate. All issues are held to maturity. Therefore, each day the index is comprised of a basket of securities. The index is not marked to market. The returns of the index represent the accrued income generated by the equally weighted average of all the coupons in the basket for a given day. The Index is unmanaged and its returns do not include any sales charges or fees. Such costs would lower performance. It is not possible to invest directly in an index.
(2) The Customized MSIM Global Allocation Index is a performance linked benchmark comprised of 60% MSCI All Country World Index and 40% Bloomberg Barclays Global Aggregate Index for periods after May 31, 2017. Prior to May 31, 2017,
the Customized MSIM Global Allocation Index consisted of 60% MSCI All Country World Index (benchmark that measures the equity market performance of developed and emerging markets), 30% Bloomberg Barclays Global Aggregate Index (benchmark that provides a broadbased measure of the global investment grade fixed-rate debt markets), 5% S&P GSCI Light Energy Index (benchmark for investment performance in the energy commodity market) and 5% ICE BofAML U.S. Dollar 1-Month LIBID Average Index (benchmark that tracks the performance of a basket of synthetic assets paying LIBID to a stated maturity). The Index is unmanaged and its returns do not include any sales charges or fees. Such costs would lower performance. It is not possible to invest directly in an index.
(3) The Lipper Alternative Global Macro Funds Index is an equally weighted performance index of the largest qualifying funds (based on net assets) in the Lipper Alternative Global Macro Funds classification. The Index, which is adjusted for capital gains distributions and income dividends, is unmanaged and should not be considered an investment. There are currently 30 funds represented in this Index. As of the date of this report, the Fund is in the Lipper Alternative Global Macro Funds classification.
(4) Total returns for the Fund reflect fees waived and expenses reimbursed, if applicable, by the Adviser. Without such waivers and reimbursements, total returns would have been lower.
(5) Commenced operations on June 22, 2012.
(6) Commenced offering on April 30, 2015.
(7) Commenced offering on May 29, 2015.
(8) For comparative purposes, average annual since inception returns listed for the Indexes refer to the inception date of Class I of the Fund, not the inception of the Index.
7
Morgan Stanley Institutional Fund, Inc.
Annual Report — December 31, 2017
Consolidated Portfolio of Investments
Multi-Asset Portfolio
| | | Shares | | Value
(000) | |
Common Stocks (29.4%) | |
Australia (0.0%) | |
Goodman Group REIT | | | 33 | | | $ | — | @ | |
Stockland REIT | | | 70 | | | | — | @ | |
| | | | — | @ | |
Austria (0.1%) | |
Erste Group Bank AG (a) | | | 1,631 | | | | 70 | | |
Raiffeisen Bank International AG (a) | | | 682 | | | | 25 | | |
| | | | 95 | | |
Belgium (0.2%) | |
KBC Group N.V. | | | 1,463 | | | | 125 | | |
Denmark (0.7%) | |
DSV A/S | | | 4,160 | | | | 327 | | |
ISS A/S | | | 4,198 | | | | 162 | | |
| | | | 489 | | |
France (8.7%) | |
Accor SA | | | 11,382 | | | | 587 | | |
Aeroports de Paris (ADP) | | | 463 | | | | 88 | | |
Atos SE | | | 3,300 | | | | 480 | | |
BNP Paribas SA | | | 6,183 | | | | 461 | | |
Bouygues SA | | | 8,928 | | | | 464 | | |
Capgemini SE | | | 6,072 | | | | 719 | | |
Cie de Saint-Gobain | | | 8,468 | | | | 466 | | |
Credit Agricole SA | | | 6,169 | | | | 102 | | |
Getlink SE | | | 10,391 | | | | 134 | | |
Natixis SA | | | 5,479 | | | | 43 | | |
Peugeot SA | | | 42,426 | | | | 862 | | |
Rexel SA | | | 9,830 | | | | 178 | | |
Societe Generale SA | | | 4,467 | | | | 230 | | |
Vinci SA | | | 14,309 | | | | 1,460 | | |
| | | | 6,274 | | |
Germany (1.2%) | |
Commerzbank AG (a) | | | 6,226 | | | | 93 | | |
Deutsche Boerse AG | | | 5,177 | | | | 600 | | |
Fraport AG Frankfurt Airport Services Worldwide | | | 1,346 | | | | 148 | | |
| | | | 841 | | |
Hong Kong (0.0%) | |
Hanergy Thin Film Power Group Ltd. (a)(b)(c) | | | 178,000 | | | | 1 | | |
Ireland (0.3%) | |
Bank of Ireland Group PLC (a) | | | 5,440 | | | | 47 | | |
CRH PLC | | | 4,794 | | | | 172 | | |
| | | | 219 | | |
Italy (2.5%) | |
Atlantia SpA | | | 19,031 | | | | 600 | | |
Intesa Sanpaolo SpA | | | 79,363 | | | | 262 | | |
Mediobanca SpA | | | 64,768 | | | | 734 | | |
UniCredit SpA (a) | | | 11,154 | | | | 208 | | |
Unione di Banche Italiane SpA | | | 5,147 | | | | 22 | | |
| | | | 1,826 | | |
| | | Shares | | Value
(000) | |
Netherlands (1.3%) | |
ABN AMRO Group N.V. CVA (d) | | | 1,372 | | | $ | 44 | | |
ING Groep N.V. | | | 22,571 | | | | 415 | | |
Randstad Holding N.V. | | | 7,980 | | | | 490 | | |
| | | | 949 | | |
Russia (0.9%) | |
Gazprom PJSC ADR | | | 22,690 | | | | 100 | | |
LUKOIL PJSC ADR | | | 1,792 | | | | 103 | | |
Magnit PJSC GDR | | | 1,292 | | | | 35 | | |
MMC Norilsk Nickel PJSC ADR | | | 2,640 | | | | 49 | | |
Mobile TeleSystems PJSC ADR | | | 2,000 | | | | 20 | | |
Novatek PJSC (Registered GDR) | | | 374 | | | | 45 | | |
PhosAgro PJSC GDR | | | 494 | | | | 8 | | |
Rosneft Oil Co., PJSC (Registered GDR) | | | 4,870 | | | | 24 | | |
Rostelecom PJSC ADR | | | 70 | | | | — | @ | |
RusHydro PJSC ADR | | | 2,887 | | | | 4 | | |
Sberbank of Russia PJSC ADR | | | 10,590 | | | | 179 | | |
Severstal PJSC GDR | | | 700 | | | | 11 | | |
Sistema PJSC FC GDR | | | 731 | | | | 3 | | |
Surgutneftegas OJSC ADR | | | 3,239 | | | | 15 | | |
Tatneft PJSC ADR | | | 686 | | | | 34 | | |
VTB Bank PJSC (Registered GDR) | | | 6,943 | | | | 13 | | |
X5 Retail Group N.V. GDR (a) | | | 419 | | | | 16 | | |
| | | | 659 | | |
South Africa (1.1%) | |
Barclays Africa Group Ltd. | | | 9,085 | | | | 134 | | |
Capitec Bank Holdings Ltd. | | | 1,216 | | | | 108 | | |
FirstRand Ltd. | | | 37,483 | | | | 204 | | |
Nedbank Group Ltd. | | | 5,285 | | | | 109 | | |
Standard Bank Group Ltd. | | | 17,067 | | | | 269 | | |
| | | | 824 | | |
Spain (1.5%) | |
Banco Bilbao Vizcaya Argentaria SA | | | 42,081 | | | | 358 | | |
Banco de Sabadell SA | | | 30,988 | | | | 62 | | |
Banco Santander SA | | | 84,143 | | | | 552 | | |
Bankia SA | | | 6,711 | | | | 32 | | |
Bankinter SA | | | 3,932 | | | | 37 | | |
CaixaBank SA | | | 15,523 | | | | 72 | | |
| | | | 1,113 | | |
Switzerland (1.1%) | |
Adecco Group AG (Registered) | | | 10,007 | | | | 765 | | |
United States (9.8%) | |
Capital One Financial Corp. | | | 23,158 | | | | 2,306 | | |
Discover Financial Services | | | 30,719 | | | | 2,363 | | |
Synchrony Financial | | | 62,824 | | | | 2,426 | | |
| | | | 7,095 | | |
Total Common Stocks (Cost $16,886) | | | 21,275 | | |
Investment Company (0.6%) | |
United States (0.6%) | |
VelocityShares Daily Inverse VIX
Short Term ETN (Cost $460) | | | 3,362 | | | | 452 | | |
The accompanying notes are an integral part of the consolidated financial statements.
8
Morgan Stanley Institutional Fund, Inc.
Annual Report — December 31, 2017
Consolidated Portfolio of Investments (cont'd)
Multi-Asset Portfolio
| | | Face
Amount
(000) | | Value
(000) | |
Fixed Income Securities (18.2%) | |
Sovereign (17.5%) | |
Australia (0.1%) | |
Australia Government Bond,
3.00%, 3/21/47 | | AUD | 48 | | | $ | 35 | | |
Brazil (12.1%) | |
Brazil Notas do Tesouro Nacional, Series F,
10.00%, 1/1/21 | | BRL | 29,434 | | | | 8,735 | | |
Canada (0.0%) | |
Canadian Government Bond,
2.75%, 12/1/48 | | CAD | 39 | | | | 34 | | |
France (0.1%) | |
French Republic Government Bond OAT,
2.00%, 5/25/48 (d) | | EUR | 47 | | | | 60 | | |
Germany (0.1%) | |
Bundesrepublik Deutschland Bundesanleihe,
1.25%, 8/15/48 | | | 72 | | | | 86 | | |
Japan (0.2%) | |
Japan Government Thirty Year Bond,
0.80%, 9/20/47 | | JPY | 13,300 | | | | 118 | | |
Portugal (4.8%) | |
Portugal Obrigacoes do Tesouro OT,
2.88%, 7/21/26 (d) | | EUR | 1,334 | | | | 1,747 | | |
4.13%, 4/14/27 (d) | | | 1,230 | | | | 1,754 | | |
| | | | 3,501 | | |
United Kingdom (0.1%) | |
United Kingdom Gilt,
1.50%, 7/22/47 | | GBP | 48 | | | | 61 | | |
Total Sovereign (Cost $12,579) | | | 12,630 | | |
U.S. Treasury Security (0.7%) | |
United States (0.7%) | |
U.S. Treasury Bond,
2.75%, 11/15/47 (Cost $460) | | | 460 | | | | 461 | | |
Total Fixed Income Securities (Cost $13,039) | | | 13,091 | | |
| | | Shares | | | |
Short-Term Investments (50.3%) | |
Investment Company (40.1%) | |
Morgan Stanley Institutional Liquidity
Funds — Government Portfolio —
Institutional Class (See Note G)
(Cost $28,990) | | | 28,989,969 | | | | 28,990 | | |
| | | Face
Amount
(000) | | | |
U.S. Treasury Securities (10.2%) | |
U.S. Treasury Bills,
1.16%, 4/26/18 (e)(f) | | $ | 285 | | | | 284 | | |
1.19%, 4/26/18 (e)(f) | | | 7,120 | | | | 7,089 | | |
1.30%, 4/26/18 (e)(f) | | | 28 | | | | 28 | | |
Total U.S. Treasury Securities (Cost $7,405) | | | 7,401 | | |
Total Short-Term Investments (Cost $36,395) | | | 36,391 | | |
Total Investments (98.5%) (Cost $66,780) (g)(h)(i) | | | 71,209 | | |
Other Assets in Excess of Liabilities (1.5%) | | | 1,115 | | |
Net Assets (100.0%) | | $ | 72,324 | | |
Country assignments and aggregations are based generally on third party vendor classifications and information, and may be different from the assignments and aggregations under the policies set forth in the Fund's prospectus and/or statement of additional information relating to geographic classifications.
(a) Non-income producing security.
(b) At December 31, 2017, the Fund held a fair valued security valued at approximately $1,000, representing less than 0.05% of net assets. This security has been fair valued as determined in good faith under procedures established by and under the general supervision of the Company's Directors.
(c) Security has been deemed illiquid at December 31, 2017.
(d) 144A security — Certain conditions for public sale may exist. Unless otherwise noted, these securities are deemed to be liquid.
(e) Rate shown is the yield to maturity at December 31, 2017.
(f) All or a portion of the security was pledged to cover margin requirements for swap agreements.
(g) Securities are available for collateral in connection with open foreign currency forward exchange contracts, futures contracts and swap agreements.
(h) The approximate fair value and percentage of net assets, $14,159,000 and 19.6%, respectively, represent the securities that have been fair valued under the fair valuation policy for international investments as described in Note A-1 within the Notes to the Financial Statements.
(i) At December 31, 2017, the aggregate cost for federal income tax purposes is approximately $67,338,000. The aggregate gross unrealized appreciation is approximately $7,947,000 and the aggregate gross unrealized depreciation is approximately $3,739,000, resulting in net unrealized appreciation of approximately $4,208,000.
@ Value is less than $500.
ADR American Depositary Receipt.
CVA Certificaten Van Aandelen.
ETN Exchange Traded Note.
GDR Global Depositary Receipt.
OAT Obligations Assimilables du Trésor (French Treasury Obligation).
OJSC Open Joint Stock Company.
PJSC Public Joint Stock Company.
REIT Real Estate Investment Trust.
The accompanying notes are an integral part of the consolidated financial statements.
9
Morgan Stanley Institutional Fund, Inc.
Annual Report — December 31, 2017
Consolidated Portfolio of Investments (cont'd)
Multi-Asset Portfolio
Foreign Currency Forward Exchange Contracts:
The Fund had the following foreign currency forward exchange contracts open at December 31, 2017:
Counterparty | | Contracts to
Deliver
(000) | | In Exchange
For
(000) | | Delivery
Date | | Unrealized
Appreciation
(Depreciation)
(000) | |
Barclays Bank PLC | | EUR | 272 | | | $ | 323 | | | 2/1/18 | | $ | (4 | ) | |
Citibank NA | | CZK | 13,821 | | | $ | 559 | | | 2/1/18 | | | (91 | ) | |
Citibank NA | | CZK | 5,073 | | | $ | 205 | | | 2/1/18 | | | (34 | ) | |
Citibank NA | | CZK | 3,472 | | | $ | 141 | | | 2/1/18 | | | (22 | ) | |
Citibank NA | | CZK | 3,994 | | | $ | 166 | | | 2/1/18 | | | (22 | ) | |
Citibank NA | | CZK | 36,957 | | | $ | 1,527 | | | 2/1/18 | | | (211 | ) | |
Citibank NA | | CZK | 8,057 | | | $ | 335 | | | 2/1/18 | | | (44 | ) | |
Citibank NA | | CZK | 8,467 | | | $ | 376 | | | 2/1/18 | | | (23 | ) | |
Citibank NA | | CZK | 16,372 | | | $ | 752 | | | 2/1/18 | | | (18 | ) | |
Citibank NA | | CZK | 13,545 | | | $ | 625 | | | 2/1/18 | | | (13 | ) | |
Citibank NA | | CZK | 2,021 | | | $ | 92 | | | 2/1/18 | | | (3 | ) | |
Citibank NA | | CZK | 11,028 | | | $ | 517 | | | 2/1/18 | | | (2 | ) | |
Citibank NA | | CZK | 9,035 | | | $ | 425 | | | 2/1/18 | | | (— | @) | |
Citibank NA | | CZK | 58,994 | | | $ | 2,533 | | | 2/1/18 | | | (241 | ) | |
Citibank NA | | CZK | 33,101 | | | $ | 1,422 | | | 2/1/18 | | | (135 | ) | |
Citibank NA | | CZK | 3,852 | | | $ | 167 | | | 2/1/18 | | | (14 | ) | |
Citibank NA | | EUR | 3,379 | | | $ | 3,683 | | | 2/1/18 | | | (378 | ) | |
Citibank NA | | EUR | 3,863 | | | $ | 4,203 | | | 2/1/18 | | | (440 | ) | |
Citibank NA | | EUR | 3,857 | | | $ | 4,204 | | | 2/1/18 | | | (431 | ) | |
Citibank NA | | EUR | 1,286 | | | $ | 1,401 | | | 2/1/18 | | | (144 | ) | |
Citibank NA | | EUR | 1,316 | | | $ | 1,429 | | | 2/1/18 | | | (152 | ) | |
Citibank NA | | EUR | 533 | | | $ | 593 | | | 2/1/18 | | | (48 | ) | |
Citibank NA | | EUR | 415 | | | $ | 466 | | | 2/1/18 | | | (32 | ) | |
Citibank NA | | EUR | 3,127 | | | $ | 3,704 | | | 2/1/18 | | | (54 | ) | |
Citibank NA | | EUR | 131 | | | $ | 156 | | | 2/1/18 | | | (2 | ) | |
Citibank NA | | EUR | 20 | | | $ | 23 | | | 2/1/18 | | | (1 | ) | |
Citibank NA | | EUR | 412 | | | $ | 469 | | | 2/1/18 | | | (26 | ) | |
Citibank NA | | $ | 3,727 | | | CZK | 91,295 | | | 2/1/18 | | | 567 | | |
Citibank NA | | $ | 4,252 | | | CZK | 104,373 | | | 2/1/18 | | | 657 | | |
Citibank NA | | $ | 4,131 | | | CZK | 101,598 | | | 2/1/18 | | | 648 | | |
Citibank NA | | $ | 1,378 | | | CZK | 33,866 | | | 2/1/18 | | | 215 | | |
Citibank NA | | $ | 1,404 | | | CZK | 34,662 | | | 2/1/18 | | | 227 | | |
Citibank NA | | $ | 607 | | | CZK | 14,359 | | | 2/1/18 | | | 68 | | |
Citibank NA | | $ | 465 | | | CZK | 10,946 | | | 2/1/18 | | | 50 | | |
Citibank NA | | $ | 476 | | | CZK | 11,033 | | | 2/1/18 | | | 43 | | |
Citibank NA | | $ | 326 | | | CZK | 7,109 | | | 2/1/18 | | | 9 | | |
Citibank NA | | $ | 3,724 | | | CZK | 81,649 | | | 2/1/18 | | | 117 | | |
Citibank NA | | $ | 164 | | | CZK | 3,579 | | | 2/1/18 | | | 5 | | |
Citibank NA | | $ | 559 | | | EUR | 517 | | | 2/1/18 | | | 63 | | |
Citibank NA | | $ | 128 | | | EUR | 119 | | | 2/1/18 | | | 14 | | |
Citibank NA | | $ | 160 | | | EUR | 147 | | | 2/1/18 | | | 17 | | |
Citibank NA | | $ | 227 | | | EUR | 205 | | | 2/1/18 | | | 20 | | |
Citibank NA | | $ | 1,583 | | | EUR | 1,430 | | | 2/1/18 | | | 136 | | |
Citibank NA | | $ | 2,498 | | | EUR | 2,202 | | | 2/1/18 | | | 148 | | |
Citibank NA | | $ | 1,291 | | | EUR | 1,138 | | | 2/1/18 | | | 77 | | |
Citibank NA | | $ | 815 | | | EUR | 682 | | | 2/1/18 | | | 4 | | |
Citibank NA | | $ | 484 | | | EUR | 403 | | | 2/1/18 | | | 1 | | |
Citibank NA | | $ | 396 | | | EUR | 331 | | | 2/1/18 | | | 2 | | |
Citibank NA | | $ | 505 | | | EUR | 419 | | | 2/1/18 | | | (1 | ) | |
Citibank NA | | $ | 84 | | | EUR | 74 | | | 2/1/18 | | | 5 | | |
Citibank NA | | $ | 274 | | | EUR | 242 | | | 2/1/18 | | | 16 | | |
Citibank NA | | $ | 318 | | | EUR | 275 | | | 2/1/18 | | | 13 | | |
Bank of America NA | | CHF | 112 | | | $ | 115 | | | 3/22/18 | | | (1 | ) | |
Bank of America NA | | ILS | 767 | | | $ | 220 | | | 3/22/18 | | | (1 | ) | |
Bank of America NA | | PLN | 843 | | | $ | 237 | | | 3/22/18 | | | (5 | ) | |
Bank of America NA | | $ | 10 | | | ILS | 35 | | | 3/22/18 | | | (— | @) | |
Bank of Montreal | | HUF | 57,843 | | | $ | 219 | | | 3/22/18 | | | (5 | ) | |
Bank of Montreal | | $ | 80 | | | GBP | 60 | | | 3/22/18 | | | 1 | | |
Bank of Montreal | | $ | 17 | | | HUF | 4,500 | | | 3/22/18 | | | — | @ | |
Bank of New York Mellon | | $ | 7 | | | GBP | 5 | | | 3/22/18 | | | — | @ | |
The accompanying notes are an integral part of the consolidated financial statements.
10
Morgan Stanley Institutional Fund, Inc.
Annual Report — December 31, 2017
Consolidated Portfolio of Investments (cont'd)
Multi-Asset Portfolio
Foreign Currency Forward Exchange Contracts (cont'd):
Counterparty | | Contracts to
Deliver
(000) | | In Exchange
For
(000) | | Delivery
Date | | Unrealized
Appreciation
(Depreciation)
(000) | |
Bank of New York Mellon | | $ | 18 | | | SEK | 154 | | | 3/22/18 | | $ | — | @ | |
Barclays Bank PLC | | AUD | 2,508 | | | $ | 1,918 | | | 3/22/18 | | | (39 | ) | |
Barclays Bank PLC | | EUR | 6,079 | | | $ | 7,226 | | | 3/22/18 | | | (101 | ) | |
Barclays Bank PLC | | SGD | 294 | | | $ | 218 | | | 3/22/18 | | | (2 | ) | |
Barclays Bank PLC | | $ | 5,693 | | | GBP | 4,247 | | | 3/22/18 | | | 56 | | |
BNP Paribas SA | | CAD | 4,709 | | | $ | 3,657 | | | 3/22/18 | | | (93 | ) | |
BNP Paribas SA | | CHF | 88 | | | $ | 90 | | | 3/22/18 | | | (1 | ) | |
BNP Paribas SA | | RUB | 8,980 | | | $ | 154 | | | 3/22/18 | | | — | @ | |
BNP Paribas SA | | $ | 201 | | | CAD | 251 | | | 3/22/18 | | | (1 | ) | |
BNP Paribas SA | | $ | 1,683 | | | EUR | 1,416 | | | 3/22/18 | | | 24 | | |
BNP Paribas SA | | $ | 20 | | | EUR | 17 | | | 3/22/18 | | | (— | @) | |
BNP Paribas SA | | $ | 3,403 | | | RUB | 202,979 | | | 3/22/18 | | | 84 | | |
Citibank NA | | CHF | 204 | | | $ | 208 | | | 3/22/18 | | | (2 | ) | |
Citibank NA | | CLP | 149,119 | | | $ | 234 | | | 3/22/18 | | | (8 | ) | |
Citibank NA | | CZK | 9,780 | | | $ | 455 | | | 3/22/18 | | | (6 | ) | |
Citibank NA | | KRW | 234,347 | | | $ | 215 | | | 3/22/18 | | | (4 | ) | |
Citibank NA | | THB | 7,023 | | | $ | 215 | | | 3/22/18 | | | (1 | ) | |
Citibank NA | | TRY | 850 | | | $ | 216 | | | 3/22/18 | | | (4 | ) | |
Citibank NA | | $ | 39 | | | CZK | 818 | | | 3/22/18 | | | — | @ | |
Citibank NA | | $ | 355 | | | EUR | 294 | | | 3/22/18 | | | (— | @) | |
Citibank NA | | $ | 12 | | | KRW | 12,836 | | | 3/22/18 | | | (— | @) | |
Citibank NA | | $ | 216 | | | SEK | 1,810 | | | 3/22/18 | | | 6 | | |
Commonwealth Bank of Australia | | AUD | 280 | | | $ | 214 | | | 3/22/18 | | | (4 | ) | |
Commonwealth Bank of Australia | | EUR | 3,322 | | | $ | 3,949 | | | 3/22/18 | | | (55 | ) | |
Commonwealth Bank of Australia | | $ | 1,108 | | | GBP | 827 | | | 3/22/18 | | | 11 | | |
Credit Suisse International | | EUR | 521 | | | $ | 620 | | | 3/22/18 | | | (9 | ) | |
Credit Suisse International | | $ | 9 | | | GBP | 7 | | | 3/22/18 | | | — | @ | |
Goldman Sachs International | | AUD | 3,859 | | | $ | 2,951 | | | 3/22/18 | | | (60 | ) | |
Goldman Sachs International | | BRL | 32,818 | | | $ | 9,731 | | | 3/22/18 | | | (78 | ) | |
Goldman Sachs International | | CNH | 1,521 | | | $ | 229 | | | 3/22/18 | | | (3 | ) | |
Goldman Sachs International | | DKK | 1,189 | | | $ | 190 | | | 3/22/18 | | | (3 | ) | |
Goldman Sachs International | | HKD | 87 | | | $ | 11 | | | 3/22/18 | | | (— | @) | |
Goldman Sachs International | | IDR | 2,986,701 | | | $ | 218 | | | 3/22/18 | | | (— | @) | |
Goldman Sachs International | | INR | 13,406 | | | $ | 207 | | | 3/22/18 | | | (1 | ) | |
Goldman Sachs International | | JPY | 151,546 | | | $ | 1,349 | | | 3/22/18 | | | (2 | ) | |
Goldman Sachs International | | $ | 320 | | | BRL | 1,072 | | | 3/22/18 | | | — | @ | |
Goldman Sachs International | | $ | 204 | | | CHF | 200 | | | 3/22/18 | | | 2 | | |
Goldman Sachs International | | $ | 20 | | | CNH | 134 | | | 3/22/18 | | | (— | @) | |
Goldman Sachs International | | $ | 2,529 | | | EUR | 2,127 | | | 3/22/18 | | | 35 | | |
Goldman Sachs International | | $ | 14 | | | IDR | 184,342 | | | 3/22/18 | | | (— | @) | |
Goldman Sachs International | | $ | 780 | | | JPY | 87,999 | | | 3/22/18 | | | 4 | | |
Goldman Sachs International | | $ | 12 | | | JPY | 1,361 | | | 3/22/18 | | | — | @ | |
Goldman Sachs International | | ZAR | 2,821 | | | $ | 218 | | | 3/22/18 | | | (8 | ) | |
Goldman Sachs International | | ZAR | 4,169 | | | $ | 332 | | | 3/22/18 | | | (1 | ) | |
JPMorgan Chase Bank NA | | JPY | 350,516 | | | $ | 3,119 | | | 3/22/18 | | | (4 | ) | |
JPMorgan Chase Bank NA | | TWD | 6,069 | | | $ | 204 | | | 3/22/18 | | | (1 | ) | |
JPMorgan Chase Bank NA | | $ | 4,873 | | | EUR | 4,098 | | | 3/22/18 | | | 67 | | |
JPMorgan Chase Bank NA | | $ | 125 | | | JPY | 14,044 | | | 3/22/18 | | | — | @ | |
JPMorgan Chase Bank NA | | $ | 3,101 | | | MXN | 60,527 | | | 3/22/18 | | | (66 | ) | |
JPMorgan Chase Bank NA | | $ | 282 | | | MXN | 5,620 | | | 3/22/18 | | | (— | @) | |
State Street Bank and Trust Co. | | AUD | 1,857 | | | $ | 1,420 | | | 3/22/18 | | | (29 | ) | |
State Street Bank and Trust Co. | | EUR | 487 | | | $ | 580 | | | 3/22/18 | | | (8 | ) | |
State Street Bank and Trust Co. | | GBP | 200 | | | $ | 271 | | | 3/22/18 | | | — | @ | |
State Street Bank and Trust Co. | | $ | 226 | | | GBP | 169 | | | 3/22/18 | | | 2 | | |
UBS AG | | AUD | 4,610 | | | $ | 3,525 | | | 3/22/18 | | | (71 | ) | |
UBS AG | | CHF | 359 | | | $ | 366 | | | 3/22/18 | | | (4 | ) | |
UBS AG | | DKK | 1,178 | | | $ | 188 | | | 3/22/18 | | | (3 | ) | |
UBS AG | | EUR | 211 | | | $ | 251 | | | 3/22/18 | | | (4 | ) | |
UBS AG | | SEK | 1,987 | | | $ | 237 | | | 3/22/18 | | | (6 | ) | |
UBS AG | | $ | 602 | | | AUD | 771 | | | 3/22/18 | | | (1 | ) | |
| | | | | | | | | $ | 133 | | |
The accompanying notes are an integral part of the consolidated financial statements.
11
Morgan Stanley Institutional Fund, Inc.
Annual Report — December 31, 2017
Consolidated Portfolio of Investments (cont'd)
Multi-Asset Portfolio
Futures Contracts:
The Fund had the following futures contracts open at December 31, 2017:
| | | Number
of
Contracts | | Expiration
Date | | Notional Amount
(000) | | Value
(000) | | Unrealized
Appreciation
(Depreciation)
(000) | |
Long: | |
MSCI Emerging Market E Mini (United States) | | | 12 | | | Mar-18 | | $ | 1 | | | $ | 698 | | | $ | 33 | | |
NIKKEI 225 Index (Japan) | | | 17 | | | Mar-18 | | | 9 | | | | 1,712 | | | | 9 | | |
TOPIX Index (Japan) | | | 25 | | | Mar-18 | | | 250 | | | | 4,032 | | | | 56 | | |
U.S. Treasury Ultra Bond (United States) | | | 14 | | | Mar-18 | | | 1,400 | | | | 2,347 | | | | 3 | | |
U.S. Treasury 10 yr. Ultra Long Bond (United States) | | | 94 | | | Mar-18 | | | 9,400 | | | | 12,555 | | | | 57 | | |
Short: | |
Copper Future (United States) | | | 53 | | | Mar-18 | | | (1,325 | ) | | | (4,373 | ) | | | (301 | ) | |
Euro FX Currency (United States) | | | 79 | | | Mar-18 | | | (9,875 | ) | | | (11,924 | ) | | | (244 | ) | |
Euro Stoxx 50 (Germany) | | | 12 | | | Mar-18 | | | (— | @) | | | (503 | ) | | | 15 | | |
German Euro Bund (Germany) | | | 16 | | | Mar-18 | | | (1,600 | ) | | | (3,104 | ) | | | 26 | | |
Hang Seng China Enterprises Index (Hong Kong) | | | 31 | | | Jan-18 | | | (2 | ) | | | (2,327 | ) | | | (3 | ) | |
S&P 500 E MINI Index (United States) | | | 137 | | | Mar-18 | | | (7 | ) | | | (18,331 | ) | | | (84 | ) | |
UK Long Gilt Bond (United Kingdom) | | | 11 | | | Mar-18 | | | (1,100 | ) | | | (1,859 | ) | | | (12 | ) | |
| | | | | | | | | | | $ | (445 | ) | |
Interest Rate Swap Agreements:
The Fund had the following interest rate swap agreements open at December 31, 2017:
Swap Counterparty | | Floating
Rate
Index | | Pay/Receive
Floating Rate | | Fixed
Rate | | Payment
Frequency
Paid/
Received | | Maturity
Date | | Notional
Amount
(000) | | Value
(000) | | Upfront
Payment
Paid
(000) | | Unrealized
Appreciation
(Depreciation)
(000) | |
Morgan Stanley &
Co., LLC* | | 1 Month TIIE | | Pay | | | 7.32 | % | | Monthly/Monthly | | 10/21/19 | | MXN | 56,252 | | | $ | (35 | ) | | $ | — | | | $ | (35 | ) | |
Morgan Stanley &
Co., LLC* | | 1 Month TIIE | | Pay | | | 7.32 | | | Monthly/Monthly | | 10/21/19 | | | 68,257 | | | | (43 | ) | | | — | | | | (43 | ) | |
Morgan Stanley &
Co., LLC* | | 1 Month TIIE | | Pay | | | 7.32 | | | Monthly/Monthly | | 10/21/19 | | | 65,631 | | | | (41 | ) | | | — | | | | (41 | ) | |
Morgan Stanley &
Co., LLC* | | 1 Month TIIE | | Pay | | | 7.39 | | | Monthly/Monthly | | 10/25/19 | | | 4,019 | | | | (2 | ) | | | — | | | | (2 | ) | |
Morgan Stanley &
Co., LLC* | | 1 Month TIIE | | Pay | | | 7.63 | | | Monthly/Monthly | | 12/5/19 | | | 63,611 | | | | (23 | ) | | | — | | | | (23 | ) | |
Morgan Stanley &
Co., LLC* | | 1 Month TIIE | | Pay | | | 7.63 | | | Monthly/Monthly | | 12/5/19 | | | 65,732 | | | | (24 | ) | | | — | | | | (24 | ) | |
Morgan Stanley &
Co., LLC* | | 1 Month TIIE | | Pay | | | 7.64 | | | Monthly/Monthly | | 12/5/19 | | | 62,334 | | | | (22 | ) | | | — | | | | (22 | ) | |
Morgan Stanley &
Co., LLC* | | 1 Month TIIE | | Pay | | | 8.04 | | | Monthly/Monthly | | 12/19/19 | | | 102,085 | | | | 15 | | | | — | | | | 15 | | |
Morgan Stanley &
Co., LLC* | | 1 Month TIIE | | Pay | | | 8.04 | | | Monthly/Monthly | | 12/19/19 | | | 83,107 | | | | 11 | | | | — | | | | 11 | | |
Morgan Stanley &
Co., LLC* | | 1 Month TIIE | | Pay | | | 8.06 | | | Monthly/Monthly | | 12/20/19 | | | 85,752 | | | | 13 | | | | — | | | | 13 | | |
Morgan Stanley &
Co., LLC* | | 1 Month TIIE | | Pay | | | 8.08 | | | Monthly/Monthly | | 12/20/19 | | | 85,751 | | | | 14 | | | | — | | | | 14 | | |
Morgan Stanley &
Co., LLC* | | 1 Month TIIE | | Pay | | | 8.07 | | | Monthly/Monthly | | 12/25/19 | | | 85,752 | | | | 9 | | | | — | | | | 9 | | |
Morgan Stanley &
Co., LLC* | | 1 Month TIIE | | Pay | | | 8.09 | | | Monthly/Monthly | | 12/26/19 | | | 85,752 | | | | 10 | | | | — | | | | 10 | | |
Morgan Stanley &
Co., LLC* | | 1 Month TIIE | | Pay | | | 8.10 | | | Monthly/Monthly | | 12/26/19 | | | 85,751 | | | | 10 | | | | — | | | | 10 | | |
Morgan Stanley &
Co., LLC* | | 1 Month TIIE | | Pay | | | 8.06 | | | Monthly/Monthly | | 12/27/19 | | | 92,073 | | | | 4 | | | | — | | | | 4 | | |
The accompanying notes are an integral part of the consolidated financial statements.
12
Morgan Stanley Institutional Fund, Inc.
Annual Report — December 31, 2017
Consolidated Portfolio of Investments (cont'd)
Multi-Asset Portfolio
Interest Rate Swap Agreements (cont'd):
Swap Counterparty | | Floating
Rate
Index | | Pay/Receive
Floating Rate | | Fixed
Rate | | Payment
Frequency
Paid/
Received | | Maturity
Date | | Notional
Amount
(000) | | Value
(000) | | Upfront
Payment
Paid
(000) | | Unrealized
Appreciation
(Depreciation)
(000) | |
Morgan Stanley &
Co., LLC* | | 1 Month TIIE | | Receive | | | 7.94 | % | | Monthly/Monthly | | 12/9/27 | | $ | 32,687 | | | $ | — | @ | | $ | — | | | $ | — | @ | |
Morgan Stanley &
Co., LLC* | | 1 Month TIIE | | Receive | | | 7.95 | | | Monthly/Monthly | | 12/9/27 | | | 23,516 | | | | 3 | | | | — | | | | 3 | | |
Morgan Stanley &
Co., LLC* | | 1 Month TIIE | | Receive | | | 8.00 | | | Monthly/Monthly | | 12/10/27 | | | 27,068 | | | | (5 | ) | | | — | | | | (5 | ) | |
Morgan Stanley &
Co., LLC* | | 1 Month TIIE | | Receive | | | 8.01 | | | Monthly/Monthly | | 12/10/27 | | | 32,625 | | | | 6 | | | | — | | | | 6 | | |
Morgan Stanley &
Co., LLC* | | 1 Month TIIE | | Receive | | | 8.01 | | | Monthly/Monthly | | 12/10/27 | | | 32,687 | | | | (7 | ) | | | — | | | | (7 | ) | |
Morgan Stanley &
Co., LLC* | | 1 Month TIIE | | Receive | | | 8.02 | | | Monthly/Monthly | | 12/10/27 | | | 27,068 | | | | (7 | ) | | | — | | | | (7 | ) | |
Morgan Stanley &
Co., LLC* | | 1 Month TIIE | | Receive | | | 8.12 | | | Monthly/Monthly | | 12/15/27 | | | 27,068 | | | | (15 | ) | | | — | | | | (15 | ) | |
Morgan Stanley &
Co., LLC* | | 1 Month TIIE | | Receive | | | 8.12 | | | Monthly/Monthly | | 12/16/27 | | | 27,068 | | | | (18 | ) | | | — | | | | (18 | ) | |
Morgan Stanley &
Co., LLC* | | 1 Month TIIE | | Receive | | | 8.14 | | | Monthly/Monthly | | 12/16/27 | | | 27,068 | | | | (17 | ) | | | — | | | | (17 | ) | |
Morgan Stanley &
Co., LLC* | | 1 Month TIIE | | Receive | | | 8.11 | | | Monthly/Monthly | | 12/17/27 | | | 28,709 | | | | (13 | ) | | | — | | | | (13 | ) | |
Morgan Stanley &
Co., LLC* | | 3 Month JIBAR | | Pay | | | 8.51 | | | Quarterly/Quarterly | | 12/13/27 | | ZAR | 58,476 | | | | 204 | | | | — | | | | 204 | | |
Morgan Stanley &
Co., LLC* | | 3 Month JIBAR | | Pay | | | 8.51 | | | Quarterly/Quarterly | | 12/13/27 | | | 15,601 | | | | 54 | | | | — | | | | 54 | | |
Morgan Stanley &
Co., LLC* | | 3 Month JIBAR | | Pay | | | 8.37 | | | Quarterly/Quarterly | | 12/15/27 | | | 33,925 | | | | 91 | | | | — | | | | 91 | | |
Morgan Stanley &
Co., LLC* | | 6 Month PRIBOR | | Receive | | | 1.11 | | | Annual/Semi-Annual | | 8/7/22 | | CZK | 12,722 | | | | 11 | | | | — | | | | 11 | | |
Morgan Stanley &
Co., LLC* | | 6 Month PRIBOR | | Receive | | | 1.12 | | | Annual/Semi-Annual | | 8/7/22 | | | 109,596 | | | | 96 | | | | — | | | | 96 | | |
Morgan Stanley &
Co., LLC* | | 6 Month PRIBOR | | Receive | | | 1.06 | | | Annual/Semi-Annual | | 8/8/22 | | | 30,867 | | | | 31 | | | | — | | | | 31 | | |
Morgan Stanley &
Co., LLC* | | 6 Month PRIBOR | | Receive | | | 1.07 | | | Annual/Semi-Annual | | 8/14/22 | | | 11,310 | | | | 11 | | | | — | | | | 11 | | |
Morgan Stanley &
Co., LLC* | | 6 Month PRIBOR | | Receive | | | 1.07 | | | Annual/Semi-Annual | | 8/14/22 | | | 25,889 | | | | 26 | | | | — | | | | 26 | | |
Morgan Stanley &
Co., LLC* | | 6 Month PRIBOR | | Receive | | | 1.06 | | | Annual/Semi-Annual | | 8/15/22 | | | 29,905 | | | | 30 | | | | — | | | | 30 | | |
Morgan Stanley &
Co., LLC* | | 6 Month PRIBOR | | Receive | | | 1.09 | | | Annual/Semi-Annual | | 8/15/22 | | | 61,597 | | | | 59 | | | | — | | | | 59 | | |
Morgan Stanley &
Co., LLC* | | 6 Month PRIBOR | | Receive | | | 1.12 | | | Annual/Semi-Annual | | 8/22/22 | | | 15,434 | | | | 14 | | | | — | | | | 14 | | |
Morgan Stanley &
Co., LLC* | | 6 Month PRIBOR | | Receive | | | 1.10 | | | Annual/Semi-Annual | | 8/23/22 | | | 22,967 | | | | 21 | | | | — | | | | 21 | | |
Morgan Stanley &
Co., LLC* | | 6 Month PRIBOR | | Receive | | | 1.10 | | | Annual/Semi-Annual | | 8/23/22 | | | 30,868 | | | | 29 | | | | — | | | | 29 | | |
Morgan Stanley &
Co., LLC* | | 6 Month PRIBOR | | Receive | | | 1.10 | | | Annual/Semi-Annual | | 8/23/22 | | | 30,868 | | | | 29 | | | | — | | | | 29 | | |
Morgan Stanley &
Co., LLC* | | 6 Month PRIBOR | | Receive | | | 1.12 | | | Annual/Semi-Annual | | 8/24/22 | | | 13,996 | | | | 13 | | | | — | | | | 13 | | |
Morgan Stanley &
Co., LLC* | | 6 Month PRIBOR | | Receive | | | 1.12 | | | Annual/Semi-Annual | | 8/24/22 | | | 30,868 | | | | 27 | | | | — | | | | 27 | | |
| | | | | | | | | | | | | $ | 1,912,312 | | | $ | 569 | | | $ | — | | | $ | 569 | | |
The accompanying notes are an integral part of the consolidated financial statements.
13
Morgan Stanley Institutional Fund, Inc.
Annual Report — December 31, 2017
Consolidated Portfolio of Investments (cont'd)
Multi-Asset Portfolio
Total Return Swap Agreements:
The Fund had the following total return swap agreements open at December 31, 2017:
Swap Counterparty | | Index | | Pay/Receive
Total Return
of Referenced
Index | | Floating
Rate | | Payment
Frequency | | Maturity
Date | | Notional
Amount
(000) | | Value
(000) | | Upfront
Payment
Paid
(000) | | Unrealized
Appreciation
(Depreciation)
(000) | |
BNP Paribas SA
| | MSCI World
Energy
Equipment &
Services Index | |
Pay | |
3 Month
USD LIBOR
plus 0.03% | |
Quarterly | |
9/6/18 | | $ | 647 | | | $ | (30 | ) | | $ | — | | | $ | (30 | ) | |
BNP Paribas SA
| | BNP Custom
Short U.S.
Machinery
Index†† | | Pay | | 3 Month
USD LIBOR
plus 0.25% | | Quarterly | | 11/21/18 | | | 519 | | | | (52 | ) | | | — | | | | (52 | ) | |
BNP Paribas SA
| | BNP Custom
Short U.S.
Machinery
Index†† | | Pay | | 3 Month
USD LIBOR
plus 0.25% | | Quarterly | | 11/21/18 | | | 1,088 | | | | (39) | | | | — | | | | (39) | | |
BNP Paribas SA
| | BNP Custom
China Tier 2
Banks
Index†† | | Pay | | 3 Month
USD LIBOR
plus 0.32% | | Quarterly | | 12/4/18 | | | 649 | | | | (38) | | | | — | | | | (38) | | |
Goldman Sachs
International
| | GS Custom
Short Non-U.S.
Machinery
Index†† | | Pay | | 3 Month
USD LIBOR
plus 0.13% | | Quarterly | | 11/23/18 | | | 768 | | | | (28) | | | | — | | | | (28) | | |
Goldman Sachs
International
| | GS Custom
Short Non-U.S.
Machinery
Index†† | | Pay | | 3 Month
USD LIBOR
plus 0.13% | | Quarterly | | 11/23/18 | | | 1,631 | | | | (61) | | | | — | | | | (61) | | |
Goldman Sachs
International
| | MSCI Metals &
Mining Index | | Pay | | 3 Month
USD LIBOR
plus 0.20% | | Quarterly | | 12/5/18 | | | 1,020 | | | | (109) | | | | — | | | | (109) | | |
JPMorgan Chase
Bank NA
| | JPM Custom
China Tier 2
Banks
Index†† | | Pay | | 3 Month
USD LIBOR
plus 0.10% | | Quarterly | | 3/15/18 | | | 1,103 | | | | (2) | | | | — | | | | (2) | | |
JPMorgan Chase
Bank NA
| | JPM Custom
China Tier 2
Banks
Index†† | | Pay | | 3 Month
USD LIBOR
plus 0.10% | | Quarterly | | 3/15/18 | | | 112 | | | | (—@) | | | | — | | | | (—@) | | |
JPMorgan Chase
Bank NA
| | JPM Custom
China Tier 2
Banks
Index†† | | Pay | | 3 Month
USD LIBOR
plus 0.10% | | Quarterly | | 3/15/18 | | | 91 | | | | (—@) | | | | — | | | | (—@) | | |
JPMorgan Chase
Bank NA
| | JPM Custom
China Tier 2
Banks
Index†† | | Pay | | 3 Month
USD LIBOR
plus 0.10% | | Quarterly | | 3/15/18 | | | 90 | | | | (—@) | | | | — | | | | (—@) | | |
JPMorgan Chase
Bank NA
| | JPM Custom
China Tier 2
Banks
Index†† | | Pay | | 3 Month
USD LIBOR
plus 0.10% | | Quarterly | | 3/15/18 | | | 86 | | | | (—@) | | | | — | | | | (—@) | | |
JPMorgan Chase
Bank NA
| | JPM Custom
China Tier 2
Banks
Index†† | | Pay | | 3 Month
USD LIBOR
minus 0.10% | | Quarterly | | 3/15/18 | | | 431 | | | | (1) | | | | — | | | | (1) | | |
The accompanying notes are an integral part of the consolidated financial statements.
14
Morgan Stanley Institutional Fund, Inc.
Annual Report — December 31, 2017
Consolidated Portfolio of Investments (cont'd)
Multi-Asset Portfolio
Total Return Swap Agreements (cont'd):
Swap Counterparty | | Index | | Pay/Receive
Total Return
of Referenced
Index | | Floating
Rate | | Payment
Frequency | | Maturity
Date | | Notional
Amount
(000) | | Value
(000) | | Upfront
Payment
Paid
(000) | | Unrealized
Appreciation
(Depreciation)
(000) | |
JPMorgan Chase
Bank NA
| | JPM Custom
China Tier 2
Banks
Index†† | |
Pay | |
3 Month
USD LIBOR
minus 0.10% | |
Quarterly | |
3/15/18 | | $ | 417 | | | $ | (1 | ) | | $ | — | | | $ | (1 | ) | |
JPMorgan Chase
Bank NA
| | JPM Custom
China Tier 2
Banks
Index†† | | Pay | | 3 Month
USD LIBOR
plus 0.10% | | Quarterly | | 3/15/18 | | | 111 | | | | (— | @) | | | — | | | | (— | @) | |
JPMorgan Chase
Bank NA
| | JPM Custom
Long U.S.
Defensives
Index†† | | Receive | | 3 Month
USD LIBOR
plus 0.42% | | Quarterly | | 11/20/18 | | | 1,783 | | | | 67 | | | | — | | | | 67 | | |
JPMorgan Chase
Bank NA
| | JPM Custom
Long U.S.
Defensives
Index†† | | Receive | | 3 Month
USD LIBOR
plus 0.42% | | Quarterly | | 11/20/18 | | | 1,790 | | | | 62 | | | | — | | | | 62 | | |
JPMorgan Chase
Bank NA
| | JPM Custom
Long U.S.
Defensives
Index†† | | Receive | | 3 Month
USD LIBOR
plus 0.65% | | Quarterly | | 11/20/18 | | | 2,536 | | | | (40) | | | | — | | | | (40) | | |
JPMorgan Chase
Bank NA
| | JPM Custom
Short U.S.
Cyclicals
Index†† | | Pay | | 3 Month
USD LIBOR
plus 0.33% | | Quarterly | | 11/20/18 | | | 1,781 | | | | (76) | | | | — | | | | (76) | | |
JPMorgan Chase
Bank NA
| | JPM Custom
Short U.S.
Cyclicals
Index†† | | Pay | | 3 Month
USD LIBOR
plus 0.33% | | Quarterly | | 11/20/18 | | | 1,788 | | | | (73) | | | | — | | | | (73) | | |
JPMorgan Chase
Bank NA
| | JPM Custom
Short U.S.
Cyclicals
Index†† | | Pay | | 3 Month
USD LIBOR
plus 0.50% | | Quarterly | | 11/20/18 | | | 2,590 | | | | 5 | | | | — | | | | 5 | | |
JPMorgan Chase
Bank NA
| | JPM Custom
Short Luxury
Index†† | | Pay | | 3 Month
USD LIBOR
plus 0.26% | | Quarterly | | 12/4/18 | | | 760 | | | | 1 | | | | — | | | | 1 | | |
JPMorgan Chase
Bank NA
| | JPM Custom
Short Luxury
Index†† | | Pay | | 3 Month
USD LIBOR
plus 0.26% | | Quarterly | | 12/4/18 | | | 1,391 | | | | (55) | | | | — | | | | (55) | | |
| | | | | | | | | | | | | $ | 23,182 | | | $ | (470 | ) | | $ | — | | | $ | (470 | ) | |
†† See tables below for details of the equity basket holdings underlying the swap.
The accompanying notes are an integral part of the consolidated financial statements.
15
Morgan Stanley Institutional Fund, Inc.
Annual Report — December 31, 2017
Consolidated Portfolio of Investments (cont'd)
Multi-Asset Portfolio
The following table represents the equity basket holdings underlying the total return swap with BNP Custom Short U.S. Machinery Index as of December 31, 2017.
Security Description | | Shares | | Value (000) | | Index Weight | |
BNP Custom Short U.S. Machinery Index | |
AGCO Corp. | | | 3,061 | | | $ | 310 | | | | 1.59 | % | |
Caterpillar, Inc. | | | 22,821 | | | | 72,869 | | | | 26.16 | | |
Cummins, Inc. | | | 6,140 | | | | 9,112 | | | | 7.89 | | |
Deere & Co. | | | 12,450 | | | | 1,133 | | | | 14.18 | | |
Dover Corp. | | | 5,975 | | | | 27,913 | | | | 4.39 | | |
Flowserve Corp. | | | 5,050 | | | | 3,479 | | | | 1.55 | | |
Illinois Tool Works, Inc. | | | 13,111 | | | | 224 | | | | 15.92 | | |
Ingersoll-Rand PLC | | | 9,543 | | | | 479 | | | | 6.19 | | |
PACCAR, Inc. | | | 13,155 | | | | 131 | | | | 6.80 | | |
Parker-Hannifin Corp. | | | 5,113 | | | | 343,322 | | | | 7.42 | | |
Pentair PLC | | | 6,986 | | | | 38,598 | | | | 3.59 | | |
SPX Corp. | | | 1,626 | | | | 58 | | | | 0.37 | | |
SPX FLOW, Inc. | | | 1,599 | | | | 4,039 | | | | 0.55 | | |
Xylem, Inc. | | | 6,850 | | | | 297 | | | | 3.40 | | |
Total | | | | $ | 501,964 | | | | 100.00 | % | |
The following table represents the equity basket holdings underlying the total return swap with BNP Custom China Tier 2 Banks Index as of December 31, 2017.
Security Description | | Shares | | Value (000) | | Index Weight | |
BNP Custom China Tier 2 Banks Index | |
China Evergrande Group | | | 52,328 | | | $ | 1,410 | | | | 17.55 | % | |
China Jinmao Holdings Group Ltd. | | | 42,822 | | | | 147 | | | | 1.83 | | |
China Overseas Land & Investment Ltd. | | | 43,659 | | | | 1,098 | | | | 13.67 | | |
China Resources Land Ltd. | | | 27,599 | | | | 635 | | | | 7.90 | | |
China Vanke Co., Ltd | | | 57,185 | | | | 1,784 | | | | 22.20 | | |
Country Garden Holdings Co., Ltd | | | 83,681 | | | | 1,247 | | | | 15.52 | | |
Guangzhou R&F Properties Co., Ltd | | | 12,831 | | | | 226 | | | | 2.81 | | |
Longfor Properties Co., Ltd | | | 23,751 | | | | 465 | | | | 5.79 | | |
Shimao Property Holdings Ltd. | | | 13,451 | | | | 229 | | | | 2.85 | | |
Sino-Ocean Group Holding Ltd. | | | 30,738 | | | | 166 | | | | 2.06 | | |
SOHO China Ltd. | | | 20,788 | | | | 95 | | | | 1.18 | | |
Sunac China Holdings Ltd. | | | 16,486 | | | | 533 | | | | 6.64 | | |
Total | | | | $ | 8,035 | | | | 100.00 | % | |
The following table represents the equity basket holdings underlying the total return swap with GS Custom Short Non-U.S. Machinery Index as of December 31, 2017.
Security Description | | Shares | | Value (000) | | Index Weight | |
GS Custom Short Non-U.S. Machinery Index | |
Alfa Laval AB | | | 915 | | | $ | 177 | | | | 2.11 | % | |
Atlas Copco AB | | | 2,617 | | | | 927 | | | | 11.01 | | |
CNH Industrial N.V. | | | 3,009 | | | | 34 | | | | 3.93 | | |
CRRC Corp Ltd. | | | 103,323 | | | | 864 | | | | 10.75 | | |
Doosan Infracore Co., Ltd. | | | 447 | | | | 3,884 | | | | 0.35 | | |
GEA Group AG | | | 423 | | | | 17 | | | | 1.98 | | |
Hino Motors Ltd. | | | 1,266 | | | | 1,848 | | | | 1.60 | | |
Hitachi Construction Machinery Co., Ltd. | | | 470 | | | | 1,927 | | | | 1.66 | | |
Hiwin Technologies Corp. | | | 608 | | | | 196 | | | | 0.64 | | |
Hyundai Heavy Industries Co., Ltd. | | | 124 | | | | 12,482 | | | | 1.14 | | |
Hyundai Mipo Dockyard Co., Ltd. | | | 44 | | | | 3,468 | | | | 0.32 | | |
IMI PLC | | | 602 | | | | 803 | | | | 1.05 | | |
JTEKT Corp. | | | 753 | | | | 1,458 | | | | 1.26 | | |
Kawasaki Heavy Industries Ltd. | | | 365 | | | | 1,442 | | | | 1.25 | | |
Komatsu Ltd. | | | 2,129 | | | | 8,681 | | | | 7.50 | | |
The accompanying notes are an integral part of the consolidated financial statements.
16
Morgan Stanley Institutional Fund, Inc.
Annual Report — December 31, 2017
Consolidated Portfolio of Investments (cont'd)
Multi-Asset Portfolio
Security Description | | Shares | | Value (000) | | Index Weight | |
GS Custom Short Non-U.S. Machinery Index (cont'd) | |
Kone Oyj | | | 1,156 | | | $ | 52 | | | | 6.05 | % | |
Kubota Corp. | | | 2,719 | | | | 6,008 | | | | 5.19 | | |
MAN SE | | | 323 | | | | 31 | | | | 3.60 | | |
Melrose Industries PLC | | | 4,303 | | | | 913 | | | | 1.20 | | |
Metso Oyj | | | 332 | | | | 9 | | | | 1.11 | | |
NGK Insulators Ltd. | | | 719 | | | | 1,529 | | | | 1.32 | | |
Samsung Heavy Industries Co., Ltd. | | | 850 | | | | 6,230 | | | | 0.57 | | |
Sandvik AB | | | 2,767 | | | | 398 | | | | 4.72 | | |
Schindler Holding AG | | | 233 | | | | 52 | | | | 5.21 | | |
SMC Corp. | | | 148 | | | | 6,861 | | | | 5.92 | | |
Sulzer AG | | | 75 | | | | 9 | | | | 0.88 | | |
Sumitomo Heavy Industries Ltd. | | | 271 | | | | 1,291 | | | | 1.11 | | |
Volvo AB | | | 4,695 | | | | 717 | | | | 8.52 | | |
Wartsila Oyj Abp | | | 436 | | | | 23 | | | | 2.68 | | |
Weichai Power Co., Ltd. | | | 19,266 | | | | 165 | | | | 2.05 | | |
Weir Group PLC (The) | | | 496 | | | | 1,053 | | | | 1.38 | | |
Yangzijiang Shipbuilding Holdings Ltd. | | | 8,648 | | | | 13 | | | | 0.92 | | |
Zoomlion Co., Ltd. | | | 24,564 | | | | 82 | | | | 1.02 | | |
Total | | | | $ | 63,644 | | | | 100.00 | % | |
The following table represents the equity basket holdings underlying the total return swap with JPM Custom China Tier 2 Banks Index as of December 31, 2017.
Security Description | | Shares | | Value (000) | | Index Weight | |
JPM Custom China Tier 2 Banks Index | |
Bank of Communications Co., Ltd. | | | 230,551 | | | $ | 1,337 | | | | 12.15 | % | |
China CITIC Bank Corp., Ltd. | | | 743,160 | | | | 3,641 | | | | 33.09 | | |
China Everbright Bank Co., Ltd. | | | 57,105 | | | | 208 | | | | 1.89 | | |
China Merchants Bank Co., Ltd. | | | 131,691 | | | | 4,096 | | | | 37.22 | | |
China Minsheng Banking Corp., Ltd. | | | 165,248 | | | | 1,294 | | | | 11.76 | | |
Chongqing Rural Commercial Bank Co., Ltd. | | | 77,532 | | | | 428 | | | | 3.89 | | |
Total | | | | $ | 11,004 | | | | 100.00 | % | |
The following table represents the equity basket holdings underlying the total return swap with JPM Custom Long U.S. Defensives Index as of December 31, 2017.
Security Description | | Shares | | Value (000) | | Index Weight | |
JPM Custom Long U.S. Defensives Index | |
Abbott Laboratories | | | 1,407 | | | $ | 80 | | | | 0.77 | % | |
AbbVie, Inc. | | | 1,291 | | | | 125 | | | | 1.20 | | |
AES Corp. | | | 2,315 | | | | 25 | | | | 0.24 | | |
Aetna, Inc. | | | 269 | | | | 49 | | | | 0.46 | | |
Agilent Technologies, Inc. | | | 260 | | | | 17 | | | | 0.17 | | |
Alexion Pharmaceuticals, Inc. | | | 181 | | | | 22 | | | | 0.21 | | |
Align Technology, Inc. | | | 58 | | | | 13 | | | | 0.12 | | |
Allergan PLC | | | 271 | | | | 44 | | | | 0.42 | | |
Alliant Energy Corp. | | | 810 | | | | 35 | | | | 0.33 | | |
Altria Group, Inc. | | | 2,694 | | | | 192 | | | | 1.84 | | |
Ameren Corp. | | | 851 | | | | 50 | | | | 0.48 | | |
American Electric Power Co., Inc. | | | 1,724 | | | | 127 | | | | 1.21 | | |
American Water Works Co., Inc. | | | 625 | | | | 57 | | | | 0.55 | | |
AmerisourceBergen Corp. | | | 131 | | | | 12 | | | | 0.12 | | |
Amgen, Inc. | | | 591 | | | | 103 | | | | 0.98 | | |
Anthem, Inc. | | | 213 | | | | 48 | | | | 0.46 | | |
Archer-Daniels-Midland Co. | | | 790 | | | | 32 | | | | 0.30 | | |
AT&T, Inc. | | | 38,194 | | | | 1,485 | | | | 14.20 | | |
Baxter International, Inc. | | | 406 | | | | 26 | | | | 0.25 | | |
The accompanying notes are an integral part of the consolidated financial statements.
17
Morgan Stanley Institutional Fund, Inc.
Annual Report — December 31, 2017
Consolidated Portfolio of Investments (cont'd)
Multi-Asset Portfolio
Security Description | | Shares | | Value (000) | | Index Weight | |
JPM Custom Long U.S. Defensives Index (cont'd) | |
Becton Dickinson & Co. | | | 214 | | | $ | 46 | | | | 0.44 | % | |
Biogen, Inc. | | | 171 | | | | 54 | | | | 0.52 | | |
Boston Scientific Corp. | | | 1,111 | | | | 28 | | | | 0.26 | | |
Bristol-Myers Squibb Co. | | | 1,328 | | | | 81 | | | | 0.78 | | |
Brown-Forman Corp. | | | 275 | | | | 19 | | | | 0.18 | | |
Campbell Soup Co. | | | 272 | | | | 13 | | | | 0.13 | | |
Cardinal Health, Inc. | | | 256 | | | | 16 | | | | 0.15 | | |
Celgene Corp. | | | 634 | | | | 66 | | | | 0.63 | | |
Centene Corp. | | | 140 | | | | 14 | | | | 0.14 | | |
CenterPoint Energy, Inc. | | | 1,511 | | | | 43 | | | | 0.41 | | |
CenturyLink, Inc. | | | 6,044 | | | | 101 | | | | 0.96 | | |
Cerner Corp. | | | 255 | | | | 17 | | | | 0.16 | | |
Church & Dwight Co., Inc. | | | 350 | | | | 18 | | | | 0.17 | | |
Cigna Corp. | | | 204 | | | | 41 | | | | 0.40 | | |
Clorox Co. (The) | | | 181 | | | | 27 | | | | 0.26 | | |
CMS Energy Corp. | | | 989 | | | | 47 | | | | 0.45 | | |
Coca-Cola Co. (The) | | | 5,391 | | | | 247 | | | | 2.37 | | |
Colgate-Palmolive Co. | | | 1,237 | | | | 93 | | | | 0.89 | | |
Conagra Brands, Inc. | | | 584 | | | | 22 | | | | 0.21 | | |
Consolidated Edison, Inc. | | | 1,086 | | | | 92 | | | | 0.88 | | |
Constellation Brands, Inc. | | | 241 | | | | 55 | | | | 0.53 | | |
Cooper Cos., Inc. (The) | | | 40 | | | | 9 | | | | 0.08 | | |
Costco Wholesale Corp. | | | 616 | | | | 115 | | | | 1.10 | | |
Coty, Inc. | | | 662 | | | | 13 | | | | 0.13 | | |
CVS Health Corp. | | | 1,428 | | | | 104 | | | | 0.99 | | |
Danaher Corp. | | | 495 | | | | 46 | | | | 0.44 | | |
DaVita, Inc. | | | 124 | | | | 9 | | | | 0.09 | | |
DENTSPLY SIRONA, Inc. | | | 186 | | | | 12 | | | | 0.12 | | |
Dominion Energy, Inc. | | | 2,253 | | | | 183 | | | | 1.75 | | |
Dr Pepper Snapple Group, Inc. | | | 255 | | | | 25 | | | | 0.24 | | |
DTE Energy Co. | | | 629 | | | | 69 | | | | 0.66 | | |
Duke Energy Corp. | | | 2,454 | | | | 206 | | | | 1.97 | | |
Edison International | | | 1,142 | | | | 72 | | | | 0.69 | | |
Edwards Lifesciences Corp. | | | 171 | | | | 19 | | | | 0.18 | | |
Eli Lilly & Co. | | | 785 | | | | 66 | | | | 0.63 | | |
Entergy Corp. | | | 629 | | | | 51 | | | | 0.49 | | |
Envision Healthcare Corp. | | | 98 | | | | 3 | | | | 0.03 | | |
Estee Lauder Cos., Inc. (The) | | | 314 | | | | 40 | | | | 0.38 | | |
Eversource Energy | | | 1,111 | | | | 70 | | | | 0.67 | | |
Exelon Corp. | | | 3,366 | | | | 133 | | | | 1.27 | | |
Express Scripts Holding Co. | | | 468 | | | | 35 | | | | 0.33 | | |
FirstEnergy Corp. | | | 1,558 | | | | 48 | | | | 0.46 | | |
General Mills, Inc. | | | 810 | | | | 48 | | | | 0.46 | | |
Gilead Sciences, Inc. | | | 1,058 | | | | 76 | | | | 0.72 | | |
HCA Healthcare, Inc. | | | 234 | | | | 21 | | | | 0.20 | | |
Henry Schein, Inc. | | | 129 | | | | 9 | | | | 0.09 | | |
Hershey Co. (The) | | | 198 | | | | 22 | | | | 0.21 | | |
Hologic, Inc. | | | 227 | | | | 10 | | | | 0.09 | | |
Hormel Foods Corp. | | | 379 | | | | 14 | | | | 0.13 | | |
Humana, Inc. | | | 117 | | | | 29 | | | | 0.28 | | |
IDEXX Laboratories, Inc. | | | 71 | | | | 11 | | | | 0.11 | | |
Illumina, Inc. | | | 118 | | | | 26 | | | | 0.25 | | |
Incyte Corp. | | | 138 | | | | 13 | | | | 0.12 | | |
Intuitive Surgical, Inc. | | | 91 | | | | 33 | | | | 0.32 | | |
IQVIA Holdings, Inc. | | | 123 | | | | 12 | | | | 0.12 | | |
JM Smucker Co. (The) | | | 160 | | | | 20 | | | | 0.19 | | |
Johnson & Johnson | | | 2,174 | | | | 304 | | | | 2.91 | | |
Kellogg Co. | | | 349 | | | | 24 | | | | 0.23 | | |
The accompanying notes are an integral part of the consolidated financial statements.
18
Morgan Stanley Institutional Fund, Inc.
Annual Report — December 31, 2017
Consolidated Portfolio of Investments (cont'd)
Multi-Asset Portfolio
Security Description | | Shares | | Value (000) | | Index Weight | |
JPM Custom Long U.S. Defensives Index (cont'd) | |
Kimberly-Clark Corp. | | | 496 | | | $ | 60 | | | | 0.57 | % | |
Kraft Heinz Co. (The) | | | 838 | | | | 65 | | | | 0.62 | | |
Kroger Co. (The) | | | 1,260 | | | | 35 | | | | 0.33 | | |
Laboratory Corp. of America Holdings | | | 82 | | | | 13 | | | | 0.13 | | |
McCormick & Co., Inc. | | | 167 | | | | 17 | | | | 0.16 | | |
McKesson Corp. | | | 170 | | | | 27 | | | | 0.25 | | |
Medtronic PLC | | | 1,097 | | | | 89 | | | | 0.85 | | |
Merck & Co., Inc. | | | 2,215 | | | | 125 | | | | 1.19 | | |
Mettler-Toledo International, Inc. | | | 21 | | | | 13 | | | | 0.12 | | |
Molson Coors Brewing Co. | | | 259 | | | | 21 | | | | 0.20 | | |
Mondelez International, Inc. | | | 2,117 | | | | 91 | | | | 0.87 | | |
Monster Beverage Corp. | | | 582 | | | | 37 | | | | 0.35 | | |
Mylan N.V. | | | 434 | | | | 18 | | | | 0.18 | | |
NextEra Energy, Inc. | | | 1,641 | | | | 256 | | | | 2.45 | | |
NiSource, Inc. | | | 1,143 | | | | 29 | | | | 0.28 | | |
NRG Energy, Inc. | | | 1,054 | | | | 30 | | | | 0.29 | | |
Patterson Cos., Inc. | | | 67 | | | | 2 | | | | 0.02 | | |
PepsiCo, Inc. | | | 2,006 | | | | 241 | | | | 2.30 | | |
PerkinElmer, Inc. | | | 89 | | | | 7 | | | | 0.06 | | |
Perrigo Co., PLC | | | 107 | | | | 9 | | | | 0.09 | | |
Pfizer, Inc. | | | 4,834 | | | | 175 | | | | 1.67 | | |
PG&E Corp. | | | 1,798 | | | | 81 | | | | 0.77 | | |
Philip Morris International, Inc. | | | 2,181 | | | | 230 | | | | 2.20 | | |
Pinnacle West Capital Corp. | | | 391 | | | | 33 | | | | 0.32 | | |
PPL Corp. | | | 2,395 | | | | 74 | | | | 0.71 | | |
Procter & Gamble Co. (The) | | | 3,581 | | | | 329 | | | | 3.15 | | |
Public Service Enterprise Group, Inc. | | | 1,774 | | | | 91 | | | | 0.87 | | |
Quest Diagnostics, Inc. | | | 110 | | | | 11 | | | | 0.10 | | |
Regeneron Pharmaceuticals, Inc. | | | 62 | | | | 23 | | | | 0.22 | | |
ResMed, Inc. | | | 115 | | | | 10 | | | | 0.09 | | |
SCANA Corp. | | | 501 | | | | 20 | | | | 0.19 | | |
Sempra Energy | | | 880 | | | | 94 | | | | 0.90 | | |
Southern Co. (The) | | | 3,504 | | | | 169 | | | | 1.61 | | |
Stryker Corp. | | | 261 | | | | 40 | | | | 0.39 | | |
Sysco Corp. | | | 682 | | | | 41 | | | | 0.40 | | |
Thermo Fisher Scientific, Inc. | | | 324 | | | | 62 | | | | 0.59 | | |
Tyson Foods, Inc. | | | 406 | | | | 33 | | | | 0.31 | | |
UnitedHealth Group, Inc. | | | 783 | | | | 173 | | | | 1.65 | | |
Universal Health Services, Inc. | | | 72 | | | | 8 | | | | 0.08 | | |
Varian Medical Systems, Inc. | | | 74 | | | | 8 | | | | 0.08 | | |
Verizon Communications, Inc. | | | 25,376 | | | | 1,343 | | | | 12.85 | | |
Vertex Pharmaceuticals, Inc. | | | 204 | | | | 31 | | | | 0.29 | | |
Walgreens Boots Alliance, Inc. | | | 1,219 | | | | 89 | | | | 0.85 | | |
Wal-Mart Stores, Inc. | | | 2,056 | | | | 203 | | | | 1.94 | | |
Waters Corp. | | | 65 | | | | 13 | | | | 0.12 | | |
WEC Energy Group, Inc. | | | 1,106 | | | | 73 | | | | 0.70 | | |
Xcel Energy, Inc. | | | 1,780 | | | | 86 | | | | 0.82 | | |
Zimmer Biomet Holdings, Inc. | | | 164 | | | | 20 | | | | 0.19 | | |
Zoetis, Inc. | | | 398 | | | | 29 | | | | 0.27 | | |
Total | | | | $ | 10,459 | | | | 100.00 | % | |
The accompanying notes are an integral part of the consolidated financial statements.
19
Morgan Stanley Institutional Fund, Inc.
Annual Report — December 31, 2017
Consolidated Portfolio of Investments (cont'd)
Multi-Asset Portfolio
The following table represents the equity basket holdings underlying the total return swap with JPM Custom Short U.S. Cyclicals Index as of December 31, 2017.
Security Description | | Shares | | Value (000) | | Index Weight | |
JPM Custom Short U.S. Cyclicals Index | |
3M Co. | | | 696 | | | $ | 164 | | | | 1.56 | % | |
Accenture PLC | | | 286 | | | | 44 | | | | 0.42 | | |
Activision Blizzard, Inc. | | | 350 | | | | 22 | | | | 0.21 | | |
Acuity Brands, Inc. | | | 49 | | | | 9 | | | | 0.08 | | |
Adobe Systems, Inc. | | | 229 | | | | 40 | | | | 0.38 | | |
Advance Auto Parts, Inc. | | | 72 | | | | 7 | | | | 0.07 | | |
Advanced Micro Devices, Inc. | | | 373 | | | | 4 | | | | 0.04 | | |
Air Products & Chemicals, Inc. | | | 897 | | | | 147 | | | | 1.40 | | |
Akamai Technologies, Inc. | | | 79 | | | | 5 | | | | 0.05 | | |
Alaska Air Group, Inc. | | | 144 | | | | 11 | | | | 0.10 | | |
Albemarle Corp. | | | 455 | | | | 58 | | | | 0.55 | | |
Allegion PLC | | | 111 | | | | 9 | | | | 0.08 | | |
Alliance Data Systems Corp. | | | 22 | | | | 6 | | | | 0.05 | | |
Alphabet, Inc. | | | 140 | | | | 146 | | | | 1.39 | | |
Alphabet, Inc. | | | 138 | | | | 145 | | | | 1.38 | | |
Amazon.com, Inc. | | | 390 | | | | 456 | | | | 4.34 | | |
American Airlines Group, Inc. | | | 506 | | | | 26 | | | | 0.25 | | |
AMETEK, Inc. | | | 269 | | | | 19 | | | | 0.19 | | |
Amphenol Corp. | | | 141 | | | | 12 | | | | 0.12 | | |
Analog Devices, Inc. | | | 170 | | | | 15 | | | | 0.14 | | |
ANSYS, Inc. | | | 39 | | | | 6 | | | | 0.05 | | |
AO Smith Corp. | | | 171 | | | | 10 | | | | 0.10 | | |
Apple, Inc. | | | 2,392 | | | | 405 | | | | 3.85 | | |
Applied Materials, Inc. | | | 494 | | | | 25 | | | | 0.24 | | |
Aptiv PLC | | | 261 | | | | 22 | | | | 0.21 | | |
Arconic, Inc. | | | 493 | | | | 13 | | | | 0.13 | | |
Autodesk, Inc. | | | 102 | | | | 11 | | | | 0.10 | | |
Automatic Data Processing, Inc. | | | 206 | | | | 24 | | | | 0.23 | | |
AutoZone, Inc. | | | 27 | | | | 19 | | | | 0.18 | | |
Avery Dennison Corp. | | | 364 | | | | 42 | | | | 0.40 | | |
Ball Corp. | | | 1,448 | | | | 55 | | | | 0.52 | | |
Best Buy Co., Inc. | | | 260 | | | | 18 | | | | 0.17 | | |
Boeing Co. (The) | | | 648 | | | | 191 | | | | 1.82 | | |
BorgWarner, Inc. | | | 194 | | | | 10 | | | | 0.09 | | |
Broadcom Ltd. | | | 188 | | | | 48 | | | | 0.46 | | |
CA, Inc. | | | 146 | | | | 5 | | | | 0.05 | | |
Cadence Design Systems, Inc. | | | 130 | | | | 5 | | | | 0.05 | | |
CarMax, Inc. | | | 179 | | | | 11 | | | | 0.11 | | |
Carnival Corp. | | | 399 | | | | 26 | | | | 0.25 | | |
Caterpillar, Inc. | | | 690 | | | | 109 | | | | 1.03 | | |
CBS Corp. | | | 356 | | | | 21 | | | | 0.20 | | |
CF Industries Holdings, Inc. | | | 960 | | | | 41 | | | | 0.39 | | |
CH Robinson Worldwide, Inc. | | | 164 | | | | 15 | | | | 0.14 | | |
Charter Communications, Inc. | | | 197 | | | | 66 | | | | 0.63 | | |
Chipotle Mexican Grill, Inc. | | | 25 | | | | 7 | | | | 0.07 | | |
Cintas Corp. | | | 100 | | | | 16 | | | | 0.15 | | |
Cisco Systems, Inc. | | | 2,316 | | | | 89 | | | | 0.84 | | |
Citrix Systems, Inc. | | | 67 | | | | 6 | | | | 0.06 | | |
Cognizant Technology Solutions Corp. | | | 274 | | | | 19 | | | | 0.19 | | |
Comcast Corp. | | | 4,605 | | | | 184 | | | | 1.75 | | |
Corning, Inc. | | | 418 | | | | 13 | | | | 0.13 | | |
CSRA, Inc. | | | 76 | | | | 2 | | | | 0.02 | | |
CSX Corp. | | | 1,066 | | | | 59 | | | | 0.56 | | |
Cummins, Inc. | | | 184 | | | | 33 | | | | 0.31 | | |
Darden Restaurants, Inc. | | | 123 | | | | 12 | | | | 0.11 | | |
The accompanying notes are an integral part of the consolidated financial statements.
20
Morgan Stanley Institutional Fund, Inc.
Annual Report — December 31, 2017
Consolidated Portfolio of Investments (cont'd)
Multi-Asset Portfolio
Security Description | | Shares | | Value (000) | | Index Weight | |
JPM Custom Short U.S. Cyclicals Index (cont'd) | |
Deere & Co. | | | 373 | | | $ | 58 | | | | 0.56 | % | |
Delphi Technologies PLC | | | 87 | | | | 5 | | | | 0.04 | | |
Delta Air Lines, Inc. | | | 777 | | | | 44 | | | | 0.41 | | |
Discovery Communications, Inc. | | | 199 | | | | 4 | | | | 0.04 | | |
Discovery Communications, Inc. | | | 151 | | | | 3 | | | | 0.03 | | |
DISH Network Corp. | | | 223 | | | | 11 | | | | 0.10 | | |
Dollar General Corp. | | | 255 | | | | 24 | | | | 0.23 | | |
Dollar Tree, Inc. | | | 232 | | | | 25 | | | | 0.24 | | |
Dover Corp. | | | 182 | | | | 18 | | | | 0.17 | | |
DowDuPont, Inc. | | | 9,605 | | | | 684 | | | | 6.50 | | |
DR Horton, Inc. | | | 333 | | | | 17 | | | | 0.16 | | |
DXC Technology Co. | | | 132 | | | | 13 | | | | 0.12 | | |
Eastman Chemical Co. | | | 596 | | | | 55 | | | | 0.53 | | |
Eaton Corp. PLC | | | 519 | | | | 41 | | | | 0.39 | | |
eBay, Inc. | | | 461 | | | | 17 | | | | 0.17 | | |
Ecolab, Inc. | | | 1,072 | | | | 144 | | | | 1.37 | | |
Electronic Arts, Inc. | | | 143 | | | | 15 | | | | 0.14 | | |
Emerson Electric Co. | | | 747 | | | | 52 | | | | 0.49 | | |
Equifax, Inc. | | | 140 | | | | 17 | | | | 0.16 | | |
Expedia, Inc. | | | 120 | | | | 14 | | | | 0.14 | | |
Expeditors International of Washington I | | | 211 | | | | 14 | | | | 0.13 | | |
F5 Networks, Inc. | | | 29 | | | | 4 | | | | 0.04 | | |
Facebook, Inc. | | | 1,098 | | | | 194 | | | | 1.84 | | |
Fastenal Co. | | | 336 | | | | 18 | | | | 0.17 | | |
FedEx Corp. | | | 288 | | | | 72 | | | | 0.68 | | |
Fidelity National Information Services I | | | 154 | | | | 14 | | | | 0.14 | | |
Fiserv, Inc. | | | 97 | | | | 13 | | | | 0.12 | | |
FLIR Systems, Inc. | | | 64 | | | | 3 | | | | 0.03 | | |
Flowserve Corp. | | | 152 | | | | 6 | | | | 0.06 | | |
Fluor Corp. | | | 163 | | | | 8 | | | | 0.08 | | |
FMC Corp. | | | 552 | | | | 52 | | | | 0.50 | | |
Foot Locker, Inc. | | | 121 | | | | 6 | | | | 0.05 | | |
Ford Motor Co. | | | 3,829 | | | | 48 | | | | 0.45 | | |
Fortive Corp. | | | 356 | | | | 26 | | | | 0.24 | | |
Fortune Brands Home & Security, Inc. | | | 180 | | | | 12 | | | | 0.12 | | |
Freeport-McMoRan, Inc. | | | 5,539 | | | | 105 | | | | 1.00 | | |
Gap, Inc. (The) | | | 215 | | | | 7 | | | | 0.07 | | |
Garmin Ltd. | | | 109 | | | | 6 | | | | 0.06 | | |
Gartner, Inc. | | | 42 | | | | 5 | | | | 0.05 | | |
General Dynamics Corp. | | | 325 | | | | 66 | | | | 0.63 | | |
General Electric Co. | | | 10,102 | | | | 176 | | | | 1.68 | | |
General Motors Co. | | | 1,284 | | | | 53 | | | | 0.50 | | |
Genuine Parts Co. | | | 144 | | | | 14 | | | | 0.13 | | |
Global Payments, Inc. | | | 71 | | | | 7 | | | | 0.07 | | |
Goodyear Tire & Rubber Co. (The) | | | 246 | | | | 8 | | | | 0.08 | | |
H&R Block, Inc. | | | 205 | | | | 5 | | | | 0.05 | | |
Hanesbrands, Inc. | | | 357 | | | | 7 | | | | 0.07 | | |
Harley-Davidson, Inc. | | | 167 | | | | 8 | | | | 0.08 | | |
Harris Corp. | | | 55 | | | | 8 | | | | 0.07 | | |
Hasbro, Inc. | | | 111 | | | | 10 | | | | 0.10 | | |
Hewlett Packard Enterprise Co. | | | 761 | | | | 11 | | | | 0.10 | | |
Hilton Worldwide Holdings, Inc. | | | 200 | | | | 16 | | | | 0.15 | | |
Home Depot, Inc. (The) | | | 1,154 | | | | 219 | | | | 2.08 | | |
Honeywell International, Inc. | | | 889 | | | | 136 | | | | 1.30 | | |
HP, Inc. | | | 774 | | | | 16 | | | | 0.15 | | |
IHS Markit Ltd. | | | 424 | | | | 19 | | | | 0.18 | | |
Illinois Tool Works, Inc. | | | 361 | | | | 60 | | | | 0.57 | | |
Ingersoll-Rand PLC | | | 296 | | | | 26 | | | | 0.25 | | |
The accompanying notes are an integral part of the consolidated financial statements.
21
Morgan Stanley Institutional Fund, Inc.
Annual Report — December 31, 2017
Consolidated Portfolio of Investments (cont'd)
Multi-Asset Portfolio
Security Description | | Shares | | Value (000) | | Index Weight | |
JPM Custom Short U.S. Cyclicals Index (cont'd) | |
Intel Corp. | | | 2,176 | | | $ | 100 | | | | 0.95 | % | |
International Business Machines Corp. | | | 401 | | | | 62 | | | | 0.58 | | |
International Flavors & Fragrances , Inc. | | | 325 | | | | 50 | | | | 0.47 | | |
International Paper Co. | | | 1,700 | | | | 98 | | | | 0.94 | | |
Interpublic Group of Cos., Inc. (The) | | | 385 | | | | 8 | | | | 0.07 | | |
Intuit, Inc. | | | 113 | | | | 18 | | | | 0.17 | | |
Jacobs Engineering Group, Inc. | | | 140 | | | | 9 | | | | 0.09 | | |
JB Hunt Transport Services, Inc. | | | 100 | | | | 11 | | | | 0.11 | | |
Johnson Controls International PLC | | | 1,088 | | | | 41 | | | | 0.39 | | |
Juniper Networks, Inc. | | | 176 | | | | 5 | | | | 0.05 | | |
Kansas City Southern | | | 123 | | | | 13 | | | | 0.12 | | |
KLA-Tencor Corp. | | | 73 | | | | 8 | | | | 0.07 | | |
Kohl's Corp. | | | 165 | | | | 9 | | | | 0.09 | | |
L Brands, Inc. | | | 244 | | | | 15 | | | | 0.14 | | |
L3 Technologies, Inc. | | | 91 | | | | 18 | | | | 0.17 | | |
Lam Research Corp. | | | 75 | | | | 14 | | | | 0.13 | | |
Leggett & Platt, Inc. | | | 130 | | | | 6 | | | | 0.06 | | |
Lennar Corp. | | | 199 | | | | 13 | | | | 0.12 | | |
Lennar Corp. | | | 4 | | | | — | | | | — | | |
LKQ Corp. | | | 302 | | | | 12 | | | | 0.12 | | |
Lockheed Martin Corp. | | | 292 | | | | 94 | | | | 0.89 | | |
Lowe's Cos., Inc. | | | 827 | | | | 77 | | | | 0.73 | | |
LyondellBasell Industries N.V. | | | 1,336 | | | | 147 | | | | 1.40 | | |
Macy's, Inc. | | | 298 | | | | 8 | | | | 0.07 | | |
Marriott International, Inc. | | | 306 | | | | 42 | | | | 0.39 | | |
Martin Marietta Materials, Inc. | | | 259 | | | | 57 | | | | 0.54 | | |
Masco Corp. | | | 372 | | | | 16 | | | | 0.16 | | |
Mastercard, Inc. | | | 432 | | | | 65 | | | | 0.62 | | |
Mattel, Inc. | | | 336 | | | | 5 | | | | 0.05 | | |
McDonald's Corp. | | | 793 | | | | 136 | | | | 1.30 | | |
MGM Resorts International | | | 507 | | | | 17 | | | | 0.16 | | |
Michael Kors Holdings Ltd. | | | 148 | | | | 9 | | | | 0.09 | | |
Microchip Technology, Inc. | | | 108 | | | | 9 | | | | 0.09 | | |
Micron Technology, Inc. | | | 516 | | | | 21 | | | | 0.20 | | |
Microsoft Corp. | | | 3,567 | | | | 305 | | | | 2.90 | | |
Mohawk Industries, Inc. | | | 62 | | | | 17 | | | | 0.16 | | |
Monsanto Co. | | | 1,809 | | | | 211 | | | | 2.01 | | |
Mosaic Co. (The) | | | 1,445 | | | | 37 | | | | 0.35 | | |
Motorola Solutions, Inc. | | | 75 | | | | 7 | | | | 0.06 | | |
NetApp, Inc. | | | 125 | | | | 7 | | | | 0.07 | | |
Netflix, Inc. | | | 423 | | | | 81 | | | | 0.77 | | |
Newell Brands, Inc. | | | 480 | | | | 15 | | | | 0.14 | | |
Newmont Mining Corp. | | | 2,195 | | | | 82 | | | | 0.78 | | |
News Corp. | | | 374 | | | | 6 | | | | 0.06 | | |
News Corp. | | | 119 | | | | 2 | | | | 0.02 | | |
Nielsen Holdings PLC | | | 392 | | | | 14 | | | | 0.14 | | |
NIKE, Inc. | | | 1,286 | | | | 80 | | | | 0.76 | | |
Nordstrom, Inc. | | | 114 | | | | 5 | | | | 0.05 | | |
Norfolk Southern Corp. | | | 336 | | | | 49 | | | | 0.46 | | |
Northrop Grumman Corp. | | | 203 | | | | 62 | | | | 0.59 | | |
Norwegian Cruise Line Holdings Ltd. | | | 174 | | | | 9 | | | | 0.09 | | |
Nucor Corp. | | | 1,315 | | | | 84 | | | | 0.79 | | |
NVIDIA Corp. | | | 278 | | | | 54 | | | | 0.51 | | |
Omnicom Group, Inc. | | | 226 | | | | 16 | | | | 0.16 | | |
Oracle Corp. | | | 1,399 | | | | 66 | | | | 0.63 | | |
O'Reilly Automotive, Inc. | | | 86 | | | | 21 | | | | 0.20 | | |
PACCAR, Inc. | | | 410 | | | | 29 | | | | 0.28 | | |
Packaging Corp. of America | | | 388 | | | | 47 | | | | 0.44 | | |
The accompanying notes are an integral part of the consolidated financial statements.
22
Morgan Stanley Institutional Fund, Inc.
Annual Report — December 31, 2017
Consolidated Portfolio of Investments (cont'd)
Multi-Asset Portfolio
Security Description | | Shares | | Value (000) | | Index Weight | |
JPM Custom Short U.S. Cyclicals Index (cont'd) | |
Parker-Hannifin Corp. | | | 155 | | | $ | 31 | | | | 0.29 | % | |
Paychex, Inc. | | | 148 | | | | 10 | | | | 0.10 | | |
PayPal Holdings, Inc. | | | 523 | | | | 39 | | | | 0.37 | | |
Pentair PLC | | | 193 | | | | 14 | | | | 0.13 | | |
PPG Industries, Inc. | | | 1,056 | | | | 123 | | | | 1.17 | | |
Priceline Group, Inc. (The) | | | 48 | | | | 83 | | | | 0.79 | | |
PulteGroup, Inc. | | | 272 | | | | 9 | | | | 0.09 | | |
PVH Corp. | | | 76 | | | | 10 | | | | 0.10 | | |
Qorvo, Inc. | | | 59 | | | | 4 | | | | 0.04 | | |
QUALCOMM, Inc. | | | 684 | | | | 44 | | | | 0.42 | | |
Quanta Services, Inc. | | | 176 | | | | 7 | | | | 0.07 | | |
Ralph Lauren Corp. | | | 54 | | | | 6 | | | | 0.05 | | |
Raytheon Co. | | | 339 | | | | 64 | | | | 0.61 | | |
Red Hat, Inc. | | | 82 | | | | 10 | | | | 0.09 | | |
Republic Services, Inc. | | | 267 | | | | 18 | | | | 0.17 | | |
Robert Half International, Inc. | | | 147 | | | | 8 | | | | 0.08 | | |
Rockwell Automation, Inc. | | | 150 | | | | 29 | | | | 0.28 | | |
Roper Technologies, Inc. | | | 119 | | | | 31 | | | | 0.29 | | |
Ross Stores, Inc. | | | 381 | | | | 31 | | | | 0.29 | | |
Royal Caribbean Cruises Ltd. | | | 168 | | | | 20 | | | | 0.19 | | |
salesforce.com, Inc. | | | 316 | | | | 32 | | | | 0.31 | | |
Seagate Technology PLC | | | 133 | | | | 6 | | | | 0.05 | | |
Sealed Air Corp. | | | 782 | | | | 39 | | | | 0.37 | | |
Sherwin-Williams Co. (The) | | | 338 | | | | 139 | | | | 1.32 | | |
Signet Jewelers Ltd. | | | 59 | | | | 3 | | | | 0.03 | | |
Skyworks Solutions, Inc. | | | 85 | | | | 8 | | | | 0.08 | | |
Snap-on, Inc. | | | 67 | | | | 12 | | | | 0.11 | | |
Southwest Airlines Co. | | | 642 | | | | 42 | | | | 0.40 | | |
Stanley Black & Decker, Inc. | | | 179 | | | | 30 | | | | 0.29 | | |
Starbucks Corp. | | | 1,414 | | | | 81 | | | | 0.77 | | |
Stericycle, Inc. | | | 100 | | | | 7 | | | | 0.06 | | |
Symantec Corp. | | | 285 | | | | 8 | | | | 0.08 | | |
Synopsys, Inc. | | | 70 | | | | 6 | | | | 0.06 | | |
Tapestry, Inc. | | | 277 | | | | 12 | | | | 0.12 | | |
Target Corp. | | | 535 | | | | 35 | | | | 0.33 | | |
TE Connectivity Ltd. | | | 164 | | | | 16 | | | | 0.15 | | |
Texas Instruments, Inc. | | | 459 | | | | 48 | | | | 0.46 | | |
Textron, Inc. | | | 309 | | | | 17 | | | | 0.17 | | |
Tiffany & Co. | | | 100 | | | | 10 | | | | 0.10 | | |
TJX Cos., Inc. (The) | | | 623 | | | | 48 | | | | 0.45 | | |
Total System Services, Inc. | | | 78 | | | | 6 | | | | 0.06 | | |
Tractor Supply Co. | | | 124 | | | | 9 | | | | 0.09 | | |
TransDigm Group, Inc. | | | 56 | | | | 15 | | | | 0.15 | | |
TripAdvisor, Inc. | | | 106 | | | | 4 | | | | 0.03 | | |
Twenty-First Century Fox, Inc. | | | 1,030 | | | | 36 | | | | 0.34 | | |
Twenty-First Century Fox, Inc. | | | 430 | | | | 15 | | | | 0.14 | | |
Ulta Beauty, Inc. | | | 57 | | | | 13 | | | | 0.12 | | |
Under Armour, Inc. | | | 181 | | | | 3 | | | | 0.02 | | |
Under Armour, Inc. | | | 182 | | | | 2 | | | | 0.02 | | |
Union Pacific Corp. | | | 934 | | | | 125 | | | | 1.19 | | |
United Continental Holdings, Inc. | | | 302 | | | | 20 | | | | 0.19 | | |
United Parcel Service, Inc. | | | 804 | | | | 96 | | | | 0.91 | | |
United Rentals, Inc. | | | 99 | | | | 17 | | | | 0.16 | | |
United Technologies Corp. | | | 867 | | | | 111 | | | | 1.05 | | |
VeriSign, Inc. | | | 40 | | | | 5 | | | | 0.04 | | |
Verisk Analytics, Inc. | | | 181 | | | | 17 | | | | 0.17 | | |
VF Corp. | | | 320 | | | | 24 | | | | 0.23 | | |
Viacom, Inc. | | | 345 | | | | 11 | | | | 0.10 | | |
The accompanying notes are an integral part of the consolidated financial statements.
23
Morgan Stanley Institutional Fund, Inc.
Annual Report — December 31, 2017
Consolidated Portfolio of Investments (cont'd)
Multi-Asset Portfolio
Security Description | | Shares | | Value (000) | | Index Weight | |
JPM Custom Short U.S. Cyclicals Index (cont'd) | |
Visa, Inc. | | | 847 | | | $ | 97 | | | | 0.92 | % | |
Vulcan Materials Co. | | | 545 | | | | 70 | | | | 0.66 | | |
Walt Disney Co. (The) | | | 1,511 | | | | 162 | | | | 1.54 | | |
Waste Management, Inc. | | | 472 | | | | 41 | | | | 0.39 | | |
Western Digital Corp. | | | 137 | | | | 11 | | | | 0.10 | | |
Western Union Co. (The) | | | 215 | | | | 4 | | | | 0.04 | | |
WestRock Co. | | | 1,046 | | | | 66 | | | | 0.63 | | |
Whirlpool Corp. | | | 71 | | | | 12 | | | | 0.11 | | |
WW Grainger, Inc. | | | 61 | | | | 14 | | | | 0.14 | | |
Wyndham Worldwide Corp. | | | 101 | | | | 12 | | | | 0.11 | | |
Wynn Resorts Ltd. | | | 78 | | | | 13 | | | | 0.12 | | |
Xerox Corp. | | | 99 | | | | 3 | | | | 0.03 | | |
Xilinx, Inc. | | | 115 | | | | 8 | | | | 0.07 | | |
Xylem, Inc. | | | 210 | | | | 14 | | | | 0.14 | | |
Yum! Brands, Inc. | | | 338 | | | | 28 | | | | 0.26 | | |
Total | | | | $ | 10,515 | | | | 100.00 | % | |
The following table represents the equity basket holdings underlying the total return swap with JPM Custom Short Luxury Index as of December 31, 2017.
Security Description | | Shares | | Value (000) | | Index Weight | |
JPM Custom Short Luxury Index | |
Brunello Cucinelli SpA | | | 112 | | | $ | 3 | | | | 0.35 | % | |
Burberry Group PLC | | | 1,410 | | | | 2,527 | | | | 3.27 | | |
Christian Dior SE | | | 77 | | | | 24 | | | | 2.71 | | |
Cie Financiere Richemont SA | | | 1,896 | | | | 167 | | | | 16.43 | | |
Hermes International | | | 105 | | | | 47 | | | | 5.37 | | |
HUGO BOSS AG | | | 233 | | | | 17 | | | | 1.90 | | |
Kering | | | 417 | | | | 164 | | | | 18.83 | | |
LVMH Moet Hennessy Louis Vuitton SE | | | 1,256 | | | | 308 | | | | 35.41 | | |
Moncler SpA | | | 840 | | | | 22 | | | | 2.52 | | |
Salvatore Ferragamo SpA | | | 559 | | | | 12 | | | | 1.42 | | |
Swatch Group AG (The) | | | 181 | | | | 72 | | | | 7.06 | | |
Tapestry, Inc. | | | 940 | | | | 42 | | | | 3.97 | | |
Tod's SpA | | | 109 | | | | 7 | | | | 0.76 | | |
Total | | | | $ | 3,412 | | | | 100.00 | % | |
@ Value is less than $500.
* Cleared swap agreement, the broker is Morgan Stanley & Co., LLC.
JIBAR Johannesburg Interbank Agreed Rate.
LIBOR London Interbank Offered Rate.
PRIBOR Prague Interbank Offered Rate.
TIIE Interbank Equilibrium Interest Rate.
AUD — Australian Dollar
BRL — Brazilian Real
CAD — Canadian Dollar
CHF — Swiss Franc
CLP — Chilean Peso
CNH — Chinese Yuan Renminbi Offshore
CZK — Czech Koruna
DKK — Danish Krone
EUR — Euro
GBP — British Pound
HKD — Hong Kong Dollar
HUF — Hungarian Forint
IDR — Indonesian Rupiah
ILS — Israeli Shekel
INR — Indian Rupee
JPY — Japanese Yen
KRW — South Korean Won
MXN — Mexican Peso
PLN — Polish Zloty
RUB — Russian Ruble
SEK — Swedish Krona
SGD — Singapore Dollar
THB — Thai Baht
TRY — Turkish Lira
TWD — Taiwan Dollar
USD — United States Dollar
ZAR — South African Rand
The accompanying notes are an integral part of the consolidated financial statements.
24
Morgan Stanley Institutional Fund, Inc.
Annual Report — December 31, 2017
Consolidated Portfolio of Investments (cont'd)
Multi-Asset Portfolio
Portfolio Composition
Classification | | Percentage of
Total Investments | |
Short-Term Investments | | | 51.1 | % | |
Common Stocks | | | 29.9 | | |
Sovereign | | | 17.7 | | |
Other** | | | 1.3 | | |
Total Investments | | | 100.0 | %*** | |
** Industries and/or investment types representing less than 5% of total investments.
*** Does not include open long/short futures contracts with an underlying face amount of approximately $63,765,000 with net unrealized depreciation of approximately $445,000. Does not include open foreign currency forward exchange contracts with net unrealized appreciation of approximately $133,000 and does not include open swap agreements with net unrealized appreciation of approximately $99,000.
The accompanying notes are an integral part of the consolidated financial statements.
25
Morgan Stanley Institutional Fund, Inc.
Annual Report — December 31, 2017
Consolidated Statement of Assets and Liabilities | | December 31, 2017
(000) | |
Assets: | |
Investments in Securities of Unaffiliated Issuers, at Value (Cost $37,790) | | $ | 42,219 | | |
Investment in Security of Affiliated Issuer, at Value (Cost $28,990) | | | 28,990 | | |
Total Investments in Securities, at Value (Cost $66,780) | | | 71,209 | | |
Foreign Currency, at Value (Cost $189) | | | 190 | | |
Unrealized Appreciation on Foreign Currency Forward Exchange Contracts | | | 3,414 | | |
Receivable for Variation Margin on Futures Contracts | | | 1,676 | | |
Interest Receivable | | | 800 | | |
Dividends Receivable | | | 5 | | |
Unrealized Appreciation on Swap Agreements | | | 135 | | |
Tax Reclaim Receivable | | | 85 | | |
Receivable from Affiliate | | | 22 | | |
Receivable for Investments Sold | | | 19 | | |
Receivable for Variation Margin on Swap Agreements | | | 13 | | |
Other Assets | | | 38 | | |
Total Assets | | | 77,606 | | |
Liabilities: | |
Unrealized Depreciation on Foreign Currency Forward Exchange Contracts | | | 3,281 | | |
Unrealized Depreciation on Swap Agreements | | | 605 | | |
Payable for Investments Purchased | | | 597 | | |
Due to Broker | | | 285 | | |
Bank Overdraft | | | 149 | | |
Payable for Advisory Fees | | | 123 | | |
Payable for Custodian Fees | | | 81 | | |
Payable for Professional Fees | | | 66 | | |
Payable for Fund Shares Redeemed | | | 34 | | |
Payable for Sub Transfer Agency Fees — Class I | | | 12 | | |
Payable for Sub Transfer Agency Fees — Class A | | | 1 | | |
Payable for Sub Transfer Agency Fees — Class L | | | 2 | | |
Payable for Sub Transfer Agency Fees — Class C | | | — | @ | |
Payable for Transfer Agency Fees — Class I | | | 5 | | |
Payable for Transfer Agency Fees — Class A | | | 2 | | |
Payable for Transfer Agency Fees — Class L | | | — | @ | |
Payable for Transfer Agency Fees — Class C | | | — | @ | |
Payable for Administration Fees | | | 5 | | |
Payable for Shareholder Services Fees — Class A | | | 1 | | |
Payable for Distribution and Shareholder Services Fees — Class L | | | 2 | | |
Payable for Distribution and Shareholder Services Fees — Class C | | | — | @ | |
Other Liabilities | | | 31 | | |
Total Liabilities | | | 5,282 | | |
Net Assets | | $ | 72,324 | | |
Net Assets Consist Of: | |
Paid-in-Capital | | $ | 156,271 | | |
Accumulated Net Investment Loss | | | (97 | ) | |
Accumulated Net Realized Loss | | | (88,072 | ) | |
Unrealized Appreciation (Depreciation) on: | |
Investments | | | 4,429 | | |
Futures Contracts | | | (445 | ) | |
Swap Agreements | | | 99 | | |
Foreign Currency Forward Exchange Contracts | | | 133 | | |
Foreign Currency Translations | | | 6 | | |
Net Assets | | $ | 72,324 | | |
The accompanying notes are an integral part of the consolidated financial statements.
26
Morgan Stanley Institutional Fund, Inc.
Annual Report — December 31, 2017
Consolidated Statement of Assets and Liabilities (cont'd) | | December 31, 2017
(000) | |
CLASS I: | |
Net Assets | | $ | 65,156 | | |
| Shares Outstanding $0.001 par value shares of beneficial interest (unlimited shares authorized) (not in 000's) | | | 6,754,717 | | |
Net Asset Value, Offering and Redemption Price Per Share | | $ | 9.65 | | |
CLASS A: | |
Net Assets | | $ | 3,791 | | |
| Shares Outstanding $0.001 par value shares of beneficial interest (unlimited shares authorized) (not in 000's) | | | 397,239 | | |
Net Asset Value, Redemption Price Per Share | | $ | 9.54 | | |
Maximum Sales Load | | | 5.25 | % | |
Maximum Sales Charge | | $ | 0.53 | | |
Maximum Offering Price Per Share | | $ | 10.07 | | |
CLASS L: | |
Net Assets | | $ | 3,242 | | |
| Shares Outstanding $0.001 par value shares of beneficial interest (unlimited shares authorized) (not in 000's) | | | 343,634 | | |
Net Asset Value, Offering and Redemption Price Per Share | | $ | 9.44 | | |
CLASS C: | |
Net Assets | | $ | 126 | | |
| Shares Outstanding $0.001 par value shares of beneficial interest (unlimited shares authorized) (not in 000's) | | | 13,532 | | |
Net Asset Value, Offering and Redemption Price Per Share | | $ | 9.28 | | |
CLASS IS: | |
Net Assets | | $ | 9 | | |
| Shares Outstanding $0.001 par value shares of beneficial interest (unlimited shares authorized) (not in 000's) | | | 902 | | |
Net Asset Value, Offering and Redemption Price Per Share | | $ | 9.65 | | |
@ Amount is less than $500.
The accompanying notes are an integral part of the consolidated financial statements.
27
Morgan Stanley Institutional Fund, Inc.
Annual Report — December 31, 2017
Consolidated Statement of Operations | | Year Ended
December 31, 2017
(000) | |
Investment Income: | |
Interest from Securities of Unaffiliated Issuers | | $ | 1,577 | | |
Dividends from Securities of Unaffiliated Issuers (Net of $98 of Foreign Taxes Withheld) | | | 857 | | |
Dividends from Security of Affiliated Issuer (Note G) | | | 281 | | |
Total Investment Income | | | 2,715 | | |
Expenses: | |
Advisory Fees (Note B) | | | 794 | | |
Professional Fees | | | 159 | | |
Custodian Fees (Note F) | | | 105 | | |
Administration Fees (Note C) | | | 74 | | |
Registration Fees | | | 67 | | |
Shareholder Services Fees — Class A (Note D) | | | 20 | | |
Distribution and Shareholder Services Fees — Class L (Note D) | | | 35 | | |
Distribution and Shareholder Services Fees — Class C (Note D) | | | 2 | | |
Sub Transfer Agency Fees — Class I | | | 32 | | |
Sub Transfer Agency Fees — Class A | | | 3 | | |
Sub Transfer Agency Fees — Class L | | | 3 | | |
Sub Transfer Agency Fees — Class C | | | — | @ | |
Transfer Agency Fees — Class I (Note E) | | | 21 | | |
Transfer Agency Fees — Class A (Note E) | | | 8 | | |
Transfer Agency Fees — Class L (Note E) | | | 2 | | |
Transfer Agency Fees — Class C (Note E) | | | 2 | | |
Transfer Agency Fees — Class IS (Note E) | | | 2 | | |
Shareholder Reporting Fees | | | 22 | | |
Pricing Fees | | | 19 | | |
Directors' Fees and Expenses | | | 6 | | |
Organization Costs for Subsidiary | | | 6 | | |
Other Expenses | | | 27 | | |
Total Expenses | | | 1,409 | | |
Waiver of Advisory Fees (Note B) | | | (290 | ) | |
Rebate from Morgan Stanley Affiliate (Note G) | | | (64 | ) | |
Reimbursement of Class Specific Expenses — Class I (Note B) | | | (29 | ) | |
Reimbursement of Class Specific Expenses — Class A (Note B) | | | (— | @) | |
Reimbursement of Class Specific Expenses — Class C (Note B) | | | (2 | ) | |
Reimbursement of Class Specific Expenses — Class IS (Note B) | | | (2 | ) | |
Net Expenses | | | 1,022 | | |
Net Investment Income | | | 1,693 | | |
Realized Gain (Loss): | |
Investments Sold (Net of $122 of Capital Gain Country Tax) | | | 6,378 | | |
Foreign Currency Forward Exchange Contracts | | | 179 | | |
Foreign Currency Transactions | | | (23 | ) | |
Futures Contracts | | | (4,864 | ) | |
Swap Agreements | | | (6,986 | ) | |
Net Realized Loss | | | (5,316 | ) | |
Change in Unrealized Appreciation (Depreciation): | |
Investments | | | 3,134 | | |
Foreign Currency Forward Exchange Contracts | | | (1,811 | ) | |
Foreign Currency Translations | | | 18 | | |
Futures Contracts | | | (166 | ) | |
Swap Agreements | | | 1,834 | | |
Net Change in Unrealized Appreciation (Depreciation) | | | 3,009 | | |
Net Realized Loss and Change in Unrealized Appreciation (Depreciation) | | | (2,307 | ) | |
Net Decrease in Net Assets Resulting from Operations | | $ | (614 | ) | |
@ Value is less than $500.
The accompanying notes are an integral part of the consolidated financial statements.
28
Morgan Stanley Institutional Fund, Inc.
Annual Report — December 31, 2017
Consolidated Statements of Changes in Net Assets | | Year Ended
December 31, 2017
(000) | | Year Ended
December 31, 2016
(000) | |
Increase (Decrease) in Net Assets: | |
Operations: | |
Net Investment Income | | $ | 1,693 | | | $ | 632 | | |
Net Realized Loss | | | (5,316 | ) | | | (13,105 | ) | |
Net Change in Unrealized Appreciation (Depreciation) | | | 3,009 | | | | 2,665 | | |
Net Decrease in Net Assets Resulting from Operations | | | (614 | ) | | | (9,808 | ) | |
Distributions from and/or in Excess of: | |
Class I: | |
Net Investment Income | | | — | | | | (3,297 | ) | |
Class A: | |
Net Investment Income | | | — | | | | (226 | ) | |
Class C: | |
Net Investment Income | | | — | | | | (3 | ) | |
Class IS: | |
Net Investment Income | | | — | | | | (— | @) | |
Total Distributions | | | — | | | | (3,526 | ) | |
Capital Share Transactions:(1) | |
Class I: | |
Subscribed | | | 22,279 | | | | 12,373 | | |
Distributions Reinvested | | | — | | | | 3,296 | | |
Redeemed | | | (66,426 | ) | | | (174,882 | ) | |
Class A: | |
Subscribed | | | 597 | | | | 2,631 | | |
Distributions Reinvested | | | — | | | | 186 | | |
Redeemed | | | (9,586 | ) | | | (17,814 | ) | |
Class L: | |
Exchanged | | | — | | | | 660 | | |
Redeemed | | | (3,027 | ) | | | (8,164 | ) | |
Class C: | |
Subscribed | | | 55 | | | | 119 | | |
Distributions Reinvested | | | — | | | | 3 | | |
Redeemed | | | (198 | ) | | | (248 | ) | |
Net Decrease in Net Assets Resulting from Capital Share Transactions | | | (56,306 | ) | | | (181,840 | ) | |
Total Decrease in Net Assets | | | (56,920 | ) | | | (195,174 | ) | |
Net Assets: | |
Beginning of Period | | | 129,244 | | | | 324,418 | | |
End of Period (Including Accumulated Net Investment Loss and Distributions in Excess of
Net Investment Income of $(97) and $(1,378), respectively) | | $ | 72,324 | | | $ | 129,244 | | |
The accompanying notes are an integral part of the consolidated financial statements.
29
Morgan Stanley Institutional Fund, Inc.
Annual Report — December 31, 2017
Consolidated Statements of Changes in Net Assets (cont'd) | | Year Ended
December 31, 2017
(000) | | Year Ended
December 31, 2016
(000) | |
(1) Capital Share Transactions: | |
Class I: | |
Shares Subscribed | | | 2,289 | | | | 1,241 | | |
Shares Issued on Distributions Reinvested | | | — | | | | 350 | | |
Shares Redeemed | | | (6,816 | ) | | | (17,884 | ) | |
Net Decrease in Class I Shares Outstanding | | | (4,527 | ) | | | (16,293 | ) | |
Class A: | |
Shares Subscribed | | | 62 | | | | 265 | | |
Shares Issued on Distributions Reinvested | | | — | | | | 20 | | |
Shares Redeemed | | | (999 | ) | | | (1,838 | ) | |
Net Decrease in Class A Shares Outstanding | | | (937 | ) | | | (1,553 | ) | |
Class L: | |
Shares Exchanged | | | — | | | | 67 | | |
Shares Redeemed | | | (319 | ) | | | (857 | ) | |
Net Decrease in Class L Shares Outstanding | | | (319 | ) | | | (790 | ) | |
Class C: | |
Shares Subscribed | | | 6 | | | | 13 | | |
Shares Issued on Distributions Reinvested | | | — | | | | — | @@ | |
Shares Redeemed | | | (21 | ) | | | (26 | ) | |
Net Decrease in Class C Shares Outstanding | | | (15 | ) | | | (13 | ) | |
@ Amount is less than $500.
@@ Amount is less than 500 shares.
The accompanying notes are an integral part of the consolidated financial statements.
30
Morgan Stanley Institutional Fund, Inc.
Annual Report — December 31, 2017
Consolidated Financial Highlights
Multi-Asset Portfolio
| | | Class I | |
| | | Year Ended December 31, | |
Selected Per Share Data and Ratios | | 2017 | | 2016(1) | | 2015(2) | | 2014(2) | | 2013(2) | |
Net Asset Value, Beginning of Period | | $ | 9.72 | | | $ | 10.17 | | | $ | 11.55 | | | $ | 11.68 | | | $ | 10.30 | | |
Income (Loss) from Investment Operations: | |
Net Investment Income (Loss)(3) | | | 0.19 | | | | 0.03 | | | | 0.07 | | | | (0.02 | ) | | | 0.03 | | |
Net Realized and Unrealized Gain (Loss) | | | (0.26 | ) | | | (0.31 | ) | | | (1.29 | ) | | | 0.11 | | | | 1.84 | | |
Total from Investment Operations | | | (0.07 | ) | | | (0.28 | ) | | | (1.22 | ) | | | 0.09 | | | | 1.87 | | |
Distributions from and/or in Excess of: | |
Net Investment Income | | | — | | | | (0.17 | ) | | | (0.16 | ) | | | (0.22 | ) | | | — | | |
Net Realized Gain | | | — | | | | — | | | | — | | | | (0.00 | )(4) | | | (0.49 | ) | |
Total Distributions | | | — | | | | (0.17 | ) | | | (0.16 | ) | | | (0.22 | ) | | | (0.49 | ) | |
Net Asset Value, End of Period | | $ | 9.65 | | | $ | 9.72 | | | $ | 10.17 | | | $ | 11.55 | | | $ | 11.68 | | |
Total Return(5) | | | (0.72 | )% | | | (2.75 | )% | | | (10.60 | )% | | | 0.77 | % | | | 18.24 | % | |
Ratios and Supplemental Data: | |
Net Assets, End of Period (Thousands) | | $ | 65,156 | | | $ | 109,692 | | | $ | 280,423 | | | $ | 495,419 | | | $ | 107,463 | | |
Ratio of Expenses to Average Net Assets(7) | | | 1.03 | %(6) | | | 1.04 | %(6) | | | 1.05 | %(6) | | | 1.01 | %(6) | | | 1.03 | %(6) | |
Ratio of Net Investment Income (Loss) to Average Net Assets(7) | | | 1.91 | %(6) | | | 0.35 | %(6) | | | 0.60 | %(6) | | | (0.14 | )%(6) | | | 0.25 | %(6) | |
Ratio of Rebate from Morgan Stanley Affiliates to Average Net Assets | | | 0.07 | % | | | 0.06 | % | | | 0.04 | % | | | 0.09 | % | | | 0.07 | % | |
Portfolio Turnover Rate | | | 386 | % | | | 353 | % | | | 355 | % | | | 264 | % | | | 223 | % | |
(7) Supplemental Information on the Ratios to Average Net Assets: | |
Ratios Before Expense Limitation: | |
Expenses to Average Net Assets | | | 1.44 | % | | | 1.25 | % | | | 1.14 | % | | | 1.21 | % | | | 1.97 | % | |
Net Investment Income (Loss) to Average Net Assets | | | 1.50 | % | | | 0.14 | % | | | 0.51 | % | | | (0.34 | )% | | | (0.69 | )% | |
(1) Reflects prior period custodian out-of-pocket expenses that were reimbursed in September 2016. The amount of the reimbursement was immaterial on a per share basis and did not impact the total return of Class I shares. The Ratio of Expenses to Average Net Assets and the Ratio of Net Investment Income to Average Net Assets would be unchanged as the reimbursement of custodian fees was offset against expense waivers/reimbursements with no impact to net expenses or net investment income.
(2) Not consolidated.
(3) Per share amount is based on average shares outstanding.
(4) Amount is less than $0.005 per share.
(5) Calculated based on the net asset value as of the last business day of the period.
(6) The Ratios of Expenses and Net Investment Income (Loss) reflect the rebate of certain Fund expenses in connection with the investments in Morgan Stanley affiliates during the period. The effect of the rebate on the ratios is disclosed in the above table as "Ratio of Rebate from Morgan Stanley Affiliates to Average Net Assets."
The accompanying notes are an integral part of the consolidated financial statements.
31
Morgan Stanley Institutional Fund, Inc.
Annual Report — December 31, 2017
Consolidated Financial Highlights
Multi-Asset Portfolio
| | | Class A | |
| | | Year Ended December 31, | |
Selected Per Share Data and Ratios | | 2017 | | 2016(1) | | 2015(2) | | 2014(2) | | 2013(2) | |
Net Asset Value, Beginning of Period | | $ | 9.68 | | | $ | 10.09 | | | $ | 11.50 | | | $ | 11.63 | | | $ | 10.29 | | |
Income (Loss) from Investment Operations: | |
Net Investment Income (Loss)(3) | | | 0.14 | | | | (0.00 | )(4) | | | 0.03 | | | | (0.05 | ) | | | 0.01 | | |
Net Realized and Unrealized Gain (Loss) | | | (0.28 | ) | | | (0.31 | ) | | | (1.28 | ) | | | 0.11 | | | | 1.82 | | |
Total from Investment Operations | | | (0.14 | ) | | | (0.31 | ) | | | (1.25 | ) | | | 0.06 | | | | 1.83 | | |
Distributions from and/or in Excess of: | |
Net Investment Income | | | — | | | | (0.10 | ) | | | (0.16 | ) | | | (0.19 | ) | | | — | | |
Net Realized Gain | | | — | | | | — | | | | — | | | | (0.00 | )(4) | | | (0.49 | ) | |
Total Distributions | | | — | | | | (0.10 | ) | | | (0.16 | ) | | | (0.19 | ) | | | (0.49 | ) | |
Net Asset Value, End of Period | | $ | 9.54 | | | $ | 9.68 | | | $ | 10.09 | | | $ | 11.50 | | | $ | 11.63 | | |
Total Return(5) | | | (1.24 | )% | | | (2.94 | )% | | | (11.00 | )% | | | 0.55 | % | | | 17.86 | % | |
Ratios and Supplemental Data: | |
Net Assets, End of Period (Thousands) | | $ | 3,791 | | | $ | 12,914 | | | $ | 29,123 | | | $ | 54,771 | | | $ | 13,437 | | |
Ratio of Expenses to Average Net Assets(8) | | | 1.38 | %(6) | | | 1.39 | %(6) | | | 1.37 | %(6) | | | 1.30 | %(6) | | | 1.30 | %(6)(7) | |
Ratio of Net Investment Income (Loss) to Average Net Assets(8) | | | 1.46 | %(6) | | | (0.01 | )%(6) | | | 0.27 | %(6) | | | (0.43 | )%(6) | | | 0.07 | %(6) | |
Ratio of Rebate from Morgan Stanley Affiliates to Average Net Assets | | | 0.07 | % | | | 0.06 | % | | | 0.04 | % | | | 0.09 | % | | | 0.07 | % | |
Portfolio Turnover Rate | | | 386 | % | | | 353 | % | | | 355 | % | | | 264 | % | | | 223 | % | |
(8) Supplemental Information on the Ratios to Average Net Assets: | |
Ratios Before Expense Limitation: | |
Expenses to Average Net Assets | | | 1.76 | % | | | 1.59 | % | | | 1.47 | % | | | 1.46 | % | | | 2.24 | % | |
Net Investment Income (Loss) to Average Net Assets | | | 1.08 | % | | | (0.21 | )% | | | 0.17 | % | | | (0.59 | )% | | | (0.87 | )% | |
(1) Reflects prior period custodian out-of-pocket expenses that were reimbursed in September 2016. The amount of the reimbursement was immaterial on a per share basis and did not impact the total return of Class A shares. The Ratio of Expenses to Average Net Assets and the Ratio of Net Investment Loss to Average Net Assets would be unchanged as the reimbursement of custodian fees was offset against expense waivers/reimbursements with no impact to net expenses or net investment loss.
(2) Not consolidated.
(3) Per share amount is based on average shares outstanding.
(4) Amount is less than $0.005 per share.
(5) Calculated based on the net asset value which does not reflect sales charges, if applicable, as of the last business day of the period.
(6) The Ratios of Expenses and Net Investment Income (Loss) reflect the rebate of certain Fund expenses in connection with the investments in Morgan Stanley affiliates during the period. The effect of the rebate on the ratios is disclosed in the above table as "Ratio of Rebate from Morgan Stanley Affiliates to Average Net Assets."
(7) Effective September 16, 2013, the Adviser has agreed to limit the ratio of expenses to average net assets to the maximum ratio of 1.45% for Class A shares. Prior to September 16, 2013, the maximum ratio was 1.35% for Class A shares.
The accompanying notes are an integral part of the consolidated financial statements.
32
Morgan Stanley Institutional Fund, Inc.
Annual Report — December 31, 2017
Consolidated Financial Highlights
Multi-Asset Portfolio
| | | Class L | |
| | | Year Ended December 31, | |
Selected Per Share Data and Ratios | | 2017 | | 2016(1) | | 2015(2) | | 2014(2) | | 2013(2) | |
Net Asset Value, Beginning of Period | | $ | 9.60 | | | $ | 9.94 | | | $ | 11.39 | | | $ | 11.53 | | | $ | 10.26 | | |
Income (Loss) from Investment Operations: | |
Net Investment Income (Loss)(3) | | | 0.10 | | | | (0.04 | ) | | | (0.02 | ) | | | (0.10 | ) | | | (0.05 | ) | |
Net Realized and Unrealized Gain (Loss) | | | (0.26 | ) | | | (0.30 | ) | | | (1.27 | ) | | | 0.10 | | | | 1.81 | | |
Total from Investment Operations | | | (0.16 | ) | | | (0.34 | ) | | | (1.29 | ) | | | (0.00 | )(4) | | | 1.76 | | |
Distributions from and/or in Excess of: | |
Net Investment Income | | | — | | | | — | | | | (0.16 | ) | | | (0.14 | ) | | | — | | |
Net Realized Gain | | | — | | | | — | | | | — | | | | (0.00 | )(4) | | | (0.49 | ) | |
Total Distributions | | | — | | | | — | | | | (0.16 | ) | | | (0.14 | ) | | | (0.49 | ) | |
Net Asset Value, End of Period | | $ | 9.44 | | | $ | 9.60 | | | $ | 9.94 | | | $ | 11.39 | | | $ | 11.53 | | |
Total Return(5) | | | (1.67 | )% | | | (3.42 | )% | | | (11.37 | )% | | | 0.02 | % | | | 17.23 | % | |
Ratios and Supplemental Data: | |
Net Assets, End of Period (Thousands) | | $ | 3,242 | | | $ | 6,357 | | | $ | 14,443 | | | $ | 41,253 | | | $ | 9,513 | | |
Ratio of Expenses to Average Net Assets(8) | | | 1.86 | %(6) | | | 1.85 | %(6) | | | 1.85 | %(6) | | | 1.77 | %(6) | | | 1.79 | %(6)(7) | |
Ratio of Net Investment Income (Loss) to Average Net Assets(8) | | | 1.09 | %(6) | | | (0.43 | )%(6) | | | (0.18 | )%(6) | | | (0.90 | )%(6) | | | (0.46 | )%(6) | |
Ratio of Rebate from Morgan Stanley Affiliates to Average Net Assets | | | 0.07 | % | | | 0.06 | % | | | 0.04 | % | | | 0.09 | % | | | 0.07 | % | |
Portfolio Turnover Rate | | | 386 | % | | | 353 | % | | | 355 | % | | | 264 | % | | | 223 | % | |
(8) Supplemental Information on the Ratios to Average Net Assets: | |
Ratios Before Expense Limitation: | |
Expenses to Average Net Assets | | | 2.24 | % | | | 2.02 | % | | | 1.92 | % | | | 1.93 | % | | | 2.73 | % | |
Net Investment Income (Loss) to Average Net Assets | | | 0.71 | % | | | (0.60 | )% | | | (0.25 | )% | | | (1.06 | )% | | | (1.40 | )% | |
(1) Reflects prior period custodian out-of-pocket expenses that were reimbursed in September 2016. The amount of the reimbursement was immaterial on a per share basis and did not impact the total return of Class L shares. The Ratio of Expenses to Average Net Assets and the Ratio of Net Investment Loss to Average Net Assets would be unchanged as the reimbursement of custodian fees was offset against expense waivers/reimbursements with no impact to net expenses or net investment loss.
(2) Not consolidated.
(3) Per share amount is based on average shares outstanding.
(4) Amount is less than $0.005 per share.
(5) Calculated based on the net asset value as of the last business day of the period.
(6) The Ratios of Expenses and Net Investment Income (Loss) reflect the rebate of certain Fund expenses in connection with the investments in Morgan Stanley affiliates during the period. The effect of the rebate on the ratios is disclosed in the above table as "Ratio of Rebate from Morgan Stanley Affiliates to Average Net Assets."
(7) Effective September 16, 2013, the Adviser has agreed to limit the ratio of expenses to average net assets to the maximum ratio of 1.95% for Class L shares. Prior to September 16, 2013, the maximum ratio was 1.85% for Class L shares.
The accompanying notes are an integral part of the consolidated financial statements.
33
Morgan Stanley Institutional Fund, Inc.
Annual Report — December 31, 2017
Consolidated Financial Highlights
Multi-Asset Portfolio
| | | Class C | |
| | | Year Ended December 31, | | Period from
April 30, 2015(2) to | |
Selected Per Share Data and Ratios | | 2017 | | 2016(1) | | December 31, 2015(3) | |
Net Asset Value, Beginning of Period | | $ | 9.47 | | | $ | 9.93 | | | $ | 11.09 | | |
Income (Loss) from Investment Operations: | |
Net Investment Income (Loss)(4) | | | 0.07 | | | | (0.09 | ) | | | (0.07 | ) | |
Net Realized and Unrealized Loss | | | (0.26 | ) | | | (0.28 | ) | | | (0.93 | ) | |
Total from Investment Operations | | | (0.19 | ) | | | (0.37 | ) | | | (1.00 | ) | |
Distributions from and/or in Excess of: | |
Net Investment Income | | | — | | | | (0.09 | ) | | | (0.16 | ) | |
Net Asset Value, End of Period | | $ | 9.28 | | | $ | 9.47 | | | $ | 9.93 | | |
Total Return(5) | | | (1.90 | )% | | | (3.70 | )% | | | (9.07 | )%(7) | |
Ratios and Supplemental Data: | |
Net Assets, End of Period (Thousands) | | $ | 126 | | | $ | 272 | | | $ | 420 | | |
Ratio of Expenses to Average Net Assets(9) | | | 2.13 | %(6) | | | 2.14 | %(6) | | | 2.17 | %(6)(8) | |
Ratio of Net Investment Income (Loss) to Average Net Assets(9) | | | 0.70 | %(6) | | | (0.95 | )%(6) | | | (1.07 | )%(6)(8) | |
Ratio of Rebate from Morgan Stanley Affiliates to Average Net Assets | | | 0.07 | % | | | 0.06 | % | | | 0.03 | %(8) | |
Portfolio Turnover Rate | | | 386 | % | | | 353 | % | | | 355 | % | |
(9) Supplemental Information on the Ratios to Average Net Assets: | |
Ratios Before Expense Limitation: | |
Expenses to Average Net Assets | | | 3.67 | % | | | 2.88 | % | | | 2.59 | %(8) | |
Net Investment Loss to Average Net Assets | | | (0.84 | )% | | | (1.69 | )% | | | (1.49 | )%(8) | |
(1) Reflects prior period custodian out-of-pocket expenses that were reimbursed in September 2016. The amount of the reimbursement was immaterial on a per share basis and did not impact the total return of Class C shares. The Ratio of Expenses to Average Net Assets and the Ratio of Net Investment Loss to Average Net Assets would be unchanged as the reimbursement of custodian fees was offset against expense waivers/reimbursements with no impact to net expenses or net investment loss.
(2) Commencement of Operations.
(3) Not consolidated.
(4) Per share amount is based on average shares outstanding.
(5) Calculated based on the net asset value which does not reflect sales charges, if applicable, as of the last business day of the period.
(6) The Ratios of Expenses and Net Investment Income (Loss) reflect the rebate of certain Fund expenses in connection with the investments in Morgan Stanley affiliates during the period. The effect of the rebate on the ratios is disclosed in the above table as "Ratio of Rebate from Morgan Stanley Affiliates to Average Net Assets."
(7) Not annualized.
(8) Annualized.
The accompanying notes are an integral part of the consolidated financial statements.
34
Morgan Stanley Institutional Fund, Inc.
Annual Report — December 31, 2017
Consolidated Financial Highlights
Multi-Asset Portfolio
| | | Class IS | |
| | | Year Ended December 31, | | Period from
May 29, 2015(2) to | |
Selected Per Share Data and Ratios | | 2017 | | 2016(1) | | December 31, 2015(3) | |
Net Asset Value, Beginning of Period | | $ | 9.72 | | | $ | 10.17 | | | $ | 11.09 | | |
Income (Loss) from Investment Operations: | |
Net Investment Income(4) | | | 0.25 | | | | 0.13 | | | | 0.01 | | |
Net Realized and Unrealized Loss | | | (0.32 | ) | | | (0.41 | ) | | | (0.77 | ) | |
Total from Investment Operations | | | (0.07 | ) | | | (0.28 | ) | | | (0.76 | ) | |
Distributions from and/or in Excess of: | |
Net Investment Income | | | — | | | | (0.17 | ) | | | (0.16 | ) | |
Net Asset Value, End of Period | | $ | 9.65 | | | $ | 9.72 | | | $ | 10.17 | | |
Total Return(5) | | | (0.82 | )% | | | (2.65 | )% | | | (6.89 | )%(7) | |
Ratios and Supplemental Data: | |
Net Assets, End of Period (Thousands) | | $ | 9 | | | $ | 9 | | | $ | 9 | | |
Ratio of Expenses to Average Net Assets(9) | | | 1.01 | %(6) | | | 1.01 | %(6) | | | 1.04 | %(6)(8) | |
Ratio of Net Investment Income to Average Net Assets(9) | | | 2.53 | %(6) | | | 1.36 | %(6) | | | 0.23 | %(6)(8) | |
Ratio of Rebate from Morgan Stanley Affiliates to Average Net Assets | | | 0.06 | % | | | 0.06 | % | | �� | 0.03 | %(8) | |
Portfolio Turnover Rate | | | 386 | % | | | 353 | % | | | 355 | % | |
(9) Supplemental Information on the Ratios to Average Net Assets: | |
Ratios Before Expense Limitation: | |
Expenses to Average Net Assets | | | 22.88 | % | | | 22.77 | % | | | 17.31 | %(8) | |
Net Investment Loss to Average Net Assets | | | (19.34 | )% | | | (20.40 | )% | | | (16.04 | )%(8) | |
(1) Reflects prior period custodian out-of-pocket expenses that were reimbursed in September 2016. The amount of the reimbursement was immaterial on a per share basis and did not impact the total return of Class IS shares. The Ratio of Expenses to Average Net Assets and the Ratio of Net Investment Income to Average Net Assets would be unchanged as the reimbursement of custodian fees was offset against expense waivers/reimbursements with no impact to net expenses or net investment income.
(2) Commencement of Offering.
(3) Not consolidated.
(4) Per share amount is based on average shares outstanding.
(5) Calculated based on the net asset value as of the last business day of the period.
(6) The Ratios of Expenses and Net Investment Income reflect the rebate of certain Fund expenses in connection with the investments in Morgan Stanley affiliates during the period. The effect of the rebate on the ratios is disclosed in the above table as "Ratio of Rebate from Morgan Stanley Affiliates to Average Net Assets."
(7) Not annualized.
(8) Annualized.
The accompanying notes are an integral part of the consolidated financial statements.
35
Morgan Stanley Institutional Fund, Inc.
Annual Report — December 31, 2017
Notes to Consolidated Financial Statements
Morgan Stanley Institutional Fund, Inc. (the "Company") is registered under the Investment Company Act of 1940, as amended (the "Act"), as an open-end management investment company. The Company is comprised of twenty-nine separate, active, diversified and non-diversified funds (individually referred to as a "Fund", collectively as the "Funds"). The Company applies investment company accounting and reporting guidance.
The accompanying consolidated financial statements relate to the Multi- Asset Portfolio. The Fund seeks total return. The Fund's ("Adviser"), Morgan Stanley Investment Management Inc., seeks to achieve this objective with an emphasis on positive absolute return and controlling downside portfolio risk.
The Fund offers five classes of shares — Class I, Class A, Class L, Class C and Class IS. On April, 30, 2015, the Fund suspended offering of Class L shares. Existing Class L shareholders may invest through reinvestment of dividends and distributions.
A. Significant Accounting Policies: The following significant accounting policies are in conformity with U.S. generally accepted accounting principles ("GAAP"). Such policies are consistently followed by the Company in the preparation of its consolidated financial statements. GAAP may require management to make estimates and assumptions that affect the reported amounts and disclosures in the consolidated financial statements. Actual results may differ from those estimates.
Effective October 3, 2016, the Fund may, consistent with its principal investment strategies, invest up to 25% of its total assets in a wholly-owned subsidiary of the Fund organized as a company under the laws of the Cayman Islands, Multi-Asset Cayman Portfolio, Ltd. (the "Subsidiary"). The Subsidiary may invest, directly or indirectly through the use of derivatives, in securities, commodities, commodity-related instruments and other investments, primarily futures, swaps and notes. The Fund is the sole shareholder of the Subsidiary, and it is not currently expected that shares of the Subsidiary will be sold or offered to other investors. The consolidated portfolio of investments and consolidated financial statements include the positions and accounts of the Fund and the Subsidiary. All intercompany accounts and transactions of the Fund and the Subsidiary have been eliminated in consolidation. As of December 31, 2017, the Subsidiary represented approximately $16,793,000 or approximately 23.22% of the total assets of the Fund.
Investments in the Subsidiary are expected to provide the Fund with exposure to the commodity markets within the limitations of Subchapter M of the Code and recent Internal Revenue Service ("IRS") revenue rulings, which require that a mutual fund receive no more than ten percent of its gross income from such investments in order to receive favorable tax treatment as a regulated investment company ("RIC"). Tax treatment of the income received from the Subsidiary may potentially be affected by changes in legislation, regulations or other legally binding authority, which could affect the character, timing and amount of the Fund's taxable income and distributions. If such changes occur, the Fund may need to significantly change its investment strategy and recognize unrealized gains in order to remain qualified for taxation as a RIC, which could adversely affect the Fund.
1. Security Valuation: (1) An equity portfolio security listed or traded on an exchange is valued at its latest reported sales price (or at the exchange official closing price if such exchange reports an official closing price), and if there were no sales on a given day and if there is no official exchange closing price for that day, the security is valued at the mean between the last reported bid and asked prices if such bid and asked prices are available on the relevant exchanges. Listed equity securities not traded on the valuation date with no reported bid and asked prices available on the exchange are valued at the mean between the current bid and asked prices obtained from one or more reputable brokers or dealers. In cases where a security is traded on more than one exchange, the security is valued on the exchange designated as the primary market; (2) all other equity portfolio securities for which over-the-counter ("OTC") market quotations are readily available are valued at the latest reported sales price (or at the market official closing price if such market reports an official closing price), and if there was no trading in the security on a given day and if there is no official closing price from relevant markets for that day, the security is valued at the mean between the last reported bid and asked prices if such bid and asked prices are available on the relevant markets. An unlisted equity security that does not trade on the valuation date and for which bid and asked prices from the relevant markets are unavailable is valued at the mean between the current bid and asked prices obtained from one or more reputable brokers or dealers; (3) certain portfolio securities may be valued by an outside pricing service/vendor approved by the Company's
36
Morgan Stanley Institutional Fund, Inc.
Annual Report — December 31, 2017
Notes to Consolidated Financial Statements (cont'd)
Board of Directors (the "Directors"). The pricing service/vendor may employ a pricing model that takes into account, among other things, bids, yield spreads, and/or other market data and specific security characteristics. Alternatively, if a valuation is not available from an outside pricing service/vendor, and the security trades on an exchange, the security may be valued at its latest reported sale price (or at the exchange official closing price if such exchange reports an official closing price), prior to the time when assets are valued. If there are no sales on a given day and if there is no official exchange closing price for that day, the security is valued at the mean between the last reported bid and asked prices if such bid and asked prices are available in the relevant exchanges; (4) futures are valued at the settlement price on the exchange on which they trade or, if a settlement price is unavailable, at the last sale price on the exchange; (5) OTC swaps may be valued by an outside pricing service approved by the Directors or quotes from a broker or dealer. Swaps cleared on a clearinghouse or exchange may be valued using the closing price provided by the clearinghouse or exchange; (6) when market quotations are not readily available, including circumstances under which the Adviser determines that the closing price, last sale price or the mean between the last reported bid and asked prices are not reflective of a security's market value, portfolio securities are valued at their fair value as determined in good faith under procedures established by and under the general supervision of the Directors. Occasionally, developments affecting the closing prices of securities and other assets may occur between the times at which valuations of such securities are determined (that is, close of the foreign market on which the securities trade) and the close of business of the New York Stock Exchange ("NYSE"). If developments occur during such periods that are expected to materially affect the value of such securities, such valuations may be adjusted to reflect the estimated fair value of such securities as of the close of the NYSE, as determined in good faith by the Directors or by the Adviser using a pricing service and/or procedures approved by the Directors; (7) quotations of foreign portfolio securities, other assets and liabilities and forward contracts stated in foreign currency are translated into U.S. dollar equivalents at the prevailing market rates prior to the close of the NYSE; (8) and investments in mutual funds, including the Morgan Stanley Institutional Liquidity Funds, are valued at the net asset value ("NAV") as of the close of each business day.
The Directors have responsibility for determining in good faith the fair value of the investments, and the Directors may appoint others, such as the Company's Adviser or a valuation committee, to assist the Directors in determining fair value and to make the actual calculations pursuant to the fair valuation methodologies previously approved by the Directors. Under procedures approved by the Directors, the Company's Adviser has formed a Valuation Committee whose members are approved by the Directors. The Valuation Committee provides administration and oversight of the Company's valuation policies and procedures, which are reviewed at least annually by the Directors. These procedures allow the Company to utilize independent pricing services, quotations from securities and financial instrument dealers, and other market sources to determine fair value.
The Company has procedures to determine the fair value of securities and other financial instruments for which market prices are not readily available. Under these procedures, the Valuation Committee convenes on a regular and ad hoc basis to review such securities and considers a number of factors, including valuation methodologies and significant unobservable valuation inputs, when arriving at fair value. The Valuation Committee may employ a market-based approach which may use related or comparable assets or liabilities, recent transactions, market multiples, book values, and other relevant information for the investment to determine the fair value of the investment. An income-based valuation approach may also be used in which the anticipated future cash flows of the investment are discounted to calculate fair value. Discounts may also be applied due to the nature or duration of any restrictions on the disposition of the investments. Due to the inherent uncertainty of valuations of such investments, the fair values may differ significantly from the values that would have been used had an active market existed. The Valuation Committee employs various methods for calibrating these valuation approaches including a regular review of valuation methodologies, key inputs and assumptions, transactional back-testing or disposition analysis, and reviews of any related market activity.
2. Fair Value Measurement: Financial Accounting Standards Board ("FASB") Accounting Standards CodificationTM ("ASC") 820, "Fair Value Measurement" ("ASC 820"), defines fair value as the value that the Fund would receive to sell an investment or pay to transfer a liability in a timely transaction with an independent buyer in the principal market, or in the absence of a principal market, the most advantageous market for the investment or
37
Morgan Stanley Institutional Fund, Inc.
Annual Report — December 31, 2017
Notes to Consolidated Financial Statements (cont'd)
liability. ASC 820 establishes a three-tier hierarchy to distinguish between (1) inputs that reflect the assumptions market participants would use in valuing an asset or liability developed based on market data obtained from sources independent of the reporting entity (observable inputs) and (2) inputs that reflect the reporting entity's own assumptions about the assumptions market participants would use in valuing an asset or liability developed based on the best information available in the circumstances (unobservable inputs) and to establish classification of fair value measurements for disclosure purposes. Various inputs are used in determining the value of the Fund's investments. The inputs are summarized in the three broad levels listed below.
• Level 1 – unadjusted quoted prices in active markets for identical investments
• Level 2 – other significant observable inputs (including quoted prices for similar investments, interest rates, prepayment speeds, credit risk, etc.)
• Level 3 – significant unobservable inputs including the Fund's own assumptions in determining the fair value of investments. Factors considered in making this determination may include, but are not limited to, information obtained by contacting the issuer, analysts, or the appropriate stock exchange (for exchange-traded securities), analysis of the issuer's financial statements or other available documents and, if necessary, available information concerning other securities in similar circumstances
The inputs or methodology used for valuing securities are not necessarily an indication of the risk associated with investing in those securities and the determination of the significance of a particular input to the fair value measurement in its entirety requires judgment and considers factors specific to each security.
The following is a summary of the inputs used to value the Fund's investments as of December 31, 2017.
Investment Type | | Level 1
Unadjusted
quoted
prices
(000) | | Level 2
Other
significant
observable
inputs
(000) | | Level 3
Significant
unobservable
inputs
(000) | | Total
(000) | |
Assets: | |
Common Stocks | |
Automobiles | | $ | — | | | $ | 862 | | | $ | — | | | $ | 862 | | |
Banks | | | — | | | | 4,763 | | | | — | | | | 4,763 | | |
Building Products | | | — | | | | 466 | | | | — | | | | 466 | | |
Capital Markets | | | — | | | | 643 | | | | — | | | | 643 | | |
Chemicals | | | — | | | | 8 | | | | — | | | | 8 | | |
Commercial Services &
Supplies | | | — | | | | 162 | | | | — | | | | 162 | | |
Construction & Engineering | | | — | | | | 1,924 | | | | — | | | | 1,924 | | |
Construction Materials | | | — | | | | 172 | | | | — | | | | 172 | | |
Consumer Finance | | | 7,095 | | | | — | | | | — | | | | 7,095 | | |
Diversified Financial
Services | | | — | | | | 204 | | | | — | | | | 204 | | |
Diversified
Telecommunication
Services | | | — | | | | — | @ | | | — | | | | — | @ | |
Electric Utilities | | | — | | | | 4 | | | | — | | | | 4 | | |
Equity Real Estate
Investment Trusts (REITs) | | | — | | | | — | @ | | | — | | | | — | @ | |
Food & Staples Retailing | | | — | | | | 51 | | | | — | | | | 51 | | |
Hotels, Restaurants &
Leisure | | | — | | | | 587 | | | | — | | | | 587 | | |
Information Technology
Services | | | — | | | | 1,199 | | | | — | | | | 1,199 | | |
Metals & Mining | | | — | | | | 60 | | | | — | | | | 60 | | �� |
Oil, Gas & Consumable
Fuels | | | — | | | | 321 | | | | — | | | | 321 | | |
Professional Services | | | — | | | | 1,255 | | | | — | | | | 1,255 | | |
Road & Rail | | | — | | | | 327 | | | | — | | | | 327 | | |
Semiconductors &
Semiconductor
Equipment | | | — | | | | — | | | | 1 | | | | 1 | | |
Trading Companies &
Distributors | | | — | | | | 178 | | | | — | | | | 178 | | |
Transportation
Infrastructure | | | — | | | | 970 | | | | — | | | | 970 | | |
Wireless
Telecommunication
Services | | | 20 | | | | 3 | | | | — | | | | 23 | | |
Total Common Stocks | | | 7,115 | | | | 14,159 | | | | 1 | | | | 21,275 | | |
Investment Company | | | 452 | | | | — | | | | — | | | | 452 | | |
Fixed Income Securities | |
Sovereign | | | — | | | | 12,630 | | | | — | | | | 12,630 | | |
U.S. Treasury Security | | | — | | | | 461 | | | | — | | | | 461 | | |
Total Fixed Income
Securities | | | — | | | | 13,091 | | | | — | | | | 13,091 | | |
Short-Term Investments | |
Investment Company | | | 28,990 | | | | — | | | | — | | | | 28,990 | | |
U.S. Treasury Securities | | | — | | | | 7,401 | | | | — | | | | 7,401 | | |
Total Short-Term
Investments | | | 28,990 | | | | 7,401 | | | | — | | | | 36,391 | | |
38
Morgan Stanley Institutional Fund, Inc.
Annual Report — December 31, 2017
Notes to Consolidated Financial Statements (cont'd)
Investment Type | | Level 1
Unadjusted
quoted
prices
(000) | | Level 2
Other
significant
observable
inputs
(000) | | Level 3
Significant
unobservable
inputs
(000) | | Total
(000) | |
Foreign Currency Forward
Exchange Contract | | $ | — | | | $ | 3,414 | | | $ | — | | | $ | 3,414 | | |
Futures Contracts | | | 199 | | | | — | | | | — | | | | 199 | | |
Interest Rate Swap
Agreements | | | — | | | | 841 | | | | — | | | | 841 | | |
Total Return Swap
Agreements | | | — | | | | 135 | | | | — | | | | 135 | | |
Total Assets | | | 36,756 | | | | 39,041 | | | | 1 | | | | 75,798 | | |
Liabilities: | |
Foreign Currency Forward
Exchange Contract | | | — | | | | (3,281 | ) | | | — | | | | (3,281 | ) | |
Futures Contracts | | | (644 | ) | | | — | | | | — | | | | (644 | ) | |
Interest Rate Swap
Agreements | | | — | | | | (272 | ) | | | — | | | | (272 | ) | |
Total Return Swap
Agreements | | | — | | | | (605 | ) | | | — | | | | (605 | ) | |
Total Liabilities | | | (644 | ) | | | (4,158 | ) | | | — | | | | (4,802 | ) | |
Total | | $ | 36,112 | | | $ | 34,883 | | | $ | 1 | | | $ | 70,996 | | |
@ Value is less than $500.
Transfers between investment levels may occur as the markets fluctuate and/or the availability of data used in an investment's valuation changes. The Fund recognizes transfers between the levels as of the end of the period. As of December 31, 2017, securities with a total value of approximately $11,811,000 transferred from Level 1 to Level 2. Securities that were valued using unadjusted
quoted prices at December 31, 2016 were valued using other significant observable inputs at December 31, 2017. At December 31, 2017, the fair value of certain securities were adjusted due to developments which occurred between the time of the close of the foreign markets on which they trade and the close of business on the NYSE which resulted in their Level 2 classification.
Following is a reconciliation of investments in which significant unobservable inputs (Level 3) were used in determining fair value.
| | | Common
Stocks
(000) | |
Beginning Balance | | $ | 2 | † | |
Purchases | | | — | | |
Sales | | | — | | |
Amortization of discount | | | — | | |
Transfers in | | | — | | |
Transfers out | | | — | | |
Corporate actions | | | (370 | ) | |
Change in unrealized appreciation | | | 369 | | |
Realized (losses) | | | — | | |
Ending Balance | | $ | 1 | | |
Net change in unrealized (depreciation) from investments
still held as of December 31, 2017 | | $ | (1 | ) | |
† Includes one security which is valued at zero.
The following table presents additional information about valuation techniques and inputs used for investments that are measured at fair value and categorized within Level 3 as of December 31, 2017.
| | | Fair Value at
December 31, 2017
(000) | | Valuation
Technique | | Unobservable
Input | | Range | | Selected
Value | | Impact to
Valuation from an
increase in input | |
Semiconductors & Semiconductor Equipment | |
Common Stock | | $ | 1 | | | Tangible Net Asset
Value Method | | Tangible Net Asset
Value Per Share | | $ | 0.004 | | | $ | 0.004 | | | $ | 0.004 | | | Increase | |
| | | | | | | Discount for
Recoverability of
Certain Assets | | | 75.0 | % | | | 75.0 | % | | | 75.0 | % | | Decrease | |
3. Foreign Currency Translation and Foreign Investments: The books and records of the Fund are maintained in U.S. dollars. Foreign currency amounts are translated into U.S. dollars as follows:
– investments, other assets and liabilities at the prevailing rate of exchange on the valuation date;
– investment transactions and investment income at the prevailing rates of exchange on the dates of such transactions.
Although the net assets of the Fund are presented at the foreign exchange rates and market values at the close of the period, the Fund does not isolate that portion of the results of operations arising as a result of changes in the foreign exchange rates from the fluctuations arising from changes in the market prices of securities held at period end. Similarly, the Fund does not isolate the effect of changes in foreign exchange rates from the fluctuations arising from changes in the market prices of securities sold during the period. Accordingly, realized
39
Morgan Stanley Institutional Fund, Inc.
Annual Report — December 31, 2017
Notes to Consolidated Financial Statements (cont'd)
and unrealized foreign currency gains (losses) on investments in securities are included in the reported net realized and unrealized gains (losses) on investment transactions and balances. However, pursuant to U.S. federal income tax regulations, gains and losses from certain foreign currency transactions and the foreign currency portion of gains and losses realized on sales and maturities of foreign denominated debt securities are treated as ordinary income for U.S. federal income tax purposes.
Net realized gains (losses) on foreign currency transactions represent net foreign exchange gains (losses) from foreign currency forward exchange contracts, disposition of foreign currencies, currency gains (losses) realized between the trade and settlement dates on securities transactions, and the difference between the amount of investment income and foreign withholding taxes recorded on the Fund's books and the U.S. dollar equivalent amounts actually received or paid. Net unrealized currency gains (losses) from valuing foreign currency denominated assets and liabilities at period end exchange rates are reflected as a component of unrealized appreciation (depreciation) in the Consolidated Statement of Assets and Liabilities. The change in unrealized currency gains (losses) on foreign currency translations for the period is reflected in the Consolidated Statement of Operations.
Foreign security and currency transactions may involve certain considerations and risks not typically associated with those of U.S. dollar denominated transactions as a result of, among other factors, fluctuations of exchange rates in relation to the U.S. dollar, the possibility of lower levels of governmental supervision and regulation of foreign securities markets and the possibility of political or economic instability.
Governmental approval for foreign investments may be required in advance of making an investment under certain circumstances in some countries, and the extent of foreign investments in domestic companies may be subject to limitation in other countries. Foreign ownership limitations also may be imposed by the charters of individual companies to prevent, among other concerns, violations of foreign investment limitations. As a result, an additional class of shares (identified as "Foreign" in the Consolidated Portfolio of Investments) may be created and offered for investment. The "local" and
"foreign shares" market values may differ. In the absence of trading of the foreign shares in such markets, the Fund values the foreign shares at the closing exchange price of the local shares.
4. Derivatives: The Fund may, but is not required to, use derivative instruments for a variety of purposes, including hedging, risk management, portfolio management or to earn income. Derivatives are financial instruments whose value is based, in part, on the value of an underlying asset, interest rate, index or financial instrument. Prevailing interest rates and volatility levels, among other things, also affect the value of derivative instruments. A derivative instrument often has risks similar to its underlying asset and may have additional risks, including imperfect correlation between the value of the derivative and the underlying asset, risks of default by the counterparty to certain transactions, magnification of losses incurred due to changes in the market value of the securities, instruments, indices or interest rates to which the derivative instrument relates, risks that the transactions may not be liquid and risks arising from margin requirements. The use of derivatives involves risks that are different from, and possibly greater than, the risks associated with other portfolio investments. Derivatives may involve the use of highly specialized instruments that require investment techniques and risk analyses different from those associated with other portfolio investments. All of the Fund's holdings, including derivative instruments, are marked-to-market each day with the change in value reflected in unrealized appreciation (depreciation). Upon disposition, a realized gain or loss is recognized.
Certain derivative transactions may give rise to a form of leverage. Leverage magnifies the potential for gain and the risk of loss. Leverage associated with derivative transactions may cause the Fund to liquidate portfolio positions when it may not be advantageous to do so to satisfy its obligations or to meet earmarking or segregation requirements, pursuant to applicable Securities and Exchange Commission ("SEC") rules and regulations, or may cause the Fund to be more volatile than if the Fund had not been leveraged. Although the Adviser seeks to use derivatives to further the Fund's investment objectives, there is no assurance that the use of derivatives will achieve this result.
40
Morgan Stanley Institutional Fund, Inc.
Annual Report — December 31, 2017
Notes to Consolidated Financial Statements (cont'd)
Following is a description of the derivative instruments and techniques that the Fund used during the period and their associated risks:
Foreign Currency Forward Exchange Contracts: In connection with its investments in foreign securities, the Fund also entered into contracts with banks, brokers or dealers to purchase or sell securities or foreign currencies at a future date. A foreign currency forward exchange contract ("currency contract") is a negotiated agreement between the contracting parties to exchange a specified amount of currency at a specified future time at a specified rate. The rate can be higher or lower than the spot rate between the currencies that are the subject of the contract. Currency contracts may be used to protect against uncertainty in the level of future foreign currency exchange rates or to gain or modify exposure to a particular currency. To the extent hedged by the use of currency contracts, the precise matching of the currency contract amounts and the value of the securities involved will not generally be possible because the future value of such securities in foreign currencies will change as a consequence of market movements in the value of those securities between the date on which the contract is entered into and the date it matures. Furthermore, such transactions may reduce or preclude the opportunity for gain if the value of the currency should move in the direction opposite to the position taken. There is additional risk to the extent that currency contracts create exposure to currencies in which the Fund's securities are not denominated. Unanticipated changes in currency prices may result in poorer overall performance for the Fund than if it had not entered into such contracts. The use of currency contracts involves the risk of loss from the insolvency or bankruptcy of the counterparty to the contract or the failure of the counterparty to make payments or otherwise comply with the terms of the contract. A currency contract is marked-to-market daily and the change in market value is recorded by the Fund as unrealized gain or loss. The Fund records realized gains (losses) when the currency contract is closed equal to the difference between the value of the currency contract at the time it was opened and the value at the time it was closed.
Futures: A futures contract is a standardized, exchange-traded agreement to buy or sell a specific quantity of an underlying asset, reference rate or index at a specific
price at a specific future time. The value of a futures contract tends to increase and decrease in tandem with the value of the underlying instrument. Depending on the terms of the particular contract, futures contracts are settled through either physical delivery of the underlying instrument on the settlement date or by payment of a cash settlement amount on the settlement date. During the period the futures contract is open, payments are received from or made to the broker based upon changes in the value of the contract (the variation margin). A decision as to whether, when and how to use futures contracts involves the exercise of skill and judgment and even a well-conceived futures transaction may be unsuccessful because of market behavior or unexpected events. In addition to the derivatives risks discussed above, the prices of futures contracts can be highly volatile, using futures contracts can lower total return, and the potential loss from futures contracts can exceed the Fund's initial investment in such contracts. No assurance can be given that a liquid market will exist for any particular futures contract at any particular time. There is also the risk of loss by the Fund of margin deposits in the event of bankruptcy of a broker with which the Fund has open positions in the futures contract.
Swaps: The Fund may enter into OTC swap contracts or cleared swap transactions. A swap contract is an agreement between two parties pursuant to which the parties exchange payments at specified dates on the basis of a specified notional amount, with the payments calculated by reference to specified securities, indices, reference rates, currencies or other instruments. Typically swap agreements provide that when the period payment dates for both parties are the same, the payments are made on a net basis (i.e., the two payment streams are netted out, with only the net amount paid by one party to the other). The Fund's obligations or rights under a swap contract entered into on a net basis will generally be equal only to the net amount to be paid or received under the agreement, based on the relative values of the positions held by each party. Cleared swap transactions may help reduce counterparty credit risk. In a cleared swap, the Fund's ultimate counterparty is a clearinghouse rather than a swap dealer, bank or other financial institution. OTC swap agreements are not entered into or traded on exchanges and often there is no central clearing or guaranty function for OTC swaps. These
41
Morgan Stanley Institutional Fund, Inc.
Annual Report — December 31, 2017
Notes to Consolidated Financial Statements (cont'd)
OTC swaps are often subject to credit risk or the risk of default or non-performance by the counterparty. Both OTC and cleared swaps could result in losses if interest rates, foreign currency exchange rates or other factors are not correctly anticipated by the Fund or if the reference index, security or investments do not perform as expected. During the period swap agreements are open, payments are received from or made to the clearinghouse or counterparty based upon changes in the value of the contract (variation margin). The Dodd-Frank Wall Street Reform and Consumer Protection Act and related regulatory developments require the clearing and exchange-trading of certain standardized swap transactions. Mandatory exchange-trading and clearing is occurring on a phased-in basis.
The Fund's use of swaps during the period included those based on the credit of an underlying security commonly referred to as "credit default swaps." The Fund may be either the buyer or seller in a credit default swap. Where the Fund is the buyer of a credit default swap contract, it would typically be entitled to receive the par (or other agreed-upon) value of a referenced debt obligation from the counterparty to the contract only in the event of a default or similar event by the issuer of the debt obligation. If no default occurs, the Fund would have paid to the counterparty a periodic stream of payments over the term of the contract and received no benefit from the contract. When the Fund is the seller of a credit default swap contract, it typically receives the stream of payments but is obligated to pay an amount equal to the par (or other agreed-upon) value of a referenced debt obligation upon the default or similar event by the issuer of the referenced debt obligation. The use of credit default swaps could result in losses to the Fund if the Adviser fails to correctly evaluate the creditworthiness of the issuer of the referenced debt obligation.
If the Fund is a seller of protection and a credit event occurs, as defined under the terms of that particular swap agreement, the Fund will either (i) pay to the buyer of protection an amount equal to the notional amount of the swap agreement and take delivery of the referenced obligation, other deliverable obligations or underlying securities comprising the referenced index or (ii) pay a net settlement amount in the form of cash or securities equal to the notional amount of the swap agreement less the recovery value of the referenced
obligation or underlying securities comprising the referenced index. If the Fund is a buyer of protection and a credit event occurs, as defined under the terms of that particular swap agreement, the Fund will either (i) receive from the seller of protection an amount equal to the notional amount of the swap agreement and deliver the referenced obligation, other deliverable obligations or underlying securities comprising the referenced index or (ii) receive a net settlement amount in the form of cash or securities equal to the notional amount of the swap agreement less the recovery value of the referenced obligation or underlying securities comprising the referenced index. Recovery values are estimated by market makers considering either industry standard recovery rates or entity specific factors and considerations until a credit event occurs. If a credit event has occurred, the recovery value is determined by a facilitated auction whereby a minimum number of allowable broker bids, together with a specified valuation method, are used to calculate the settlement value. The Fund's maximum risk of loss from counterparty risk, either as the protection seller or as the protection buyer, is the fair value of the swap agreement.
The current credit rating of each individual issuer is listed in the table following the Consolidated Portfolio of Investments and serves as an indicator of the current status of the payment/performance risk of the credit derivative. Alternatively, for credit default swaps on an index of credits, the quoted market prices and current values serve as an indicator of the current status of the payment/performance risk of the credit derivative. Generally, lower credit ratings and increasing market values, in absolute terms, represent a deterioration of the credit and a greater likelihood of an adverse credit event of the issuer.
When the Fund has an unrealized loss on a swap agreement, the Fund has instructed the custodian to pledge cash or liquid securities as collateral with a value approximately equal to the amount of the unrealized loss. Collateral pledges are monitored and subsequently adjusted if and when the swap valuations fluctuate. If applicable, cash collateral is included with "Due from (to) Broker" in the Consolidated Statement of Assets and Liabilities.
Upfront payments paid or received by the Fund will be reflected as an asset or liability, respectively, in the Consolidated Statement of Assets and Liabilities.
42
Morgan Stanley Institutional Fund, Inc.
Annual Report — December 31, 2017
Notes to Consolidated Financial Statements (cont'd)
FASB ASC 815, "Derivatives and Hedging" ("ASC 815"), is intended to improve financial reporting about derivative instruments by requiring enhanced disclosures to enable investors to better understand how and why the Fund uses derivative instruments, how these derivative instruments are accounted for and their effects on the Fund's financial position and results of operations.
The following tables set forth the fair value of the Fund's derivative contracts by primary risk exposure as of December 31, 2017.
| | | Asset Derivatives
Statement of Assets and
Liabilities Location | | Primary Risk
Exposure | | Value
(000) | |
Foreign Currency Forward
Exchange Contracts | | Unrealized Appreciation on
Foreign Currency Forward
Exchange Contracts | |
Currency Risk | | $ | 3,414 | | |
Futures Contracts | | Variation Margin on
Futures Contracts | |
Equity Risk | | | 113 | (a) | |
Futures Contracts | | Variation Margin on
Futures Contracts | | Interest Rate
Risk | | | 86 | (a) | |
Swap Agreements | | Unrealized Appreciation on
Swap Agreements | |
Equity Risk | | | 135 | | |
Swap Agreements | | Variation Margin on
Swap Agreements | | Interest Rate
Risk | | | 841 | (a) | |
Total | | | | | | $ | 4,589 | | |
| | | Liability Derivatives
Statement of Assets and
Liabilities Location | | Primary Risk
Exposure | | Value
(000) | |
Foreign Currency Forward
Exchange Contracts | | Unrealized Depreciation on
Foreign Currency Forward
Exchange Contracts | |
Currency Risk | | $ | (3,281 | ) | |
Futures Contract | | Variation Margin on
Futures Contract | | Commodity
Risk | | | (301 | )(a) | |
Futures Contract | | Variation Margin on
Futures Contract | |
Currency Risk | | | (244 | )(a) | |
Futures Contracts | | Variation Margin on
Futures Contracts | |
Equity Risk | | | (87 | )(a) | |
Futures Contract | | Variation Margin on
Futures Contract | | Interest Rate
Risk | | | (12 | )(a) | |
Swap Agreements | | Unrealized Depreciation on
Swap Agreements | |
Equity Risk | | | (605 | ) | |
Swap Agreements | | Variation Margin on
Swap Agreements | | Interest Rate
Risk | | | (272 | )(a) | |
Total | | | | | | $ | (4,802 | ) | |
(a) This amount represents the cumulative appreciation (depreciation) as reported in the Consolidated Portfolio of Investments. The Consolidated Statement of Assets and Liabilities only reflects the current day's net variation margin.
The following tables set forth by primary risk exposure the Fund's realized gains (losses) and change in unrealized appreciation (depreciation) by type of derivative contract for the year ended December 31, 2017 in accordance with ASC 815.
Realized Gain (Loss) | |
Primary Risk Exposure | | Derivative Type | | Value
(000) | |
Currency Risk | | Foreign Currency Forward
Exchange Contracts | | $ | 179 | | |
Commodity Risk | | Futures Contracts | | | (881 | ) | |
Currency Risk | | Futures Contracts | | | 16 | | |
Equity Risk | | Futures Contracts | | | (3,328 | ) | |
Interest Rate Risk | | Futures Contracts | | | (671 | ) | |
Credit Risk | | Swap Agreements | | | 140 | | |
Equity Risk | | Swap Agreements | | | (7,324 | ) | |
Interest Rate Risk | | Swap Agreements | | | 198 | | |
Total | | | | $ | (11,671 | ) | |
Change in Unrealized Appreciation (Depreciation) | |
Primary Risk Exposure | | Derivative Type | | Value
(000) | |
Currency Risk | | Foreign Currency Forward
Exchange Contracts | | $ | (1,811 | ) | |
Commodity Risk | | Futures Contracts | | | (516 | ) | |
Currency Risk | | Futures Contracts | | | (244 | ) | |
Equity Risk | | Futures Contracts | | | 504 | | |
Interest Rate Risk | | Futures Contracts | | | 90 | | |
Equity Risk | | Swap Agreements | | | 541 | | |
Credit Risk | | Swap Agreements | | | (126 | ) | |
Interest Rate Risk | | Swap Agreements | | | 1,419 | | |
Total | | | | $ | (143 | ) | |
At December 31, 2017, the Fund's derivative assets and liabilities are as follows:
Gross Amounts of Assets and Liabilities Presented in the
Consolidated Statement of Assets and Liabilities | |
Derivatives(b) | | Assets(c)
(000) | | Liabilities(c)
(000) | |
Foreign Currency Forward
Exchange Contracts | | $ | 3,414 | | | $ | (3,281 | ) | |
Swap Agreements | | | 135 | | | | (605 | ) | |
Total | | $ | 3,549 | | | $ | (3,886 | ) | |
(b) Excludes exchange traded derivatives.
(c) Absent an event of default or early termination, OTC derivative assets and liabilities are presented gross and not offset in the Consolidated Statement of Assets and Liabilities.
The Fund typically enters into International Swaps and Derivatives Association, Inc. Master Agreements ("ISDA Master Agreements") or similar master agreements (collectively, "Master Agreements") with its contract counterparties for certain OTC derivatives in order to, among other things, reduce its credit risk to counterparties. ISDA Master Agreements include provisions for general obligations, representations, collateral and events of default or termination. Under an ISDA Master Agreement, the Fund typically may offset with the counterparty certain OTC derivative financial instruments' payables and/or receivables with collateral held and/or posted and create one single net payment (close-out netting) in the event of default, termination and/or potential deterioration in the credit quality of
43
Morgan Stanley Institutional Fund, Inc.
Annual Report — December 31, 2017
Notes to Consolidated Financial Statements (cont'd)
the counterparty. Various Master Agreements govern the terms of certain transactions with counterparties, including transactions such as swap, forward, repurchase and reverse repurchase agreements. These Master Agreements typically attempt to reduce the counterparty risk associated with such transactions by specifying credit protection mechanisms and providing standardization that improves legal certainty. Cross-termination provisions under Master Agreements typically provide that a default in connection with one transaction between the Fund and a counterparty gives the non-defaulting party the right to terminate any other transactions in place with the defaulting party to create one single net payment due to/due from the defaulting party and may be a feature in certain Master Agreements. In the event the Fund exercises its right to terminate a Master Agreement after a counterparty experiences a termination event as defined in the Master Agreement, the return of collateral with market value in excess of the Fund's net liability may be delayed or denied.
The following tables present derivative financial instruments that are subject to enforceable netting arrangements as of December 31, 2017.
Gross Amounts Not Offset in the Consolidated Statement of Assets and Liabilities | |
Counterparty | | Gross Asset
Derivatives
Presented in
Consolidated
Statement of
Assets and
Liabilities
(000) | | Financial
Instrument
(000) | | Collateral
Received(d)
(000) | | Net Amount
(not less
than $0)
(000) | |
Bank of Montreal | | $ | 1 | | | $ | (1 | ) | | $ | — | | | $ | 0 | | |
Bank of New York Mellon | | | — | @ | | | — | | | | — | | | | — | @ | |
Barclays Bank PLC | | | 56 | | | | (56 | ) | | | — | | | | 0 | | |
BNP Paribas SA | | | 108 | | | | (108 | ) | | | — | | | | 0 | | |
Citibank NA | | | 3,128 | | | | (2,607 | ) | | | (285 | ) | | | 236 | | |
Commonwealth Bank of
Australia | | | 11 | | | | (11 | ) | | | — | | | | 0 | | |
Credit Suisse International | | | — | @ | | | (— | @) | | | — | | | | 0 | | |
Goldman Sachs
International | | | 41 | | | | (41 | ) | | | — | | | | 0 | | |
JPMorgan Chase Bank NA | | | 202 | | | | (202 | ) | | | — | | | | 0 | | |
State Street Bank and
Trust Co. | | | 2 | | | | (2 | ) | | | — | | | | 0 | | |
Total | | $ | 3,549 | | | $ | (3,028 | ) | | $ | (285 | ) | | $ | 236 | | |
(d) In some instances, the actual collateral received may be more than the amount shown here due to overcollateralization.
Gross Amounts Not Offset in the Consolidated Statement of Assets and Liabilities | |
Counterparty | | Gross Liability
Derivatives
Presented in
Consolidated
Statement of
Assets and
Liabilities
(000) | | Financial
Instrument
(000) | | Collateral
Pledged)(e)
(000) | | Net Amount
(not less
than $0)
(000) | |
Bank of America NA | | $ | 7 | | | $ | — | | | $ | — | | | $ | 7 | | |
Bank of Montreal | | | 5 | | | | (1 | ) | | | — | | | | 4 | | |
Barclays Bank PLC | | | 146 | | | | (56 | ) | | | — | | | | 90 | | |
BNP Paribas SA | | | 254 | | | | (108 | ) | | | (146 | ) | | | 0 | | |
Citibank NA | | | 2,607 | | | | (2,607 | ) | | | — | | | | 0 | | |
Commonwealth Bank of
Australia | | | 59 | | | | (11 | ) | | | — | | | | 48 | | |
Credit Suisse International | | | 9 | | | | (— | @) | | | — | | | | 9 | | |
Goldman Sachs
International | | | 354 | | | | (41 | ) | | | — | | | | 313 | | |
JPMorgan Chase Bank NA | | | 319 | | | | (202 | ) | | | — | | | | 117 | | |
State Street Bank and
Trust Co. | | | 37 | | | | (2 | ) | | | — | | | | 35 | | |
UBS AG | | | 89 | | | | — | | | | — | | | | 89 | | |
Total | | $ | 3,886 | | | $ | (3,028 | ) | | $ | (146 | ) | | $ | 712 | | |
(e) In some instances, the actual collateral pledged may be more than the amount shown here due to overcollateralization.
For the year ended December 31, 2017, the approximate average monthly amount outstanding for each derivative type is as follows:
Foreign Currency Forward Exchange Contracts: | |
Average monthly principal amount | | $ | 199,598,000 | | |
Futures Contracts: | |
Average monthly original value | | $ | 138,072,000 | | |
Swap Agreements: | |
Average monthly notional amount | | $ | 34,433,000 | | |
5. Indemnifications: The Company enters into contracts that contain a variety of indemnifications. The Company's maximum exposure under these arrangements is unknown. However, the Company has not had prior claims or losses pursuant to these contracts and expects the risk of loss to be remote.
6. Dividends and Distributions to Shareholders: Dividends and distributions to shareholders are recorded on the ex-dividend date. Dividends from net investment income, if any, are declared and paid annually. Net realized capital gains, if any, are distributed at least annually.
7. Security Transactions, Income and Expenses: Security transactions are accounted for on the trade date (date the order to buy or sell is executed). Realized gains and losses on the sale of investment securities are determined on the specific identified cost method. Dividend
44
Morgan Stanley Institutional Fund, Inc.
Annual Report — December 31, 2017
Notes to Consolidated Financial Statements (cont'd)
income and other distributions are recorded on the ex-dividend date (except for certain foreign dividends which may be recorded as soon as the Fund is informed of such dividends) net of applicable withholding taxes. Interest income is recognized on the accrual basis except where collection is in doubt. Discounts are accreted and premiums are amortized over the life of the respective securities. Most expenses of the Company can be directly attributed to a particular Fund. Expenses which cannot be directly attributed are apportioned among the Funds based upon relative net assets or other appropriate methods. Income, expenses (other than class specific expenses — distribution and shareholder services, transfer agency and sub transfer agency fees) and realized and unrealized gains or losses are allocated to each class of shares based upon their relative net assets.
The Fund owns shares of real estate investment trusts ("REITs") which report information on the source of their distributions annually in the following calendar year. A portion of distributions received from REITs during the year is estimated to be a return of capital and is recorded as a reduction of their cost.
B. Advisory Fees: The Adviser, a wholly-owned subsidiary of Morgan Stanley, provides the Fund with advisory services under the terms of an Investment Advisory Agreement, paid quarterly, at the annual rate based on the daily net assets as follows:
First $750
million | | Next $750
million | | Over $1.5
billion | |
| | 0.85 | % | | | 0.80 | % | | | 0.75 | % | |
For the year ended December 31, 2017, the advisory fee rate (net of waiver/rebate) was equivalent to an annual effective rate of 0.48% of the Fund's average daily net assets.
The Adviser has agreed to reduce its advisory fee and/or reimburse the Fund so that total annual portfolio operating expenses, excluding certain investment related expenses, taxes, interest and other extraordinary expenses (including litigation), will not exceed 1.10% for Class I shares, 1.45% for Class A shares, 1.95% for Class L shares, 2.20% for Class C shares and 1.07% for Class IS shares. The fee waivers and/or expense reimbursements will continue for at least one year from the date of the Fund's prospectus or until such time as the Directors act to discontinue all or a portion of such waivers and/or reimbursements when they deem such action is appropriate. For the year ended December 31, 2017, approximately $290,000 of advisory fees were waived and approximately
$33,000 of other expenses were reimbursed by the Adviser pursuant to this arrangement.
The Adviser provides investment advisory services to the Subsidiary pursuant to the Subsidiary Investment Management Agreement (the "Agreement"). Under the Agreement, the Subsidiary will pay the Adviser at the end of each fiscal quarter, calculated by applying a quarterly rate, based on the annual rate of 0.05%, to the average daily net assets of the Subsidiary.
The Adviser has agreed to waive its advisory fees by the amount of advisory fees it receives from the Subsidiary.
C. Administration Fees: The Adviser also serves as Administrator to the Company and provides administrative services pursuant to an Administration Agreement for an annual fee, accrued daily and paid monthly, of 0.08% of the Fund's average daily net assets.
Under a Sub-Administration Agreement between the Administrator and State Street Bank and Trust Company ("State Street"), State Street provides certain administrative services to the Company. For such services, the Administrator pays State Street a portion of the fee the Administrator receives from the Fund.
D. Distribution and Shareholder Services Fees: Morgan Stanley Distribution, Inc. ("MSDI" or the "Distributor"), a wholly-owned subsidiary of the Adviser and an indirect subsidiary of Morgan Stanley, serves as the Company's Distributor of Fund shares pursuant to a Distribution Agreement. The Company has adopted a Shareholder Services Plan with respect to Class A shares pursuant to Rule 12b-1 under the Act. Under the Shareholder Services Plan, the Fund pays the Distributor a shareholder services fee, accrued daily and paid monthly, at an annual rate of 0.25% of the Fund's average daily net assets attributable to Class A shares.
The Company has adopted a Distribution and Shareholder Services Plan with respect to Class L shares pursuant to Rule 12b-1 under the Act. Under the Distribution and Shareholder Services Plan, the Fund pays the Distributor a distribution fee, accrued daily and paid monthly, at an annual rate of 0.50% and a shareholder services fee, accrued daily and paid monthly, at an annual rate of 0.25% of the Fund's average daily net assets attributable to Class L shares.
The Company has adopted a Distribution and Shareholder Services Plan with respect to Class C shares pursuant to Rule 12b-1 under the Act. Under the Distribution and Shareholder Services Plan, the Fund pays the Distributor a
45
Morgan Stanley Institutional Fund, Inc.
Annual Report — December 31, 2017
Notes to Consolidated Financial Statements (cont'd)
distribution fee, accrued daily and paid monthly, at an annual rate of 0.75% and a shareholder services fee, accrued daily and paid monthly, at an annual rate of 0.25% of the Fund's average daily net assets attributable to Class C shares.
The distribution and shareholder services fees are used to support the expenses associated with servicing and maintaining accounts. The Distributor may compensate other parties for providing shareholder support services to investors who purchase Class A, Class L and Class C shares.
E. Dividend Disbursing and Transfer Agent: The Company's dividend disbursing and transfer agent is Boston Financial Data Services, Inc. ("BFDS"). Pursuant to a Transfer Agency Agreement, the Company pays BFDS a fee based on the number of classes, accounts and transactions relating to the Funds of the Company. Effective January 1, 2018, BFDS changed its name to DST Asset Manager Solutions, Inc.
F. Custodian Fees: State Street (the "Custodian") also serves as Custodian for the Company in accordance with a Custodian Agreement. The Custodian holds cash, securities, and other assets of the Company as required by the Act. Custody fees are payable monthly based on assets held in custody, investment purchases and sales activity and account maintenance fees, plus reimbursement for certain out-of-pocket expenses.
G. Security Transactions and Transactions with Affiliates: For the year ended December 31, 2017, purchases and sales of investment securities for the Fund, other than long-term U.S. Government securities and short-term investments, were approximately $127,763,000 and $134,623,000, respectively. For the year ended December 31, 2017, purchases and sales of long-term U.S. Government securities were approximately $22,394,000 and $21,893,000, respectively.
The Fund invests in the Institutional Class of the Morgan Stanley Institutional Liquidity Funds — Government Portfolio (the "Liquidity Funds"), an open-end management investment company managed by the Adviser. Advisory fees paid by the Fund are reduced by an amount equal to its pro-rata share of the advisory and administration fees paid by the Fund due to its investment in the Liquidity Funds. For the year ended December 31, 2017, advisory fees paid were reduced by approximately $64,000 relating to the Fund's investment in the Liquidity Funds.
A summary of the Fund's transactions in shares of the Liquidity Funds during the year ended December 31, 2017 is as follows:
Affiliated
Investment
Company | | Value
December 31,
2016
(000) | | Purchases
at Cost
(000) | | Proceeds
from Sales
(000) | | Dividend
Income
(000) | |
Liquidity Funds | | $ | 88,232 | | | $ | 152,743 | | | $ | 211,985 | | | $ | 281 | | |
Affiliated
Investment
Company (cont'd) | | Realized
Gain
(Loss)
(000) | | Change in
Unrealized
Appreciation
(Depreciation)
(000) | | Value
December 31,
2017
(000) | |
Liquidity Funds | | $ | — | | | $ | — | | | $ | 28,990 | | |
The Fund is permitted to purchase and sell securities ("cross-trade") from and to other Morgan Stanley Funds as well as other funds and client accounts for which the Adviser or an affiliate of the Adviser serves as investment adviser, pursuant to procedures approved by the Directors in compliance with Rule 17a-7 under the Act (the "Rule"). Each cross-trade is executed at the current market price in compliance with provisions of the Rule. For the year ended December 31, 2017, the Fund did not engage in any cross-trade transactions.
The Fund has an unfunded Deferred Compensation Plan (the "Compensation Plan"), which allows each independent Director to defer payment of all, or a portion, of the fees he or she receives for serving on the Board of Directors. Each eligible Director generally may elect to have the deferred amounts credited with a return equal to the total return on one or more of the Morgan Stanley funds that are offered as investment options under the Compensation Plan. Appreciation/depreciation and distributions received from these investments are recorded with an offsetting increase/decrease in the deferred compensation obligation and do not affect the NAV of the Fund.
H. Federal Income Taxes: It is the Fund's intention to continue to qualify as a regulated investment company and distribute all of its taxable and tax-exempt income. Accordingly, no provision for federal income taxes is required in the consolidated financial statements.
The Fund may be subject to taxes imposed by countries in which it invests. Such taxes are generally based on income and/or capital gains earned or repatriated. Taxes are accrued based on net investment income, net realized gains and net unrealized appreciation as such income and/or gains are earned or repatriated. Taxes may also be based on transactions in foreign currency and are accrued based on the value of investments denominated in such currency.
46
Morgan Stanley Institutional Fund, Inc.
Annual Report — December 31, 2017
Notes to Consolidated Financial Statements (cont'd)
FASB ASC 740-10, "Income Taxes — Overall", sets forth a minimum threshold for consolidated financial statement recognition of the benefit of a tax position taken or expected to be taken in a tax return. Management has concluded that there are no significant uncertain tax positions that would require recognition in the consolidated financial statements. If applicable, the Fund recognizes interest accrued related to unrecognized tax benefits in "Interest Expense" and penalties in "Other Expenses" in the Consolidated Statement of Operations. The Fund files tax returns with the U.S. Internal Revenue Service, New York and various states. Generally, each of the tax years in the four-year period ended December 31, 2017, remains subject to examination by taxing authorities.
The tax character of distributions paid may differ from the character of distributions shown in the Statements of Changes in Net Assets due to short-term capital gains being treated as ordinary income for tax purposes. The tax character of distributions paid during fiscal years 2017 and 2016 was as follows:
2017
Distributions
Paid From: | | 2016
Distributions
Paid From: | |
Ordinary
Income
(000) | | Long-Term
Capital Gain
(000) | | Ordinary
Income
(000) | | Long-Term
Capital Gain
(000) | |
| $ | — | | | $ | — | | | $ | 3,526 | | | $ | — | | |
The amount and character of income and gains to be distributed are determined in accordance with income tax regulations which may differ from GAAP. These book/tax differences are either considered temporary or permanent in nature.
Temporary differences are primarily due to differing book and tax treatments in the timing of the recognition of gains (losses) on certain investment transactions and the timing of the deductibility of certain expenses.
Permanent differences, primarily due to differing treatments of gains (losses) related to foreign currency transactions, tax adjustments on certain equity securities designated as issued by passive foreign investment companies, swap transactions, foreign capital gains tax and tax adjustments related to the Subsidiary, resulted in the following reclassifications among the components of net assets at December 31, 2017:
Accumulated
Net Investment
Loss
(000) | | Accumulated
Net Realized
Gain
(000) | | Paid-in-
Capital
(000) | |
| $ | (410 | ) | | $ | 930 | | | $ | (520 | ) | |
At December 31, 2017, the Fund had no distributable earnings on a tax basis.
At December 31, 2017, the Fund had available for federal income tax purposes unused short-term and long-term capital losses of approximately $84,170,000 and $3,767,000, respectively, that do not have an expiration date
To the extent that capital loss carryforwards are used to offset any future capital gains realized, no capital gains tax liability will be incurred by the Fund for gains realized and not distributed. To the extent that capital gains are offset, such gains will not be distributed to the shareholders.
Qualified late year losses are capital losses and specified ordinary losses, including currency losses, incurred after October 31 but within the taxable year that, if elected, are deemed to arise on the first day of the Fund's next taxable year. For the year ended December 31, 2017, the Fund deferred to January 1, 2018 for U.S. federal income tax purposes the following losses:
Qualified Late
Year Ordinary
Losses
(000) | | Post-October
Capital
Losses
(000) | |
| $ | 476 | | | $ | — | | |
I. Credit Facility: The Company and other Morgan Stanley funds participated in a $150,000,000 committed, unsecured revolving line of credit facility (the "Facility") with State Street. This Facility is to be used for temporary emergency purposes or funding of shareholder redemption requests. The interest rate on borrowings is based on the federal funds rate or 1 month LIBOR rate plus a spread. The Facility also has a commitment fee of 0.25% per annum based on the unused portion of the Facility. During the year ended December 31, 2017, the Fund did not have any borrowings under the Facility.
J. Other: At December 31, 2017, the Fund had record owners of 10% or greater. Investment activities of these shareholders could have a material impact on the Fund. The aggregate percentage of such owners was 89.6%.
47
Morgan Stanley Institutional Fund, Inc.
Annual Report — December 31, 2017
Report of Independent Registered Public Accounting Firm
To the Shareholders and Board of Directors of
Morgan Stanley Institutional Fund, Inc. —
Multi-Asset Portfolio
Opinion on the Financial Statements
We have audited the accompanying consolidated statement of assets and liabilities of Multi-Asset Portfolio (the "Fund") (one of the funds constituting the Morgan Stanley Institutional Fund, Inc. (the "Company")), including the consolidated portfolio of investments, as of December 31, 2017, and the related consolidated statement of operations for the year then ended, the consolidated statements of changes in net assets for each of the two years in the period then ended, the consolidated financial highlights for each of the five years in the period then ended and the related notes (collectively referred to as the "consolidated financial statements"). In our opinion, the consolidated financial statements present fairly, in all material respects, the financial position of Multi-Asset Portfolio (one of the funds constituting Morgan Stanley Institutional Fund, Inc.) at December 31, 2017, the consolidated results of its operations for the year then ended, the consolidated changes in its net assets for each of the two years in the period then ended and its consolidated financial highlights for each of the five years in the period then ended, in conformity with U.S. generally accepted accounting principles.
Basis for Opinion
These consolidated financial statements are the responsibility of the Company's management. Our responsibility is to express an opinion on the Fund's consolidated financial statements based on our audits. We are a public accounting firm registered with the Public Company Accounting Oversight Board (United States) ("PCAOB") and are required to be independent with respect to the Company in accordance with the U.S. federal securities law and the applicable rules and regulations of the Securities and Exchange Commission and the PCAOB.
We conducted our audits in accordance with the standards of the PCAOB. Those standards require that we plan and perform the audit to obtain reasonable assurance about whether the financial statements are free of material misstatement, whether due to error or fraud. The Company is not required to have, nor were we engaged to perform, an audit of the Company's internal control over financial reporting. As part of our audits, we are required to obtain an understanding of internal control over financial reporting, but not for the purpose of expressing an opinion on the effectiveness of the Company's internal control over financial reporting. Accordingly, we express no such opinion.
Our audits included performing procedures to assess the risks of material misstatement of the financial statements, whether due to error or fraud, and performing procedures that respond to those risks. Such procedures included examining, on a test basis, evidence regarding the amounts and disclosures in the financial statements. Our procedures included confirmation of securities owned as of December 31, 2017 by correspondence with the custodian and others or by other appropriate auditing procedures where replies from others were not received. Our audits also included evaluating the accounting principles used and significant estimates made by management, as well as evaluating the overall presentation of the financial statements. We believe that our audits provide a reasonable basis for our opinion.

We have served as the auditor of one or more Morgan Stanley investment companies since 2000.
Boston, Massachusetts
February 26, 2018
48
Morgan Stanley Institutional Fund, Inc.
Annual Report — December 31, 2017
Privacy Notice (unaudited)
MORGAN STANLEY INVESTMENT MANAGEMENT INC.
AN IMPORTANT NOTICE CONCERNING OUR U.S. PRIVACY POLICY
We are required by federal law to provide you with a copy of our privacy policy annually. This policy applies to current and former individual investors in funds managed or sponsored by Morgan Stanley Investment Management Inc. ("MSIM") as well as current and former individual clients of MSIM. This policy is not applicable to partnerships, corporations, trusts or other non-individual clients or investors. Please note that we may amend this policy at any time, and will inform you of any changes as required by law.
WE RESPECT YOUR PRIVACY
We appreciate that you have provided us with your personal financial information. We strive to maintain the privacy of such information while we help you achieve your financial objectives. This Notice describes what non-public personal information we collect about you, why we collect it, when we may share it with others and how certain others may use it. It discusses the steps you may take to limit our sharing of certain information about you to affiliated companies in the Morgan Stanley family of companies ("other Morgan Stanley companies"). It also discloses how you may limit use of certain shared information for marketing purposes by other Morgan Stanley branded companies. Throughout this policy, we refer to the non-public information that personally identifies you or your accounts as "personal information.''
1. WHAT PERSONAL INFORMATION DO WE COLLECT ABOUT YOU?
We obtain personal information from applications and other forms you submit to us, from your dealings with us, from consumer reporting agencies, from our Web sites and from third parties and other sources.
For example:
• We may collect information such as your name, address, e-mail address, telephone/fax numbers, assets, income and investment objectives through subscription documents, applications and other forms you submit to us.
• We may obtain information about account balances, your use of account(s) and the types of products and services you prefer to receive from us through your dealings and transactions with us and other sources.
• We may obtain information about your creditworthiness and credit history from consumer reporting agencies.
• We may collect background information from and through third-party vendors to verify representations you have made and to comply with various regulatory requirements.
• If you interact with us through our public and private Web sites, we may collect information that you provide directly through online communications (such as an e-mail address). We may also collect information about your Internet service provider, your domain name, your computer's operating system and Web browser, your use of our Web sites and your product and service preferences, through the use of "cookies." Please consult the Terms of Use of these sites for more details.
2. WHEN DO WE DISCLOSE PERSONAL INFORMATION WE COLLECT ABOUT YOU?
We may disclose personal information we collect about you to other Morgan Stanley companies and to non-affiliated third parties.
a. Information We Disclose to Other Morgan Stanley Companies.
We may disclose personal information to other Morgan Stanley companies for a variety of reasons, including to manage your account(s) effectively, to service and process your transactions, to let you know about products and services offered by us and other Morgan Stanley companies, to manage our business, and as otherwise required or permitted by law. Offers for products and services from other Morgan Stanley companies are developed under conditions designed to safeguard your personal information.
49
Morgan Stanley Institutional Fund, Inc.
Annual Report — December 31, 2017
Privacy Notice (unaudited) (cont'd)
b. Information We Disclose to Non-affiliated Third Parties.
We do not disclose personal information that we collect about you to non-affiliated third parties except to those who provide marketing services on our behalf, to financial institutions with whom we have joint marketing agreements, and as otherwise required or permitted by law. For example, we may disclose personal information to non-affiliated third parties for servicing and processing transactions, to offer our own products and services, to protect against fraud, for institutional risk control, to respond to judicial process or to perform services on our behalf. When we share personal information with a non-affiliated third party, they are required to limit their use of personal information to the particular purpose for which it was shared and they are not allowed to share personal information with others except to fulfill that limited purpose or as may be permitted or required by law.
3. HOW DO WE PROTECT THE SECURITY AND CONFIDENTIALITY OF PERSONAL INFORMATION WE COLLECT ABOUT YOU?
We maintain physical, electronic and procedural security measures to help safeguard the personal information we collect about you. We have internal policies governing the proper handling of client information. Third parties that provide support or marketing services on our behalf may also receive personal information, and we require them to adhere to confidentiality standards with respect to such information.
4. HOW CAN YOU LIMIT THE SHARING OF CERTAIN TYPES OF PERSONAL INFORMATION WITH OTHER MORGAN STANLEY COMPANIES?
We offer you choices as to whether we share with other Morgan Stanley companies the personal information that was collected to determine your eligibility for products and services you request ("eligibility information"). Eligibility information does not include your identification information or personal information pertaining to our transactions or experiences with you. Please note that, even if you direct us not to share eligibility information with other Morgan Stanley companies ("opt-out"), we may still share personal information, including eligibility information, with those companies in circumstances excluded from the opt-out under applicable law, such as to process transactions or to service your account.
5. HOW CAN YOU LIMIT THE USE OF CERTAIN TYPES OF PERSONAL INFORMATION BY OTHER MORGAN STANLEY COMPANIES FOR MARKETING?
By following the opt-out instructions in Section 6 below, you may limit other Morgan Stanley branded companies from marketing their products or services to you based on personal information we disclose to them. This information may include, for example, your income and account history with us. Please note that, even if you choose to limit Other Morgan Stanley Companies from using personal information about you that we may share with them for marketing their products and services to you, Other Morgan Stanley Companies may use your personal information that they obtain from us to market to you in circumstances permitted by law, such as if the Other Morgan Stanley Company has its own relationship with you.
6. HOW CAN YOU SEND US AN OPT-OUT INSTRUCTION?
If you wish to limit our sharing of eligibility information about you with other Morgan Stanley companies or other Morgan Stanley companies' use of personal information for marketing purposes, as described in this notice, you may do so by:
• Calling us at (800) 548-7786
Monday–Friday between 8a.m. and 6p.m.(EST)
• Writing to us at the following address:
DST Asset Manager Solutions, Inc.
c/o Privacy Coordinator
P.O. Box 219804
Kansas City, Missouri 64121
50
Morgan Stanley Institutional Fund, Inc.
Annual Report — December 31, 2017
Privacy Notice (unaudited) (cont'd)
Your written request should include your name, address, telephone number and account number(s) to which the opt-out applies and whether you are opting out with respect to sharing of eligibility information (Section 4 above), or if information used for Marketing (Section 5 above) or both. Written opt-out requests should not be sent with any other correspondence. In order to process your request, we require that the request be provided by you directly and not through a third party.
Your opt-out preference will remain in effect with respect to this policy (as it may be amended) until you notify us otherwise. If you have a joint account, your direction for us not to share this information with other Morgan Stanley companies and for those other Morgan Stanley companies not to use your personal information for marketing will be applied to all account holders on that account. Please understand that if you limit our sharing or our affiliated companies' use of personal information, you and any joint account holder(s) may not receive information about Morgan Stanley products and services, including products or services that could help you manage your financial resources and achieve your investment objectives.
7. WHAT IF AN AFFILIATED COMPANY BECOMES A NON-AFFILIATED THIRD PARTY?
If, at any time in the future, an affiliated company becomes a non-affiliated third party, further disclosures of personal information made to the former affiliated company will be limited to those described in Section 2(b) above relating to non-affiliated third parties. If you elected under Section 6 to limit disclosures we make to affiliated companies, or use of personal information by affiliated companies, your election will not apply to use by any former affiliated company of your personal information in their possession once it becomes a non-affiliated third party.
SPECIAL NOTICE TO RESIDENTS OF VERMONT
The following section supplements our policy with respect to our individual clients who have a Vermont address and supersedes anything to the contrary in the above policy with respect to those clients only.
The state of Vermont requires financial institutions to obtain your consent prior to sharing personal information that they collect about you with affiliated companies and non-affiliated third parties other than in certain limited circumstances. Except as permitted by law, we will not share personal information we collect about you with non-affiliated third parties or other Morgan Stanley companies unless you provide us with your written consent to share such information ("opt-in").
If you wish to receive offers for investment products and services offered by or through other Morgan Stanley companies, please notify us in writing at the following address:
DST Asset Manager Solutions, Inc.
c/o Privacy Coordinator
P.O. Box 219804
Kansas City, Missouri 64121
Your authorization should include your name, address, telephone number and account number(s) to which the opt-in applies and should not be sent with any other correspondence. In order to process your authorization, we require that the authorization be provided by you directly and not through a third party.
SPECIAL NOTICE TO RESIDENTS OF CALIFORNIA
The following section supplements our policy with respect to our individual clients who have a California address and supersedes anything to the contrary in the above policy with respect to those clients only.
In response to a California law, if your account has a California home address, your personal information will not be disclosed to non-affiliated third parties except as permitted by applicable California law, and we will limit sharing such information with our affiliates to comply with California privacy laws that apply to us.
51
Morgan Stanley Institutional Fund, Inc.
Annual Report — December 31, 2017
Director and Officer Information (unaudited)
Independent Directors:
Name, Age and Address of
Independent Director | | Position(s)
Held with
Registrant | | Length of Time
Served* | | Principal Occupation(s) During Past 5 Years
and Other Relevant Professional Experience | | Number of
Portfolios in
Fund Complex
Overseen by
Independent
Director** | | Other Directorships
Held by Independent
Director*** | |
Frank L. Bowman (73)
c/o Perkins Coie LLP
Counsel to the Independent
Directors
30 Rockefeller Plaza
New York, NY 10112 | | Director | | Since
August
2006 | | President, Strategic Decisions, LLC (consulting) (since February 2009); Director or Trustee of various Morgan Stanley Funds (since August 2006); Chairperson of the Compliance and Insurance Committee (since October 2015); formerly, Chairperson of the Insurance Sub-Committee of the Compliance and Insurance Committee (2007-2015); served as President and Chief Executive Officer of the Nuclear Energy Institute (policy organization) (February 2005-November 2008); retired as Admiral, U.S. Navy after serving over 38 years on active duty including 8 years as Director of the Naval Nuclear Propulsion Program in the Department of the Navy and the U.S. Department of Energy (1996-2004); served as Chief of Naval Personnel (July 1994-September 1996) and on the Joint Staff as Director of Political Military Affairs (June 1992-July 1994); knighted as Honorary Knight Commander of the Most Excellent Order of the British Empire; awarded the Officier de l'Orde National du Mérite by the French Government; elected to the National Academy of Engineering (2009). | | | 88 | | | Director of BP p.l.c.; Director of Naval and Nuclear Technologies LLP; Director Emeritus of the Armed Services YMCA; Director of the U.S. Naval Submarine League; Member of the National Security Advisory Council of the Center for U.S. Global Engagement and a member of the CNA Military Advisory Board; Trustee of Fairhaven United Methodist Church; and Director of other various non-profit organizations. | |
Kathleen A. Dennis (64)
c/o Perkins Coie LLP
Counsel to the Independent Directors
30 Rockefeller Plaza
New York, NY 10112 | | Director | | Since
August
2006 | | President, Cedarwood Associates (mutual fund and investment management consulting) (since July 2006); Chairperson of the Liquidity and Alternatives Sub-Committee of the Investment Committee (since October 2006) and Director or Trustee of various Morgan Stanley Funds (since August 2006); formerly, Senior Managing Director of Victory Capital Management (1993-2006). | | | 89 | | | Director of various non-profit organizations. | |
Nancy C. Everett (62)
c/o Perkins Coie LLP
Counsel to the Independent Directors
30 Rockefeller Plaza
New York, NY 10112 | | Director | | Since
January
2015 | | Chief Executive Officer, Virginia Commonwealth University Investment Company (since November 2015); Owner, OBIR, LLC (institutional investment management consulting) (since June 2014); formerly, Managing Director, BlackRock Inc. (February 2011-December 2013); and Chief Executive Officer, General Motors Asset Management (a/k/a Promark Global Advisors, Inc.) (June 2005-May 2010). | | | 90 | | | Formerly, Member of Virginia Commonwealth University School of Business Foundation (2005-2016); Member of Virginia Commonwealth University Board of Visitors (2013-2015); Member of Committee on Directors for Emerging Markets Growth Fund, Inc. (2007-2010); Chairperson of Performance Equity Management, LLC (2006-2010); and Chairperson, GMAM Absolute Return Strategies Fund, LLC (2006-2010). | |
52
Morgan Stanley Institutional Fund, Inc.
Annual Report — December 31, 2017
Director and Officer Information (unaudited) (cont'd)
Independent Directors: (cont'd)
Name, Age and Address of
Independent Director | | Position(s)
Held with
Registrant | | Length of Time
Served* | | Principal Occupation(s) During Past 5 Years
and Other Relevant Professional Experience | | Number of
Portfolios in
Fund Complex
Overseen by
Independent
Director** | | Other Directorships
Held by Independent
Director*** | |
Jakki L. Haussler (60)
c/o Perkins Coie LLP
Counsel to the Independent Directors
30 Rockefeller Plaza
New York, NY 10112 | | Director | | Since
January
2015 | | Chairman and Chief Executive Officer, Opus Capital Group (since January 1996); formerly, Director, Capvest Venture Fund, LP (May 2000-December 2011); Partner, Adena Ventures, LP (July 1999-December 2010); Director, The Victory Funds (February 2005-July 2008). | | | 90 | | | Director of Cincinnati Bell Inc. and Member, Audit Committee and Compensation Committee; Director of Northern Kentucky University Foundation and Member, Investment Committee; Member of Chase College of Law Transactional Law Practice Center Board of Advisors; Director of Best Transport; Director of Chase College of Law Board of Visitors; formerly, Member, University of Cincinnati Foundation Investment Committee; Member, Miami University Board of Visitors (2008-2011); Trustee of Victory Funds (2005-2008) and Chairman, Investment Committee (2007-2008) and Member, Service Provider Committee (2005-2008). | |
Dr. Manuel H. Johnson (68)
c/o Johnson Smick
International, Inc.
220 I Street, NE — Suite 200
Washington, D.C. 20002 | | Director | | Since
July
1991 | | Senior Partner, Johnson Smick International, Inc. (consulting firm); Chairperson of the Investment Committee (since October 2006) and Director or Trustee of various Morgan Stanley Funds (since July 1991); Co-Chairman and a founder of the Group of Seven Council (G7C) (international economic commission); formerly, Chairperson of the Audit Committee (July 1991-September 2006), Vice Chairman of the Board of Governors of the Federal Reserve System and Assistant Secretary of the U.S. Treasury. | | | 88 | | | Director of NVR, Inc. (home construction). | |
Joseph J. Kearns (75)
c/o Kearns & Associates LLC
46 E Peninsula Center #385
Rolling Hills Estates, CA
90274-3712 | | Director | | Since
August
1994 | | Senior Adviser, Kearns & Associates LLC (investment consulting); Chairperson of the Audit Committee (since October 2006) and Director or Trustee of various Morgan Stanley Funds (since August 1994); formerly, Deputy Chairperson of the Audit Committee (July 2003-September 2006) and Chairperson of the Audit Committee of various Morgan Stanley Funds (since August 1994); CFO of the J. Paul Getty Trust. | | | 89 | | | Prior to August 10, 2016, Director of Electro Rent Corporation (equipment leasing); Prior to December 31, 2013, Director of The Ford Family Foundation. | |
53
Morgan Stanley Institutional Fund, Inc.
Annual Report — December 31, 2017
Director and Officer Information (unaudited) (cont'd)
Independent Directors: (cont'd)
Name, Age and Address of
Independent Director | | Position(s)
Held with
Registrant | | Length of Time
Served* | | Principal Occupation(s) During Past 5 Years
and Other Relevant Professional Experience | | Number of
Portfolios in
Fund Complex
Overseen by
Independent
Director** | | Other Directorships
Held by Independent
Director*** | |
Michael F. Klein (59)
c/o Perkins Coie LLP
Counsel to the Independent Directors
30 Rockefeller Plaza
New York, NY 10112 | | Director | | Since
August
2006 | | Managing Director, Aetos Capital, LLC (since March 2000); Co-President, Aetos Alternatives Management, LLC (since January 2004) and Co-Chief Executive Officer of Aetos Capital LLC (since August 2013); Chairperson of the Fixed Income Sub-Committee of the Investment Committee (since October 2006) and Director or Trustee of various Morgan Stanley Funds (since August 2006); formerly, Managing Director, Morgan Stanley & Co. Inc. and Morgan Stanley Dean Witter Investment Management, President, various Morgan Stanley Funds (June 1998-March 2000) and Principal, Morgan Stanley & Co. Inc. and Morgan Stanley Dean Witter Investment Management (August 1997-December 1999). | | | 88 | | | Director of certain investment funds managed or sponsored by Aetos Capital, LLC; Director of Sanitized AG and Sanitized Marketing AG (specialty chemicals). | |
Patricia Maleski (57)
c/o Perkins Coie LLP
Counsel to the Independent Directors
30 Rockefeller Plaza
New York, NY 10112 | | Director | | Since
January
2017 | | Managing Director, JPMorgan Asset Management (2004-2016); Oversight and Control Head of Fiduciary and Conflicts of Interest Program (2015-2016); Chief Control Officer-Global Asset Management (2013-2015); President, JPMorgan Funds (2010-2013); Chief Administrative Officer (2004-2013); various other positions including Treasurer and Board Liaison (since 2001). | | | 90 | | | None. | |
Michael E. Nugent (81)
522 Fifth Avenue
New York, NY 10036 | | Chair of the Board and Director | | Chair of the Boards since July 2006 and Director since July 1991 | | Chair of the Boards of various Morgan Stanley Funds (since July 2006); Chairperson of the Closed-End Fund Committee (since June 2012) and Director or Trustee of various Morgan Stanley Funds (since July 1991); formerly, Chairperson of the Insurance Committee (until July 2006); General Partner, Triumph Capital, L.P. (private investment partnership) (1988-2013). | | | 88 | | | None. | |
W. Allen Reed (70)
c/o Perkins Coie LLP
Counsel to the Independent Directors
30 Rockefeller Plaza
New York, NY 10112 | | Director | | Since
August
2006 | | Chairperson of the Equity Sub-Committee of the Investment Committee (since October 2006) and Director or Trustee of various Morgan Stanley Funds (since August 2006); formerly, President and CEO of General Motors Asset Management; Chairman and Chief Executive Officer of the GM Trust Bank and Corporate Vice President of General Motors Corporation (August 1994-December 2005). | | | 89 | | | Director of Legg Mason, Inc.; formerly, Director of the Auburn University Foundation (2010-2015). | |
Fergus Reid (85)
c/o Joe Pietryka, Inc.
85 Charles Colman Blvd.
Pawling, NY 12564 | | Director | | Since
June
1992 | | Chairman, Joe Pietryka, Inc.; Chairperson of the Governance Committee and Director or Trustee of various Morgan Stanley Funds (since June 1992). | | | 89 | | | Formerly, Trustee and Director of certain investment companies in the JP Morgan Fund Complex managed by JP Morgan Investment Management Inc. (1987-2012). | |
* This is the earliest date the Director began serving the Morgan Stanley Funds. Each Director serves an indefinite term, until his or her successor is elected.
** The Fund Complex includes (as of December 31, 2017) all open-end and closed-end funds (including all of their portfolios) advised by Morgan Stanley Investment Management Inc. (the "Adviser") and any funds that have an adviser that is an affiliated person of the Adviser (including, but not limited to, Morgan Stanley AIP GP LP).
*** This includes any directorships at public companies and registered investment companies held by the Director at any time during the past five years.
54
Morgan Stanley Institutional Fund, Inc.
Annual Report — December 31, 2017
Director and Officer Information (unaudited) (cont'd)
Executive Officers:
Name, Age and Address of Executive Officer | | Position(s) Held
with
Registrant | | Length of Time
Served* | | Principal Occupation(s) During Past 5 Years | |
John H. Gernon (54)
522 Fifth Avenue
New York, NY 10036 | | President and Principal Executive Officer | | Since
September
2013 | | President and Principal Executive Officer of the Equity and Fixed Income Funds and the Morgan Stanley AIP Funds (since September 2013) and the Liquidity Funds and various money market funds (since May 2014) in the Fund Complex; Managing Director of the Adviser; Head of Product (since 2006). | |
Timothy J. Knierim (58)
522 Fifth Avenue
New York, NY 10036 | | Chief Compliance Officer | | Since
December
2016 | | Managing Director of the Adviser and various entities affiliated with the Adviser; Chief Compliance Officer of various Morgan Stanley Funds and the Adviser (since December 2016) and Chief Compliance Officer of Morgan Stanley AIP GP LP (since 2014). Formerly, Managing Director and Deputy Chief Compliance Officer of the Adviser (2014-2016); and formerly, Chief Compliance Officer of Prudential Investment Management, Inc. (2007-2014). | |
Francis J. Smith (52)
522 Fifth Avenue
New York, NY 10036 | | Treasurer and Principal Financial Officer | | Treasurer since July 2003 and Principal Financial Officer since September 2002 | | Manging Director of the Adviser and various entities affiliated with the Adviser; Treasurer (since July 2003) and Principal Financial Officer of various Morgan Stanley Funds (since September 2002). | |
Mary E. Mullin (50)
522 Fifth Avenue
New York, NY 10036 | | Secretary | | Since
June
1999 | | Managing Director of the Adviser; Secretary of various Morgan Stanley Funds (since June 1999). | |
Michael J. Key (38)
522 Fifth Avenue
New York, NY 10036 | | Vice President | | Since
June
2017 | | Vice President of the Equity and Fixed Income Funds, Liquidity Funds, various money market funds and the Morgan Stanley AIP Funds in the Fund Complex (since June 2017); Executive Director of the Adviser; Head of Product Development for Equity and Fixed Income Funds (since August 2013). | |
* This is the earliest date the officer began serving the Morgan Stanley Funds. Each officer serves a one-year term, until his or her successor is elected and qualifies.
55
Morgan Stanley Institutional Fund, Inc.
Annual Report — December 31, 2017
Adviser and Administrator
Morgan Stanley Investment Management Inc.
522 Fifth Avenue
New York, New York 10036
Distributor
Morgan Stanley Distribution, Inc.
522 Fifth Avenue
New York, New York 10036
Dividend Disbursing and Transfer Agent
DST Asset Manager Solutions, Inc.
2000 Crown Colony Drive
Quincy, Massachusetts 02169
Custodian
State Street Bank and Trust Company
One Lincoln Street
Boston, Massachusetts 02111
Legal Counsel
Dechert LLP
1095 Avenue of the Americas
New York, New York 10036
Counsel to the Independent Directors
Perkins Coie LLP
30 Rockefeller Plaza
New York, New York 10112
Independent Registered Public Accounting Firm
Ernst & Young LLP
200 Clarendon Street
Boston, Massachusetts 02116
Reporting to Shareholders
Each Morgan Stanley Fund provides a complete schedule of portfolio holdings in its semi-annual and annual reports within 60 days of the end of the fund's second and fourth fiscal quarters. The semi-annual and annual reports are filed electronically with the Securities and Exchange Commission (SEC) on Form N-CSRS and Form N-CSR, respectively. Morgan Stanley also delivers the semi-annual and annual reports to fund shareholders and makes these reports available on its public website, www.morganstanley.com/im. Each Morgan Stanley fund also files a complete schedule of portfolio holdings with the SEC for the fund's first and third fiscal quarters on Form N-Q. Morgan Stanley does not deliver the reports for the first and third fiscal quarters to shareholders, nor are the reports posted to the Morgan Stanley public website. You may, however, obtain the Form N-Q filings (as well as the Form N-CSR and N-CSRS filings) by accessing the SEC's website, www.sec.gov. You may also review and copy them at the SEC's Public Reference Room in Washington, DC. Information on the operation of the SEC's Public Reference Room may be obtained by calling the SEC toll free at 1 (800) SEC-0330. You can also request copies of these materials, upon payment of a duplicating fee, by electronic request at the SEC's email address (publicinfo@sec.gov) or by writing to the SEC's Public Reference Section, Washington, D.C. 20549-1520.
Proxy Voting Policies and Procedures and Proxy Voting Record
You may obtain a copy of the Company's Proxy Voting Policy and Procedures and information regarding how the Company voted proxies relating to portfolio securities during the most recent twelve-month period ended June 30, without charge, upon request, by calling toll free 1 (800) 548-7786 or by visiting our website at www.morganstanley.com/im. This information is also available on the SEC's website at www.sec.gov.
This report is authorized for distribution only when preceded or accompanied by a prospectus or summary prospectus of the applicable Fund of Morgan Stanley Institutional Fund, Inc., which describes in detail the Fund's investment policies, risks, fees and expenses. Please read the prospectus carefully before you invest or send money. For additional information, including information regarding the investments comprising the Fund, please visit our website at www.morganstanley.com/im or call toll free 1 (800) 548-7786.
56
Printed in U.S.A.
This Report has been prepared for shareholders and may be distributed to others only if preceded or accompanied by a current prospectus.
Morgan Stanley Investment Management Inc.
522 Fifth Avenue
New York, New York 10036
© 2018 Morgan Stanley. Morgan Stanley Distribution, Inc.

IFIMAANN
2009529 EXP. 02.28.19

Morgan Stanley Institutional Fund, Inc.
Small Company Growth Portfolio
Annual Report
December 31, 2017

Morgan Stanley Institutional Fund, Inc.
Annual Report — December 31, 2017
Shareholders' Letter | | | 2 | | |
Expense Example | | | 3 | | |
Investment Overview | | | 4 | | |
Portfolio of Investments | | | 6 | | |
Statement of Assets and Liabilities | | | 9 | | |
Statement of Operations | | | 11 | | |
Statements of Changes in Net Assets | | | 12 | | |
Financial Highlights | | | 14 | | |
Notes to Financial Statements | | | 19 | | |
Report of Independent Registered Public Accounting Firm | | | 30 | | |
Federal Tax Notice | | | 31 | | |
Privacy Notice | | | 32 | | |
Director and Officer Information | | | 35 | | |
This report is authorized for distribution only when preceded or accompanied by a prospectus or summary prospectus of the applicable Fund of Morgan Stanley Institutional Fund, Inc. To receive a prospectus and/or statement of additional information (SAI), which contains more complete information such as investment objectives, charges, expenses, policies for voting proxies, risk considerations, and describes in detail each of the Fund's investment policies to the prospective investor, please call toll free 1 (800) 548-7786. Please read the prospectuses carefully before you invest or send money.
Additionally, you can access information about the Fund, including performance, characteristics, and investment team commentary, through Morgan Stanley Investment Management's website: www.morganstanley.com/im.
Market forecasts provided in this report may not necessarily come to pass. There is no guarantee that any sectors mentioned will continue to perform as discussed herein or that securities in such sectors will be held by the Fund in the future. There is no assurance that a fund will achieve its investment objective. Funds are subject to market risk, which is the possibility that market values of securities owned by the Fund will decline and, therefore, the value of the Fund's shares may be less than what you paid for them. Accordingly, you can lose money investing in this Fund. Please see the prospectus for more complete information on investment risks.
1
Morgan Stanley Institutional Fund, Inc.
Annual Report — December 31, 2017
Shareholders' Letter (unaudited)
Dear Shareholders,
We are pleased to provide this Annual report, in which you will learn how your investment in Small Company Growth Portfolio (the "Fund") performed during the latest twelve-month period.
Morgan Stanley Investment Management is a client-centric, investor-led organization. Our global presence, intellectual capital, and breadth of products and services enable us to partner with investors to meet the evolving challenges of today's financial markets. We aim to deliver superior investment service and to empower our clients to make the informed decisions that help them reach their investment goals.
As always, we thank you for selecting Morgan Stanley Investment Management, and look forward to working with you in the months and years ahead.
Sincerely,

John H. Gernon
President and Principal Executive Officer
January 2018
2
Morgan Stanley Institutional Fund, Inc.
Annual Report — December 31, 2017
Expense Example (unaudited)
Small Company Growth Portfolio
As a shareholder of the Fund, you incur two types of costs: (1) transactional costs, including redemption fees; and (2) ongoing costs, which may include advisory fees, administration fees, distribution and shareholder services fees and other Fund expenses. This example is intended to help you understand your ongoing costs (in dollars) of investing in the Fund and to compare these costs with the ongoing costs of investing in other mutual funds.
This example is based on an investment of $1,000 invested at the beginning of the six-month period ended December 31, 2017 and held for the entire six-month period.
Actual Expenses
The table below provides information about actual account values and actual expenses. You may use the information in this table, together with the amount you invested, to estimate the expenses that you paid over the period. Simply divide your account value by $1,000 (for example, an $8,600 account value divided by $1,000 = 8.6), then multiply the result by the number in the table under the heading entitled "Actual Expenses Paid During Period" to estimate the expenses you paid on your account during this period.
Hypothetical Example for Comparison Purposes
The table below provides information about hypothetical account values and hypothetical expenses based on the Fund's actual expense ratio and an assumed rate of return of 5% per year before expenses, which is not the Fund's actual return. The hypothetical account values and expenses may not be used to estimate the actual ending account balance or expenses you paid for the period. You may use this information to compare the ongoing costs of investing in the Fund and other funds. To do so, compare this 5% hypothetical example with the 5% hypothetical examples that appear in the shareholder reports of the other funds.
Please note that the expenses shown in the table are meant to highlight your ongoing costs only and do not reflect any transactional costs, such as sales charges (loads) and redemption fees. Therefore, the information for each class in the table is useful in comparing ongoing costs only, and will not help you determine the relative total costs of owning different funds. In addition, if these transactional costs were included, your costs would have been higher.
| | | Beginning
Account
Value
7/1/17 | | Actual Ending
Account
Value
12/31/17 | | Hypothetical
Ending Account
Value | | Actual
Expenses
Paid
During
Period* | | Hypothetical
Expenses Paid
During Period* | | Net
Expense
Ratio
During
Period** | |
Small Company Growth Portfolio Class I | | $ | 1,000.00 | | | $ | 1,057.60 | | | $ | 1,020.16 | | | $ | 5.19 | | | $ | 5.09 | | | | 1.00 | % | |
Small Company Growth Portfolio Class A | | | 1,000.00 | | | | 1,056.20 | | | | 1,018.40 | | | | 7.00 | | | | 6.87 | | | | 1.35 | | |
Small Company Growth Portfolio Class L | | | 1,000.00 | | | | 1,054.20 | | | | 1,015.88 | | | | 9.58 | | | | 9.40 | | | | 1.85 | | |
Small Company Growth Portfolio Class C | | | 1,000.00 | | | | 1,052.10 | | | | 1,014.62 | | | | 10.86 | | | | 10.66 | | | | 2.10 | | |
Small Company Growth Portfolio Class IS | | | 1,000.00 | | | | 1,058.30 | | | | 1,020.52 | | | | 4.82 | | | | 4.74 | | | | 0.93 | | |
* Expenses are calculated using each Fund Class' annualized net expense ratio (as disclosed), multiplied by the average account value over the period, and multiplied by 184/365 (to reflect the most recent one-half year period).
** Annualized.
3
Morgan Stanley Institutional Fund, Inc.
Annual Report — December 31, 2017
Investment Overview (unaudited)
Small Company Growth Portfolio
The Fund seeks long-term capital appreciation by investing primarily in growth-oriented equity securities of small capitalization companies.
Performance
For the year ended December 31, 2017, the Fund's Class I shares had a total return based on net asset value and reinvestment of distributions per share of 21.87%, net of fees. The Fund's Class I shares underperformed the Fund's benchmark, the Russell 2000® Growth Index (the "Index"), which returned 22.17%.
Please keep in mind that double-digit returns are highly unusual and cannot be sustained. Investors should also be aware that these returns were primarily achieved during favorable market conditions.
Factors Affecting Performance
• Major U.S. stock indexes spent most of 2017 climbing toward, then exceeding, new record highs. Fueling their momentum was a combination of strong economic growth, robust corporate profits (aided, in part, by a weak dollar) and optimism for tax reform. While the Federal Reserve raised its benchmark interest rate three times in 2017, the moves were incremental and not considered a headwind to the economy's momentum. Notable uncertainties in domestic politics and geopolitics also failed to disrupt the market's advance. Overall, market volatility remained historically low, further bolstering investor confidence in stocks.
• Within the small-cap growth universe, as represented by the Index, telecommunication services, health care and materials were the best-performing sectors for the year. The energy sector, with a negative return, was the weakest-performing sector in the Index. The consumer staples and real estate sectors, despite their double-digit returns, were also among the Index's bottom-performing sectors.
• The long-term investment horizon and conviction-weighted investment approach embraced by the team since 1998 can result in periods of performance deviation from the benchmark and peers. In this reporting period, stock selection contributed positively to relative performance, while sector allocations detracted somewhat.
• Stock selection was the most favorable in the consumer discretionary sector. Several internet retailers and a discount retail chain posted strong gains in the period, which offset weak performance in restaurant holdings.
• Stock selection in the industrials sector was also advantageous, led by a best-practices research provider that rallied after it announced a merger agreement for its health care business and the sale of its education business.
• The information technology sector was a modest contributor, due to the combined benefit of stock selection and an overweight allocation in the sector.
• Stock selection in the health care sector was the largest detractor from relative results. A provider of analytics-driven claims and payment accuracy solutions to health plans and payors was the main detractor in the sector. Sentiment on the shares was adversely impacted in the fourth quarter of 2017 by news of greater consolidation in the health care industry, including the announced merger of a pharmacy chain and a health insurance provider, which has the potential to slow the sales cycles for payment processing companies.
• Stock selection in financials was detrimental but partially offset by a beneficial underweight to the sector. The Fund held an exchange-traded funds (ETF) provider whose stock declined earlier in 2017 on outflows from international ETFs, higher expenses and concerns about fee pressure.
• Lack of exposure to the telecommunication services sector mildly dampened relative performance, as the sector was the Index's top-performing group.
Management Strategies
• There were no changes to our bottom-up investment process during the period. We continued to look for high-quality growth companies that we believe have these attributes: sustainable competitive advantages, above-average business visibility, rising return on invested capital, strong free cash flow generation and a favorable risk/reward profile. We find these companies through intense fundamental research. Our emphasis is on secular growth, and as a result short-term market events are not as meaningful in the stock selection process.
4
Morgan Stanley Institutional Fund, Inc.
Annual Report — December 31, 2017
Investment Overview (unaudited) (cont'd)
Small Company Growth Portfolio

* Minimum Investment for Class I shares
In accordance with SEC regulations, the Fund's performance shown assumes that all recurring fees (including management fees) were deducted and all dividends and distributions were reinvested. The performance of Class A, L, C and IS shares will vary from Class I shares based upon their different inception dates and will be negatively impacted by additional fees assessed to those classes (if applicable).
Performance Compared to the Russell 2000® Growth Index(1) and the Lipper Small-Cap Growth Funds Index(2)
| | | Period Ended December 31, 2017
Total Returns(3) | |
| | | | | Average Annual | |
| | | One
Year | | Five
Years | | Ten
Years | | Since
Inception(9) | |
Fund — Class I Shares
w/o sales charges(4) | | | 21.87 | % | | | 9.98 | % | | | 6.48 | % | | | 10.54 | % | |
Fund — Class A Shares
w/o sales charges(5) | | | 21.57 | | | | 9.65 | | | | 6.18 | | | | 9.48 | | |
Fund — Class A Shares with
maximum 5.25% sales charges(5) | | | 15.19 | | | | 8.47 | | | | 5.60 | | | | 9.21 | | |
Fund — Class L Shares
w/o sales charges(6) | | | 20.95 | | | | 9.09 | | | | — | | | | 9.36 | | |
Fund — Class C Shares
w/o sales charges(8) | | | — | | | | — | | | | — | | | | 4.36 | | |
Fund — Class C Shares with
maximum 1.00% deferred
sales charges(8) | | | — | | | | — | | | | — | | | | 3.70 | | |
Fund — Class IS Shares
w/o sales charges(7) | | | 22.08 | | | | — | | | | — | | | | 3.51 | | |
Russell 2000® Growth Index | | | 22.17 | | | | 15.21 | | | | 9.19 | | | | 8.20 | | |
Lipper Small-Cap Growth Funds Index | | | 24.77 | | | | 13.92 | | | | 7.84 | | | | 9.51 | | |
Performance data quoted represents past performance, which is no guarantee of future results, and current performance may be lower or higher than the figures shown. Performance assumes that all dividends and distributions, if any, were reinvested. For the most recent month-end performance figures, please visit www.morganstanley.com/im. Investment return and principal value will fluctuate so that Fund shares, when redeemed, may be worth more or less than their original cost. Total returns do not reflect the deduction of taxes that a shareholder would pay on Fund distributions or the redemption of Fund shares. Returns for periods less than one year are not annualized. Performance of share classes will vary due to difference in sales charges and expenses.
(1) The Russell 2000® Growth Index measures the performance of the small-cap growth segment of the U.S. equity universe. It includes those Russell 2000® Index companies with higher price-to-book ratios and higher forecasted growth values. The Russell 2000® Index is a subset of the Russell 3000® Index representing approximately 10% of the total market capitalization of that index. It includes approximately 2,000 of the smallest securities based on a combination of their market capitalization and current index membership. The Index is unmanaged and its returns do not include any sales charges or fees. Such costs would lower performance. It is not possible to invest directly in an index.
(2) The Lipper Small-Cap Growth Funds Index is an equally weighted performance index of the largest qualifying funds (based on net assets) in the Lipper Small-Cap Growth Funds classification. The Index, which is adjusted for capital gains distributions and income dividends, is unmanaged and should not be considered an investment. There are currently 30 funds represented in this Index. As of the date of this report, the Fund is in the Lipper Small-Cap Growth Funds classification.
(3) Total returns for the Fund reflect fees waived and expenses reimbursed, if applicable, by the Adviser. Without such waivers and reimbursements, total returns would have been lower.
(4) Commenced operations on November 1, 1989.
(5) Commenced offering on January 2, 1996.
(6) Commenced offering on November 11, 2011.
(7) Commenced offering on September 13, 2013.
(8) Commenced offering on May 31, 2017.
(9) For comparative purposes, average annual since inception returns listed for the Indexes refer to the inception date of Class I of the Fund, not the inception of the Index.
5
Morgan Stanley Institutional Fund, Inc.
Annual Report — December 31, 2017
Portfolio of Investments
Small Company Growth Portfolio
| | | Shares | | Value
(000) | |
Common Stocks (99.2%) | |
Biotechnology (2.7%) | |
Agios Pharmaceuticals, Inc. (a) | | | 15,047 | | | $ | 860 | | |
Alnylam Pharmaceuticals, Inc. (a) | | | 12,540 | | | | 1,593 | | |
Bellicum Pharmaceuticals, Inc. (a)(b) | | | 59,243 | | | | 498 | | |
Editas Medicine, Inc. (a)(b) | | | 72,388 | | | | 2,225 | | |
Intellia Therapeutics, Inc. (a) | | | 60,628 | | | | 1,165 | | |
Intrexon Corp. (a)(b) | | | 38,998 | | | | 449 | | |
Juno Therapeutics, Inc. (a) | | | 34,463 | | | | 1,576 | | |
| | | | 8,366 | | |
Construction Materials (3.3%) | |
Eagle Materials, Inc. | | | 30,629 | | | | 3,470 | | |
Summit Materials, Inc., Class A (a) | | | 111,031 | | | | 3,491 | | |
US Concrete, Inc. (a) | | | 41,687 | | | | 3,487 | | |
| | | | 10,448 | | |
Consumer Finance (0.6%) | |
LendingClub Corp. (a) | | | 487,495 | | | | 2,013 | | |
Health Care Equipment & Supplies (2.7%) | |
Penumbra, Inc. (a) | | | 88,833 | | | | 8,359 | | |
Health Care Providers & Services (6.2%) | |
HealthEquity, Inc. (a) | | | 413,178 | | | | 19,279 | | |
Health Care Technology (16.0%) | |
athenahealth, Inc. (a) | | | 117,890 | | | | 15,684 | | |
Castlight Health, Inc., Class B (a) | | | 722,319 | | | | 2,708 | | |
Cotiviti Holdings, Inc. (a) | | | 494,714 | | | | 15,935 | | |
Veeva Systems, Inc., Class A (a) | | | 284,115 | | | | 15,706 | | |
| | | | 50,033 | | |
Hotels, Restaurants & Leisure (12.3%) | |
Habit Restaurants, Inc. (The) (a)(b) | | | 839,486 | | | | 8,017 | | |
Potbelly Corp. (a) | | | 660,583 | | | | 8,125 | | |
Shake Shack, Inc., Class A (a)(b) | | | 323,902 | | | | 13,993 | | |
Zoe's Kitchen, Inc. (a) | | | 489,974 | | | | 8,192 | | |
| | | | 38,327 | | |
Insurance (0.9%) | |
Trupanion, Inc. (a) | | | 100,026 | | | | 2,928 | | |
Internet & Direct Marketing Retail (10.5%) | |
MakeMyTrip Ltd. (a) | | | 170,606 | | | | 5,093 | | |
Netshoes Cayman Ltd. (a)(b) | | | 395,939 | | | | 3,128 | | |
Overstock.com, Inc. (a)(b) | | | 317,917 | | | | 20,315 | | |
Wayfair, Inc., Class A (a) | | | 52,199 | | | | 4,190 | | |
| | | | 32,726 | | |
Internet Software & Services (17.0%) | |
Benefitfocus, Inc. (a)(b) | | | 101,696 | | | | 2,746 | | |
Coupa Software, Inc. (a) | | | 505,579 | | | | 15,784 | | |
Criteo SA ADR (France) (a) | | | 85,287 | | | | 2,220 | | |
Etsy, Inc. (a) | | | 153,136 | | | | 3,132 | | |
GrubHub, Inc. (a) | | | 45,885 | | | | 3,295 | | |
MuleSoft, Inc., Class A (a) | | | 150,134 | | | | 3,492 | | |
New Relic, Inc. (a) | | | 57,431 | | | | 3,318 | | |
| | | Shares | | Value
(000) | |
Okta, Inc. (a) | | | 131,687 | | | $ | 3,372 | | |
Shutterstock, Inc. (a) | | | 370,164 | | | | 15,928 | | |
| | | | 53,287 | | |
Machinery (5.4%) | |
Welbilt, Inc. (a) | | | 720,731 | | | | 16,944 | | |
Multi-Line Retail (1.6%) | |
Dillard's, Inc., Class A (b) | | | 85,099 | | | | 5,110 | | |
Personal Products (1.1%) | |
elf Beauty, Inc. (a)(b) | | | 155,699 | | | | 3,474 | | |
Professional Services (5.3%) | |
WageWorks, Inc. (a) | | | 266,712 | | | | 16,536 | | |
Software (9.5%) | |
Ellie Mae, Inc. (a) | | | 171,483 | | | | 15,331 | | |
Guidewire Software, Inc. (a) | | | 62,507 | | | | 4,642 | | |
HubSpot, Inc. (a) | | | 35,726 | | | | 3,158 | | |
Xero Ltd. (New Zealand) (a) | | | 138,995 | | | | 3,100 | | |
Zendesk, Inc. (a) | | | 99,363 | | | | 3,362 | | |
| | | | 29,593 | | |
Specialty Retail (3.4%) | |
Five Below, Inc. (a) | | | 161,238 | | | | 10,693 | | |
Thrifts & Mortgage Finance (0.7%) | |
LendingTree, Inc. (a) | | | 6,813 | | | | 2,319 | | |
Total Common Stocks (Cost $271,285) | | | 310,435 | | |
Preferred Stocks (5.7%) | |
Health Care Technology (1.8%) | |
Grand Rounds, Inc. Series B (a)(c)(d)(e)
(acquisition cost — $3,362;
acquired 7/3/14) | | | 3,269,139 | | | | 5,787 | | |
Internet Software & Services (1.0%) | |
Doximity, Inc. Series C (a)(c)(d)(e)
(acquisition cost — $3,834;
acquired 4/10/14) | | | 795,247 | | | | 3,014 | | |
Software (2.9%) | |
DOMO, Inc. (a)(c)(d)(e)
(acquisition cost — $10,559;
acquired 1/31/14 — 2/7/14) | | | 2,554,715 | | | | 6,668 | | |
Lookout, Inc. Series F (a)(c)(d)(e)
(acquisition cost — $13,476;
acquired 6/17/14) | | | 1,179,743 | | | | 2,359 | | |
| | | | 9,027 | | |
Total Preferred Stocks (Cost $31,231) | | | 17,828 | | |
Short-Term Investments (16.0%) | |
Securities held as Collateral on Loaned Securities (14.3%) | |
Investment Company (10.5%) | |
Morgan Stanley Institutional Liquidity
Funds — Treasury Securities Portfolio —
Institutional Class (See Note G) | | | 32,880,967 | | | | 32,881 | | |
The accompanying notes are an integral part of the financial statements.
6
Morgan Stanley Institutional Fund, Inc.
Annual Report — December 31, 2017
Portfolio of Investments (cont'd)
Small Company Growth Portfolio
| | | Face
Amount
(000) | | Value
(000) | |
Repurchase Agreements (3.8%) | |
Barclays Capital, Inc., (1.37%,
dated 12/29/17, due 1/2/18;
proceeds $7,567; fully collateralized
by a U.S. Government obligation;
1.75% due 5/15/23; valued at $7,718) | | $ | 7,567 | | | $ | 7,567 | | |
HSBC Securities USA, Inc., (1.30%,
dated 12/29/17, due 1/2/18;
proceeds $585; fully collateralized
by a U.S. Government obligation;
3.00% due 2/15/47; valued at $597) | | | 585 | | | | 585 | | |
Merrill Lynch & Co., Inc., (1.42%,
dated 12/29/17, due 1/2/18;
proceeds $3,876; fully collateralized
by a U.S. Government obligation;
2.00% due 12/31/21; valued at $3,953) | | | 3,876 | | | | 3,876 | | |
| | | | 12,028 | | |
Total Securities held as Collateral on Loaned
Securities (Cost $44,909) | | | 44,909 | | |
| | | Shares | | | |
Investment Company (1.7%) | |
Morgan Stanley Institutional Liquidity
Funds — Treasury Securities Portfolio —
Institutional Class (See Note G)
(Cost $5,172) | | | 5,171,845 | | | | 5,172 | | |
Total Short-Term Investments (Cost $50,081) | | | 50,081 | | |
Total Investments Excluding Purchased
Options (120.9%) (Cost $352,597) | | | | | 378,344 | | |
Total Purchased Options Outstanding (0.0%)
(Cost $832) | | | 123 | | |
Total Investments (120.9%) (Cost $353,429)
Including $43,641 of Securities Loaned (f)(g) | | | 378,467 | | |
Liabilities in Excess of Other Assets (–20.9%) | | | (65,516 | ) | |
Net Assets (100.0%) | | $ | 312,951 | | |
(a) Non-income producing security.
(b) All or a portion of this security was on loan at December 31, 2017.
(c) At December 31, 2017, the Fund held fair valued securities valued at approximately $17,828,000, representing 5.7% of net assets. These securities have been fair valued as determined in good faith under procedures established by and under the general supervision of the Company's Directors.
(d) Security has been deemed illiquid at December 31, 2017.
(e) Security cannot be offered for public resale without first being registered under the Securities Act of 1933 and related rules ("restricted security"). Acquisition date represents the day on which an enforceable right to acquire such security is obtained and is presented along with related cost in the security description. The Fund has registration rights for certain restricted securities. Any costs related to such registration are borne by the issuer. The aggregate value of restricted securities (excluding 144A holdings) at December 31, 2017, amounts to approximately $17,828,000 and represents 5.7% of net assets.
(f) The approximate fair value and percentage of net assets, $3,100,000 and 1.0%, respectively, represent the securities that have been fair valued under the fair valuation policy for international investments as described in Note A-1 within the Notes to the Financial Statements.
(g) At December 31, 2017, the aggregate cost for federal income tax purposes is approximately $370,617,000. The aggregate gross unrealized appreciation is approximately $36,850,000 and the aggregate gross unrealized depreciation is approximately $29,000,000, resulting in net unrealized appreciation of approximately $7,850,000.
ADR American Depositary Receipt.
The accompanying notes are an integral part of the financial statements.
7
Morgan Stanley Institutional Fund, Inc.
Annual Report — December 31, 2017
Portfolio of Investments (cont'd)
Small Company Growth Portfolio
Call Options Purchased:
The Fund had the following call options purchased open at December 31, 2017:
Counterparty | | Description | | Strike
Price | | Expiration
Date | | Number of
Contracts | | Notional
Amount
(000) | | Value
(000) | | Premiums
Paid
(000) | | Unrealized
Depreciation
(000) | |
Royal Bank of Scotland | | USD/CNH | | CNH | 7.52 | | | Nov-18 | | | 98,365,333 | | | | 98,365 | | | $ | 96 | | | $ | 407 | | | $ | (311 | ) | |
Royal Bank of Scotland | | USD/CNH | | CNH | 7.55 | | | Aug-18 | | | 80,114,099 | | | | 80,114 | | | | 27 | | | | 425 | | | | (398 | ) | |
| | | | | | | | | | | | | $ | 123 | | | $ | 832 | | | $ | (709 | ) | |
CNH Chinese Yuan Renminbi Offshore
USD United States Dollar
Portfolio Composition*
Classification | | Percentage of
Total Investments | |
Other** | | | 17.6 | % | |
Internet Software & Services | | | 16.9 | | |
Health Care Technology | | | 16.7 | | |
Software | | | 11.6 | | |
Hotels, Restaurants & Leisure | | | 11.5 | | |
Internet & Direct Marketing Retail | | | 9.8 | | |
Health Care Providers & Services | | | 5.8 | | |
Machinery | | | 5.1 | | |
Professional Services | | | 5.0 | | |
Total Investments | | | 100.0 | % | |
* Percentages indicated are based upon total investments (excluding Securities held as Collateral on Loaned Securities) as of December 31, 2017.
** Industries and/or investment types representing less than 5% of total investments.
The accompanying notes are an integral part of the financial statements.
8
Morgan Stanley Institutional Fund, Inc.
Annual Report — December 31, 2017
Small Company Growth Portfolio
Statement of Assets and Liabilities | | December 31, 2017
(000) | |
Assets: | |
Investments in Securities of Unaffiliated Issuers, at Value(1) (Cost $315,376) | | $ | 340,414 | | |
Investment in Security of Affiliated Issuer, at Value (Cost $38,053) | | | 38,053 | | |
Total Investments in Securities, at Value (Cost $353,429) | | | 378,467 | | |
Foreign Currency, at Value (Cost —@) | | | — | @ | |
Receivable from Securities Lending Income | | | 333 | | |
Receivable for Fund Shares Sold | | | 211 | | |
Dividends Receivable | | | 12 | | |
Receivable from Affiliate | | | 9 | | |
Other Assets | | | 92 | | |
Total Assets | | | 379,124 | | |
Liabilities: | |
Collateral on Securities Loaned, at Value | | | 44,909 | | |
Payable for Fund Shares Redeemed | | | 20,095 | | |
Payable for Advisory Fees | | | 699 | | |
Due to Broker | | | 170 | | |
Payable for Sub Transfer Agency Fees — Class I | | | 66 | | |
Payable for Sub Transfer Agency Fees — Class A | | | 30 | | |
Payable for Sub Transfer Agency Fees — Class L | | | 2 | | |
Payable for Professional Fees | | | 60 | | |
Payable for Administration Fees | | | 24 | | |
Payable for Custodian Fees | | | 19 | | |
Payable for Directors' Fees and Expenses | | | 16 | | |
Payable for Transfer Agency Fees — Class I | | | 5 | | |
Payable for Transfer Agency Fees — Class A | | | 4 | | |
Payable for Transfer Agency Fees — Class L | | | 1 | | |
Payable for Transfer Agency Fees — Class C | | | — | @ | |
Payable for Transfer Agency Fees — Class IS | | | 1 | | |
Payable for Shareholder Services Fees — Class A | | | 9 | | |
Payable for Distribution and Shareholder Services Fees — Class L | | | 1 | | |
Payable for Distribution and Shareholder Services Fees — Class C | | | — | @ | |
Other Liabilities | | | 62 | | |
Total Liabilities | | | 66,173 | | |
Net Assets | | $ | 312,951 | | |
Net Assets Consist Of: | |
Paid-in-Capital | | $ | 305,178 | | |
Accumulated Net Investment Loss | | | (77 | ) | |
Distribution in Excess of Net Realized Gain | | | (17,188 | ) | |
Unrealized Appreciation (Depreciation) on: | |
Investments | | | 25,038 | | |
Foreign Currency Translations | | | (— | @) | |
Net Assets | | $ | 312,951 | | |
The accompanying notes are an integral part of the financial statements.
9
Morgan Stanley Institutional Fund, Inc.
Annual Report — December 31, 2017
Small Company Growth Portfolio
Statement of Assets and Liabilities (cont'd) | | December 31, 2017
(000) | |
CLASS I: | |
Net Assets | | $ | 141,954 | | |
| Shares Outstanding $0.001 par value shares of beneficial interest (unlimited shares authorized) (not in 000's) | | | 13,021,358 | | |
Net Asset Value, Offering and Redemption Price Per Share | | $ | 10.90 | | |
CLASS A: | |
Net Assets | | $ | 40,531 | | |
| Shares Outstanding $0.001 par value shares of beneficial interest (unlimited shares authorized) (not in 000's) | | | 4,508,986 | | |
Net Asset Value, Redemption Price Per Share | | $ | 8.99 | | |
Maximum Sales Load | | | 5.25 | % | |
Maximum Sales Charge | | $ | 0.50 | | |
Maximum Offering Price Per Share | | $ | 9.49 | | |
CLASS L: | |
Net Assets | | $ | 1,310 | | |
| Shares Outstanding $0.001 par value shares of beneficial interest (unlimited shares authorized) (not in 000's) | | | 154,968 | | |
Net Asset Value, Offering and Redemption Price Per Share | | $ | 8.46 | | |
CLASS C: | |
Net Assets | | $ | 30 | | |
| Shares Outstanding $0.001 par value shares of beneficial interest (unlimited shares authorized) (not in 000's) | | | 3,355 | | |
Net Asset Value, Offering and Redemption Price Per Share | | $ | 8.93 | | |
CLASS IS: | |
Net Assets | | $ | 129,126 | | |
| Shares Outstanding $0.001 par value shares of beneficial interest (unlimited shares authorized) (not in 000's) | | | 11,784,191 | | |
Net Asset Value, Offering and Redemption Price Per Share | | $ | 10.96 | | |
(1) Including:
Securities on Loan, at Value: | | $ | 43,641 | | |
@ Amount is less than $500.
The accompanying notes are an integral part of the financial statements.
10
Morgan Stanley Institutional Fund, Inc.
Annual Report — December 31, 2017
Small Company Growth Portfolio
Statement of Operations | | Year Ended
December 31, 2017
(000) | |
Investment Income: | |
Income from Securities Loaned — Net | | $ | 1,204 | | |
Dividends from Security of Affiliated Issuer (Note G) | | | 111 | | |
Dividends from Securities of Unaffiliated Issuers | | | (104 | )@@ | |
Interest from Securities of Unaffiliated Issuers | | | (148 | )@@@ | |
Total Investment Income | | | 1,063 | | |
Expenses: | |
Advisory Fees (Note B) | | | 4,558 | | |
Administration Fees (Note C) | | | 396 | | |
Sub Transfer Agency Fees — Class I | | | 227 | | |
Sub Transfer Agency Fees — Class A | | | 87 | | |
Sub Transfer Agency Fees — Class L | | | 4 | | |
Professional Fees | | | 163 | | |
Shareholder Services Fees — Class A (Note D) | | | 143 | | |
Distribution and Shareholder Services Fees — Class L (Note D) | | | 12 | | |
Distribution and Shareholder Services Fees — Class C (Note D) | | | — | @ | |
Registration Fees | | | 80 | | |
Custodian Fees (Note F) | | | 42 | | |
Shareholder Reporting Fees | | | 39 | | |
Transfer Agency Fees — Class I (Note E) | | | 16 | | |
Transfer Agency Fees — Class A (Note E) | | | 13 | | |
Transfer Agency Fees — Class L (Note E) | | | 3 | | |
Transfer Agency Fees — Class C (Note E) | | | 1 | | |
Transfer Agency Fees — Class IS (Note E) | | | 4 | | |
Directors' Fees and Expenses | | | 18 | | |
Pricing Fees | | | 4 | | |
Other Expenses | | | 92 | | |
Expenses Before Non Operating Expenses | | | 5,902 | | |
Bank Overdraft Expense | | | 19 | | |
Total Expenses | | | 5,921 | | |
Waiver of Advisory Fees (Note B) | | | (784 | ) | |
Reimbursement of Class Specific Expenses — Class I (Note B) | | | (81 | ) | |
Reimbursement of Class Specific Expenses — Class A (Note B) | | | (3 | ) | |
Reimbursement of Class Specific Expenses — Class L (Note B) | | | (4 | ) | |
Reimbursement of Class Specific Expenses — Class C (Note B) | | | (1 | ) | |
Reimbursement of Class Specific Expenses — Class IS (Note B) | | | (4 | ) | |
Rebate from Morgan Stanley Affiliate (Note G) | | | (30 | ) | |
Net Expenses | | | 5,014 | | |
Net Investment Loss | | | (3,951 | ) | |
Realized Gain (Loss): | |
Investments Sold | | | 171,686 | | |
Foreign Currency Transactions | | | (15 | ) | |
Net Realized Gain | | | 171,671 | | |
Change in Unrealized Appreciation (Depreciation): | |
Investments | | | (62,911 | ) | |
Foreign Currency Translations | | | — | @ | |
Net Change in Unrealized Appreciation (Depreciation) | | | (62,911 | ) | |
Net Realized Gain and Change in Unrealized Appreciation (Depreciation) | | | 108,760 | | |
Net Increase in Net Assets Resulting from Operations | | $ | 104,809 | | |
@ Amount is less than $500.
@@ Relates to revised projected escrow receivable.
@@@ Relates to reversal of previously accrued income for written off security.
The accompanying notes are an integral part of the financial statements.
11
Morgan Stanley Institutional Fund, Inc.
Annual Report — December 31, 2017
Small Company Growth Portfolio
Statements of Changes in Net Assets | | Year Ended
December 31, 2017
(000) | | Year Ended
December 31, 2016
(000) | |
Increase (Decrease) in Net Assets: | |
Operations: | |
Net Investment Income (Loss) | | $ | (3,951 | ) | | $ | 26 | | |
Net Realized Gain | | | 171,671 | | | | 52,262 | | |
Net Change in Unrealized Appreciation (Depreciation) | | | (62,911 | ) | | | (85,970 | ) | |
Net Increase (Decrease) in Net Assets Resulting from Operations | | | 104,809 | | | | (33,682 | ) | |
Distributions from and/or in Excess of: | |
Class I: | |
Net Realized Gain | | | (66,031 | ) | | | (13,037 | ) | |
Class A: | |
Net Realized Gain | | | (18,203 | ) | | | (3,815 | ) | |
Class L: | |
Net Realized Gain | | | (589 | ) | | | (61 | ) | |
Class C: | |
Net Realized Gain | | | (4 | ) | | | — | | |
Class IS: | |
Net Realized Gain | | | (51,397 | ) | | | (12,878 | ) | |
Total Distributions | | | (136,224 | ) | | | (29,791 | ) | |
Capital Share Transactions:(1) | |
Class I: | |
Subscribed | | | 47,817 | | | | 66,765 | | |
Distributions Reinvested | | | 65,879 | | | | 11,844 | | |
Redeemed | | | (259,329 | ) | | | (467,089 | ) | |
Class A: | |
Subscribed | | | 5,601 | | | | 9,837 | | |
Distributions Reinvested | | | 18,092 | | | | 3,802 | | |
Redeemed | | | (64,607 | ) | | | (57,910 | ) | |
Class L: | |
Distributions Reinvested | | | 586 | | | | 61 | | |
Redeemed | | | (504 | ) | | | (323 | ) | |
Class C: | |
Subscribed | | | 33 | * | | | — | | |
Class IS: | |
Subscribed | | | 60,649 | | | | 47,147 | | |
Distributions Reinvested | | | 50,949 | | | | 12,801 | | |
Redeemed | | | (337,736 | ) | | | (323,566 | ) | |
Net Decrease in Net Assets Resulting from Capital Share Transactions | | | (412,570 | ) | | | (696,631 | ) | |
Redemption Fees | | | 17 | | | | 8 | | |
Total Decrease in Net Assets | | | (443,968 | ) | | | (760,096 | ) | |
Net Assets: | |
Beginning of Period | | | 756,919 | | | | 1,517,015 | | |
End of Period (Including Accumulated Net Investment Loss of $(77) and $(573)) | | $ | 312,951 | | | $ | 756,919 | | |
The accompanying notes are an integral part of the financial statements.
12
Morgan Stanley Institutional Fund, Inc.
Annual Report — December 31, 2017
Small Company Growth Portfolio
Statements of Changes in Net Assets (cont'd) | | Year Ended
December 31, 2017
(000) | | Year Ended
December 31, 2016
(000) | |
(1) Capital Share Transactions: | |
Class I: | |
Shares Subscribed | | | 3,416 | | | | 5,147 | | |
Shares Issued on Distributions Reinvested | | | 5,619 | | | | 889 | | |
Shares Redeemed | | | (19,091 | ) | | | (35,214 | ) | |
Net Decrease in Class I Shares Outstanding | | | (10,056 | ) | | | (29,178 | ) | |
Class A: | |
Shares Subscribed | | | 454 | | | | 856 | | |
Shares Issued on Distributions Reinvested | | | 1,855 | | | | 322 | | |
Shares Redeemed | | | (5,295 | ) | | | (4,837 | ) | |
Net Decrease in Class A Shares Outstanding | | | (2,986 | ) | | | (3,659 | ) | |
Class L: | |
Shares Issued on Distributions Reinvested | | | 64 | | | | 5 | | |
Shares Redeemed | | | (43 | ) | | | (28 | ) | |
Net Increase (Decrease) in Class L Shares Outstanding | | | 21 | | | | (23 | ) | |
Class C: | |
Shares Subscribed | | | 3 | * | | | — | | |
Class IS: | |
Shares Subscribed | | | 4,289 | | | | 3,684 | | |
Shares Issued on Distributions Reinvested | | | 4,361 | | | | 958 | | |
Shares Redeemed | | | (24,070 | ) | | | (25,375 | ) | |
Net Decrease in Class IS Shares Outstanding | | | (15,420 | ) | | | (20,733 | ) | |
* For the period May 31, 2017 through December 31, 2017.
The accompanying notes are an integral part of the financial statements.
13
Morgan Stanley Institutional Fund, Inc.
Annual Report — December 31, 2017
Financial Highlights
Small Company Growth Portfolio
| | | Class I | |
| | | Year Ended December 31, | |
Selected Per Share Data and Ratios | | 2017 | | 2016(1) | | 2015 | | 2014 | | 2013 | |
Net Asset Value, Beginning of Period | | $ | 13.26 | | | $ | 13.75 | | | $ | 16.50 | | | $ | 20.55 | | | $ | 14.16 | | |
Income (Loss) from Investment Operations: | |
Net Investment Income (Loss)(2) | | | (0.11 | ) | | | 0.00 | (3) | | | (0.05 | ) | | | (0.06 | ) | | | (0.09 | ) | |
Net Realized and Unrealized Gain (Loss) | | | 2.91 | | | | (0.05 | ) | | | (1.51 | ) | | | (2.04 | ) | | | 8.77 | | |
Total from Investment Operations | | | 2.80 | | | | (0.05 | ) | | | (1.56 | ) | | | (2.10 | ) | | | 8.68 | | |
Distributions from and/or in Excess of: | |
Net Realized Gain | | | (5.16 | ) | | | (0.44 | ) | | | (1.19 | ) | | | (1.95 | ) | | | (2.29 | ) | |
Redemption Fees | | | 0.00 | (3) | | | 0.00 | (3) | | | 0.00 | (3) | | | 0.00 | (3) | | | 0.00 | (3) | |
Net Asset Value, End of Period | | $ | 10.90 | | | $ | 13.26 | | | $ | 13.75 | | | $ | 16.50 | | | $ | 20.55 | | |
Total Return(4) | | | 21.87 | % | | | (0.35 | )% | | | (9.58 | )% | | | (9.68 | )% | | | 62.26 | % | |
Ratios and Supplemental Data: | |
Net Assets, End of Period (Thousands) | | $ | 141,954 | | | $ | 305,945 | | | $ | 718,386 | | | $ | 1,156,812 | | | $ | 2,017,558 | | |
Ratio of Expenses to Average Net Assets(8) | | | 0.99 | %(5) | | | 1.02 | %(5)(6) | | | 1.05 | %(5) | | | 1.05 | %(5) | | | 1.04 | %(5) | |
Ratio of Expenses to Average Net Assets Excluding Non Operating Expenses | | | 0.99 | %(5) | | | N/A | | | | N/A | | | | N/A | | | | N/A | | |
Ratio of Net Investment Income (Loss) to Average Net Assets(8) | | | (0.77 | )%(5) | | | 0.02 | %(5) | | | (0.29 | )%(5) | | | (0.34 | )%(5) | | | (0.49 | )%(5) | |
Ratio of Rebate from Morgan Stanley Affiliates to Average Net Assets | | | 0.01 | % | | | 0.00 | %(7) | | | 0.00 | %(7) | | | 0.00 | %(7) | | | 0.01 | % | |
Portfolio Turnover Rate | | | 97 | % | | | 51 | % | | | 42 | % | | | 53 | % | | | 43 | % | |
(8) Supplemental Information on the Ratios to Average Net Assets: | |
Ratios Before Expense Limitation: | |
Expenses to Average Net Assets | | | 1.20 | % | | | 1.17 | % | | | 1.11 | % | | | 1.13 | % | | | 1.08 | % | |
Net Investment Loss to Average Net Assets | | | (0.98 | )% | | | (0.13 | )% | | | (0.35 | )% | | | (0.42 | )% | | | (0.53 | )% | |
(1) Reflects prior period custodian out-of-pocket expenses that were reimbursed in September 2016. The amount of the reimbursement was immaterial on a per share basis and did not impact the total return of Class I shares. The Ratio of Expenses to Average Net Assets and the Ratio of Net Investment Income to Average Net Assets would be unchanged as the reimbursement of custodian fees was offset against expense waivers/reimbursements with no impact to net expenses or net investment income.
(2) Per share amount is based on average shares outstanding.
(3) Amount is less than $0.005 per share.
(4) Calculated based on the net asset value as of the last business day of the period.
(5) The Ratios of Expenses and Net Investment Income (Loss) reflect the rebate of certain Fund expenses in connection with the investments in Morgan Stanley affiliates during the period. The effect of the rebate on the ratios is disclosed in the above table as "Ratio of Rebate from Morgan Stanley Affiliates to Average Net Assets."
(6) Effective July 1, 2016, the Adviser has agreed to limit the ratio of expenses to average net assets to the maximum ratio of 1.00% for Class I shares. Prior to July 1, 2016, the maximum ratio was 1.05% for Class I shares.
(7) Amount is less than 0.005%.
The accompanying notes are an integral part of the financial statements.
14
Morgan Stanley Institutional Fund, Inc.
Annual Report — December 31, 2017
Financial Highlights
Small Company Growth Portfolio
| | | Class A | |
| | | Year Ended December 31, | |
Selected Per Share Data and Ratios | | 2017 | | 2016(1) | | 2015 | | 2014 | | 2013 | |
Net Asset Value, Beginning of Period | | $ | 11.72 | | | $ | 12.25 | | | $ | 14.89 | | | $ | 18.83 | | | $ | 13.13 | | |
Income (Loss) from Investment Operations: | |
Net Investment Loss(2) | | | (0.14 | ) | | | (0.04 | ) | | | (0.09 | ) | | | (0.11 | ) | | | (0.13 | ) | |
Net Realized and Unrealized Gain (Loss) | | | 2.57 | | | | (0.05 | ) | | | (1.36 | ) | | | (1.88 | ) | | | 8.12 | | |
Total from Investment Operations | | | 2.43 | | | | (0.09 | ) | | | (1.45 | ) | | | (1.99 | ) | | | 7.99 | | |
Distributions from and/or in Excess of: | |
Net Realized Gain | | | (5.16 | ) | | | (0.44 | ) | | | (1.19 | ) | | | (1.95 | ) | | | (2.29 | ) | |
Redemption Fees | | | 0.00 | (3) | | | 0.00 | (3) | | | 0.00 | (3) | | | 0.00 | (3) | | | 0.00 | (3) | |
Net Asset Value, End of Period | | $ | 8.99 | | | $ | 11.72 | | | $ | 12.25 | | | $ | 14.89 | | | $ | 18.83 | | |
Total Return(4) | | | 21.57 | % | | | (0.73 | )% | | | (9.88 | )% | | | (9.98 | )% | | | 61.88 | % | |
Ratios and Supplemental Data: | |
Net Assets, End of Period (Thousands) | | $ | 40,531 | | | $ | 87,864 | | | $ | 136,621 | | | $ | 186,307 | | | $ | 282,632 | | |
Ratio of Expenses to Average Net Assets(9) | | | 1.34 | %(5) | | | 1.37 | %(5)(7) | | | 1.37 | %(5) | | | 1.38 | %(5) | | | 1.31 | %(5)(6) | |
Ratio of Expenses to Average Net Assets Excluding Non Operating Expenses | | | 1.34 | %(5) | | | N/A | | | | N/A | | | | N/A | | | | N/A | | |
Ratio of Net Investment Loss to Average Net Assets(9) | | | (1.12 | )%(5) | | | (0.35 | )%(5) | | | (0.61 | )%(5) | | | (0.67 | )%(5) | | | (0.75 | )%(5) | |
Ratio of Rebate from Morgan Stanley Affiliates to Average Net Assets | | | 0.01 | % | | | 0.00 | %(8) | | | 0.00 | %(8) | | | 0.00 | %(8) | | | 0.01 | % | |
Portfolio Turnover Rate | | | 97 | % | | | 51 | % | | | 42 | % | | | 53 | % | | | 43 | % | |
(9) Supplemental Information on the Ratios to Average Net Assets: | |
Ratios Before Expense Limitation: | |
Expenses to Average Net Assets | | | 1.51 | % | | | 1.45 | % | | | 1.38 | % | | | N/A | | | | 1.35 | % | |
Net Investment Loss to Average Net Assets | | | (1.29 | )% | | | (0.43 | )% | | | (0.62 | )% | | | N/A | | | | (0.79 | )% | |
(1) Reflects prior period custodian out-of-pocket expenses that were reimbursed in September 2016. The amount of the reimbursement was immaterial on a per share basis and did not impact the total return of Class A shares. The Ratio of Expenses to Average Net Assets and the Ratio of Net Investment Loss to Average Net Assets would be unchanged as the reimbursement of custodian fees was offset against expense waivers/reimbursements with no impact to net expenses or net investment loss.
(2) Per share amount is based on average shares outstanding.
(3) Amount is less than $0.005 per share.
(4) Calculated based on the net asset value which does not reflect sales charges, if applicable, as of the last business day of the period.
(5) The Ratios of Expenses and Net Investment Loss reflect the rebate of certain Fund expenses in connection with the investments in Morgan Stanley affiliates during the period. The effect of the rebate on the ratios is disclosed in the above table as "Ratio of Rebate from Morgan Stanley Affiliates to Average Net Assets."
(6) Effective September 16, 2013, the Adviser has agreed to limit the ratio of expenses to average net assets to the maximum ratio of 1.40% for Class A shares. Prior to September 16, 2013, the maximum ratio was 1.30% for Class A shares.
(7) Effective July 1, 2016, the Adviser has agreed to limit the ratio of expenses to average net assets to the maximum ratio of 1.35% for Class A shares. Prior to July 1, 2016, the maximum ratio was 1.40% for Class A shares.
(8) Amount is less than 0.005%.
The accompanying notes are an integral part of the financial statements.
15
Morgan Stanley Institutional Fund, Inc.
Annual Report — December 31, 2017
Financial Highlights
Small Company Growth Portfolio
| | | Class L | |
| | | Year Ended December 31, | |
Selected Per Share Data and Ratios | | 2017 | | 2016(1) | | 2015 | | 2014 | | 2013 | |
Net Asset Value, Beginning of Period | | $ | 11.34 | | | $ | 11.92 | | | $ | 14.60 | | | $ | 18.60 | | | $ | 13.06 | | |
Income (Loss) from Investment Operations: | |
Net Investment Loss(2) | | | (0.19 | ) | | | (0.10 | ) | | | (0.16 | ) | | | (0.19 | ) | | | (0.21 | ) | |
Net Realized and Unrealized Gain (Loss) | | | 2.47 | | | | (0.04 | ) | | | (1.33 | ) | | | (1.86 | ) | | | 8.04 | | |
Total from Investment Operations | | | 2.28 | | | | (0.14 | ) | | | (1.49 | ) | | | (2.05 | ) | | | 7.83 | | |
Distributions from and/or in Excess of: | |
Net Realized Gain | | | (5.16 | ) | | | (0.44 | ) | | | (1.19 | ) | | | (1.95 | ) | | | (2.29 | ) | |
Redemption Fees | | | 0.00 | (3) | | | 0.00 | (3) | | | 0.00 | (3) | | | 0.00 | (3) | | | 0.00 | (3) | |
Net Asset Value, End of Period | | $ | 8.46 | | | $ | 11.34 | | | $ | 11.92 | | | $ | 14.60 | | | $ | 18.60 | | |
Total Return(4) | | | 20.95 | % | | | (1.17 | )% | | | (10.36 | )% | | | (10.43 | )% | | | 60.97 | % | |
Ratios and Supplemental Data: | |
Net Assets, End of Period (Thousands) | | $ | 1,310 | | | $ | 1,524 | | | $ | 1,874 | | | $ | 2,370 | | | $ | 2,632 | | |
Ratio of Expenses to Average Net Assets(9) | | | 1.84 | %(5) | | | 1.87 | %(5)(7) | | | 1.90 | %(5) | | | 1.90 | %(5) | | | 1.83 | %(5)(6) | |
Ratio of Expenses to Average Net Assets Excluding Non Operating Expenses | | | 1.84 | %(5) | | | N/A | | | | N/A | | | | N/A | | | | N/A | | |
Ratio of Net Investment Loss to Average Net Assets(9) | | | (1.61 | )%(5) | | | (0.88 | )%(5) | | | (1.33 | )%(5) | | | (1.16 | )%(5) | | | (1.27 | )%(5) | |
Ratio of Rebate from Morgan Stanley Affiliates to Average Net Assets | | | 0.01 | % | | | 0.00 | %(8) | | | 0.00 | %(8) | | | 0.00 | %(8) | | | 0.01 | % | |
Portfolio Turnover Rate | | | 97 | % | | | 51 | % | | | 42 | % | | | 53 | % | | | 43 | % | |
(9) Supplemental Information on the Ratios to Average Net Assets: | |
Ratios Before Expense Limitation: | |
Expenses to Average Net Assets | | | 2.27 | % | | | 2.21 | % | | | 2.10 | % | | | 2.02 | % | | | 1.92 | % | |
Net Investment Loss to Average Net Assets | | | (2.04 | )% | | | (1.22 | )% | | | (1.34 | )% | | | (1.28 | )% | | | (1.36 | )% | |
(1) Reflects prior period custodian out-of-pocket expenses that were reimbursed in September 2016. The amount of the reimbursement was immaterial on a per share basis and did not impact the total return of Class L shares. The Ratio of Expenses to Average Net Assets and the Ratio of Net Investment Loss to Average Net Assets would be unchanged as the reimbursement of custodian fees was offset against expense waivers/reimbursements with no impact to net expenses or net investment loss.
(2) Per share amount is based on average shares outstanding.
(3) Amount is less than $0.005 per share.
(4) Calculated based on the net asset value as of the last business day of the period.
(5) The Ratios of Expenses and Net Investment Loss reflect the rebate of certain Fund expenses in connection with the investments in Morgan Stanley affiliates during the period. The effect of the rebate on the ratios is disclosed in the above table as "Ratio of Rebate from Morgan Stanley Affiliates to Average Net Assets."
(6) Effective September 16, 2013, the Adviser has agreed to limit the ratio of expenses to average net assets to the maximum ratio of 1.90% for Class L shares. Prior to September 16, 2013, the maximum ratio was 1.80% for Class L shares.
(7) Effective July 1, 2016, the Adviser has agreed to limit the ratio of expenses to average net assets to the maximum ratio of 1.85% for Class L shares. Prior to July 1, 2016, the maximum ratio was 1.90% for Class L shares.
(8) Amount is less than 0.005%.
The accompanying notes are an integral part of the financial statements.
16
Morgan Stanley Institutional Fund, Inc.
Annual Report — December 31, 2017
Financial Highlights
Small Company Growth Portfolio
| | | Class C | |
Selected Per Share Data and Ratios | | Period from May 31, 2017(1)
to December 31, 2017 | |
Net Asset Value, Beginning of Period | | $ | 13.59 | | |
Income (Loss) from Investment Operations: | |
Net Investment Loss(2) | | | (0.13 | ) | |
Net Realized and Unrealized Gain | | | 0.63 | | |
Total from Investment Operations | | | 0.50 | | |
Distributions from and/or in Excess of: | |
Net Realized Gain | | | (5.16 | ) | |
Redemption Fees | | | 0.00 | (3) | |
Net Asset Value, End of Period | | $ | 8.93 | | |
Total Return(4) | | | 4.36 | %(7) | |
Ratios and Supplemental Data: | |
Net Assets, End of Period (Thousands) | | $ | 30 | | |
Ratio of Expenses to Average Net Assets(9) | | | 2.10 | %(5)(8) | |
Ratio of Expenses to Average Net Assets Excluding Non Operating Expenses | | | 2.10 | %(5)(8) | |
Ratio of Net Investment Loss to Average Net Assets(9) | | | (1.82 | )%(5)(8) | |
Ratio of Rebate from Morgan Stanley Affiliates to Average Net Assets | | | 0.00 | %(6)(8) | |
Portfolio Turnover Rate | | | 97 | % | |
(9) Supplemental Information on the Ratios to Average Net Assets: | |
Ratios Before Expense Limitation: | |
Expenses to Average Net Assets | | | 21.29 | %(8) | |
Net Investment Loss to Average Net Assets | | | (21.01 | )%(8) | |
(1) Commencement of Offering.
(2) Per share amount is based on average shares outstanding.
(3) Amount is less than $0.005 per share.
(4) Calculated based on the net asset value which does not reflect sales charges, if applicable, as of the last business day of the period.
(5) The Ratios of Expenses and Net Investment Loss reflect the rebate of certain Fund expenses in connection with the investments in Morgan Stanley affiliates during the period. The effect of the rebate on the ratios is disclosed in the above table as "Ratio of Rebate from Morgan Stanley Affiliates to Average Net Assets."
(6) Amount is less than 0.005%.
(7) Not annualized.
(8) Annualized.
The accompanying notes are an integral part of the financial statements.
17
Morgan Stanley Institutional Fund, Inc.
Annual Report — December 31, 2017
Financial Highlights
Small Company Growth Portfolio
| | | Class IS | |
| | | Year Ended December 31, | | Period from
September 13, 2013(2) to | |
Selected Per Share Data and Ratios | | 2017 | | 2016(1) | | 2015 | | 2014 | | December 31, 2013 | |
Net Asset Value, Beginning of Period | | $ | 13.29 | | | $ | 13.77 | | | $ | 16.51 | | | $ | 20.55 | | | $ | 19.51 | | |
Income (Loss) from Investment Operations: | |
Net Investment Income (Loss)(3) | | | (0.10 | ) | | | 0.01 | | | | (0.03 | ) | | | (0.03 | ) | | | (0.02 | ) | |
Net Realized and Unrealized Gain (Loss) | | | 2.93 | | | | (0.05 | ) | | | (1.52 | ) | | | (2.06 | ) | | | 3.15 | | |
Total from Investment Operations | | | 2.83 | | | | (0.04 | ) | | | (1.55 | ) | | | (2.09 | ) | | | 3.13 | | |
Distributions from and/or in Excess of: | |
Net Realized Gain | | | (5.16 | ) | | | (0.44 | ) | | | (1.19 | ) | | | (1.95 | ) | | | (2.09 | ) | |
Redemption Fees | | | 0.00 | (4) | | | 0.00 | (4) | | | 0.00 | (4) | | | 0.00 | (4) | | | 0.00 | (4) | |
Net Asset Value, End of Period | | $ | 10.96 | | | $ | 13.29 | | | $ | 13.77 | | | $ | 16.51 | | | $ | 20.55 | | |
Total Return(5) | | | 22.08 | % | | | (0.28 | )% | | | (9.52 | )% | | | (9.63 | )% | | | 16.50 | %(10) | |
Ratios and Supplemental Data: | |
Net Assets, End of Period (Thousands) | | $ | 129,126 | | | $ | 361,586 | | | $ | 660,134 | | | $ | 671,885 | | | $ | 125,351 | | |
Ratio of Expenses to Average Net Assets(12) | | | 0.92 | %(6) | | | 0.95 | %(6)(8) | | | 0.98 | %(6) | | | 0.97 | %(6) | | | 0.97 | %(6)(7)(11) | |
Ratio of Expenses to Average Net Assets Excluding Non Operating Expenses | | | 0.92 | %(6) | | | N/A | | | | N/A | | | | N/A | | | | N/A | | |
Ratio of Net Investment Income (Loss) to Average Net Assets(12) | | | (0.71 | )%(6) | | | 0.08 | %(6) | | | (0.21 | )%(6) | | | (0.17 | )%(6) | | | (0.30 | )%(6)(11) | |
Ratio of Rebate from Morgan Stanley Affiliates to Average Net Assets | | | 0.01 | % | | | 0.00 | %(9) | | | 0.00 | %(9) | | | 0.00 | %(9) | | | 0.01 | %(11) | |
Portfolio Turnover Rate | | | 97 | % | | | 51 | % | | | 42 | % | | | 53 | % | | | 43 | % | |
(12) Supplemental Information on the Ratios to Average Net Assets: | |
Ratios Before Expense Limitation: | |
Expenses to Average Net Assets | | | 1.09 | % | | | 1.03 | % | | | 0.99 | % | | | 0.98 | % | | | 0.99 | %(11) | |
Net Investment Loss to Average Net Assets | | | (0.88 | )% | | | (0.00 | )% | | | (0.22 | )% | | | (0.18 | )% | | | (0.32 | )%(11) | |
(1) Reflects prior period custodian out-of-pocket expenses that were reimbursed in September 2016. The amount of the reimbursement was immaterial on a per share basis and did not impact the total return of Class IS shares. The Ratio of Expenses to Average Net Assets and the Ratio of Net Investment Income to Average Net Assets would be unchanged as the reimbursement of custodian fees was offset against expense waivers/reimbursements with no impact to net expenses or net investment income.
(2) Commencement of Offering.
(3) Per share amount is based on average shares outstanding.
(4) Amount is less than $0.005 per share.
(5) Calculated based on the net asset value as of the last business day of the period.
(6) The Ratios of Expenses and Net Investment Income (Loss) reflect the rebate of certain Fund expenses in connection with the investments in Morgan Stanley affiliates during the period. The effect of the rebate on the ratios is disclosed in the above table as "Ratio of Rebate from Morgan Stanley Affiliates to Average Net Assets."
(7) Effective September 16, 2013, the Adviser has agreed to limit the ratio of expenses to average net assets to the maximum ratio of 0.98% for Class IS shares.
(8) Effective July 1, 2016, the Adviser has agreed to limit the ratio of expenses to average net assets to the maximum ratio of 0.93% for Class IS shares. Prior to July 1, 2016, the maximum ratio was 0.98% for Class IS shares.
(9) Amount is less than 0.005%.
(10) Not annualized.
(11) Annualized.
The accompanying notes are an integral part of the financial statements.
18
Morgan Stanley Institutional Fund, Inc.
Annual Report — December 31, 2017
Notes to Financial Statements
Morgan Stanley Institutional Fund, Inc. (the "Company") is registered under the Investment Company Act of 1940, as amended (the "Act"), as an open-end management investment company. The Company is comprised of twenty-nine separate, active, diversified and non-diversified funds (individually referred to as a "Fund", collectively as the "Funds"). The Company applies investment company accounting and reporting guidance.
The accompanying financial statements relate to the Small Company Growth Portfolio. The Fund seeks long-term capital appreciation by investing primarily in growth-oriented equity securities of small capitalization companies.
The Fund offers five classes of shares — Class I, Class A, Class L, Class C and Class IS. On May 31, 2017, the Fund recommenced offering Class I, Class A and Class IS shares and commenced offering Class C shares. The Fund suspended offering of Class L shares. Existing Class L shareholders may invest through reinvestment of dividends and distributions.
A. Significant Accounting Policies: The following significant accounting policies are in conformity with U.S. generally accepted accounting principles ("GAAP"). Such policies are consistently followed by the Company in the preparation of its financial statements. GAAP may require management to make estimates and assumptions that affect the reported amounts and disclosures in the financial statements. Actual results may differ from those estimates.
1. Security Valuation: (1) An equity portfolio security listed or traded on an exchange is valued at its latest reported sales price (or at the exchange official closing price if such exchange reports an official closing price), and if there were no sales on a given day and if there is no official exchange closing price for that day, the security is valued at the mean between the last reported bid and asked prices if such bid and asked prices are available on the relevant exchanges. Listed equity securities not traded on the valuation date with no reported bid and asked prices available on the exchange are valued at the mean between the current bid and asked prices obtained from one or more reputable brokers or dealers. In cases where a security is traded on more than one exchange, the security is valued on the exchange designated as the primary market; (2) all other equity portfolio securities for which over-the-counter ("OTC") market quotations are readily available are valued at the latest reported sales price (or at the market official closing price if such market reports an
official closing price), and if there was no trading in the security on a given day and if there is no official closing price from relevant markets for that day, the security is valued at the mean between the last reported bid and asked prices if such bid and asked prices are available on the relevant markets. An unlisted equity security that does not trade on the valuation date and for which bid and asked prices from the relevant markets are unavailable is valued at the mean between the current bid and asked prices obtained from one or more reputable brokers or dealers; (3) certain portfolio securities may be valued by an outside pricing service/vendor approved by the Company's Board of Directors (the "Directors"). The pricing service/vendor may employ a pricing model that takes into account, among other things, bids, yield spreads, and/or other market data and specific security characteristics. Alternatively, if a valuation is not available from an outside pricing service/vendor, and the security trades on an exchange, the security may be valued at its latest reported sale price (or at the exchange official closing price if such exchange reports an official closing price), prior to the time when assets are valued. If there are no sales on a given day and if there is no official exchange closing price for that day, the security is valued at the mean between the last reported bid and asked prices if such bid and asked prices are available in the relevant exchanges; (4) listed options are valued at the last reported sales price on the exchange on which they are listed (or at the exchange official closing price if such exchange reports an official closing price). If an official closing price or last reported sales price is unavailable, the listed option should be fair valued at the mean between its latest bid and ask prices. Unlisted options are valued at the mean between their latest bid and ask prices from a broker/dealer or valued by a pricing service/vendor; (5) when market quotations are not readily available, including circumstances under which Morgan Stanley Investment Management Inc. (the "Adviser") determines that the closing price, last sale price or the mean between the last reported bid and asked prices are not reflective of a security's market value, portfolio securities are valued at their fair value as determined in good faith under procedures established by and under the general supervision of the Directors. Occasionally, developments affecting the closing prices of securities and other assets may occur between the times at which valuations of such securities are determined (that is, close of the foreign market
19
Morgan Stanley Institutional Fund, Inc.
Annual Report — December 31, 2017
Notes to Financial Statements (cont'd)
on which the securities trade) and the close of business of the New York Stock Exchange ("NYSE"). If developments occur during such periods that are expected to materially affect the value of such securities, such valuations may be adjusted to reflect the estimated fair value of such securities as of the close of the NYSE, as determined in good faith by the Directors or by the Adviser using a pricing service and/or procedures approved by the Directors; (6) quotations of foreign portfolio securities, other assets and liabilities and forward contracts stated in foreign currency are translated into U.S. dollar equivalents at the prevailing market rates prior to the close of the NYSE; and (7) investments in mutual funds, including the Morgan Stanley Institutional Liquidity Funds, are valued at the net asset value ("NAV") as of the close of each business day.
The Directors have responsibility for determining in good faith the fair value of the investments, and the Directors may appoint others, such as the Company's Adviser or a valuation committee, to assist the Directors in determining fair value and to make the actual calculations pursuant to the fair valuation methodologies previously approved by the Directors. Under procedures approved by the Directors, the Company's Adviser has formed a Valuation Committee whose members are approved by the Directors. The Valuation Committee provides administration and oversight of the Company's valuation policies and procedures, which are reviewed at least annually by the Directors. These procedures allow the Company to utilize independent pricing services, quotations from securities and financial instrument dealers, and other market sources to determine fair value.
The Company has procedures to determine the fair value of securities and other financial instruments for which market prices are not readily available. Under these procedures, the Valuation Committee convenes on a regular and ad hoc basis to review such securities and considers a number of factors, including valuation methodologies and significant unobservable valuation inputs, when arriving at fair value. The Valuation Committee may employ a market-based approach which may use related or comparable assets or liabilities, recent transactions, market multiples, book values, and other relevant information for the investment to determine the fair value of the investment. An income-based valua-
tion approach may also be used in which the anticipated future cash flows of the investment are discounted to calculate fair value. Discounts may also be applied due to the nature or duration of any restrictions on the disposition of the investments. Due to the inherent uncertainty of valuations of such investments, the fair values may differ significantly from the values that would have been used had an active market existed. The Valuation Committee employs various methods for calibrating these valuation approaches including a regular review of valuation methodologies, key inputs and assumptions, transactional back-testing or disposition analysis, and reviews of any related market activity.
2. Fair Value Measurement: Financial Accounting Standards Board ("FASB") Accounting Standards CodificationTM ("ASC") 820, "Fair Value Measurement" ("ASC 820"), defines fair value as the value that the Fund would receive to sell an investment or pay to transfer a liability in a timely transaction with an independent buyer in the principal market, or in the absence of a principal market, the most advantageous market for the investment or liability. ASC 820 establishes a three-tier hierarchy to distinguish between (1) inputs that reflect the assumptions market participants would use in valuing an asset or liability developed based on market data obtained from sources independent of the reporting entity (observable inputs) and (2) inputs that reflect the reporting entity's own assumptions about the assumptions market participants would use in valuing an asset or liability developed based on the best information available in the circumstances (unobservable inputs) and to establish classification of fair value measurements for disclosure purposes. Various inputs are used in determining the value of the Fund's investments. The inputs are summarized in the three broad levels listed below.
• Level 1 – unadjusted quoted prices in active markets for identical investments
• Level 2 – other significant observable inputs (including quoted prices for similar investments, interest rates, prepayment speeds, credit risk, etc.)
• Level 3 – significant unobservable inputs including the Fund's own assumptions in determining the fair value of investments. Factors
20
Morgan Stanley Institutional Fund, Inc.
Annual Report — December 31, 2017
Notes to Financial Statements (cont'd)
considered in making this determination may include, but are not limited to, information obtained by contacting the issuer, analysts, or the appropriate stock exchange (for exchange-traded securities), analysis of the issuer's financial statements or other available documents and, if necessary, available information concerning other securities in similar circumstances
The inputs or methodology used for valuing securities are not necessarily an indication of the risk associated with investing in those securities and the determination of the significance of a particular input to the fair value measurement in its entirety requires judgment and considers factors specific to each security.
The following is a summary of the inputs used to value the Fund's investments as of December 31, 2017.
Investment Type | | Level 1
Unadjusted
quoted
prices
(000) | | Level 2
Other
significant
observable
inputs
(000) | | Level 3
Significant
unobservable
inputs
(000) | | Total
(000) | |
Assets: | |
Common Stocks | |
Biotechnology | | $ | 8,366 | | | $ | — | | | $ | — | | | $ | 8,366 | | |
Construction Materials | | | 10,448 | | | | — | | | | — | | | | 10,448 | | |
Consumer Finance | | | 2,013 | | | | — | | | | — | | | | 2,013 | | |
Health Care Equipment &
Supplies | | | 8,359 | | | | — | | | | — | | | | 8,359 | | |
Health Care Providers &
Services | | | 19,279 | | | | — | | | | — | | | | 19,279 | | |
Health Care Technology | | | 50,033 | | | | — | | | | — | | | | 50,033 | | |
Hotels, Restaurants &
Leisure | | | 38,327 | | | | — | | | | — | | | | 38,327 | | |
Insurance | | | 2,928 | | | | — | | | | — | | | | 2,928 | | |
Internet & Direct
Marketing Retail | | | 32,726 | | | | — | | | | — | | | | 32,726 | | |
Internet Software &
Services | | | 53,287 | | | | — | | | | — | | | | 53,287 | | |
Machinery | | | 16,944 | | | | — | | | | — | | | | 16,944 | | |
Multi-Line Retail | | | 5,110 | | | | — | | | | — | | | | 5,110 | | |
Personal Products | | | 3,474 | | | | — | | | | — | | | | 3,474 | | |
Professional Services | | | 16,536 | | | | — | | | | — | | | | 16,536 | | |
Software | | | 26,493 | | | | 3,100 | | | | — | | | | 29,593 | | |
Specialty Retail | | | 10,693 | | | | — | | | | — | | | | 10,693 | | |
Thrifts & Mortgage
Finance | | | 2,319 | | | | — | | | | — | | | | 2,319 | | |
Total Common Stocks | | | 307,335 | | | | 3,100 | | | | — | | | | 310,435 | | |
Preferred Stocks | |
Health Care Technology | | | — | | | | — | | | | 5,787 | | | | 5,787 | | |
Internet Software &
Services | | | — | | | | — | | | | 3,014 | | | | 3,014 | | |
Software | | | — | | | | — | | | | 9,027 | | | | 9,027 | | |
Total Preferred Stocks | | | — | | | | — | | | | 17,828 | | | | 17,828 | | |
Investment Type | | Level 1
Unadjusted
quoted
prices
(000) | | Level 2
Other
significant
observable
inputs
(000) | | Level 3
Significant
unobservable
inputs
(000) | | Total
(000) | |
Call Options Purchased | | $ | — | | | $ | 123 | | | $ | — | | | $ | 123 | | |
Short-Term Investments | |
Investment Company | | | 38,053 | | | | — | | | | — | | | | 38,053 | | |
Repurchase Agreements | | | — | | | | 12,028 | | | | — | | | | 12,028 | | |
Total Short-Term
Investments | | | 38,053 | | | | 12,028 | | | | — | | | | 50,081 | | |
Total Assets | | $ | 345,388 | | | $ | 15,251 | | | $ | 17,828 | | | $ | 378,467 | | |
Transfers between investment levels may occur as the markets fluctuate and/or the availability of data used in an investment's valuation changes. The Fund recognizes transfers between the levels as of the end of the period. As of December 31, 2017, securities with a total value of approximately $3,100,000 transferred from Level 1 to Level 2. Securities that were valued using unadjusted quoted prices at December 31, 2016 were valued using other significant observable inputs at December 31, 2017. At December 31, 2017, the fair value of certain securities were adjusted due to developments which occurred between the time of the close of the foreign markets on which they trade and the close of business on the NYSE which resulted in their Level 2 classification.
Following is a reconciliation of investments in which significant unobservable inputs (Level 3) were used in determining fair value.
| | | Common
Stock
(000) | | Preferred
Stocks
(000) | | Promissory
Notes
(000) | |
Beginning Balance | | $ | — | † | | $ | 62,200 | | | $ | — | † | |
Purchases | | | — | | | | — | | | | — | | |
Sales | | | — | † | | | (40,595 | ) | | | — | | |
Amortization of discount | | | — | | | | — | | | | (1 | ) | |
Transfers in | | | — | | | | — | | | | — | | |
Transfers out | | | — | | | | — | | | | — | | |
Corporate actions | | | — | | | | (12,317 | ) | | | (2,337 | ) | |
Change in unrealized appreciation
(depreciation) | | | — | | | | (4,114 | ) | | | 2,338 | | |
Realized gains (losses) | | | — | | | | 12,654 | | | | — | | |
Ending Balance | | $ | — | | | $ | 17,828 | | | $ | — | | |
Net change in unrealized appreciation
(depreciation) from investments still
held as of December 31, 2017 | | $ | — | | | $ | (2,990 | ) | | $ | — | | |
† Includes one or more securities which are valued at zero.
21
Morgan Stanley Institutional Fund, Inc.
Annual Report — December 31, 2017
Notes to Financial Statements (cont'd)
The following table presents additional information about valuation techniques and inputs used for investments that are measured at fair value and categorized within Level 3 as of December 31, 2017. Various valuation techniques were used in the valuation of certain investments and weighted based on the level of significance.
| | | Fair Value at
December 31, 2017
(000) | | Valuation
Technique | | Unobservable
Input | | Range | | Selected
Value | | Impact to
Valuation from an
increase in input | |
Health Care Technology | |
Preferred Stock | | $ | 5,787 | | | Discounted Cash Flow | | Weighted Average
Cost of Capital | | | 16.0 | % | | | 18.0 | % | | | 17.0 | % | | Decrease | |
| | | | | | | Perpetual Growth Rate | | | 3.0 | % | | | 4.0 | % | | | 3.5 | % | | Increase | |
| | | | | Market Comparable
Companies | | Enterprise Value/
Revenue | | | 5.3 | x | | | 20.0 | x | | | 7.5 | x | | Increase | |
| | | | | | | Discount for Lack of
Marketability | | | 20.0 | % | | | 20.0 | % | | | 20.0 | % | | Decrease | |
Internet Software & Services | |
Preferred Stock | | $ | 3,014 | | | Discounted Cash Flow | | Weighted Average
Cost of Capital | | | 19.0 | % | | | 21.0 | % | | | 20.0 | % | | Decrease | |
| | | | | | | Perpetual Growth Rate | | | 3.0 | % | | | 4.0 | % | | | 3.5 | % | | Increase | |
| | | | | Market Comparable
Companies | | Enterprise Value/
Revenue | | | 3.4 | x | | | 9.1 | x | | | 4.5 | x | | Increase | |
| | | | | | | Discount for Lack of
Marketability | | | 20.0 | % | | | 20.0 | % | | | 20.0 | % | | Decrease | |
Software | |
Preferred Stocks | | $ | 6,668 | | | Discounted Cash Flow | | Weighted Average
Cost of Capital | | | 16.5 | % | | | 18.5 | % | | | 17.5 | % | | Decrease | |
| | | | | | | Perpetual Growth Rate | | | 3.0 | % | | | 4.0 | % | | | 3.5 | % | | Increase | |
| | | | | Market Comparable
Companies | | Enterprise Value/
Revenue | | | 1.7 | x | | | 8.8 | x | | | 6.2 | x | | Increase | |
| | | | | | | Discount for Lack of
Marketability | | | 15.0 | % | | | 15.0 | % | | | 15.0 | % | | Decrease | |
| | | $ | 2,359 | | | Discounted Cash Flow | | Weighted Average
Cost of Capital | | | 17.5 | % | | | 19.5 | % | | | 18.5 | % | | Decrease | |
| | | | | | | Perpetual Growth Rate | | | 3.0 | % | | | 4.0 | % | | | 3.5 | % | | Increase | |
| | | | | Market Comparable
Companies | | Enterprise Value/
Revenue | | | 1.6 | x | | | 7.7 | x | | | 5.3 | x | | Increase | |
| | | | | | | Discount for Lack of
Marketability | | | 20.0 | % | | | 20.0 | % | | | 20.0 | % | | Decrease | |
3. ��Repurchase Agreements: The Fund may enter into repurchase agreements under which the Fund lends cash and takes possession of securities with an agreement that the counterparty will repurchase such securities. In connection with transactions in repurchase agreements, a bank as custodian for the Fund takes possession of the underlying securities which are held as collateral, with a market value at least equal to the amount of the repurchase transaction, including principal and accrued interest. To the extent that any repurchase transaction exceeds one business day, the value of the collateral is marked-to-market on a daily basis to determine that the value of the collateral does not decrease below the repurchase price plus accrued interest
as earned. If such a decrease occurs, additional collateral will be requested and, when received, will be added to the account to maintain full collateralization. In the event of default on the obligation to repurchase, the Fund has the right to liquidate the collateral and apply the proceeds in satisfaction of the obligation. In the event of default or bankruptcy by the counterparty to the agreement, realization of the collateral proceeds may be subject to cost and delays. The Fund, along with other affiliated investment companies, may utilize a joint trading account for the purpose of entering into repurchase agreements.
22
Morgan Stanley Institutional Fund, Inc.
Annual Report — December 31, 2017
Notes to Financial Statements (cont'd)
4. Foreign Currency Translation and Foreign Investments: The books and records of the Fund are maintained in U.S. dollars. Foreign currency amounts are translated into U.S. dollars as follows:
– investments, other assets and liabilities at the prevailing rate of exchange on the valuation date;
– investment transactions and investment income at the prevailing rates of exchange on the dates of such transactions.
Although the net assets of the Fund are presented at the foreign exchange rates and market values at the close of the period, the Fund does not isolate that portion of the results of operations arising as a result of changes in the foreign exchange rates from the fluctuations arising from changes in the market prices of securities held at period end. Similarly, the Fund does not isolate the effect of changes in foreign exchange rates from the fluctuations arising from changes in the market prices of securities sold during the period. Accordingly, realized and unrealized foreign currency gains (losses) on investments in securities are included in the reported net realized and unrealized gains (losses) on investment transactions and balances. However, pursuant to U.S. federal income tax regulations, gains and losses from certain foreign currency transactions and the foreign currency portion of gains and losses realized on sales and maturities of foreign denominated debt securities are treated as ordinary income for U.S. federal income tax purposes.
Net realized gains (losses) on foreign currency transactions represent net foreign exchange gains (losses) from foreign currency forward exchange contracts, disposition of foreign currencies, currency gains (losses) realized between the trade and settlement dates on securities transactions, and the difference between the amount of investment income and foreign withholding taxes recorded on the Fund's books and the U.S. dollar equivalent amounts actually received or paid. Net unrealized currency gains (losses) from valuing foreign currency denominated assets and liabilities at period end exchange rates are reflected as a component of unrealized appreciation (depreciation) in the Statement of Assets and Liabilities. The change in unrealized currency gains (losses) on foreign currency translations for the period is reflected in the Statement of Operations.
Foreign security and currency transactions may involve certain considerations and risks not typically associated with those of U.S. dollar denominated transactions as a result of, among other factors, fluctuations of exchange rates in relation to the U.S. dollar, the possibility of lower levels of governmental supervision and regulation of foreign securities markets and the possibility of political or economic instability.
Governmental approval for foreign investments may be required in advance of making an investment under certain circumstances in some countries, and the extent of foreign investments in domestic companies may be subject to limitation in other countries. Foreign ownership limitations also may be imposed by the charters of individual companies to prevent, among other concerns, violations of foreign investment limitations. As a result, an additional class of shares (identified as "Foreign" in the Portfolio of Investments) may be created and offered for investment. The "local" and "foreign shares" market values may differ. In the absence of trading of the foreign shares in such markets, the Fund values the foreign shares at the closing exchange price of the local shares.
5. Derivatives: The Fund may, but is not required to, use derivative instruments for a variety of purposes, including hedging, risk management, portfolio management or to earn income. Derivatives are financial instruments whose value is based, in part, on the value of an underlying asset, interest rate, index or financial instrument. Prevailing interest rates and volatility levels, among other things, also affect the value of derivative instruments. A derivative instrument often has risks similar to its underlying asset and may have additional risks, including imperfect correlation between the value of the derivative and the underlying asset, risks of default by the counterparty to certain transactions, magnification of losses incurred due to changes in the market value of the securities, instruments, indices or interest rates to which the derivative instrument relates, risks that the transactions may not be liquid and risks arising from margin requirements. The use of derivatives involves risks that are different from, and possibly greater than, the risks associated with other portfolio investments. Derivatives may involve the use of highly specialized instruments that require investment techniques and risk analyses different from those associated with other portfolio investments. All of the Fund's holdings, including derivative instruments, are marked-to-market each day
23
Morgan Stanley Institutional Fund, Inc.
Annual Report — December 31, 2017
Notes to Financial Statements (cont'd)
with the change in value reflected in unrealized appreciation (depreciation). Upon disposition, a realized gain or loss is recognized.
Certain derivative transactions may give rise to a form of leverage. Leverage magnifies the potential for gain and the risk of loss. Leverage associated with derivative transactions may cause the Fund to liquidate portfolio positions when it may not be advantageous to do so to satisfy its obligations or to meet earmarking or segregation requirements, pursuant to applicable Securities and Exchange Commission ("SEC") rules and regulations, or may cause the Fund to be more volatile than if the Fund had not been leveraged. Although the Adviser seeks to use derivatives to further the Fund's investment objectives, there is no assurance that the use of derivatives will achieve this result.
Following is a description of the derivative instruments and techniques that the Fund used during the period and their associated risks:
Options: With respect to options, the Fund is subject to equity risk, interest rate risk and foreign currency exchange risk in the normal course of pursuing its investment objectives. If the Fund buys an option, it buys a legal contract giving it the right to buy or sell a specific amount of the underlying instrument or foreign currency, or futures contract on the underlying instrument or foreign currency, at an agreed-upon price during a period of time or on a specified date typically in exchange for a premium paid by the Fund. The Fund may purchase and/or sell put and call options. Purchasing call options tends to increase the Fund's exposure to the underlying (or similar) instrument. Purchasing put options tends to decrease the Fund's exposure to the underlying (or similar) instrument. When entering into purchased option contracts, the Fund bears the risk of interest or exchange rates or securities prices moving unexpectedly, in which case, the Fund may not achieve the anticipated benefits of the purchased option contracts; however the risk of loss is limited to the premium paid. Purchased options are reported as part of "Total Investments in Securities" in the Statement of Assets and Liabilities. Premium paid for purchasing options which expired are treated as realized losses. If the Fund sells an option, it sells to another party the right to buy from or sell to the Fund a specific amount of the underlying instrument or foreign currency, or futures contract
on the underlying instrument or foreign currency, at an agreed-upon price during a period of time or on a specified date typically in exchange for a premium received by the Fund. When options are purchased OTC, the Fund bears the risk that the counterparty that wrote the option will be unable or unwilling to perform its obligations under the option contract. Options may also be illiquid and the Fund may have difficulty closing out its position. A decision as to whether, when and how to use options involves the exercise of skill and judgment and even a well-conceived option transaction may be unsuccessful because of market behavior or unexpected events. The prices of options can be highly volatile and the use of options can lower total returns.
FASB ASC 815, "Derivatives and Hedging" ("ASC 815"), is intended to improve financial reporting about derivative instruments by requiring enhanced disclosures to enable investors to better understand how and why the Fund uses derivative instruments, how these derivative instruments are accounted for and their effects on the Fund's financial position and results of operations.
The following table sets forth the fair value of the Fund's derivative contracts by primary risk exposure as of December 31, 2017.
| | | Asset Derivatives
Statement of Assets and
Liabilities Location | | Primary Risk
Exposure | | Value
(000) | |
Options Purchased | | Investments, at Value
(Options Purchased) | | Currency Risk | | $ | 123 | (a) | |
(a) Amounts are included in Investments in Securities in the Statement of Assets and Liabilities.
The following tables set forth by primary risk exposure the Fund's realized gains (losses) and change in unrealized appreciation (depreciation) by type of derivative contract for the year ended December 31, 2017 in accordance with ASC 815.
Realized Gain (Loss) | |
Primary Risk Exposure | | Derivative Type | | Value
(000) | |
Currency Risk | | Investments
(Options Purchased) | | $ | (738 | )(b) | |
(b) Amounts are included in Investments Sold in the Statement of Operations.
Change in Unrealized Appreciation (Depreciation) | |
Primary Risk Exposure | | Derivative Type | | Value
(000) | |
Currency Risk | | Investments
(Options Purchased) | | $ | (669 | )(c) | |
(c) Amounts are included in Investments in the Statement of Operations.
24
Morgan Stanley Institutional Fund, Inc.
Annual Report — December 31, 2017
Notes to Financial Statements (cont'd)
At December 31, 2017, the Fund's derivative assets and liabilities are as follows:
Gross Amounts of Assets and Liabilities
Presented in the Statement of Assets and Liabilities | |
Derivatives | | Assets(d)
(000) | | Liabilities(d)
(000) | |
Options Purchased | | $ | 123 | (a) | | $ | — | | |
(a) Amounts are included in Investments in Securities in the Statement of Assets and Liabilities.
(d) Absent an event of default or early termination, OTC derivative assets and liabilities are presented gross and not offset in the Statement of Assets and Liabilities.
The Fund typically enters into International Swaps and Derivatives Association, Inc. Master Agreements ("ISDA Master Agreements") or similar master agreements (collectively, "Master Agreements") with its contract counterparties for certain OTC derivatives in order to, among other things, reduce its credit risk to counterparties. ISDA Master Agreements include provisions for general obligations, representations, collateral and events of default or termination. Under an ISDA Master Agreement, the Fund typically may offset with the counterparty certain OTC derivative financial instruments' payables and/or receivables with collateral held and/or posted and create one single net payment (close-out netting) in the event of default, termination and/or potential deterioration in the credit quality of the counterparty. Various Master Agreements govern the terms of certain transactions with counterparties, including transactions such as swap, forward, repurchase and reverse repurchase agreements. These Master Agreements typically attempt to reduce the counterparty risk associated with such transactions by specifying credit protection mechanisms and providing standardization that improves legal certainty. Cross-termination provisions under Master Agreements typically provide that a default in connection with one transaction between the Fund and a counterparty gives the non-defaulting party the right to terminate any other transactions in place with the defaulting party to create one single net payment due to/due from the defaulting party and may be a feature in certain Master Agreements. In the event the Fund exercises its right to terminate a Master Agreement after a counterparty experiences a termination event as defined in the Master Agreement, the return of collateral with market value in excess of the Fund's net liability may be delayed or denied.
The following table presents derivative financial instruments that are subject to enforceable netting arrangements as of December 31, 2017.
Gross Amounts Not Offset in the Statement of Assets and Liabilities | |
Counterparty | | Gross Asset
Derivatives
Presented in
Statement of
Assets and
Liabilities
(000) | | Financial
Instrument
(000) | | Collateral
Received(e)
(000) | | Net Amount
(not less
than $0)
(000) | |
Royal Bank of Scotland | | $ | 123 | (a) | | $ | — | | | $ | (123 | ) | | $ | 0 | | |
(a) Amounts are included in Investments in Securities in the Statement of Assets and Liabilities.
(e) In some instances, the actual collateral received may be more than the amount shown here due to overcollateralization.
For the year ended December 31, 2017, the approximate average monthly amount outstanding for each derivative type is as follows:
Options Purchased: | |
Average monthly notional amount | | | 128,580,000 | | |
6. Securities Lending: The Fund lends securities to qualified financial institutions, such as broker-dealers, to earn additional income. Any increase or decrease in the fair value of the securities loaned that might occur and any interest earned or dividends declared on those securities during the term of the loan would remain in the Fund. The Fund would receive cash or securities as collateral in an amount equal to or exceeding 100% of the current fair value of the loaned securities. The collateral is marked-to-market daily by State Street Bank and Trust Company ("State Street"), the securities lending agent, to ensure that a minimum of 100% collateral coverage is maintained.
Based on pre-established guidelines, the securities lending agent invests any cash collateral that is received in an affiliated money market portfolio and repurchase agreements. Securities lending income is generated from the earnings on the invested collateral and borrowing fees, less any rebates owed to the borrowers and compensation to the lending agent, and is recorded as "Income from Securities Loaned — Net" in the Fund's Statement of Operations. Risks in securities lending transactions are that a borrower may not provide additional collateral when required or return the securities when due, and that the value of the short-term investments will be less than the amount of cash collateral plus any rebate that is required to be returned to the borrower.
25
Morgan Stanley Institutional Fund, Inc.
Annual Report — December 31, 2017
Notes to Financial Statements (cont'd)
The Fund has the right under the securities lending agreement to recover the securities from the borrower on demand.
The following table presents financial instruments that are subject to enforceable netting arrangements as of December 31, 2017.
Gross Amounts Not Offset in the Statement of Assets and Liabilities | |
Gross Asset
Amounts
Presented in
Statement of
Assets and
Liabilities
(000) | | Financial
Instrument
(000) | | Collateral
Received
(000) | | Net Amount
(not less
than $0)
(000) | |
| $ | 43,641 | (f) | | $ | — | | | $ | (43,641 | )(g)(h) | | $ | 0 | | |
(f) Represents market value of loaned securities at year end.
(g) The Fund received cash collateral of approximately $44,909,000, which was subsequently invested in Repurchase Agreements and Morgan Stanley Institutional Liquidity Funds as reported in the Portfolio of Investments. In addition, the Fund received non-cash collateral of approximately $793,000 in the form of U.S. Government obligations, which the Fund cannot sell or repledge, and accordingly are not reflected in the Portfolio of Investments.
(h) The actual collateral received is greater than the amount shown here due to overcollateralization.
FASB ASC 860 "Transfers & Servicing: Repurchase-to-Maturity Transactions, Repurchase Financings, and Disclosures", is intended to provide increased transparency about the types of collateral pledged in securities lending transactions and other similar transactions that are accounted for as secured borrowing.
The following table displays a breakdown of transactions accounted for as secured borrowings, the gross obligations by class of collateral pledged, and the remaining contractual maturity of those transactions as of December 31, 2017.
Remaining Contractual Maturity of the Agreements | |
| | | Overnight and
Continuous
(000) | | <30 days
(000) | | Between
30 &
90 days
(000) | | >90 days
(000) | | Total
(000) | |
Securities Lending
Transactions | |
Common Stocks | | $ | 44,909 | | | $ | — | | | $ | — | | | $ | — | | | $ | 44,909 | | |
Total Borrowings | | $ | 44,909 | | | $ | — | | | $ | — | | | $ | — | | | $ | 44,909 | | |
Gross amount of
recognized liabilities
for securities lending
transactions | | | | | | | | | | $ | 44,909 | | |
7. Restricted Securities: The Fund invests in unregistered or otherwise restricted securities. The term "restricted securities" refers to securities that are unregistered or are held by control persons of the issuer and securities that are
subject to contractual restrictions on their resale. As a result, restricted securities may be more difficult to value and the Fund may have difficulty disposing of such assets either in a timely manner or for a reasonable price. In order to dispose of an unregistered security, the Fund, where it has contractual rights to do so, may have to cause such security to be registered. A considerable period may elapse between the time the decision is made to sell the security and the time the security is registered so that the Fund can sell it. Contractual restrictions on the resale of securities vary in length and scope and are generally the result of a negotiation between the issuer and the acquirer of the securities. The Fund would, in either case, bear market risks during that period. Restricted securities are identified in the Portfolio of Investments.
8. Redemption Fees: The Fund will assess a 2% redemption fee, on Class I shares, Class A shares, Class L shares, Class C shares and Class IS shares, which is paid directly to the Fund, for shares redeemed or exchanged within thirty days of purchase, subject to certain exceptions. The redemption fee is designed to protect the Fund and its remaining shareholders from the effects of short-term trading. These fees, if any, are included in the Statements of Changes in Net Assets.
9. Indemnifications: The Company enters into contracts that contain a variety of indemnifications. The Company's maximum exposure under these arrangements is unknown. However, the Company has not had prior claims or losses pursuant to these contracts and expects the risk of loss to be remote.
10. Dividends and Distributions to Shareholders: Dividends and distributions to shareholders are recorded on the ex-dividend date. Dividends from net investment income, if any, are declared and paid annually. Net realized capital gains, if any, are distributed at least annually.
11. Security Transactions, Income and Expenses: Security transactions are accounted for on the trade date (date the order to buy or sell is executed). Realized gains and losses on the sale of investment securities are determined on the specific identified cost method. Dividend income and other distributions are recorded on the ex-dividend date (except for certain foreign dividends which may be recorded as soon as the Fund is informed of such dividends) net of applicable withholding taxes. Interest income is recognized on the accrual basis except
26
Morgan Stanley Institutional Fund, Inc.
Annual Report — December 31, 2017
Notes to Financial Statements (cont'd)
where collection is in doubt. Discounts are accreted and premiums are amortized over the life of the respective securities. Most expenses of the Company can be directly attributed to a particular Fund. Expenses which cannot be directly attributed are apportioned among the Funds based upon relative net assets or other appropriate methods. Income, expenses (other than class specific expenses — distribution and shareholder services, transfer agency and sub transfer agency fees) and realized and unrealized gains or losses are allocated to each class of shares based upon their relative net assets.
B. Advisory Fees: The Adviser, a wholly-owned subsidiary of Morgan Stanley, provides the Fund with advisory services under the terms of an Investment Advisory Agreement, paid quarterly, at the annual rate based on the daily net assets as follows:
First $1
billion | | Next $500
million | | Next $500
million | | Over $2
billion | |
| | 0.92 | % | | | 0.85 | % | | | 0.80 | % | | | 0.75 | % | |
For the year ended December 31, 2017, the advisory fee rate (net of waiver/rebate) was equivalent to an annual effective rate of 0.76% of the Fund's average daily net assets.
The Adviser has agreed to reduce its advisory fee and/or reimburse the Fund so that total annual portfolio operating expenses, excluding certain investment related expenses, taxes, interest and other extraordinary expenses (including litigation), will not exceed 1.00% for Class I shares, 1.35% for Class A shares, 1.85% for Class L shares, 2.10% for Class C shares and 0.93% for Class IS shares. The fee waivers and/or expense reimbursements will continue for at least one year from the date of the Fund's prospectus or until such time as the Directors act to discontinue all or a portion of such waivers and/or reimbursements when they deem such action is appropriate. For the year ended December 31, 2017, approximately $784,000 of advisory fees were waived and approximately $93,000 of other expenses were reimbursed by the Adviser pursuant to this arrangement.
C. Administration Fees: The Adviser also serves as Administrator to the Company and provides administrative services pursuant to an Administration Agreement for an annual fee, accrued daily and paid monthly, of 0.08% of the Fund's average daily net assets.
Under a Sub-Administration Agreement between the Administrator and State Street, State Street provides certain administrative services to the Company. For such services, the Administrator pays State Street a portion of the fee the Administrator receives from the Fund.
D. Distribution and Shareholder Services Fees: Morgan Stanley Distribution, Inc. ("MSDI" or the "Distributor"), a wholly-owned subsidiary of the Adviser and an indirect subsidiary of Morgan Stanley, serves as the Company's Distributor of Fund shares pursuant to a Distribution Agreement. The Company has adopted a Shareholder Services Plan with respect to Class A shares pursuant to Rule 12b-1 under the Act. Under the Shareholder Services Plan, the Fund pays the Distributor a shareholder services fee, accrued daily and paid monthly, at an annual rate of 0.25% of the Fund's average daily net assets attributable to Class A shares.
The Company has adopted a Distribution and Shareholder Services Plan with respect to Class L shares pursuant to Rule 12b-1 under the Act. Under the Distribution and Shareholder Services Plan, the Fund pays the Distributor a distribution fee, accrued daily and paid monthly, at an annual rate of 0.50% and a shareholder services fee, accrued daily and paid monthly, at an annual rate of 0.25% of the Fund's average daily net assets attributable to Class L shares.
The Company has adopted a Distribution and Shareholder Services Plan with respect to Class C shares pursuant to Rule 12b-1 under the Act. Under the Distribution and Shareholder Services Plan, the Fund pays the Distributor a distribution fee, accrued daily and paid monthly, at an annual rate of 0.75% and a shareholder services fee, accrued daily and paid monthly, at an annual rate of 0.25% of the Fund's average daily net assets attributable to Class C shares.
The distribution and shareholder services fees are used to support the expenses associated with servicing and maintaining accounts. The Distributor may compensate other parties for providing shareholder support services to investors who purchase Class A, Class L and Class C shares.
E. Dividend Disbursing and Transfer Agent: The Company's dividend disbursing and transfer agent is Boston Financial Data Services, Inc. ("BFDS"). Pursuant to a Transfer Agency Agreement, the Company pays BFDS a fee based on the number of classes, accounts and transactions relating to the Funds of the Company. Effective January 1, 2018, BFDS changed its name to DST Asset Manager Solutions, Inc.
F. Custodian Fees: State Street (the "Custodian") also serves as Custodian for the Company in accordance with a Custodian Agreement. The Custodian holds cash, securities, and other assets of the Company as required by the Act. Custody fees are payable monthly based on assets held in custody, investment purchases and sales activity and account
27
Morgan Stanley Institutional Fund, Inc.
Annual Report — December 31, 2017
Notes to Financial Statements (cont'd)
maintenance fees, plus reimbursement for certain out-of-pocket expenses.
G. Security Transactions and Transactions with Affiliates: For the year ended December 31, 2017, purchases and sales of investment securities for the Fund, other than long-term U.S. Government securities and short-term investments, were approximately $452,409,000 and $940,004,000, respectively. There were no purchases and sales of long-term U.S. Government securities for the year ended December 31, 2017.
The Fund invests in the Institutional Class of the Morgan Stanley Institutional Liquidity Funds — Treasury Securities Portfolio (the "Liquidity Funds"), an open-end management investment company managed by the Adviser, both directly and as a portion of the securities held as collateral on loaned securities. Advisory fees paid by the Fund are reduced by an amount equal to its pro-rata share of the advisory and administration fees paid by the Fund due to its investment in the Liquidity Funds. For the year ended December 31, 2017, advisory fees paid were reduced by approximately $30,000 relating to the Fund's investment in the Liquidity Funds.
A summary of the Fund's transactions in shares of the Liquidity Funds during the year ended December 31, 2017 is as follows:
Affiliated
Investment
Company | | Value
December 31,
2016
(000) | | Purchases
at
Cost
(000) | | Proceeds
from Sales
(000) | | Dividend
Income
(000) | |
Liquidity Funds | | $ | 89,258 | | | $ | 487,019 | | | $ | 538,224 | | | $ | 111 | | |
Affiliated
Investment
Company (cont'd) | | Realized
Gain
(Loss)
(000) | | Change in
Unrealized
Appreciation
(Depreciation)
(000) | | Value
December 31,
2017
(000) | |
Liquidity Funds | | $ | — | | | $ | — | | | $ | 38,053 | | |
During the year ended December 31, 2017, the Fund incurred approximately $20,000 in brokerage commissions with Morgan Stanley & Co., LLC, an affiliate of the Adviser/Administrator and Distributor, for portfolio transactions executed on behalf of the Fund.
The Fund is permitted to purchase and sell securities ("cross-trade") from and to other Morgan Stanley Funds as well as other funds and client accounts for which the Adviser or an affiliate of the Adviser serves as investment adviser, pursuant to procedures approved by the Directors in compliance with Rule 17a-7 under the Act (the "Rule"). Each cross-trade is executed at the current market price in compliance with
provisions of the Rule. For the year ended December 31, 2017, the Fund engaged in cross-trade sales of approximately $1,957,000 which resulted in net realized gains of approximately $1,011,000.
The Fund has an unfunded Deferred Compensation Plan (the "Compensation Plan"), which allows each independent Director to defer payment of all, or a portion, of the fees he or she receives for serving on the Board of Directors. Each eligible Director generally may elect to have the deferred amounts credited with a return equal to the total return on one or more of the Morgan Stanley funds that are offered as investment options under the Compensation Plan. Appreciation/depreciation and distributions received from these investments are recorded with an offsetting increase/decrease in the deferred compensation obligation and do not affect the NAV of the Fund.
H. Federal Income Taxes: It is the Fund's intention to continue to qualify as a regulated investment company and distribute all of its taxable and tax-exempt income. Accordingly, no provision for federal income taxes is required in the financial statements.
The Fund may be subject to taxes imposed by countries in which it invests. Such taxes are generally based on income and/or capital gains earned or repatriated. Taxes are accrued based on net investment income, net realized gains and net unrealized appreciation as such income and/or gains are earned. Taxes may also be based on transactions in foreign currency and are accrued based on the value of investments denominated in such currency.
FASB ASC 740-10, "Income Taxes — Overall", sets forth a minimum threshold for financial statement recognition of the benefit of a tax position taken or expected to be taken in a tax return. Management has concluded that there are no significant uncertain tax positions that would require recognition in the financial statements. If applicable, the Fund recognizes interest accrued related to unrecognized tax benefits in "Interest Expense" and penalties in "Other Expenses" in the Statement of Operations. The Fund files tax returns with the U.S. Internal Revenue Service, New York and various states. Generally, each of the tax years in the four-year period ended December 31, 2017, remains subject to examination by taxing authorities.
The tax character of distributions paid may differ from the character of distributions shown in the Statements of Changes in Net Assets due to short-term capital gains being treated as
28
Morgan Stanley Institutional Fund, Inc.
Annual Report — December 31, 2017
Notes to Financial Statements (cont'd)
ordinary income for tax purposes. The tax character of distributions paid during fiscal years 2017 and 2016 was as follows:
2017
Distributions
Paid From: | | 2016
Distributions
Paid From: | |
Ordinary
Income
(000) | | Long-Term
Capital Gain
(000) | | Ordinary
Income
(000) | | Long-Term
Capital Gain
(000) | |
| $ | 27,098 | | | $ | 109,126 | | | $ | — | | | $ | 29,791 | | |
The amount and character of income and gains to be distributed are determined in accordance with income tax regulations which may differ from GAAP. These book/tax differences are either considered temporary or permanent in nature.
Temporary differences are primarily due to differing book and tax treatments for the timing of the recognition of gains (losses) on certain investment transactions and the timing of the deductibility of certain expenses.
Permanent differences, primarily due to differing treatments of gains (losses) related to foreign currency transactions, a net operating loss, basis adjustments on partnerships, a nondeductible expense and equalization debits, resulted in the following reclassifications among the components of net assets at December 31, 2017:
Accumulated
Net Investment
Loss
(000) | | Distributions
in Excess of
Net Realized
Gain
(000) | | Paid-in-
Capital
(000) | |
| $ | 4,447 | | | $ | (73,697 | ) | | $ | 69,250 | | |
At December 31, 2017, the Fund had no distributable earnings on a tax basis.
I. Credit Facility: The Company and other Morgan Stanley funds participated in a $150,000,000 committed, unsecured revolving line of credit facility (the "Facility") with State Street. This Facility is to be used for temporary emergency purposes or funding of shareholder redemption requests. The interest rate on borrowings is based on the federal funds rate or 1 month LIBOR rate plus a spread. The Facility also has a commitment fee of 0.25% per annum based on the unused portion of the Facility. During the year ended December 31, 2017, the Fund did not have any borrowings under the Facility.
J. Other: At December 31, 2017, the Fund had record owners of 10% or greater. Investment activities of these shareholders could have a material impact on the Fund. The aggregate percentage of such owners was 32.9%.
29
Morgan Stanley Institutional Fund, Inc.
Annual Report — December 31, 2017
Report of Independent Registered Public Accounting Firm
To the Shareholders and Board of Directors of
Morgan Stanley Institutional Fund, Inc. —
Small Company Growth Portfolio
Opinion on the Financial Statements
We have audited the accompanying statement of assets and liabilities of Small Company Growth Portfolio (the "Fund") (one of the funds constituting the Morgan Stanley Institutional Fund, Inc. (the "Company")), including the portfolio of investments, as of December 31, 2017, and the related statement of operations for the year then ended, the statements of changes in net assets for each of the two years in the period then ended, the financial highlights for each of the five years in the period then ended and the related notes (collectively referred to as the "financial statements"). In our opinion, the financial statements present fairly, in all material respects, the financial position of Small Company Growth Portfolio (one of the funds constituting Morgan Stanley Institutional Fund, Inc.) at December 31, 2017, the results of its operations for the year then ended, the changes in its net assets for each of the two years in the period then ended and its financial highlights for each of the five years in the period then ended, in conformity with U.S. generally accepted accounting principles.
Basis for Opinion
These financial statements are the responsibility of the Company's management. Our responsibility is to express an opinion on the Fund's financial statements based on our audits. We are a public accounting firm registered with the Public Company Accounting Oversight Board (United States) ("PCAOB") and are required to be independent with respect to the Company in accordance with the U.S. federal securities law and the applicable rules and regulations of the Securities and Exchange Commission and the PCAOB.
We conducted our audits in accordance with the standards of the PCAOB. Those standards require that we plan and perform the audit to obtain reasonable assurance about whether the financial statements are free of material misstatement, whether due to error or fraud. The Company is not required to have, nor were we engaged to perform, an audit of the Company's internal control over financial reporting. As part of our audits, we are required to obtain an understanding of internal control over financial reporting, but not for the purpose of expressing an opinion on the effectiveness of the Company's internal control over financial reporting. Accordingly, we express no such opinion.
Our audits included performing procedures to assess the risks of material misstatement of the financial statements, whether due to error or fraud, and performing procedures that respond to those risks. Such procedures included examining, on a test basis, evidence regarding the amounts and disclosures in the financial statements. Our procedures included confirmation of securities owned as of December 31, 2017 by correspondence with the custodian and others or by other appropriate auditing procedures where replies from others were not received. Our audits also included evaluating the accounting principles used and significant estimates made by management, as well as evaluating the overall presentation of the financial statements. We believe that our audits provide a reasonable basis for our opinion.

We have served as the auditor of one or more Morgan Stanley investment companies since 2000.
Boston, Massachusetts
February 26, 2018
30
Morgan Stanley Institutional Fund, Inc.
Annual Report — December 31, 2017
Federal Tax Notice (unaudited)
For federal income tax purposes, the following information is furnished with respect to the distributions paid by the Fund during its taxable year ended December 31, 2017. For corporate shareholders, 0.1% of the dividends qualified for the dividends received deduction.
For federal income tax purposes, the following information is furnished with respect to the Fund's earnings for its taxable year ended December 31, 2017. When distributed, certain earnings may be subject to a maximum tax rate of 15% as provided for by the Jobs and Growth Tax Relief Reconciliation Act of 2003. The Fund designated up to a maximum of approximately $27,098,000 as taxable at this lower rate.
For federal income tax purposes, the following information is furnished with respect to the distributions paid by the Fund during its taxable year ended December 31, 2017. The Fund designated and paid approximately $109,126,000 as a long-term capital gain distribution.
In January, the Fund provides tax information to shareholders for the preceding calendar year.
31
Morgan Stanley Institutional Fund, Inc.
Annual Report — December 31, 2017
Privacy Notice (unaudited)
MORGAN STANLEY INVESTMENT MANAGEMENT INC.
AN IMPORTANT NOTICE CONCERNING OUR U.S. PRIVACY POLICY
We are required by federal law to provide you with a copy of our privacy policy annually. This policy applies to current and former individual investors in funds managed or sponsored by Morgan Stanley Investment Management Inc. ("MSIM") as well as current and former individual clients of MSIM. This policy is not applicable to partnerships, corporations, trusts or other non-individual clients or investors. Please note that we may amend this policy at any time, and will inform you of any changes as required by law.
WE RESPECT YOUR PRIVACY
We appreciate that you have provided us with your personal financial information. We strive to maintain the privacy of such information while we help you achieve your financial objectives. This Notice describes what non-public personal information we collect about you, why we collect it, when we may share it with others and how certain others may use it. It discusses the steps you may take to limit our sharing of certain information about you to affiliated companies in the Morgan Stanley family of companies ("other Morgan Stanley companies"). It also discloses how you may limit use of certain shared information for marketing purposes by other Morgan Stanley branded companies. Throughout this policy, we refer to the non-public information that personally identifies you or your accounts as "personal information.''
1. WHAT PERSONAL INFORMATION DO WE COLLECT ABOUT YOU?
We obtain personal information from applications and other forms you submit to us, from your dealings with us, from consumer reporting agencies, from our Web sites and from third parties and other sources.
For example:
• We may collect information such as your name, address, e-mail address, telephone/fax numbers, assets, income and investment objectives through subscription documents, applications and other forms you submit to us.
• We may obtain information about account balances, your use of account(s) and the types of products and services you prefer to receive from us through your dealings and transactions with us and other sources.
• We may obtain information about your creditworthiness and credit history from consumer reporting agencies.
• We may collect background information from and through third-party vendors to verify representations you have made and to comply with various regulatory requirements.
• If you interact with us through our public and private Web sites, we may collect information that you provide directly through online communications (such as an e-mail address). We may also collect information about your Internet service provider, your domain name, your computer's operating system and Web browser, your use of our Web sites and your product and service preferences, through the use of "cookies." Please consult the Terms of Use of these sites for more details.
2. WHEN DO WE DISCLOSE PERSONAL INFORMATION WE COLLECT ABOUT YOU?
We may disclose personal information we collect about you to other Morgan Stanley companies and to non-affiliated third parties.
a. Information We Disclose to Other Morgan Stanley Companies.
We may disclose personal information to other Morgan Stanley companies for a variety of reasons, including to manage your account(s) effectively, to service and process your transactions, to let you know about products and services offered by us and other Morgan Stanley companies, to manage our business, and as otherwise required or permitted by law. Offers for products and services from other Morgan Stanley companies are developed under conditions designed to safeguard your personal information.
32
Morgan Stanley Institutional Fund, Inc.
Annual Report — December 31, 2017
Privacy Notice (unaudited) (cont'd)
b. Information We Disclose to Non-affiliated Third Parties.
We do not disclose personal information that we collect about you to non-affiliated third parties except to those who provide marketing services on our behalf, to financial institutions with whom we have joint marketing agreements, and as otherwise required or permitted by law. For example, we may disclose personal information to non-affiliated third parties for servicing and processing transactions, to offer our own products and services, to protect against fraud, for institutional risk control, to respond to judicial process or to perform services on our behalf. When we share personal information with a non-affiliated third party, they are required to limit their use of personal information to the particular purpose for which it was shared and they are not allowed to share personal information with others except to fulfill that limited purpose or as may be permitted or required by law.
3. HOW DO WE PROTECT THE SECURITY AND CONFIDENTIALITY OF PERSONAL INFORMATION WE COLLECT ABOUT YOU?
We maintain physical, electronic and procedural security measures to help safeguard the personal information we collect about you. We have internal policies governing the proper handling of client information. Third parties that provide support or marketing services on our behalf may also receive personal information, and we require them to adhere to confidentiality standards with respect to such information.
4. HOW CAN YOU LIMIT THE SHARING OF CERTAIN TYPES OF PERSONAL INFORMATION WITH OTHER MORGAN STANLEY COMPANIES?
We offer you choices as to whether we share with other Morgan Stanley companies the personal information that was collected to determine your eligibility for products and services you request ("eligibility information"). Eligibility information does not include your identification information or personal information pertaining to our transactions or experiences with you. Please note that, even if you direct us not to share eligibility information with other Morgan Stanley companies ("opt-out"), we may still share personal information, including eligibility information, with those companies in circumstances excluded from the opt-out under applicable law, such as to process transactions or to service your account.
5. HOW CAN YOU LIMIT THE USE OF CERTAIN TYPES OF PERSONAL INFORMATION BY OTHER MORGAN STANLEY COMPANIES FOR MARKETING?
By following the opt-out instructions in Section 6 below, you may limit other Morgan Stanley branded companies from marketing their products or services to you based on personal information we disclose to them. This information may include, for example, your income and account history with us. Please note that, even if you choose to limit Other Morgan Stanley Companies from using personal information about you that we may share with them for marketing their products and services to you, Other Morgan Stanley Companies may use your personal information that they obtain from us to market to you in circumstances permitted by law, such as if the Other Morgan Stanley Company has its own relationship with you.
6. HOW CAN YOU SEND US AN OPT-OUT INSTRUCTION?
If you wish to limit our sharing of eligibility information about you with other Morgan Stanley companies or other Morgan Stanley companies' use of personal information for marketing purposes, as described in this notice, you may do so by:
• Calling us at (800) 548-7786
Monday–Friday between 8a.m. and 6p.m.(EST)
• Writing to us at the following address:
DST Asset Manager Solutions, Inc.
c/o Privacy Coordinator
P.O. Box 219804
Kansas City, Missouri 64121
33
Morgan Stanley Institutional Fund, Inc.
Annual Report — December 31, 2017
Privacy Notice (unaudited) (cont'd)
Your written request should include your name, address, telephone number and account number(s) to which the opt-out applies and whether you are opting out with respect to sharing of eligibility information (Section 4 above), or if information used for Marketing (Section 5 above) or both. Written opt-out requests should not be sent with any other correspondence. In order to process your request, we require that the request be provided by you directly and not through a third party.
Your opt-out preference will remain in effect with respect to this policy (as it may be amended) until you notify us otherwise. If you have a joint account, your direction for us not to share this information with other Morgan Stanley companies and for those other Morgan Stanley companies not to use your personal information for marketing will be applied to all account holders on that account. Please understand that if you limit our sharing or our affiliated companies' use of personal information, you and any joint account holder(s) may not receive information about Morgan Stanley products and services, including products or services that could help you manage your financial resources and achieve your investment objectives.
7. WHAT IF AN AFFILIATED COMPANY BECOMES A NON-AFFILIATED THIRD PARTY?
If, at any time in the future, an affiliated company becomes a non-affiliated third party, further disclosures of personal information made to the former affiliated company will be limited to those described in Section 2(b) above relating to non-affiliated third parties. If you elected under Section 6 to limit disclosures we make to affiliated companies, or use of personal information by affiliated companies, your election will not apply to use by any former affiliated company of your personal information in their possession once it becomes a non-affiliated third party.
SPECIAL NOTICE TO RESIDENTS OF VERMONT
The following section supplements our policy with respect to our individual clients who have a Vermont address and supersedes anything to the contrary in the above policy with respect to those clients only.
The state of Vermont requires financial institutions to obtain your consent prior to sharing personal information that they collect about you with affiliated companies and non-affiliated third parties other than in certain limited circumstances. Except as permitted by law, we will not share personal information we collect about you with non-affiliated third parties or other Morgan Stanley companies unless you provide us with your written consent to share such information ("opt-in").
If you wish to receive offers for investment products and services offered by or through other Morgan Stanley companies, please notify us in writing at the following address:
DST Asset Manager Solutions, Inc.
c/o Privacy Coordinator
P.O. Box 219804
Kansas City, Missouri 64121
Your authorization should include your name, address, telephone number and account number(s) to which the opt-in applies and should not be sent with any other correspondence. In order to process your authorization, we require that the authorization be provided by you directly and not through a third party.
SPECIAL NOTICE TO RESIDENTS OF CALIFORNIA
The following section supplements our policy with respect to our individual clients who have a California address and supersedes anything to the contrary in the above policy with respect to those clients only.
In response to a California law, if your account has a California home address, your personal information will not be disclosed to non-affiliated third parties except as permitted by applicable California law, and we will limit sharing such information with our affiliates to comply with California privacy laws that apply to us.
34
Morgan Stanley Institutional Fund, Inc.
Annual Report — December 31, 2017
Director and Officer Information (unaudited)
Independent Directors:
Name, Age and Address of
Independent Director | | Position(s)
Held with
Registrant | | Length of Time
Served* | | Principal Occupation(s) During Past 5 Years
and Other Relevant Professional Experience | | Number of
Portfolios in
Fund Complex
Overseen by
Independent
Director** | | Other Directorships
Held by Independent
Director*** | |
Frank L. Bowman (73)
c/o Perkins Coie LLP
Counsel to the Independent
Directors
30 Rockefeller Plaza
New York, NY 10112 | | Director | | Since
August
2006 | | President, Strategic Decisions, LLC (consulting) (since February 2009); Director or Trustee of various Morgan Stanley Funds (since August 2006); Chairperson of the Compliance and Insurance Committee (since October 2015); formerly, Chairperson of the Insurance Sub-Committee of the Compliance and Insurance Committee (2007-2015); served as President and Chief Executive Officer of the Nuclear Energy Institute (policy organization) (February 2005-November 2008); retired as Admiral, U.S. Navy after serving over 38 years on active duty including 8 years as Director of the Naval Nuclear Propulsion Program in the Department of the Navy and the U.S. Department of Energy (1996-2004); served as Chief of Naval Personnel (July 1994-September 1996) and on the Joint Staff as Director of Political Military Affairs (June 1992-July 1994); knighted as Honorary Knight Commander of the Most Excellent Order of the British Empire; awarded the Officier de l'Orde National du Mérite by the French Government; elected to the National Academy of Engineering (2009). | | | 88 | | | Director of BP p.l.c.; Director of Naval and Nuclear Technologies LLP; Director Emeritus of the Armed Services YMCA; Director of the U.S. Naval Submarine League; Member of the National Security Advisory Council of the Center for U.S. Global Engagement and a member of the CNA Military Advisory Board; Trustee of Fairhaven United Methodist Church; and Director of other various non-profit organizations. | |
Kathleen A. Dennis (64)
c/o Perkins Coie LLP
Counsel to the Independent Directors
30 Rockefeller Plaza
New York, NY 10112 | | Director | | Since
August
2006 | | President, Cedarwood Associates (mutual fund and investment management consulting) (since July 2006); Chairperson of the Liquidity and Alternatives Sub-Committee of the Investment Committee (since October 2006) and Director or Trustee of various Morgan Stanley Funds (since August 2006); formerly, Senior Managing Director of Victory Capital Management (1993-2006). | | | 89 | | | Director of various non-profit organizations. | |
Nancy C. Everett (62)
c/o Perkins Coie LLP
Counsel to the Independent Directors
30 Rockefeller Plaza
New York, NY 10112 | | Director | | Since
January
2015 | | Chief Executive Officer, Virginia Commonwealth University Investment Company (since November 2015); Owner, OBIR, LLC (institutional investment management consulting) (since June 2014); formerly, Managing Director, BlackRock Inc. (February 2011-December 2013); and Chief Executive Officer, General Motors Asset Management (a/k/a Promark Global Advisors, Inc.) (June 2005-May 2010). | | | 90 | | | Formerly, Member of Virginia Commonwealth University School of Business Foundation (2005-2016); Member of Virginia Commonwealth University Board of Visitors (2013-2015); Member of Committee on Directors for Emerging Markets Growth Fund, Inc. (2007-2010); Chairperson of Performance Equity Management, LLC (2006-2010); and Chairperson, GMAM Absolute Return Strategies Fund, LLC (2006-2010). | |
35
Morgan Stanley Institutional Fund, Inc.
Annual Report — December 31, 2017
Director and Officer Information (unaudited) (cont'd)
Independent Directors: (cont'd)
Name, Age and Address of
Independent Director | | Position(s)
Held with
Registrant | | Length of Time
Served* | | Principal Occupation(s) During Past 5 Years
and Other Relevant Professional Experience | | Number of
Portfolios in
Fund Complex
Overseen by
Independent
Director** | | Other Directorships
Held by Independent
Director*** | |
Jakki L. Haussler (60)
c/o Perkins Coie LLP
Counsel to the Independent Directors
30 Rockefeller Plaza
New York, NY 10112 | | Director | | Since
January
2015 | | Chairman and Chief Executive Officer, Opus Capital Group (since January 1996); formerly, Director, Capvest Venture Fund, LP (May 2000-December 2011); Partner, Adena Ventures, LP (July 1999-December 2010); Director, The Victory Funds (February 2005-July 2008). | | | 90 | | | Director of Cincinnati Bell Inc. and Member, Audit Committee and Compensation Committee; Director of Northern Kentucky University Foundation and Member, Investment Committee; Member of Chase College of Law Transactional Law Practice Center Board of Advisors; Director of Best Transport; Director of Chase College of Law Board of Visitors; formerly, Member, University of Cincinnati Foundation Investment Committee; Member, Miami University Board of Visitors (2008-2011); Trustee of Victory Funds (2005-2008) and Chairman, Investment Committee (2007-2008) and Member, Service Provider Committee (2005-2008). | |
Dr. Manuel H. Johnson (68)
c/o Johnson Smick
International, Inc.
220 I Street, NE — Suite 200
Washington, D.C. 20002 | | Director | | Since
July
1991 | | Senior Partner, Johnson Smick International, Inc. (consulting firm); Chairperson of the Investment Committee (since October 2006) and Director or Trustee of various Morgan Stanley Funds (since July 1991); Co-Chairman and a founder of the Group of Seven Council (G7C) (international economic commission); formerly, Chairperson of the Audit Committee (July 1991-September 2006), Vice Chairman of the Board of Governors of the Federal Reserve System and Assistant Secretary of the U.S. Treasury. | | | 88 | | | Director of NVR, Inc. (home construction). | |
Joseph J. Kearns (75)
c/o Kearns & Associates LLC
46 E Peninsula Center #385
Rolling Hills Estates, CA
90274-3712 | | Director | | Since
August
1994 | | Senior Adviser, Kearns & Associates LLC (investment consulting); Chairperson of the Audit Committee (since October 2006) and Director or Trustee of various Morgan Stanley Funds (since August 1994); formerly, Deputy Chairperson of the Audit Committee (July 2003-September 2006) and Chairperson of the Audit Committee of various Morgan Stanley Funds (since August 1994); CFO of the J. Paul Getty Trust. | | | 89 | | | Prior to August 10, 2016, Director of Electro Rent Corporation (equipment leasing); Prior to December 31, 2013, Director of The Ford Family Foundation. | |
36
Morgan Stanley Institutional Fund, Inc.
Annual Report — December 31, 2017
Director and Officer Information (unaudited) (cont'd)
Independent Directors: (cont'd)
Name, Age and Address of
Independent Director | | Position(s)
Held with
Registrant | | Length of Time
Served* | | Principal Occupation(s) During Past 5 Years
and Other Relevant Professional Experience | | Number of
Portfolios in
Fund Complex
Overseen by
Independent
Director** | | Other Directorships
Held by Independent
Director*** | |
Michael F. Klein (59)
c/o Perkins Coie LLP
Counsel to the Independent Directors
30 Rockefeller Plaza
New York, NY 10112 | | Director | | Since
August
2006 | | Managing Director, Aetos Capital, LLC (since March 2000); Co-President, Aetos Alternatives Management, LLC (since January 2004) and Co-Chief Executive Officer of Aetos Capital LLC (since August 2013); Chairperson of the Fixed Income Sub-Committee of the Investment Committee (since October 2006) and Director or Trustee of various Morgan Stanley Funds (since August 2006); formerly, Managing Director, Morgan Stanley & Co. Inc. and Morgan Stanley Dean Witter Investment Management, President, various Morgan Stanley Funds (June 1998-March 2000) and Principal, Morgan Stanley & Co. Inc. and Morgan Stanley Dean Witter Investment Management (August 1997-December 1999). | | | 88 | | | Director of certain investment funds managed or sponsored by Aetos Capital, LLC; Director of Sanitized AG and Sanitized Marketing AG (specialty chemicals). | |
Patricia Maleski (57)
c/o Perkins Coie LLP
Counsel to the Independent Directors
30 Rockefeller Plaza
New York, NY 10112 | | Director | | Since
January
2017 | | Managing Director, JPMorgan Asset Management (2004-2016); Oversight and Control Head of Fiduciary and Conflicts of Interest Program (2015-2016); Chief Control Officer-Global Asset Management (2013-2015); President, JPMorgan Funds (2010-2013); Chief Administrative Officer (2004-2013); various other positions including Treasurer and Board Liaison (since 2001). | | | 90 | | | None. | |
Michael E. Nugent (81)
522 Fifth Avenue
New York, NY 10036 | | Chair of the Board and Director | | Chair of the Boards since July 2006 and Director since July 1991 | | Chair of the Boards of various Morgan Stanley Funds (since July 2006); Chairperson of the Closed-End Fund Committee (since June 2012) and Director or Trustee of various Morgan Stanley Funds (since July 1991); formerly, Chairperson of the Insurance Committee (until July 2006); General Partner, Triumph Capital, L.P. (private investment partnership) (1988-2013). | | | 88 | | | None. | |
W. Allen Reed (70)
c/o Perkins Coie LLP
Counsel to the Independent Directors
30 Rockefeller Plaza
New York, NY 10112 | | Director | | Since
August
2006 | | Chairperson of the Equity Sub-Committee of the Investment Committee (since October 2006) and Director or Trustee of various Morgan Stanley Funds (since August 2006); formerly, President and CEO of General Motors Asset Management; Chairman and Chief Executive Officer of the GM Trust Bank and Corporate Vice President of General Motors Corporation (August 1994-December 2005). | | | 89 | | | Director of Legg Mason, Inc.; formerly, Director of the Auburn University Foundation (2010-2015). | |
Fergus Reid (85)
c/o Joe Pietryka, Inc.
85 Charles Colman Blvd.
Pawling, NY 12564 | | Director | | Since
June
1992 | | Chairman, Joe Pietryka, Inc.; Chairperson of the Governance Committee and Director or Trustee of various Morgan Stanley Funds (since June 1992). | | | 89 | | | Formerly, Trustee and Director of certain investment companies in the JP Morgan Fund Complex managed by JP Morgan Investment Management Inc. (1987-2012). | |
* This is the earliest date the Director began serving the Morgan Stanley Funds. Each Director serves an indefinite term, until his or her successor is elected.
** The Fund Complex includes (as of December 31, 2017) all open-end and closed-end funds (including all of their portfolios) advised by Morgan Stanley Investment Management Inc. (the "Adviser") and any funds that have an adviser that is an affiliated person of the Adviser (including, but not limited to, Morgan Stanley AIP GP LP).
*** This includes any directorships at public companies and registered investment companies held by the Director at any time during the past five years.
37
Morgan Stanley Institutional Fund, Inc.
Annual Report — December 31, 2017
Director and Officer Information (unaudited) (cont'd)
Executive Officers:
Name, Age and Address of Executive Officer | | Position(s) Held
with
Registrant | | Length of Time
Served* | | Principal Occupation(s) During Past 5 Years | |
John H. Gernon (54)
522 Fifth Avenue
New York, NY 10036 | | President and Principal Executive Officer | | Since
September
2013 | | President and Principal Executive Officer of the Equity and Fixed Income Funds and the Morgan Stanley AIP Funds (since September 2013) and the Liquidity Funds and various money market funds (since May 2014) in the Fund Complex; Managing Director of the Adviser; Head of Product (since 2006). | |
Timothy J. Knierim (58)
522 Fifth Avenue
New York, NY 10036 | | Chief Compliance Officer | | Since
December
2016 | | Managing Director of the Adviser and various entities affiliated with the Adviser; Chief Compliance Officer of various Morgan Stanley Funds and the Adviser (since December 2016) and Chief Compliance Officer of Morgan Stanley AIP GP LP (since 2014). Formerly, Managing Director and Deputy Chief Compliance Officer of the Adviser (2014-2016); and formerly, Chief Compliance Officer of Prudential Investment Management, Inc. (2007-2014). | |
Francis J. Smith (52)
522 Fifth Avenue
New York, NY 10036 | | Treasurer and Principal Financial Officer | | Treasurer since July 2003 and Principal Financial Officer since September 2002 | | Manging Director of the Adviser and various entities affiliated with the Adviser; Treasurer (since July 2003) and Principal Financial Officer of various Morgan Stanley Funds (since September 2002). | |
Mary E. Mullin (50)
522 Fifth Avenue
New York, NY 10036 | | Secretary | | Since
June
1999 | | Managing Director of the Adviser; Secretary of various Morgan Stanley Funds (since June 1999). | |
Michael J. Key (38)
522 Fifth Avenue
New York, NY 10036 | | Vice President | | Since
June
2017 | | Vice President of the Equity and Fixed Income Funds, Liquidity Funds, various money market funds and the Morgan Stanley AIP Funds in the Fund Complex (since June 2017); Executive Director of the Adviser; Head of Product Development for Equity and Fixed Income Funds (since August 2013). | |
* This is the earliest date the officer began serving the Morgan Stanley Funds. Each officer serves a one-year term, until his or her successor is elected and qualifies.
38
Morgan Stanley Institutional Fund, Inc.
Annual Report — December 31, 2017
Adviser and Administrator
Morgan Stanley Investment Management Inc.
522 Fifth Avenue
New York, New York 10036
Distributor
Morgan Stanley Distribution, Inc.
522 Fifth Avenue
New York, New York 10036
Dividend Disbursing and Transfer Agent
DST Asset Manager Solutions, Inc.
2000 Crown Colony Drive
Quincy, Massachusetts 02169
Custodian
State Street Bank and Trust Company
One Lincoln Street
Boston, Massachusetts 02111
Legal Counsel
Dechert LLP
1095 Avenue of the Americas
New York, New York 10036
Counsel to the Independent Directors
Perkins Coie LLP
30 Rockefeller Plaza
New York, New York 10112
Independent Registered Public Accounting Firm
Ernst & Young LLP
200 Clarendon Street
Boston, Massachusetts 02116
Reporting to Shareholders
Each Morgan Stanley Fund provides a complete schedule of portfolio holdings in its semi-annual and annual reports within 60 days of the end of the fund's second and fourth fiscal quarters. The semi-annual and annual reports are filed electronically with the Securities and Exchange Commission (SEC) on Form N-CSRS and Form N-CSR, respectively. Morgan Stanley also delivers the semi-annual and annual reports to fund shareholders and makes these reports available on its public website, www.morganstanley.com/im. Each Morgan Stanley fund also files a complete schedule of portfolio holdings with the SEC for the fund's first and third fiscal quarters on Form N-Q. Morgan Stanley does not deliver the reports for the first and third fiscal quarters to shareholders, nor are the reports posted to the Morgan Stanley public website. You may, however, obtain the Form N-Q filings (as well as the Form N-CSR and N-CSRS filings) by accessing the SEC's website, www.sec.gov. You may also review and copy them at the SEC's Public Reference Room in Washington, DC. Information on the operation of the SEC's Public Reference Room may be obtained by calling the SEC toll free at 1 (800) SEC-0330. You can also request copies of these materials, upon payment of a duplicating fee, by electronic request at the SEC's email address (publicinfo@sec.gov) or by writing to the SEC's Public Reference Section, Washington, D.C. 20549-1520.
Proxy Voting Policies and Procedures and Proxy Voting Record
You may obtain a copy of the Company's Proxy Voting Policy and Procedures and information regarding how the Company voted proxies relating to portfolio securities during the most recent twelve-month period ended June 30, without charge, upon request, by calling toll free 1 (800) 548-7786 or by visiting our website at www.morganstanley.com/im. This information is also available on the SEC's website at www.sec.gov.
This report is authorized for distribution only when preceded or accompanied by a prospectus or summary prospectus of the applicable Fund of Morgan Stanley Institutional Fund, Inc., which describes in detail the Fund's investment policies, risks, fees and expenses. Please read the prospectus carefully before you invest or send money. For additional information, including information regarding the investments comprising the Fund, please visit our website at www.morganstanley.com/im or call toll free 1 (800) 548-7786.
39
Printed in U.S.A.
This Report has been prepared for shareholders and may be distributed to others only if preceded or accompanied by a current prospectus.
Morgan Stanley Investment Management Inc.
522 Fifth Avenue
New York, New York 10036
© 2018 Morgan Stanley. Morgan Stanley Distribution, Inc.

IFISCGANN
2007719 EXP. 02.28.19

Morgan Stanley Institutional Fund, Inc.
US Core Portfolio
Annual Report
December 31, 2017

Morgan Stanley Institutional Fund, Inc.
Annual Report — December 31, 2017
Shareholders' Letter | | | 2 | | |
Expense Example | | | 3 | | |
Investment Overview | | | 4 | | |
Portfolio of Investments | | | 6 | | |
Statement of Assets and Liabilities | | | 7 | | |
Statement of Operations | | | 8 | | |
Statements of Changes in Net Assets | | | 9 | | |
Financial Highlights | | | 10 | | |
Notes to Financial Statements | | | 14 | | |
Report of Independent Registered Public Accounting Firm | | | 19 | | |
Federal Tax Notice | | | 20 | | |
Privacy Notice | | | 21 | | |
Director and Officer Information | | | 24 | �� | |
This report is authorized for distribution only when preceded or accompanied by a prospectus or summary prospectus of the applicable Fund of Morgan Stanley Institutional Fund, Inc. To receive a prospectus and/or statement of additional information (SAI), which contains more complete information such as investment objectives, charges, expenses, policies for voting proxies, risk considerations, and describes in detail each of the Fund's investment policies to the prospective investor, please call toll free 1 (800) 548-7786. Please read the prospectuses carefully before you invest or send money.
Additionally, you can access information about the Fund, including performance, characteristics, and investment team commentary, through Morgan Stanley Investment Management's website: www.morganstanley.com/im.
Market forecasts provided in this report may not necessarily come to pass. There is no guarantee that any sectors mentioned will continue to perform as discussed herein or that securities in such sectors will be held by the Fund in the future. There is no assurance that a fund will achieve its investment objective. Funds are subject to market risk, which is the possibility that market values of securities owned by the Fund will decline and, therefore, the value of the Fund's shares may be less than what you paid for them. Accordingly, you can lose money investing in this Fund. Please see the prospectus for more complete information on investment risks.
1
Morgan Stanley Institutional Fund, Inc.
Annual Report — December 31, 2017
Shareholders' Letter (unaudited)
Dear Shareholders,
We are pleased to provide this Annual report, in which you will learn how your investment in US Core Portfolio (the "Fund") performed during the latest twelve-month period.
Morgan Stanley Investment Management is a client-centric, investor-led organization. Our global presence, intellectual capital, and breadth of products and services enable us to partner with investors to meet the evolving challenges of today's financial markets. We aim to deliver superior investment service and to empower our clients to make the informed decisions that help them reach their investment goals.
As always, we thank you for selecting Morgan Stanley Investment Management, and look forward to working with you in the months and years ahead.
Sincerely,

John H. Gernon
President and Principal Executive Officer
January 2018
2
Morgan Stanley Institutional Fund, Inc.
Annual Report — December 31, 2017
Expense Example (unaudited)
US Core Portfolio
As a shareholder of the Fund, you incur two types of costs: (1) transactional costs; and (2) ongoing costs, which may include advisory fees, administration fees, distribution and shareholder services fees and other Fund expenses. This example is intended to help you understand your ongoing costs (in dollars) of investing in the Fund and to compare these costs with the ongoing costs of investing in other mutual funds.
This example is based on an investment of $1,000 invested at the beginning of the six-month period ended December 31, 2017 and held for the entire six-month period.
Actual Expenses
The table below provides information about actual account values and actual expenses. You may use the information in this table, together with the amount you invested, to estimate the expenses that you paid over the period. Simply divide your account value by $1,000 (for example, an $8,600 account value divided by $1,000 = 8.6), then multiply the result by the number in the table under the heading entitled "Actual Expenses Paid During Period" to estimate the expenses you paid on your account during this period.
Hypothetical Example for Comparison Purposes
The table below provides information about hypothetical account values and hypothetical expenses based on the Fund's actual expense ratio and an assumed rate of return of 5% per year before expenses, which is not the Fund's actual return. The hypothetical account values and expenses may not be used to estimate the actual ending account balance or expenses you paid for the period. You may use this information to compare the ongoing costs of investing in the Fund and other funds. To do so, compare this 5% hypothetical example with the 5% hypothetical examples that appear in the shareholder reports of the other funds.
Please note that the expenses shown in the table are meant to highlight your ongoing costs only and do not reflect any transactional costs, such as sales charges (loads). Therefore, the information for each class in the table is useful in comparing ongoing costs only, and will not help you determine the relative total costs of owning different funds. In addition, if these transactional costs were included, your costs would have been higher.
| | | Beginning
Account
Value
7/1/17 | | Actual Ending
Account
Value
12/31/17 | | Hypothetical
Ending Account
Value | | Actual
Expenses
Paid
During
Period* | | Hypothetical
Expenses Paid
During Period* | | Net
Expense
Ratio
During
Period** | |
US Core Portfolio Class I | | $ | 1,000.00 | | | $ | 1,110.50 | | | $ | 1,021.27 | | | $ | 4.15 | | | $ | 3.97 | | | | 0.78 | % | |
US Core Portfolio Class A | | | 1,000.00 | | | | 1,108.30 | | | | 1,019.41 | | | | 6.11 | | | | 5.85 | | | | 1.15 | | |
US Core Portfolio Class C | | | 1,000.00 | | | | 1,103.30 | | | | 1,015.63 | | | | 10.07 | | | | 9.65 | | | | 1.90 | | |
US Core Portfolio Class IS | | | 1,000.00 | | | | 1,110.80 | | | | 1,021.42 | | | | 3.99 | | | | 3.82 | | | | 0.75 | | |
* Expenses are calculated using each Fund Class' annualized net expense ratio (as disclosed), multiplied by the average account value over the period, and multiplied by 184/365 (to reflect the most recent one-half year period).
** Annualized.
3
Morgan Stanley Institutional Fund, Inc.
Annual Report — December 31, 2017
Investment Overview (unaudited)
US Core Portfolio
The Fund seeks long-term capital appreciation.
Performance
For the year ended December 31, 2017, the Fund's Class I shares had a total return based on net asset value and reinvestment of distributions per share of 19.33%, net of fees. The Fund's Class I shares underperformed the Fund's benchmark, the S&P 500® Index (the "Index"), which returned 21.83%.
Factors Affecting Performance
• Following the 2016 U.S. presidential election campaign, the market re-focused on company earnings, beginning its 2017 ascent. The surprise for many in 2017 was the strength of the equity markets, with the Index posting a 21.83% return.
• For the Index, the greatest strength over the reporting period came from information technology, with the consumer discretionary, health care, industrials and materials sectors delivering performance in line with the market. However, low volatility, high dividend yielding sectors such as consumer staples, utilities, telecommunications and real estate lagged overall market performance.
• The Fund benefited from its underweights to low volatility, high dividend yielding sectors such as consumer staples, telecommunication services and utilities. Likewise, the Fund's overweight to information technology added gains.
• Within stock selection, the largest detractor for the period was a U.S.-based biopharmaceutical company that reported weaker-than-expected sales for a new drug and had one of its stronger pipelines of drugs affected by a compound that the U.S. Food and Drug Administration pulled. Other significant detractors were positions in a telecommunications company and an oil services company.
• The largest contributors to performance were several positions within the technology sector,
including a global payments and technology company; a multinational company specializing in consumer electronics, computer software and online services; and a U.S.-based leader in cloud infrastructure and digital workspace technology. Also significantly contributing to performance was a diversified financial services company.
Management Strategies
• There have been no changes to our investment process during the period. Statistically, the majority of a portfolio's annual return can be explained by its common factor exposures (which we categorize as growth, value, quality, and risk). The tilting of these exposures is highly correlated to alpha generation (that is, a portfolio's excess return over a benchmark). Therefore, the team begins with a quantitative process to identify the common factors we believe are likely to prevail going forward. The rest of a portfolio's annual returns is explained by its company-specific results, meaning that stock selection is also a key determinant to alpha generation. We employ a bottom-up fundamental stock selection process to capture idiosyncratic returns. The result is a highly active portfolio of fundamentally attractive stocks which we believe could benefit from what we have identified to be quantitative investment styles likely to outperform.
• Entering 2018, the Fund is positioned with weightings in growth (technology and consumer discretionary sectors) and value (financials and industrials sectors) stocks and continues to be underweight low volatility, high dividend yielding sectors that remain expensive relative to their historic valuations. We believe that the financials sector in particular offers opportunities in an environment of rising interest rates following a decade of underperformance. As an offset, we remain overweight in technology.
4
Morgan Stanley Institutional Fund, Inc.
Annual Report — December 31, 2017
Investment Overview (unaudited) (cont'd)
US Core Portfolio
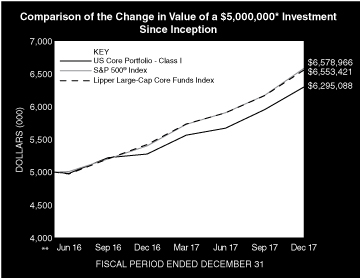
* Minimum Investment for Class I shares
** Commenced Operations on May 27, 2016.
In accordance with SEC regulations, the Fund's performance shown assumes that all recurring fees (including management fees) were deducted and all dividends and distributions were reinvested. The performance of Class A, C and IS shares will vary from the performance of Class I shares and will be impacted by additional fees assessed to those classes (if applicable).
Performance Compared to the S&P 500® Index(1) and the Lipper Large-Cap Core Funds Index(2)
| | | Period Ended December 31, 2017
Total Returns(3) | |
| | | Average Annual | |
| | | One
Year | | Five
Years | | Ten
Years | | Since
Inception(5) | |
Fund — Class I Shares
w/o sales charges(4) | | | 19.33 | % | | | — | | | | — | | | | 15.51 | % | |
Fund — Class A Shares
w/o sales charges(4) | | | 18.80 | | | | — | | | | — | | | | 15.04 | | |
Fund — Class A Shares with
maximum 5.25% sales charges(4) | | | 12.54 | | | | — | | | | — | | | | 11.25 | | |
Fund — Class C Shares
w/o sales charges(4) | | | 17.96 | | | | — | | | | — | | | | 14.19 | | |
Fund — Class C Shares with
maximum 1.00% deferred sales
charges(4) | | | 16.96 | | | | — | | | | — | | | | 14.19 | | |
Fund — Class IS Shares
w/o sales charges(4) | | | 19.37 | | | | — | | | | — | | | | 15.55 | | |
S&P 500® Index | | | 21.83 | | | | — | | | | — | | | | 18.82 | | |
Lipper Large-Cap Core Funds Index | | | 20.90 | | | | — | | | | — | | | | 18.50 | | |
Performance data quoted represents past performance, which is no guarantee of future results, and current performance may be lower or higher than the figures shown. Performance assumes that all dividends and distributions, if any, were reinvested. For the most recent month-end performance figures, please visit www.morganstanley.com/im. Investment return and principal value will fluctuate so that Fund shares, when redeemed, may be worth more or less than their original cost. Total returns do not reflect the deduction of taxes that a shareholder would pay on Fund distributions or the redemption of Fund shares. Performance of share classes will vary due to difference in sales charges and expenses.
(1) The Standard & Poor's 500® Index (S&P 500®) measures the performance of the large cap segment of the U.S. equities market, covering approximately 80% of the U.S. equities market. The Index includes 500 leading companies in leading industries of the U.S. economy. The Index is unmanaged and its returns do not include any sales charges or fees. Such costs would lower performance. It is not possible to invest directly in an index.
(2) The Lipper Large-Cap Core Funds Index is an equally weighted performance index of the largest qualifying funds (based on net assets) in the Lipper Large-Cap Core Funds classification. The Index, which is adjusted for capital gains distributions and income dividends, is unmanaged and should not be considered an investment. There are currently 30 funds represented in this Index. As of the date of this report, the Fund is in the Lipper Large-Cap Core Funds classification.
(3) Total returns for the Fund reflect fees waived and expenses reimbursed, if applicable, by the Adviser. Without such waivers and reimbursements, total returns would have been lower.
(4) Commenced operations on May 27, 2016.
(5) For comparative purposes, average annual since inception returns listed for the Indexes refer to the inception date of the Fund, not the inception of the Index.
5
Morgan Stanley Institutional Fund, Inc.
Annual Report — December 31, 2017
Portfolio of Investments
US Core Portfolio
| | | Shares | | Value
(000) | |
Common Stocks (98.8%) | |
Aerospace & Defense (5.0%) | |
Northrop Grumman Corp. | | | 2,054 | | | $ | 630 | | |
Banks (5.4%) | |
JPMorgan Chase & Co. | | | 6,450 | | | | 690 | | |
Biotechnology (1.3%) | |
Amgen, Inc. | | | 963 | | | | 168 | | |
Capital Markets (8.9%) | |
Ameriprise Financial, Inc. | | | 4,411 | | | | 748 | | |
Franklin Resources, Inc. | | | 8,794 | | | | 381 | | |
| | | | 1,129 | | |
Electrical Equipment (0.8%) | |
Emerson Electric Co. | | | 1,499 | | | | 105 | | |
Energy Equipment & Services (4.2%) | |
National Oilwell Varco, Inc. | | | 14,699 | | | | 529 | | |
Health Care Equipment & Supplies (3.6%) | |
Danaher Corp. | | | 4,907 | | | | 456 | | |
Health Care Providers & Services (6.4%) | |
Cigna Corp. | | | 3,965 | | | | 805 | | |
Hotels, Restaurants & Leisure (15.1%) | |
Hilton Worldwide Holdings, Inc. | | | 7,251 | | | | 579 | | |
McDonald's Corp. | | | 4,113 | | | | 708 | | |
Norwegian Cruise Line Holdings Ltd. (a) | | | 4,907 | | | | 261 | | |
Starbucks Corp. | | | 6,328 | | | | 364 | | |
| | | | 1,912 | | |
Information Technology Services (6.9%) | |
Mastercard, Inc., Class A | | | 5,755 | | | | 871 | | |
Internet & Direct Marketing Retail (3.8%) | |
Priceline Group, Inc. (The) (a) | | | 279 | | | | 485 | | |
Internet Software & Services (9.6%) | |
Alphabet, Inc., Class A (a) | | | 610 | | | | 642 | | |
Facebook, Inc., Class A (a) | | | 3,279 | | | | 579 | | |
| | | | 1,221 | | |
Machinery (5.0%) | |
Illinois Tool Works, Inc. | | | 3,811 | | | | 636 | | |
Media (4.7%) | |
Comcast Corp., Class A | | | 14,893 | | | | 596 | | |
Multi-Line Retail (1.3%) | |
Target Corp. | | | 2,545 | | | | 166 | | |
Semiconductors & Semiconductor Equipment (8.1%) | |
Broadcom Ltd. | | | 1,593 | | | | 409 | | |
QUALCOMM, Inc. | | | 5,784 | | | | 370 | | |
Taiwan Semiconductor Manufacturing Co., Ltd.
ADR (Taiwan) | | | 6,214 | | | | 247 | | |
| | | | 1,026 | | |
| | | Shares | | Value
(000) | |
Software (3.9%) | |
VMware, Inc., Class A (a) | | | 3,905 | | | $ | 489 | | |
Tech Hardware, Storage & Peripherals (4.8%) | |
Apple, Inc. | | | 3,604 | | | | 610 | | |
Total Common Stocks (Cost $10,037) | | | 12,524 | | |
Short-Term Investment (1.4%) | |
Investment Company (1.4%) | |
Morgan Stanley Institutional Liquidity
Funds — Treasury Securities Portfolio —
Institutional Class (See Note G)
(Cost $179) | | | 179,434 | | | | 179 | | |
Total Investments (100.2%) (Cost $10,216) (b) | | | 12,703 | | |
Liabilities in Excess of Other Assets (–0.2%) | | | (21 | ) | |
Net Assets (100.0%) | | $ | 12,682 | | |
(a) Non-income producing security.
(b) At December 31, 2017, the aggregate cost for federal income tax purposes is approximately $10,222,000. The aggregate gross unrealized appreciation is approximately $2,499,000 and the aggregate gross unrealized depreciation is approximately $19,000, resulting in net unrealized appreciation of approximately $2,480,000.
ADR American Depositary Receipt.
Portfolio Composition
Classification | | Percentage of
Total Investments | |
Other* | | | 29.8 | % | |
Hotels, Restaurants & Leisure | | | 15.0 | | |
Internet Software & Services | | | 9.6 | | |
Capital Markets | | | 8.9 | | |
Semiconductors & Semiconductor Equipment | | | 8.1 | | |
Information Technology Services | | | 6.9 | | |
Health Care Providers & Services | | | 6.3 | | |
Banks | | | 5.4 | | |
Machinery | | | 5.0 | | |
Aerospace & Defense | | | 5.0 | | |
Total Investments | | | 100.0 | % | |
* Industries and/or investment types representing less than 5% of total investments.
The accompanying notes are an integral part of the financial statements.
6
Morgan Stanley Institutional Fund, Inc.
Annual Report — December 31, 2017
Statement of Assets and Liabilities | | December 31, 2017
(000) | |
Assets: | |
Investments in Securities of Unaffiliated Issuers, at Value (Cost $10,037) | | $ | 12,524 | | |
Investment in Security of Affiliated Issuer, at Value (Cost $179) | | | 179 | | |
Total Investments in Securities, at Value (Cost $10,216) | | | 12,703 | | |
Receivable for Investments Sold | | | 124 | | |
Due from Adviser | | | 48 | | |
Dividends Receivable | | | 6 | | |
Receivable from Affiliate | | | — | @ | |
Other Assets | | | 25 | | |
Total Assets | | | 12,906 | | |
Liabilities: | |
Payable for Investments Purchased | | | 135 | | |
Payable for Professional Fees | | | 52 | | |
Payable for Fund Shares Redeemed | | | 23 | | |
Payable for Custodian Fees | | | 2 | | |
Payable for Shareholder Services Fees — Class A | | | — | @ | |
Payable for Distribution and Shareholder Services Fees — Class C | | | 2 | | |
Payable for Sub Transfer Agency Fees — Class I | | | — | @ | |
Payable for Sub Transfer Agency Fees — Class A | | | 1 | | |
Payable for Sub Transfer Agency Fees — Class C | | | — | @ | |
Payable for Transfer Agency Fees — Class I | | | 1 | | |
Payable for Transfer Agency Fees — Class A | | | 1 | | |
Payable for Transfer Agency Fees — Class C | | | — | @ | |
Payable for Administration Fees | | | 1 | | |
Other Liabilities | | | 6 | | |
Total Liabilities | | | 224 | | |
Net Assets | | $ | 12,682 | | |
Net Assets Consist Of: | |
Paid-in-Capital | | $ | 10,485 | | |
Distributions in Excess of Net Investment Income | | | (34 | ) | |
Accumulated Net Realized Loss | | | (256 | ) | |
Unrealized Appreciation (Depreciation) on: | |
Investments | | | 2,487 | | |
Net Assets | | $ | 12,682 | | |
CLASS I: | |
Net Assets | | $ | 8,965 | | |
| Shares Outstanding $0.001 par value shares of beneficial interest (unlimited shares authorized) (not in 000's) | | | 722,486 | | |
Net Asset Value, Offering and Redemption Price Per Share | | $ | 12.41 | | |
CLASS A: | |
Net Assets | | $ | 1,874 | | |
| Shares Outstanding $0.001 par value shares of beneficial interest (unlimited shares authorized) (not in 000's) | | | 151,349 | | |
Net Asset Value, Redemption Price Per Share | | $ | 12.38 | | |
Maximum Sales Load | | | 5.25 | % | |
Maximum Sales Charge | | $ | 0.69 | | |
Maximum Offering Price Per Share | | $ | 13.07 | | |
CLASS C: | |
Net Assets | | $ | 1,831 | | |
| Shares Outstanding $0.001 par value shares of beneficial interest (unlimited shares authorized) (not in 000's) | | | 149,070 | | |
Net Asset Value, Offering and Redemption Price Per Share | | $ | 12.28 | | |
CLASS IS: | |
Net Assets | | $ | 12 | | |
| Shares Outstanding $0.001 par value shares of beneficial interest (unlimited shares authorized) (not in 000's) | | | 1,000 | | |
Net Asset Value, Offering and Redemption Price Per Share | | $ | 12.41 | | |
@ Amount is less than $500.
The accompanying notes are an integral part of the financial statements.
7
Morgan Stanley Institutional Fund, Inc.
Annual Report — December 31, 2017
Statement of Operations | | Year Ended
December 31, 2017
(000) | |
Investment Income: | |
Dividends from Securities of Unaffiliated Issuers (Net of $2 of Foreign Taxes Withheld) | | $ | 166 | | |
Dividends from Security of Affiliated Issuer (Note G) | | | 1 | | |
Total Investment Income | | | 167 | | |
Expenses: | |
Professional Fees | | | 140 | | |
Advisory Fees (Note B) | | | 69 | | |
Registration Fees | | | 36 | | |
Offering Costs | | | 22 | | |
Shareholder Services Fees — Class A (Note D) | | | 4 | | |
Distribution and Shareholder Services Fees — Class C (Note D) | | | 16 | | |
Shareholder Reporting Fees | | | 14 | | |
Administration Fees (Note C) | | | 9 | | |
Transfer Agency Fees — Class I (Note E) | | | 2 | | |
Transfer Agency Fees — Class A (Note E) | | | 2 | | |
Transfer Agency Fees — Class C (Note E) | | | 2 | | |
Transfer Agency Fees — Class IS (Note E) | | | 2 | | |
Sub Transfer Agency Fees — Class I | | | 1 | | |
Sub Transfer Agency Fees — Class A | | | 2 | | |
Sub Transfer Agency Fees — Class C | | | 1 | | |
Custodian Fees (Note F) | | | 3 | | |
Directors' Fees and Expenses | | | 3 | | |
Pricing Fees | | | 2 | | |
Other Expenses | | | 16 | | |
Total Expenses | | | 346 | | |
Expenses Reimbursed by Adviser (Note B) | | | (159 | ) | |
Waiver of Advisory Fees (Note B) | | | (69 | ) | |
Reimbursement of Class Specific Expenses — Class A (Note B) | | | (1 | ) | |
Reimbursement of Class Specific Expenses — Class C (Note B) | | | (1 | ) | |
Reimbursement of Class Specific Expenses — Class IS (Note B) | | | (2 | ) | |
Rebate from Morgan Stanley Affiliate (Note G) | | | (— | @) | |
Net Expenses | | | 114 | | |
Net Investment Income | | | 53 | | |
Realized Loss: | |
Investments Sold | | | (195 | ) | |
Change in Unrealized Appreciation (Depreciation): | |
Investments | | | 2,139 | | |
Net Realized Loss and Change in Unrealized Appreciation (Depreciation) | | | 1,944 | | |
Net Increase in Net Assets Resulting from Operations | | $ | 1,997 | | |
@ Amount is less than $500.
The accompanying notes are an integral part of the financial statements.
8
Morgan Stanley Institutional Fund, Inc.
Annual Report — December 31, 2017
Statements of Changes in Net Assets | | Year Ended
December 31, 2017
(000) | | Period from
May 27, 2016^ to
December 31, 2016
(000) | |
Increase (Decrease) in Net Assets: | |
Operations: | |
Net Investment Income | | $ | 53 | | | $ | 42 | | |
Net Realized Loss | | | (195 | ) | | | (77 | ) | |
Net Change in Unrealized Appreciation (Depreciation) | | | 2,139 | | | | 348 | | |
Net Increase in Net Assets Resulting from Operations | | | 1,997 | | | | 313 | | |
Distributions From and/or In Excess of: | |
Class I: | |
Net Investment Income | | | (34 | ) | | | (64 | ) | |
Paid-in-Capital | | | (9 | ) | | | — | | |
Class A: | |
Net Investment Income | | | (1 | ) | | | (11 | ) | |
Paid-in-Capital | | | (2 | ) | | | — | | |
Class C: | |
Net Investment Income | | | — | | | | (6 | ) | |
Paid-in-Capital | | | — | | | | — | | |
Class IS: | |
Net Investment Income | | | (— | @) | | | (— | @) | |
Paid-in-Capital | | | (— | @) | | | — | | |
Total Distributions | | | (46 | ) | | | (81 | ) | |
Capital Share Transactions:(1) | |
Class I: | |
Subscribed | | | 408 | | | | 7,645 | | |
Distributions Reinvested | | | 13 | | | | 14 | | |
Redeemed | | | (173 | ) | | | (560 | ) | |
Class A: | |
Subscribed | | | 437 | | | | 1,488 | | |
Distributions Reinvested | | | 3 | | | | 11 | | |
Redeemed | | | (253 | ) | | | (104 | ) | |
Class C: | |
Subscribed | | | 254 | | | | 1,366 | | |
Distributions Reinvested | | | — | | | | 6 | | |
Redeemed | | | (65 | ) | | | (1 | ) | |
Class IS: | |
Subscribed | | | — | | | | 10 | | |
Net Increase in Net Assets Resulting from Capital Share Transactions | | | 624 | | | | 9,875 | | |
Total Increase in Net Assets | | | 2,575 | | | | 10,107 | | |
Net Assets: | |
Beginning of Period | | | 10,107 | | | | — | | |
End of Period (Including Distributions in Excess of Net Investment Income of $(34) and $(36)) | | $ | 12,682 | | | $ | 10,107 | | |
(1) Capital Share Transactions: | |
Class I: | |
Shares Subscribed | | | 37 | | | | 754 | | |
Shares Issued on Distributions Reinvested | | | 1 | | | | 1 | | |
Shares Redeemed | | | (15 | ) | | | (55 | ) | |
Net Increase in Class I Shares Outstanding | | | 23 | | | | 700 | | |
Class A: | |
Shares Subscribed | | | 39 | | | | 144 | | |
Shares Issued on Distributions Reinvested | | | — | @@ | | | 1 | | |
Shares Redeemed | | | (22 | ) | | | (10 | ) | |
Net Increase in Class A Shares Outstanding | | | 17 | | | | 135 | | |
Class C: | |
Shares Subscribed | | | 23 | | | | 131 | | |
Shares Issued on Distributions Reinvested | | | — | | | | 1 | | |
Shares Redeemed | | | (6 | ) | | | (— | @@) | |
Net Increase in Class C Shares Outstanding | | | 17 | | | | 132 | | |
Class IS: | |
Shares Subscribed | | | — | | | | 1 | | |
^ Commencement of Operations.
@ Amount is less than $500.
@@ Amount is less than 500 shares.
The accompanying notes are an integral part of the financial statements.
9
Morgan Stanley Institutional Fund, Inc.
Annual Report — December 31, 2017
Financial Highlights
US Core Portfolio
| | | Class I | |
Selected Per Share Data and Ratios | | Year Ended
December 31, 2017 | | Period from
May 27, 2016(1) to
December 31, 2016 | |
Net Asset Value, Beginning of Period | | $ | 10.45 | | | $ | 10.00 | | |
Income from Investment Operations: | |
Net Investment Income(2) | | | 0.08 | | | | 0.07 | | |
Net Realized and Unrealized Gain | | | 1.94 | | | | 0.48 | | |
Total from Investment Operations | | | 2.02 | | | | 0.55 | | |
Distributions from and/or in Excess of: | |
Net Investment Income | | | (0.05 | ) | | | (0.10 | ) | |
Paid-in-Capital | | | (0.01 | ) | | | — | | |
Total Distributions | | | (0.06 | ) | | | (0.10 | ) | |
Net Asset Value, End of Period | | $ | 12.41 | | | $ | 10.45 | | |
Total Return(3) | | | 19.33 | % | | | 5.50 | %(6) | |
Ratios and Supplemental Data: | |
Net Assets, End of Period (Thousands) | | $ | 8,965 | | | $ | 7,314 | | |
Ratio of Expenses to Average Net Assets(8) | | | 0.78 | %(4) | | | 0.77 | %(4)(7) | |
Ratio of Net Investment Income to Average Net Assets(8) | | | 0.68 | %(4) | | | 1.12 | %(4)(7) | |
Ratio of Rebate from Morgan Stanley Affiliates to Average Net Assets | | | 0.00 | %(5) | | | 0.00 | %(5)(7) | |
Portfolio Turnover Rate | | | 57 | % | | | 28 | %(6) | |
(8) Supplemental Information on the Ratios to Average Net Assets: | |
Ratios Before Expense Limitation: | |
Expenses to Average Net Assets | | | 2.78 | % | | | 3.62 | %(7) | |
Net Investment Loss to Average Net Assets | | | (1.32 | )% | | | (1.73 | )%(7) | |
(1) Commencement of Operations.
(2) Per share amount is based on average shares outstanding.
(3) Calculated based on the net asset value as of the last business day of the period.
(4) The Ratios of Expenses and Net Investment Income reflect the rebate of certain Fund expenses in connection with the investments in Morgan Stanley affiliates during the period. The effect of the rebate on the ratios is disclosed in the above table as "Ratio of Rebate from Morgan Stanley Affiliates to Average Net Assets."
(5) Amount is less than 0.005%.
(6) Not annualized.
(7) Annualized.
The accompanying notes are an integral part of the financial statements.
10
Morgan Stanley Institutional Fund, Inc.
Annual Report — December 31, 2017
Financial Highlights
US Core Portfolio
| | | Class A | |
Selected Per Share Data and Ratios | | Year Ended
December 31, 2017 | | Period from
May 27, 2016(1) to
December 31, 2016 | |
Net Asset Value, Beginning of Period | | $ | 10.44 | | | $ | 10.00 | | |
Income from Investment Operations: | |
Net Investment Income(2) | | | 0.04 | | | | 0.04 | | |
Net Realized and Unrealized Gain | | | 1.92 | | | | 0.49 | | |
Total from Investment Operations | | | 1.96 | | | | 0.53 | | |
Distributions from and/or in Excess of: | |
Net Investment Income | | | (0.01 | ) | | | (0.09 | ) | |
Paid-in-Capital | | | (0.01 | ) | | | — | | |
Total Distributions | | | (0.02 | ) | | | (0.09 | ) | |
Net Asset Value, End of Period | | $ | 12.38 | | | $ | 10.44 | | |
Total Return(3) | | | 18.80 | % | | | 5.30 | %(6) | |
Ratios and Supplemental Data: | |
Net Assets, End of Period (Thousands) | | $ | 1,874 | | | $ | 1,406 | | |
Ratio of Expenses to Average Net Assets(8) | | | 1.15 | %(4) | | | 1.15 | %(4)(7) | |
Ratio of Net Investment Income to Average Net Assets(8) | | | 0.31 | %(4) | | | 0.66 | %(4)(7) | |
Ratio of Rebate from Morgan Stanley Affiliates to Average Net Assets | | | 0.00 | %(5) | | | 0.00 | %(5)(7) | |
Portfolio Turnover Rate | | | 57 | % | | | 28 | %(6) | |
(8) Supplemental Information on the Ratios to Average Net Assets: | |
Ratios Before Expense Limitation: | |
Expenses to Average Net Assets | | | 3.23 | % | | | 4.12 | %(7) | |
Net Investment Loss to Average Net Assets | | | (1.77 | )% | | | (2.31 | )%(7) | |
(1) Commencement of Operations.
(2) Per share amount is based on average shares outstanding.
(3) Calculated based on the net asset value which does not reflect sales charges, if applicable, as of the last business day of the period.
(4) The Ratios of Expenses and Net Investment Income reflect the rebate of certain Fund expenses in connection with the investments in Morgan Stanley affiliates during the period. The effect of the rebate on the ratios is disclosed in the above table as "Ratio of Rebate from Morgan Stanley Affiliates to Average Net Assets."
(5) Amount is less than 0.005%.
(6) Not annualized.
(7) Annualized.
The accompanying notes are an integral part of the financial statements.
11
Morgan Stanley Institutional Fund, Inc.
Annual Report — December 31, 2017
Financial Highlights
US Core Portfolio
| | | Class C | |
Selected Per Share Data and Ratios | | Year Ended
December 31, 2017 | | Period from
May 27, 2016(1) to
December 31, 2016 | |
Net Asset Value, Beginning of Period | | $ | 10.41 | | | $ | 10.00 | | |
Income (Loss) from Investment Operations: | |
Net Investment Loss(2) | | | (0.05 | ) | | | (0.00 | )(3) | |
Net Realized and Unrealized Gain | | | 1.92 | | | | 0.48 | | |
Total from Investment Operations | | | 1.87 | | | | 0.48 | | |
Distributions from and/or in Excess of: | |
Net Investment Income | | | — | | | | (0.07 | ) | |
Net Asset Value, End of Period | | $ | 12.28 | | | $ | 10.41 | | |
Total Return(4) | | | 17.96 | % | | | 4.79 | %(7) | |
Ratios and Supplemental Data: | |
Net Assets, End of Period (Thousands) | | $ | 1,831 | | | $ | 1,377 | | |
Ratio of Expenses to Average Net Assets(9) | | | 1.90 | %(5) | | | 1.90 | %(5)(8) | |
Ratio of Net Investment Loss to Average Net Assets(9) | | | (0.43 | )%(5) | | | (0.05 | )%(5)(8) | |
Ratio of Rebate from Morgan Stanley Affiliates to Average Net Assets | | | 0.00 | %(6) | | | 0.00 | %(6)(8) | |
Portfolio Turnover Rate | | | 57 | % | | | 28 | %(7) | |
(9) Supplemental Information on the Ratios to Average Net Assets: | |
Ratios Before Expense Limitation: | |
Expenses to Average Net Assets | | | 3.94 | % | | | 4.99 | %(8) | |
Net Investment Loss to Average Net Assets | | | (2.47 | )% | | | (3.14 | )%(8) | |
(1) Commencement of Operations.
(2) Per share amount is based on average shares outstanding.
(3) Amount is less than $0.005 per share.
(4) Calculated based on the net asset value which does not reflect sales charges, if applicable, as of the last business day of the period.
(5) The Ratios of Expenses and Net Investment Loss reflect the rebate of certain Fund expenses in connection with the investments in Morgan Stanley affiliates during the period. The effect of the rebate on the ratios is disclosed in the above table as "Ratio of Rebate from Morgan Stanley Affiliates to Average Net Assets."
(6) Amount is less than 0.005%.
(7) Not annualized.
(8) Annualized.
The accompanying notes are an integral part of the financial statements.
12
Morgan Stanley Institutional Fund, Inc.
Annual Report — December 31, 2017
Financial Highlights
US Core Portfolio
| | | Class IS | |
Selected Per Share Data and Ratios | | Year Ended
December 31, 2017 | | Period from
May 27, 2016(1) to
December 31, 2016 | |
Net Asset Value, Beginning of Period | | $ | 10.45 | | | $ | 10.00 | | |
Income from Investment Operations: | |
Net Investment Income(2) | | | 0.08 | | | | 0.07 | | |
Net Realized and Unrealized Gain | | | 1.94 | | | | 0.48 | | |
Total from Investment Operations | | | 2.02 | | | | 0.55 | | |
Distributions from and/or in Excess of: | |
Net Investment Income | | | (0.01 | ) | | | (0.10 | ) | |
Paid-in-Capital | | | (0.05 | ) | | | — | | |
Total Distributions | | | (0.06 | ) | | | (0.10 | ) | |
Net Asset Value, End of Period | | $ | 12.41 | | | $ | 10.45 | | |
Total Return(3) | | | 19.37 | % | | | 5.52 | %(6) | |
Ratios and Supplemental Data: | |
Net Assets, End of Period (Thousands) | | $ | 12 | | | $ | 10 | | |
Ratio of Expenses to Average Net Assets(8) | | | 0.75 | %(4) | | | 0.75 | %(4)(7) | |
Ratio of Net Investment Income to Average Net Assets(8) | | | 0.71 | %(4) | | | 1.17 | %(4)(7) | |
Ratio of Rebate from Morgan Stanley Affiliates to Average Net Assets | | | 0.00 | %(5) | | | 0.00 | %(5)(7) | |
Portfolio Turnover Rate | | | 57 | % | | | 28 | %(6) | |
(8) Supplemental Information on the Ratios to Average Net Assets: | |
Ratios Before Expense Limitation: | |
Expenses to Average Net Assets | | | 19.96 | % | | | 19.22 | %(7) | |
Net Investment Loss to Average Net Assets | | | (18.50 | )% | | | (17.30 | )%(7) | |
(1) Commencement of Operations.
(2) Per share amount is based on average shares outstanding.
(3) Calculated based on the net asset value as of the last business day of the period.
(4) The Ratios of Expenses and Net Investment Income reflect the rebate of certain Fund expenses in connection with the investments in Morgan Stanley affiliates during the period. The effect of the rebate on the ratios is disclosed in the above table as "Ratio of Rebate from Morgan Stanley Affiliates to Average Net Assets."
(5) Amount is less than 0.005%.
(6) Not annualized.
(7) Annualized.
The accompanying notes are an integral part of the financial statements.
13
Morgan Stanley Institutional Fund, Inc.
Annual Report — December 31, 2017
Notes to Financial Statements
Morgan Stanley Institutional Fund, Inc. (the "Company") is registered under the Investment Company Act of 1940, as amended (the "Act"), as an open-end management investment company. The Company is comprised of twenty-nine separate, active, diversified and non-diversified funds (individually referred to as a "Fund", collectively as the "Funds"). The Company applies investment company accounting and reporting guidance.
The accompanying financial statements relate to the US Core Portfolio. The Fund seeks long-term capital appreciation.
The Fund offers four classes of shares — Class I, Class A, Class C and Class IS.
A. Significant Accounting Policies: The following significant accounting policies are in conformity with U.S. generally accepted accounting principles ("GAAP"). Such policies are consistently followed by the Company in the preparation of its financial statements. GAAP may require management to make estimates and assumptions that affect the reported amounts and disclosures in the financial statements. Actual results may differ from those estimates.
1. Security Valuation: (1) An equity portfolio security listed or traded on an exchange is valued at its latest reported sales price (or at the exchange official closing price if such exchange reports an official closing price), and if there were no sales on a given day and if there is no official exchange closing price for that day, the security is valued at the mean between the last reported bid and asked prices if such bid and asked prices are available on the relevant exchanges. Listed equity securities not traded on the valuation date with no reported bid and asked prices available on the exchange are valued at the mean between the current bid and asked prices obtained from one or more reputable brokers or dealers. In cases where a security is traded on more than one exchange, the security is valued on the exchange designated as the primary market; (2) all other equity portfolio securities for which over-the-counter ("OTC") market quotations are readily available are valued at the latest reported sales price (or at the market official closing price if such market reports an official closing price), and if there was no trading in the security on a given day and if there is no official closing price from relevant markets for that day, the security is valued at the mean between the last reported bid and asked prices if such bid and asked prices are available on the relevant markets. An unlisted equity security that does
not trade on the valuation date and for which bid and asked prices from the relevant markets are unavailable is valued at the mean between the current bid and asked prices obtained from one or more reputable brokers or dealers; (3) certain portfolio securities may be valued by an outside pricing service/vendor approved by the Company's Board of Directors (the "Directors"). The pricing service/vendor may employ a pricing model that takes into account, among other things, bids, yield spreads, and/or other market data and specific security characteristics. Alternatively, if a valuation is not available from an outside pricing service/vendor, and the security trades on an exchange, the security may be valued at its latest reported sale price (or at the exchange official closing price if such exchange reports an official closing price), prior to the time when assets are valued. If there are no sales on a given day and if there is no official exchange closing price for that day, the security is valued at the mean between the last reported bid and asked prices if such bid and asked prices are available in the relevant exchanges; (4) when market quotations are not readily available, including circumstances under which Morgan Stanley Investment Management Inc. (the "Adviser") determines that the closing price, last sale price or the mean between the last reported bid and asked prices are not reflective of a security's market value, portfolio securities are valued at their fair value as determined in good faith under procedures established by and under the general supervision of the Directors. Occasionally, developments affecting the closing prices of securities and other assets may occur between the times at which valuations of such securities are determined (that is, close of the foreign market on which the securities trade) and the close of business of the New York Stock Exchange ("NYSE"). If developments occur during such periods that are expected to materially affect the value of such securities, such valuations may be adjusted to reflect the estimated fair value of such securities as of the close of the NYSE, as determined in good faith by the Directors or by the Adviser using a pricing service and/or procedures approved by the Directors; and (5) investments in mutual funds, including the Morgan Stanley Institutional Liquidity Funds, are valued at the net asset value ("NAV") as of the close of each business day.
The Directors have responsibility for determining in good faith the fair value of the investments, and the Directors may appoint others, such as the Company's
14
Morgan Stanley Institutional Fund, Inc.
Annual Report — December 31, 2017
Notes to Financial Statements (cont'd)
Adviser or a valuation committee, to assist the Directors in determining fair value and to make the actual calculations pursuant to the fair valuation methodologies previously approved by the Directors. Under procedures approved by the Directors, the Company's Adviser has formed a Valuation Committee whose members are approved by the Directors. The Valuation Committee provides administration and oversight of the Company's valuation policies and procedures, which are reviewed at least annually by the Directors. These procedures allow the Company to utilize independent pricing services, quotations from securities and financial instrument dealers, and other market sources to determine fair value.
The Company has procedures to determine the fair value of securities and other financial instruments for which market prices are not readily available. Under these procedures, the Valuation Committee convenes on a regular and ad hoc basis to review such securities and considers a number of factors, including valuation methodologies and significant unobservable valuation inputs, when arriving at fair value. The Valuation Committee may employ a market-based approach which may use related or comparable assets or liabilities, recent transactions, market multiples, book values, and other relevant information for the investment to determine the fair value of the investment. An income-based valuation approach may also be used in which the anticipated future cash flows of the investment are discounted to calculate fair value. Discounts may also be applied due to the nature or duration of any restrictions on the disposition of the investments. Due to the inherent uncertainty of valuations of such investments, the fair values may differ significantly from the values that would have been used had an active market existed. The Valuation Committee employs various methods for calibrating these valuation approaches including a regular review of valuation methodologies, key inputs and assumptions, transactional back-testing or disposition analysis, and reviews of any related market activity.
2. Fair Value Measurement: Financial Accounting Standards Board ("FASB") Accounting Standards CodificationTM ("ASC") 820, "Fair Value Measurement" ("ASC 820"), defines fair value as the value that the Fund
would receive to sell an investment or pay to transfer a liability in a timely transaction with an independent buyer in the principal market, or in the absence of a principal market, the most advantageous market for the investment or liability. ASC 820 establishes a three-tier hierarchy to distinguish between (1) inputs that reflect the assumptions market participants would use in valuing an asset or liability developed based on market data obtained from sources independent of the reporting entity (observable inputs) and (2) inputs that reflect the reporting entity's own assumptions about the assumptions market participants would use in valuing an asset or liability developed based on the best information available in the circumstances (unobservable inputs) and to establish classification of fair value measurements for disclosure purposes. Various inputs are used in determining the value of the Fund's investments. The inputs are summarized in the three broad levels listed below.
• Level 1 – unadjusted quoted prices in active markets for identical investments
• Level 2 – other significant observable inputs (including quoted prices for similar investments, interest rates, prepayment speeds, credit risk, etc.)
• Level 3 – significant unobservable inputs including the Fund's own assumptions in determining the fair value of investments. Factors considered in making this determination may include, but are not limited to, information obtained by contacting the issuer, analysts, or the appropriate stock exchange (for exchange-traded securities), analysis of the issuer's financial statements or other available documents and, if necessary, available information concerning other securities in similar circumstances
The inputs or methodology used for valuing securities are not necessarily an indication of the risk associated with investing in those securities and the determination of the significance of a particular input to the fair value measurement in its entirety requires judgment and considers factors specific to each security.
15
Morgan Stanley Institutional Fund, Inc.
Annual Report — December 31, 2017
Notes to Financial Statements (cont'd)
The following is a summary of the inputs used to value the Fund's investments as of December 31, 2017.
Investment Type | | Level 1
Unadjusted
quoted
prices
(000) | | Level 2
Other
significant
observable
inputs
(000) | | Level 3
Significant
unobservable
inputs
(000) | | Total
(000) | |
Assets: | |
Common Stocks | |
Aerospace & Defense | | $ | 630 | | | $ | — | | | $ | — | | | $ | 630 | | |
Banks | | | 690 | | | | — | | | | — | | | | 690 | | |
Biotechnology | | | 168 | | | | — | | | | — | | | | 168 | | |
Capital Markets | | | 1,129 | | | | — | | | | — | | | | 1,129 | | |
Electrical Equipment | | | 105 | | | | — | | | | — | | | | 105 | | |
Energy Equipment &
Services | | | 529 | | | | — | | | | — | | | | 529 | | |
Health Care Equipment &
Supplies | | | 456 | | | | — | | | | — | | | | 456 | | |
Health Care Providers &
Services | | | 805 | | | | — | | | | — | | | | 805 | | |
Hotels, Restaurants &
Leisure | | | 1,912 | | | | — | | | | — | | | | 1,912 | | |
Information Technology
Services | | | 871 | | | | — | | | | — | | | | 871 | | |
Internet & Direct
Marketing Retail | | | 485 | | | | — | | | | — | | | | 485 | | |
Internet Software &
Services | | | 1,221 | | | | — | | | | — | | | | 1,221 | | |
Machinery | | | 636 | | | | — | | | | — | | | | 636 | | |
Media | | | 596 | | | | — | | | | — | | | | 596 | | |
Multi-Line Retail | | | 166 | | | | — | | | | — | | | | 166 | | |
Semiconductors &
Semiconductor
Equipment | | | 1,026 | | | | — | | | | — | | | | 1,026 | | |
Software | | | 489 | | | | — | | | | — | | | | 489 | | |
Tech Hardware,
Storage &
Peripherals | | | 610 | | | | — | | | | — | | | | 610 | | |
Total Common Stocks | | | 12,524 | | | | — | | | | — | | | | 12,524 | | |
Short-Term Investment | |
Investment Company | | | 179 | | | | — | | | | — | | | | 179 | | |
Total Assets | | $ | 12,703 | | | $ | — | | | $ | — | | | $ | 12,703 | | |
Transfers between investment levels may occur as the markets fluctuate and/or the availability of data used in an investment's valuation changes. The Fund recognizes transfers between the levels as of the end of the period. As of December 31, 2017, the Fund did not have any investments transfer between investment levels.
3. Indemnifications: The Company enters into contracts that contain a variety of indemnifications. The Company's maximum exposure under these arrangements is unknown. However, the Company has not had prior claims or losses pursuant to these contracts and expects the risk of loss to be remote.
4. Dividends and Distributions to Shareholders: Dividends and distributions to shareholders are recorded
on the ex-dividend date. Dividends from net investment income, if any, are declared and paid annually. Net realized capital gains, if any, are distributed at least annually.
5. Security Transactions, Income and Expenses: Security transactions are accounted for on the trade date (date the order to buy or sell is executed). Realized gains and losses on the sale of investment securities are determined on the specific identified cost method. Dividend income and other distributions are recorded on the ex-dividend date (except for certain foreign dividends which may be recorded as soon as the Fund is informed of such dividends) net of applicable withholding taxes. Interest income is recognized on the accrual basis except where collection is in doubt. Discounts are accreted and premiums are amortized over the life of the respective securities. Most expenses of the Company can be directly attributed to a particular Fund. Expenses which cannot be directly attributed are apportioned among the Funds based upon relative net assets or other appropriate methods. Income, expenses (other than class specific expenses — distribution and shareholder services, transfer agency and sub transfer agency fees) and realized and unrealized gains or losses are allocated to each class of shares based upon their relative net assets.
B. Advisory Fees: The Adviser, a wholly-owned subsidiary of Morgan Stanley, provides the Fund with advisory services under the terms of an Investment Advisory Agreement, paid quarterly, at the annual rate based on the daily net assets as follows:
First $750
million | | Next $750
million | | Over $1.5
billion | |
| | 0.60 | % | | | 0.55 | % | | | 0.50 | % | |
For the year ended December 31, 2017, the advisory fee rate (net of waiver/rebate) was equivalent to an annual effective rate of 0.00% of the Fund's average daily net assets.
The Adviser has agreed to reduce its advisory fee and/or reimburse the Fund so that total annual portfolio operating expenses, excluding certain investment related expenses, taxes, interest and other extraordinary expenses (including litigation), will not exceed 0.80% for Class I shares, 1.15% for Class A shares, 1.90% for Class C shares and 0.75% for Class IS shares. The fee waivers and/or expense reimbursements will continue for at least one year from the date of the Fund's prospectus or until such time as the Directors act to discontinue all or a portion of such waivers and/or reimbursements when they deem such action is appropriate. For the year ended December 31, 2017, approximately $69,000 of advisory fees
16
Morgan Stanley Institutional Fund, Inc.
Annual Report — December 31, 2017
Notes to Financial Statements (cont'd)
were waived and approximately $163,000 of other expenses were reimbursed by the Adviser pursuant to this arrangement.
C. Administration Fees: The Adviser also serves as Administrator to the Company and provides administrative services pursuant to an Administration Agreement for an annual fee, accrued daily and paid monthly, of 0.08% of the Fund's average daily net assets.
Under a Sub-Administration Agreement between the Administrator and State Street Bank and Trust Company ("State Street"), State Street provides certain administrative services to the Company. For such services, the Administrator pays State Street a portion of the fee the Administrator receives from the Fund.
D. Distribution and Shareholder Services Fees: Morgan Stanley Distribution, Inc. ("MSDI" or the "Distributor"), a wholly-owned subsidiary of the Adviser and an indirect subsidiary of Morgan Stanley, serves as the Company's Distributor of Fund shares pursuant to a Distribution Agreement. The Company has adopted a Shareholder Services Plan with respect to Class A shares pursuant to Rule 12b-1 under the Act. Under the Shareholder Services Plan, the Fund pays the Distributor a shareholder services fee, accrued daily and paid monthly, at an annual rate of 0.25% of the Fund's average daily net assets attributable to Class A shares.
The Company has adopted a Distribution and Shareholder Services Plan with respect to Class C shares pursuant to Rule 12b-1 under the Act. Under the Distribution and Shareholder Services Plan, the Fund pays the Distributor a distribution fee, accrued daily and paid monthly, at an annual rate of 0.75% and a shareholder services fee, accrued daily and paid monthly, at an annual rate of 0.25% of the Fund's average daily net assets attributable to Class C shares.
The distribution and shareholder services fees are used to support the expenses associated with servicing and maintaining accounts. The Distributor may compensate other parties for providing shareholder support services to investors who purchase Class A and Class C shares.
E. Dividend Disbursing and Transfer Agent: The Company's dividend disbursing and transfer agent is Boston Financial Data Services, Inc. ("BFDS"). Pursuant to a Transfer Agency Agreement, the Company pays BFDS a fee based on the number of classes, accounts and transactions relating to the Funds of the Company. Effective January 1, 2018, BFDS changed its name to DST Asset Manager Solutions, Inc.
F. Custodian Fees: State Street (the "Custodian") also serves as Custodian for the Company in accordance with a Custodian Agreement. The Custodian holds cash, securities, and other assets of the Company as required by the Act. Custody fees are payable monthly based on assets held in custody, investment purchases and sales activity and account maintenance fees, plus reimbursement for certain out-of-pocket expenses.
G. Security Transactions and Transactions with Affiliates: For the year ended December 31, 2017, purchases and sales of investment securities for the Fund, other than long-term U.S. Government securities and short-term investments, were approximately $7,831,000 and $6,369,000, respectively. There were no purchases and sales of long-term U.S. Government securities for the year ended December 31, 2017.
The Fund invests in the Institutional Class of the Morgan Stanley Institutional Liquidity Funds — Treasury Securities Portfolio (the "Liquidity Funds"), an open-end management investment company managed by the Adviser. Advisory fees paid by the Fund are reduced by an amount equal to its pro-rata share of the advisory and administration fees paid by the Fund due to its investment in the Liquidity Funds. For the year ended December 31, 2017, advisory fees paid were reduced by less than $500 relating to the Fund's investment in the Liquidity Funds.
A summary of the Fund's transactions in shares of the Liquidity Funds during the year ended December 31, 2017 is as follows:
Affiliated
Investment
Company | | Value
December 31,
2016
(000) | | Purchases
at Cost
(000) | | Proceeds
from Sales
(000) | | Dividend
Income
(000) | |
Liquidity Funds | | $ | 581 | | | $ | 1,763 | | | $ | 2,165 | | | $ | 1 | | |
Affiliated
Investment
Company (cont'd) | | Realized
Gain
(Loss)
(000) | | Change in
Unrealized
Appreciation
(Depreciation)
(000) | | Value
December 31,
2017
(000) | |
Liquidity Funds | | $ | — | | | $ | — | | | $ | 179 | | |
The Fund is permitted to purchase and sell securities ("cross-trade") from and to other Morgan Stanley Funds as well as other funds and client accounts for which the Adviser or an affiliate of the Adviser serves as investment adviser, pursuant to procedures approved by the Directors in compliance with Rule 17a-7 under the Act (the "Rule"). Each cross-trade is executed at the current market price in compliance with provisions of the Rule. For the year ended December 31, 2017, the Fund did not engage in any cross-trade transactions.
The Fund has an unfunded Deferred Compensation Plan (the "Compensation Plan"), which allows each independent
17
Morgan Stanley Institutional Fund, Inc.
Annual Report — December 31, 2017
Notes to Financial Statements (cont'd)
Director to defer payment of all, or a portion, of the fees he or she receives for serving on the Board of Directors. Each eligible Director generally may elect to have the deferred amounts credited with a return equal to the total return on one or more of the Morgan Stanley funds that are offered as investment options under the Compensation Plan. Appreciation/depreciation and distributions received from these investments are recorded with an offsetting increase/decrease in the deferred compensation obligation and do not affect the NAV of the Fund.
H. Federal Income Taxes: It is the Fund's intention to continue to qualify as a regulated investment company and distribute all of its taxable and tax-exempt income. Accordingly, no provision for federal income taxes is required in the financial statements.
The Fund may be subject to taxes imposed by countries in which it invests. Such taxes are generally based on income and/or capital gains earned or repatriated. Taxes are accrued based on net investment income, net realized gains and net unrealized appreciation as such income and/or gains are earned. Taxes may also be based on transactions in foreign currency and are accrued based on the value of investments denominated in such currency.
FASB ASC 740-10, "Income Taxes — Overall", sets forth a minimum threshold for financial statement recognition of the benefit of a tax position taken or expected to be taken in a tax return. Management has concluded that there are no significant uncertain tax positions that would require recognition in the financial statements. If applicable, the Fund recognizes interest accrued related to unrecognized tax benefits in "Interest Expense" and penalties in "Other Expenses" in the Statement of Operations. The Fund files tax returns with the U.S. Internal Revenue Service, New York and various states. Generally, each of the tax years in the two-year period ended December 31, 2017, remains subject to examination by taxing authorities.
The tax character of distributions paid may differ from the character of distributions shown in the Statements of Changes in Net Assets due to short-term capital gains being treated as ordinary income for tax purposes. The tax character of distributions paid during fiscal years 2017 and 2016 was as follows:
2017
Distributions
Paid From: | | 2016
Distributions
Paid From: | |
Ordinary
Income
(000) | | Paid-in-
Capital
(000) | | Ordinary
Income
(000) | | Paid-in-
Capital
(000) | |
| $ | 35 | | | $ | 11 | | | $ | 78 | | | $ | 3 | | |
The amount and character of income and gains to be distributed are determined in accordance with income tax regulations which may differ from GAAP. These book/tax differences are either considered temporary or permanent in nature.
Temporary differences are primarily due to differing book and tax treatments for the timing of the recognition of gains (losses) on certain investment transactions and the timing of the deductibility of certain expenses.
Permanent differences, primarily due to return of capital distributions from real estate investment trusts, resulted in the following reclassifications among the components of net assets at December 31, 2017:
Distributions
in Excess of Net
Investment
Income
(000) | | Accumulated
Net Realized
Loss
(000) | | Paid-in-
Capital
(000) | |
| $ | (16 | ) | | $ | 16 | | | $ | — | | |
At December 31, 2017, the Fund had no distributable earnings on a tax basis.
At December 31, 2017, the Fund had available for federal income tax purposes unused short-term and long-term capital losses of approximately $206,000 and $44,000, respectively, that do not have an expiration date.
To the extent that capital loss carryforwards are used to offset any future capital gains realized, no capital gains tax liability will be incurred by the Fund for gains realized and not distributed. To the extent that capital gains are offset, such gains will not be distributed to the shareholders.
I. Credit Facility: The Company and other Morgan Stanley funds participated in a $150,000,000 committed, unsecured revolving line of credit facility (the "Facility") with State Street. This Facility is to be used for temporary emergency purposes or funding of shareholder redemption requests. The interest rate on borrowings is based on the federal funds rate or 1 month LIBOR rate plus a spread. The Facility also has a commitment fee of 0.25% per annum based on the unused portion of the Facility. During the year ended December 31, 2017, the Fund did not have any borrowings under the Facility.
J. Other: At December 31, 2017, the Fund had record owners of 10% or greater. Investment activities of these shareholders could have a material impact on the Fund. The aggregate percentage of such owners was 50.3%.
18
Morgan Stanley Institutional Fund, Inc.
Annual Report — December 31, 2017
Report of Independent Registered Public Accounting Firm
To the Shareholders and Board of Directors of
Morgan Stanley Institutional Fund, Inc. —
US Core Portfolio
Opinion on the Financial Statements
We have audited the accompanying statement of assets and liabilities of US Core Portfolio (the "Fund") (one of the funds constituting the Morgan Stanley Institutional Fund, Inc. (the "Company")), including the portfolio of investments, as of December 31, 2017, and the related statement of operations for the year then ended, the statements of changes in net assets and the financial highlights for the year ended December 31, 2017 and the period from May 27, 2016 (commencement of operations) through December 31, 2016 and the related notes (collectively referred to as the "financial statements"). In our opinion, the financial statements present fairly, in all material respects, the financial position of US Core Portfolio (one of the funds constituting Morgan Stanley Institutional Fund, Inc.) at December 31, 2017, the results of its operations for the year then ended and the changes in its net assets and its financial highlights for the year ended December 31, 2017 and the period from May 27, 2016 (commencement of operations) through December 31, 2016, in conformity with U.S. generally accepted accounting principles.
Basis for Opinion
These financial statements are the responsibility of the Company's management. Our responsibility is to express an opinion on the Fund's financial statements based on our audits. We are a public accounting firm registered with the Public Company Accounting Oversight Board (United States) ("PCAOB") and are required to be independent with respect to the Company in accordance with the U.S. federal securities law and the applicable rules and regulations of the Securities and Exchange Commission and the PCAOB.
We conducted our audits in accordance with the standards of the PCAOB. Those standards require that we plan and perform the audit to obtain reasonable assurance about whether the financial statements are free of material misstatement, whether due to error or fraud. The Company is not required to have, nor were we engaged to perform, an audit of the Company's internal control over financial reporting. As part of our audits, we are required to obtain an understanding of internal control over financial reporting, but not for the purpose of expressing an opinion on the effectiveness of the Company's internal control over financial reporting. Accordingly, we express no such opinion.
Our audits included performing procedures to assess the risks of material misstatement of the financial statements, whether due to error or fraud, and performing procedures that respond to those risks. Such procedures included examining, on a test basis, evidence regarding the amounts and disclosures in the financial statements. Our procedures included confirmation of securities owned as of December 31, 2017 by correspondence with the custodian and others or by other appropriate auditing procedures where replies from others were not received. Our audits also included evaluating the accounting principles used and significant estimates made by management, as well as evaluating the overall presentation of the financial statements. We believe that our audits provide a reasonable basis for our opinion.

We have served as the auditor of one or more Morgan Stanley investment companies since 2000.
Boston, Massachusetts
February 26, 2018
19
Morgan Stanley Institutional Fund, Inc.
Annual Report — December 31, 2017
Federal Tax Notice (unaudited)
For federal income tax purposes, the following information is furnished with respect to the Fund's earnings for its taxable year ended December 31, 2017. When distributed, certain earnings may be subject to a maximum tax rate of 15% as provided for by the Jobs and Growth Tax Relief Reconciliation Act of 2003. The Fund designated up to a maximum of approximately $47,000 as taxable at this lower rate.
In January, the Fund provides tax information to shareholders for the preceding calendar year.
20
Morgan Stanley Institutional Fund, Inc.
Annual Report — December 31, 2017
Privacy Notice (unaudited)
MORGAN STANLEY INVESTMENT MANAGEMENT INC.
AN IMPORTANT NOTICE CONCERNING OUR U.S. PRIVACY POLICY
We are required by federal law to provide you with a copy of our privacy policy annually. This policy applies to current and former individual investors in funds managed or sponsored by Morgan Stanley Investment Management Inc. ("MSIM") as well as current and former individual clients of MSIM. This policy is not applicable to partnerships, corporations, trusts or other non-individual clients or investors. Please note that we may amend this policy at any time, and will inform you of any changes as required by law.
WE RESPECT YOUR PRIVACY
We appreciate that you have provided us with your personal financial information. We strive to maintain the privacy of such information while we help you achieve your financial objectives. This Notice describes what non-public personal information we collect about you, why we collect it, when we may share it with others and how certain others may use it. It discusses the steps you may take to limit our sharing of certain information about you to affiliated companies in the Morgan Stanley family of companies ("other Morgan Stanley companies"). It also discloses how you may limit use of certain shared information for marketing purposes by other Morgan Stanley branded companies. Throughout this policy, we refer to the non-public information that personally identifies you or your accounts as "personal information."
1. WHAT PERSONAL INFORMATION DO WE COLLECT ABOUT YOU?
We obtain personal information from applications and other forms you submit to us, from your dealings with us, from consumer reporting agencies, from our Web sites and from third parties and other sources.
For example:
• We may collect information such as your name, address, e-mail address, telephone/fax numbers, assets, income and investment objectives through subscription documents, applications and other forms you submit to us.
• We may obtain information about account balances, your use of account(s) and the types of products and services you prefer to receive from us through your dealings and transactions with us and other sources.
• We may obtain information about your creditworthiness and credit history from consumer reporting agencies.
• We may collect background information from and through third-party vendors to verify representations you have made and to comply with various regulatory requirements.
• If you interact with us through our public and private Web sites, we may collect information that you provide directly through online communications (such as an e-mail address). We may also collect information about your Internet service provider, your domain name, your computer's operating system and Web browser, your use of our Web sites and your product and service preferences, through the use of "cookies." Please consult the Terms of Use of these sites for more details.
2. WHEN DO WE DISCLOSE PERSONAL INFORMATION WE COLLECT ABOUT YOU?
We may disclose personal information we collect about you to other Morgan Stanley companies and to non-affiliated third parties.
a. Information We Disclose to Other Morgan Stanley Companies.
We may disclose personal information to other Morgan Stanley companies for a variety of reasons, including to manage your account(s) effectively, to service and process your transactions, to let you know about products and services offered by us and other Morgan Stanley companies, to manage our business, and as otherwise required or permitted by law. Offers for products and services from other Morgan Stanley companies are developed under conditions designed to safeguard your personal information.
21
Morgan Stanley Institutional Fund, Inc.
Annual Report — December 31, 2017
Privacy Notice (unaudited) (cont'd)
b. Information We Disclose to Non-affiliated Third Parties.
We do not disclose personal information that we collect about you to non-affiliated third parties except to those who provide marketing services on our behalf, to financial institutions with whom we have joint marketing agreements, and as otherwise required or permitted by law. For example, we may disclose personal information to non-affiliated third parties for servicing and processing transactions, to offer our own products and services, to protect against fraud, for institutional risk control, to respond to judicial process or to perform services on our behalf. When we share personal information with a non-affiliated third party, they are required to limit their use of personal information to the particular purpose for which it was shared and they are not allowed to share personal information with others except to fulfill that limited purpose or as may be permitted or required by law.
3. HOW DO WE PROTECT THE SECURITY AND CONFIDENTIALITY OF PERSONAL INFORMATION WE COLLECT ABOUT YOU?
We maintain physical, electronic and procedural security measures to help safeguard the personal information we collect about you. We have internal policies governing the proper handling of client information. Third parties that provide support or marketing services on our behalf may also receive personal information, and we require them to adhere to confidentiality standards with respect to such information.
4. HOW CAN YOU LIMIT THE SHARING OF CERTAIN TYPES OF PERSONAL INFORMATION WITH OTHER MORGAN STANLEY COMPANIES?
We offer you choices as to whether we share with other Morgan Stanley companies the personal information that was collected to determine your eligibility for products and services you request ("eligibility information"). Eligibility information does not include your identification information or personal information pertaining to our transactions or experiences with you. Please note that, even if you direct us not to share eligibility information with other Morgan Stanley companies ("opt-out"), we may still share personal information, including eligibility information, with those companies in circumstances excluded from the opt-out under applicable law, such as to process transactions or to service your account.
5. HOW CAN YOU LIMIT THE USE OF CERTAIN TYPES OF PERSONAL INFORMATION BY OTHER MORGAN STANLEY COMPANIES FOR MARKETING?
By following the opt-out instructions in Section 6 below, you may limit other Morgan Stanley branded companies from marketing their products or services to you based on personal information we disclose to them. This information may include, for example, your income and account history with us. Please note that, even if you choose to limit Other Morgan Stanley Companies from using personal information about you that we may share with them for marketing their products and services to you, Other Morgan Stanley Companies may use your personal information that they obtain from us to market to you in circumstances permitted by law, such as if the Other Morgan Stanley Company has its own relationship with you.
6. HOW CAN YOU SEND US AN OPT-OUT INSTRUCTION?
If you wish to limit our sharing of eligibility information about you with other Morgan Stanley companies or other Morgan Stanley companies' use of personal information for marketing purposes, as described in this notice, you may do so by:
• Calling us at (800) 548-7786
Monday–Friday between 8a.m. and 6p.m.(EST)
• Writing to us at the following address:
DST Asset Manager Solutions, Inc.
c/o Privacy Coordinator
P.O. Box 219804
Kansas City, Missouri 64121
22
Morgan Stanley Institutional Fund, Inc.
Annual Report — December 31, 2017
Privacy Notice (unaudited) (cont'd)
Your written request should include your name, address, telephone number and account number(s) to which the opt-out applies and whether you are opting out with respect to sharing of eligibility information (Section 4 above), or if information used for Marketing (Section 5 above) or both. Written opt-out requests should not be sent with any other correspondence. In order to process your request, we require that the request be provided by you directly and not through a third party.
Your opt-out preference will remain in effect with respect to this policy (as it may be amended) until you notify us otherwise. If you have a joint account, your direction for us not to share this information with other Morgan Stanley companies and for those other Morgan Stanley companies not to use your personal information for marketing will be applied to all account holders on that account. Please understand that if you limit our sharing or our affiliated companies' use of personal information, you and any joint account holder(s) may not receive information about Morgan Stanley products and services, including products or services that could help you manage your financial resources and achieve your investment objectives.
7. WHAT IF AN AFFILIATED COMPANY BECOMES A NON-AFFILIATED THIRD PARTY?
If, at any time in the future, an affiliated company becomes a non-affiliated third party, further disclosures of personal information made to the former affiliated company will be limited to those described in Section 2(b) above relating to non-affiliated third parties. If you elected under Section 6 to limit disclosures we make to affiliated companies, or use of personal information by affiliated companies, your election will not apply to use by any former affiliated company of your personal information in their possession once it becomes a non-affiliated third party.
SPECIAL NOTICE TO RESIDENTS OF VERMONT
The following section supplements our policy with respect to our individual clients who have a Vermont address and supersedes anything to the contrary in the above policy with respect to those clients only.
The state of Vermont requires financial institutions to obtain your consent prior to sharing personal information that they collect about you with affiliated companies and non-affiliated third parties other than in certain limited circumstances. Except as permitted by law, we will not share personal information we collect about you with non-affiliated third parties or other Morgan Stanley companies unless you provide us with your written consent to share such information ("opt-in").
If you wish to receive offers for investment products and services offered by or through other Morgan Stanley companies, please notify us in writing at the following address:
DST Asset Manager Solutions, Inc.
c/o Privacy Coordinator
P.O. Box 219804
Kansas City, Missouri 64121
Your authorization should include your name, address, telephone number and account number(s) to which the opt-in applies and should not be sent with any other correspondence. In order to process your authorization, we require that the authorization be provided by you directly and not through a third party.
SPECIAL NOTICE TO RESIDENTS OF CALIFORNIA
The following section supplements our policy with respect to our individual clients who have a California address and supersedes anything to the contrary in the above policy with respect to those clients only.
In response to a California law, if your account has a California home address, your personal information will not be disclosed to non-affiliated third parties except as permitted by applicable California law, and we will limit sharing such information with our affiliates to comply with California privacy laws that apply to us.
23
Morgan Stanley Institutional Fund, Inc.
Annual Report — December 31, 2017
Director and Officer Information (unaudited)
Independent Directors:
Name, Age and Address of
Independent Director | | Position(s)
Held with
Registrant | | Length of Time
Served* | | Principal Occupation(s) During Past 5 Years
and Other Relevant Professional Experience | | Number of
Portfolios in
Fund Complex
Overseen by
Independent
Director** | | Other Directorships
Held by Independent
Director*** | |
Frank L. Bowman (73)
c/o Perkins Coie LLP
Counsel to the Independent
Directors
30 Rockefeller Plaza
New York, NY 10112 | | Director | | Since
August
2006 | | President, Strategic Decisions, LLC (consulting) (since February 2009); Director or Trustee of various Morgan Stanley Funds (since August 2006); Chairperson of the Compliance and Insurance Committee (since October 2015); formerly, Chairperson of the Insurance Sub-Committee of the Compliance and Insurance Committee (2007-2015); served as President and Chief Executive Officer of the Nuclear Energy Institute (policy organization) (February 2005-November 2008); retired as Admiral, U.S. Navy after serving over 38 years on active duty including 8 years as Director of the Naval Nuclear Propulsion Program in the Department of the Navy and the U.S. Department of Energy (1996-2004); served as Chief of Naval Personnel (July 1994-September 1996) and on the Joint Staff as Director of Political Military Affairs (June 1992-July 1994); knighted as Honorary Knight Commander of the Most Excellent Order of the British Empire; awarded the Officier de l'Orde National du Mérite by the French Government; elected to the National Academy of Engineering (2009). | | | 88 | | | Director of BP p.l.c.; Director of Naval and Nuclear Technologies LLP; Director Emeritus of the Armed Services YMCA; Director of the U.S. Naval Submarine League; Member of the National Security Advisory Council of the Center for U.S. Global Engagement and a member of the CNA Military Advisory Board; Trustee of Fairhaven United Methodist Church; and Director of other various non-profit organizations. | |
Kathleen A. Dennis (64)
c/o Perkins Coie LLP
Counsel to the Independent Directors
30 Rockefeller Plaza
New York, NY 10112 | | Director | | Since
August
2006 | | President, Cedarwood Associates (mutual fund and investment management consulting) (since July 2006); Chairperson of the Liquidity and Alternatives Sub-Committee of the Investment Committee (since October 2006) and Director or Trustee of various Morgan Stanley Funds (since August 2006); formerly, Senior Managing Director of Victory Capital Management (1993-2006). | | | 89 | | | Director of various non-profit organizations. | |
Nancy C. Everett (62)
c/o Perkins Coie LLP
Counsel to the Independent Directors
30 Rockefeller Plaza
New York, NY 10112 | | Director | | Since
January
2015 | | Chief Executive Officer, Virginia Commonwealth University Investment Company (since November 2015); Owner, OBIR, LLC (institutional investment management consulting) (since June 2014); formerly, Managing Director, BlackRock Inc. (February 2011-December 2013); and Chief Executive Officer, General Motors Asset Management (a/k/a Promark Global Advisors, Inc.) (June 2005-May 2010). | | | 90 | | | Formerly, Member of Virginia Commonwealth University School of Business Foundation (2005-2016); Member of Virginia Commonwealth University Board of Visitors (2013-2015); Member of Committee on Directors for Emerging Markets Growth Fund, Inc. (2007-2010); Chairperson of Performance Equity Management, LLC (2006-2010); and Chairperson, GMAM Absolute Return Strategies Fund, LLC (2006-2010). | |
24
Morgan Stanley Institutional Fund, Inc.
Annual Report — December 31, 2017
Director and Officer Information (unaudited) (cont'd)
Independent Directors: (cont'd)
Name, Age and Address of
Independent Director | | Position(s)
Held with
Registrant | | Length of Time
Served* | | Principal Occupation(s) During Past 5 Years
and Other Relevant Professional Experience | | Number of
Portfolios in
Fund Complex
Overseen by
Independent
Director** | | Other Directorships
Held by Independent
Director*** | |
Jakki L. Haussler (60)
c/o Perkins Coie LLP
Counsel to the Independent Directors
30 Rockefeller Plaza
New York, NY 10112 | | Director | | Since
January
2015 | | Chairman and Chief Executive Officer, Opus Capital Group (since January 1996); formerly, Director, Capvest Venture Fund, LP (May 2000-December 2011); Partner, Adena Ventures, LP (July 1999-December 2010); Director, The Victory Funds (February 2005-July 2008). | | | 90 | | | Director of Cincinnati Bell Inc. and Member, Audit Committee and Compensation Committee; Director of Northern Kentucky University Foundation and Member, Investment Committee; Member of Chase College of Law Transactional Law Practice Center Board of Advisors; Director of Best Transport; Director of Chase College of Law Board of Visitors; formerly, Member, University of Cincinnati Foundation Investment Committee; Member, Miami University Board of Visitors (2008-2011); Trustee of Victory Funds (2005-2008) and Chairman, Investment Committee (2007-2008) and Member, Service Provider Committee (2005-2008). | |
Dr. Manuel H. Johnson (68)
c/o Johnson Smick
International, Inc.
220 I Street, NE — Suite 200
Washington, D.C. 20002 | | Director | | Since
July
1991 | | Senior Partner, Johnson Smick International, Inc. (consulting firm); Chairperson of the Investment Committee (since October 2006) and Director or Trustee of various Morgan Stanley Funds (since July 1991); Co-Chairman and a founder of the Group of Seven Council (G7C) (international economic commission); formerly, Chairperson of the Audit Committee (July 1991-September 2006), Vice Chairman of the Board of Governors of the Federal Reserve System and Assistant Secretary of the U.S. Treasury. | | | 88 | | | Director of NVR, Inc. (home construction). | |
Joseph J. Kearns (75)
c/o Kearns & Associates LLC
46 E Peninsula Center #385
Rolling Hills Estates, CA
90274-3712 | | Director | | Since
August
1994 | | Senior Adviser, Kearns & Associates LLC (investment consulting); Chairperson of the Audit Committee (since October 2006) and Director or Trustee of various Morgan Stanley Funds (since August 1994); formerly, Deputy Chairperson of the Audit Committee (July 2003-September 2006) and Chairperson of the Audit Committee of various Morgan Stanley Funds (since August 1994); CFO of the J. Paul Getty Trust. | | | 89 | | | Prior to August 10, 2016, Director of Electro Rent Corporation (equipment leasing); Prior to December 31, 2013, Director of The Ford Family Foundation. | |
25
Morgan Stanley Institutional Fund, Inc.
Annual Report — December 31, 2017
Director and Officer Information (unaudited) (cont'd)
Independent Directors: (cont'd)
Name, Age and Address of
Independent Director | | Position(s)
Held with
Registrant | | Length of Time
Served* | | Principal Occupation(s) During Past 5 Years
and Other Relevant Professional Experience | | Number of
Portfolios in
Fund Complex
Overseen by
Independent
Director** | | Other Directorships
Held by Independent
Director*** | |
Michael F. Klein (59)
c/o Perkins Coie LLP
Counsel to the Independent Directors
30 Rockefeller Plaza
New York, NY 10112 | | Director | | Since
August
2006 | | Managing Director, Aetos Capital, LLC (since March 2000); Co-President, Aetos Alternatives Management, LLC (since January 2004) and Co-Chief Executive Officer of Aetos Capital LLC (since August 2013); Chairperson of the Fixed Income Sub-Committee of the Investment Committee (since October 2006) and Director or Trustee of various Morgan Stanley Funds (since August 2006); formerly, Managing Director, Morgan Stanley & Co. Inc. and Morgan Stanley Dean Witter Investment Management, President, various Morgan Stanley Funds (June 1998-March 2000) and Principal, Morgan Stanley & Co. Inc. and Morgan Stanley Dean Witter Investment Management (August 1997-December 1999). | | | 88 | | | Director of certain investment funds managed or sponsored by Aetos Capital, LLC; Director of Sanitized AG and Sanitized Marketing AG (specialty chemicals). | |
Patricia Maleski (57)
c/o Perkins Coie LLP
Counsel to the Independent Directors
30 Rockefeller Plaza
New York, NY 10112 | | Director | | Since
January
2017 | | Managing Director, JPMorgan Asset Management (2004-2016); Oversight and Control Head of Fiduciary and Conflicts of Interest Program (2015-2016); Chief Control Officer-Global Asset Management (2013-2015); President, JPMorgan Funds (2010-2013); Chief Administrative Officer (2004-2013); various other positions including Treasurer and Board Liaison (since 2001). | | | 90 | | | None. | |
Michael E. Nugent (81)
522 Fifth Avenue
New York, NY 10036 | | Chair of the Board and Director | | Chair of the Boards since July 2006 and Director since July 1991 | | Chair of the Boards of various Morgan Stanley Funds (since July 2006); Chairperson of the Closed-End Fund Committee (since June 2012) and Director or Trustee of various Morgan Stanley Funds (since July 1991); formerly, Chairperson of the Insurance Committee (until July 2006); General Partner, Triumph Capital, L.P. (private investment partnership) (1988-2013). | | | 88 | | | None. | |
W. Allen Reed (70)
c/o Perkins Coie LLP
Counsel to the Independent Directors
30 Rockefeller Plaza
New York, NY 10112 | | Director | | Since
August
2006 | | Chairperson of the Equity Sub-Committee of the Investment Committee (since October 2006) and Director or Trustee of various Morgan Stanley Funds (since August 2006); formerly, President and CEO of General Motors Asset Management; Chairman and Chief Executive Officer of the GM Trust Bank and Corporate Vice President of General Motors Corporation (August 1994-December 2005). | | | 89 | | | Director of Legg Mason, Inc.; formerly, Director of the Auburn University Foundation (2010-2015). | |
Fergus Reid (85)
c/o Joe Pietryka, Inc.
85 Charles Colman Blvd.
Pawling, NY 12564 | | Director | | Since
June
1992 | | Chairman, Joe Pietryka, Inc.; Chairperson of the Governance Committee and Director or Trustee of various Morgan Stanley Funds (since June 1992). | | | 89 | | | Formerly, Trustee and Director of certain investment companies in the JP Morgan Fund Complex managed by JP Morgan Investment Management Inc. (1987-2012). | |
* This is the earliest date the Director began serving the Morgan Stanley Funds. Each Director serves an indefinite term, until his or her successor is elected.
** The Fund Complex includes (as of December 31, 2017) all open-end and closed-end funds (including all of their portfolios) advised by Morgan Stanley Investment Management Inc. (the "Adviser") and any funds that have an adviser that is an affiliated person of the Adviser (including, but not limited to, Morgan Stanley AIP GP LP).
*** This includes any directorships at public companies and registered investment companies held by the Director at any time during the past five years.
26
Morgan Stanley Institutional Fund, Inc.
Annual Report — December 31, 2017
Director and Officer Information (unaudited) (cont'd)
Executive Officers:
Name, Age and Address of Executive Officer | | Position(s) Held
with
Registrant | | Length of Time
Served* | | Principal Occupation(s) During Past 5 Years | |
John H. Gernon (54)
522 Fifth Avenue
New York, NY 10036 | | President and Principal Executive Officer | | Since
September
2013 | | President and Principal Executive Officer of the Equity and Fixed Income Funds and the Morgan Stanley AIP Funds (since September 2013) and the Liquidity Funds and various money market funds (since May 2014) in the Fund Complex; Managing Director of the Adviser; Head of Product (since 2006). | |
Timothy J. Knierim (58)
522 Fifth Avenue
New York, NY 10036 | | Chief Compliance Officer | | Since
December
2016 | | Managing Director of the Adviser and various entities affiliated with the Adviser; Chief Compliance Officer of various Morgan Stanley Funds and the Adviser (since December 2016) and Chief Compliance Officer of Morgan Stanley AIP GP LP (since 2014). Formerly, Managing Director and Deputy Chief Compliance Officer of the Adviser (2014-2016); and formerly, Chief Compliance Officer of Prudential Investment Management, Inc. (2007-2014). | |
Francis J. Smith (52)
522 Fifth Avenue
New York, NY 10036 | | Treasurer and Principal Financial Officer | | Treasurer since July 2003 and Principal Financial Officer since September 2002 | | Managing Director of the Adviser and various entities affiliated with the Adviser; Treasurer (since July 2003) and Principal Financial Officer of various Morgan Stanley Funds (since September 2002). | |
Mary E. Mullin (50)
522 Fifth Avenue
New York, NY 10036 | | Secretary | | Since
June
1999 | | Managing Director of the Adviser; Secretary of various Morgan Stanley Funds (since June 1999). | |
Michael J. Key (38)
522 Fifth Avenue
New York, NY 10036 | | Vice President | | Since
June
2017 | | Vice President of the Equity and Fixed Income Funds, Liquidity Funds, various money market funds and the Morgan Stanley AIP Funds in the Fund Complex (since June 2017); Executive Director of the Adviser; Head of Product Development for Equity and Fixed Income Funds (since August 2013). | |
* This is the earliest date the officer began serving the Morgan Stanley Funds. Each officer serves a one-year term, until his or her successor is elected and qualifies.
27
Morgan Stanley Institutional Fund, Inc.
Annual Report — December 31, 2017
Adviser and Administrator
Morgan Stanley Investment Management Inc.
522 Fifth Avenue
New York, New York 10036
Distributor
Morgan Stanley Distribution, Inc.
522 Fifth Avenue
New York, New York 10036
Dividend Disbursing and Transfer Agent
DST Asset Manager Solutions, Inc.
2000 Crown Colony Drive
Quincy, Massachusetts 02169
Custodian
State Street Bank and Trust Company
One Lincoln Street
Boston, Massachusetts 02111
Legal Counsel
Dechert LLP
1095 Avenue of the Americas
New York, New York 10036
Counsel to the Independent Directors
Perkins Coie LLP
30 Rockefeller Plaza
New York, New York 10112
Independent Registered Public Accounting Firm
Ernst & Young LLP
200 Clarendon Street
Boston, Massachusetts 02116
Reporting to Shareholders
Each Morgan Stanley Fund provides a complete schedule of portfolio holdings in its semi-annual and annual reports within 60 days of the end of the fund's second and fourth fiscal quarters. The semi-annual and annual reports are filed electronically with the Securities and Exchange Commission (SEC) on Form N-CSRS and Form N-CSR, respectively. Morgan Stanley also delivers the semi-annual and annual reports to fund shareholders and makes these reports available on its public website, www.morganstanley.com/im. Each Morgan Stanley fund also files a complete schedule of portfolio holdings with the SEC for the fund's first and third fiscal quarters on Form N-Q. Morgan Stanley does not deliver the reports for the first and third fiscal quarters to shareholders, nor are the reports posted to the Morgan Stanley public website. You may, however, obtain the Form N-Q filings (as well as the Form N-CSR and N-CSRS filings) by accessing the SEC's website, www.sec.gov. You may also review and copy them at the SEC's Public Reference Room in Washington, DC. Information on the operation of the SEC's Public Reference Room may be obtained by calling the SEC toll free at 1 (800) SEC-0330. You can also request copies of these materials, upon payment of a duplicating fee, by electronic request at the SEC's email address (publicinfo@sec.gov) or by writing to the SEC's Public Reference Section, Washington, D.C. 20549-1520.
Proxy Voting Policies and Procedures and Proxy Voting Record
You may obtain a copy of the Company's Proxy Voting Policy and Procedures and information regarding how the Company voted proxies relating to portfolio securities during the most recent twelve-month period ended June 30, without charge, upon request, by calling toll free 1 (800) 548-7786 or by visiting our website at www.morganstanley.com/im. This information is also available on the SEC's website at www.sec.gov.
This report is authorized for distribution only when preceded or accompanied by a prospectus or summary prospectus of the applicable Fund of Morgan Stanley Institutional Fund, Inc., which describes in detail the Fund's investment policies, risks, fees and expenses. Please read the prospectus carefully before you invest or send money. For additional information, including information regarding the investments comprising the Fund, please visit our website at www.morganstanley.com/im or call toll free 1 (800) 548-7786.
28
Printed in U.S.A.
This Report has been prepared for shareholders and may be distributed to others only if preceded or accompanied by a current prospectus.
Morgan Stanley Investment Management Inc.
522 Fifth Avenue
New York, New York 10036
© 2018 Morgan Stanley. Morgan Stanley Distribution, Inc.

IFIUSCPANN
2007712 EXP. 02.28.19

Morgan Stanley Institutional Fund, Inc.
U.S. Real Estate Portfolio
Annual Report
December 31, 2017

Morgan Stanley Institutional Fund, Inc.
Annual Report — December 31, 2017
Shareholders' Letter | | | 2 | | |
Expense Example | | | 3 | | |
Investment Overview | | | 4 | | |
Portfolio of Investments | | | 7 | | |
Statement of Assets and Liabilities | | | 9 | | |
Statement of Operations | | | 11 | | |
Statements of Changes in Net Assets | | | 12 | | |
Financial Highlights | | | 14 | | |
Notes to Financial Statements | | | 19 | | |
Report of Independent Registered Public Accounting Firm | | | 26 | | |
Federal Tax Notice | | | 27 | | |
Privacy Notice | | | 28 | | |
Director and Officer Information | | | 31 | | |
This report is authorized for distribution only when preceded or accompanied by a prospectus or summary prospectus of the applicable Fund of Morgan Stanley Institutional Fund, Inc. To receive a prospectus and/or statement of additional information (SAI), which contains more complete information such as investment objectives, charges, expenses, policies for voting proxies, risk considerations, and describes in detail each of the Fund's investment policies to the prospective investor, please call toll free 1 (800) 548-7786. Please read the prospectuses carefully before you invest or send money.
Additionally, you can access information about the Fund including performance, characteristics, and investment team commentary, through Morgan Stanley Investment Management's website: www.morganstanley.com/im.
Market forecasts provided in this report may not necessarily come to pass. There is no guarantee that any sectors mentioned will continue to perform as discussed herein or that securities in such sectors will be held by the Fund in the future. There is no assurance that a fund will achieve its investment objective. Funds are subject to market risk, which is the possibility that market values of securities owned by the Fund will decline and, therefore, the value of the Fund's shares may be less than what you paid for them. Accordingly, you can lose money investing in this Fund. Please see the prospectus for more complete information on investment risks.
1
Morgan Stanley Institutional Fund, Inc.
Annual Report — December 31, 2017
Shareholders' Letter (unaudited)
Dear Shareholders,
We are pleased to provide this Annual report, in which you will learn how your investment in U.S. Real Estate Portfolio (the "Fund") performed during the latest twelve-month period.
Morgan Stanley Investment Management is a client-centric, investor-led organization. Our global presence, intellectual capital, and breadth of products and services enable us to partner with investors to meet the evolving challenges of today's financial markets. We aim to deliver superior investment service and to empower our clients to make the informed decisions that help them reach their investment goals.
As always, we thank you for selecting Morgan Stanley Investment Management, and look forward to working with you in the months and years ahead.
Sincerely,

John H. Gernon
President and Principal Executive Officer
January 2018
2
Morgan Stanley Institutional Fund, Inc.
Annual Report — December 31, 2017
Expense Example (unaudited)
U.S. Real Estate Portfolio
As a shareholder of the Fund, you incur two types of costs: (1) transactional costs; and (2) ongoing costs, which may include advisory fees, administration fees, distribution and shareholder services fees and other Fund expenses. This example is intended to help you understand your ongoing costs (in dollars) of investing in the Fund and to compare these costs with the ongoing costs of investing in other mutual funds.
This example is based on an investment of $1,000 invested at the beginning of the six-month period ended December 31, 2017 and held for the entire six-month period.
Actual Expenses
The table below provides information about actual account values and actual expenses. You may use the information in this table, together with the amount you invested, to estimate the expenses that you paid over the period. Simply divide your account value by $1,000 (for example, an $8,600 account value divided by $1,000 = 8.6), then multiply the result by the number in the table under the heading entitled "Actual Expenses Paid During Period" to estimate the expenses you paid on your account during this period.
Hypothetical Example for Comparison Purposes
The table below provides information about hypothetical account values and hypothetical expenses based on the Fund's actual expense ratio and an assumed rate of return of 5% per year before expenses, which is not the Fund's actual return. The hypothetical account values and expenses may not be used to estimate the actual ending account balance or expenses you paid for the period. You may use this information to compare the ongoing costs of investing in the Fund and other funds. To do so, compare this 5% hypothetical example with the 5% hypothetical examples that appear in the shareholder reports of the other funds.
Please note that the expenses shown in the table are meant to highlight your ongoing costs only and do not reflect any transactional costs, such as sales charges (loads). Therefore, the information for each class in the table is useful in comparing ongoing costs only, and will not help you determine the relative total costs of owning different funds. In addition, if these transactional costs were included, your costs would have been higher.
| | | Beginning
Account
Value
7/1/17 | | Actual Ending
Account
Value
12/31/17 | | Hypothetical
Ending Account
Value | | Actual
Expenses
Paid
During
Period* | | Hypothetical
Expenses Paid
During Period* | | Net
Expense
Ratio
During
Period** | |
U.S. Real Estate Portfolio Class I | | $ | 1,000.00 | | | $ | 1,042.50 | | | $ | 1,020.16 | | | $ | 5.15 | | | $ | 5.09 | | | | 1.00 | % | |
U.S. Real Estate Portfolio Class A | | | 1,000.00 | | | | 1,040.90 | | | | 1,018.40 | | | | 6.94 | | | | 6.87 | | | | 1.35 | | |
U.S. Real Estate Portfolio Class L | | | 1,000.00 | | | | 1,038.20 | | | | 1,015.88 | | | | 9.50 | | | | 9.40 | | | | 1.85 | | |
U.S. Real Estate Portfolio Class C | | | 1,000.00 | | | | 1,037.30 | | | | 1,014.62 | | | | 10.78 | | | | 10.66 | | | | 2.10 | | |
U.S. Real Estate Portfolio Class IS | | | 1,000.00 | | | | 1,042.90 | | | | 1,020.42 | | | | 4.89 | | | | 4.84 | | | | 0.95 | | |
* Expenses are calculated using each Fund Class' annualized net expense ratio (as disclosed), multiplied by the average account value over the period, and multiplied by 184/365 (to reflect the most recent one-half year period).
** Annualized.
3
Morgan Stanley Institutional Fund, Inc.
Annual Report — December 31, 2017
Investment Overview (unaudited)
U.S. Real Estate Portfolio
The Fund seeks to provide above average current income and long-term capital appreciation by investing primarily in equity securities of companies in the U.S. real estate industry, including real estate investment trusts ("REITs").
Performance
For the year ended December 31, 2017, the Fund's Class I shares had a total return based on net asset value and reinvestment of distributions per share of 3.31%, net of fees. The Fund's Class I shares underperformed against the Fund's benchmark, the FTSE NAREIT Equity REITs Index (the "Index"), which returned 5.23%, and underperformed the S&P 500® Index, which returned 21.83%.
Factors Affecting Performance
• The REIT market gained 5.23% in the 12-month period ending December 31, 2017, as measured by the Index. REITs posted gains during the period, but underperformed the broader equity markets, as investors generally appeared to prefer investing in other sectors in what was perceived as a better growth environment. There has been a wide disparity with sectors grouped at Premiums, Near Par and at Significant Discounts to net asset values ("NAVs"). Premiums are sectors with perceived defensive characteristics (net lease, health care) and/or benefiting from secular demand growth of digital technology and e-commerce (industrial, data center); Near Par are sectors experiencing decelerating same-store net operating income growth due to conventional supply-demand factors (storage, hotels, apartment, office ex-NYC); and Significant Discounts are sectors experiencing extreme negative investor sentiment (NYC office and retail).
• Among the major sectors, the apartment sector performed in line with the Index, while the retail and office sectors underperformed. Despite significant outperformance in the fourth quarter due to improved sentiment largely as a result of November news that included a private take-private bid on one mall REIT and activist investors taking new stakes in two other mall REITs, retail was the worst-performing sector of the year as a result of pervasive negative investor sentiment ensuing from concerns over the impact of retailer challenges on retail real estate. In the office sector, both the secondary central business district (CBD)/suburban office and primary CBD office assets
underperformed the Index. The health care REITs posted the weakest performance among all of the sectors in fourth quarter, resulting in underperformance for the full year. Recent weakness appears to be related to investor concerns with regard to oversupply in the senior living sector and weakness in the skilled nursing facility tenants. Among the smaller sectors, the data center and industrial sectors provided the best returns for the full year, as they benefited from investor focus on the secular demand growth of digital technology and e-commerce. The hotel sector outperformed for the year due to optimism for improved corporate travel. The net lease sector outperformed for the full year, while the storage sector underperformed.
• The Fund underperformed the Index for the period. Favorable bottom-up stock selection was more than offset by underperformance from top-down sector allocation relative to the Index. From a bottom-up perspective, the Fund achieved favorable relative stock selection in the mall, shopping center and hotel sectors; this was partially offset by less favorable stock selection in the secondary CBD/suburban office and primary CBD office sectors. From a top-down perspective, the underweight to the shopping centers and health care sectors contributed to relative performance. This was more than offset by the underweight to the data center and industrial sectors and overweight to the mall sector, which detracted from performance.
Management Strategies
• We have maintained our core investment philosophy as a real estate value investor. This results in the ownership of stocks whose share prices provide real estate exposure at the best valuation relative to their underlying asset values. We continue to focus on relative implied valuations as a key metric. Our company-specific research leads us to an overweighting in the portfolio to a group of companies that are focused in the ownership of NYC office and Class A mall assets and a number of out-of-favor companies, and an underweighting to companies concentrated in the ownership of health care, data center and net lease assets.
• Our outlook for the REIT market is based on two key factors: private market pricing for underlying real estate assets and public market pricing for the
4
Morgan Stanley Institutional Fund, Inc.
Annual Report — December 31, 2017
Investment Overview (unaudited) (cont'd)
U.S. Real Estate Portfolio
securities. The REIT sector gained 5.23% for the full year (as measured by the Index). With asset values for high-quality assets having fully recovered and now, on average, approximately 20% in excess of levels achieved in 2007, the overall REIT market ended the year trading at an approximate 2% premium to NAVs, although there is wider than typical disparity in relative valuations among the sectors.(i) We see the most attractive value in the owners of NYC office and Class A mall assets. These companies provide exposure to high-quality core assets at significant discounted valuations.(i)
(i) Source: Morgan Stanley Investment Management as of December 31, 2017
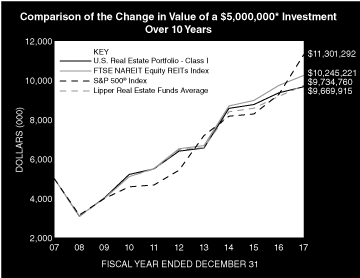
* Minimum Investment for Class I shares
In accordance with SEC regulations, the Fund's performance shown assumes that all recurring fees (including management fees) were deducted and all dividends and distributions were reinvested. The performance of Class A, L, C and IS shares will vary from Class I shares based upon their different inception dates and will be negatively impacted by additional fees assessed to those classes (if applicable).
Performance Compared to the FTSE NAREIT Equity REITs Index(1), the S&P 500® Index(2), and the Lipper Real Estate Funds Average(3)
| | | Period Ended December 31, 2017
Total Returns(4) | |
| | | | | Average Annual | |
| | | One
Year | | Five
Years | | Ten
Years | | Since
Inception(10) | |
Fund — Class I Shares
w/o sales charges(5) | | | 3.31 | % | | | 8.61 | % | | | 6.82 | % | | | 11.94 | % | |
Fund — Class A Shares
w/o sales charges(6) | | | 2.98 | | | | 8.28 | | | | 6.51 | | | | 11.11 | | |
Fund — Class A Shares
with maximum 5.25%
sales charges(6) | | | –2.44 | | | | 7.12 | | | | 5.94 | | | | 10.84 | | |
Fund — Class L Shares
w/o sales charges(7) | | | 2.37 | | | | 7.71 | | | | — | | | | 8.96 | | |
Fund — Class C Shares
w/o sales charges(9) | | | 2.14 | | | | — | | | | — | | | | 3.95 | | |
Fund — Class C Shares
with maximum 1.00%
deferred sales charges(9) | | | 1.26 | | | | — | | | | — | | | | 3.95 | | |
Fund — Class IS Shares
w/o sales charges(8) | | | 3.32 | | | | — | | | | — | | | | 9.62 | | |
FTSE NAREIT Equity REITs Index | | | 5.23 | | | | 9.46 | | | | 7.44 | | | | 10.79 | | |
S&P 500® Index | | | 21.83 | | | | 15.79 | | | | 8.50 | | | | 9.81 | | |
Lipper Real Estate Funds Average | | | 6.02 | | | | 8.46 | | | | 6.79 | | | | 10.97 | | |
Performance data quoted represents past performance, which is no guarantee of future results, and current performance may be lower or higher than the figures shown. Performance assumes that all dividends and distributions, if any, were reinvested. For the most recent month-end performance figures, please visit www.morganstanley.com/im. Investment return and principal value will fluctuate so that Fund shares, when redeemed, may be worth more or less than their original cost. Total returns do not reflect the deduction of taxes that a shareholder would pay on Fund distributions or the redemption of Fund shares. Performance of share classes will vary due to difference in sales charges and expenses.
(1) The FTSE NAREIT (National Association of Real Estate Investment Trusts) Equity REITs Index is free float-adjusted market capitalization weighted index of tax-qualified REITs listed on the New York Stock Exchange, NYSE Amex and the NASDAQ National Market Systems. Effective December 20, 2010, the FTSE NAREIT Equity REITs Index will not include "Timber REITs" The Index is unmanaged and its returns do not include any sales charges or fees. Such costs would lower performance. It is not possible to invest directly in an index.
(2) The Standard & Poor's 500® Index (S&P 500®) measures the performance of the large cap segment of the U.S. equities market, covering approximately 80% of the U.S. equities market. The Index includes 500 leading companies in leading industries of the U.S. economy. The Index is unmanaged and its returns do not include any sales charges or fees. Such costs would lower performance. It is not possible to invest directly in an index.
(3) The Lipper Real Estate Funds Average tracks the performance of all funds in the Lipper Real Estate Funds classification. The Average, which is adjusted for capital gains distributions and income dividends, is unmanaged and should not be considered an investment. As of the date of this report, the Fund is in the Lipper Real Estate Funds classification.
5
Morgan Stanley Institutional Fund, Inc.
Annual Report — December 31, 2017
Investment Overview (unaudited) (cont'd)
U.S. Real Estate Portfolio
(4) Total returns for the Fund reflect fees waived and expenses reimbursed, if applicable, by the Adviser. Without such waivers and reimbursements, total returns would have been lower.
(5) Commenced operations on February 24, 1995.
(6) Commenced offering on January 2, 1996.
(7) Commenced offering on November 11, 2011.
(8) Commenced offering on September 13, 2013.
(9) Commenced offering on April 30, 2015.
(10) For comparative purposes, average annual since inception returns listed for the Indexes refer to the inception date of Class I of the Fund, not the inception of the Index.
6
Morgan Stanley Institutional Fund, Inc.
Annual Report — December 31, 2017
Portfolio of Investments
U.S. Real Estate Portfolio
| | | Shares | | Value
(000) | |
Common Stocks (99.4%) | |
Apartments (11.4%) | |
American Campus Communities, Inc. REIT | | | 12,899 | | | $ | 529 | | |
AvalonBay Communities, Inc. REIT | | | 83,450 | | | | 14,888 | | |
Camden Property Trust REIT | | | 142,988 | | | | 13,164 | | |
Education Realty Trust, Inc. REIT | | | 86,800 | | | | 3,031 | | |
Equity Residential REIT | | | 335,661 | | | | 21,405 | | |
Essex Property Trust, Inc. REIT | | | 37,574 | | | | 9,069 | | |
UDR, Inc. REIT | | | 121,521 | | | | 4,681 | | |
| | | | 66,767 | | |
Commercial Financing (0.9%) | |
Blackstone Mortgage Trust, Inc., Class A REIT | | | 95,080 | | | | 3,060 | | |
Starwood Property Trust, Inc. REIT | | | 115,370 | | | | 2,463 | | |
| | | | 5,523 | | |
Data Centers (3.3%) | |
Digital Realty Trust, Inc. REIT | | | 71,750 | | | | 8,172 | | |
QTS Realty Trust, Inc., Class A REIT | | | 207,158 | | | | 11,220 | | |
| | | | 19,392 | | |
Diversified (9.6%) | |
JBG SMITH Properties REIT | | | 204,088 | | | | 7,088 | | |
VEREIT, Inc. REIT | | | 721,030 | | | | 5,617 | | |
Vornado Realty Trust REIT | | | 560,638 | | | | 43,831 | | |
| | | | 56,536 | | |
Free Standing (0.8%) | |
National Retail Properties, Inc. REIT | | | 107,950 | | | | 4,656 | | |
Health Care (7.1%) | |
HCP, Inc. REIT | | | 351,097 | | | | 9,157 | | |
Healthcare Realty Trust, Inc. REIT | | | 366,394 | | | | 11,768 | | |
Healthcare Trust of America, Inc., Class A REIT | | | 179,214 | | | | 5,383 | | |
Ventas, Inc. REIT | | | 130,609 | | | | 7,838 | | |
Welltower, Inc. REIT | | | 119,959 | | | | 7,650 | | |
| | | | 41,796 | | |
Industrial (5.6%) | |
DCT Industrial Trust, Inc. REIT | | | 150,196 | | | | 8,829 | | |
Duke Realty Corp. REIT | | | 61,705 | | | | 1,679 | | |
Exeter Industrial Value Fund, LP REIT
(See Note A-4) (a)(b)(c)(d) | | | 7,905,000 | | | | 885 | | |
Liberty Property Trust REIT | | | 8,797 | | | | 378 | | |
ProLogis, Inc. REIT | | | 247,556 | | | | 15,970 | | |
Rexford Industrial Realty, Inc. REIT | | | 174,896 | | | | 5,100 | | |
| | | | 32,841 | | |
Lodging/Resorts (5.5%) | |
Chesapeake Lodging Trust REIT | | | 115,464 | | | | 3,128 | | |
Hilton Worldwide Holdings, Inc. | | | 42,673 | | | | 3,408 | | |
Host Hotels & Resorts, Inc. REIT | | | 296,883 | | | | 5,893 | | |
LaSalle Hotel Properties REIT | | | 539,804 | | | | 15,152 | | |
RLJ Lodging Trust REIT | | | 209,100 | | | | 4,594 | | |
| | | | 32,175 | | |
Manufactured Homes (0.1%) | |
Equity Lifestyle Properties, Inc. REIT | | | 7,069 | | | | 629 | | |
| | | Shares | | Value
(000) | |
Office (19.9%) | |
Alexandria Real Estate Equities, Inc. REIT | | | 32,347 | | | $ | 4,224 | | |
Boston Properties, Inc. REIT | | | 328,395 | | | | 42,701 | | |
Brandywine Realty Trust REIT | | | 147,441 | | | | 2,682 | | |
BRCP REIT II, LP (See Note A-4) (a)(b)(c)(d) | | | 8,363,574 | | | | 761 | | |
Cousins Properties, Inc. REIT | | | 412,655 | | | | 3,817 | | |
Douglas Emmett, Inc. REIT | | | 62,592 | | | | 2,570 | | |
Hudson Pacific Properties, Inc. REIT | | | 83,342 | | | | 2,854 | | |
Kilroy Realty Corp. REIT | | | 128,783 | | | | 9,614 | | |
Mack-Cali Realty Corp. REIT | | | 381,708 | | | | 8,230 | | |
Paramount Group, Inc. REIT | | | 513,487 | | | | 8,139 | | |
SL Green Realty Corp. REIT | | | 299,683 | | | | 30,247 | | |
Tier REIT, Inc. REIT | | | 48,017 | | | | 979 | | |
| | | | 116,818 | | |
Regional Malls (20.4%) | |
CBL & Associates Properties, Inc. REIT | | | 24,145 | | | | 137 | | |
GGP, Inc. REIT | | | 1,042,711 | | | | 24,389 | | |
Macerich Co. (The) REIT | | | 185,930 | | | | 12,212 | | |
Pennsylvania Real Estate Investment Trust REIT | | | 146,771 | | | | 1,745 | | |
Simon Property Group, Inc. REIT | | | 426,737 | | | | 73,288 | | |
Taubman Centers, Inc. REIT | | | 119,598 | | | | 7,825 | | |
| | | | 119,596 | | |
Self Storage (7.4%) | |
CubeSmart REIT | | | 293,779 | | | | 8,496 | | |
Life Storage, Inc. REIT | | | 91,779 | | | | 8,175 | | |
Public Storage REIT | | | 126,660 | | | | 26,472 | | |
| | | | 43,143 | | |
Shopping Centers (4.5%) | |
Brixmor Property Group, Inc. REIT | | | 223,066 | | | | 4,162 | | |
DDR Corp. REIT | | | 96,510 | | | | 865 | | |
Federal Realty Investment Trust REIT | | | 17,749 | | | | 2,357 | | |
Regency Centers Corp. REIT | | | 231,086 | | | | 15,987 | | |
Tanger Factory Outlet Centers, Inc. REIT | | | 109,597 | | | | 2,905 | | |
| | | | 26,276 | | |
Single Family Homes (1.9%) | |
American Homes 4 Rent, Class A REIT | | | 292,266 | | | | 6,383 | | |
Invitation Homes, Inc. REIT | | | 203,247 | | | | 4,791 | | |
| | | | 11,174 | | |
Specialty (1.0%) | |
Gaming and Leisure Properties, Inc. REIT | | | 156,543 | | | | 5,792 | | |
Total Common Stocks (Cost $437,556) | | | 583,114 | | |
Short-Term Investment (0.3%) | |
Investment Company (0.3%) | |
Morgan Stanley Institutional Liquidity
Funds — Treasury Portfolio —
Institutional Class (See Note G)
(Cost $1,942) | | | 1,941,556 | | | | 1,942 | | |
Total Investments (99.7%) (Cost $439,498) (e) | | | 585,056 | | |
Other Assets in Excess of Liabilities (0.3%) | | | 2,030 | | |
Net Assets (100.0%) | | $ | 587,086 | | |
The accompanying notes are an integral part of the financial statements.
7
Morgan Stanley Institutional Fund, Inc.
Annual Report — December 31, 2017
Portfolio of Investments (cont'd)
U.S. Real Estate Portfolio
(a) Non-income producing security.
(b) At December 31, 2017, the Fund held fair valued securities valued at approximately $1,646,000, representing 0.3% of net assets. These securities have been fair valued as determined in good faith under procedures established by and under the general supervision of the Company's Directors.
(c) Security has been deemed illiquid at December 31, 2017.
(d) Restricted security valued at fair value and not registered under the Securities Act of 1933. BRCP REIT II, LP was acquired between 10/06 - 4/11 and has a current cost basis of approximately $2,495,000. Exeter Industrial Value Fund, LP was acquired between 11/07 - 4/11 and has a current cost basis of approximately $0. At December 31, 2017, these securities had an aggregate market value of approximately $1,646,000, representing 0.3% of net assets.
(e) At December 31, 2017, the aggregate cost for federal income tax purposes is approximately $444,679,000. The aggregate gross unrealized appreciation is approximately $148,330,000 and the aggregate gross unrealized depreciation is approximately $7,953,000, resulting in net unrealized appreciation of approximately $140,377,000.
REIT Real Estate Investment Trust.
Portfolio Composition
Classification | | Percentage of
Total Investments | |
Regional Malls | | | 20.4 | % | |
Office | | | 19.9 | | |
Other* | | | 13.1 | | |
Apartments | | | 11.4 | | |
Diversified | | | 9.6 | | |
Self Storage | | | 7.4 | | |
Health Care | | | 7.1 | | |
Industrial | | | 5.6 | | |
Lodging/Resorts | | | 5.5 | | |
Total Investments | | | 100.0 | % | |
* Industries and/or investment types representing less than 5% of total investments.
The accompanying notes are an integral part of the financial statements.
8
Morgan Stanley Institutional Fund, Inc.
Annual Report — December 31, 2017
U.S. Real Estate Portfolio
Statement of Assets and Liabilities | | December 31, 2017
(000) | |
Assets: | |
Investments in Securities of Unaffiliated Issuers, at Value (Cost $437,556) | | $ | 583,114 | | |
Investment in Security of Affiliated Issuer, at Value (Cost $1,942) | | | 1,942 | | |
Total Investments in Securities, at Value (Cost $439,498) | | | 585,056 | | |
Foreign Currency, at Value (Cost $1) | | | 1 | | |
Cash | | | 11 | | |
Dividends Receivable | | | 2,668 | | |
Receivable for Fund Shares Sold | | | 1,043 | | |
Receivable for Investments Sold | | | 591 | | |
Receivable from Affiliate | | | 3 | | |
Other Assets | | | 79 | | |
Total Assets | | | 589,452 | | |
Liabilities: | |
Payable for Advisory Fees | | | 1,163 | | |
Payable for Fund Shares Redeemed | | | 848 | | |
Payable for Sub Transfer Agency Fees — Class I | | | 100 | | |
Payable for Sub Transfer Agency Fees — Class A | | | 21 | | |
Payable for Sub Transfer Agency Fees — Class L | | | 2 | | |
Payable for Sub Transfer Agency Fees — Class C | | | — | @ | |
Payable for Professional Fees | | | 49 | | |
Payable for Administration Fees | | | 40 | | |
Payable for Directors' Fees and Expenses | | | 29 | | |
Payable for Custodian Fees | | | 24 | | |
Payable for Transfer Agency Fees — Class I | | | 8 | | |
Payable for Transfer Agency Fees — Class A | | | 4 | | |
Payable for Transfer Agency Fees — Class L | | | 1 | | |
Payable for Transfer Agency Fees — Class C | | | 1 | | |
Payable for Transfer Agency Fees — Class IS | | | 2 | | |
Payable for Shareholder Services Fees — Class A | | | 12 | | |
Payable for Distribution and Shareholder Services Fees — Class L | | | 2 | | |
Payable for Distribution and Shareholder Services Fees — Class C | | | — | @ | |
Other Liabilities | | | 60 | | |
Total Liabilities | | | 2,366 | | |
Net Assets | | $ | 587,086 | | |
Net Assets Consist Of: | |
Paid-in-Capital | | $ | 424,461 | | |
Accumulated Undistributed Net Investment Income | | | 4,593 | | |
Accumulated Net Realized Gain | | | 12,474 | | |
Unrealized Appreciation (Depreciation) on: | |
Investments | | | 145,558 | | |
Foreign Currency Translations | | | (— | @) | |
Net Assets | | $ | 587,086 | | |
The accompanying notes are an integral part of the financial statements.
9
Morgan Stanley Institutional Fund, Inc.
Annual Report — December 31, 2017
U.S. Real Estate Portfolio
Statement of Assets and Liabilities (cont'd) | | December 31, 2017
(000) | |
CLASS I: | |
Net Assets | | $ | 331,637 | | |
| Shares Outstanding $0.001 par value shares of beneficial interest (unlimited shares authorized) (not in 000's) | | | 21,762,683 | | |
Net Asset Value, Offering and Redemption Price Per Share | | $ | 15.24 | | |
CLASS A: | |
Net Assets | | $ | 55,640 | | |
| Shares Outstanding $0.001 par value shares of beneficial interest (unlimited shares authorized) (not in 000's) | | | 3,770,837 | | |
Net Asset Value, Redemption Price Per Share | | $ | 14.76 | | |
Maximum Sales Load | | | 5.25 | % | |
Maximum Sales Charge | | $ | 0.82 | | |
Maximum Offering Price Per Share | | $ | 15.58 | | |
CLASS L: | |
Net Assets | | $ | 2,787 | | |
| Shares Outstanding $0.001 par value shares of beneficial interest (unlimited shares authorized) (not in 000's) | | | 189,003 | | |
Net Asset Value, Offering and Redemption Price Per Share | | $ | 14.74 | | |
CLASS C: | |
Net Assets | | $ | 486 | | |
| Shares Outstanding $0.001 par value shares of beneficial interest (unlimited shares authorized) (not in 000's) | | | 33,097 | | |
Net Asset Value, Offering and Redemption Price Per Share | | $ | 14.68 | | |
CLASS IS: | |
Net Assets | | $ | 196,536 | | |
| Shares Outstanding $0.001 par value shares of beneficial interest (unlimited shares authorized) (not in 000's) | | | 12,894,926 | | |
Net Asset Value, Offering and Redemption Price Per Share | | $ | 15.24 | | |
@ Amount is less than $500.
The accompanying notes are an integral part of the financial statements.
10
Morgan Stanley Institutional Fund, Inc.
Annual Report — December 31, 2017
U.S. Real Estate Portfolio
Statement of Operations | | Year Ended
December 31, 2017
(000) | |
Investment Income: | |
Dividends from Securities of Unaffiliated Issuers | | $ | 21,939 | | |
Dividends from Security of Affiliated Issuer (Note G) | | | 32 | | |
Total Investment Income | | | 21,971 | | |
Expenses: | |
Advisory Fees (Note B) | | | 5,379 | | |
Administration Fees (Note C) | | | 547 | | |
Sub Transfer Agency Fees — Class I | | | 343 | | |
Sub Transfer Agency Fees — Class A | | | 95 | | |
Sub Transfer Agency Fees — Class L | | | 3 | | |
Sub Transfer Agency Fees — Class C | | | — | @ | |
Shareholder Services Fees — Class A (Note D) | | | 163 | | |
Distribution and Shareholder Services Fees — Class L (Note D) | | | 23 | | |
Distribution and Shareholder Services Fees — Class C (Note D) | | | 5 | | |
Professional Fees | | | 123 | | |
Registration Fees | | | 92 | | |
Shareholder Reporting Fees | | | 80 | | |
Transfer Agency Fees — Class I (Note E) | | | 28 | | |
Transfer Agency Fees — Class A (Note E) | | | 13 | | |
Transfer Agency Fees — Class L (Note E) | | | 3 | | |
Transfer Agency Fees — Class C (Note E) | | | 2 | | |
Transfer Agency Fees — Class IS (Note E) | | | 7 | | |
Custodian Fees (Note F) | | | 37 | | |
Directors' Fees and Expenses | | | 21 | | |
Pricing Fees | | | 4 | | |
Other Expenses | | | 48 | | |
Expenses Before Non Operating Expenses | | | 7,016 | | |
Bank Overdraft Expense | | | 4 | | |
Total Expenses | | | 7,020 | | |
Reimbursement of Class Specific Expenses — Class I (Note B) | | | (63 | ) | |
Reimbursement of Class Specific Expenses — Class L (Note B) | | | (1 | ) | |
Reimbursement of Class Specific Expenses — Class C (Note B) | | | (2 | ) | |
Rebate from Morgan Stanley Affiliate (Note G) | | | (9 | ) | |
Net Expenses | | | 6,945 | | |
Net Investment Income | | | 15,026 | | |
Realized Gain: | |
Investments Sold | | | 87,966 | | |
Change in Unrealized Appreciation (Depreciation): | |
Investments | | | (85,277 | ) | |
Foreign Currency Translations | | | — | @ | |
Net Change in Unrealized Appreciation (Depreciation) | | | (85,277 | ) | |
Net Realized Gain and Change in Unrealized Appreciation (Depreciation) | | | (2,689 | ) | |
Net Increase in Net Assets Resulting from Operations | | $ | 17,715 | | |
@ Amount is less than $500.
The accompanying notes are an integral part of the financial statements.
11
Morgan Stanley Institutional Fund, Inc.
Annual Report — December 31, 2017
U.S. Real Estate Portfolio
Statements of Changes in Net Assets | | Year Ended
December 31, 2017
(000) | | Year Ended
December 31, 2016
(000) | |
Increase (Decrease) in Net Assets: | |
Operations: | |
Net Investment Income | | $ | 15,026 | | | $ | 13,938 | | |
Net Realized Gain | | | 87,966 | | | | 52,824 | | |
Net Change in Unrealized Appreciation (Depreciation) | | | (85,277 | ) | | | (13,149 | ) | |
Net Increase in Net Assets Resulting from Operations | | | 17,715 | | | | 53,613 | | |
Distributions from and/or in Excess of: | |
Class I: | |
Net Investment Income | | | (6,074 | ) | | | (10,756 | ) | |
Net Realized Gain | | | (45,159 | ) | | | (42,079 | ) | |
Class A: | |
Net Investment Income | | | (767 | ) | | | (1,446 | ) | |
Net Realized Gain | | | (7,798 | ) | | | (6,682 | ) | |
Class L: | |
Net Investment Income | | | (21 | ) | | | (45 | ) | |
Net Realized Gain | | | (386 | ) | | | (303 | ) | |
Class C: | |
Net Investment Income | | | (2 | ) | | | (3 | ) | |
Net Realized Gain | | | (65 | ) | | | (21 | ) | |
Class IS: | |
Net Investment Income | | | (3,208 | ) | | | (3,742 | ) | |
Net Realized Gain | | | (25,427 | ) | | | (15,246 | ) | |
Total Distributions | | | (88,907 | ) | | | (80,323 | ) | |
Capital Share Transactions:(1) | |
Class I: | |
Subscribed | | | 45,913 | | | | 89,531 | | |
Distributions Reinvested | | | 50,421 | | | | 52,022 | | |
Redeemed | | | (218,674 | ) | | | (257,414 | ) | |
Class A: | |
Subscribed | | | 7,511 | | | | 20,770 | | |
Distributions Reinvested | | | 8,510 | | | | 8,073 | | |
Redeemed | | | (29,361 | ) | | | (37,132 | ) | |
Class L: | |
Exchanged | | | — | | | | 4 | | |
Distributions Reinvested | | | 401 | | | | 346 | | |
Redeemed | | | (738 | ) | | | (740 | ) | |
Class C: | |
Subscribed | | | 179 | | | | 404 | | |
Distributions Reinvested | | | 66 | | | | 22 | | |
Redeemed | | | (131 | ) | | | (72 | ) | |
Class IS: | |
Subscribed | | | 83,171 | | | | 89,169 | | |
Distributions Reinvested | | | 6,283 | | | | 3,809 | | |
Redeemed | | | (65,710 | ) | | | (30,860 | ) | |
Net Decrease in Net Assets Resulting from Capital Share Transactions | | | (112,159 | ) | | | (62,068 | ) | |
Total Decrease in Net Assets | | | (183,351 | ) | | | (88,778 | ) | |
Net Assets: | |
Beginning of Period | | | 770,437 | | | | 859,215 | | |
End of Period (Including Accumulated Undistributed Net Investment Income of $4,593 and $821) | | $ | 587,086 | | | $ | 770,437 | | |
The accompanying notes are an integral part of the financial statements.
12
Morgan Stanley Institutional Fund, Inc.
Annual Report — December 31, 2017
U.S. Real Estate Portfolio
Statements of Changes in Net Assets (cont'd) | | Year Ended
December 31, 2017
(000) | | Year Ended
December 31, 2016
(000) | |
(1) Capital Share Transactions: | |
Class I: | |
Shares Subscribed | | | 2,733 | | | | 4,857 | | |
Shares Issued on Distributions Reinvested | | | 3,289 | | | | 2,935 | | |
Shares Redeemed | | | (13,016 | ) | | | (14,086 | ) | |
Net Decrease in Class I Shares Outstanding | | | (6,994 | ) | | | (6,294 | ) | |
Class A: | |
Shares Subscribed | | | 457 | | | | 1,161 | | |
Shares Issued on Distributions Reinvested | | | 574 | | | | 468 | | |
Shares Redeemed | | | (1,805 | ) | | | (2,106 | ) | |
Net Decrease in Class A Shares Outstanding | | | (774 | ) | | | (477 | ) | |
Class L: | |
Shares Exchanged | | | — | | | | — | @@ | |
Shares Issued on Distributions Reinvested | | | 28 | | | | 20 | | |
Shares Redeemed | | | (46 | ) | | | (42 | ) | |
Net Decrease in Class L Shares Outstanding | | | (18 | ) | | | (22 | ) | |
Class C: | |
Shares Subscribed | | | 11 | | | | 23 | | |
Shares Issued on Distributions Reinvested | | | 4 | | | | 1 | | |
Shares Redeemed | | | (8 | ) | | | (4 | ) | |
Net Increase in Class C Shares Outstanding | | | 7 | | | | 20 | | |
Class IS: | |
Shares Subscribed | | | 5,043 | | | | 4,903 | | |
Shares Issued on Distributions Reinvested | | | 410 | | | | 218 | | |
Shares Redeemed | | | (3,914 | ) | | | (1,696 | ) | |
Net Increase in Class IS Shares Outstanding | | | 1,539 | | | | 3,425 | | |
@@ Amount is less than 500 shares.
The accompanying notes are an integral part of the financial statements.
13
Morgan Stanley Institutional Fund, Inc.
Annual Report — December 31, 2017
Financial Highlights
U.S. Real Estate Portfolio
| | | Class I | |
| | | Year Ended December 31, | |
Selected Per Share Data and Ratios | | 2017 | | 2016(1) | | 2015 | | 2014 | | 2013 | |
Net Asset Value, Beginning of Period | | $ | 17.21 | | | $ | 17.86 | | | $ | 20.48 | | | $ | 16.55 | | | $ | 16.93 | | |
Income from Investment Operations: | |
Net Investment Income(2) | | | 0.37 | | | | 0.31 | | | | 0.32 | | | | 0.36 | | | | 0.27 | | |
Net Realized and Unrealized Gain | | | 0.16 | | | | 0.91 | | | | 0.10 | | | | 4.66 | | | | 0.14 | | |
Total from Investment Operations | | | 0.53 | | | | 1.22 | | | | 0.42 | | | | 5.02 | | | | 0.41 | | |
Distributions from and/or in Excess of: | |
Net Investment Income | | | (0.26 | ) | | | (0.38 | ) | | | (0.26 | ) | | | (0.35 | ) | | | (0.20 | ) | |
Net Realized Gain | | | (2.24 | ) | | | (1.49 | ) | | | (2.78 | ) | | | (0.74 | ) | | | (0.59 | ) | |
Total Distributions | | | (2.50 | ) | | | (1.87 | ) | | | (3.04 | ) | | | (1.09 | ) | | | (0.79 | ) | |
Net Asset Value, End of Period | | $ | 15.24 | | | $ | 17.21 | | | $ | 17.86 | | | $ | 20.48 | | | $ | 16.55 | | |
Total Return(3) | | | 3.31 | % | | | 6.79 | % | | | 2.27 | % | | | 30.74 | % | | | 2.45 | % | |
Ratios and Supplemental Data: | |
Net Assets, End of Period (Thousands) | | $ | 331,637 | | | $ | 494,967 | | | $ | 625,999 | | | $ | 948,311 | | | $ | 797,933 | | |
Ratio of Expenses to Average Net Assets(6) | | | 1.00 | %(4) | | | 1.00 | %(4) | | | 0.98 | %(4) | | | 0.95 | %(4) | | | 1.01 | %(4) | |
Ratio of Expenses to Average Net Assets Excluding Non Operating Expenses | | | 1.00 | %(4) | | | N/A | | | | 0.98 | %(4) | | | 0.94 | %(4) | | | 1.00 | %(4) | |
Ratio of Net Investment Income to Average Net Assets(6) | | | 2.19 | %(4) | | | 1.73 | %(4) | | | 1.61 | %(4) | | | 1.90 | %(4) | | | 1.51 | %(4) | |
Ratio of Rebate from Morgan Stanley Affiliates to Average Net Assets | | | 0.00 | %(5) | | | 0.00 | %(5) | | | 0.00 | %(5) | | | 0.00 | %(5) | | | 0.00 | %(5) | |
Portfolio Turnover Rate | | | 43 | % | | | 24 | % | | | 24 | % | | | 25 | % | | | 24 | % | |
(6) Supplemental Information on the Ratios to Average Net Assets: | |
Ratios Before Expense Limitation: | |
Expenses to Average Net Assets | | | 1.02 | % | | | 1.02 | % | | | N/A | | | | N/A | | | | 1.03 | % | |
Net Investment Income to Average Net Assets | | | 2.17 | % | | | 1.71 | % | | | N/A | | | | N/A | | | | 1.49 | % | |
(1) Reflects prior period custodian out-of-pocket expenses that were reimbursed in September 2016. The amount of the reimbursement was immaterial on a per share basis and did not impact the total return of Class I shares. The Ratio of Expenses to Average Net Assets and the Ratio of Net Investment Income to Average Net Assets would be unchanged as the reimbursement of custodian fees was offset against expense waivers/reimbursements with no impact to net expenses or net investment income.
(2) Per share amount is based on average shares outstanding.
(3) Calculated based on the net asset value as of the last business day of the period.
(4) The Ratios of Expenses and Net Investment Income reflect the rebate of certain Fund expenses in connection with the investments in Morgan Stanley affiliates during the period. The effect of the rebate on the ratios is disclosed in the above table as "Ratio of Rebate from Morgan Stanley Affiliates to Average Net Assets."
(5) Amount is less than 0.005%.
The accompanying notes are an integral part of the financial statements.
14
Morgan Stanley Institutional Fund, Inc.
Annual Report — December 31, 2017
Financial Highlights
U.S. Real Estate Portfolio
| | | Class A | |
| | | Year Ended December 31, | |
Selected Per Share Data and Ratios | | 2017 | | 2016(1) | | 2015 | | 2014 | | 2013 | |
Net Asset Value, Beginning of Period | | $ | 16.74 | | | $ | 17.42 | | | $ | 20.04 | | | $ | 16.21 | | | $ | 16.60 | | |
Income from Investment Operations: | |
Net Investment Income(2) | | | 0.31 | | | | 0.24 | | | | 0.28 | | | | 0.29 | | | | 0.23 | | |
Net Realized and Unrealized Gain | | | 0.15 | | | | 0.89 | | | | 0.08 | | | | 4.56 | | | | 0.12 | | |
Total from Investment Operations | | | 0.46 | | | | 1.13 | | | | 0.42 | | | | 4.85 | | | | 0.35 | | |
Distributions from and/or in Excess of: | |
Net Investment Income | | | (0.20 | ) | | | (0.32 | ) | | | (0.20 | ) | | | (0.28 | ) | | | (0.15 | ) | |
Net Realized Gain | | | (2.24 | ) | | | (1.49 | ) | | | (2.78 | ) | | | (0.74 | ) | | | (0.59 | ) | |
Total Distributions | | | (2.44 | ) | | | (1.81 | ) | | | (2.98 | ) | | | (1.02 | ) | | | (0.74 | ) | |
Net Asset Value, End of Period | | $ | 14.76 | | | $ | 16.74 | | | $ | 17.42 | | | $ | 20.04 | | | $ | 16.21 | | |
Total Return(3) | | | 2.98 | % | | | 6.47 | % | | | 2.01 | % | | | 30.28 | % | | | 2.14 | % | |
Ratios and Supplemental Data: | |
Net Assets, End of Period (Thousands) | | $ | 55,640 | | | $ | 76,082 | | | $ | 87,462 | | | $ | 107,441 | | | $ | 101,325 | | |
Ratio of Expenses to Average Net Assets(7) | | | 1.34 | %(4) | | | 1.29 | %(4) | | | 1.28 | %(4) | | | 1.31 | %(4) | | | 1.28 | %(4)(5) | |
Ratio of Expenses to Average Net Assets Excluding Non Operating Expenses | | | 1.34 | %(4) | | | N/A | | | | 1.28 | %(4) | | | 1.30 | %(4) | | | 1.27 | %(4)(5) | |
Ratio of Net Investment Income to Average Net Assets(7) | | | 1.87 | %(4) | | | 1.37 | %(4) | | | 1.43 | %(4) | | | 1.54 | %(4) | | | 1.35 | %(4) | |
Ratio of Rebate from Morgan Stanley Affiliates to Average Net Assets | | | 0.00 | %(6) | | | 0.00 | %(6) | | | 0.00 | %(6) | | | 0.00 | %(6) | | | 0.00 | %(6) | |
Portfolio Turnover Rate | | | 43 | % | | | 24 | % | | | 24 | % | | | 25 | % | | | 24 | % | |
(7) Supplemental Information on the Ratios to Average Net Assets: | |
Ratios Before Expense Limitation: | |
Expenses to Average Net Assets | | | N/A | | | | 1.30 | % | | | N/A | | | | N/A | | | | 1.29 | % | |
Net Investment Income to Average Net Assets | | | N/A | | | | 1.36 | % | | | N/A | | | | N/A | | | | 1.34 | % | |
(1) Reflects prior period custodian out-of-pocket expenses that were reimbursed in September 2016. The amount of the reimbursement was immaterial on a per share basis and did not impact the total return of Class A shares. The Ratio of Expenses to Average Net Assets would have been less than 0.005% higher and the Ratio of Net Investment Income to Average Net Assets would have been less than 0.005% lower had the custodian not reimbursed the Fund.
(2) Per share amount is based on average shares outstanding.
(3) Calculated based on the net asset value which does not reflect sales charges, if applicable, as of the last business day of the period.
(4) The Ratios of Expenses and Net Investment Income reflect the rebate of certain Fund expenses in connection with the investments in Morgan Stanley affiliates during the period. The effect of the rebate on the ratios is disclosed in the above table as "Ratio of Rebate from Morgan Stanley Affiliates to Average Net Assets."
(5) Effective September 16, 2013, the Adviser has agreed to limit the ratio of expenses to average net assets to the maximum ratio of 1.35% for Class A shares. Prior to September 16, 2013, the maximum ratio was 1.25% for Class A shares.
(6) Amount is less than 0.005%.
The accompanying notes are an integral part of the financial statements.
15
Morgan Stanley Institutional Fund, Inc.
Annual Report — December 31, 2017
Financial Highlights
U.S. Real Estate Portfolio
| | | Class L | |
| | | Year Ended December 31, | |
Selected Per Share Data and Ratios | | 2017 | | 2016(1) | | 2015 | | 2014 | | 2013 | |
Net Asset Value, Beginning of Period | | $ | 16.73 | | | $ | 17.41 | | | $ | 20.03 | | | $ | 16.20 | | | $ | 16.59 | | |
Income from Investment Operations: | |
Net Investment Income(2) | | | 0.22 | | | | 0.15 | | | | 0.21 | | | | 0.20 | | | | 0.13 | | |
Net Realized and Unrealized Gain | | | 0.15 | | | | 0.89 | | | | 0.04 | | | | 4.56 | | | | 0.13 | | |
Total from Investment Operations | | | 0.37 | | | | 1.04 | | | | 0.25 | | | | 4.76 | | | | 0.26 | | |
Distributions from and/or in Excess of: | |
Net Investment Income | | | (0.12 | ) | | | (0.23 | ) | | | (0.09 | ) | | | (0.19 | ) | | | (0.06 | ) | |
Net Realized Gain | | | (2.24 | ) | | | (1.49 | ) | | | (2.78 | ) | | | (0.74 | ) | | | (0.59 | ) | |
Total Distributions | | | (2.36 | ) | | | (1.72 | ) | | | (2.87 | ) | | | (0.93 | ) | | | (0.65 | ) | |
Net Asset Value, End of Period | | $ | 14.74 | | | $ | 16.73 | | | $ | 17.41 | | | $ | 20.03 | | | $ | 16.20 | | |
Total Return(3) | | | 2.37 | % | | | 5.91 | % | | | 1.44 | % | | | 29.68 | % | | | 1.62 | % | |
Ratios and Supplemental Data: | |
Net Assets, End of Period (Thousands) | | $ | 2,787 | | | $ | 3,471 | | | $ | 3,993 | | | $ | 4,919 | | | $ | 4,462 | | |
Ratio of Expenses to Average Net Assets(7) | | | 1.85 | %(4) | | | 1.84 | %(4) | | | 1.82 | %(4) | | | 1.79 | %(4) | | | 1.78 | %(4)(5) | |
Ratio of Expenses to Average Net Assets Excluding Non Operating Expenses | | | 1.85 | %(4) | | | N/A | | | | 1.81 | %(4) | | | 1.78 | %(4) | | | 1.77 | %(4)(5) | |
Ratio of Net Investment Income to Average Net Assets(7) | | | 1.37 | %(4) | | | 0.84 | %(4) | | | 1.08 | %(4) | | | 1.06 | %(4) | | | 0.73 | %(4) | |
Ratio of Rebate from Morgan Stanley Affiliates to Average Net Assets | | | 0.00 | %(6) | | | 0.00 | %(6) | | | 0.00 | %(6) | | | 0.00 | %(6) | | | 0.00 | %(6) | |
Portfolio Turnover Rate | | | 43 | % | | | 24 | % | | | 24 | % | | | 25 | % | | | 24 | % | |
(7) Supplemental Information on the Ratios to Average Net Assets: | |
Ratios Before Expense Limitation: | |
Expenses to Average Net Assets | | | 1.89 | % | | | 1.84 | % | | | N/A | | | | N/A | | | | 1.79 | % | |
Net Investment Income to Average Net Assets | | | 1.33 | % | | | 0.84 | % | | | N/A | | | | N/A | | | | 0.72 | % | |
(1) Reflects prior period custodian out-of-pocket expenses that were reimbursed in September 2016. The amount of the reimbursement was immaterial on a per share basis and did not impact the total return of Class L shares. The Ratio of Expenses to Average Net Assets would have been less than 0.005% higher and the Ratio of Net Investment Income to Average Net Assets would have been less than 0.005% lower had the custodian not reimbursed the Fund.
(2) Per share amount is based on average shares outstanding.
(3) Calculated based on the net asset value as of the last business day of the period.
(4) The Ratios of Expenses and Net Investment Income reflect the rebate of certain Fund expenses in connection with the investments in Morgan Stanley affiliates during the period. The effect of the rebate on the ratios is disclosed in the above table as "Ratio of Rebate from Morgan Stanley Affiliates to Average Net Assets."
(5) Effective September 16, 2013, the Adviser has agreed to limit the ratio of expenses to average net assets to the maximum ratio of 1.85% for Class L shares. Prior to September 16, 2013, the maximum ratio was 1.75% for Class L shares.
(6) Amount is less than 0.005%.
The accompanying notes are an integral part of the financial statements.
16
Morgan Stanley Institutional Fund, Inc.
Annual Report — December 31, 2017
Financial Highlights
U.S. Real Estate Portfolio
| | | Class C | |
| | | Year Ended December 31, | | Period from
April 30, 2015(2) to | |
Selected Per Share Data and Ratios | | 2017 | | 2016(1) | | December 31, 2015 | |
Net Asset Value, Beginning of Period | | $ | 16.67 | | | $ | 17.36 | | | $ | 19.73 | | |
Income from Investment Operations: | |
Net Investment Income(3) | | | 0.20 | | | | 0.13 | | | | 0.18 | | |
Net Realized and Unrealized Gain | | | 0.13 | | | | 0.87 | | | | 0.31 | | |
Total from Investment Operations | | | 0.33 | | | | 1.00 | | | | 0.49 | | |
Distributions from and/or in Excess of: | |
Net Investment Income | | | (0.08 | ) | | | (0.20 | ) | | | (0.08 | ) | |
Net Realized Gain | | | (2.24 | ) | | | (1.49 | ) | | | (2.78 | ) | |
Total Distributions | | | (2.32 | ) | | | (1.69 | ) | | | (2.86 | ) | |
Net Asset Value, End of Period | | $ | 14.68 | | | $ | 16.67 | | | $ | 17.36 | | |
Total Return(4) | | | 2.14 | % | | | 5.72 | % | | | 2.70 | %(7) | |
Ratios and Supplemental Data: | |
Net Assets, End of Period (Thousands) | | $ | 486 | | | $ | 427 | | | $ | 91 | | |
Ratio of Expenses to Average Net Assets(9) | | | 2.10 | %(5) | | | 2.10 | %(5) | | | 2.10 | %(5)(8) | |
Ratio of Expenses to Average Net Assets Excluding Non Operating Expenses | | | 2.10 | %(5) | | | N/A | | | | 2.10 | %(5)(8) | |
Ratio of Net Investment Income to Average Net Assets(9) | | | 1.21 | %(5) | | | 0.73 | %(5) | | | 1.44 | %(5)(8) | |
Ratio of Rebate from Morgan Stanley Affiliates to Average Net Assets | | | 0.00 | %(6) | | | 0.00 | %(6) | | | 0.00 | %(6)(8) | |
Portfolio Turnover Rate | | | 43 | % | | | 24 | % | | | 24 | % | |
(9) Supplemental Information on the Ratios to Average Net Assets: | |
Ratios Before Expense Limitation: | |
Expenses to Average Net Assets | | | 2.46 | % | | | 3.13 | % | | | 5.89 | %(8) | |
Net Investment Income (Loss) to Average Net Assets | | | 0.85 | % | | | (0.30 | )% | | | (2.35 | )%(8) | |
(1) Reflects prior period custodian out-of-pocket expenses that were reimbursed in September 2016. The amount of the reimbursement was immaterial on a per share basis and did not impact the total return of Class C shares. The Ratio of Expenses to Average Net Assets and the Ratio of Net Investment Income to Average Net Assets would be unchanged as the reimbursement of custodian fees was offset against expense waivers/reimbursements with no impact to net expenses or net investment income.
(2) Commencement of Offering.
(3) Per share amount is based on average shares outstanding.
(4) Calculated based on the net asset value which does not reflect sales charges, if applicable, as of the last business day of the period.
(5) The Ratios of Expenses and Net Investment Income reflect the rebate of certain Fund expenses in connection with the investments in Morgan Stanley affiliates during the period. The effect of the rebate on the ratios is disclosed in the above table as "Ratio of Rebate from Morgan Stanley Affiliates to Average Net Assets."
(6) Amount is less than 0.005%.
(7) Not annualized.
(8) Annualized.
The accompanying notes are an integral part of the financial statements.
17
Morgan Stanley Institutional Fund, Inc.
Annual Report — December 31, 2017
Financial Highlights
U.S. Real Estate Portfolio
| | | Class IS | |
| | | Year Ended December 31, | | Period from
September 13, 2013(2) to | |
Selected Per Share Data and Ratios | | 2017 | | 2016(1) | | 2015 | | 2014 | | December 31, 2013 | |
Net Asset Value, Beginning of Period | | $ | 17.22 | | | $ | 17.86 | | | $ | 20.48 | | | $ | 16.55 | | | $ | 17.13 | | |
Income from Investment Operations: | |
Net Investment Income(3) | | | 0.39 | | | | 0.33 | | | | 0.36 | | | | 0.38 | | | | 0.03 | | |
Net Realized and Unrealized Gain | | | 0.14 | | | | 0.92 | | | | 0.08 | | | | 4.65 | | | | 0.01 | | |
Total from Investment Operations | | | 0.53 | | | | 1.25 | | | | 0.44 | | | | 5.03 | | | | 0.04 | | |
Distributions from and/or in Excess of: | |
Net Investment Income | | | (0.27 | ) | | | (0.40 | ) | | | (0.28 | ) | | | (0.36 | ) | | | (0.11 | ) | |
Net Realized Gain | | | (2.24 | ) | | | (1.49 | ) | | | (2.78 | ) | | | (0.74 | ) | | | (0.51 | ) | |
Total Distributions | | | (2.51 | ) | | | (1.89 | ) | | | (3.06 | ) | | | (1.10 | ) | | | (0.62 | ) | |
Net Asset Value, End of Period | | $ | 15.24 | | | $ | 17.22 | | | $ | 17.86 | | | $ | 20.48 | | | $ | 16.55 | | |
Total Return(4) | | | 3.32 | % | | | 6.96 | % | | | 2.36 | % | | | 30.82 | % | | | 0.30 | %(8) | |
Ratios and Supplemental Data: | |
Net Assets, End of Period (Thousands) | | $ | 196,536 | | | $ | 195,490 | | | $ | 141,670 | | | $ | 12 | | | $ | 10 | | |
Ratio of Expenses to Average Net Assets(10) | | | 0.93 | %(5) | | | 0.89 | %(5) | | | 0.90 | %(5) | | | 0.89 | %(5) | | | 0.90 | %(5)(6)(9) | |
Ratio of Expenses to Average Net Assets Excluding Non
Operating Expenses | | | 0.93 | %(5) | | | N/A | | | | 0.90 | %(5) | | | 0.88 | %(5) | | | 0.89 | %(5)(6)(9) | |
Ratio of Net Investment Income to Average Net Assets(10) | | | 2.33 | %(5) | | | 1.79 | %(5) | | | 1.81 | %(5) | | | 1.96 | %(5) | | | 0.52 | %(5)(9) | |
Ratio of Rebate from Morgan Stanley Affiliates to Average Net Assets | | | 0.00 | %(7) | | | 0.00 | %(7) | | | 0.00 | %(7) | | | 0.00 | %(7) | | | N/A | | |
Portfolio Turnover Rate | | | 43 | % | | | 24 | % | | | 24 | % | | | 25 | % | | | 24 | % | |
(10) Supplemental Information on the Ratios to Average Net Assets: | |
Ratios Before Expense Limitation: | |
Expenses to Average Net Assets | | | N/A | | | | 0.90 | % | | | 0.90 | % | | | 20.21 | % | | | 6.19 | %(9) | |
Net Investment Income (Loss) to Average Net Assets | | | N/A | | | | 1.78 | % | | | 1.81 | % | | | (17.36 | )% | | | (4.77 | )%(9) | |
(1) Reflects prior period custodian out-of-pocket expenses that were reimbursed in September 2016. The amount of the reimbursement was immaterial on a per share basis and did not impact the total return of Class IS shares. The Ratio of Expenses to Average Net Assets would have been less than 0.005% higher and the Ratio of Net Investment Income to Average Net Assets would have been less than 0.005% lower had the custodian not reimbursed the Fund.
(2) Commencement of Offering.
(3) Per share amount is based on average shares outstanding.
(4) Calculated based on the net asset value as of the last business day of the period.
(5) The Ratios of Expenses and Net Investment Income reflect the rebate of certain Fund expenses in connection with the investments in Morgan Stanley affiliates during the period. The effect of the rebate on the ratios is disclosed in the above table as "Ratio of Rebate from Morgan Stanley Affiliates to Average Net Assets."
(6) Effective September 16, 2013, the Adviser has agreed to limit the ratio of expenses to average net assets to the maximum ratio of 0.93% for Class IS shares.
(7) Amount is less than 0.005%.
(8) Not annualized.
(9) Annualized.
The accompanying notes are an integral part of the financial statements.
18
Morgan Stanley Institutional Fund, Inc.
Annual Report — December 31, 2017
Notes to Financial Statements
Morgan Stanley Institutional Fund, Inc. (the "Company") is registered under the Investment Company Act of 1940, as amended (the "Act"), as an open-end management investment company. The Company is comprised of twenty-nine separate, active, diversified and non-diversified funds (individually referred to as a "Fund", collectively as the "Funds"). The Company applies investment company accounting and reporting guidance.
The accompanying financial statements relate to the U.S. Real Estate Portfolio. The Fund seeks to provide above average current income and long-term capital appreciation by investing primarily in equity securities of companies in the U.S. real estate industry, including real estate investment trusts ("REITs"). The Fund has capital subscription commitments to certain investee companies for this same purpose, the details of which are disclosed in the Unfunded Commitments note.
The Fund offers five classes of shares — Class I, Class A, Class L, Class C and Class IS. On April 30, 2015, the Fund suspended offering of Class L shares. Existing Class L shareholders may invest through reinvestment of dividends and distributions.
A. Significant Accounting Policies: The following significant accounting policies are in conformity with U.S. generally accepted accounting principles ("GAAP"). Such policies are consistently followed by the Company in the preparation of its financial statements. GAAP may require management to make estimates and assumptions that affect the reported amounts and disclosures in the financial statements. Actual results may differ from those estimates.
1. Security Valuation: (1) An equity portfolio security listed or traded on an exchange is valued at its latest reported sales price (or at the exchange official closing price if such exchange reports an official closing price), and if there were no sales on a given day and if there is no official exchange closing price for that day, the security is valued at the mean between the last reported bid and asked prices if such bid and asked prices are available on the relevant exchanges. Listed equity securities not traded on the valuation date with no reported bid and asked prices available on the exchange are valued at the mean between the current bid and asked prices obtained from one or more reputable brokers or dealers. In cases where a security is traded on more than one exchange, the security is valued on the exchange designated as the primary market; (2) all other equity portfolio securities for which
over-the-counter ("OTC") market quotations are readily available are valued at the latest reported sales price (or at the market official closing price if such market reports an official closing price), and if there was no trading in the security on a given day and if there is no official closing price from relevant markets for that day, the security is valued at the mean between the last reported bid and asked prices if such bid and asked prices are available on the relevant markets. An unlisted equity security that does not trade on the valuation date and for which bid and asked prices from the relevant markets are unavailable is valued at the mean between the current bid and asked prices obtained from one or more reputable brokers or dealers; (3) certain portfolio securities may be valued by an outside pricing service/vendor approved by the Company's Board of Directors (the "Directors"). The pricing service/vendor may employ a pricing model that takes into account, among other things, bids, yield spreads, and/or other market data and specific security characteristics. Alternatively, if a valuation is not available from an outside pricing service/vendor, and the security trades on an exchange, the security may be valued at its latest reported sale price (or at the exchange official closing price if such exchange reports an official closing price), prior to the time when assets are valued. If there are no sales on a given day and if there is no official exchange closing price for that day, the security is valued at the mean between the last reported bid and asked prices if such bid and asked prices are available in the relevant exchanges; (4) when market quotations are not readily available, including circumstances under which Morgan Stanley Investment Management Inc. (the "Adviser") determines that the closing price, last sale price or the mean between the last reported bid and asked prices are not reflective of a security's market value, portfolio securities are valued at their fair value as determined in good faith under procedures established by and under the general supervision of the Directors. Occasionally, developments affecting the closing prices of securities and other assets may occur between the times at which valuations of such securities are determined (that is, close of the foreign market on which the securities trade) and the close of business of the New York Stock Exchange ("NYSE"). If developments occur during such periods that are expected to materially affect the value of such securities, such valuations may be adjusted to reflect the estimated fair value of such securities as of the close of the NYSE, as determined in good faith by the Directors or
19
Morgan Stanley Institutional Fund, Inc.
Annual Report — December 31, 2017
Notes to Financial Statements (cont'd)
by the Adviser using a pricing service and/or procedures approved by the Directors; (5) quotations of foreign portfolio securities, other assets and liabilities and forward contracts stated in foreign currency are translated into U.S. dollar equivalents at the prevailing market rates prior to the close of the NYSE; and (6) investments in mutual funds, including the Morgan Stanley Institutional Liquidity Funds, are valued at the net asset value ("NAV") as of the close of each business day.
The Directors have responsibility for determining in good faith the fair value of the investments, and the Directors may appoint others, such as the Company's Adviser or a valuation committee, to assist the Directors in determining fair value and to make the actual calculations pursuant to the fair valuation methodologies previously approved by the Directors. Under procedures approved by the Directors, the Company's Adviser has formed a Valuation Committee whose members are approved by the Directors. The Valuation Committee provides administration and oversight of the Company's valuation policies and procedures, which are reviewed at least annually by the Directors. These procedures allow the Company to utilize independent pricing services, quotations from securities and financial instrument dealers, and other market sources to determine fair value.
The Company has procedures to determine the fair value of securities and other financial instruments for which market prices are not readily available. Under these procedures, the Valuation Committee convenes on a regular and ad hoc basis to review such securities and considers a number of factors, including valuation methodologies and significant unobservable valuation inputs, when arriving at fair value. The Valuation Committee may employ a market-based approach which may use related or comparable assets or liabilities, recent transactions, market multiples, book values, and other relevant information for the investment to determine the fair value of the investment. An income-based valuation approach may also be used in which the anticipated future cash flows of the investment are discounted to calculate fair value. Discounts may also be applied due to the nature or duration of any restrictions on the disposition of the investments. Due to the inherent uncertainty of valuations of such investments, the fair values may differ significantly from the values that would have been used had an active market existed. The Valuation
Committee employs various methods for calibrating these valuation approaches including a regular review of valuation methodologies, key inputs and assumptions, transactional back-testing or disposition analysis, and reviews of any related market activity.
The Fund invests a significant portion of its assets in securities of REITs. The market's perception of prospective declines in private real estate values and other financial assets may result in increased volatility of market prices that can negatively impact the valuation of certain issuers held by the Fund.
2. Fair Value Measurement: Financial Accounting Standards Board ("FASB") Accounting Standards CodificationTM ("ASC") 820, "Fair Value Measurement" ("ASC 820"), defines fair value as the value that the Fund would receive to sell an investment or pay to transfer a liability in a timely transaction with an independent buyer in the principal market, or in the absence of a principal market, the most advantageous market for the investment or liability. ASC 820 establishes a three-tier hierarchy to distinguish between (1) inputs that reflect the assumptions market participants would use in valuing an asset or liability developed based on market data obtained from sources independent of the reporting entity (observable inputs) and (2) inputs that reflect the reporting entity's own assumptions about the assumptions market participants would use in valuing an asset or liability developed based on the best information available in the circumstances (unobservable inputs) and to establish classification of fair value measurements for disclosure purposes. Various inputs are used in determining the value of the Fund's investments. The inputs are summarized in the three broad levels listed below.
• Level 1 – unadjusted quoted prices in active markets for identical investments
• Level 2 – other significant observable inputs (including quoted prices for similar investments, interest rates, prepayment speeds, credit risk, etc.)
• Level 3 – significant unobservable inputs including the Fund's own assumptions in determining the fair value of investments. Factors considered in making this determination may include, but are not limited to, information obtained by contacting the
20
Morgan Stanley Institutional Fund, Inc.
Annual Report — December 31, 2017
Notes to Financial Statements (cont'd)
issuer, analysts, or the appropriate stock exchange (for exchange-traded securities), analysis of the issuer's financial statements or other available documents and, if necessary, available information concerning other securities in similar circumstances
The inputs or methodology used for valuing securities are not necessarily an indication of the risk associated with investing in those securities and the determination of the significance of a particular input to the fair value measurement in its entirety requires judgment and considers factors specific to each security.
The following is a summary of the inputs used to value the Fund's investments as of December 31, 2017.
Investment Type | | Level 1
Unadjusted
quoted
prices
(000) | | Level 2
Other
significant
observable
inputs
(000) | | Level 3
Significant
unobservable
inputs
(000) | | Total
(000) | |
Assets: | |
Common Stocks | |
Apartments | | $ | 66,767 | | | $ | — | | | $ | — | | | $ | 66,767 | | |
Commercial Financing | | | 5,523 | | | | — | | | | — | | | | 5,523 | | |
Data Centers | | | 19,392 | | | | — | | | | — | | | | 19,392 | | |
Diversified | | | 56,536 | | | | — | | | | — | | | | 56,536 | | |
Free Standing | | | 4,656 | | | | — | | | | — | | | | 4,656 | | |
Health Care | | | 41,796 | | | | — | | | | — | | | | 41,796 | | |
Industrial | | | 31,956 | | | | — | | | | 885 | | | | 32,841 | | |
Lodging/Resorts | | | 32,175 | | | | — | | | | — | | | | 32,175 | | |
Manufactured Homes | | | 629 | | | | — | | | | — | | | | 629 | | |
Office | | | 116,057 | | | | — | | | | 761 | | | | 116,818 | | |
Regional Malls | | | 119,596 | | | | — | | | | — | | | | 119,596 | | |
Self Storage | | | 43,143 | | | | — | | | | — | | | | 43,143 | | |
Shopping Centers | | | 26,276 | | | | — | | | | — | | | | 26,276 | | |
Single Family Homes | | | 11,174 | | | | — | | | | — | | | | 11,174 | | |
Specialty | | | 5,792 | | | | — | | | | — | | | | 5,792 | | |
Total Common Stocks | | | 581,468 | | | | — | | | | 1,646 | | | | 583,114 | | |
Short-Term Investment | |
Investment Company | | | 1,942 | | | | — | | | | — | | | | 1,942 | | |
Total Assets | | $ | 583,410 | | | $ | — | | | $ | 1,646 | | | $ | 585,056 | | |
Transfers between investment levels may occur as the markets fluctuate and/or the availability of data used in an investment's valuation changes. The Fund recognizes transfers between the levels as of the end of the period. As of December 31, 2017, the Fund did not have any investments transfer between investment levels.
Following is a reconciliation of investments in which significant unobservable inputs (Level 3) were used in determining fair value.
| | | Common
Stocks
(000) | |
Beginning Balance | | $ | 14,538 | | |
Purchases | | | — | | |
Sales | | | (7,816 | ) | |
Amortization of discount | | | — | | |
Transfers in | | | — | | |
Transfers out | | | — | | |
Corporate actions | | | (3,273 | ) | |
Change in unrealized appreciation (depreciation) | | | (2,753 | ) | |
Realized gains (losses) | | | 950 | | |
Ending Balance | | $ | 1,646 | | |
Net change in unrealized appreciation from investments still held
as of December 31, 2017 | | $ | (1,128 | ) | |
The following table presents additional information about valuation techniques and inputs used for investments that are measured at fair value and categorized within Level 3 as of December 31, 2017.
| | | Fair Value at
December 31,
2017
(000) | | Valuation
Technique | | Unobservable
Input | |
Industrial | |
Common
Stock
| | $ | 885
| | | Reported Capital Balance,
Adjusted for Subsequent
Capital Calls, Return of
Capital and Significant
Market Changes
between last Capital
Statement and
Valuation Date | | Adjusted Capital
Balance
| |
Office | |
Common
Stock
| | $ | 761
| | | Reported Capital Balance,
Adjusted for Subsequent
Capital Calls, Return of
Capital and Significant
Market Changes
between last Capital
Statement and
Valuation Date | | Adjusted Capital
Balance
| |
21
Morgan Stanley Institutional Fund, Inc.
Annual Report — December 31, 2017
Notes to Financial Statements (cont'd)
3. Foreign Currency Translation and Foreign Investments: The books and records of the Fund are maintained in U.S. dollars. Foreign currency amounts are translated into U.S. dollars as follows:
– investments, other assets and liabilities at the prevailing rate of exchange on the valuation date;
– investment transactions and investment income at the prevailing rates of exchange on the dates of such transactions.
Although the net assets of the Fund are presented at the foreign exchange rates and market values at the close of the period, the Fund does not isolate that portion of the results of operations arising as a result of changes in the foreign exchange rates from the fluctuations arising from changes in the market prices of securities held at period end. Similarly, the Fund does not isolate the effect of changes in foreign exchange rates from the fluctuations arising from changes in the market prices of securities sold during the period. Accordingly, realized and unrealized foreign currency gains (losses) on investments in securities are included in the reported net realized and unrealized gains (losses) on investment transactions and balances. However, pursuant to U.S. federal income tax regulations, gains and losses from certain foreign currency transactions and the foreign currency portion of gains and losses realized on sales and maturities of foreign denominated debt securities are treated as ordinary income for U.S. federal income tax purposes.
Net realized gains (losses) on foreign currency transactions represent net foreign exchange gains (losses) from foreign currency forward exchange contracts, disposition of foreign currencies, currency gains (losses) realized between the trade and settlement dates on securities transactions, and the difference between the amount of investment income and foreign withholding taxes recorded on the Fund's books and the U.S. dollar equivalent amounts actually received or paid. Net unrealized currency gains (losses) from valuing foreign currency denominated assets and liabilities at period end exchange rates are reflected as a component of unrealized appreciation (depreciation) in the Statement of
Assets and Liabilities. The change in unrealized currency gains (losses) on foreign currency translations for the period is reflected in the Statement of Operations.
Foreign security and currency transactions may involve certain considerations and risks not typically associated with those of U.S. dollar denominated transactions as a result of, among other factors, fluctuations of exchange rates in relation to the U.S. dollar, the possibility of lower levels of governmental supervision and regulation of foreign securities markets and the possibility of political or economic instability.
Governmental approval for foreign investments may be required in advance of making an investment under certain circumstances in some countries, and the extent of foreign investments in domestic companies may be subject to limitation in other countries. Foreign ownership limitations also may be imposed by the charters of individual companies to prevent, among other concerns, violations of foreign investment limitations. As a result, an additional class of shares (identified as "Foreign" in the Portfolio of Investments) may be created and offered for investment. The "local" and "foreign shares" market values may differ. In the absence of trading of the foreign shares in such markets, the Fund values the foreign shares at the closing exchange price of the local shares.
4. Unfunded Commitments: Subject to the terms of a Subscription Agreement between the Fund and BRCP REIT II, LP, the Fund has made a subscription commitment of $9,000,000 for which it will receive 9,000,000 shares of common stock. As of December 31, 2017, BRCP REIT II, LP has drawn down approximately $8,364,000 which represents 92.9% of the commitment.
Subject to the terms of a Subscription Agreement between the Fund and Exeter Industrial Value Fund, LP, the Fund has made a subscription commitment of $8,500,000 for which it will receive 8,500,000 shares of common stock. As of December 31, 2017, Exeter Industrial Value Fund, LP has drawn down approximately $7,905,000 which represents 93.0% of the commitment.
22
Morgan Stanley Institutional Fund, Inc.
Annual Report — December 31, 2017
Notes to Financial Statements (cont'd)
5. Restricted Securities: The Fund invests in unregistered or otherwise restricted securities. The term "restricted securities" refers to securities that are unregistered or are held by control persons of the issuer and securities that are subject to contractual restrictions on their resale. As a result, restricted securities may be more difficult to value and the Fund may have difficulty disposing of such assets either in a timely manner or for a reasonable price. In order to dispose of an unregistered security, the Fund, where it has contractual rights to do so, may have to cause such security to be registered. A considerable period may elapse between the time the decision is made to sell the security and the time the security is registered so that the Fund can sell it. Contractual restrictions on the resale of securities vary in length and scope and are generally the result of a negotiation between the issuer and the acquirer of the securities. The Fund would, in either case, bear market risks during that period. Restricted securities are identified in the Portfolio of Investments.
6. Indemnifications: The Company enters into contracts that contain a variety of indemnifications. The Company's maximum exposure under these arrangements is unknown. However, the Company has not had prior claims or losses pursuant to these contracts and expects the risk of loss to be remote.
7. Dividends and Distributions to Shareholders: Dividends and distributions to shareholders are recorded on the ex-dividend date. Dividends from net investment income, if any, are declared and paid quarterly. Net realized capital gains, if any, are distributed at least annually.
8. Security Transactions, Income and Expenses: Security transactions are accounted for on the trade date (date the order to buy or sell is executed). Realized gains and losses on the sale of investment securities are determined on the specific identified cost method. Dividend income and other distributions are recorded on the ex-dividend date (except for certain foreign dividends which may be recorded as soon as the Fund is informed of such dividends) net of applicable withholding taxes. Interest income is recognized on the accrual basis except where collection is in doubt. Discounts are accreted and premiums are amortized over the life of the respective securities. Most expenses of the Company can be directly attributed to a particular Fund. Expenses which cannot be directly
attributed are apportioned among the Funds based upon relative net assets or other appropriate methods. Income, expenses (other than class specific expenses — distribution and shareholder services, transfer agency and sub transfer agency fees) and realized and unrealized gains or losses are allocated to each class of shares based upon their relative net assets.
The Fund owns shares of REITs which report information on the source of their distributions annually in the following calendar year. A portion of distributions received from REITs during the year is estimated to be a return of capital and is recorded as a reduction of their cost.
B. Advisory Fees: The Adviser, a wholly-owned subsidiary of Morgan Stanley, provides the Fund with advisory services under the terms of an Investment Advisory Agreement, paid quarterly, at the annual rate based on the daily net assets as follows:
First $500
million | | Next $500
million | | Over $1
billion | |
| | 0.80 | % | | | 0.75 | % | | | 0.70 | % | |
For the year ended December 31, 2017, the advisory fee rate (net of rebate) was equivalent to an annual effective rate of 0.79% of the Fund's average daily net assets.
The Adviser has agreed to reduce its advisory fee and/or reimburse the Fund so that total annual portfolio operating expenses, excluding certain investment related expenses, taxes, interest and other extraordinary expenses (including litigation), will not exceed 1.00% for Class I shares, 1.35% for Class A shares, 1.85% for Class L shares, 2.10% for Class C shares and 0.93% for Class IS shares. The fee waivers and/or expense reimbursements will continue for at least one year from the date of the Fund's prospectus or until such time as the Directors act to discontinue all or a portion of such waivers and/or reimbursements when they deem such action is appropriate. For the year ended December 31, 2017, approximately $66,000 of other expenses were reimbursed by the Adviser pursuant to this arrangement.
C. Administration Fees: The Adviser also serves as Administrator to the Company and provides administrative services pursuant to an Administration Agreement for an annual fee, accrued daily and paid monthly, of 0.08% of the Fund's average daily net assets.
23
Morgan Stanley Institutional Fund, Inc.
Annual Report — December 31, 2017
Notes to Financial Statements (cont'd)
Under a Sub-Administration Agreement between the Administrator and State Street Bank and Trust Company ("State Street"), State Street provides certain administrative services to the Company. For such services, the Administrator pays State Street a portion of the fee the Administrator receives from the Fund.
D. Distribution and Shareholder Services Fees: Morgan Stanley Distribution, Inc. ("MSDI" or the "Distributor"), a wholly-owned subsidiary of the Adviser and an indirect subsidiary of Morgan Stanley, serves as the Company's Distributor of Fund shares pursuant to a Distribution Agreement. The Company has adopted a Shareholder Services Plan with respect to Class A shares pursuant to Rule 12b-1 under the Act. Under the Shareholder Services Plan, the Fund pays the Distributor a shareholder services fee, accrued daily and paid monthly, at an annual rate of 0.25% of the Fund's average daily net assets attributable to Class A shares.
The Company has adopted a Distribution and Shareholder Services Plan with respect to Class L shares pursuant to Rule 12b-1 under the Act. Under the Distribution and Shareholder Services Plan, the Fund pays the Distributor a distribution fee, accrued daily and paid monthly, at an annual rate of 0.50% and a shareholder services fee, accrued daily and paid monthly, at an annual rate of 0.25% of the Fund's average daily net assets attributable to Class L shares.
The Company has adopted a Distribution and Shareholder Services Plan with respect to Class C shares pursuant to Rule 12b-1 under the Act. Under the Distribution and Shareholder Services Plan, the Fund pays the Distributor a distribution fee, accrued daily and paid monthly, at an annual rate of 0.75% and a shareholder services fee, accrued daily and paid monthly, at an annual rate of 0.25% of the Fund's average daily net assets attributable to Class C shares.
The distribution and shareholder services fees are used to support the expenses associated with servicing and maintaining accounts. The Distributor may compensate other parties for providing shareholder support services to investors who purchase Class A, Class L and Class C shares.
E. Dividend Disbursing and Transfer Agent: The Company's dividend disbursing and transfer agent is Boston Financial Data Services, Inc. ("BFDS"). Pursuant to a Transfer Agency Agreement, the Company pays BFDS a fee based on the number of classes, accounts and transactions relating to the
Funds of the Company. Effective January 1, 2018, BFDS changed its name to DST Asset Manager Solutions, Inc.
F. Custodian Fees: State Street (the "Custodian") also serves as Custodian for the Company in accordance with a Custodian Agreement. The Custodian holds cash, securities, and other assets of the Company as required by the Act. Custody fees are payable monthly based on assets held in custody, investment purchases and sales activity and account maintenance fees, plus reimbursement for certain out-of-pocket expenses.
G. Security Transactions and Transactions with Affiliates: For the year ended December 31, 2017, purchases and sales of investment securities for the Fund, other than long-term U.S. Government securities and short-term investments, were approximately $291,552,000 and $464,796,000, respectively. There were no purchases and sales of long-term U.S. Government securities for the year ended December 31, 2017.
The Fund invests in the Institutional Class of the Morgan Stanley Institutional Liquidity Funds — Treasury Portfolio (the "Liquidity Funds"), an open-end management investment company managed by the Adviser. Advisory fees paid by the Fund are reduced by an amount equal to its pro-rata share of the advisory and administration fees paid by the Fund due to its investment in the Liquidity Funds. For the year ended December 31, 2017, advisory fees paid were reduced by approximately $9,000 relating to the Fund's investment in the Liquidity Funds.
A summary of the Fund's transactions in shares of the Liquidity Funds during the year ended December 31, 2017 is as follows:
Affiliated
Investment
Company | | Value
December 31,
2016
(000) | | Purchases
at Cost
(000) | | Proceeds
from Sales
(000) | | Dividend
Income
(000) | |
Liquidity Funds | | $ | 5,194 | | | $ | 158,109 | | | $ | 161,361 | | | $ | 32 | | |
Affiliated
Investment
Company (cont'd) | | Realized
Gain
(Loss)
(000) | | Change in
Unrealized
Appreciation
(Depreciation)
(000) | | Value
December 31,
2017
(000) | |
Liquidity Funds | | $ | — | | | $ | — | | | $ | 1,942 | | |
The Fund is permitted to purchase and sell securities ("cross-trade") from and to other Morgan Stanley Funds as well as other funds and client accounts for which the Adviser or an affiliate of the Adviser serves as investment adviser, pursuant to procedures approved by the Directors in compliance with Rule 17a-7 under the Act (the "Rule"). Each cross-trade is executed at the current market price in compliance with
24
Morgan Stanley Institutional Fund, Inc.
Annual Report — December 31, 2017
Notes to Financial Statements (cont'd)
provisions of the Rule. For the year ended December 31, 2017, the Fund did not engage in any cross-trade transactions.
The Fund has an unfunded Deferred Compensation Plan (the "Compensation Plan"), which allows each independent Director to defer payment of all, or a portion, of the fees he or she receives for serving on the Board of Directors. Each eligible Director generally may elect to have the deferred amounts credited with a return equal to the total return on one or more of the Morgan Stanley funds that are offered as investment options under the Compensation Plan. Appreciation/depreciation and distributions received from these investments are recorded with an offsetting increase/decrease in the deferred compensation obligation and do not affect the NAV of the Fund.
H. Federal Income Taxes: It is the Fund's intention to continue to qualify as a regulated investment company and distribute all of its taxable and tax-exempt income. Accordingly, no provision for federal income taxes is required in the financial statements.
The Fund may be subject to taxes imposed by countries in which it invests. Such taxes are generally based on income and/or capital gains earned or repatriated. Taxes are accrued based on net investment income, net realized gains and net unrealized appreciation as such income and/or gains are earned. Taxes may also be based on transactions in foreign currency and are accrued based on the value of investments denominated in such currency.
FASB ASC 740-10, "Income Taxes — Overall", sets forth a minimum threshold for financial statement recognition of the benefit of a tax position taken or expected to be taken in a tax return. Management has concluded that there are no significant uncertain tax positions that would require recognition in the financial statements. If applicable, the Fund recognizes interest accrued related to unrecognized tax benefits in "Interest Expense" and penalties in "Other Expenses" in the Statement of Operations. The Fund files tax returns with the U.S. Internal Revenue Service, New York and various states. Generally, each of the tax years in the four-year period ended December 31, 2017, remains subject to examination by taxing authorities.
The tax character of distributions paid may differ from the character of distributions shown in the Statements of Changes in Net Assets due to short-term capital gains being treated as
ordinary income for tax purposes. The tax character of distributions paid during fiscal years 2017 and 2016 was as follows:
2017
Distributions
Paid From: | | 2016
Distributions
Paid From: | |
Ordinary
Income
(000) | | Long-Term
Capital Gain
(000) | | Ordinary
Income
(000) | | Long-Term
Capital Gain
(000) | |
| $ | 10,843 | | | $ | 78,064 | | | $ | 21,077 | | | $ | 59,246 | | |
The amount and character of income and gains to be distributed are determined in accordance with income tax regulations which may differ from GAAP. These book/tax differences are either considered temporary or permanent in nature.
Temporary differences are primarily due to differing book and tax treatments for the timing of the recognition of gains (losses) on certain investment transactions and the timing of the deductibility of certain expenses.
Permanent differences, primarily due to basis adjustments on partnerships and differing treatments of gains (losses) related to REIT adjustments, resulted in the following reclassifications among the components of net assets at December 31, 2017:
Accumulated
Undistributed
Net Investment
Income
(000) | | Accumulated
Net Realized
Gain
(000) | | Paid-in-
Capital
(000) | |
| $ | (1,182 | ) | | $ | 1,183 | | | $ | (1 | ) | |
At December 31, 2017, the components of distributable earnings for the Fund on a tax basis were as follows:
Undistributed
Ordinary
Income
(000) | | Undistributed
Long-Term
Capital Gain
(000) | |
| $ | 4,332 | | | $ | 17,970 | | |
I. Credit Facility: The Company and other Morgan Stanley funds participated in a $150,000,000 committed, unsecured revolving line of credit facility (the "Facility") with State Street. This Facility is to be used for temporary emergency purposes or funding of shareholder redemption requests. The interest rate on borrowings is based on the federal funds rate or 1 month LIBOR rate plus a spread. The Facility also has a commitment fee of 0.25% per annum based on the unused portion of the Facility. During the year ended December 31, 2017, the Fund did not have any borrowings under the Facility.
J. Other: At December 31, 2017, the Fund had record owners of 10% or greater. Investment activities of these shareholders could have a material impact on the Fund. The aggregate percentage of such owners was 36.5%.
25
Morgan Stanley Institutional Fund, Inc.
Annual Report — December 31, 2017
Report of Independent Registered Public Accounting Firm
To the Shareholders and Board of Directors of
Morgan Stanley Institutional Fund, Inc. —
U.S. Real Estate Portfolio
Opinion on the Financial Statements
We have audited the accompanying statement of assets and liabilities of U.S. Real Estate Portfolio (the "Fund") (one of the funds constituting the Morgan Stanley Institutional Fund, Inc. (the "Company")), including the portfolio of investments, as of December 31, 2017, and the related statement of operations for the year then ended, the statements of changes in net assets for each of the two years in the period then ended, the financial highlights for each of the five years in the period then ended and the related notes (collectively referred to as the "financial statements"). In our opinion, the financial statements present fairly, in all material respects, the financial position of U.S. Real Estate Portfolio (one of the funds constituting Morgan Stanley Institutional Fund, Inc.) at December 31, 2017, the results of its operations for the year then ended, the changes in its net assets for each of the two years in the period then ended and its financial highlights for each of the five years in the period then ended, in conformity with U.S. generally accepted accounting principles.
Basis for Opinion
These financial statements are the responsibility of the Company's management. Our responsibility is to express an opinion on the Fund's financial statements based on our audits. We are a public accounting firm registered with the Public Company Accounting Oversight Board (United States) ("PCAOB") and are required to be independent with respect to the Company in accordance with the U.S. federal securities law and the applicable rules and regulations of the Securities and Exchange Commission and the PCAOB.
We conducted our audits in accordance with the standards of the PCAOB. Those standards require that we plan and perform the audit to obtain reasonable assurance about whether the financial statements are free of material misstatement, whether due to error or fraud. The Company is not required to have, nor were we engaged to perform, an audit of the Company's internal control over financial reporting. As part of our audits, we are required to obtain an understanding of internal control over financial reporting, but not for the purpose of expressing an opinion on the effectiveness of the Company's internal control over financial reporting. Accordingly, we express no such opinion.
Our audits included performing procedures to assess the risks of material misstatement of the financial statements, whether due to error or fraud, and performing procedures that respond to those risks. Such procedures included examining, on a test basis, evidence regarding the amounts and disclosures in the financial statements. Our procedures included confirmation of securities owned as of December 31, 2017 by correspondence with the custodian and others or by other appropriate auditing procedures where replies from others were not received. Our audits also included evaluating the accounting principles used and significant estimates made by management, as well as evaluating the overall presentation of the financial statements. We believe that our audits provide a reasonable basis for our opinion.

We have served as the auditor of one or more Morgan Stanley investment companies since 2000.
Boston, Massachusetts
February 26, 2018
26
Morgan Stanley Institutional Fund, Inc.
Annual Report — December 31, 2017
Federal Tax Notice (unaudited)
For federal income tax purposes, the following information is furnished with respect to the distributions paid by the Fund during its taxable year ended December 31, 2017. For corporate shareholders, 0.5% of the dividends qualified for the dividends received deduction.
The Fund designated and paid approximately $78,064,000 as a long-term capital gain distribution.
For federal income tax purposes, the following information is furnished with respect to the Fund's earnings for its taxable year ended December 31, 2017. When distributed, certain earnings may be subject to a maximum tax rate of 15% as provided for by the Jobs and Growth Tax Relief Reconciliation Act of 2003. The Fund designated up to a maximum of approximately $76,000 as taxable at this lower rate.
In January, the Portfolio provides tax information to shareholders for the preceding calendar year.
27
Morgan Stanley Institutional Fund, Inc.
Annual Report — December 31, 2017
Privacy Notice (unaudited)
MORGAN STANLEY INVESTMENT MANAGEMENT INC.
AN IMPORTANT NOTICE CONCERNING OUR U.S. PRIVACY POLICY
We are required by federal law to provide you with a copy of our privacy policy annually. This policy applies to current and former individual investors in funds managed or sponsored by Morgan Stanley Investment Management Inc. ("MSIM") as well as current and former individual clients of MSIM. This policy is not applicable to partnerships, corporations, trusts or other non-individual clients or investors. Please note that we may amend this policy at any time, and will inform you of any changes as required by law.
WE RESPECT YOUR PRIVACY
We appreciate that you have provided us with your personal financial information. We strive to maintain the privacy of such information while we help you achieve your financial objectives. This Notice describes what non-public personal information we collect about you, why we collect it, when we may share it with others and how certain others may use it. It discusses the steps you may take to limit our sharing of certain information about you to affiliated companies in the Morgan Stanley family of companies ("other Morgan Stanley companies"). It also discloses how you may limit use of certain shared information for marketing purposes by other Morgan Stanley branded companies. Throughout this policy, we refer to the non-public information that personally identifies you or your accounts as "personal information."
1. WHAT PERSONAL INFORMATION DO WE COLLECT ABOUT YOU?
We obtain personal information from applications and other forms you submit to us, from your dealings with us, from consumer reporting agencies, from our Web sites and from third parties and other sources.
For example:
• We may collect information such as your name, address, e-mail address, telephone/fax numbers, assets, income and investment objectives through subscription documents, applications and other forms you submit to us.
• We may obtain information about account balances, your use of account(s) and the types of products and services you prefer to receive from us through your dealings and transactions with us and other sources.
• We may obtain information about your creditworthiness and credit history from consumer reporting agencies.
• We may collect background information from and through third-party vendors to verify representations you have made and to comply with various regulatory requirements.
• If you interact with us through our public and private Web sites, we may collect information that you provide directly through online communications (such as an e-mail address). We may also collect information about your Internet service provider, your domain name, your computer's operating system and Web browser, your use of our Web sites and your product and service preferences, through the use of "cookies." Please consult the Terms of Use of these sites for more details.
2. WHEN DO WE DISCLOSE PERSONAL INFORMATION WE COLLECT ABOUT YOU?
We may disclose personal information we collect about you to other Morgan Stanley companies and to non-affiliated third parties.
a. Information We Disclose to Other Morgan Stanley Companies.
We may disclose personal information to other Morgan Stanley companies for a variety of reasons, including to manage your account(s) effectively, to service and process your transactions, to let you know about products and services offered by us and other Morgan Stanley companies, to manage our business, and as otherwise required or permitted by law. Offers for products and services from other Morgan Stanley companies are developed under conditions designed to safeguard your personal information.
28
Morgan Stanley Institutional Fund, Inc.
Annual Report — December 31, 2017
Privacy Notice (unaudited) (cont'd)
b. Information We Disclose to Non-affiliated Third Parties.
We do not disclose personal information that we collect about you to non-affiliated third parties except to those who provide marketing services on our behalf, to financial institutions with whom we have joint marketing agreements, and as otherwise required or permitted by law. For example, we may disclose personal information to non-affiliated third parties for servicing and processing transactions, to offer our own products and services, to protect against fraud, for institutional risk control, to respond to judicial process or to perform services on our behalf. When we share personal information with a non-affiliated third party, they are required to limit their use of personal information to the particular purpose for which it was shared and they are not allowed to share personal information with others except to fulfill that limited purpose or as may be permitted or required by law.
3. HOW DO WE PROTECT THE SECURITY AND CONFIDENTIALITY OF PERSONAL INFORMATION WE COLLECT ABOUT YOU?
We maintain physical, electronic and procedural security measures to help safeguard the personal information we collect about you. We have internal policies governing the proper handling of client information. Third parties that provide support or marketing services on our behalf may also receive personal information, and we require them to adhere to confidentiality standards with respect to such information.
4. HOW CAN YOU LIMIT THE SHARING OF CERTAIN TYPES OF PERSONAL INFORMATION WITH OTHER MORGAN STANLEY COMPANIES?
We offer you choices as to whether we share with other Morgan Stanley companies the personal information that was collected to determine your eligibility for products and services you request ("eligibility information"). Eligibility information does not include your identification information or personal information pertaining to our transactions or experiences with you. Please note that, even if you direct us not to share eligibility information with other Morgan Stanley companies ("opt-out"), we may still share personal information, including eligibility information, with those companies in circumstances excluded from the opt-out under applicable law, such as to process transactions or to service your account.
5. HOW CAN YOU LIMIT THE USE OF CERTAIN TYPES OF PERSONAL INFORMATION BY OTHER MORGAN STANLEY COMPANIES FOR MARKETING?
By following the opt-out instructions in Section 6 below, you may limit other Morgan Stanley branded companies from marketing their products or services to you based on personal information we disclose to them. This information may include, for example, your income and account history with us. Please note that, even if you choose to limit Other Morgan Stanley Companies from using personal information about you that we may share with them for marketing their products and services to you, Other Morgan Stanley Companies may use your personal information that they obtain from us to market to you in circumstances permitted by law, such as if the Other Morgan Stanley Company has its own relationship with you.
6. HOW CAN YOU SEND US AN OPT-OUT INSTRUCTION?
If you wish to limit our sharing of eligibility information about you with other Morgan Stanley companies or other Morgan Stanley companies' use of personal information for marketing purposes, as described in this notice, you may do so by:
• Calling us at (800) 548-7786
Monday–Friday between 8a.m. and 6p.m.(EST)
• Writing to us at the following address:
DST Asset Manager Solutions, Inc.
c/o Privacy Coordinator
P.O. Box 219804
Kansas City, Missouri 64121
29
Morgan Stanley Institutional Fund, Inc.
Annual Report — December 31, 2017
Privacy Notice (unaudited) (cont'd)
Your written request should include your name, address, telephone number and account number(s) to which the opt-out applies and whether you are opting out with respect to sharing of eligibility information (Section 4 above), or if information used for Marketing (Section 5 above) or both. Written opt-out requests should not be sent with any other correspondence. In order to process your request, we require that the request be provided by you directly and not through a third party.
Your opt-out preference will remain in effect with respect to this policy (as it may be amended) until you notify us otherwise. If you have a joint account, your direction for us not to share this information with other Morgan Stanley companies and for those other Morgan Stanley companies not to use your personal information for marketing will be applied to all account holders on that account. Please understand that if you limit our sharing or our affiliated companies' use of personal information, you and any joint account holder(s) may not receive information about Morgan Stanley products and services, including products or services that could help you manage your financial resources and achieve your investment objectives.
7. WHAT IF AN AFFILIATED COMPANY BECOMES A NON-AFFILIATED THIRD PARTY?
If, at any time in the future, an affiliated company becomes a non-affiliated third party, further disclosures of personal information made to the former affiliated company will be limited to those described in Section 2(b) above relating to non-affiliated third parties. If you elected under Section 6 to limit disclosures we make to affiliated companies, or use of personal information by affiliated companies, your election will not apply to use by any former affiliated company of your personal information in their possession once it becomes a non-affiliated third party.
SPECIAL NOTICE TO RESIDENTS OF VERMONT
The following section supplements our policy with respect to our individual clients who have a Vermont address and supersedes anything to the contrary in the above policy with respect to those clients only.
The state of Vermont requires financial institutions to obtain your consent prior to sharing personal information that they collect about you with affiliated companies and non-affiliated third parties other than in certain limited circumstances. Except as permitted by law, we will not share personal information we collect about you with non-affiliated third parties or other Morgan Stanley companies unless you provide us with your written consent to share such information ("opt-in").
If you wish to receive offers for investment products and services offered by or through other Morgan Stanley companies, please notify us in writing at the following address:
DST Asset Manager Solutions, Inc.
c/o Privacy Coordinator
P.O. Box 219804
Kansas City, Missouri 64121
Your authorization should include your name, address, telephone number and account number(s) to which the opt-in applies and should not be sent with any other correspondence. In order to process your authorization, we require that the authorization be provided by you directly and not through a third party.
SPECIAL NOTICE TO RESIDENTS OF CALIFORNIA
The following section supplements our policy with respect to our individual clients who have a California address and supersedes anything to the contrary in the above policy with respect to those clients only.
In response to a California law, if your account has a California home address, your personal information will not be disclosed to non-affiliated third parties except as permitted by applicable California law, and we will limit sharing such information with our affiliates to comply with California privacy laws that apply to us.
30
Morgan Stanley Institutional Fund, Inc.
Annual Report — December 31, 2017
Director and Officer Information (unaudited)
Independent Directors:
Name, Age and Address of
Independent Director | | Position(s)
Held with
Registrant | | Length of Time
Served* | | Principal Occupation(s) During Past 5 Years
and Other Relevant Professional Experience | | Number of
Portfolios in
Fund Complex
Overseen by
Independent
Director** | | Other Directorships
Held by Independent
Director*** | |
Frank L. Bowman (73)
c/o Perkins Coie LLP
Counsel to the Independent
Directors
30 Rockefeller Plaza
New York, NY 10112 | | Director | | Since
August
2006 | | President, Strategic Decisions, LLC (consulting) (since February 2009); Director or Trustee of various Morgan Stanley Funds (since August 2006); Chairperson of the Compliance and Insurance Committee (since October 2015); formerly, Chairperson of the Insurance Sub-Committee of the Compliance and Insurance Committee (2007-2015); served as President and Chief Executive Officer of the Nuclear Energy Institute (policy organization) (February 2005-November 2008); retired as Admiral, U.S. Navy after serving over 38 years on active duty including 8 years as Director of the Naval Nuclear Propulsion Program in the Department of the Navy and the U.S. Department of Energy (1996-2004); served as Chief of Naval Personnel (July 1994-September 1996) and on the Joint Staff as Director of Political Military Affairs (June 1992-July 1994); knighted as Honorary Knight Commander of the Most Excellent Order of the British Empire; awarded the Officier de l'Orde National du Mérite by the French Government; elected to the National Academy of Engineering (2009). | | | 88 | | | Director of BP p.l.c.; Director of Naval and Nuclear Technologies LLP; Director Emeritus of the Armed Services YMCA; Director of the U.S. Naval Submarine League; Member of the National Security Advisory Council of the Center for U.S. Global Engagement and a member of the CNA Military Advisory Board; Trustee of Fairhaven United Methodist Church; and Director of other various non-profit organizations. | |
Kathleen A. Dennis (64)
c/o Perkins Coie LLP
Counsel to the Independent Directors
30 Rockefeller Plaza
New York, NY 10112 | | Director | | Since
August
2006 | | President, Cedarwood Associates (mutual fund and investment management consulting) (since July 2006); Chairperson of the Liquidity and Alternatives Sub-Committee of the Investment Committee (since October 2006) and Director or Trustee of various Morgan Stanley Funds (since August 2006); formerly, Senior Managing Director of Victory Capital Management (1993-2006). | | | 89 | | | Director of various non-profit organizations. | |
Nancy C. Everett (62)
c/o Perkins Coie LLP
Counsel to the Independent Directors
30 Rockefeller Plaza
New York, NY 10112 | | Director | | Since
January
2015 | | Chief Executive Officer, Virginia Commonwealth University Investment Company (since November 2015); Owner, OBIR, LLC (institutional investment management consulting) (since June 2014); formerly, Managing Director, BlackRock Inc. (February 2011-December 2013); and Chief Executive Officer, General Motors Asset Management (a/k/a Promark Global Advisors, Inc.) (June 2005-May 2010). | | | 90 | | | Formerly, Member of Virginia Commonwealth University School of Business Foundation (2005-2016); Member of Virginia Commonwealth University Board of Visitors (2013-2015); Member of Committee on Directors for Emerging Markets Growth Fund, Inc. (2007-2010); Chairperson of Performance Equity Management, LLC (2006-2010); and Chairperson, GMAM Absolute Return Strategies Fund, LLC (2006-2010). | |
31
Morgan Stanley Institutional Fund, Inc.
Annual Report — December 31, 2017
Director and Officer Information (unaudited) (cont'd)
Independent Directors: (cont'd)
Name, Age and Address of
Independent Director | | Position(s)
Held with
Registrant | | Length of Time
Served* | | Principal Occupation(s) During Past 5 Years
and Other Relevant Professional Experience | | Number of
Portfolios in
Fund Complex
Overseen by
Independent
Director** | | Other Directorships
Held by Independent
Director*** | |
Jakki L. Haussler (60)
c/o Perkins Coie LLP
Counsel to the Independent Directors
30 Rockefeller Plaza
New York, NY 10112 | | Director | | Since
January
2015 | | Chairman and Chief Executive Officer, Opus Capital Group (since January 1996); formerly, Director, Capvest Venture Fund, LP (May 2000-December 2011); Partner, Adena Ventures, LP (July 1999-December 2010); Director, The Victory Funds (February 2005-July 2008). | | | 91 | | | Director of Cincinnati Bell Inc. and Member, Audit Committee and Compensation Committee; Director of Northern Kentucky University Foundation and Member, Investment Committee; Member of Chase College of Law Transactional Law Practice Center Board of Advisors; Director of Best Transport; Director of Chase College of Law Board of Visitors; formerly, Member, University of Cincinnati Foundation Investment Committee; Member, Miami University Board of Visitors (2008-2011); Trustee of Victory Funds (2005-2008) and Chairman, Investment Committee (2007-2008) and Member, Service Provider Committee (2005-2008). | |
Dr. Manuel H. Johnson (68)
c/o Johnson Smick
International, Inc.
220 I Street, NE — Suite 200
Washington, D.C. 20002 | | Director | | Since
July
1991 | | Senior Partner, Johnson Smick International, Inc. (consulting firm); Chairperson of the Investment Committee (since October 2006) and Director or Trustee of various Morgan Stanley Funds (since July 1991); Co-Chairman and a founder of the Group of Seven Council (G7C) (international economic commission); formerly, Chairperson of the Audit Committee (July 1991-September 2006), Vice Chairman of the Board of Governors of the Federal Reserve System and Assistant Secretary of the U.S. Treasury. | | | 91 | | | Director of NVR, Inc. (home construction). | |
Joseph J. Kearns (75)
c/o Kearns & Associates LLC
46 E Peninsula Center #385
Rolling Hills Estates, CA 90274-3712 | | Director | | Since
August
1994 | | Senior Adviser, Kearns & Associates LLC (investment consulting); Chairperson of the Audit Committee (since October 2006) and Director or Trustee of various Morgan Stanley Funds (since August 1994); formerly, Deputy Chairperson of the Audit Committee (July 2003-September 2006) and Chairperson of the Audit Committee of various Morgan Stanley Funds (since August 1994); CFO of the J. Paul Getty Trust. | | | 93 | | | Prior to August 10, 2016, Director of Electro Rent Corporation (equipment leasing); Prior to December 31, 2013, Director of The Ford Family Foundation. | |
32
Morgan Stanley Institutional Fund, Inc.
Annual Report — December 31, 2017
Director and Officer Information (unaudited) (cont'd)
Independent Directors: (cont'd)
Name, Age and Address of
Independent Director | | Position(s)
Held with
Registrant | | Length of Time
Served* | | Principal Occupation(s) During Past 5 Years
and Other Relevant Professional Experience | | Number of
Portfolios in
Fund Complex
Overseen by
Independent
Director** | | Other Directorships
Held by Independent
Director*** | |
Michael F. Klein (59)
c/o Perkins Coie LLP
Counsel to the Independent Directors
30 Rockefeller Plaza
New York, NY 10112 | | Director | | Since
August
2006 | | Managing Director, Aetos Capital, LLC (since March 2000); Co-President, Aetos Alternatives Management, LLC (since January 2004) and Co-Chief Executive Officer of Aetos Capital LLC (since August 2013); Chairperson of the Fixed Income Sub-Committee of the Investment Committee (since October 2006) and Director or Trustee of various Morgan Stanley Funds (since August 2006); formerly, Managing Director, Morgan Stanley & Co. Inc. and Morgan Stanley Dean Witter Investment Management, President, various Morgan Stanley Funds (June 1998-March 2000) and Principal, Morgan Stanley & Co. Inc. and Morgan Stanley Dean Witter Investment Management (August 1997-December 1999). | | | 88 | | | Director of certain investment funds managed or sponsored by Aetos Capital, LLC; Director of Sanitized AG and Sanitized Marketing AG (specialty chemicals). | |
Patricia Maleski (57)
c/o Perkins Coie LLP
Counsel to the Independent Directors
30 Rockefeller Plaza
New York, NY 10112 | | Director | | Since
January
2017 | | Managing Director, JPMorgan Asset Management (2004-2016); Oversight and Control Head of Fiduciary and Conflicts of Interest Program (2015-2016); Chief Control Officer-Global Asset Management (2013-2015); President, JPMorgan Funds (2010-2013); Chief Administrative Officer (2004-2013); various other positions including Treasurer and Board Liaison (since 2001). | | | 90 | | | None. | |
Michael E. Nugent (81)
522 Fifth Avenue
New York, NY 10036 | | Chair of the Board and Director | | Chair of the Boards since July 2006 and Director since July 1991 | | Chair of the Boards of various Morgan Stanley Funds (since July 2006); Chairperson of the Closed-End Fund Committee (since June 2012) and Director or Trustee of various Morgan Stanley Funds (since July 1991); formerly, Chairperson of the Insurance Committee (until July 2006); General Partner, Triumph Capital, L.P. (private investment partnership) (1988-2013). | | | 88 | | | None. | |
W. Allen Reed (70)
c/o Perkins Coie LLP
Counsel to the Independent Directors
30 Rockefeller Plaza
New York, NY 10112 | | Director | | Since
August
2006 | | Chairperson of the Equity Sub-Committee of the Investment Committee (since October 2006) and Director or Trustee of various Morgan Stanley Funds (since August 2006); formerly, President and CEO of General Motors Asset Management; Chairman and Chief Executive Officer of the GM Trust Bank and Corporate Vice President of General Motors Corporation (August 1994-December 2005). | | | 89 | | | Director of Legg Mason, Inc.; formerly, Director of the Auburn University Foundation (2010-2015). | |
Fergus Reid (85)
c/o Joe Pietryka, Inc.
85 Charles Colman Blvd.
Pawling, NY 12564 | | Director | | Since
June
1992 | | Chairman, Joe Pietryka, Inc.; Chairperson of the Governance Committee and Director or Trustee of various Morgan Stanley Funds (since June 1992). | | | 89 | | | Formerly, Trustee and Director of certain investment companies in the JP Morgan Fund Complex managed by JP Morgan Investment Management Inc. (1987-2012). | |
* This is the earliest date the Director began serving the Morgan Stanley Funds. Each Director serves an indefinite term, until his or her successor is elected.
** The Fund Complex includes (as of December 31, 2017) all open-end and closed-end funds (including all of their portfolios) advised by Morgan Stanley Investment Management Inc. (the "Adviser") and any funds that have an adviser that is an affiliated person of the Adviser (including, but not limited to, Morgan Stanley AIP GP LP).
*** This includes any directorships at public companies and registered investment companies held by the Director at any time during the past five years.
33
Morgan Stanley Institutional Fund, Inc.
Annual Report — December 31, 2017
Director and Officer Information (unaudited) (cont'd)
Executive Officers:
Name, Age and Address of Executive Officer | | Position(s) Held
with
Registrant | | Length of Time
Served* | | Principal Occupation(s) During Past 5 Years | |
John H. Gernon (54)
522 Fifth Avenue
New York, NY 10036 | | President and Principal Executive Officer | | Since
September
2013 | | President and Principal Executive Officer of the Equity and Fixed Income Funds and the Morgan Stanley AIP Funds (since September 2013) and the Liquidity Funds and various money market funds (since May 2014) in the Fund Complex; Managing Director of the Adviser; Head of Product (since 2006). | |
Timothy J. Knierim (58)
522 Fifth Avenue
New York, NY 10036 | | Chief Compliance Officer | | Since
December
2016 | | Managing Director of the Adviser and various entities affiliated with the Adviser; Chief Compliance Officer of various Morgan Stanley Funds and the Adviser (since December 2016) and Chief Compliance Officer of Morgan Stanley AIP GP LP (since 2014). Formerly, Managing Director and Deputy Chief Compliance Officer of the Adviser (2014-2016); and formerly, Chief Compliance Officer of Prudential Investment Management, Inc. (2007-2014). | |
Francis J. Smith (52)
522 Fifth Avenue
New York, NY 10036 | | Treasurer and Principal Financial Officer | | Treasurer since July 2003 and Principal Financial Officer since September 2002 | | Managing Director of the Adviser and various entities affiliated with the Adviser; Treasurer (since July 2003) and Principal Financial Officer of various Morgan Stanley Funds (since September 2002). | |
Mary E. Mullin (50)
522 Fifth Avenue
New York, NY 10036 | | Secretary | | Since
June
1999 | | Managing Director of the Adviser; Secretary of various Morgan Stanley Funds (since June 1999). | |
Michael J. Key (38)
522 Fifth Avenue
New York, NY 10036 | | Vice President | | Since
June
2017 | | Vice President of the Equity and Fixed Income Funds, Liquidity Funds, various money market funds and the Morgan Stanley AIP Funds in the Fund Complex (since June 2017); Executive Director of the Adviser; Head of Product Development for Equity and Fixed Income Funds (since August 2013). | |
* This is the earliest date the officer began serving the Morgan Stanley Funds. Each officer serves a one-year term, until his or her successor is elected and qualifies.
34
Morgan Stanley Institutional Fund, Inc.
Annual Report — December 31, 2017
Adviser and Administrator
Morgan Stanley Investment Management Inc.
522 Fifth Avenue
New York, New York 10036
Distributor
Morgan Stanley Distribution, Inc.
522 Fifth Avenue
New York, New York 10036
Dividend Disbursing and Transfer Agent
DST Asset Manager Solutions, Inc.
2000 Crown Colony Drive
Quincy, Massachusetts 02169
Custodian
State Street Bank and Trust Company
One Lincoln Street
Boston, Massachusetts 02111
Legal Counsel
Dechert LLP
1095 Avenue of the Americas
New York, New York 10036
Counsel to the Independent Directors
Perkins Coie LLP
30 Rockefeller Plaza
New York, New York 10112
Independent Registered Public Accounting Firm
Ernst & Young LLP
200 Clarendon Street
Boston, Massachusetts 02116
Reporting to Shareholders
Each Morgan Stanley Fund provides a complete schedule of portfolio holdings in its semi-annual and annual reports within 60 days of the end of the fund's second and fourth fiscal quarters. The semi-annual and annual reports are filed electronically with the Securities and Exchange Commission (SEC) on Form N-CSRS and Form N-CSR, respectively. Morgan Stanley also delivers the semi-annual and annual reports to fund shareholders and makes these reports available on its public website, www.morganstanley.com/im. Each Morgan Stanley fund also files a complete schedule of portfolio holdings with the SEC for the fund's first and third fiscal quarters on Form N-Q. Morgan Stanley does not deliver the reports for the first and third fiscal quarters to shareholders, nor are the reports posted to the Morgan Stanley public website. You may, however, obtain the Form N-Q filings (as well as the Form N-CSR and N-CSRS filings) by accessing the SEC's website, www.sec.gov. You may also review and copy them at the SEC's Public Reference Room in Washington, DC. Information on the operation of the SEC's Public Reference Room may be obtained by calling the SEC toll free at 1 (800) SEC-0330. You can also request copies of these materials, upon payment of a duplicating fee, by electronic request at the SEC's email address (publicinfo@sec.gov) or by writing to the SEC's Public Reference Section, Washington, D.C. 20549-1520.
Proxy Voting Policies and Procedures and Proxy Voting Record
You may obtain a copy of the Company's Proxy Voting Policy and Procedures and information regarding how the Company voted proxies relating to portfolio securities during the most recent twelve-month period ended June 30, without charge, upon request, by calling toll free 1 (800) 548-7786 or by visiting our website at www.morganstanley.com/im. This information is also available on the SEC's website at www.sec.gov.
This report is authorized for distribution only when preceded or accompanied by a prospectus or summary prospectus of the applicable Fund of Morgan Stanley Institutional Fund, Inc., which describes in detail the Fund's investment policies, risks, fees and expenses. Please read the prospectus carefully before you invest or send money. For additional information, including information regarding the investments comprising the Fund, please visit our website at www.morganstanley.com/im or call toll free 1 (800) 548-7786.
35
Printed in U.S.A.
This Report has been prepared for shareholders and may be distributed to others only if preceded or accompanied by a current prospectus.
Morgan Stanley Investment Management Inc.
522 Fifth Avenue
New York, New York 10036
© 2018 Morgan Stanley. Morgan Stanley Distribution, Inc.

IFIUSREAANN
2011341 EXP. 02.28.19
Item 2. Code of Ethics.
(a) The registrant has adopted a code of ethics (the “Code of Ethics”) that applies to its principal executive officer, principal financial officer, principal accounting officer or controller, or persons performing similar functions, regardless of whether these individuals are employed by the registrant or a third party.
(b) No information need be disclosed pursuant to this paragraph.
(c) Not applicable.
(d) Not applicable.
(e) Not applicable.
(f)
(1) The registrant’s Code of Ethics is attached hereto as Exhibit 12 A.
(2) Not applicable.
(3) Not applicable.
Item 3. Audit Committee Financial Expert.
The registrant’s Board of Directors has determined that Joseph J. Kearns, an “independent” Director, is an “audit committee financial expert” serving on its audit committee. Under applicable securities laws, a person who is determined to be an audit committee financial expert will not be deemed an “expert” for any purpose, including without limitation for the purposes of Section 11 of the Securities Act of 1933, as a result of being designated or identified as an audit committee financial expert. The designation or identification of a person as an audit committee financial expert does not impose on such person any duties, obligations, or liabilities that are greater than the duties, obligations, and liabilities imposed on such person as a member of the audit committee and Board of Directors in the absence of such designation or identification.
Item 4. Principal Accountant Fees and Services.
(a)(b)(c)(d) and (g). Based on fees billed for the periods shown:
2017
| | Registrant | | Covered Entities(1) | |
Audit Fees | | $ | 1,281,889 | | N/A | |
| | | | | |
Non-Audit Fees | | | | | |
Audit-Related Fees | | $ | — | (2) | $ | — | (2) |
Tax Fees | | $ | 138,206 | (3) | $ | 11,474,825 | (4) |
All Other Fees | | $ | — | | $ | 136,088 | (5) |
Total Non-Audit Fees | | $ | 138,206 | | $ | 11,610,913 | |
| | | | | |
Total | | $ | 1,420,095 | | $ | 11,610,913 | |
2016
| | Registrant | | Covered Entities(1) | |
Audit Fees | | $ | 1,169,439 | | N/A | |
| | | | | |
Non-Audit Fees | | | | | |
Audit-Related Fees | | $ | — | (2) | $ | — | (2) |
Tax Fees | | $ | 124,000 | (3) | $ | 8,817,179 | (4) |
All Other Fees | | $ | — | | $ | 227,300 | (5) |
Total Non-Audit Fees | | $ | 124,000 | | $ | 9,044,479 | |
| | | | | |
Total | | $ | 1,293,439 | | $ | 9,044,479 | |
N/A- Not applicable, as not required by Item 4.
(1) Covered Entities include the Adviser (excluding sub-advisors) and any entity controlling, controlled by or under common control with the Adviser that provides ongoing services to the Registrant.
(2) Audit-Related Fees represent assurance and related services provided that are reasonably related to the performance of the audit of the financial statements of the Covered Entities’ and funds advised by the Adviser or its affiliates, specifically data verification and agreed-upon procedures related to asset securitizations and agreed-upon procedures engagements.
(3) Tax Fees represent tax compliance, tax planning and tax advice services provided in connection with the preparation and review of the Registrant’s tax returns.
(4) Tax Fees represent tax compliance, tax planning and tax advice services provided in connection with the review of Covered Entities’ tax returns.
(5) All other fees represent project management for future business applications and improving business and operational processes.
(e)(1) The audit committee’s pre-approval policies and procedures are as follows:
APPENDIX A
AUDIT COMMITTEE
AUDIT AND NON-AUDIT SERVICES
PRE-APPROVAL POLICY AND PROCEDURES
OF THE
MORGAN STANLEY RETAIL AND INSTITUTIONAL FUNDS
AS ADOPTED AND AMENDED JULY 23, 2004,(1)
1. Statement of Principles
The Audit Committee of the Board is required to review and, in its sole discretion, pre-approve all Covered Services to be provided by the Independent Auditors to the Fund and Covered Entities in order to assure that services performed by the Independent Auditors do not impair the auditor’s independence from the Fund.
The SEC has issued rules specifying the types of services that an independent auditor may not provide to its audit client, as well as the audit committee’s administration of the engagement of the independent auditor. The SEC’s rules establish two different approaches to pre-approving services, which the SEC considers to be equally valid. Proposed services either: may be pre-approved without consideration of specific case-by-case services by the Audit Committee (“general pre-approval”); or require the specific pre-approval of the Audit Committee or its delegate (“specific pre-approval”). The Audit Committee believes that the combination of these two approaches in this Policy will result in an effective and efficient procedure to pre-approve services performed by the Independent Auditors. As set forth in this Policy, unless a type of service has received general pre-approval, it will require specific pre-approval by the Audit Committee (or by any member of the Audit Committee to which pre-approval authority has been delegated) if it is to be provided by the Independent Auditors. Any proposed services exceeding pre-approved cost levels or budgeted amounts will also require specific pre-approval by the Audit Committee.
The appendices to this Policy describe the Audit, Audit-related, Tax and All Other services that have the general pre-approval of the Audit Committee. The term of any general pre-approval is 12 months from the date of pre-approval, unless the Audit Committee considers and provides a different period and states otherwise. The Audit Committee will annually review and pre-approve the services that may be provided by the Independent Auditors without obtaining specific pre-approval from the Audit Committee. The Audit Committee will add to or subtract from the list of general pre-approved services from time to time, based on subsequent determinations.
(1) This Audit Committee Audit and Non-Audit Services Pre-Approval Policy and Procedures (the “Policy”), adopted as of the date above, supersedes and replaces all prior versions that may have been adopted from time to time.
The purpose of this Policy is to set forth the policy and procedures by which the Audit Committee intends to fulfill its responsibilities. It does not delegate the Audit Committee’s responsibilities to pre-approve services performed by the Independent Auditors to management.
The Fund’s Independent Auditors have reviewed this Policy and believes that implementation of the Policy will not adversely affect the Independent Auditors’ independence.
2. Delegation
As provided in the Act and the SEC’s rules, the Audit Committee may delegate either type of pre-approval authority to one or more of its members. The member to whom such authority is delegated must report, for informational purposes only, any pre-approval decisions to the Audit Committee at its next scheduled meeting.
3. Audit Services
The annual Audit services engagement terms and fees are subject to the specific pre-approval of the Audit Committee. Audit services include the annual financial statement audit and other procedures required to be performed by the Independent Auditors to be able to form an opinion on the Fund’s financial statements. These other procedures include information systems and procedural reviews and testing performed in order to understand and place reliance on the systems of internal control, and consultations relating to the audit. The Audit Committee will approve, if necessary, any changes in terms, conditions and fees resulting from changes in audit scope, Fund structure or other items.
In addition to the annual Audit services engagement approved by the Audit Committee, the Audit Committee may grant general pre-approval to other Audit services, which are those services that only the Independent Auditors reasonably can provide. Other Audit services may include statutory audits and services associated with SEC registration statements (on Forms N-1A, N-2, N-3, N-4, etc.), periodic reports and other documents filed with the SEC or other documents issued in connection with securities offerings.
The Audit Committee has pre-approved the Audit services in Appendix B.1. All other Audit services not listed in Appendix B.1 must be specifically pre-approved by the Audit Committee (or by any member of the Audit Committee to which pre-approval has been delegated).
4. Audit-related Services
Audit-related services are assurance and related services that are reasonably related to the performance of the audit or review of the Fund’s financial statements and, to the extent they are Covered Services, the Covered Entities or that are traditionally performed by the Independent Auditors. Because the Audit Committee believes that the provision of Audit-related services does not impair the independence of the auditor and is consistent with the SEC’s rules on auditor independence, the Audit Committee may grant general pre-approval to Audit-related services. Audit-related services include, among others, accounting consultations related to accounting, financial reporting or disclosure matters not classified as “Audit services”; assistance with understanding and implementing new accounting and financial reporting guidance from rulemaking authorities; agreed-upon or expanded audit procedures related to accounting and/or billing records required to respond to or comply with financial, accounting or regulatory
reporting matters; and assistance with internal control reporting requirements under Forms N-SAR and/or N-CSR.
The Audit Committee has pre-approved the Audit-related services in Appendix B.2. All other Audit-related services not listed in Appendix B.2 must be specifically pre-approved by the Audit Committee (or by any member of the Audit Committee to which pre-approval has been delegated).
5. Tax Services
The Audit Committee believes that the Independent Auditors can provide Tax services to the Fund and, to the extent they are Covered Services, the Covered Entities, such as tax compliance, tax planning and tax advice without impairing the auditor’s independence, and the SEC has stated that the Independent Auditors may provide such services.
Pursuant to the preceding paragraph, the Audit Committee has pre-approved the Tax Services in Appendix B.3. All Tax services in Appendix B.3 must be specifically pre-approved by the Audit Committee (or by any member of the Audit Committee to which pre-approval has been delegated).
6. All Other Services
The Audit Committee believes, based on the SEC’s rules prohibiting the Independent Auditors from providing specific non-audit services, that other types of non-audit services are permitted. Accordingly, the Audit Committee believes it may grant general pre-approval to those permissible non-audit services classified as All Other services that it believes are routine and recurring services, would not impair the independence of the auditor and are consistent with the SEC’s rules on auditor independence.
The Audit Committee has pre-approved the All Other services in Appendix B.4. Permissible All Other services not listed in Appendix B.4 must be specifically pre-approved by the Audit Committee (or by any member of the Audit Committee to which pre-approval has been delegated).
7. Pre-Approval Fee Levels or Budgeted Amounts
Pre-approval fee levels or budgeted amounts for all services to be provided by the Independent Auditors will be established annually by the Audit Committee. Any proposed services exceeding these levels or amounts will require specific pre-approval by the Audit Committee. The Audit Committee is mindful of the overall relationship of fees for audit and non-audit services in determining whether to pre-approve any such services.
8. Procedures
All requests or applications for services to be provided by the Independent Auditors that do not require specific approval by the Audit Committee will be submitted to the Fund’s Chief Financial Officer and must include a detailed description of the services to be rendered. The Fund’s Chief Financial Officer will determine whether such services are included within the list of services that have received the general pre-approval of the Audit Committee. The Audit Committee will be informed on a timely basis of any such services rendered by the Independent Auditors. Requests or applications to provide services that require specific approval by the
Audit Committee will be submitted to the Audit Committee by both the Independent Auditors and the Fund’s Chief Financial Officer, and must include a joint statement as to whether, in their view, the request or application is consistent with the SEC’s rules on auditor independence.
The Audit Committee has designated the Fund’s Chief Financial Officer to monitor the performance of all services provided by the Independent Auditors and to determine whether such services are in compliance with this Policy. The Fund’s Chief Financial Officer will report to the Audit Committee on a periodic basis on the results of its monitoring. Both the Fund’s Chief Financial Officer and management will immediately report to the chairman of the Audit Committee any breach of this Policy that comes to the attention of the Fund’s Chief Financial Officer or any member of management.
9. Additional Requirements
The Audit Committee has determined to take additional measures on an annual basis to meet its responsibility to oversee the work of the Independent Auditors and to assure the auditor’s independence from the Fund, such as reviewing a formal written statement from the Independent Auditors delineating all relationships between the Independent Auditors and the Fund, consistent with Independence Standards Board No. 1, and discussing with the Independent Auditors its methods and procedures for ensuring independence.
10. Covered Entities
Covered Entities include the Fund’s investment adviser(s) and any entity controlling, controlled by or under common control with the Fund’s investment adviser(s) that provides ongoing services to the Fund(s). Beginning with non-audit service contracts entered into on or after May 6, 2003, the Fund’s audit committee must pre-approve non-audit services provided not only to the Fund but also to the Covered Entities if the engagements relate directly to the operations and financial reporting of the Fund. This list of Covered Entities would include:
Morgan Stanley Retail Funds
Morgan Stanley Investment Advisors Inc.
Morgan Stanley & Co. Incorporated
Morgan Stanley DW Inc.
Morgan Stanley Investment Management Inc.
Morgan Stanley Investment Management Limited
Morgan Stanley Investment Management Private Limited
Morgan Stanley Asset & Investment Trust Management Co., Limited
Morgan Stanley Investment Management Company
Morgan Stanley Services Company, Inc.
Morgan Stanley Distributors Inc.
Morgan Stanley Trust FSB
Morgan Stanley Institutional Funds
Morgan Stanley Investment Management Inc.
Morgan Stanley Investment Advisors Inc.
Morgan Stanley Investment Management Limited
Morgan Stanley Investment Management Private Limited
Morgan Stanley Asset & Investment Trust Management Co., Limited
Morgan Stanley Investment Management Company
Morgan Stanley & Co. Incorporated
Morgan Stanley Distribution, Inc.
Morgan Stanley AIP GP LP
Morgan Stanley Alternative Investment Partners LP
(e)(2) Beginning with non-audit service contracts entered into on or after May 6, 2003, the audit committee also is required to pre-approve services to Covered Entities to the extent that the services are determined to have a direct impact on the operations or financial reporting of the Registrant. 100% of such services were pre-approved by the audit committee pursuant to the Audit Committee’s pre-approval policies and procedures (attached hereto).
(f) Not applicable.
(g) See table above.
(h) The audit committee of the Board of Directors has considered whether the provision of services other than audit services performed by the auditors to the Registrant and Covered Entities is compatible with maintaining the auditors’ independence in performing audit services.
Item 5. Audit Committee of Listed Registrants.
(a) The registrant has a separately-designated standing audit committee established in accordance with Section 3(a)(58)(A) of the Exchange Act whose members are:
Joseph J. Kearns, Jakki L. Haussler, Michael F. Klein and Allen W. Reed.
(b) Not applicable.
Item 6. Schedule of Investments
(a) Refer to Item 1.
(b) Not applicable.
Item 7. Disclosure of Proxy Voting Policies and Procedures for Closed-End Management Investment Companies.
Applicable only to reports filed by closed-end funds.
Item 8. Portfolio Managers of Closed-End Management Investment Companies
Applicable only to reports filed by closed-end funds.
Item 9. Closed-End Fund Repurchases
Applicable only to reports filed by closed-end funds.
Item 10. Submission of Matters to a Vote of Security Holders
Not applicable.
Item 11. Controls and Procedures
(a) The registrant’s President (principal executive officer) and Treasurer (principal financial officer) have evaluated the registrant’s disclosure controls and procedures within 90 days of this filing and have concluded that the registrant’s disclosure controls and procedures were effective as of that date in ensuring that information required to be disclosed by the registrant in this Form N-CSR was recorded, processed, summarized, and reported timely, except for the item discussed below.
Morgan Stanley Institutional Fund, Inc. (the “Company”) may be subject to foreign taxes (a portion of which may be reclaimable) on income, stock dividends, capital gains on investments or certain foreign currency transactions. The Company has disclosure controls, a process and procedures in place to analyze any foreign holdings and determine if there is any tax exposure that needs to be recorded in the financial statements. However, due to a material weakness in an identified control in the Company’s process, the control was not operating effectively to identify necessary changes to foreign capital gain tax accruals based on information available, including a change in tax laws in Argentina. As a result, for the period ended December 31, 2017, Management corrected accruals for tax reserves within the financial statements for Active International Allocation, Emerging Markets, Emerging Markets Breakout Nations, Emerging Markets Fixed Income Opportunities, Emerging Markets Small Cap and Frontier Markets Portfolios. Management plans to enhance its procedures around the identification of changes to tax laws that could have a potential impact on their calculation of exposure to foreign capital gain tax.
(b) The registrant’s principal executive officer and principal financial officer are aware of no change in the registrant’s internal control over financial reporting that occurred during the registrant’s second fiscal quarter covered by this report that has materially affected, or is reasonably likely to materially affect, the registrant’s internal control over financial reporting.
Item 12. Exhibits
(a) The Code of Ethics for Principal Executive and Senior Financial Officers is attached hereto.
(b) A separate certification for each principal executive officer and principal financial officer of the registrant are attached hereto as part of EX-99.CERT.
SIGNATURES
Pursuant to the requirements of the Securities Exchange Act of 1934 and the Investment Company Act of 1940, the registrant has duly caused this report to be signed on its behalf by the undersigned, thereunto duly authorized.
Morgan Stanley Institutional Fund, Inc.
/s/ John H. Gernon | |
John H. Gernon | |
Principal Executive Officer | |
March 2, 2018 | |
Pursuant to the requirements of the Securities Exchange Act of 1934 and the Investment Company Act of 1940, this report has been signed by the following persons on behalf of the registrant and in the capacities and on the dates indicated.
/s/ John H. Gernon | |
John H. Gernon | |
Principal Executive Officer | |
March 2, 2018 | |
| |
/s/ Francis Smith | |
Francis Smith | |
Principal Financial Officer | |
March 2, 2018 | |